
Influence of the North Atlantic Oscillation on the Winter Season in Cuba †


1
Instituto Superior de Tecnologías y Ciencias Aplicadas, La Habana 10400, Cuba
2
Instituto de Meteorología, La Habana 11700, Cuba
*
Author to whom correspondence should be addressed.
†
Presented at the 4th International Electronic Conference on Atmospheric Sciences, 16–31 July 2021; Available online: https://ecas2021.sciforum.net .
Environ. Sci. Proc. 2021, 8(1), 45; https://doi.org/10.3390/ecas2021-10357
Published: 22 June 2021
(This article belongs to the Proceedings of The 4th International Electronic Conference on Atmospheric Sciences)
Abstract
:There have been several advances in understanding the North Atlantic Oscillation (NAO), but there are still uncertainties regarding its level of influence on the tropical climate. That is why this work determines the influence of the NAO on the main hydrometeorological events that affected Cuba in the 1999–2016 period. To comply with this, a regression analysis is carried out in the CurveExpert software where the combined influence of the NAO and El Niño-Southern Oscillation on hydrometeorological events is also examined. It was found that the NAO exerts a greater influence on Cuba when it is in its negative phase during the winter season.
1. Introduction
Studies carried out in Cuba [1,2,3] have shown that, since the 1970s, there has been a significant change in the climate of the largest of the Antilles, associated with changes in circulation patterns over the Caribbean region and the Gulf of Mexico. However, to date, the evidence suggests that the observed changes seem to be associated with very low frequency oscillations or cycles in the background climatic conditions, within the processes of natural climate variability [4].
In this work, we propose to determine the influence of the North Atlantic Oscillation (NAO) on the winter season in Cuba, in the period 1999–2016, because the NAO constitutes the most prominent mode of climate variability in the North Atlantic. Furthermore, the evidence indicates that anomalous weather patterns, associated with the extreme phases of the NAO, are manifested even at low latitudes through complex connection mechanisms.
2. Materials and Methods
The geographic domain selected for the study included the area of the Inter-American seas (Caribbean Sea, Gulf of Mexico and Near Atlantic), which are located from 5° N to 35° N and from 100° W to 55° W. The analysis was carried out in the period 1999–2016, during the months of November to April, which make up the winter season in Cuba.
The monthly series of the NAO index and Ocean El Niño Index (ONI) were used. The first was based on the difference in standardized atmospheric pressure anomalies at sea level between the stations located in Lisbon (Portugal) and Stykkisholmur (Iceland), while the second was defined as the 3-month moving average of the anomalies of the sea surface temperature in the Niño 3.4 region (5° N–5° S, 120°–170° W). Both series are available on the website of the Washington Climate Prediction Center (CPC) in the United States (www.cpc.ncep.noaa.gov, 6 March 2020).
The results were obtained through a Multiple Linear Regression (MLR) analysis, where the main functions that relate the dependent variables (number of cold fronts per month and number of moderate cold fronts during the winter season) with the independent ones (index NAO and ONI) were obtained in the CurveExpert software. From this function, the number of cold fronts per month and the number of moderate cold fronts during the dry season were calculated, a comparison was performed with the real data in order to define a new index capable of explaining the interannual variations of the affectation of cold fronts in Cuba, from the combination of the ONI and NAO indices, so that we could appreciate how they act together.
To select the function that best represented the relationship between the NAO and the winter season, it was necessary to take into account the correlation R, the adjusted R2 and the significance level p. An R greater than 50%, an adjusted R2 greater than 30% and a significance level p = 90% were required.
3. Results
3.1. Multiple Linear Regression Analysis. NAO—Number of Cold Fronts
In this first exercise, only the relationship between the NAO index and the number of cold fronts per month that affected Cuba in the period from 1999 to 2016 during the months of the winter season (November–April) was established.
In this case, a polynomial equation of degree 19 was obtained, whose constants appear in the following (Table 1), the correlation coefficient that was obtained was R = 0.54, R2 = 0.30 and p = 95%.
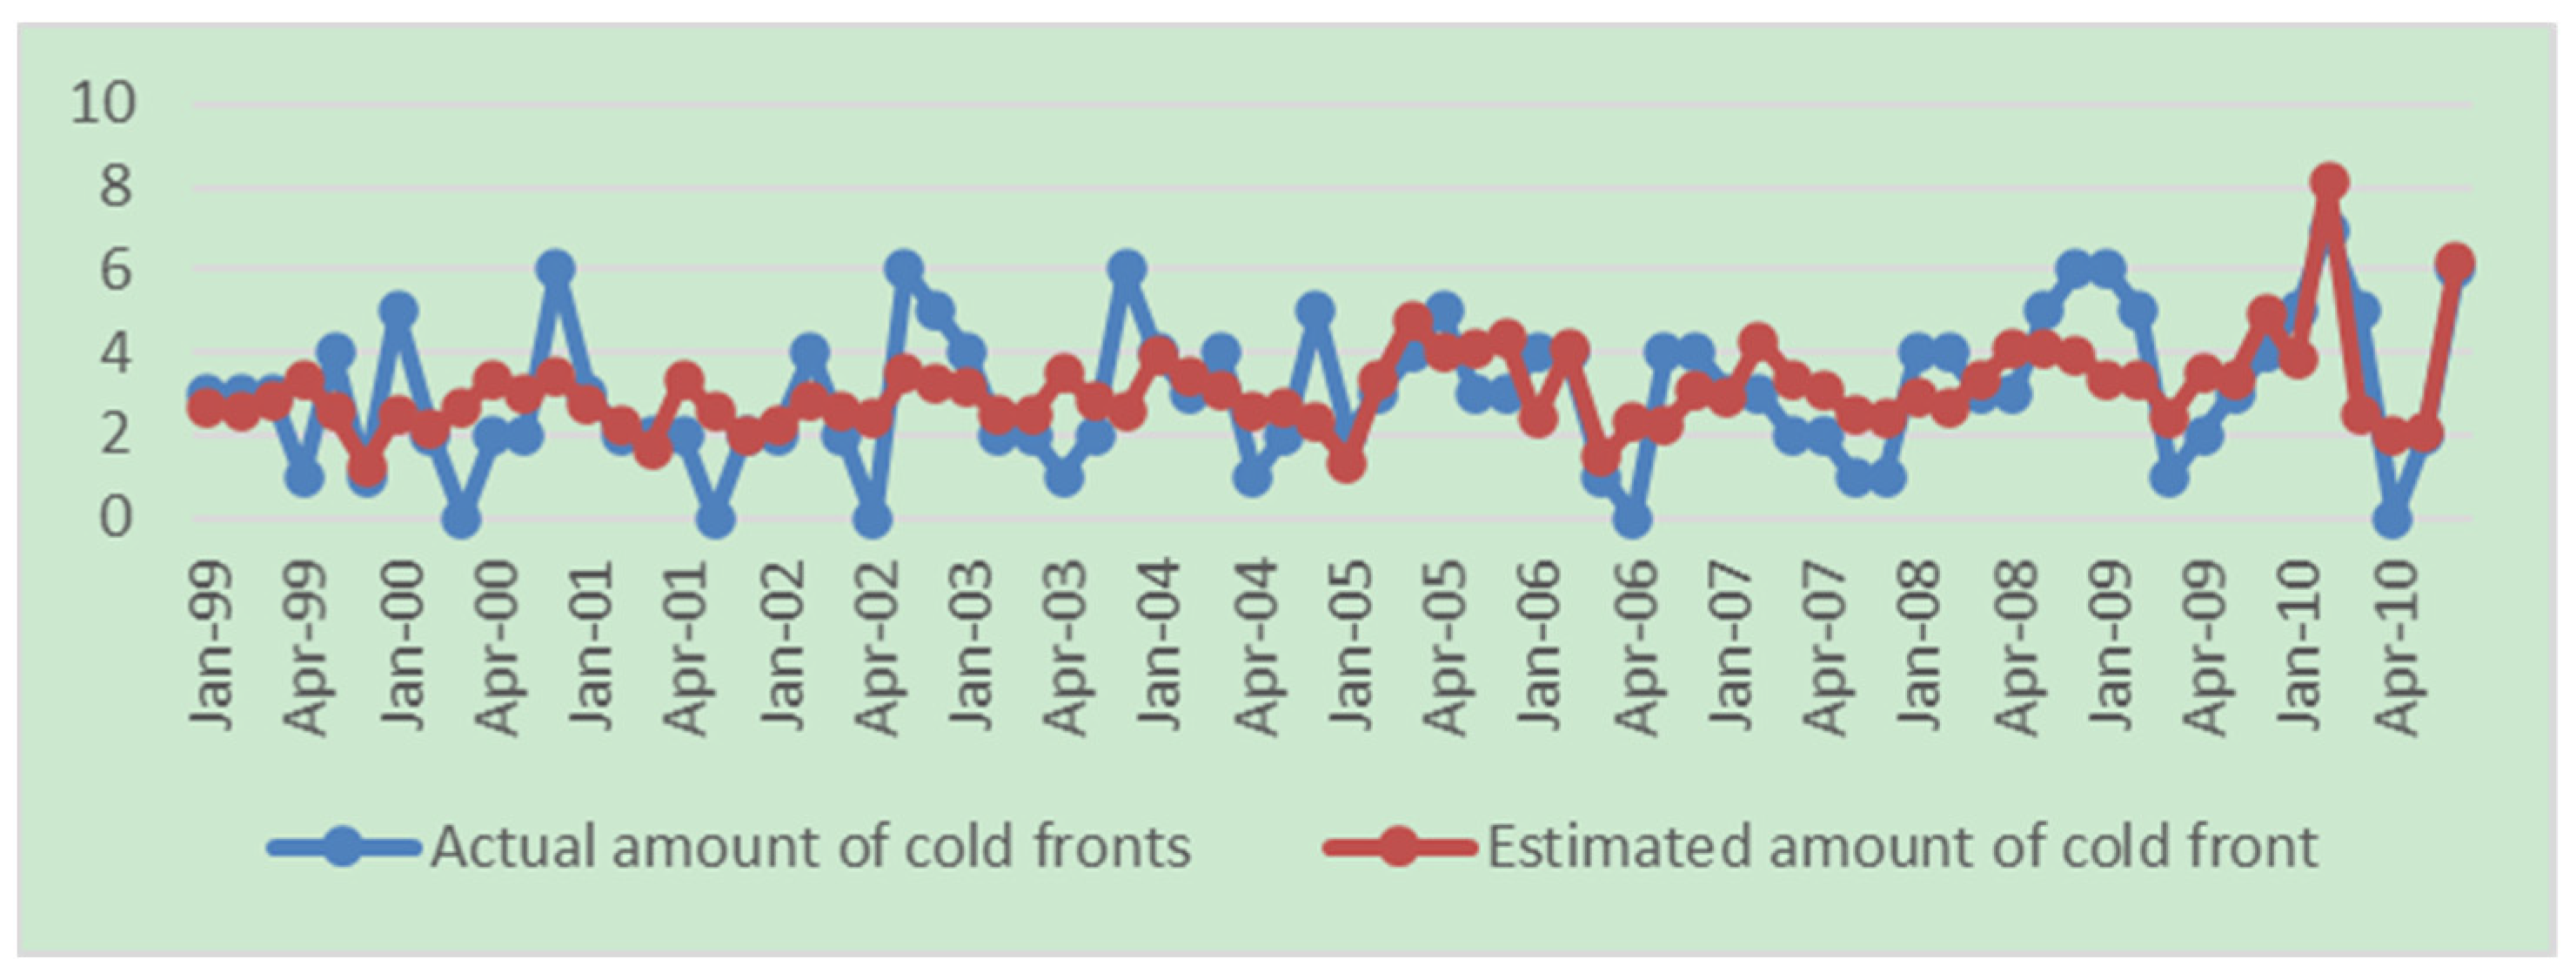
From this equation, the number of cold fronts was estimated and a comparison was performed with the real number of cold fronts that affected Cuba during this period (Figure 1).
3.2. Multiple Linear Regression Analysis. Negative Phase of the NAO, Positive El Niño Index and Number of Cold Fronts
In the case of the positive phase of the ONI in combination with the negative phase of the NAO, a cubic equation was obtained with a very good correlation coefficient value; R = 0.93, R2 = 0.86 and p = 95%. In the equation, y represents the number of cold fronts to be determined per month, INAO is the monthly value of the NAO index and ONI is the value of the El Niño index. The values of the constants appear in the (Table 2).
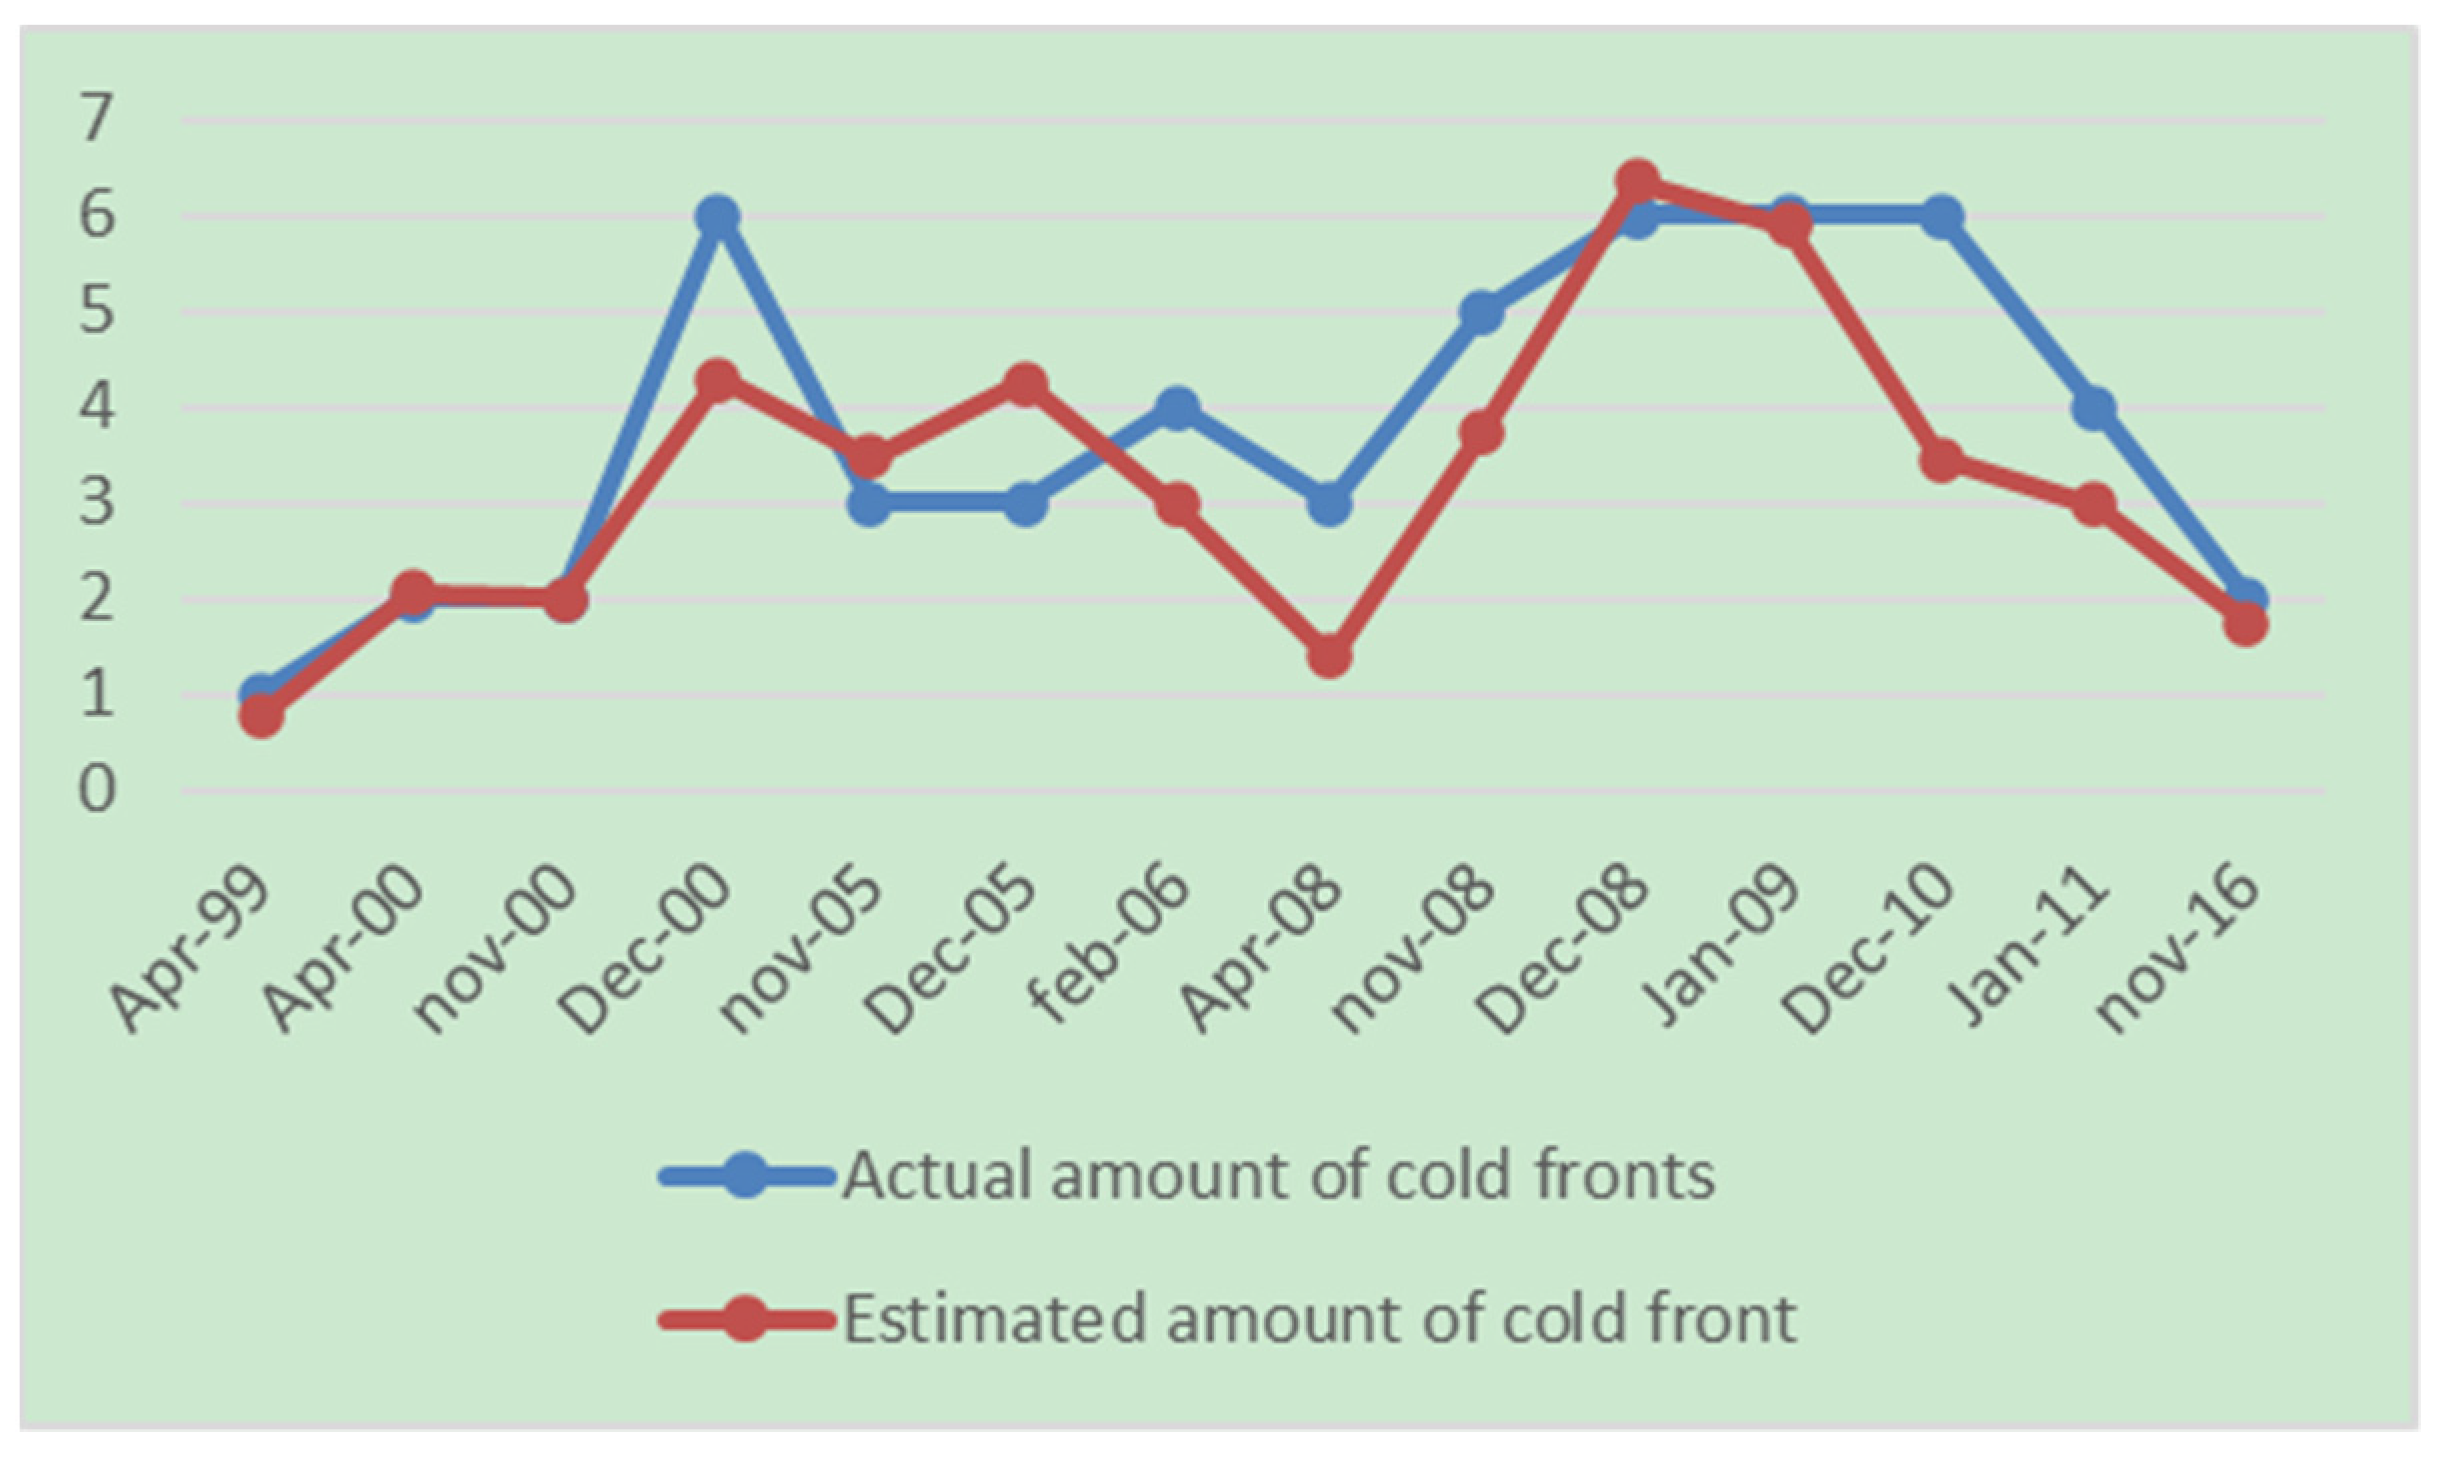
After obtaining the equation, the number of cold fronts affecting Cuba was determined and a comparison was performed with the real values (Figure 2).
3.3. Multiple Linear Regression Analysis. Negative Phase of the NAO, Negative El Niño Index and Number of Cold Fronts
Finally, to complete the previous exercise, the same procedure was developed, but in this case, the combined influence of the negative phase of the NAO and the negative values of the El Niño index was analyzed.
A cubic equation was obtained with R = 0.89, R2 = 0.81 and p = 95%. The equation is the following, where y represents the number of cold fronts to be determined per month, INAO is the monthly value of the NAO index and ONI is the value of the El Niño index. The values of the constants appear in Table 3.
The results obtained, as in previous years, were compared with the real number of cold fronts that affected Cuba (Figure 3).
3.4. Multiple Linear Regression Analysis. Negative Phase of the NAO, El Niño Index and Number of Moderate Cold Fronts
The same procedure as the previous regression exercises was developed; when processing the combined influence of the negative phase of the NAO with both the positive and negative phases of the ONI, a cubic-type equation was obtained. The values of the constants in the equation, as well as the parameters R, R2 and p, appear in the following Table 4.
The equation is the following, where y represents the number of moderate cold fronts to be determined per month, INAO is the monthly value of the NAO index and ONI is the value of the El Niño index.
4. Discussion
In the graph of Figure 1, it can be seen how both series described a similar behavior, although the estimated amount of CF underestimated the real amount of CF except for 2010, where the results were very close to reality. In this year, the behavior of the NAO, contrary to its trend in recent decades towards positive values, was shown to be a year in which the negative phase of this pattern predominated. Therefore, it was decided in the rest of the exercises to carry out the comparison taking into account only the months of the winter season in which the index presented negative values.
In order to determine the true influence of the negative phase of the NAO on the behavior of the cold fronts that affected Cuba in their interaction with the ONI, it was considered appropriate to perform the analysis for both the positive phase (presence of El Niño) of the ONI and for the negative (presence of La Niña).
The graph in Figure 2 shows that the combined influence of the positive phase of the ONI and the negative phase of the NAO exerted a greater influence on the winter season. Furthermore, the equation obtained was the one with the highest correlation coefficient and the one that yielded the best results, showing results very close to the real values.
The combined influence of the negative phase of the NAO with the negative phase of the ONI (Figure 3), despite the fact that the equation presented parameters with good values that were within the required range, did not yield as good results as when it was present during the positive phase of the ONI.
In general, it can be concluded that the greatest influence on the frequency of cold fronts affecting Cuba, during the winter season, occurred when the negative phase of the NAO was present in combination with the positive phase of the ONI. These results were consistent with that observed in previous research [5,6,7], which suggests that the greatest influence of the El Niño-Southern Oscillation in the negative phase of the NAO was on the southern United States and the Atlantic, favoring the winter cyclonic developments and the movement of cold fronts along the eastern coast of the United States and the Gulf of Mexico. Thus, the highest frequency of cold fronts in western Cuba was associated with this phase of the NAO.
Regarding the intensity of the frontal systems, only the months of the winter season in which the negative phase of the NAO was present were taken into account, as in previous years. According to the bibliography consulted, in the presence of significant negative phases of the NAO, there was a greater intrusion of cold air in the Cuban archipelago, in the winter seasons with a greater frequency of impact of strong cold fronts, as a direct consequence of an increase in the intensity and amplitude of the mid-latitude circulation in the vicinity of Cuba, since the centers of action in winter move to the south [6,8].
In this case, only moderate CF were analyzed, since in the period from 1999 to 2016 there was no record of strong CF affectation; this may be linked to the trend towards positive values of the NAO index in recent decades.
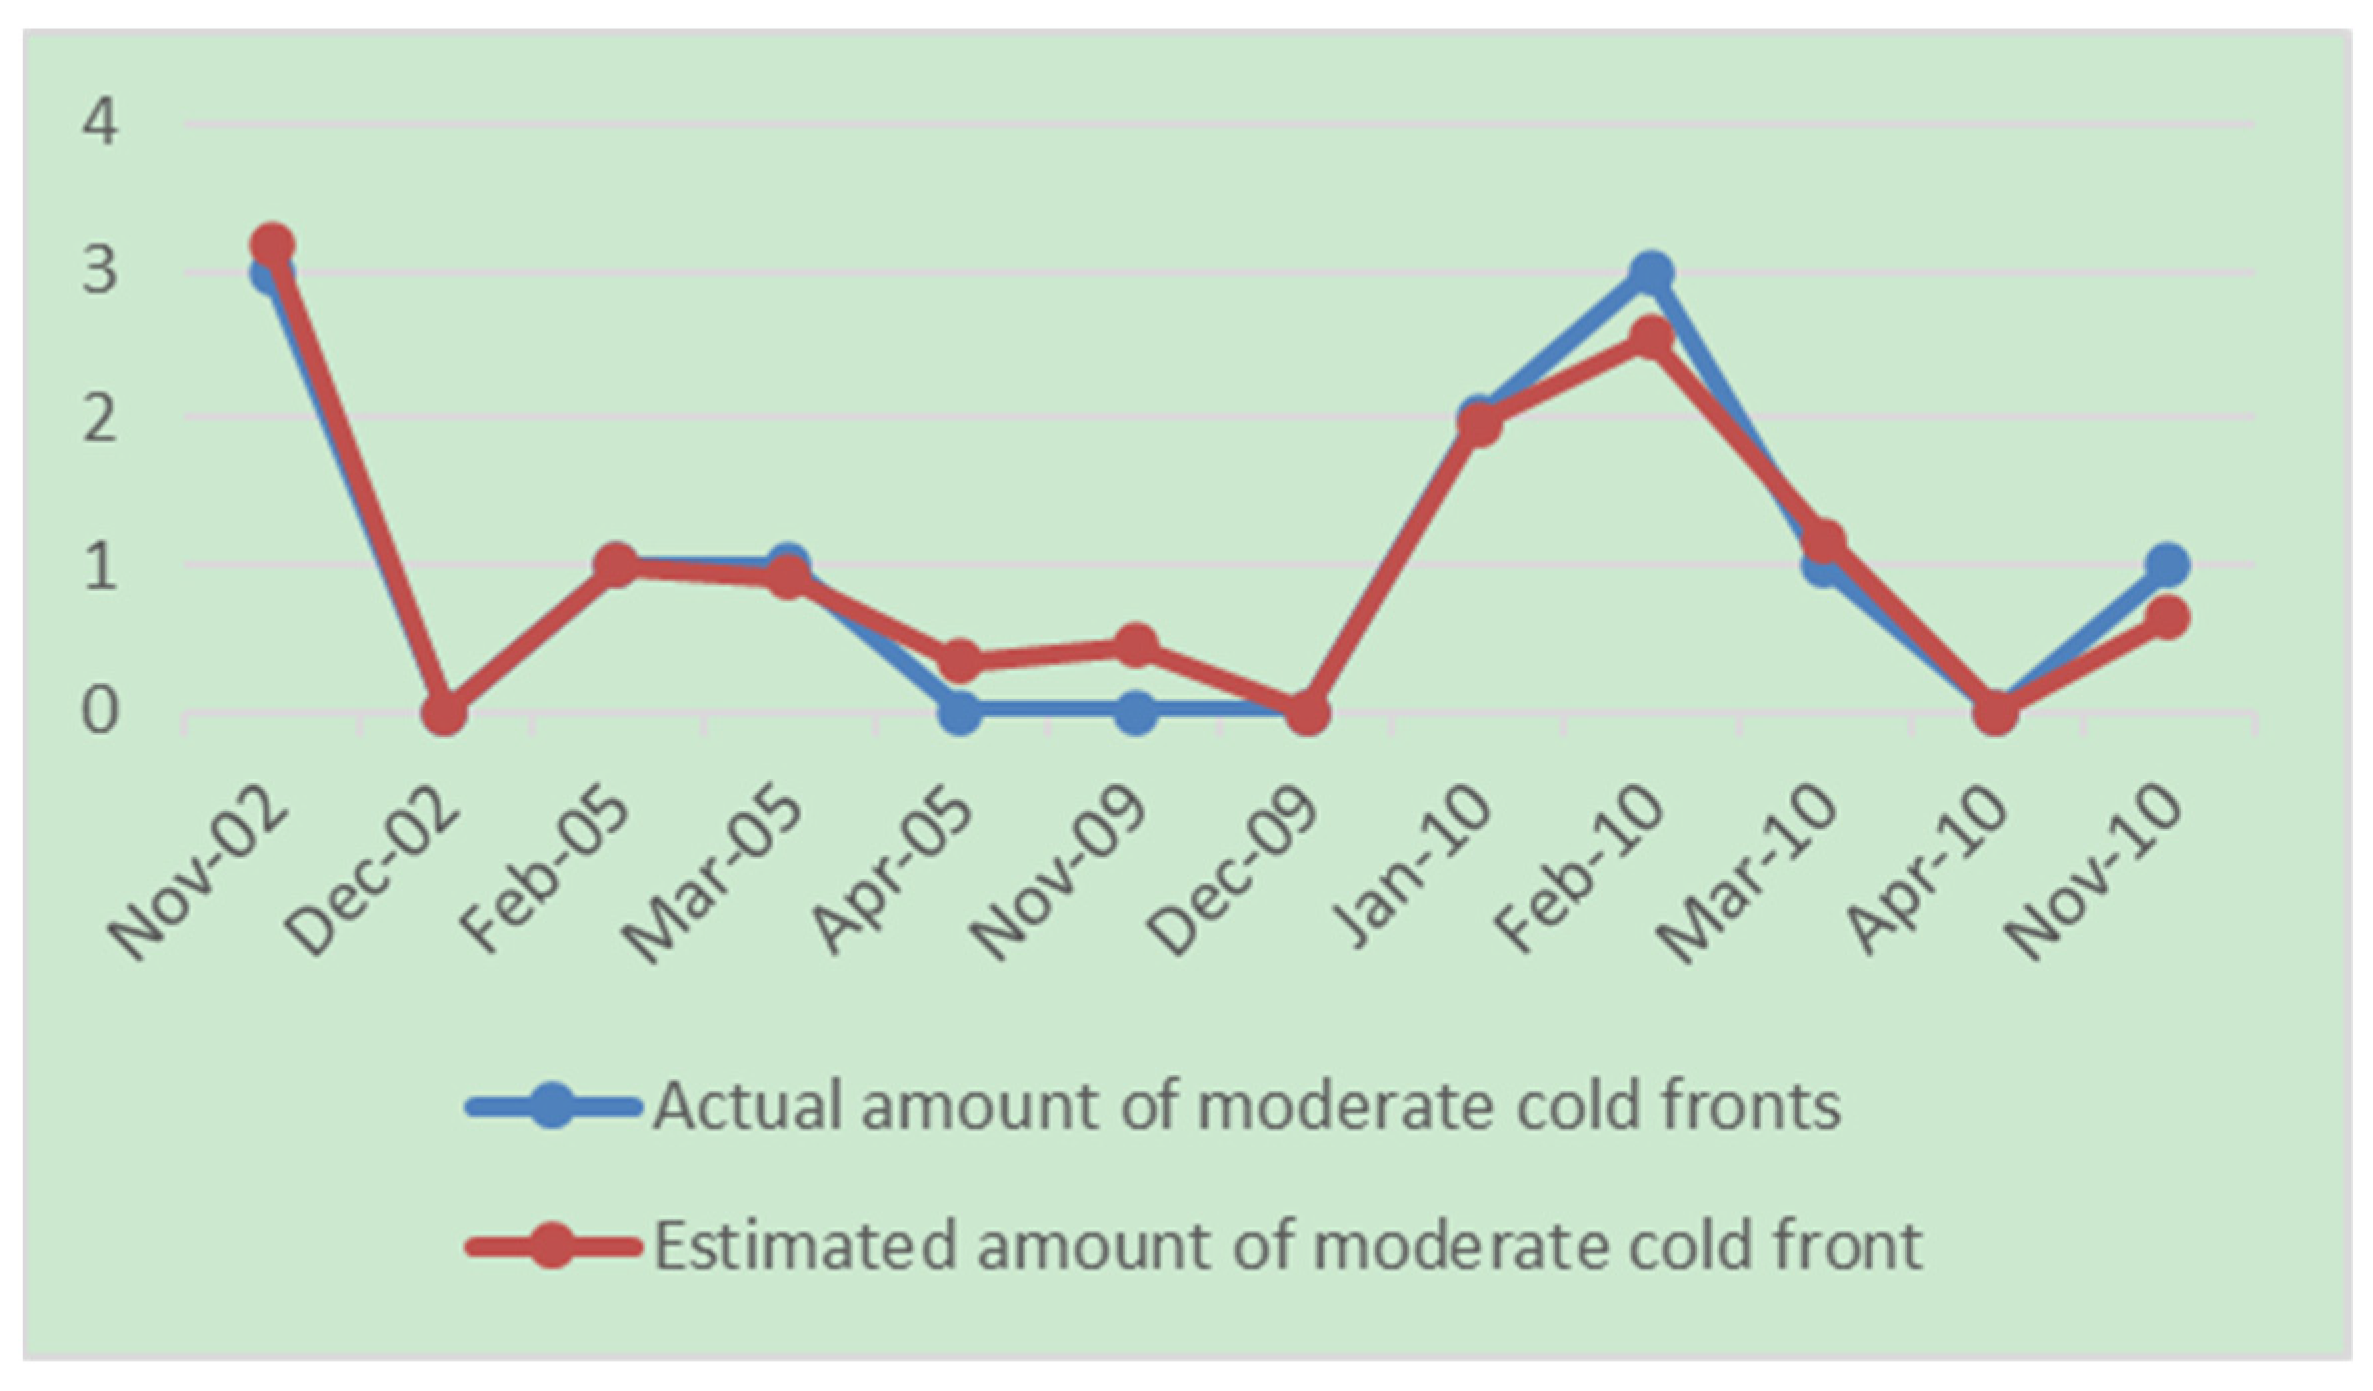
In both Figure 4 and Figure 5, it can be seen that both curves described a similar behavior; however, in the first graph, the results were closer to the real values, in addition to being the one with the best correlation coefficient. It can be concluded that, when the negative phase of the NAO was present with a Niño event (positive ONI), they predominated and, therefore, there was a higher frequency of the affectation of moderate systems. Results that agree with those obtained in previous research [7,9].
5. Conclusions
It was shown that the highest frequency of cold fronts in the study area occurred during the negative phase of the NAO and the positive phase of the ONI (presence of the El Niño event). In the research, a function was obtained that calculated the monthly number of events by means of a multiple regression.
Regarding the intensity of cold fronts when the positive phase of the ONI (El Niño) occurred in the presence of the negative phase of the NAO, there was a greater incidence of moderate systems on Cuba.
Conflicts of Interest
The authors declare no conflict of interest.
References
- Centella, A.; Naranjo, L.; Paz, L.; Cárdenas, P.; Lapinel, B.; Ballester, M.; Pérez, R.; Alfonso, A.; González, C.; Limia, M.; et al. Variaciones y Cambios del Clima en Cuba; Technical Report; Climate National Center, INSMET: Havana, Cuba, 1997; 58p. [Google Scholar]
- Naranjo, D.L. Uso de los Índices de Circulación para la Caracterización de las Condiciones Atmosféricas en las Inmediaciones de Cuba.; INSMET: Havana, Cuba, 1998. [Google Scholar]
- Pérez, R.; Fonseca, C.; Lapinel, B.; González, C.; Planos, E.; Cutié, V.; Ballester, M.; Limia, M.; Vega, R. Actualización del Conocimiento Sobre Variaciones, Cambios y Tendencias del Clima en Cuba.; Scientific Result Report; INSMET: Havana, Cuba, 2009. [Google Scholar]
- Centella, A.; Llanes, J.; Paz, L. Primera Comunicación Nacional a la Convención Marco de las Naciones Unidas sobre Cambio Climático; UNFCCC: Rio de Janeiro, Brazil; New York, NY, USA, 2009. [Google Scholar]
- Aceituno, P. On the functioning of the Southern Oscillation in the South American Sector. Part II: Upper-air circulation. J. Clim. 1989, 2, 341–355. [Google Scholar]
- Jústiz, A. Circulación Troposférica Asociada a los Frentes Fríos Fuertes que Han Afectado a Cuba en el Período 1950–2008. Bachelor’s Thesis, InSTEC, Havana University, Havana, Cuba, 2010. [Google Scholar]
- Acosta, H. La Oscilación del Atlántico Norte y el Comportamiento de la Temporada Invernal en la Región Occidental de Cuba. Bachelor’s Thesis, InSTEC, Havana University, Havana, Cuba, 2014. [Google Scholar]
- Fonseca, C. La Oscilación del Atlántico Norte, los Índices de Circulación Atmosférica y la Lluvia en Cuba. Ph.D. Thesis, Havana University, Havana, Cuba, 2008. [Google Scholar]
- Espinosa, D. Comportamiento y Variabilidad de los Sistemas Invernales que Afectan a Cuba. Bachelor’s Thesis, InSTEC, Havana University, Havana, Cuba, 2018. [Google Scholar]
Figure 1.
Comparison between the actual number of cold fronts and the estimated number of cold fronts.
Figure 1.
Comparison between the actual number of cold fronts and the estimated number of cold fronts.

Figure 2.
Comparison between the actual number of cold fronts and the estimated number of cold fronts.
Figure 2.
Comparison between the actual number of cold fronts and the estimated number of cold fronts.

Figure 3.
Comparison between the actual number of cold fronts and the estimated number of cold fronts.
Figure 3.
Comparison between the actual number of cold fronts and the estimated number of cold fronts.

Figure 4.
Comparison between the actual amount of moderate cold fronts (MCF) and the amount of MCF estimated under the combined influence of the NAO (−) and ONI (+).
Figure 4.
Comparison between the actual amount of moderate cold fronts (MCF) and the amount of MCF estimated under the combined influence of the NAO (−) and ONI (+).

Figure 5.
Comparison between the actual amount of moderate cold fronts (MCF) and the amount of MCF estimated under the combined influence of the NAO (−) and ONI (−).
Figure 5.
Comparison between the actual amount of moderate cold fronts (MCF) and the amount of MCF estimated under the combined influence of the NAO (−) and ONI (−).


Table 1.
Values of the constants of the polynomial equation of degree 19.
| a | 3.37 | k | −1.04 × 10³ |
| b | 3.81 × 10⁻¹ | l | −9.36 × 10² |
| c | −5.11 | m | 6.90 × 10² |
| d | −5.55 × 101 | n | 4.78 × 10² |
| e | 7.44 × 101 | o | −2.57 × 10² |
| f | 3.42 × 10² | p | −1.50 × 10² |
| g | −3.91 × 10² | q | 5.07 × 101 |
| h | −8.54 × 10² | r | 2.66 × 101 |
| i | 8.91 × 10² | s | −4.11 |
| j | 1.15 × 10³ | t | −2.02 |
Table 2.
Values of the constants of the cubic function.
| a | 3.10 × 101 |
| b | −2.11 × 101 |
| c | −9.98 × 101 |
| d | −2.75 × 101 |
| e | 1.07 × 10² |
| f | −8.89 |
| g | −3.61 × 101 |
Table 3.
Values of the constants of the cubic function.
| a | 3.37 | f | −1.04 × 10³ |
| b | 3.81 × 10⁻¹ | g | −9.36 × 10² |
| c | −5.11 | h | 6.90 × 10² |
| d | −5.55 × 101 | i | 4.78 × 10² |
| e | 7.44 × 101 | j | −2.57 × 10² |
Table 4.
Values of the constants and parameters of the cubic function.
| ONI (+) | ONI (−) | |
|---|---|---|
| a | −2.18 × 101 | 5.63 × 101 |
| b | 4.79 × 101 | −2.07 × 10² |
| c | 1.27 × 10² | 3.58 × 10² |
| d | 9.25 | 1.15 × 10² |
| e | −2.08 × 10² | 6.58 × 10² |
| f | 3.53 | −3.86 × 101 |
| g | 1.01 × 10² | 3.68 × 10² |
| h | −1.12 × 10² | −6.46 × 10² |
| i | 4.15 | 2.21 × 10² |
| j | 7.11 × 101 | −5.19 × 10² |
| Parameters | ||
| R | 0.99 | 0.89 |
| R2 | 0.98 | 0.79 |
| p | 95% | 95% |
Publisher’s Note: MDPI stays neutral with regard to jurisdictional claims in published maps and institutional affiliations. |
© 2021 by the authors. Licensee MDPI, Basel, Switzerland. This article is an open access article distributed under the terms and conditions of the Creative Commons Attribution (CC BY) license (https://creativecommons.org/licenses/by/4.0/).
Share and Cite
MDPI and ACS Style
González, G.; Calzada, A.; Rodríguez, A. Influence of the North Atlantic Oscillation on the Winter Season in Cuba. Environ. Sci. Proc. 2021, 8, 45. https://doi.org/10.3390/ecas2021-10357
AMA Style
González G, Calzada A, Rodríguez A. Influence of the North Atlantic Oscillation on the Winter Season in Cuba. Environmental Sciences Proceedings. 2021; 8(1):45. https://doi.org/10.3390/ecas2021-10357
Chicago/Turabian StyleGonzález, Graciela, Amílcar Calzada, and Alejandro Rodríguez. 2021. "Influence of the North Atlantic Oscillation on the Winter Season in Cuba" Environmental Sciences Proceedings 8, no. 1: 45. https://doi.org/10.3390/ecas2021-10357