1. Introduction
Energy has a key role in the evolution of society and in the development of culture [
1]. Humanity has used every source of energy that has been discovered, and as a result, nowadays, everyone relies mostly on energy. Global energy consumption has increased 20 times since 1850, 10 times since 1900, and 4 times since 1950 [
2]. Today, 80% of global energy consumption is derived from fossil fuels (coal, oil, gas, uranium), which cause severe environmental issues and negatively affect the climate, exacerbating the greenhouse effect. The question that arises is how humanity will accommodate its enormous energy needs without risking the viability of the planet [
3].
Unfortunately, climate change has already made an appearance. In past years, extreme weather phenomena and disasters have taken place with unprecedented frequency. Nevertheless, the average global temperature is just 1.1 °C higher than the temperature at the beginning of the Industrial Revolution. The origins of the phenomenon are known: greenhouse emissions caused by fossil fuel combustion to generate electricity, intensive livestock farming, and the general devastation of ecosystems, such as forests and oceans, are considered to be the main causes [
4,
5,
6,
7].
Electricity is considered to be the flagship form of energy and is directly associated with progress and development from the post-war years and onwards. Statistics show the gross national product (GDP) of a country increases according to the domestic consumption of electricity. The surging demand to produce electricity using clean energy, in order to not worsen the greenhouse effect, has led to fast-growing renewable energy sources (RES) in the last 20 years [
8,
9,
10]. RES can be divided into continuous production units (from sources that are always available, such as geothermal, biomass, and biogas units), elastic production (from optionally available sources, such as small hydropower plants), and intermittent or stochastic production (from solar or wind RES systems).
To promote decarbonization, meaning the abolishment of lignite shares in electricity generation by 2028, storage technology advancements are crucial. Specifically, the National Plan for Energy and Climate (NPEC) is planning for the construction of new pumped hydro (and other storage) systems, with a total capacity of 700 MW, by 2025 [
11,
12,
13].
The subject of this paper is a hybrid renewable energy system (HRES) on the island of Lemnos, with two possible operating scenarios. In particular, the wind energy can be stored, either in the form of hydraulic energy (pumped storage) or in the form of hydrogen (by electrolyzing water). The objective here was to also cover the water needs, irrigation, and energy of the island. The HRES contains a wind farm, a desalination plant, and a tank for storing drinking water. In case wind energy is stored in the form of hydraulic energy, the system includes a hydroelectric station, a pumping station, and a seawater reservoir. Alternatively, when the wind energy is stored in the form of hydrogen, the system includes an electrolysis unit, hydrogen storage tanks, and fuel cells. Furthermore, the capability of the HRES to cover energy and water needs is estimated.
2. Materials and Methods
2.1. Study Area
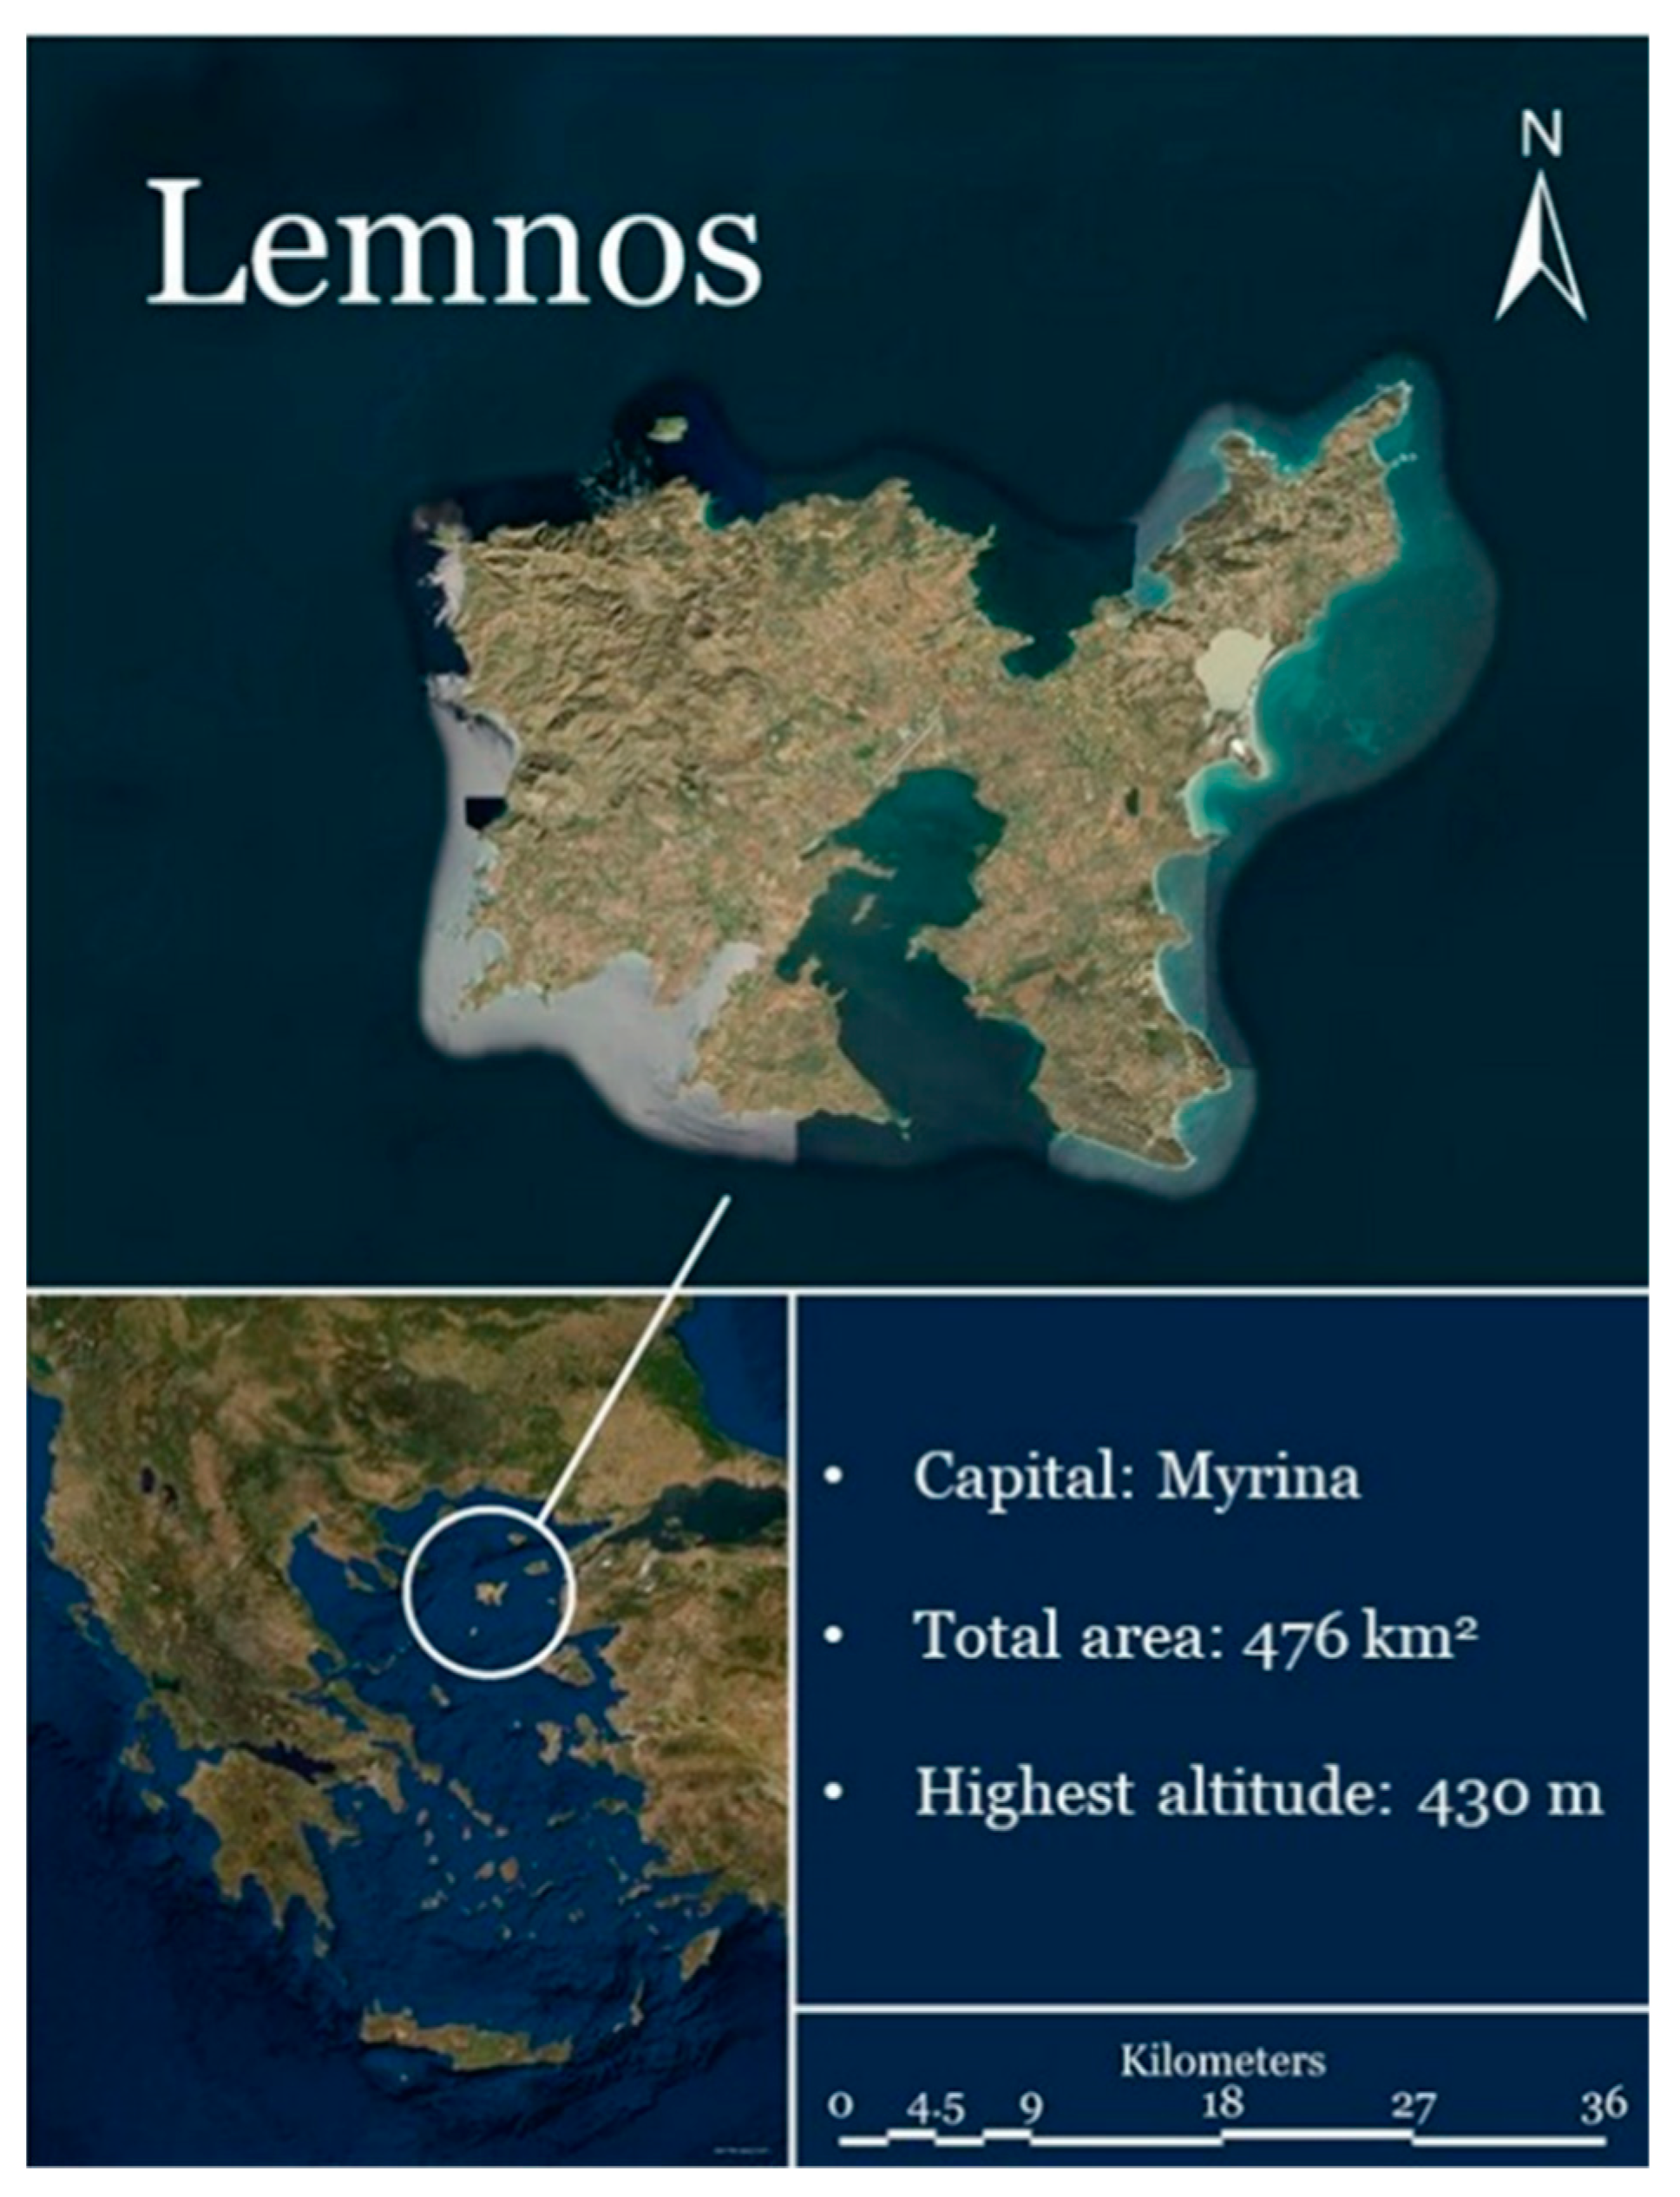
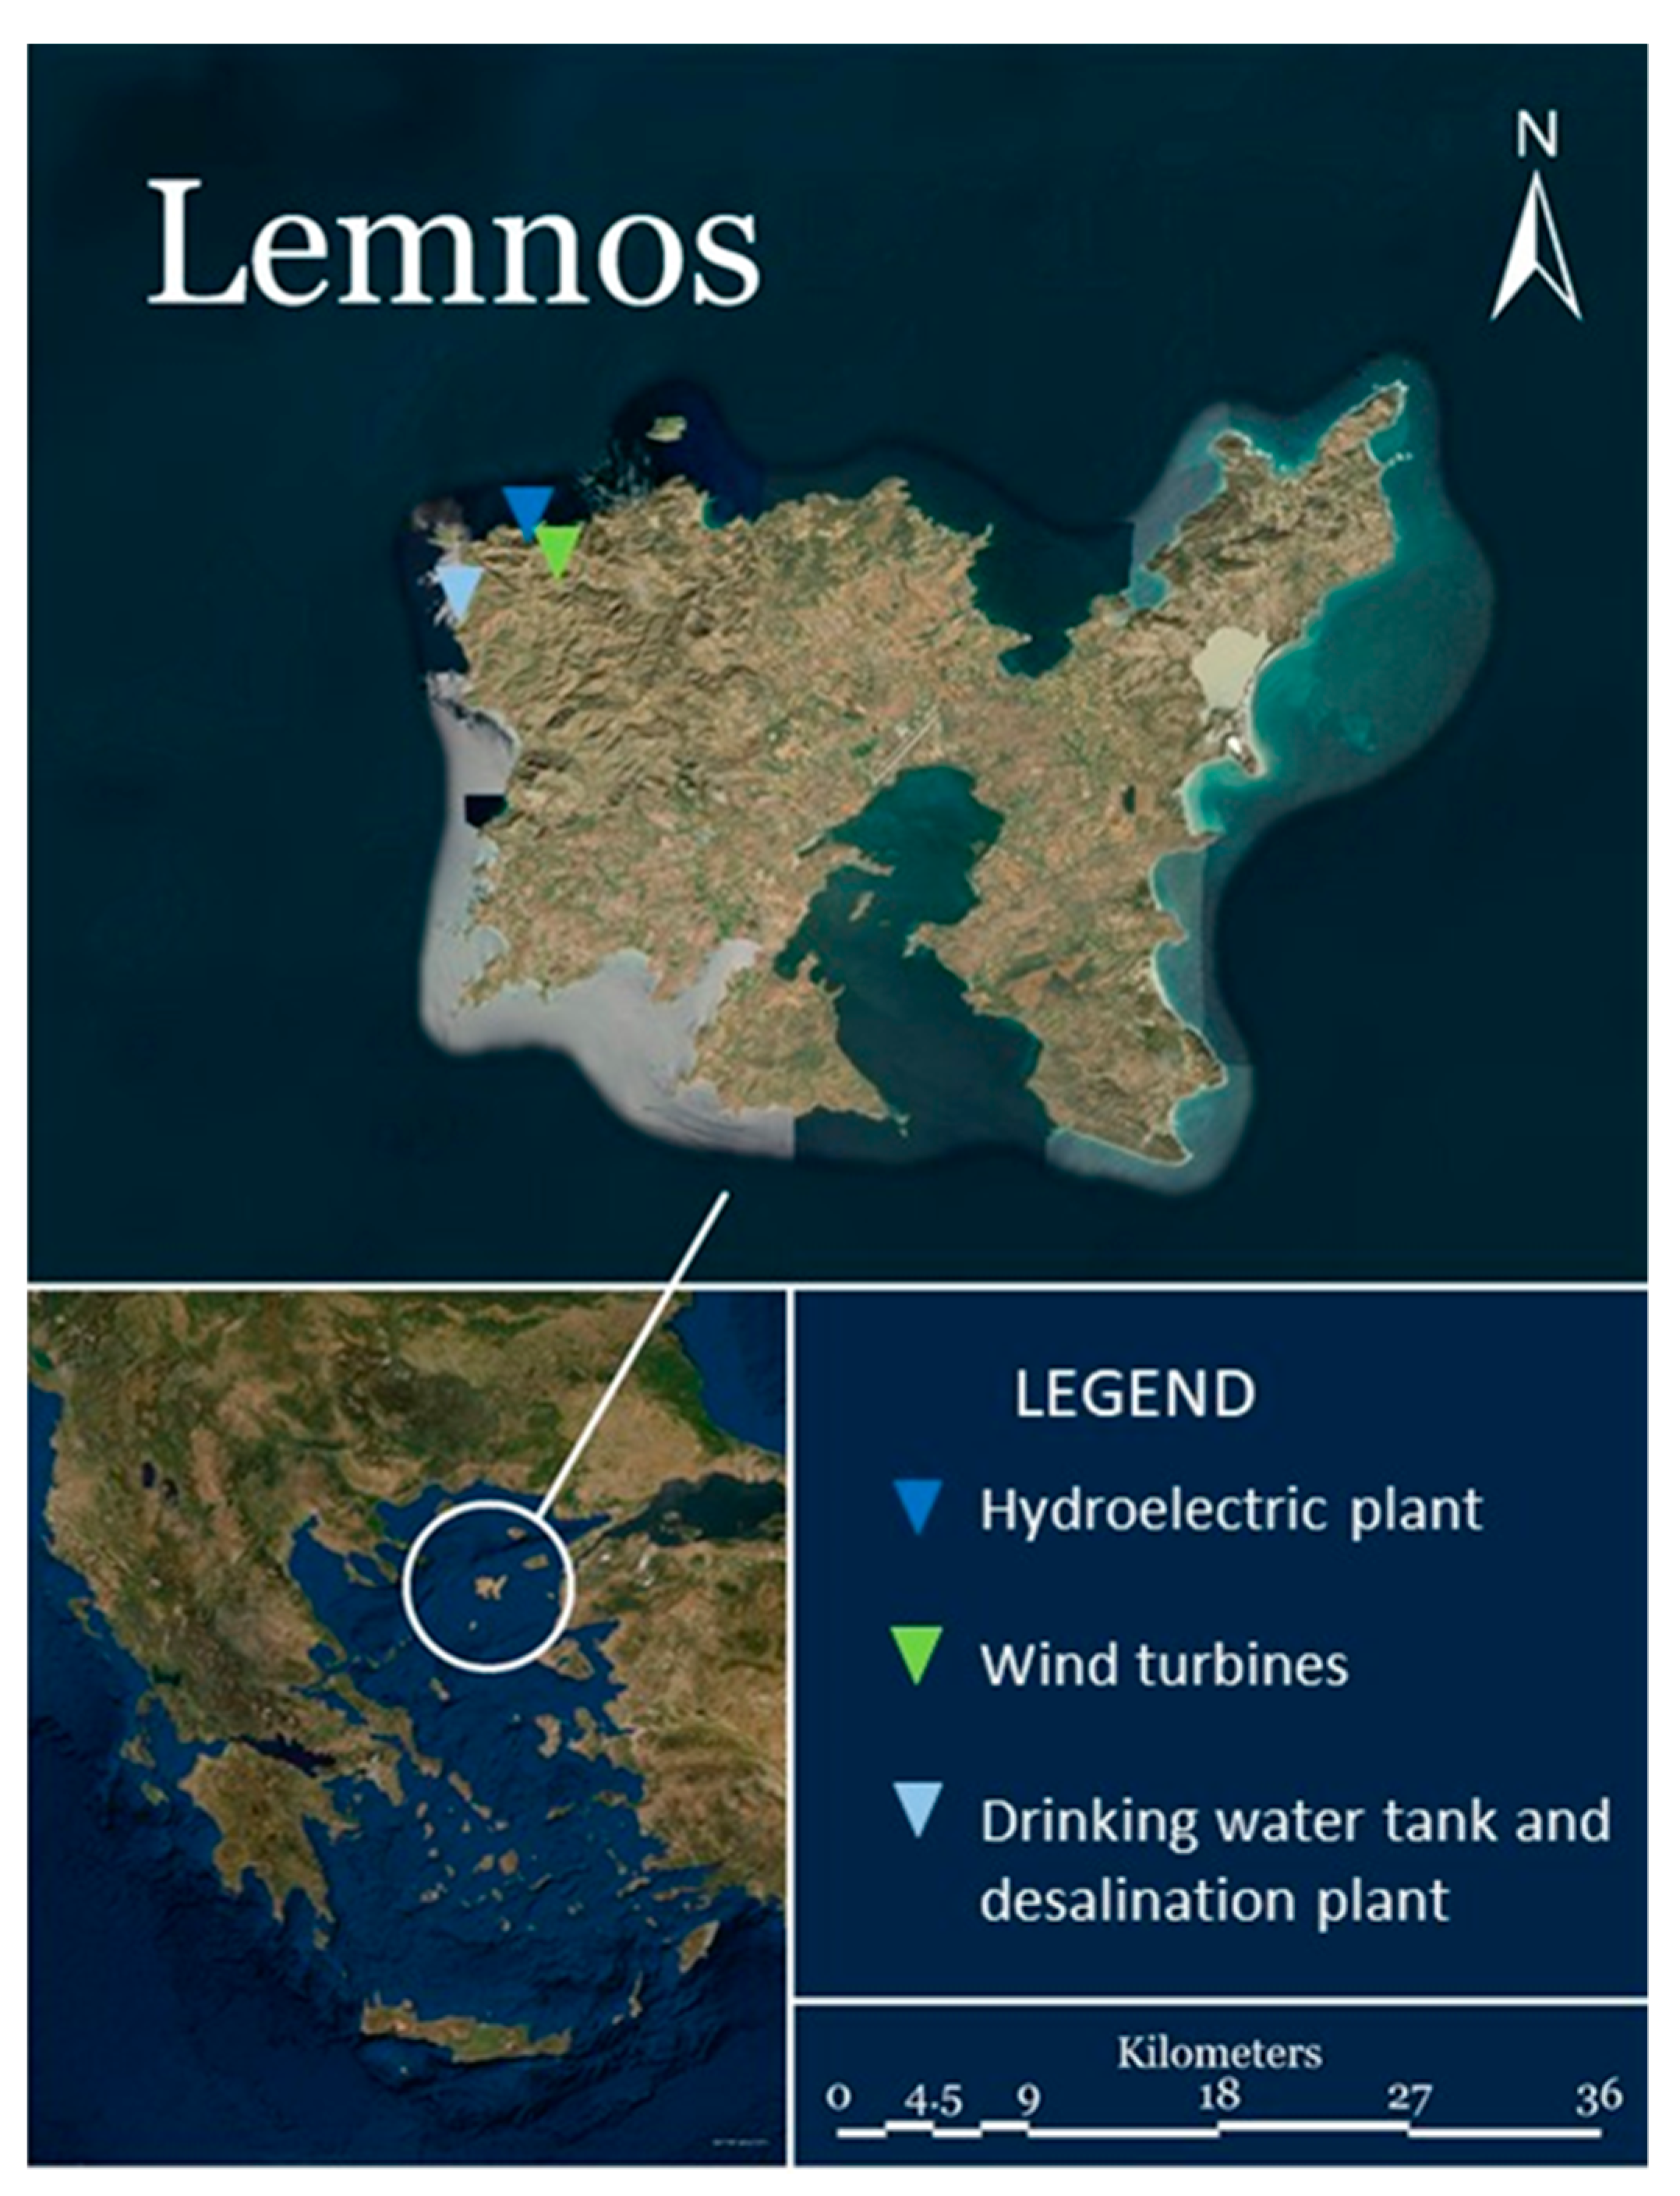
Lemnos belongs to the region of North Aegean (
Figure 1), known as the Thracian Sea, and is the eighth largest island in Greece and the fourth in coastal length. Myrina is the capital and the main port of the island. Lemnos has a total area of 476 km
2 and a coast line of 263 km. Lemnos is mostly flat (having more than 30 sand beaches), but the west, especially the northwestern part, is rough and mountainous. The highest point is Mount Skopia or Mount Vigla at an altitude of 430 m [
14].
According to the most recent census of the population of Lemnos [
15], 17,000 permanent residents inhabit Lemnos. The climate in Lemnos is Mediterranean (as with most Aegean islands). Winters are generally mild, although there is the possibility of an occasional snowfall. The island is known for its strong winds in August and in the winter. Rainfall mostly occurs in the fall and winter, rarely throughout the rest of the year. The average total annual precipitation reaches 480 mm.
The municipality is the exclusive provider of water for domestic use and partly for irrigation. Most of the water, which is equal to 1,377,577.50 m
3/year with a unit financial cost of 1.12 EUR (€)/m
3 and a recovery rate circa 59%, comes from drilling. Furthermore, the Local Land Improvement Organization provides water supply for agricultural use in some parts of the island [
16].
Lemnos has an autonomous power station (APS), which was built in 1980 in the Avlona area. The station is only 3 km away from the island’s capital and is located very close to the sea, so it takes advantage of both the direct supply of liquid fuel and seawater, using the latter to cool the generators. The APS of Lemnos consists of 3 generators (2.7 MW capacity each) and 2 generators (6.5 MW capacity), all working on oil. In addition, the Public Power Corporation of Greece (PPC) operates 3 gensets at the station to ensure adequate power supply to the island in extreme cases; there is also a backup genset to start the station. The total installed capacity therefore equals 23.6 MW [
17]. The fluctuation of electricity demand also affects the operation of the station. During the summer, due to tourism, the operation of all 8 generators is considered necessary, while under normal conditions throughout the rest of the year, the demand for electricity can be met with the operation of 2 to 5 generators. Furthermore, 3 wind turbines with 900 kW of rated power each and a total expected annual production of 5300 MWh were installed on the island.
2.2. Methodology
From the perspective of the probability theory, hydrological processes are treated as stochastic developments. For example, the rainfall or flow of a river at a particular location at time t is a random variable, since there is no definitive method of determining its value with complete certainty. Therefore, this process is a stochastic evolution in continuous time, while a series of measurements at regular intervals is a time series [
18].
In the present project, the historical time series of rainfall, temperature, and wind of the study area are available, with 47 years of measurements (1974–2020). However, due to imprecise data quality, not all measurements were used. The study of the HRES was carried out for a period of 25 years. Hence, the production of the synthetic time series of the aforementioned natural processes had a total length of 25 years, respectively, with an hourly step.
For the generation of the rainfall timeseries, the 30-year long historical data set (1991–2020) from the Hellenic National Meteorological Service was used. The models considered for the simulation were the “autoregression second order”, AR (2) and “first-order and rolling medium self-regression model”, ARMA (1,1).
The first method represents a random process, which claims that the output variable, in this case the rain, is prescribed linearly by its two previous values since the model is of the second order, and by a contemplative term, white noise, which introduces the randomness. White noise is defined, at a district time, as a distinct signal, whose samples are considered to be a sequence of unrelated random variables with zero mean and finite variance, or else a momentary and discrete variation in the sample [
19,
20].
On the other hand, the second method is a combination of the AR method and the MA mobile process. It must be noted that MA mobile models are useful for describing phenomena where events produce an immediate effect—the effect of which does not stop but continues. The combination of the two methods, known as ARMA, has proven to be a model suitable for the analysis of historical time series, but also the production of future synthetic time series [
21,
22].
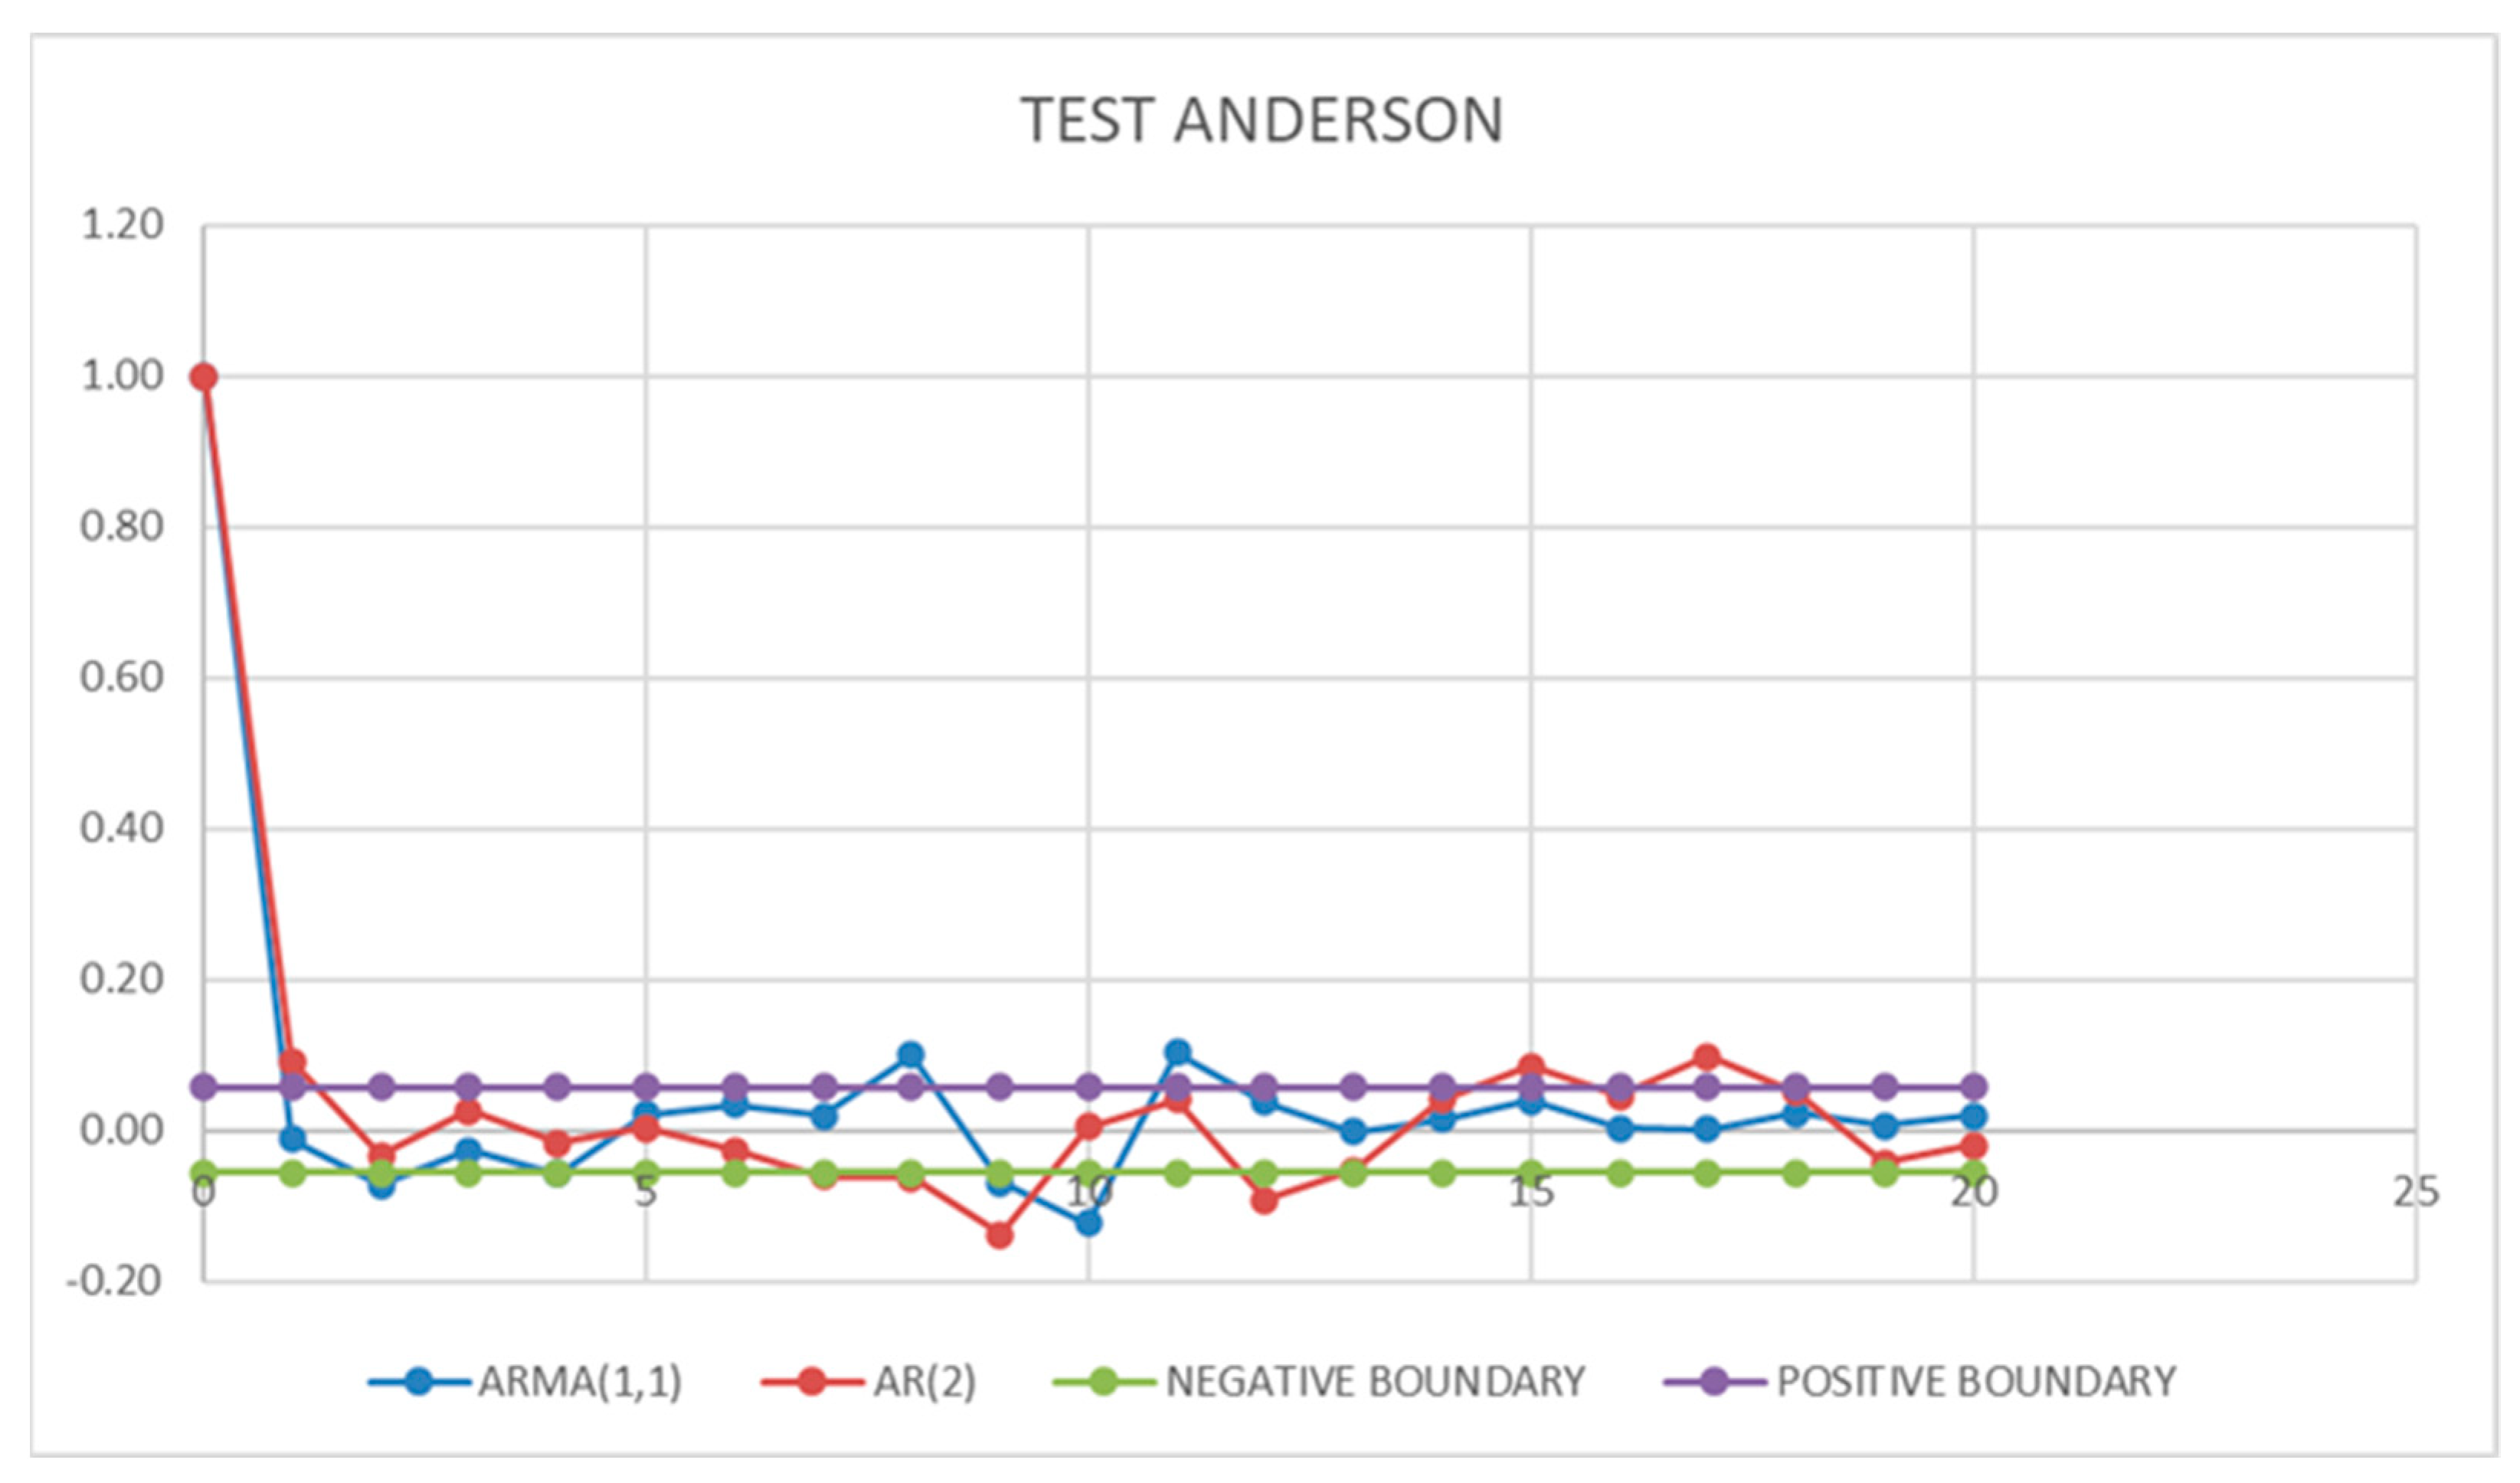
The selection of the optimal synthetic time series production model is made through the Anderson test. The model that is mostly within the limits
where
N is the months of the synthetic time series produced and appears to be the most suitable for the simulation of the HRES [
23,
24]. The model ARMA (1,1) is selected according to
Figure 2.
For production of the synthetic time series of the temperature, the procedure is the same as before, which means the models AR (2) and ARMA (1,1) are considered. The Anderson test takes place once again, and the model ARMA (1,1) is selected.
The historical data of the wind series (i.e., three-hourly temporal frequency) are from the Hellenic National Meteorological Service. Due to lack of wind data, the historical series that is used is 25 years long (1996–2020). The aforementioned series is the input data for the Negra [
25] method, followed for the production of the synthetic wind series. The output of this method is a one-year synthetic time series with a three-hour step. The method is repeated 25 times (as many as the periods of time the HRES are studied). Finally, the time series that are derived from the method are converted into a one-hour step, so that all synthetic series, including rainfall and temperature, have a common hour step.
The steps used to produce a synthetic wind series are as follows [
25]:
The classification of historic wind speed data based on their speed;
The wind speed state probability;
The state frequency;
The average state duration;
The transition rates, one for the transition up and one for the transition down.
Once probability tables for each month are defined, it is possible to produce a synthetic wind speed time series. The step-by-step procedure is described as follows:
The wind speed vector takes an initial value while the time variable receives the initial value of 0 h. For the first simulation year, the initial wind speed vector takes the value that corresponds to the average historic wind speed.
Two random numbers are created in the interval (0,1), one for the transition up and one for the transition down.
Calculation of time to up (TTU) and time to down (TTD); h represents the simulation period, which is one year.
If TTU < TTD the wind speed goes to the upper state after TTU hours.
If TTD < TTU the wind speed goes to the lower state after TTD hours.
Vector and variable t are updated.
The procedure is repeated until t is equal or exceeds h.
Every time step, the initial wind speed vector takes the latest value of the previous synthetic wind speed times series.
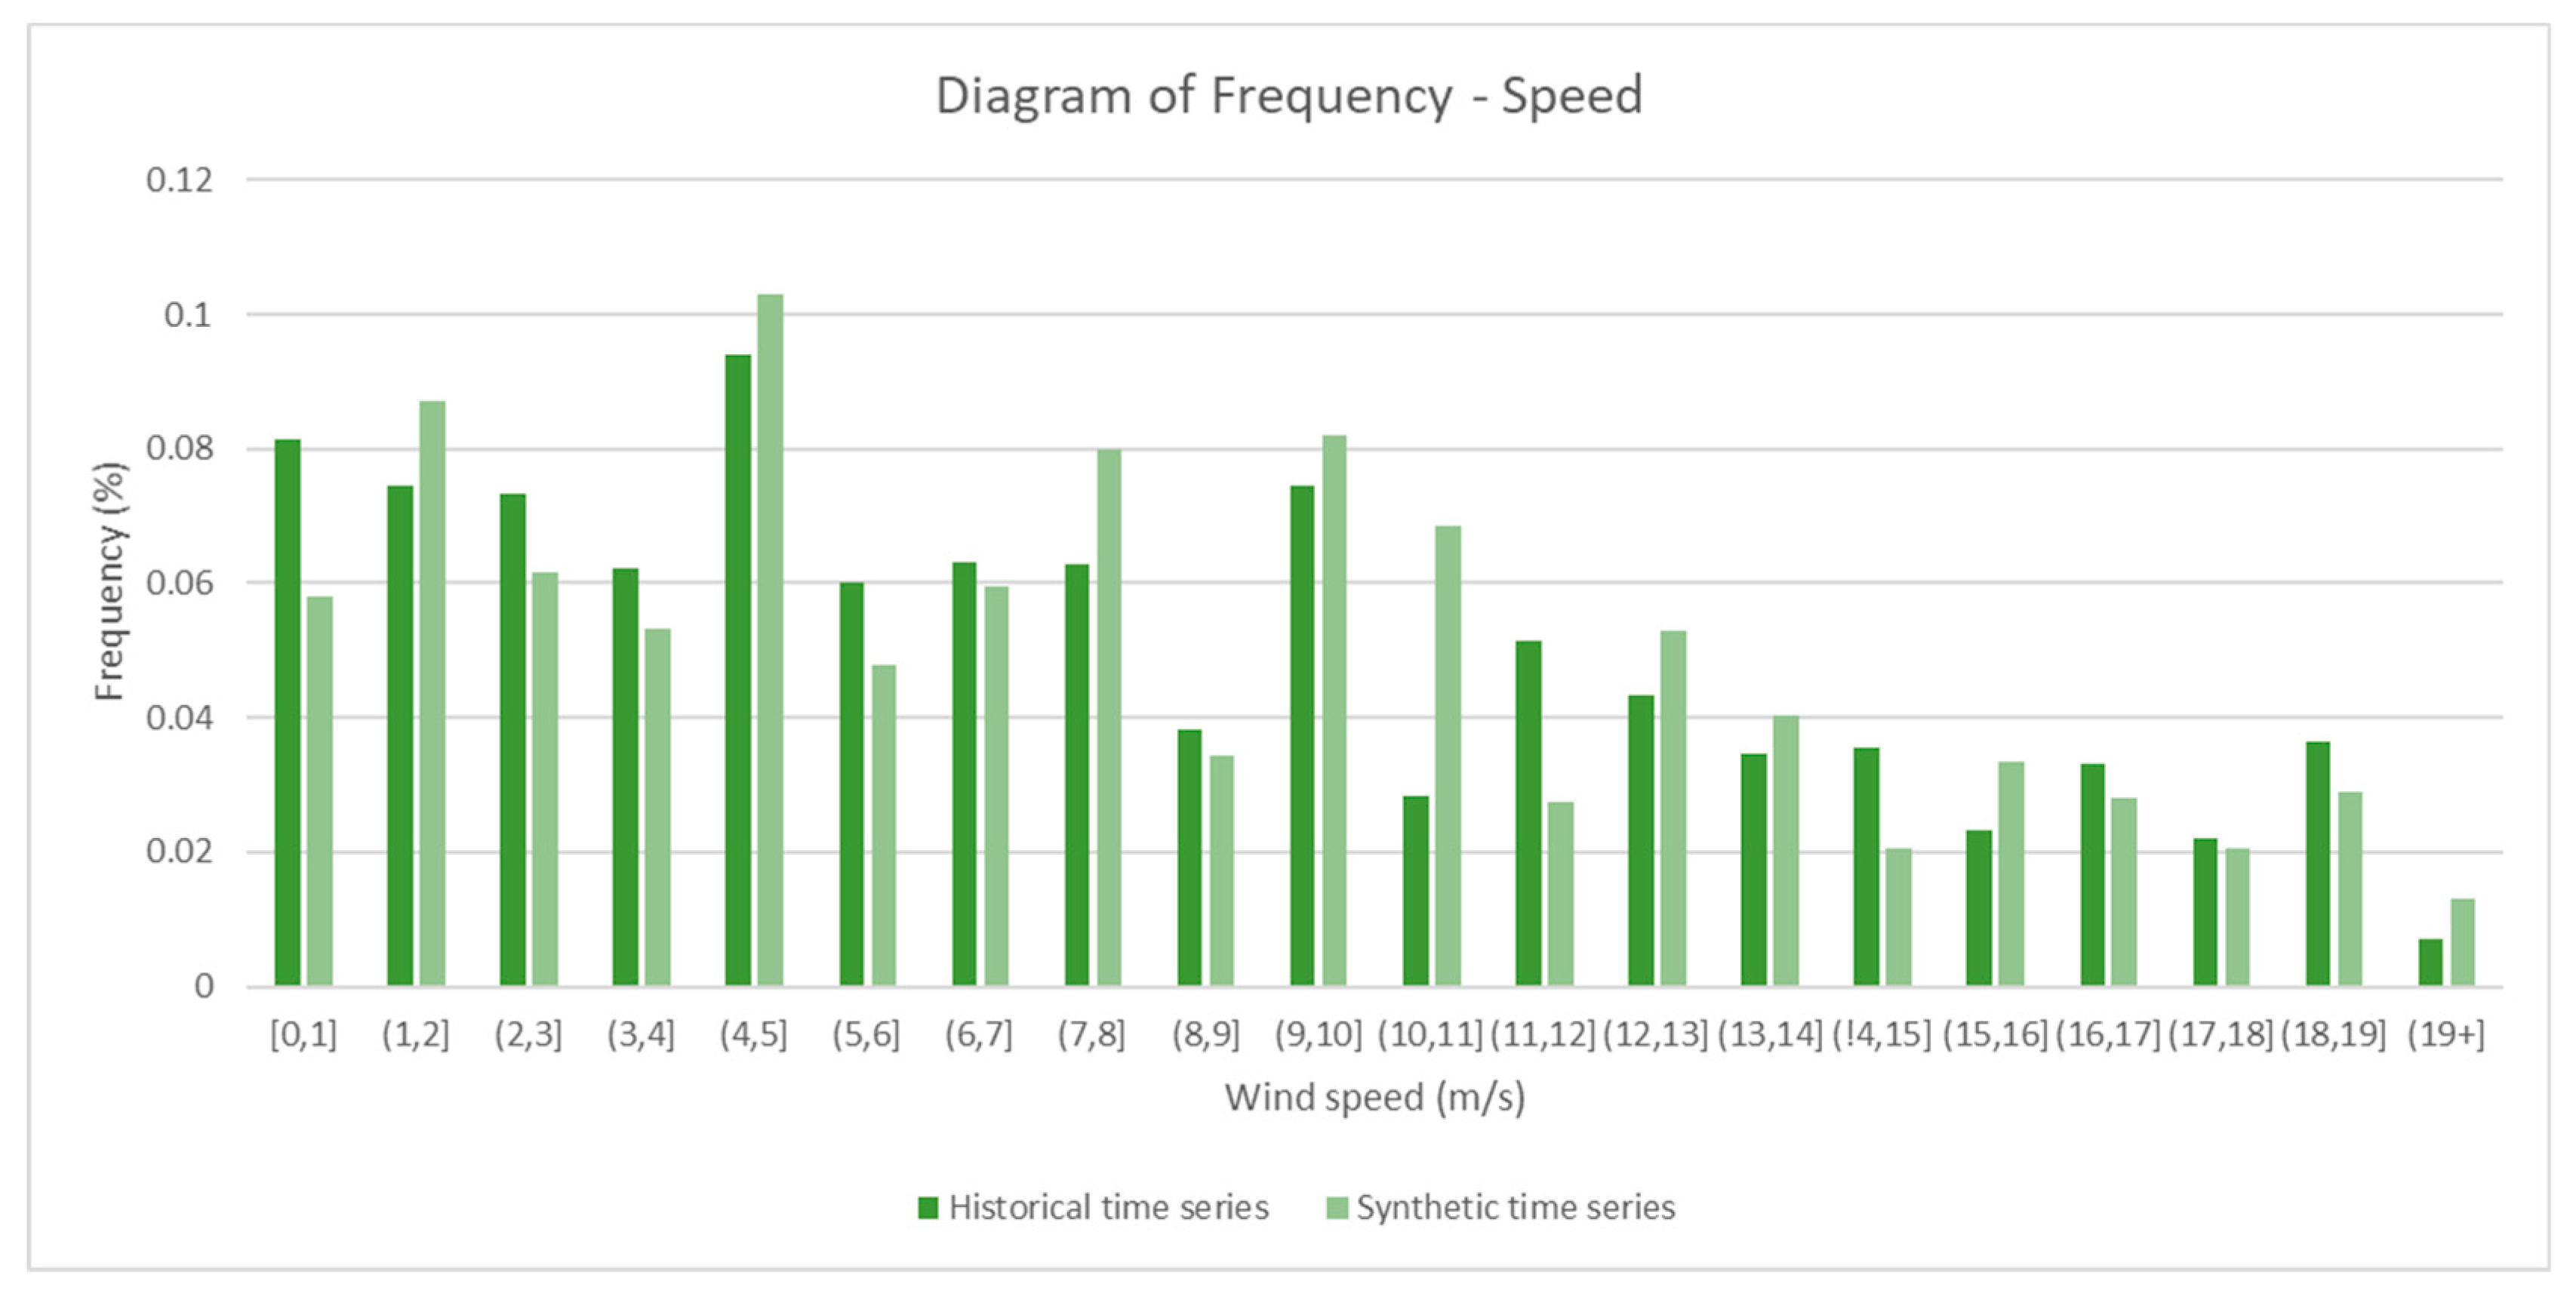
In order to understand the maintenance of the hourly variation and the seasonality of the wind, the frequencies–speeds of the historical and the produced time series of the wind are compared. As shown in
Figure 3, there is a similarity between the two and, therefore, the reliability of the model is verified. The graph corresponds to the geographical location that the historical time series data were collected. Even though there are some discrepancies, overall, the synthetic time series can be approved.
Besides the collection and analysis of the rainfall, temperature, and wind data, it is also necessary to assess the needs of the study area. The water, irrigation, and energy needs must be estimated for the lifespan of the HRES, since the study cannot be based on the current population and the current needs. To begin with, vacationers, i.e., people possessing a holiday home on the island, as well as tourists, contribute to the assessment of the island’s needs. The main tourist seasons are during June, July, and August, but that does not prevent visitors during May and September. The number of tourists and vacationers varies depending on the month.
For the estimation of the water needs of Lemnos, it is necessary to evaluate the water consumption per type of inhabitant. In particular, the average daily consumption is equal to 170 l/d/capita for permanent residents, 225 l/d/capita for vacationers, and 170 l/d/capita for tourists [
26]. However, due to increased water demands during summertime and in September, an additional 20% of water consumption is taken under consideration for the total population. Once the population projection for the year (target 2045) is available, which is based on the assumption of geometric progression, the water needs can then be calculated.
Figure 4 shows the monthly water supply change every 5 years. The results are considered reasonable, because the demand during the summer is increased, and in total, as the years go by, the water needs rise due to population growth.
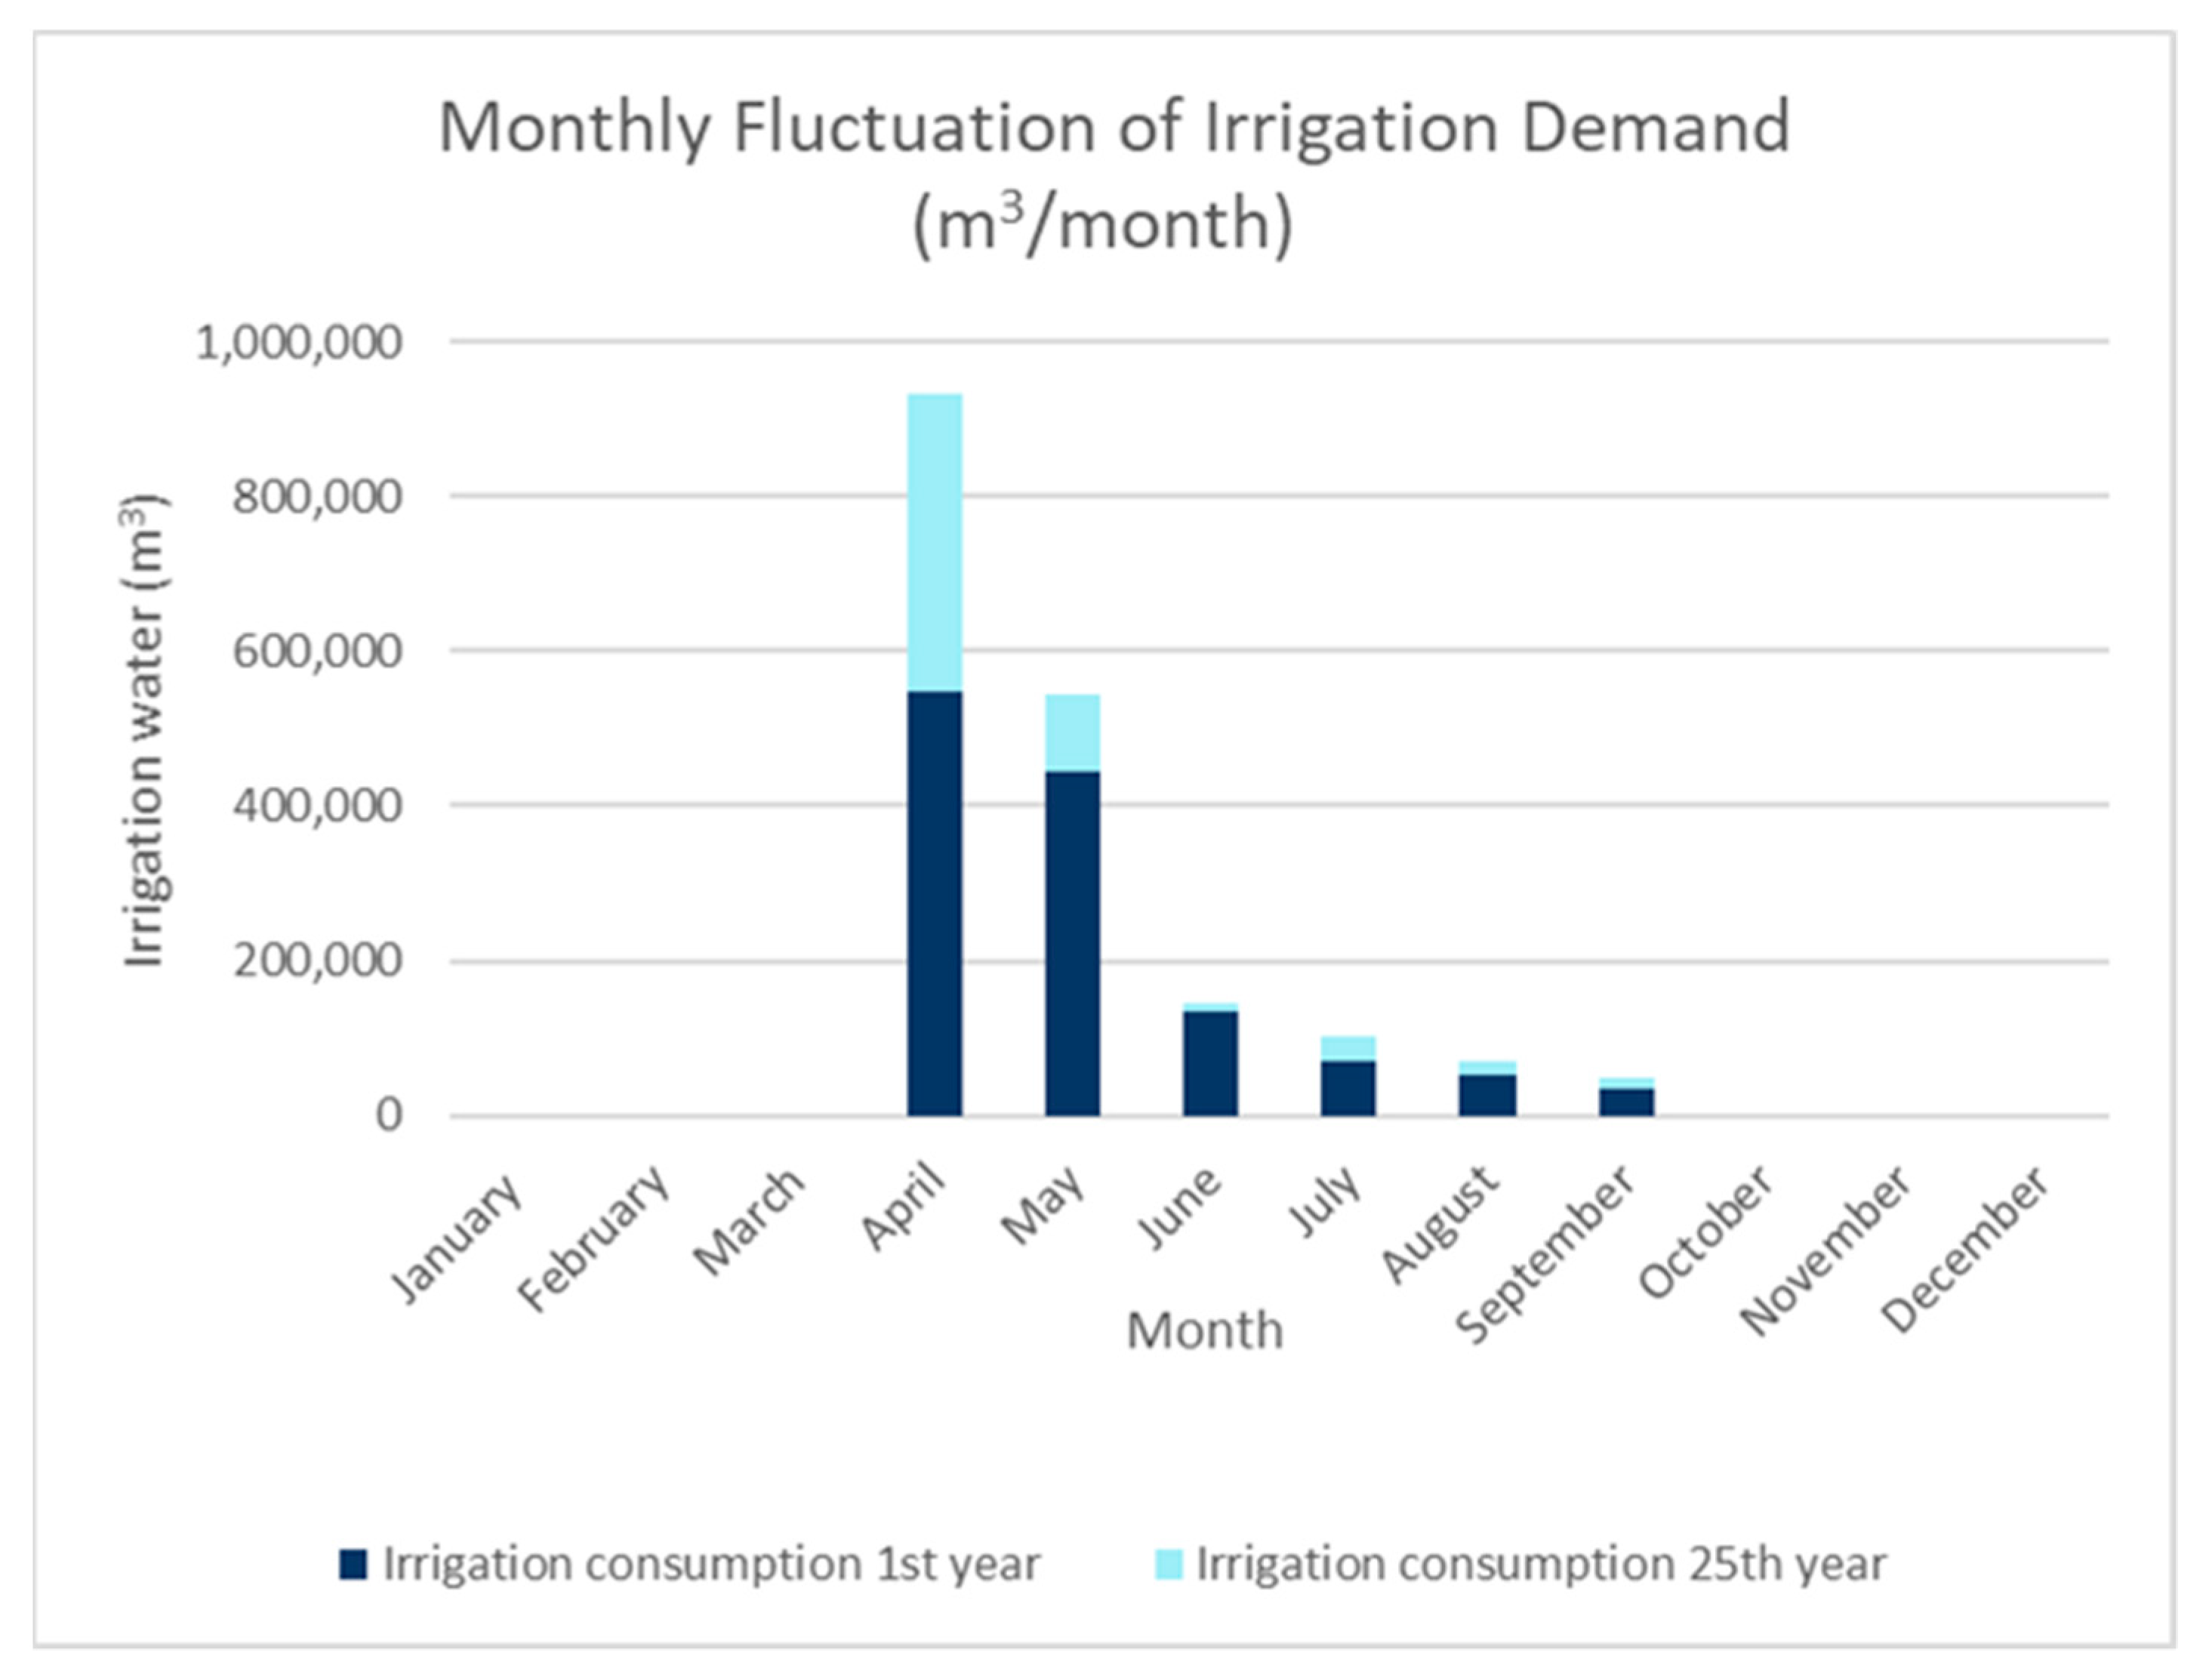
Irrigation is also necessary for the crops and livestock of the island. To estimate the irrigation needs of crops, the Blaney–Criddle method is used [
27]. The population growth does not have an impact as before. Blaney–Criddle developed an empirical equation that accounts for evaporation, the average air temperature, and the percentage of daylight hours. In
Figure 5, the irrigation consumption of the crops for the 1st and the 25th years of the HRES are presented.
The energy needs of Lemnos are fully covered by the APS, with a total installed capacity of 23.6 MW. The energy consumption data from 2016 to 2020, with a monthly step, are obtained from the Hellenic Electricity Distribution Network Operator (HEDNO). The average monthly demand for the year 2020 is presented in
Table 1.
2.3. Estimation of Produced Wind Energy
As already indicated, Lemnos has three wind turbines, Enercon E-44, installed with 900 kW of rated power each, in the southeastern part of the island. Nevertheless, the construction of a new wind farm is considered essential as a consequence of the increased water and energy demands. The location of the wind farm is purported to be in the northwestern part of the island, as shown in
Figure 6. This is due to the Natura 2000 protected areas located on the east side of Lemnos, with the favorable winds occurring on the north side. The average turbine—with a capacity of 2.5–3 MW—can produce more than 6 million kWh in a year—enough to supply 1500 average EU households with electricity [
28]. In 2020, there was a sharp increase for turbines installed in the 2.75–3.5 MW range. More wind energy per turbine means that fewer turbines are needed to generate a desired capacity across a wind plant—ultimately leading to lower costs [
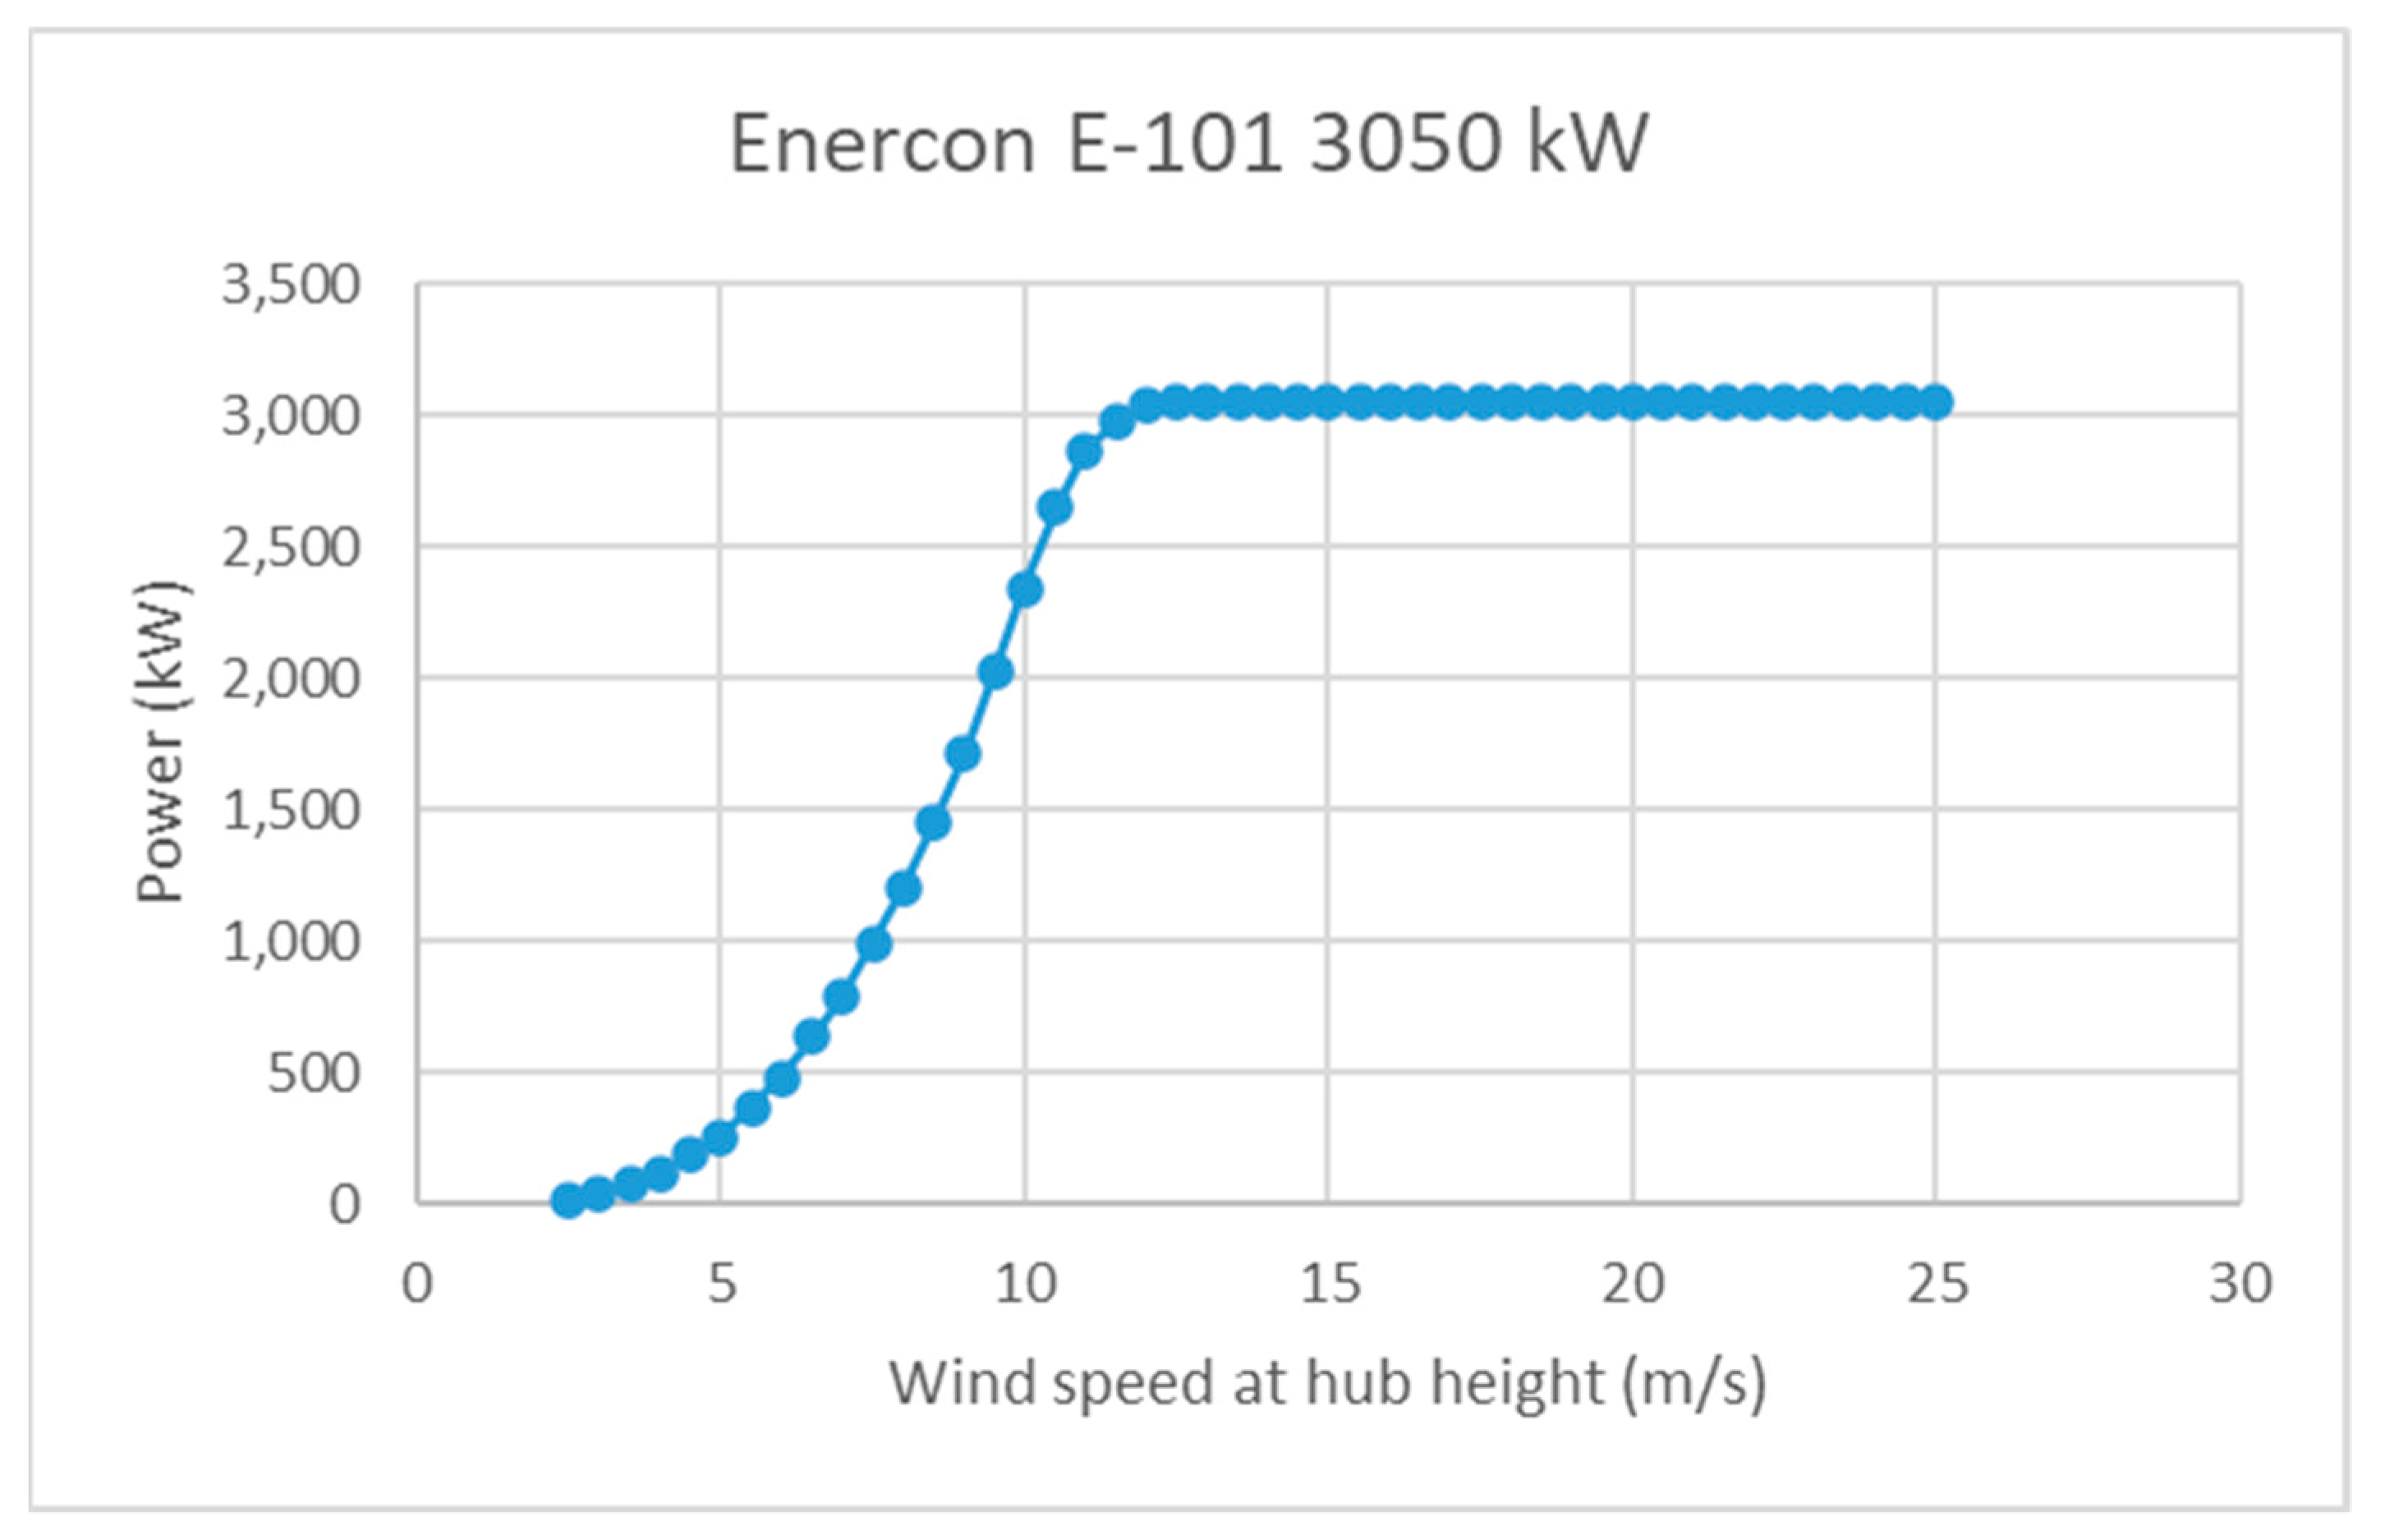
29]. The types of wind turbines considered are the Enercon E-101 of 3050 kW, Vestas V112 of 3000 kW, and Siemens SWT-101 of 3000 kW. The nominal curves between the three possible turbines are quite similar [
30,
31,
32]. However, Enercon E-101 3050 kW has the ability to make the most out of wind speed lower than 10 m/s.
Table 2 contains the expected power produced by each wind turbine. In
Figure 7, the power curve of Enercon E-101 of 3050 kW of rated power is presented.
2.4. Hydrogen Storage and Use
Hydrogen is a way to store and transport energy. Hydrogen produced by electrolysis is in a gaseous form. It is also an extremely light gas, which occupies a significant volume under atmospheric conditions. Its density is 0.09 kg/m
3. For efficient storage and transport of hydrogen, this volume must be reduced [
33]. The storage tanks considered in this study include hydrogen in compressed gaseous form and hydrogen in liquid form. The first case of hydrogen requires, for its compression, 4.05 kWh per kg of H
2 produced. Pragmatically, the temperature at which the gas is located remains constant and the pressure increases. At a value of 700 bar, which means 700 times the atmospheric pressure, hydrogen has a density of 42 kg/m
3. Under these conditions, about 5 kg of H
2 can be stored in a 125-litter tank. In the second case of hydrogen, its liquefaction requires 12 kWh per kg of H
2 produced. Hydrogen is converted from a gaseous form to a liquid form at a temperature below −253 °C (critical temperature). At this temperature and at atmospheric pressure, the density of the liquid hydrogen is approximately 71 kg/m
3. That means, 5 kg of liquid H
2 (LH
2) can be stored in a 75-liter tank [
34]. Therefore, for the production of hydrogen, the energy needs of the electrolysis system are taken into account, as well as the energy needs for the respective case of hydrogen storage. Under normal conditions of temperature and pressure, 1 kg of H
2 will occupy 12.15 m
3 possessing an energy content of 33.5 kWh [
35].
The HRES under study examines a hybrid system—a wind power plant and a desalination plant, with two possible energy storage systems, i.e., by the method of pump storage or by use of hydrogen produced through electrolysis [
36,
37,
38,
39]. Therefore, two operating scenarios are simulated and examined. The purpose of both storage methods is to cover as much as possible of the water supply, irrigation, and energy needs. During the simulation of both scenarios, 30% of the wind energy produced is driven directly to the grid, while the rest, 70%, is provided to the HRES. Moreover, in case of inability to meet the energy needs, the APS supplies electricity to the island. The lifespan of the project is 25 years.
2.5. Simulation
The model is simulated using the Microsoft Office Excel 365 program; the input data with an hourly step are:
The time series of wind energy produced;
The time series of energy needs;
The time series of water supply needs;
The time series of irrigation needs;
The capacity and the required energy for the desalination plant;
The capacity of the drinking water tank;
The height where the seawater reservoir is installed, its maximum and minimum water level, its capacity, as well as the power of the pumps used for pumping water. All of the above fall under the hydroelectric power plant;
The aforementioned time series are 25 years long, which is the lifespan of the project.
The output data of the model with an hourly step are:
The time series of generated hydroelectric energy;
The time series of total energy from renewable sources,;
The time series of deficit and its coverage by the APS;
The time series of water supply;
The time series of irrigation;
The time series of the water level of the drinking water tank and the reservoir of the hydroelectric power plant;
The reliability of meeting water supply, irrigation, and energy needs;
The time series of hydrogen produced by electrolysis.
3. Results—Discussion
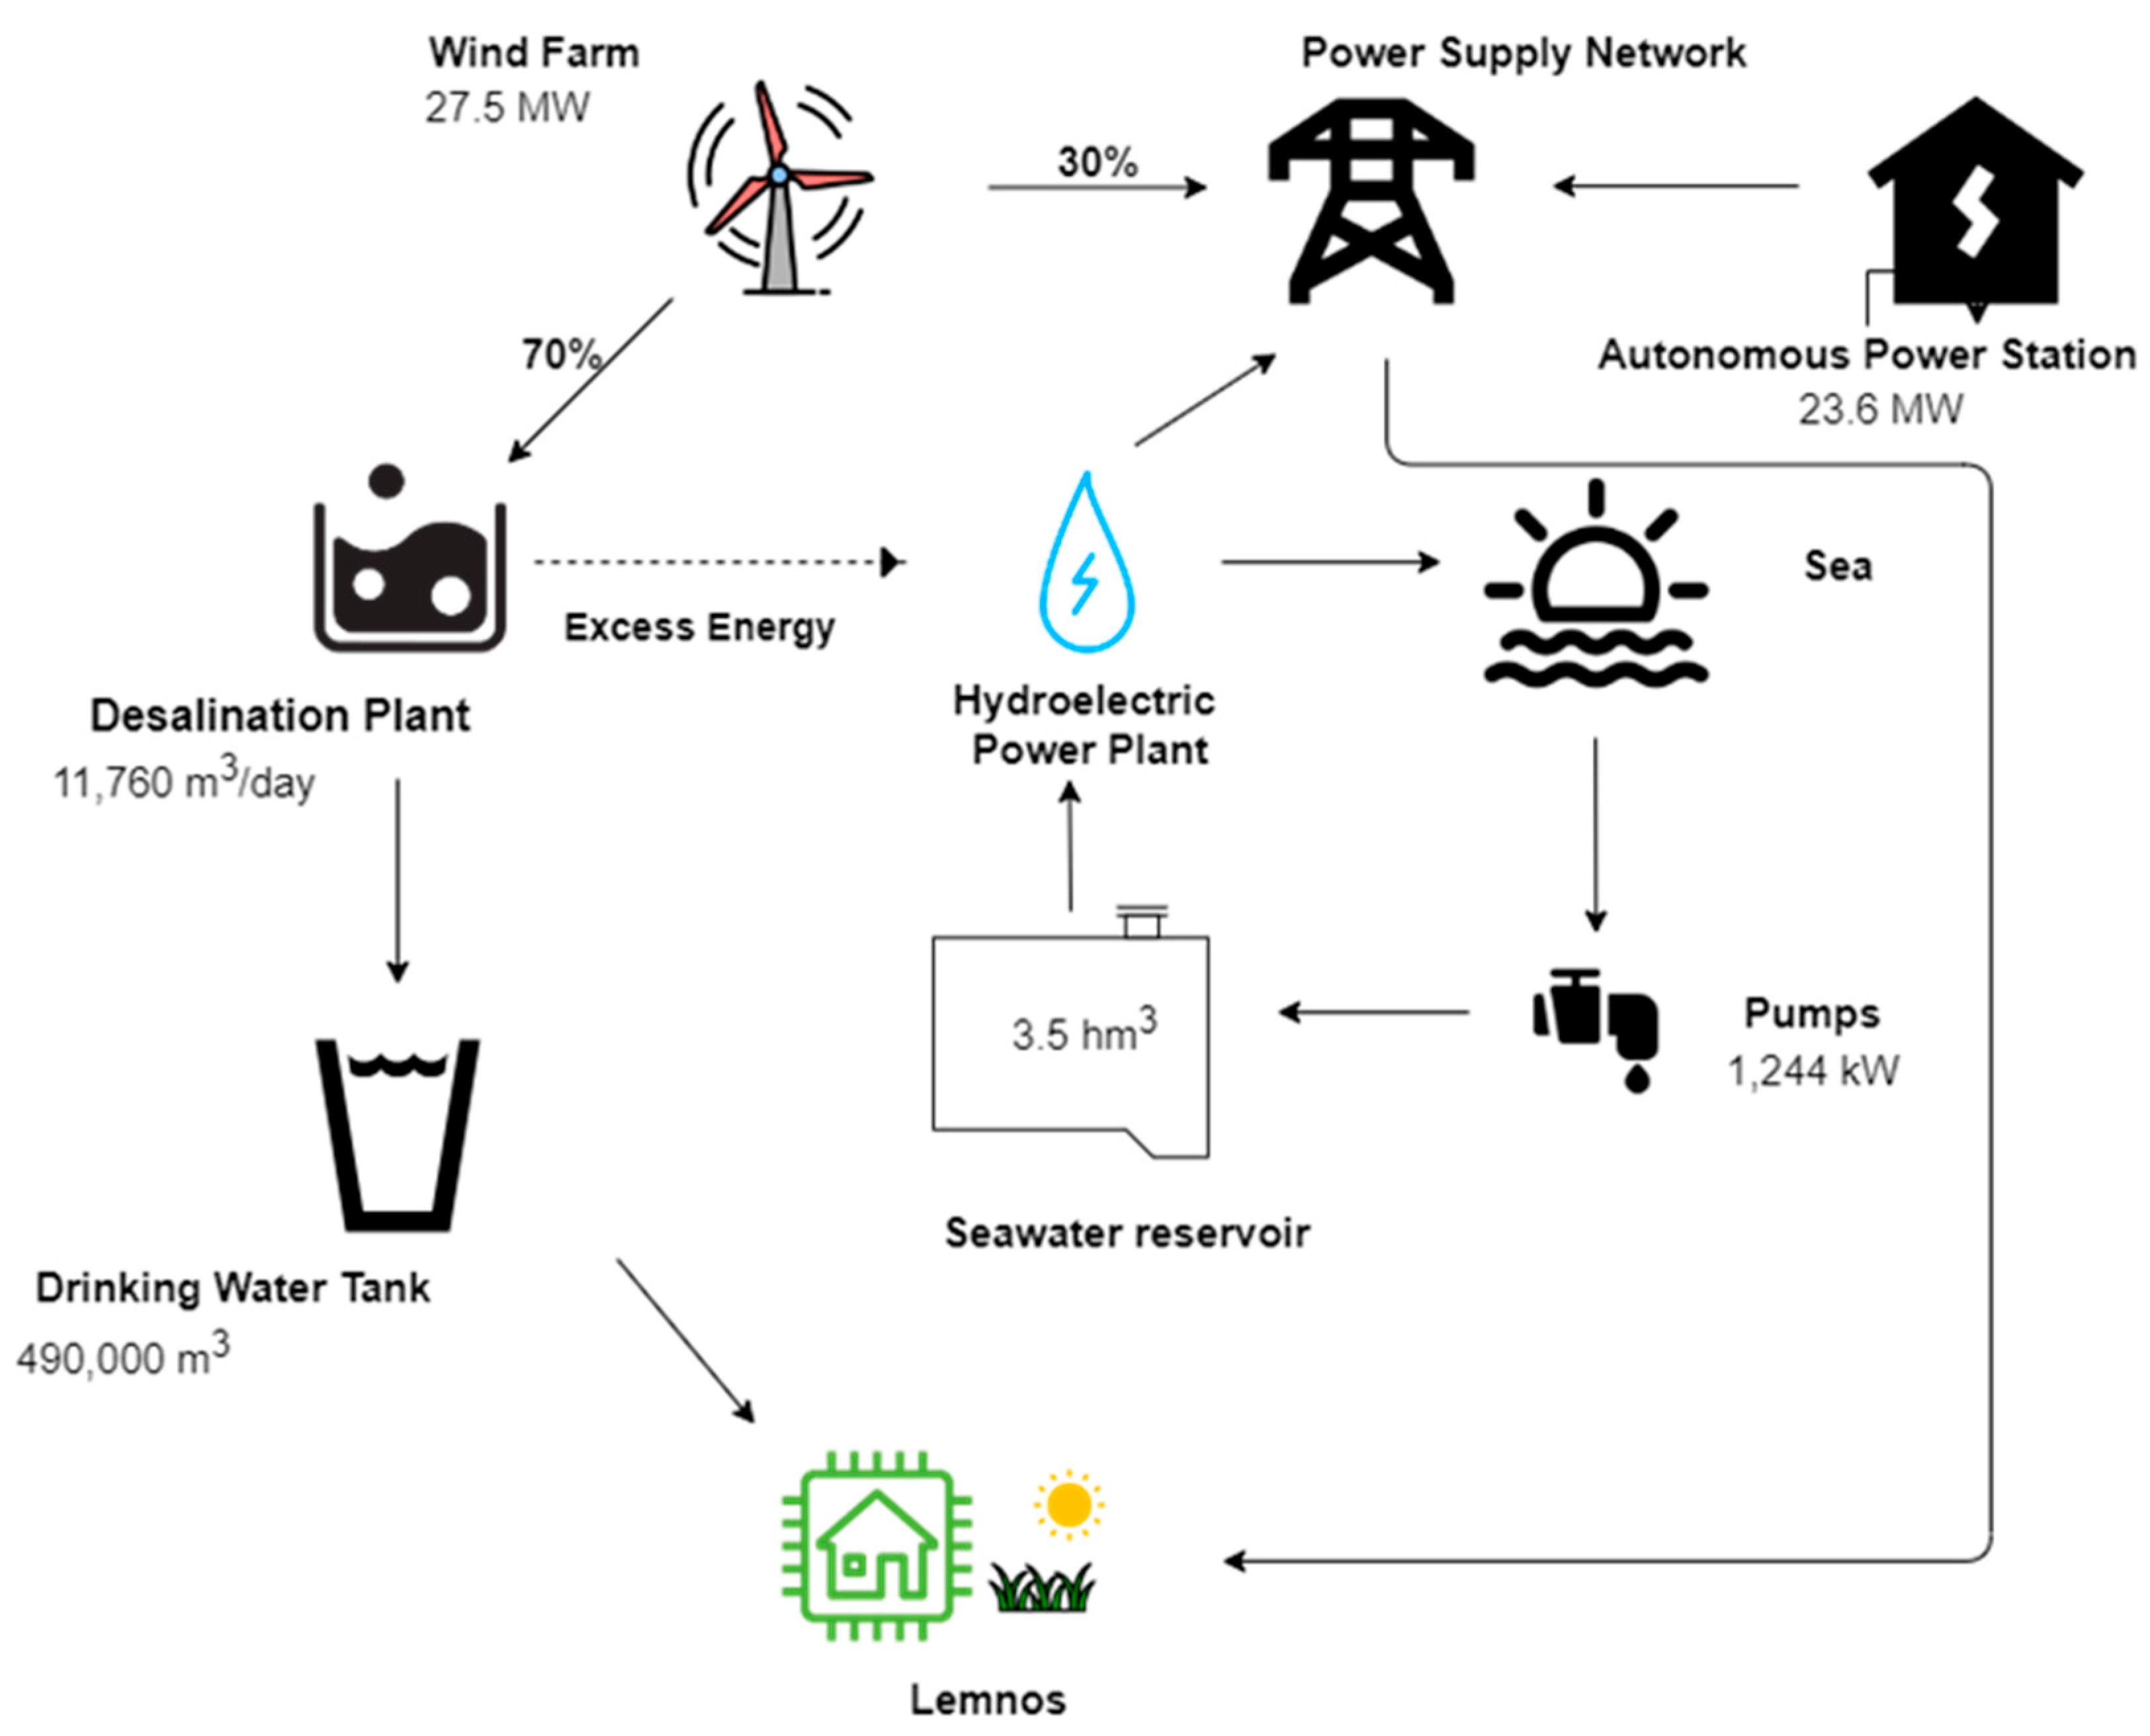
The first operating scenario of the HRES consists of a wind farm of nine turbines (type Enercon E-101), 3050 kW of rated power each, a desalination plant with 490 m
3/h capacity, a drinking water tank with 490,000 m
3 capacity, and a hydroelectric power plant with seawater reservoir of 3.5 hm
3 capacity. The capacity and the quantity of the elements are derived from the optimization of the particular system. A total of 30% of the produced wind energy is channeled directly to the power supply network. The rest, 70%, is used first from the desalination plant, for the production of drinking water. Afterwards, the excess energy, if any, is used from the hydroelectric plant. The latter pumps seawater to the seawater reservoir. When energy is needed from the HRES, the appropriate amount of water passes through the turbines. In addition, the hydroelectric plant can provide energy to the desalination plant, at times when the produced wind energy is not enough for the coverage of water needs. In case the wind farm and the hydroelectric plant do not produce enough energy, the APS offers the amount of energy needed.
Figure 8 demonstrates the schematic diagram of operating scenario 1 (pumped storage).
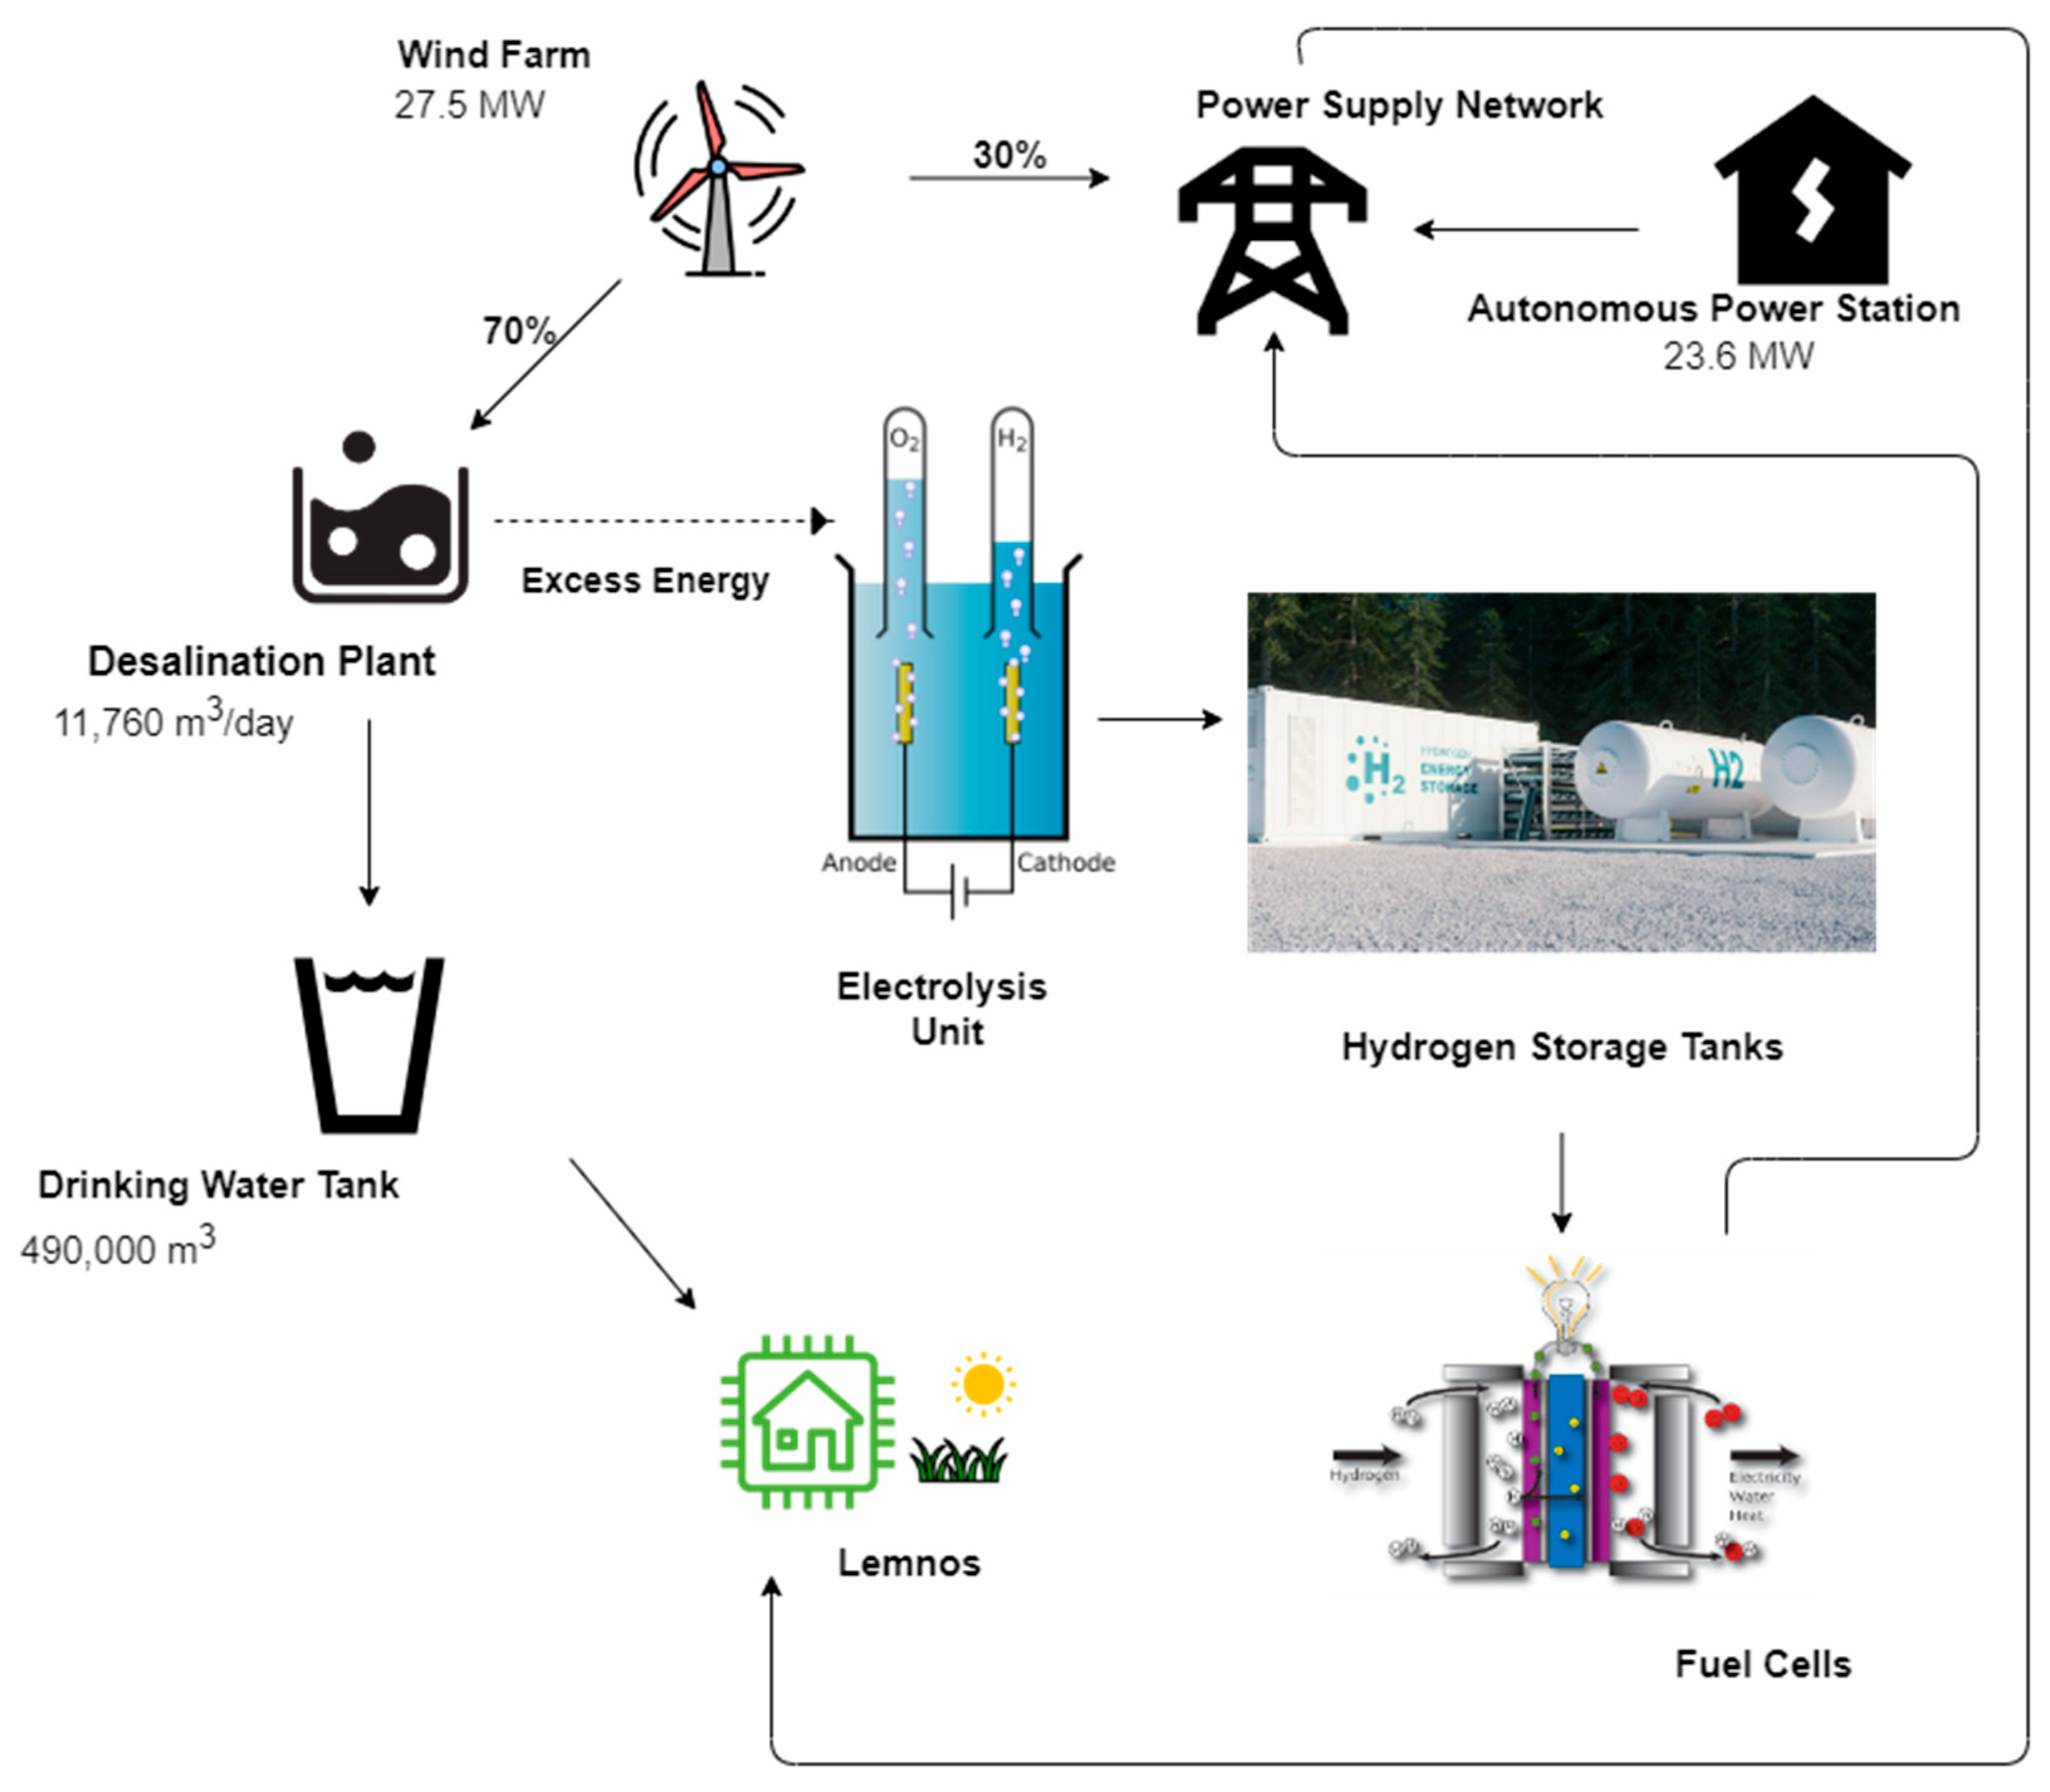
The second operating scenario of the HRES consists of the same type of wind farms, the same desalination plant with 490 m
3/h capacity, a drinking water tank of equal capacity as before, and a seawater electrolysis unit for the production and later storage of hydrogen. The capacity and the quantity of the elements are derived from the optimization of the particular system. A total of 30% of the produced wind energy is channeled directly to the power supply network. The remaining 70% is used first by the desalination plant, for the production of drinking water. Afterwards, the excess energy, if any, is used by the electrolysis unit. The latter produces hydrogen in a gaseous form, which is then channeled to hydrogen storage tanks. When energy is needed from the HRES, the appropriate amount of hydrogen flows through the fuel cells. On the occasion that there is not enough energy produced from the wind farm, the APS provides the amount needed to the desalination plant.
Figure 9 presents the schematic diagram of operating scenario 2.
The two operating scenarios of the HRES differ in the way energy is stored and, therefore, its use, in case the grid requires electricity.
Table 3 contains the basic elements of both scenarios.
The primary goal of both the scenarios is to meet the water needs of Lemnos. This goal is achieved from both of them with 99.99% reliability; 70% of the wind energy is offered directly to the HRES and it is first used by the desalination plant, for the production of drinking water. The irrigation needs follow. Corresponding with meeting the needs of the water supply, the water used for irrigation derives from the desalination plant and, therefore, from the drinking water tank. If the water tank is 20% full of its capacity or more, it can offer water for the coverage of irrigation needs. The desalination plant and the drinking water tank are common features of the two operating scenarios, resulting in the same percentage of reliability, i.e., 66%.
However, the scenarios differ significantly in meeting energy needs. The first one, which is with the hydroelectric plant, has reliability equal to 91%. The desalination plant channels the excess energy to the pumped hydro station. When the need of electricity arises, water is channeled through the turbines and potential energy is converted to electricity.
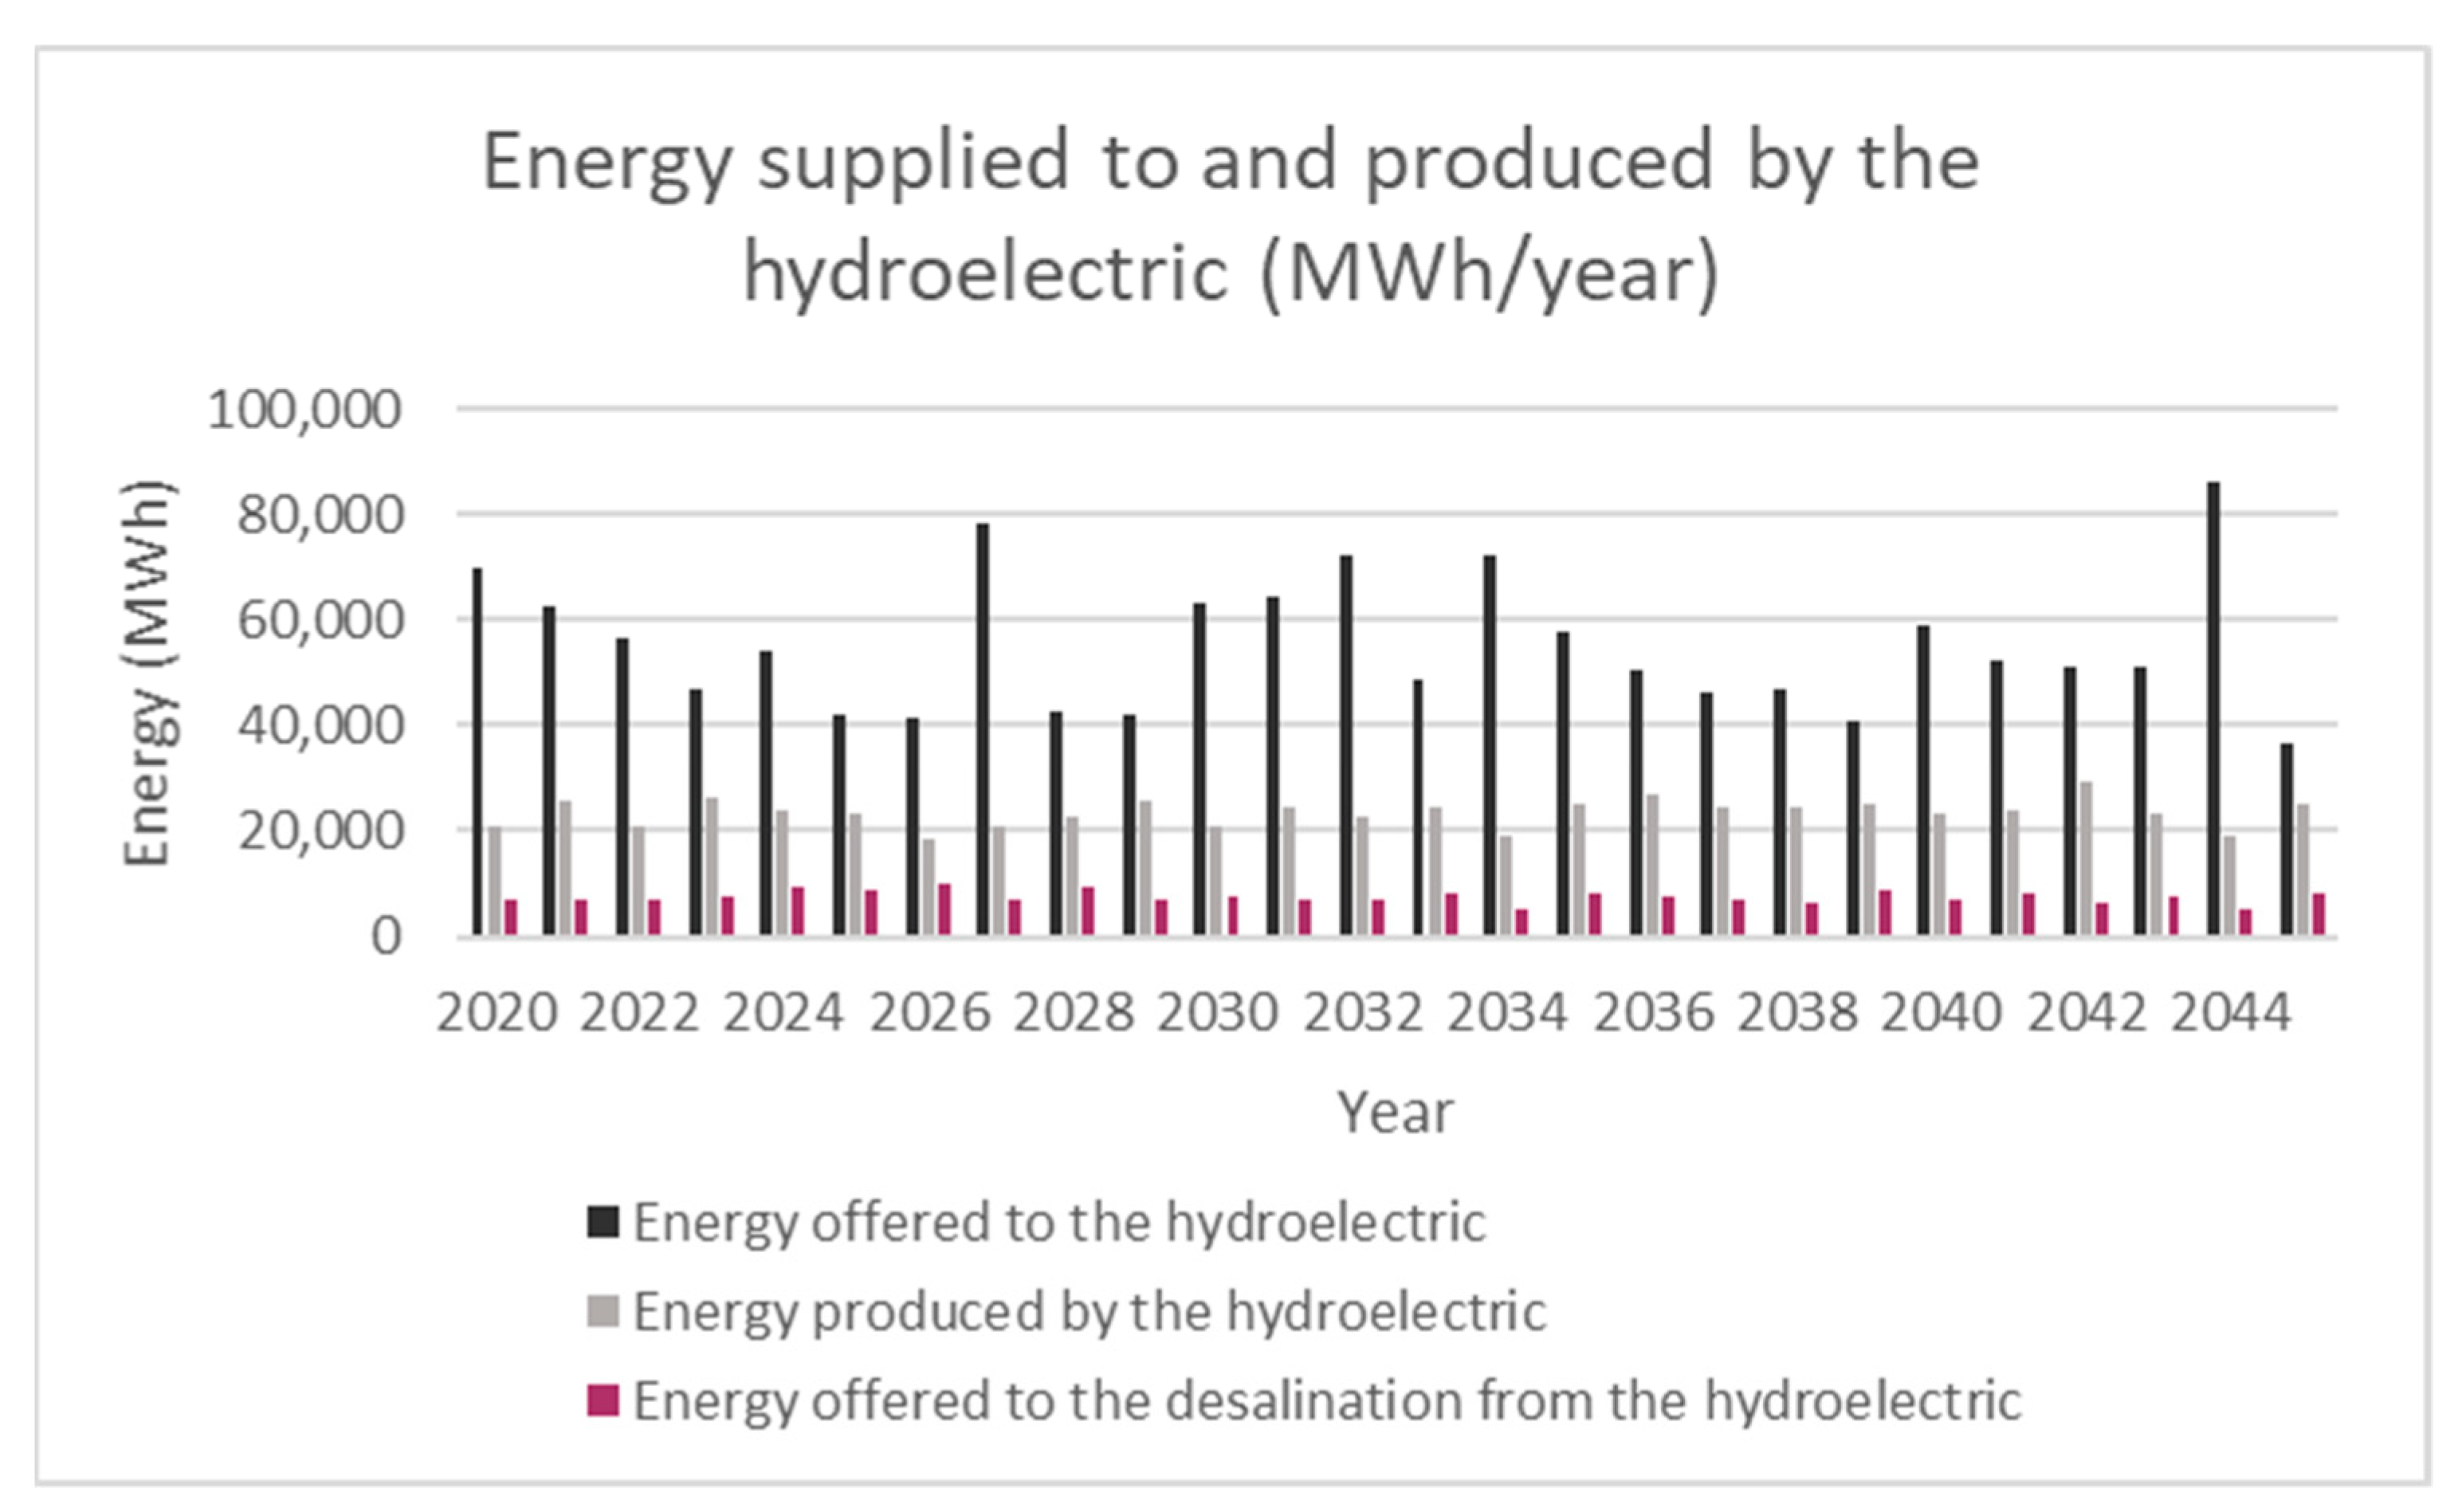
Figure 10 presents the energy that is offered to and produced by the hydroelectric project. The annual energy production varies. For example, the year 2026 is not as productive—wind energy wise—as is year 2027, according to the synthetic time series that was created. However, the generated energy of the hydroelectric, which is channeled to the grid, appears to be, every year, approximately 20,000 MWh for the lifespan of the HRES. Moreover, the pumped hydro station produces energy only when it is needed. In addition, the hydroelectric covers the energy needs of the desalination plant for the production of drinking water.
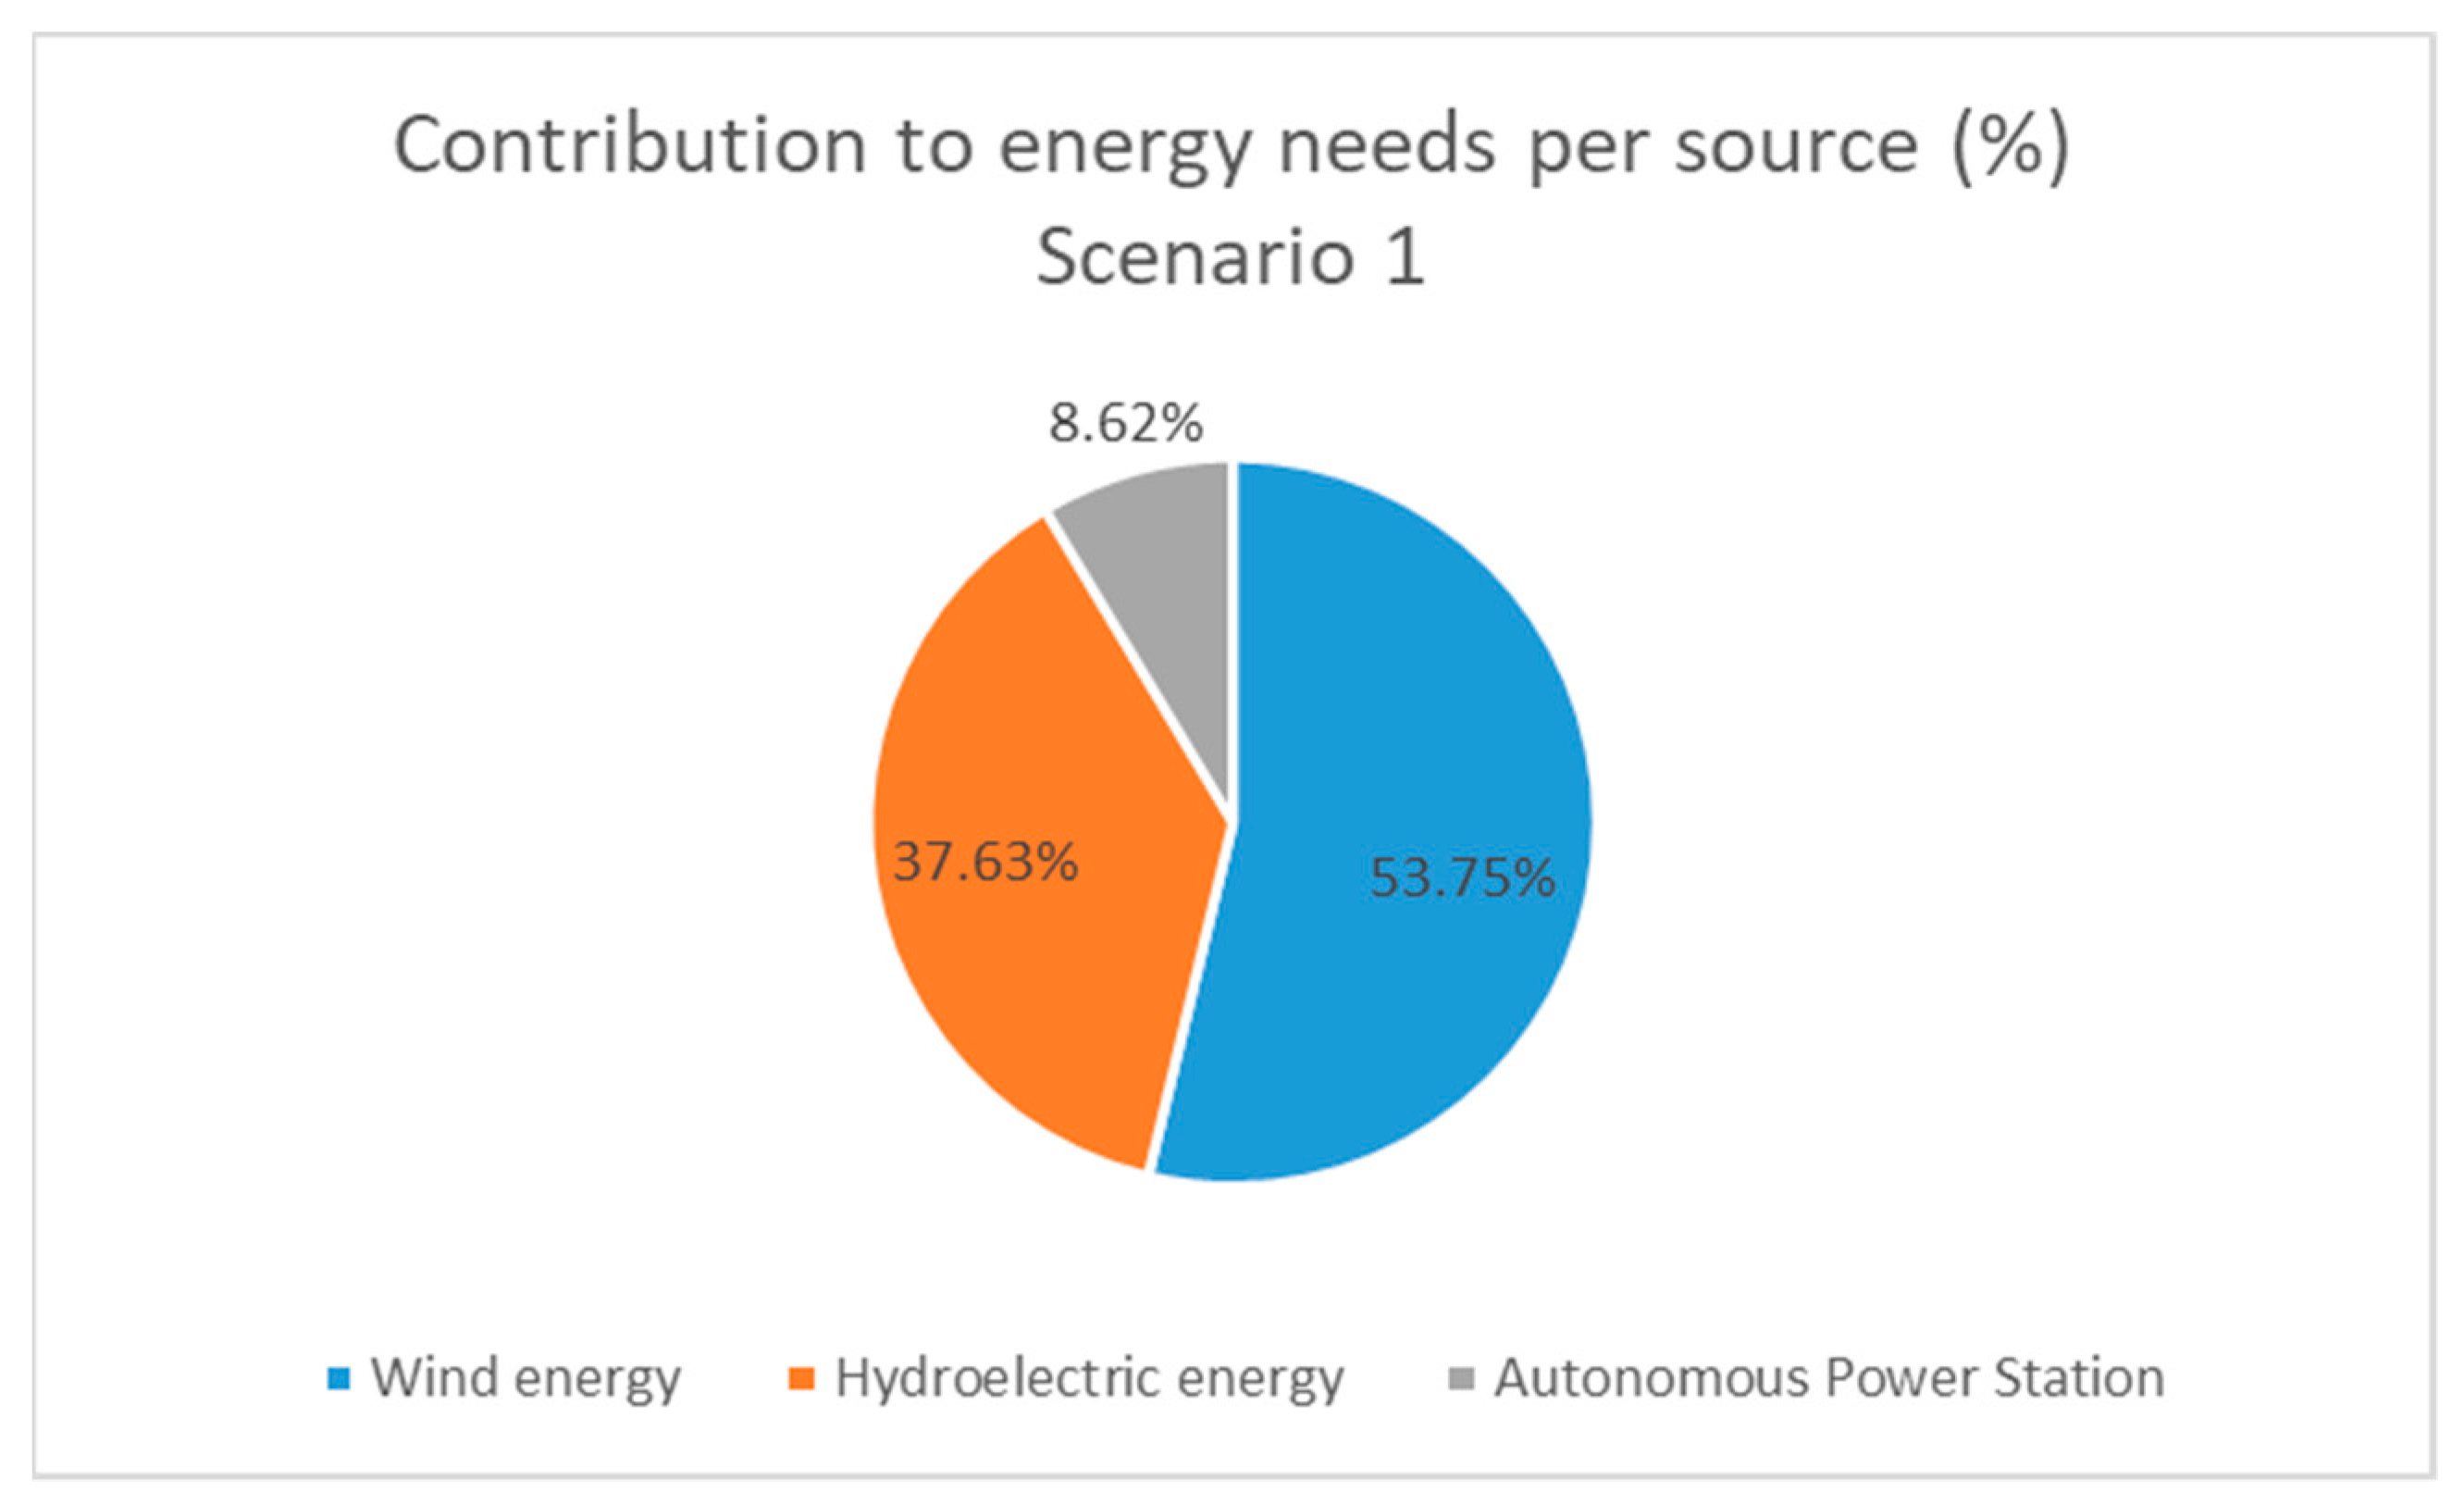
The HRES of the first scenario can cover 91% of the energy needs of Lemnos. As shown in
Figure 11, from that, 53.75% is from wind energy and the rest, 37.63%, is from the energy of the hydroelectric plant. As for the 8.62% that is not covered by the current HRES, the APS offers the energy needed. The APS remains in operation at 15% of its capacity, despite the existence of the HRES.
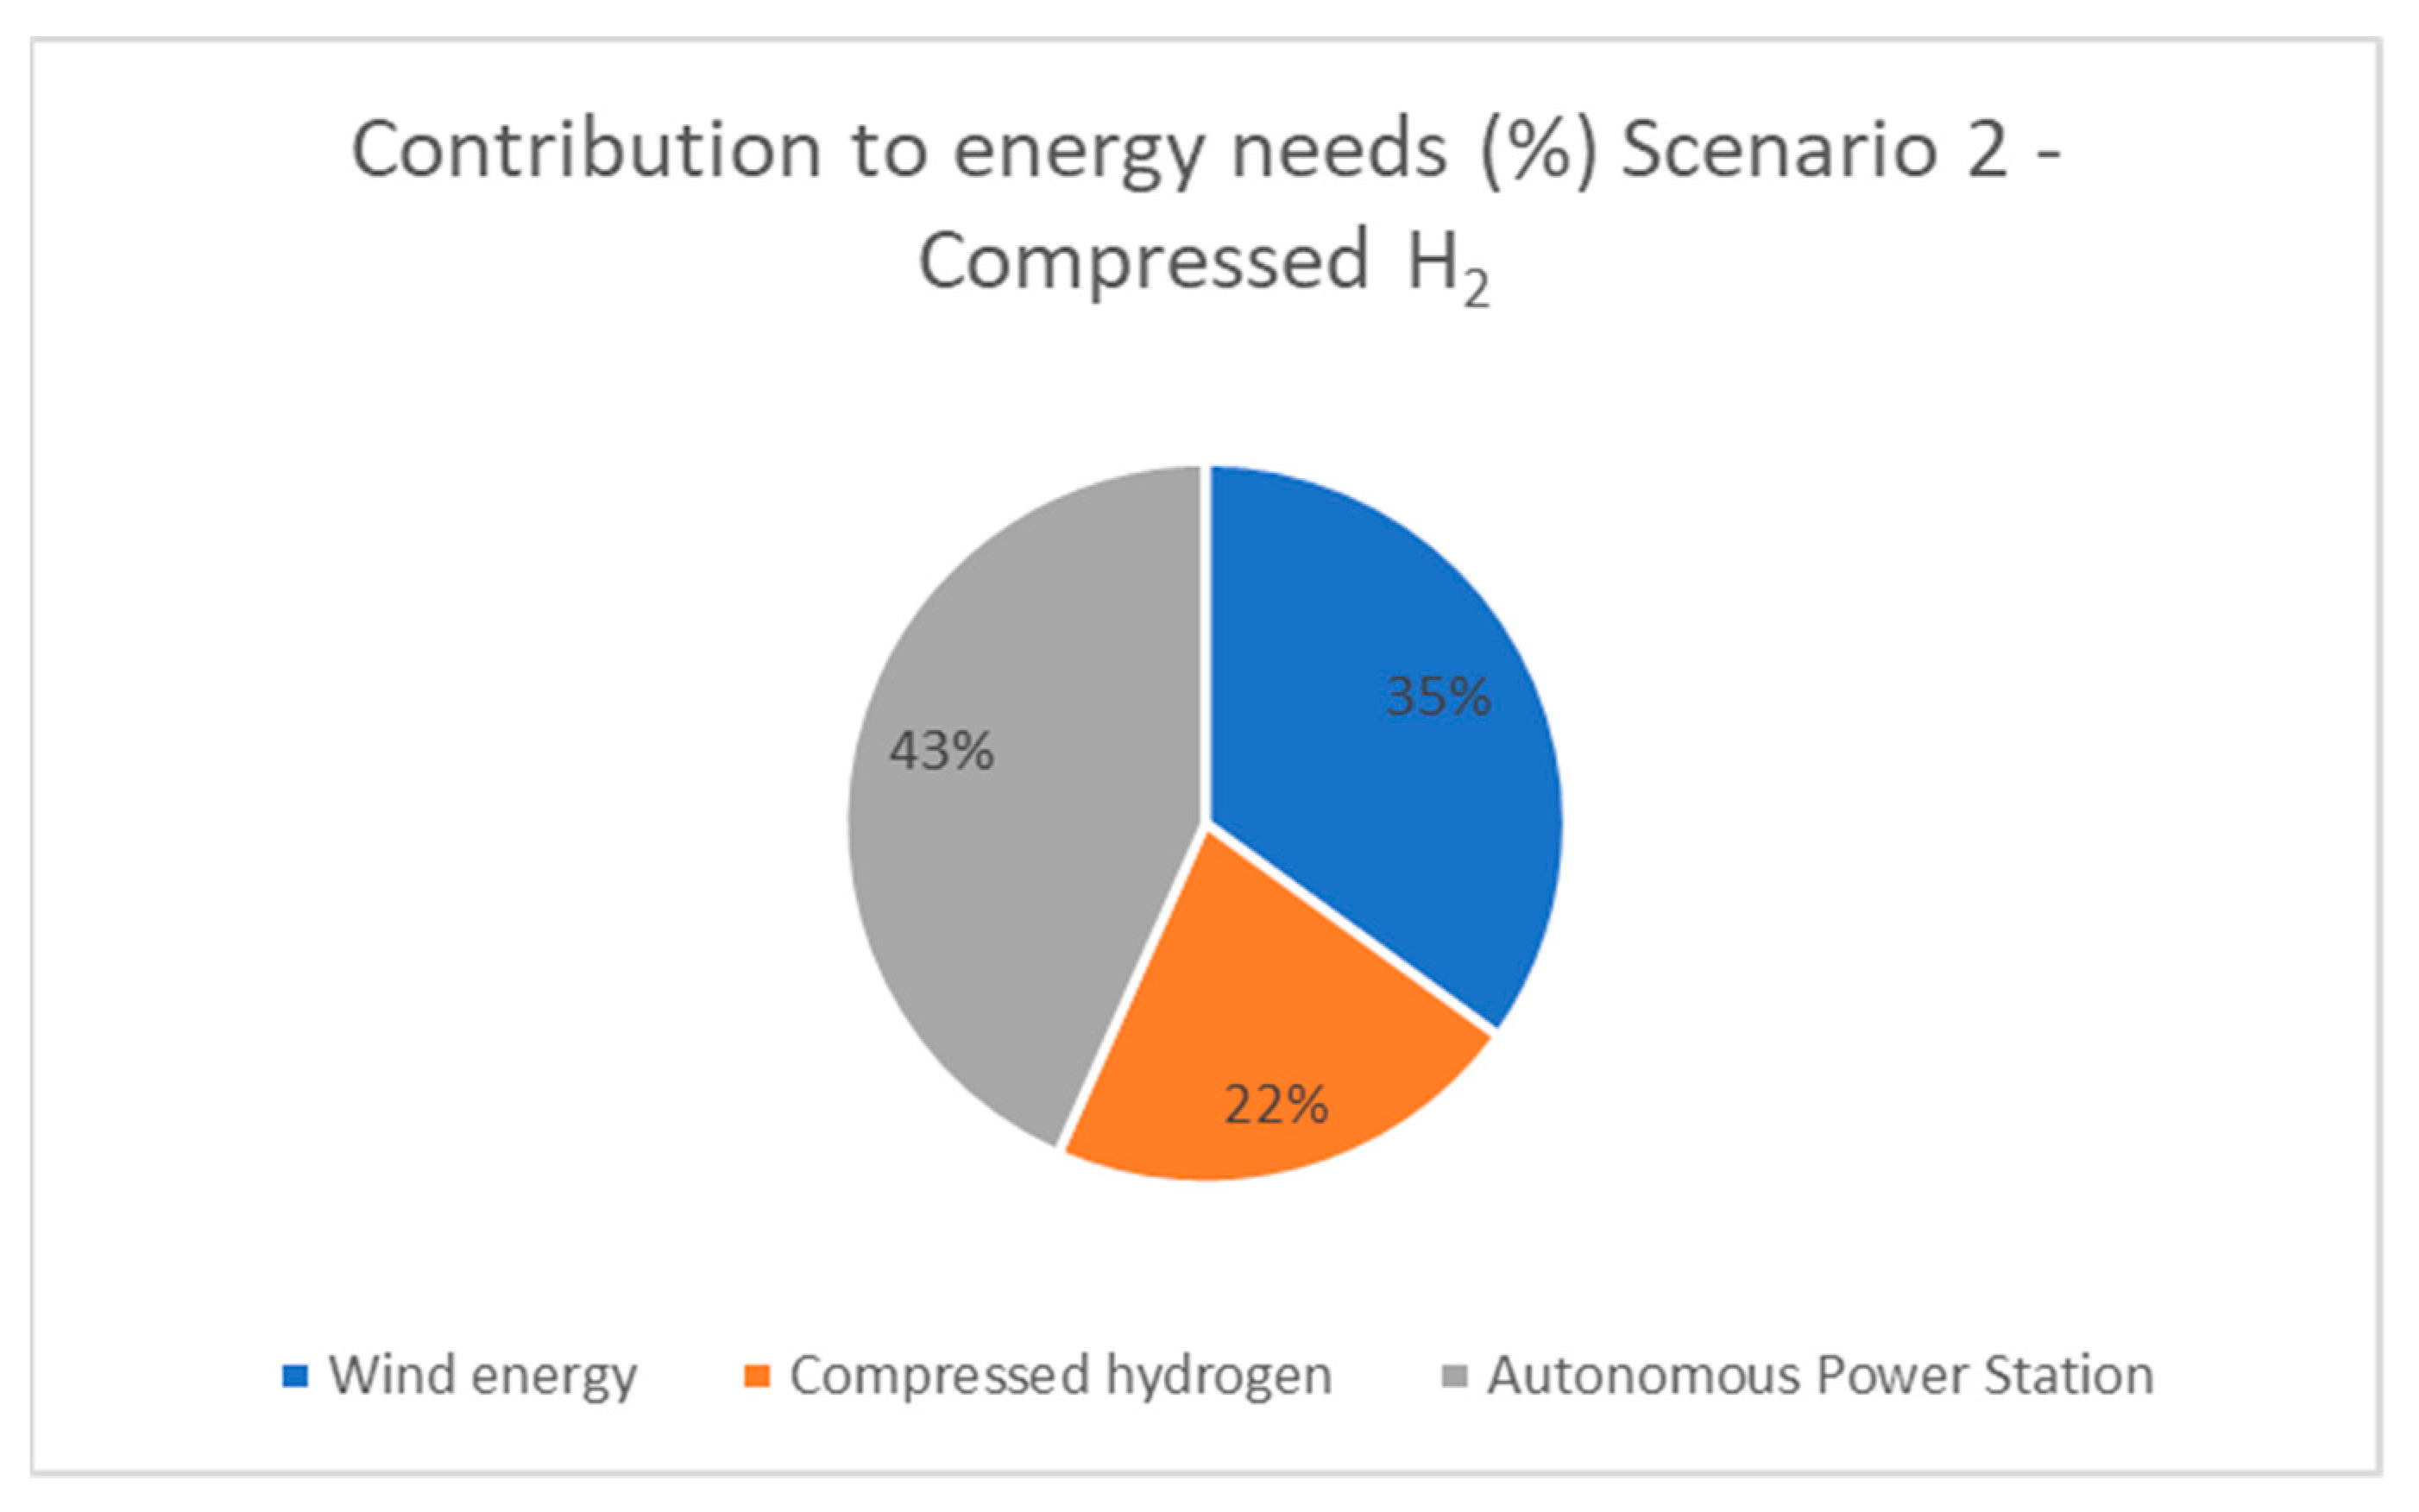
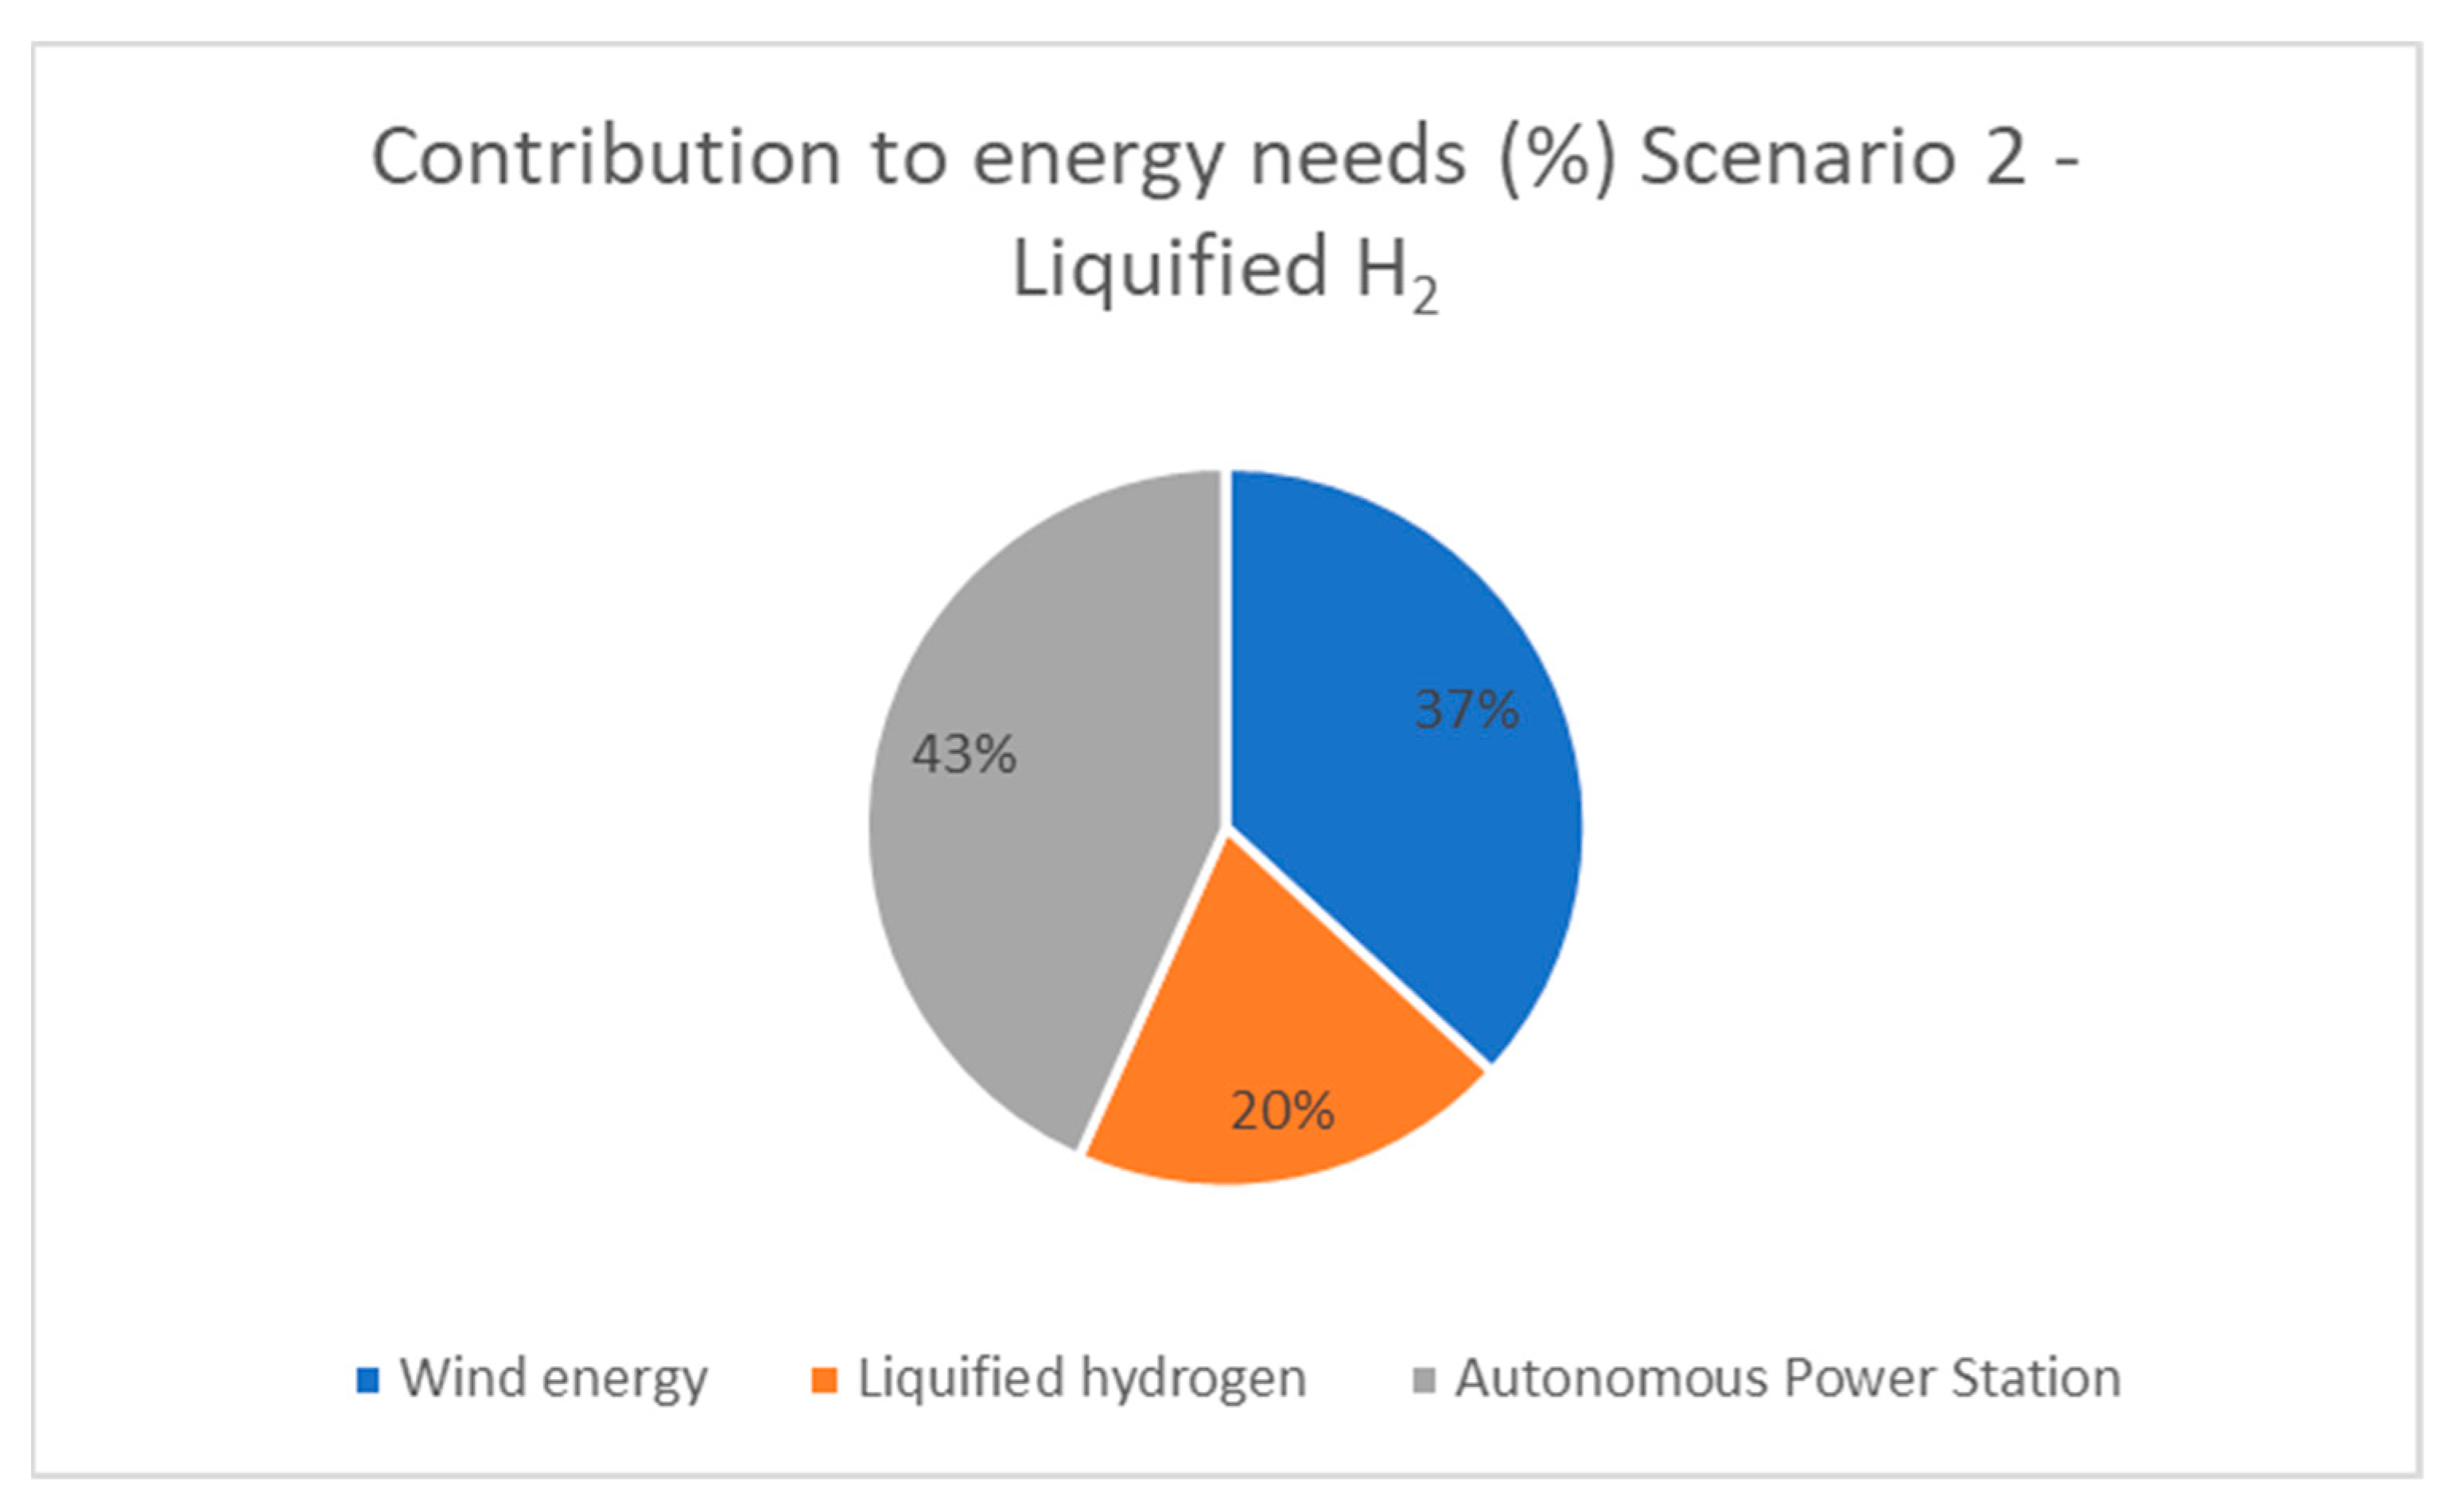
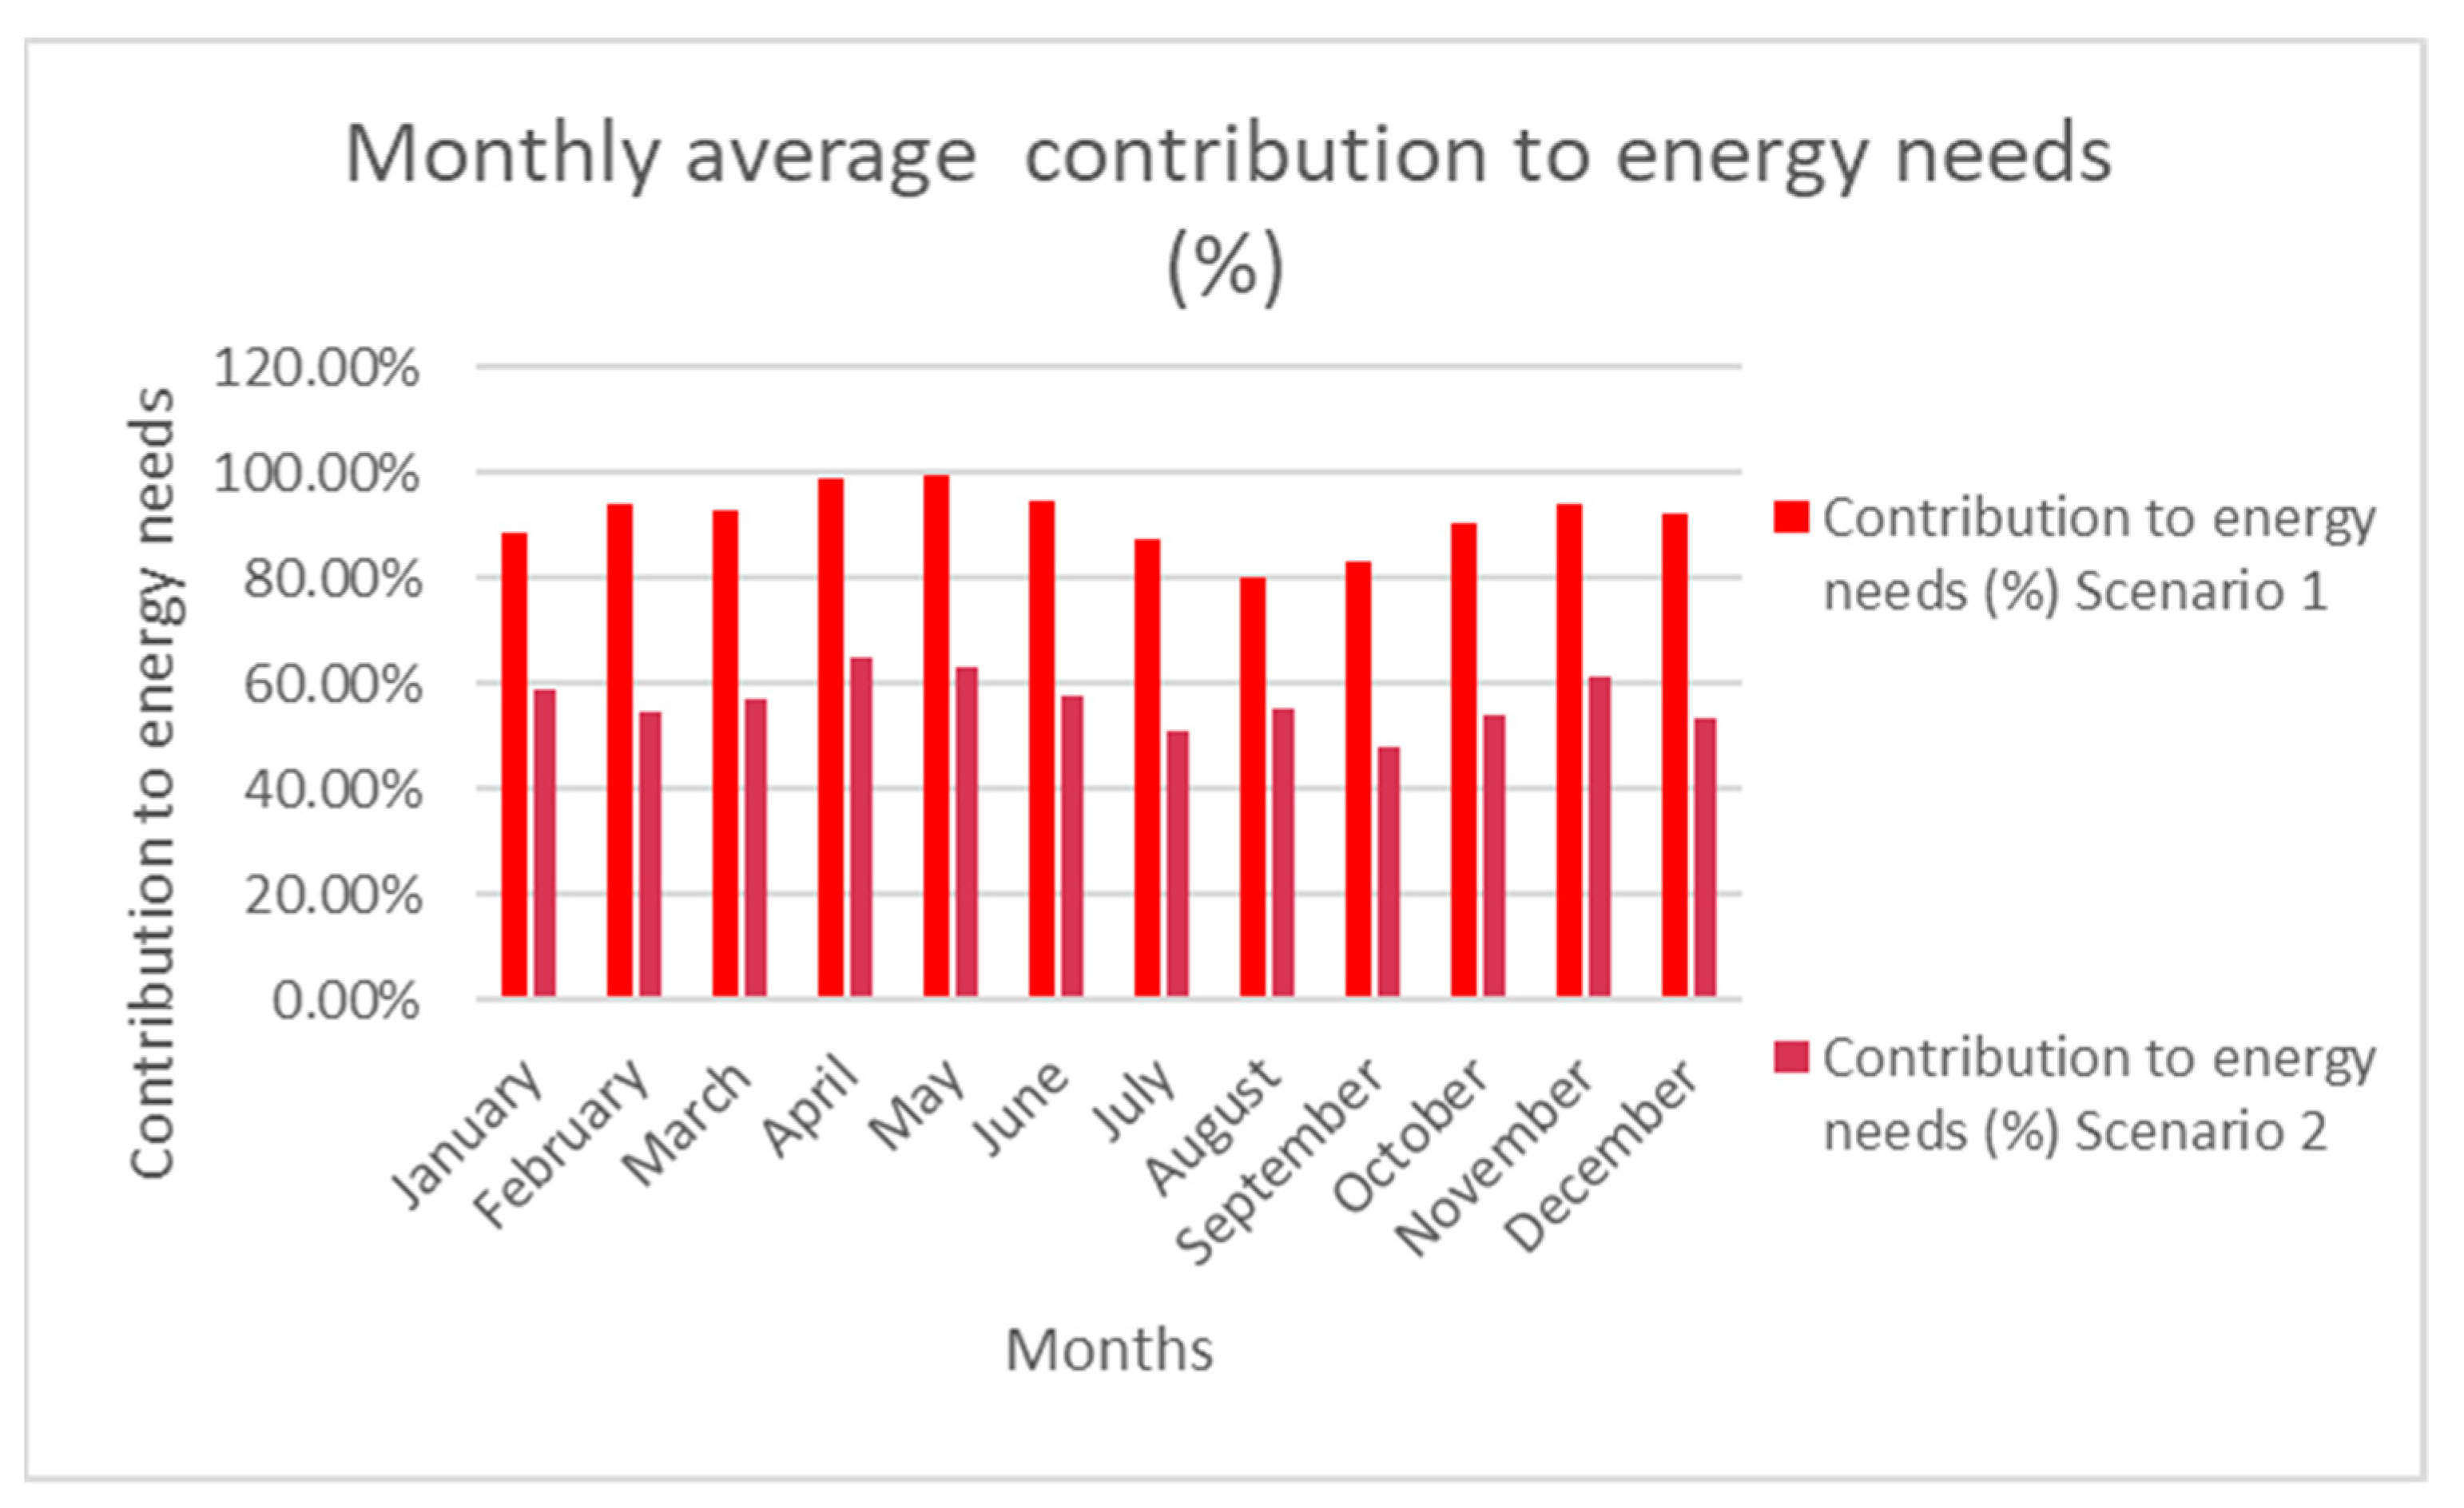
The second scenario, the one that contains hydrogen storage, has reliability of covering energy needs equal to 57%. This percentage stays fixed, using either compressed gas hydrogen or liquefied hydrogen. The energy that is offered, first in the electrolysis and then in the respective storage tank, is actually the wind energy that is not used from the desalination plant. The electrolysis unit produces hydrogen gas, which can then be stored at very high pressures (compressed) or at very low temperatures (liquefied). Nevertheless, if compressed hydrogen is selected, then wind energy meets 35% of the energy needs and the remaining 22% is covered by the conversion of compressed hydrogen to electricity through fuel cells. If the use of liquefied hydrogen is chosen, then 37% of the needs are met by wind energy and 20% by the conversion of liquefied hydrogen to electricity through fuel cells. In both cases, the APS-operating at part of its capacity covers 43% of the needs. The percentages of each choice are shown in
Figure 12 and
Figure 13.
Figure 14 shows the monthly fluctuation of contributions to energy needs per scenario.
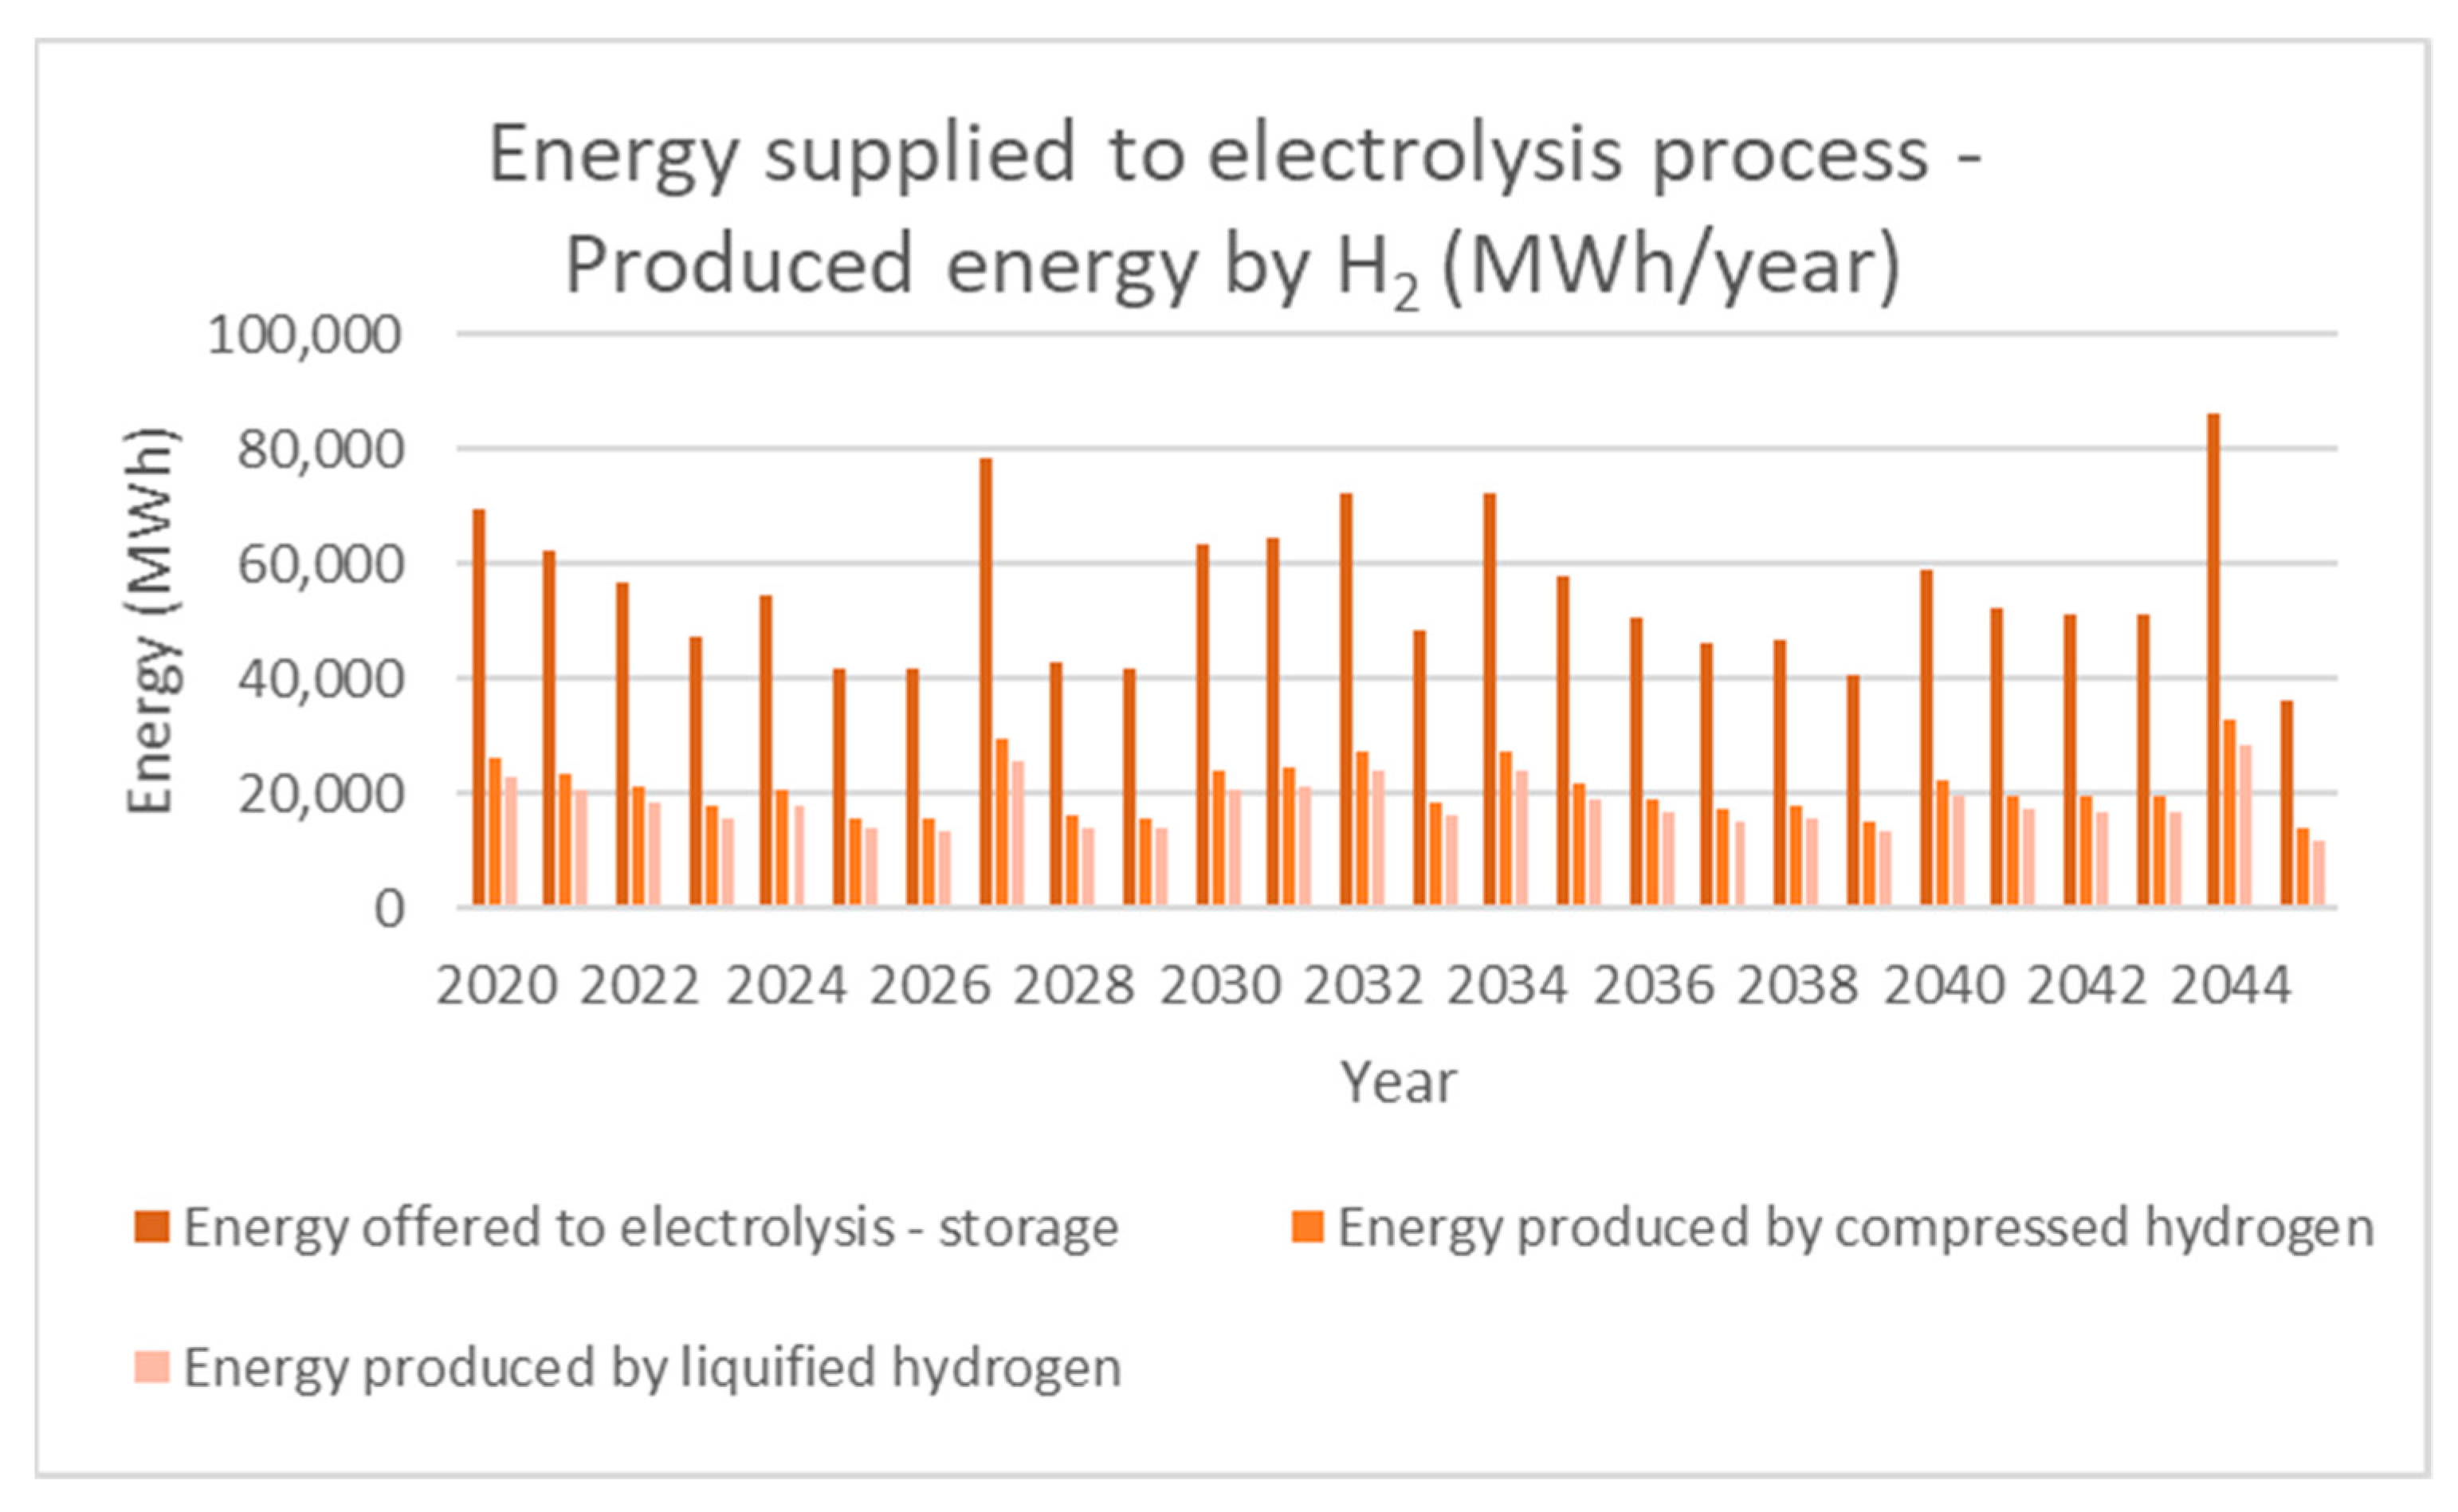
Figure 15 shows the energy offered in electrolysis and the subsequent storage of hydrogen, as well as the energy produced by each form of hydrogen. The difference observed in energy production between compressed and liquefied hydrogen, even though narrow, is attributed to the energy consumed for the transformation (liquification) of the latter.
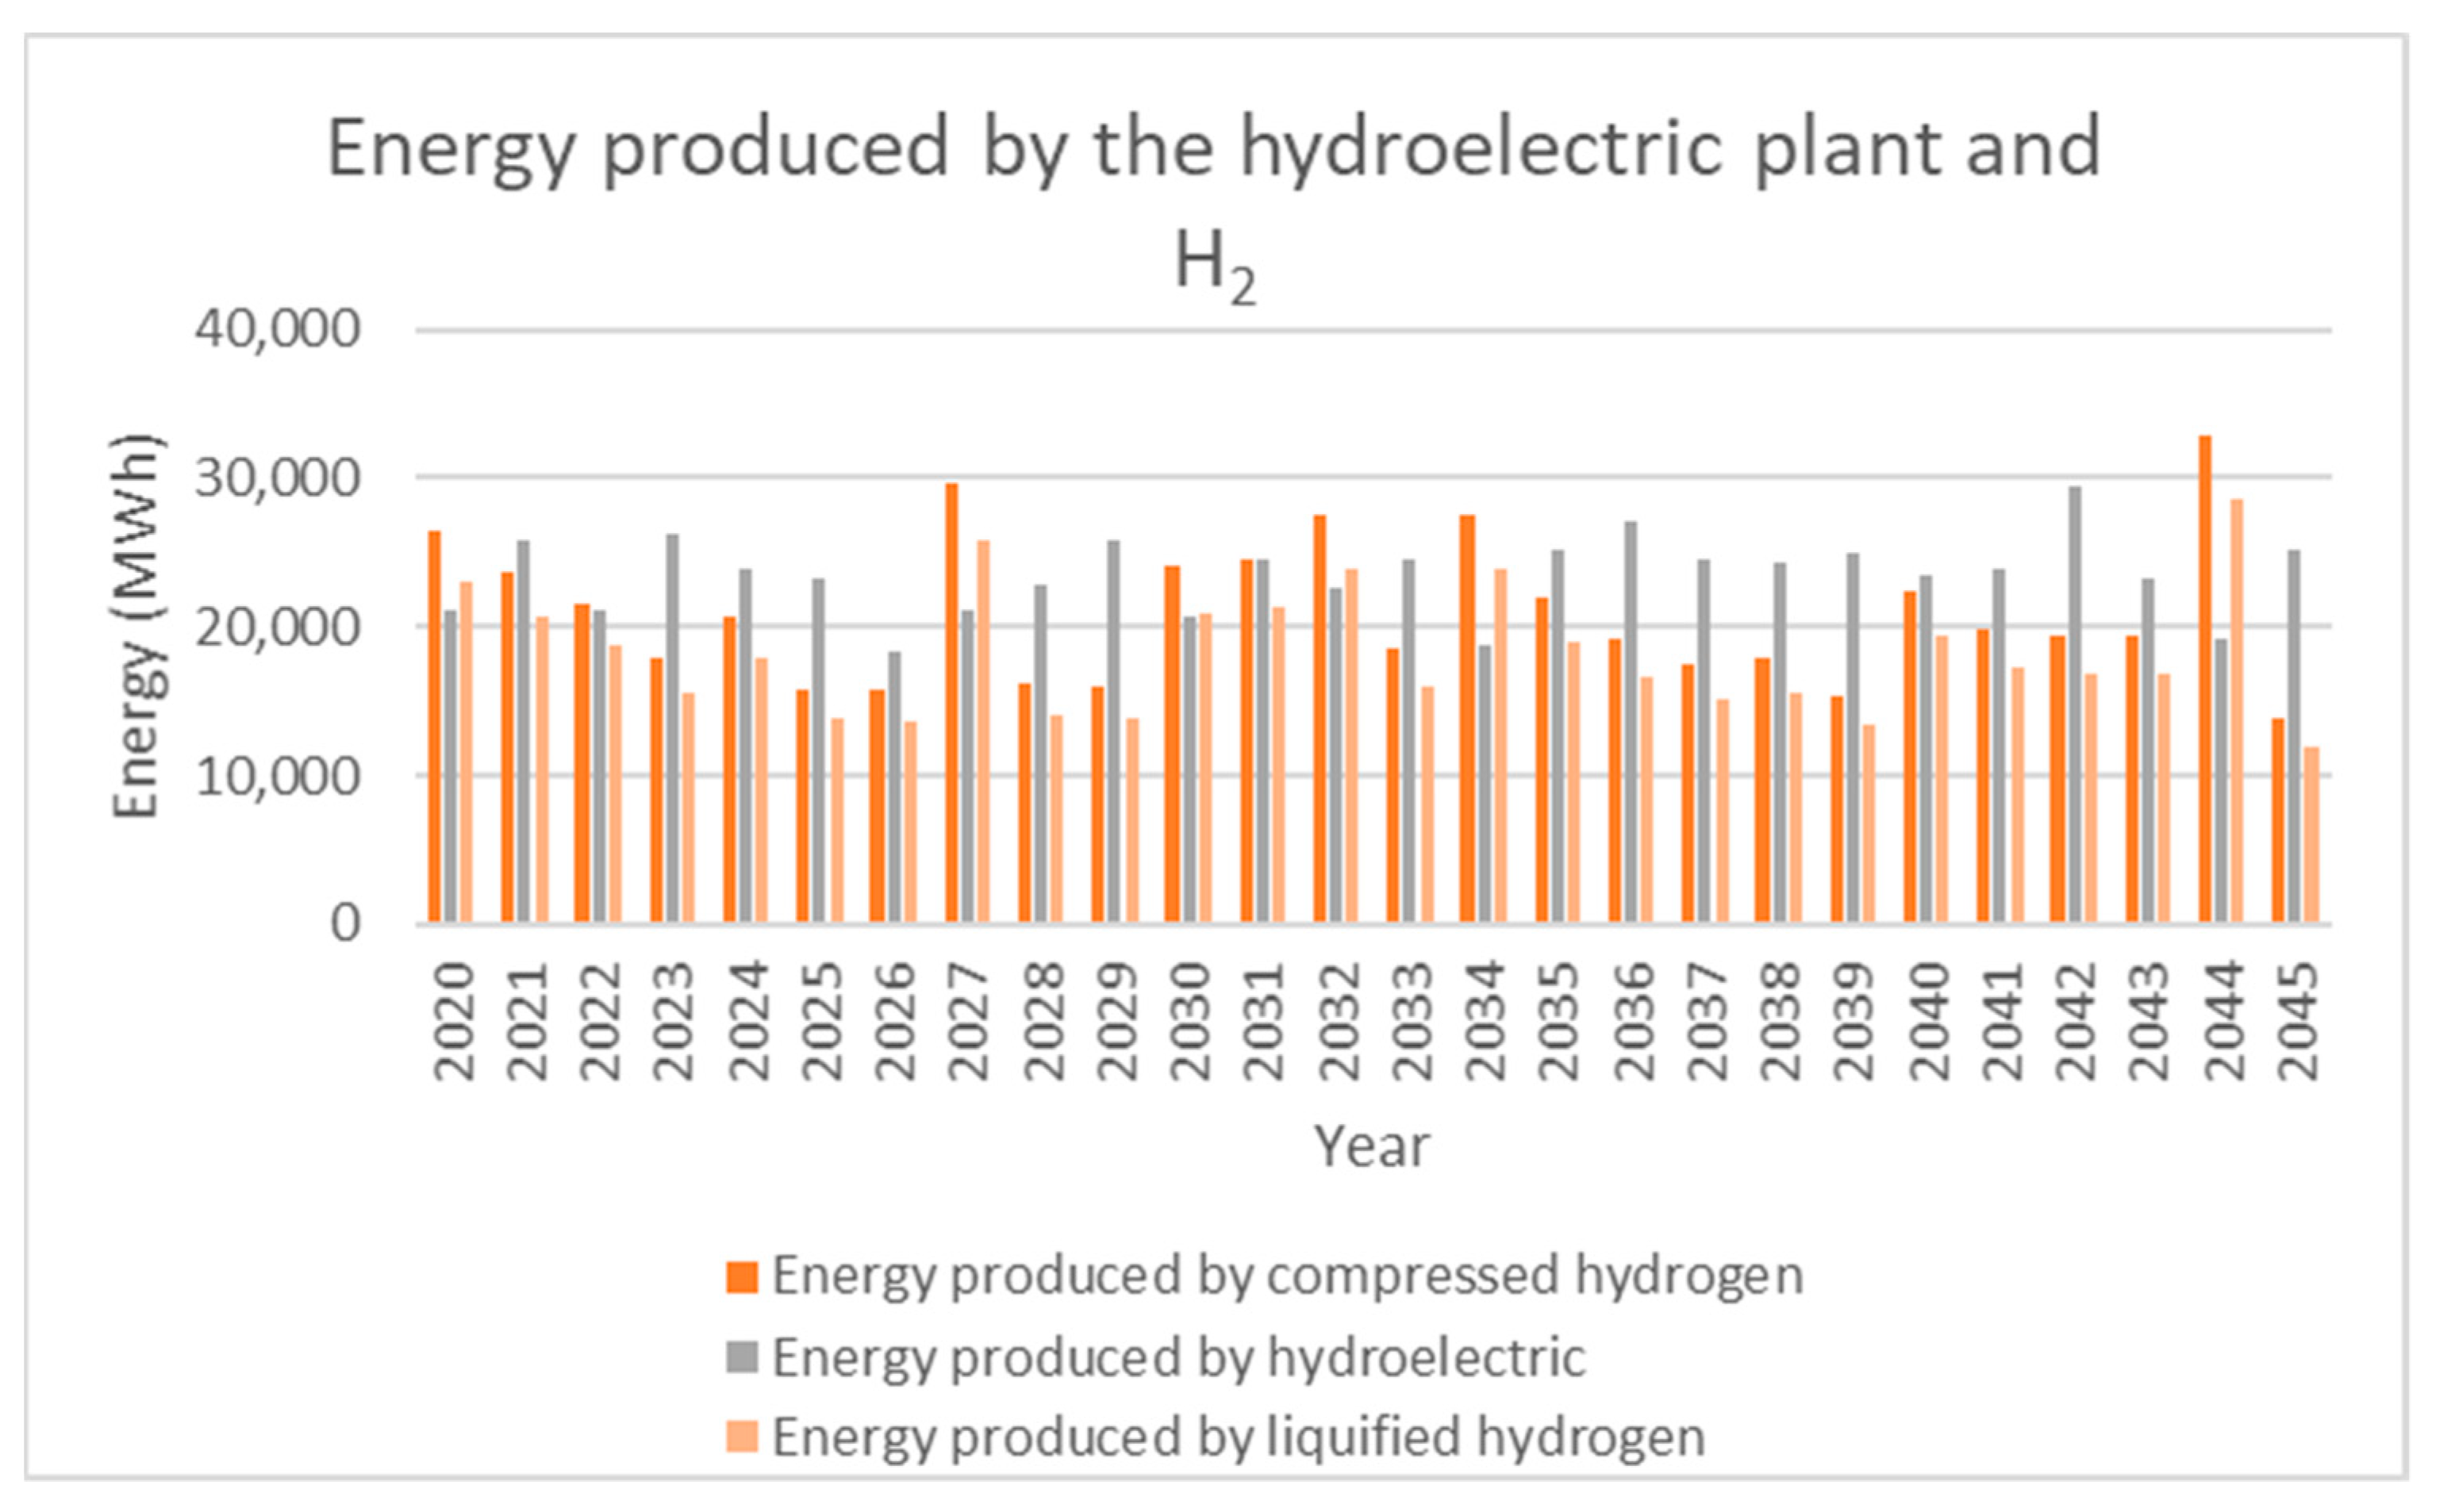
From a technical perspective, the choice of solution depends on the required energy to fulfill the energy and water supply needs. The energy offered in both cases of wind energy storage is the same. However, the two systems do not deliver the same energy. The hydroelectric plant has an efficiency of 80%, while with the use of a fuel cell, the efficiency is just 60%. Judging by
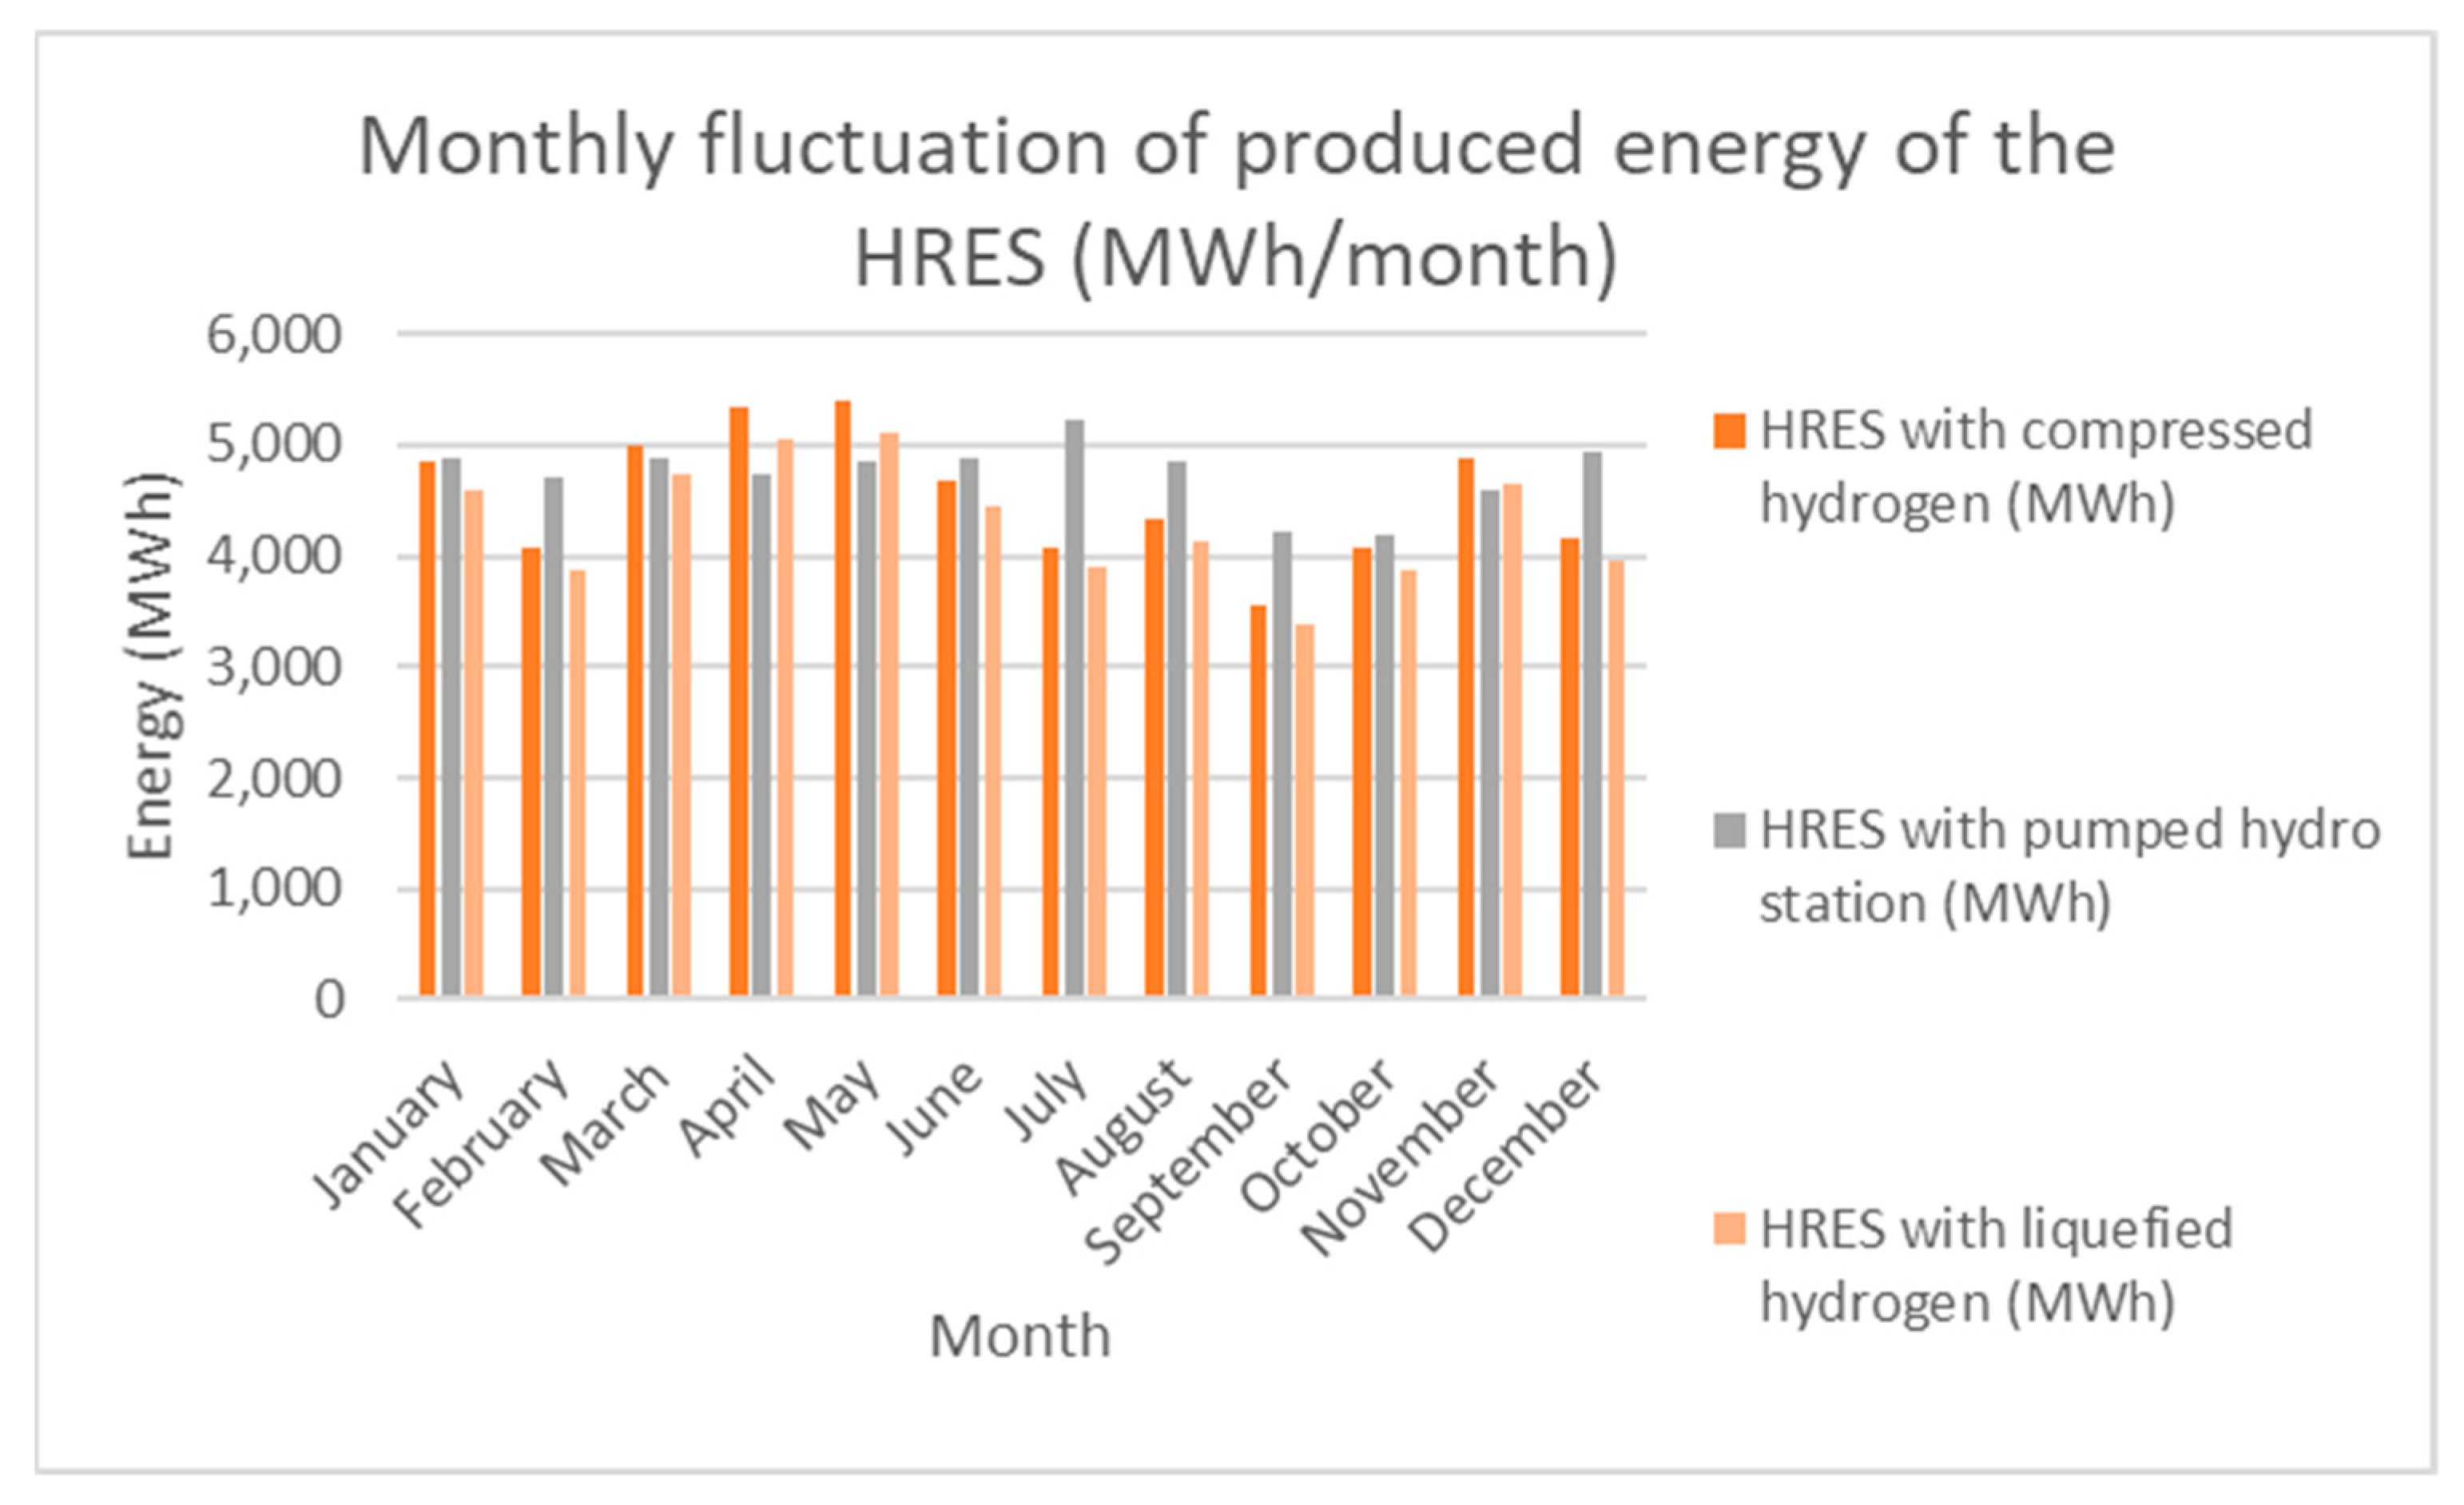
Figure 16, which presents the comparison of the produced energy, it can be seen that the hydroelectric plant does not always exceed the production of energy using hydrogen. In the years when there is a high amount of excess energy, i.e., 2027 and 2044, operating scenario 2 responds better than scenario 1, despite the form of hydrogen used. On the contrary, in cases of low energy surplus, such as years 2039 and 2045, the hydroelectric plant generates significantly more electricity than using hydrogen. The production of energy through the hydroelectric seems to be relatively stable, while through the fuel cells, more fluctuations are observed. The process of hydrogen production and its subsequent conversion requires a significant amount of electricity. When that amount exists and it is greater than 60,000 MWh, then there is a high generation of electricity due to the use of hydrogen. When the excess energy is approximately equal to 60,000 MWh, the differences in electricity production are small, while in cases where there is less than the aforementioned energy available, the electricity generation of the hydroelectric plant is higher. The monthly fluctuation of produced energy of the HRES is shown in
Figure 17.
It is additionally necessary to choose the form of hydrogen that will be used in the HRES of the operating scenario 2. In addition to comparing the power generations between the two options, other important factors include the safety of use and storage of each form of hydrogen. Since both forms of hydrogen pose significant risks, the number of tanks needed to store hydrogen must also be taken into account. Tanks that store liquefied hydrogen (LH
2) are significantly fewer than those that store compressed gaseous hydrogen (cGH
2). The former needs very low temperatures—cryogenic conditions to be stored, while the latter needs very high pressure. Thus, in terms of storage pressure, liquid hydrogen poses fewer potential hazards than compressed gas. Furthermore, liquefied hydrogen has a higher density than compressed hydrogen, i.e., it takes up less volume and, therefore, more hydrogen can be stored. The choice for the HRES of operation scenario 2, therefore, is proposed to be the liquefaction of the hydrogen gas produced by the electrolysis, in cryogenically compressed tanks, which use slightly higher pressures than the typical pressure conditions [
40,
41,
42,
43].
To recapitulate, the case described in this paper has some limitations. The primary goal of this paper is to optimize the cover of water and energy needs from a technical point of view; therefore, the two possible operating scenarios are compared only energy wise and not cost wise. Further, the irrigation needs depend on the crops and the livestock of the island. For the last 20 years, the number of livestock and the arable land are quite stable. Hence, it is not considered that, for the next 25 years there will be a significant increase. Taking into consideration all of the above, the irrigation needs vary, depending only on the evapotranspiration. Lastly, the reverse osmosis desalination method is chosen on the grounds that it is the most compatible with the wind turbines. Contrary to that, alternative desalination methods (namely thermal desalination) could be appropriate if solar panels are included in the HRES, due to the high solar radiation on the island.
4. Conclusions—Future Research
The use of RES is becoming more imperative, especially in Greece, which can benefit significantly from them [
44]. RES include wind, solar, geothermal energy, and more. Climate change, which is aggravated from the use of fossil fuels, highlights the need to produce energy from RES as much as possible and to eliminate greenhouse gas emissions. This need, in addition to other environmental and economic reasons, has led to the research and development of HRES that tap into the benefits of RES. The operation of HRES, with the comprehensive use of RES, especially in non-interconnected islands, is the way to achieve energy autonomy [
45,
46]. The study area is a non-interconnected island. However, beyond energy dependence on conventional power plants, the islands face significant problems with water scarcity due to limited water resources. Water shortages are common situations and problems are exacerbated during the summer, by a temporary surge in the population and irrigation needs [
47,
48].
The primary purpose of this HRES is the complete coverage of the water supply needs. This is achieved by installing a high efficiency desalination plant, designed with the most advanced methods of reverse osmosis and the use of a drinking water tank. Reverse osmosis is the most common desalination method, recommended for its low energy consumption, besides its ease of being associated with RES. Whichever operating scenario is chosen, the water supply needs throughout the lifecycle of the project can be met, taking into account the increasing needs due to the corresponding population raise.
Consequently, and from a technical perspective, the choice of solution depends on the required energy to fulfill the water supply needs, which is lowest for scenario 1, using the hydroelectric plant. It is a logical outcome since the operation of a hydroelectric project is fully developed technically. With the use of the first operating scenario, the ASP of Lemnos provides the minimum possible electricity, leading to significant energy independence. The coverage of energy needs are carried out primarily by wind energy, making good use of the high wind potential of the study area, and then follows the hydroelectric energy. Another factor that affects the production of hydrogen is the efficiency of the hydroelectric project in relation to the electrolysis units and the fuel cells. The hydroelectric has an efficiency of 80%, the electrolysis has an efficiency of 80%, while the efficiency of fuel cells is only 60%. Nevertheless, the comparison of the two scenarios shows that in cases where the wind energy surplus exceeds 60,000 MWh, then hydrogen produces significantly more energy than the hydroelectric plant. This is an important and encouraging result for the future, as it demonstrates the efficacy of hydrogen contributing in future HRES.
Further, the influence of the form of hydrogen that was used in the second operating scenario of the study is remarkable. Keeping in mind that the production of hydrogen is rendered only with the use of excess wind energy (“green hydrogen”) and not by conventional units. This energy is first channeled to the electrolysis unit to produce hydrogen gas. The liquefaction of hydrogen resulting from electrolysis and its storage in cryogenic conditions requires more energy than the compression of hydrogen gas. Of course, in the final energy production, i.e., after the hydrogen is funneled through the fuel cells, the difference between the two possible storage methods is not large. However, with the choice of LH2 (liquid H2), fewer storage tanks are needed, since in this form, hydrogen has a high energy density, so it occupies less volume. Thus, it is less likely to be exposed to hazardous sources either in the event of tank failure or to exogenous factors.
This paper presents results that can be further explored. The methodology analyzed can be applied to the Greek islands, which still depend on conventional power plants or the PPC network to meet their necessary needs.
Future research should focus on the development of hydrogen production and use. More specifically, the development of electrolysis units that purely use seawater to produce hydrogen gas, instead of using desalinated, if not drinking water, is recommended. Moreover, hydrogen requires significant amounts of energy for its production due to the energy needed for electrolysis, which, for the production of 1 kg H2, needs 49 kWh. Therefore, it is necessary to optimize the energy need of electrolysis, but also the high energy demand for the conversion of hydrogen gas into liquid.
Finally, the possibility of combining additional RES in this HRES, such as solar, seems to be promising for further research, even making the energy autonomy of the island possible. In addition, the sale of this energy to neighboring islands, or even to the PPC network, is a remarkable alternative that should be explored. The production and sale of hydrogen is an innovative process, from which the municipality of Lemnos can benefit significantly. Thus, it is necessary to conduct a cost–benefit analysis of the HRES for the two possible operating scenarios in order to optimize the system from a financial perspective. Other economic and technical issues that are useful to explore involve the connection between Lemnos and the interconnected electricity system, as opposed to full energy autonomy. An additional issue to be considered is the case of complete elimination of drilling to cover water supply and irrigation, with the construction of a water transmission network.


