Minimum Entropy Generation Rate and Maximum Yield Optimization of Sulfuric Acid Decomposition Process Using NSGA-II


1
College of Power Engineering, Naval University of Engineering, Wuhan 430033, China
2
Institute of Thermal Science and Power Engineering, Wuhan Institute of Technology, Wuhan 430205, China
3
School of Mechanical & Electrical Engineering, Wuhan Institute of Technology, Wuhan 430205, China
*
Author to whom correspondence should be addressed.
Entropy 2020, 22(10), 1065; https://doi.org/10.3390/e22101065
Submission received: 24 July 2020
/
Revised: 19 September 2020
/
Accepted: 19 September 2020
/
Published: 23 September 2020
(This article belongs to the Special Issue Finite-Time Thermodynamics)
Abstract
:Based on the theory of finite-time thermodynamics (FTT), the effects of three design parameters, that is, inlet temperature, inlet pressure, and inlet total mole flow rate, of a tubular plug-flow sulfuric acid decomposition reactor on the total entropy generation rate (EGR) and SO2 yield are analyzed firstly. One can find that when the three design parameters are taken as optimization variables, the minimum total EGR and the maximum SO2 yield of the reference reactor restrict each other, i.e., the two different performance objectives cannot achieve the corresponding extremum values at the same time. Then, the second-generation non-dominated solution sequencing genetic algorithm (NSGA-II) is further used to pursue the minimum total EGR and the maximum SO2 yield of the reference reactor by taking the three parameters as optimization design variables. After the multi-objective optimization, the reference reactor can be Pareto improved, and the total EGR can be reduced by 9% and the SO2 yield can be increased by 14% compared to those of the reference reactor. The obtained results could provide certain theoretical guidance for the optimal design of actual sulfuric acid decomposition reactors.
1. Introduction
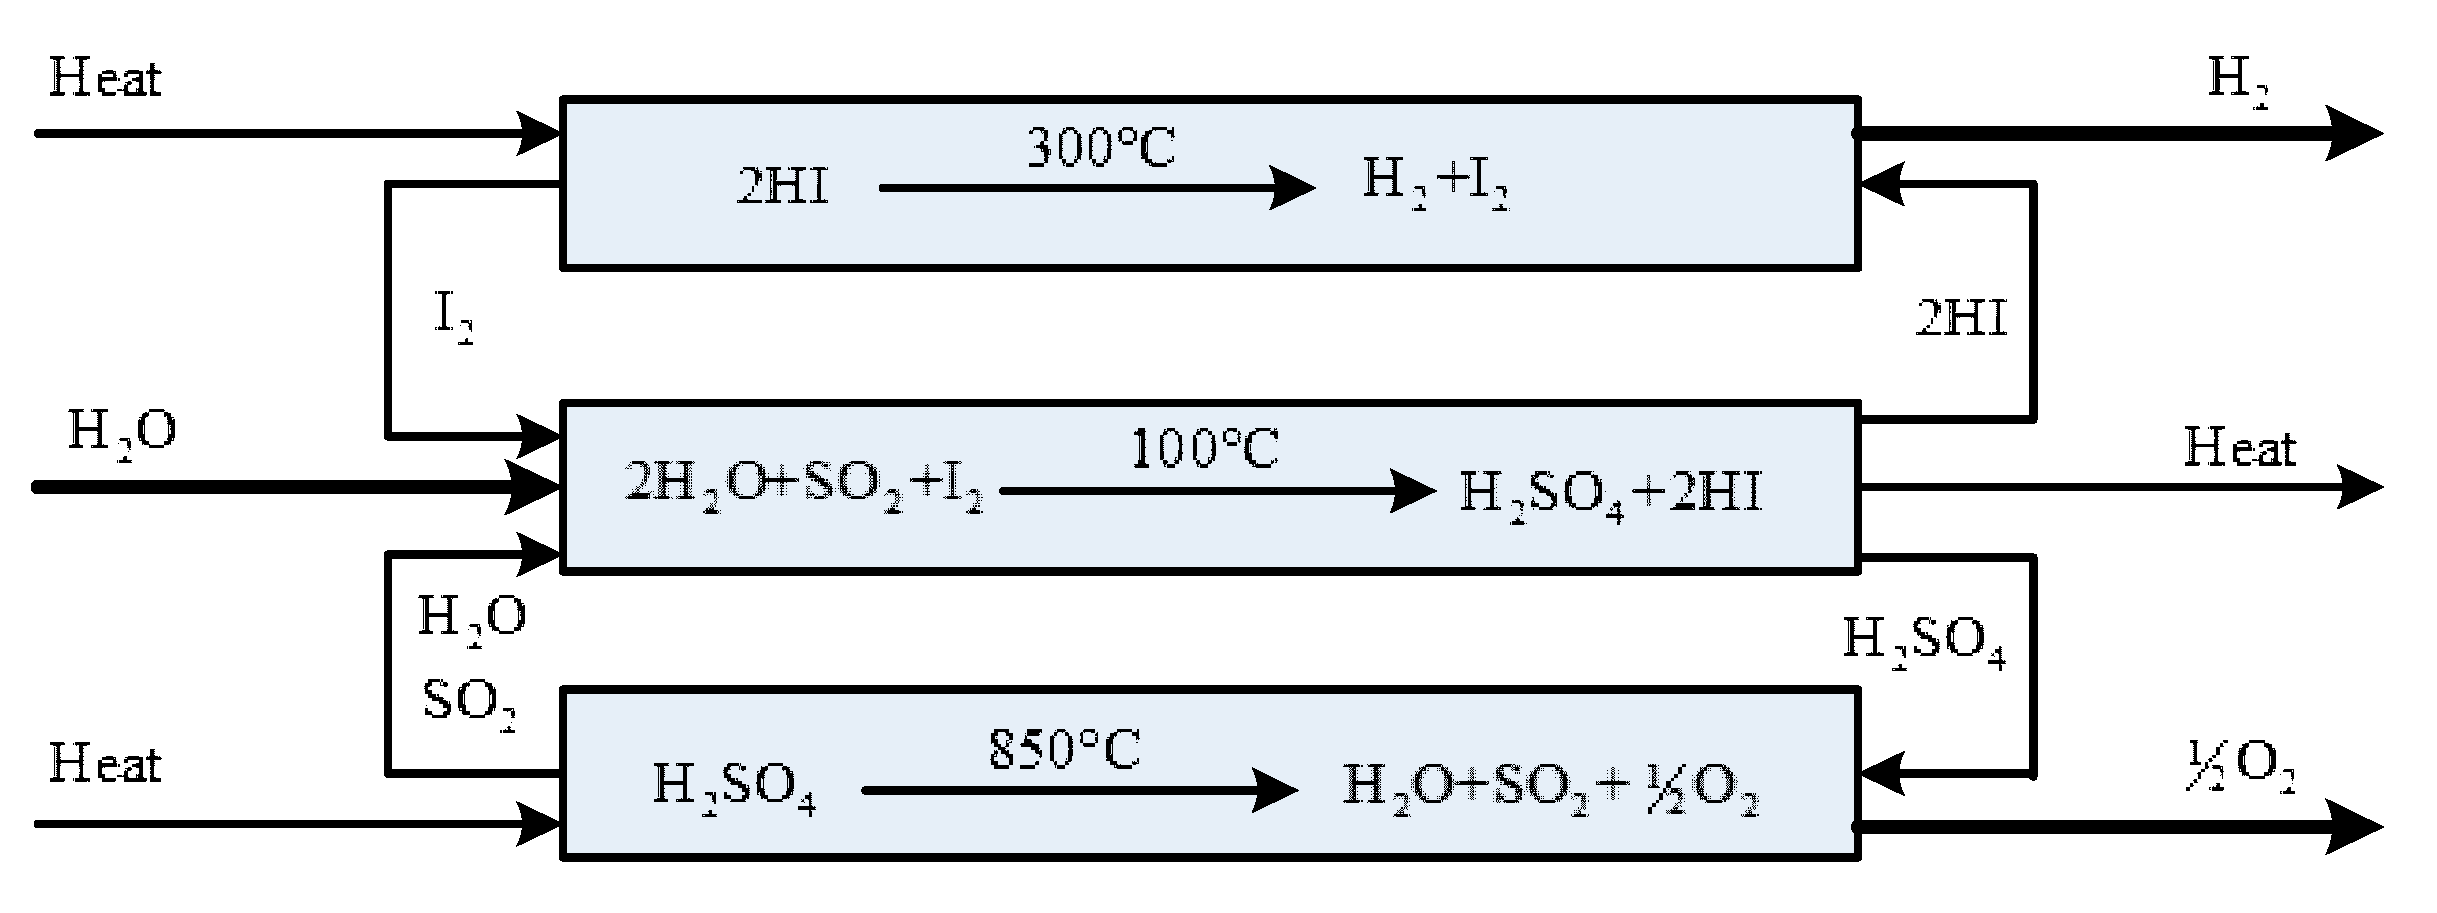
At present, the Hybrid-Sulphur (H-S) thermochemical cycle and the Sulphur-Iodine (S-I) thermochemical cycle are considered to be the two most promising recycling methods in the preparation of hydrogen from water by thermochemical cycles [1], and the schematic diagram of S-I thermochemical cycle is shown in Figure 1. Both the H-S and the S-I cycles contain the sulfuric acid decomposition process. Therefore, it is important and necessary to improve the performance of the sulfuric acid decomposition process.
The S-I thermochemical cycle consists of three main chemical reactions: (1) the endothermic decomposition of hydrogen iodide in gas phase; (2) the spontaneous absorption of sulfur dioxide in liquid phase; (3) the sulfuric acid decomposition reaction. The corresponding reaction equations are given as follows:
Reaction type (I) is the spontaneous decomposition of H2SO4 into SO3 and H2O at 400–500 °C. Reaction type (II) is the reaction of SO3 over 750 °C to produce SO2 and O2 under the action of a catalyst. In this process, a great deal of heat is consumed, which is also the main energy consumption process in the S-I and H-S thermochemical cycles.
In the aspect of thermodynamic analysis and optimization of sulfuric acid decomposition, Van der ham et al. [1] assumed that the reaction mixture satisfies the ideal gas equation of state, established the physical model of sulfuric acid decomposition reaction, and analyzed the minimization of entropy generation rate (EGR) of a sulfuric acid decomposition reactor by using the optimal control theory. Kuchi et al. [2] carried out a numerical simulation of a high-temperature shell and tube heat exchanger and decomposer, investigated the fluid flow, heat transfer, and chemical reaction processes in the decomposer by using the porous media method, and established a two-dimensional axisymmetric tubular plug-flow reactor model. Ponyavin et al. [3] studied the sulfuric acid decomposer process in a high-temperature ceramic heat exchanger and established a three-dimensional calculation model of the reactor. Van der ham et al. [4] further compared two methods to improve the efficiency of sulfuric acid decomposition reactor and proposed two design schemes to improve the efficiency of the reactor. On the basis of Ref. [1], Wang et al. [5,6] optimized the decomposition of sulfuric acid in the tubular plug-flow reactor with the goal of maximum yield [5], further analyzed the influences of the design parameters of the reactor on the SO2 yield and specific EGRs [6], and obtained the optimal parameters corresponding to the minimum specific EGRs.
Many scholars have optimized other types of thermochemical reaction processes by using the theory and method of finite-time thermodynamics (FTT) [7,8,9,10,11,12,13,14,15,16,17,18,19,20,21,22]. For example, Wang et al. [23] investigated the isotherm chemical reaction A⇔B⇔C and obtained the best concentration configuration of the reaction. Johannessen and Kjelstrup [24] studied the EGR minimization of sulfur dioxide oxidation process. The second-generation non-dominated solution sequencing genetic algorithm (NSGA-II) has been widely used in multi-objective optimization of various engineering problems [25,26,27,28,29,30].
2. Modeling of the Sulfuric Acid Decomposition Process
A reference reactor used in the performance analysis and optimization as well as the kinetics and thermodynamics models will be introduced in this section.
2.1. Reference Reactor
The model of a tubular plug-flow reactor for sulfuric acid decomposition is shown in Figure 2. It is assumed that the temperature (Tw) of the outer wall of tubular plug-flow reactor does not change with time and its distribution is linear along the axial direction of the reactor. The distribution follows (K). The reaction mixture in the reactor is regarded as an ideal gas and only flows along the axial direction of the reactor. The radial concentration gradient and temperature gradient of the reaction mixture in the reactor are ignored without both radial diffusion and back-mixing. The total molar flow rate and velocity of the reaction mixture at the cross-section of the reactor are as follows:
where is the molar flow rate of reaction component , i.e., H2SO4, SO3, H2O, SO2 and O2; is the radial cross section area of the reactor, and is the universal gas constant.
2.2. Models of Kinetics and Thermodynamics
The fluid flow, heat transfer, and chemical reaction of the reaction mixture in a tubular plug-flow reactor follow momentum, energy, and mass conservation equations, respectively, which are given by:
where and are the density and flow velocity of the reaction mixture on the entrance section, respectively; subscript = 1, 2 represents the reaction types (I) and (II); is the reaction rate of mass per unit catalyst, and they are and ; and are the component molar constant-pressure heat capacity and the reaction enthalpy of the reaction type , and their expressions are given in the Appendix A.
The heat transfer from the heat source outside the tube to the reaction mixture inside the tube follows Newtonian heat transfer law:
For different reaction conditions and mechanisms, the driving force in the kinetic equation could be written as different mathematical forms, and the corresponding coefficients in the kinetic equation should be determined by experiments and also be different for different choices of the driving force. According to Ref. [1], the condition that the chemical reaction occurred at the vicinity of the equilibrium is assumed to be satisfied, and all components are assumed to have stoichiometric reaction order, so the chemical reaction rates of reaction types (I) and (II) are as follows:
where and are the reaction rate constants of reaction types (I) and (II), according to Ref. [1], , ; P represents the partial pressure of the corresponding component; is the equilibrium constant of the chemical reaction type ; is the standard Gibbs free enthalpy of the reaction type , and the expression is given in the Appendix A. The driving force in the kinetic Equation (12) is written as , and effects of the different forms of the driving force on the optimization results will be considered in another paper in the future.
The SO2 yield of the tubular plug-flow reactor is as follows:
The local EGR of the tubular plug-flow reactor is as follows:
where subscripts ht, f, and cr represent the local EGRs of heat transfer, fluid flow, and chemical reaction, respectively.
The total EGR is obtained by integrating the local EGR, i.e.,
3. Parameter Analyses of Sulfuric Acid Decomposition Reactor
By changing the inlet parameters of the reference reactor, including the inlet temperature Tin, pressure Pin and the total molar flow rate Ftot,in, the total EGR and the SO2 yield of the reference reactor are analyzed, and the influences of the initial inlet conditions on the two performance objectives can be obtained. The variation ranges of the initial inlet parameters are: 750 K ≤ Tin ≤ 900 K, 4 MPa ≤ Pin ≤ 9.5 MPa, and 0.0027 mol/s ≤ Ftot,in ≤ 0.1 mol/s.
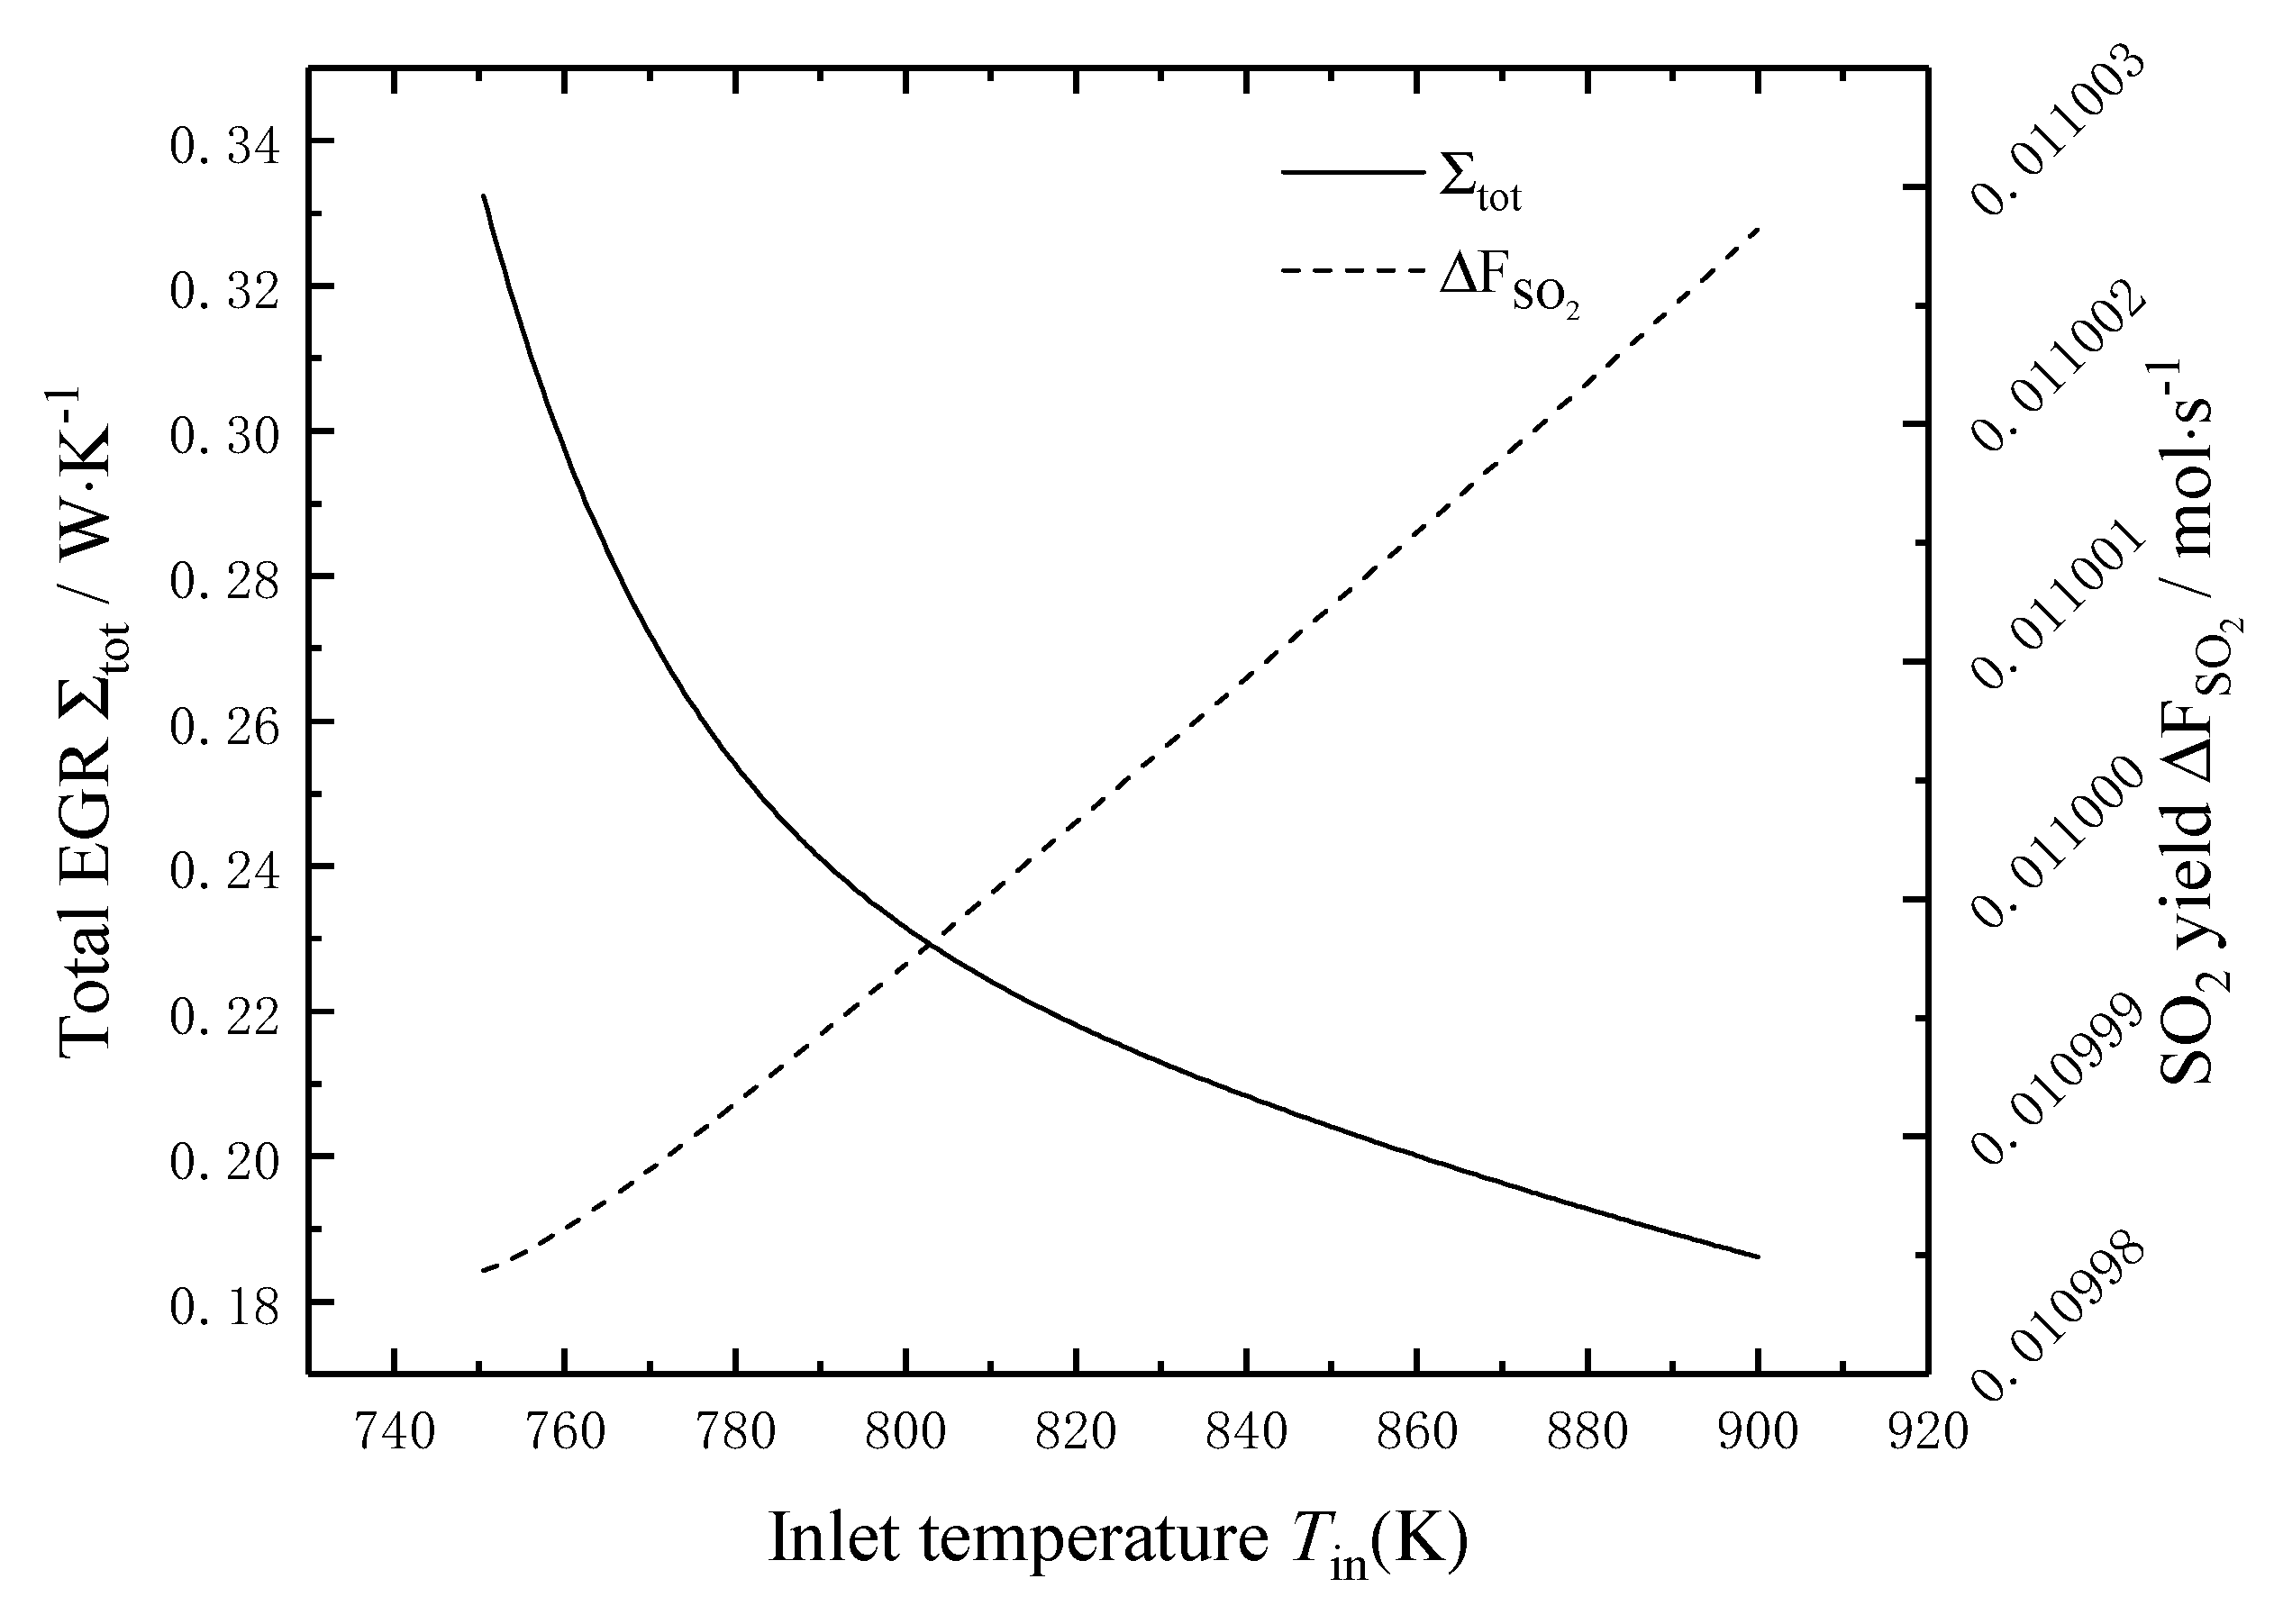
Figure 3 shows the effects of the temperature Tin of the reaction mixture on the total EGR and the SO2 yield. It can be seen that the total EGR decreases nonlinearly with the increase of the temperature Tin, and the decreasing trend is fast firstly and then slow; when the temperature Tin increases from 750 °C to 900 °C, the total EGR decreases from 0.331 W/K to 0.189 W/K, i.e., decreases by 43%. The main reason is that with the temperature Tin of the reaction mixture increases, the heat transfer temperature difference between the reaction mixture and the external heat source decreases, which reduces the local EGR of heat transfer and the total EGR. The SO2 yield increases very slowly with the increase of the temperature Tin, and when the temperature Tin increases from 750 °C to 900 °C, the SO2 yield increases by only 0.4%. It can be seen that the total EGR can be reduced by increasing the temperature Tin of the reaction mixture, i.e., the irreversibility of the sulfuric acid decomposition process could be reduced by increasing the Tin of the reaction mixture. However, it is not significant to increase the SO2 yield by increasing the temperature Tin of the reaction mixture.
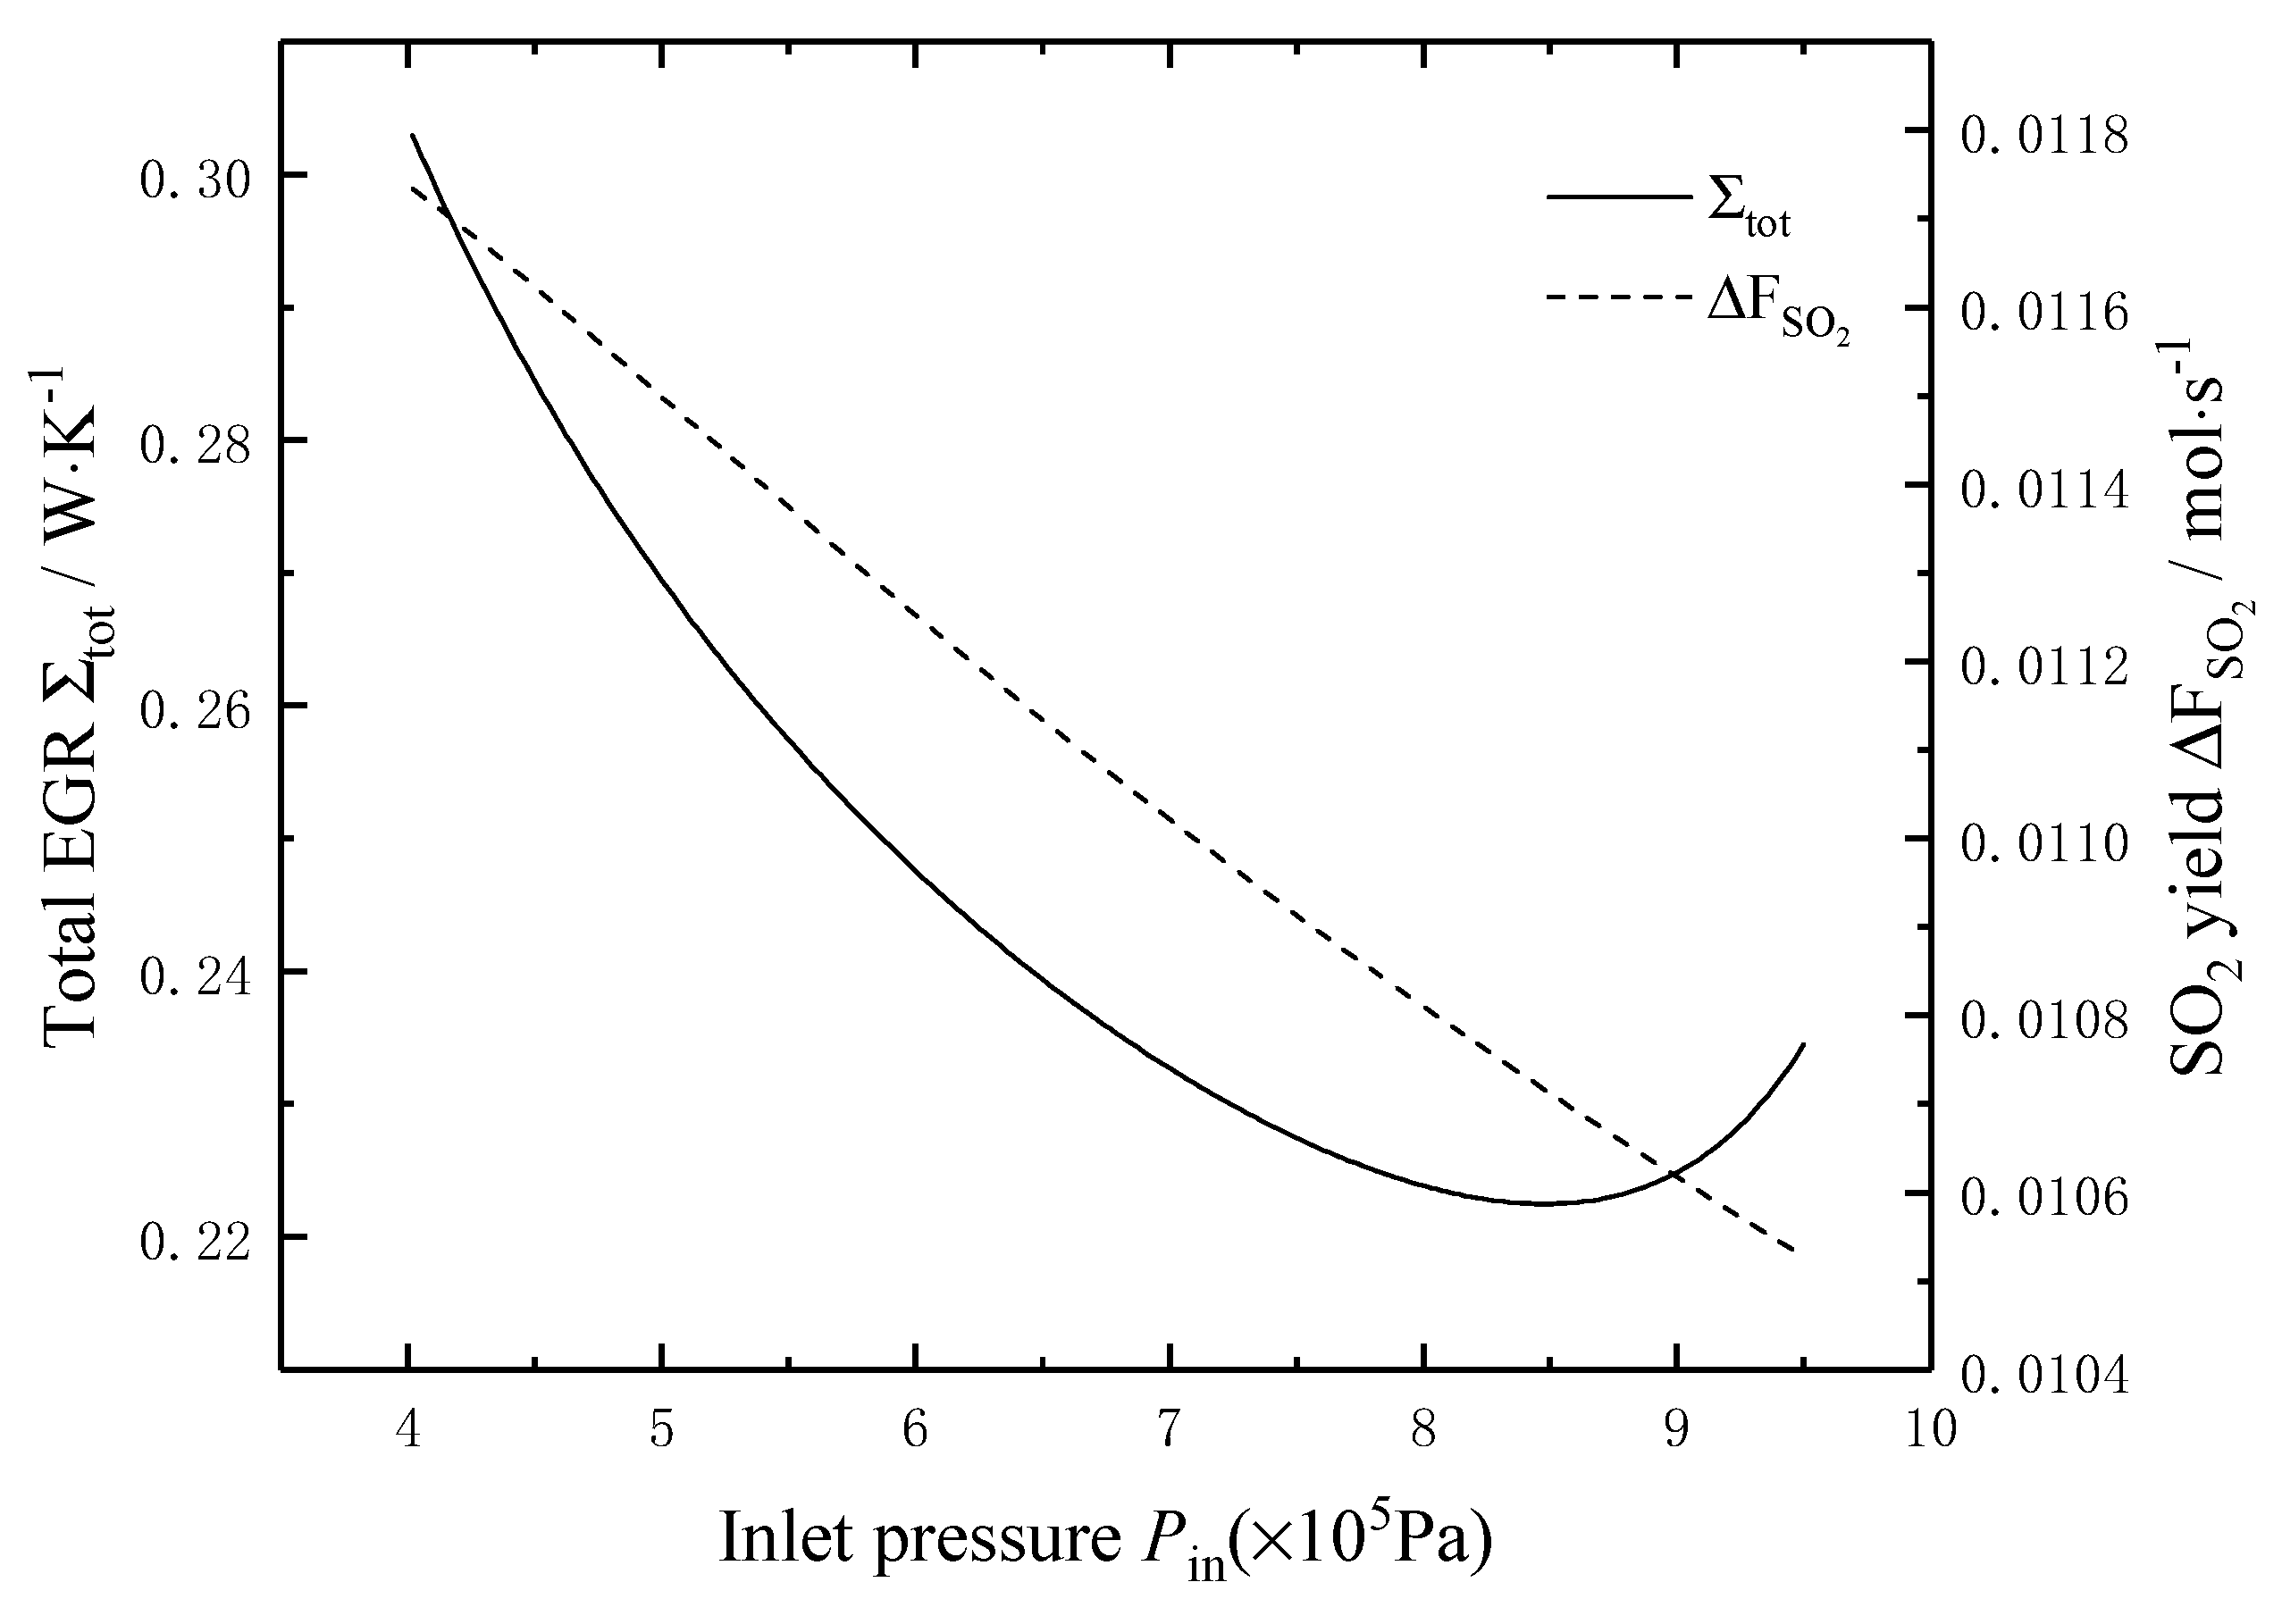
Figure 4 shows the effects of the pressure Pin of the reaction mixture on the total EGR and the SO2 yield. It can be seen that the curve of the total EGR is concave and parabolic-like with the increase of the pressure Pin, and the minimum value is 0.224 W/K when the pressure Pin is about 0.85 MPa. The SO2 yield decreases linearly with the increase of the pressure Pin. When the pressure Pin increases from 0.4 MPa to 1 MPa, the SO2 yield decreases from 0.0118 mol/s to 0.0105 mol/s, i.e., decreases by 11.02%.
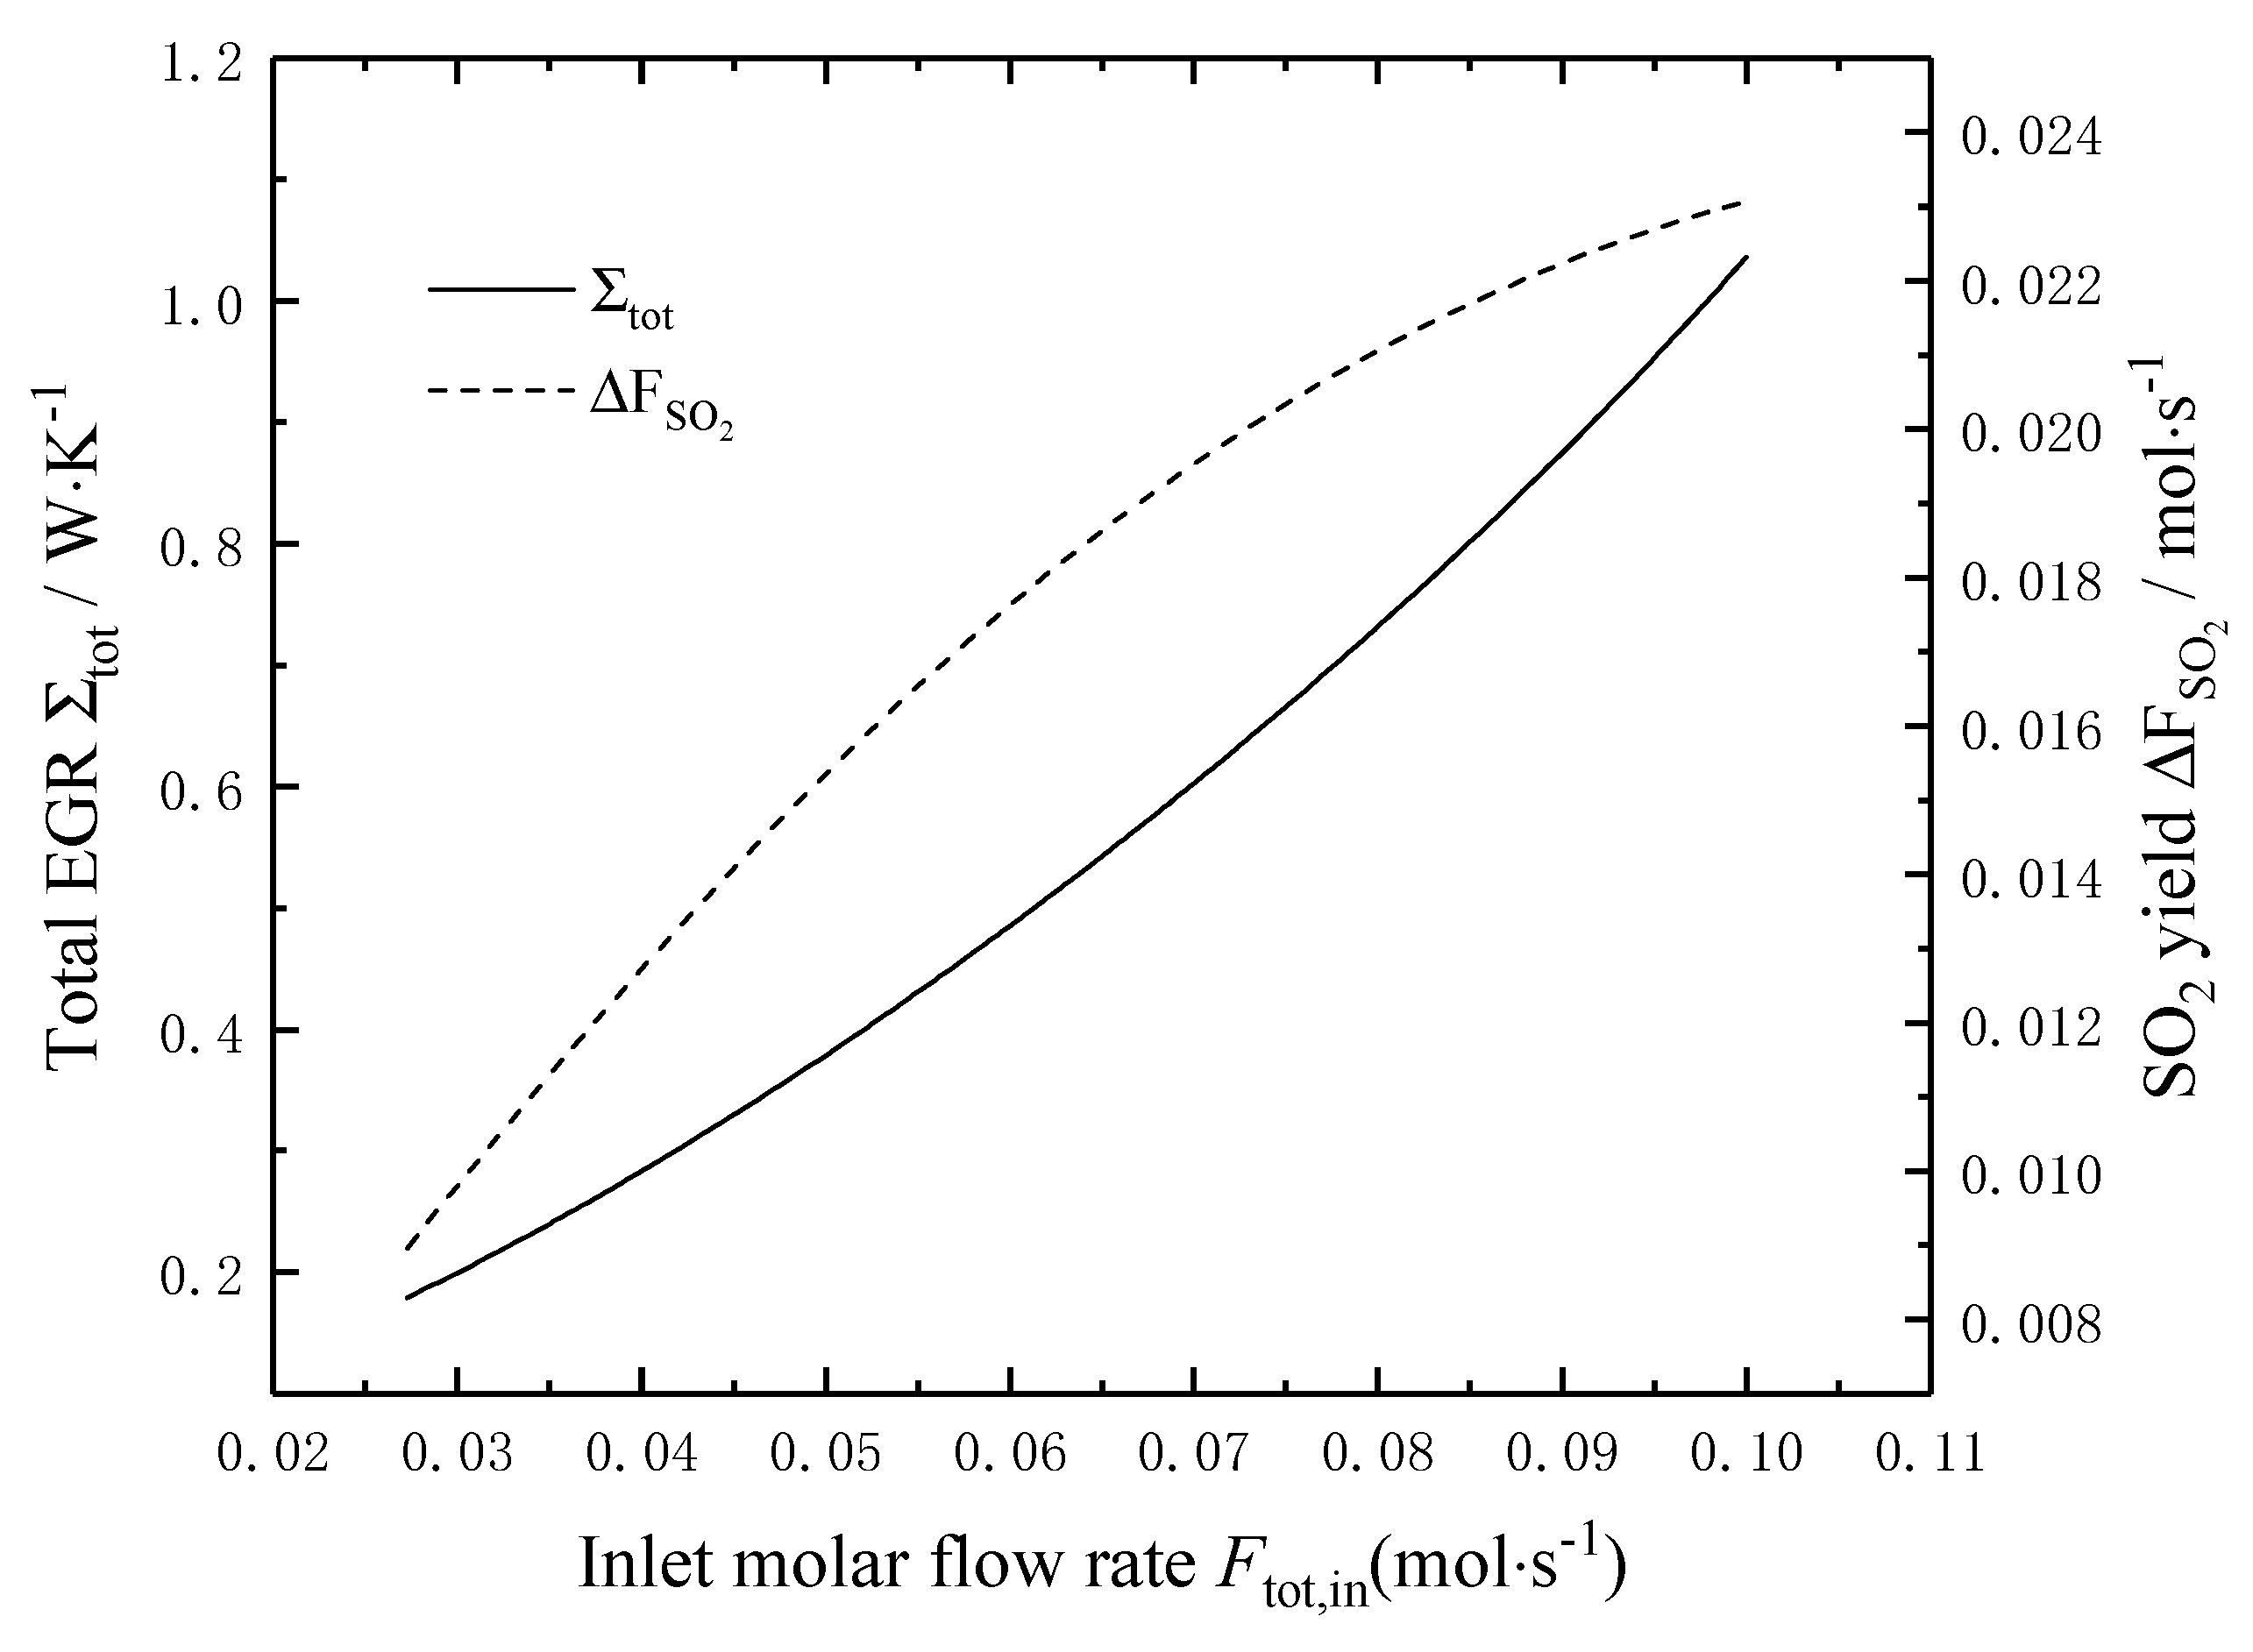
Figure 5 shows the effects of the molar flow rate Ftot,in of the reaction mixture on the total EGR and the SO2 yield. It can be seen that the total EGR and the SO2 yield increase with the increase of the molar flow rate Ftot,in, and the minimum total EGR and the maximum SO2 yield are mutually restricted. When the molar flow rate Ftot,in increases from 0.027 mol/s to 0.10 mol/s, the total EGR and the SO2 yield increases by 4.8 times and 1.8 times, respectively.
4. Multi-Objective Optimization and Result Analyses
From the analyses in Section 3, when the three inlet parameters are chosen as optimization variables, and the minimum total EGR and the maximum SO2 yield are taken as optimization objectives, respectively, there is no optimal solution to achieve the extremum values of the total EGR and SO2 yield at the same time. Therefore, how to select the appropriate initial inlet conditions to achieve the relative optimal total EGR and SO2 yield is very important. The NSGA-II algorithm is one of the excellent algorithms to solve multi-objective optimization problems, and can give a series of non-inferior solutions (solutions that cannot be optimized for arbitrary objectives without making other objectives worse) of multi-objective problems. The corresponding improvement process is called Pareto improvement, the corresponding set of non-inferior solutions is called the Pareto-optimal solution set, and the corresponding objective function solution is called the Pareto-optimal front.
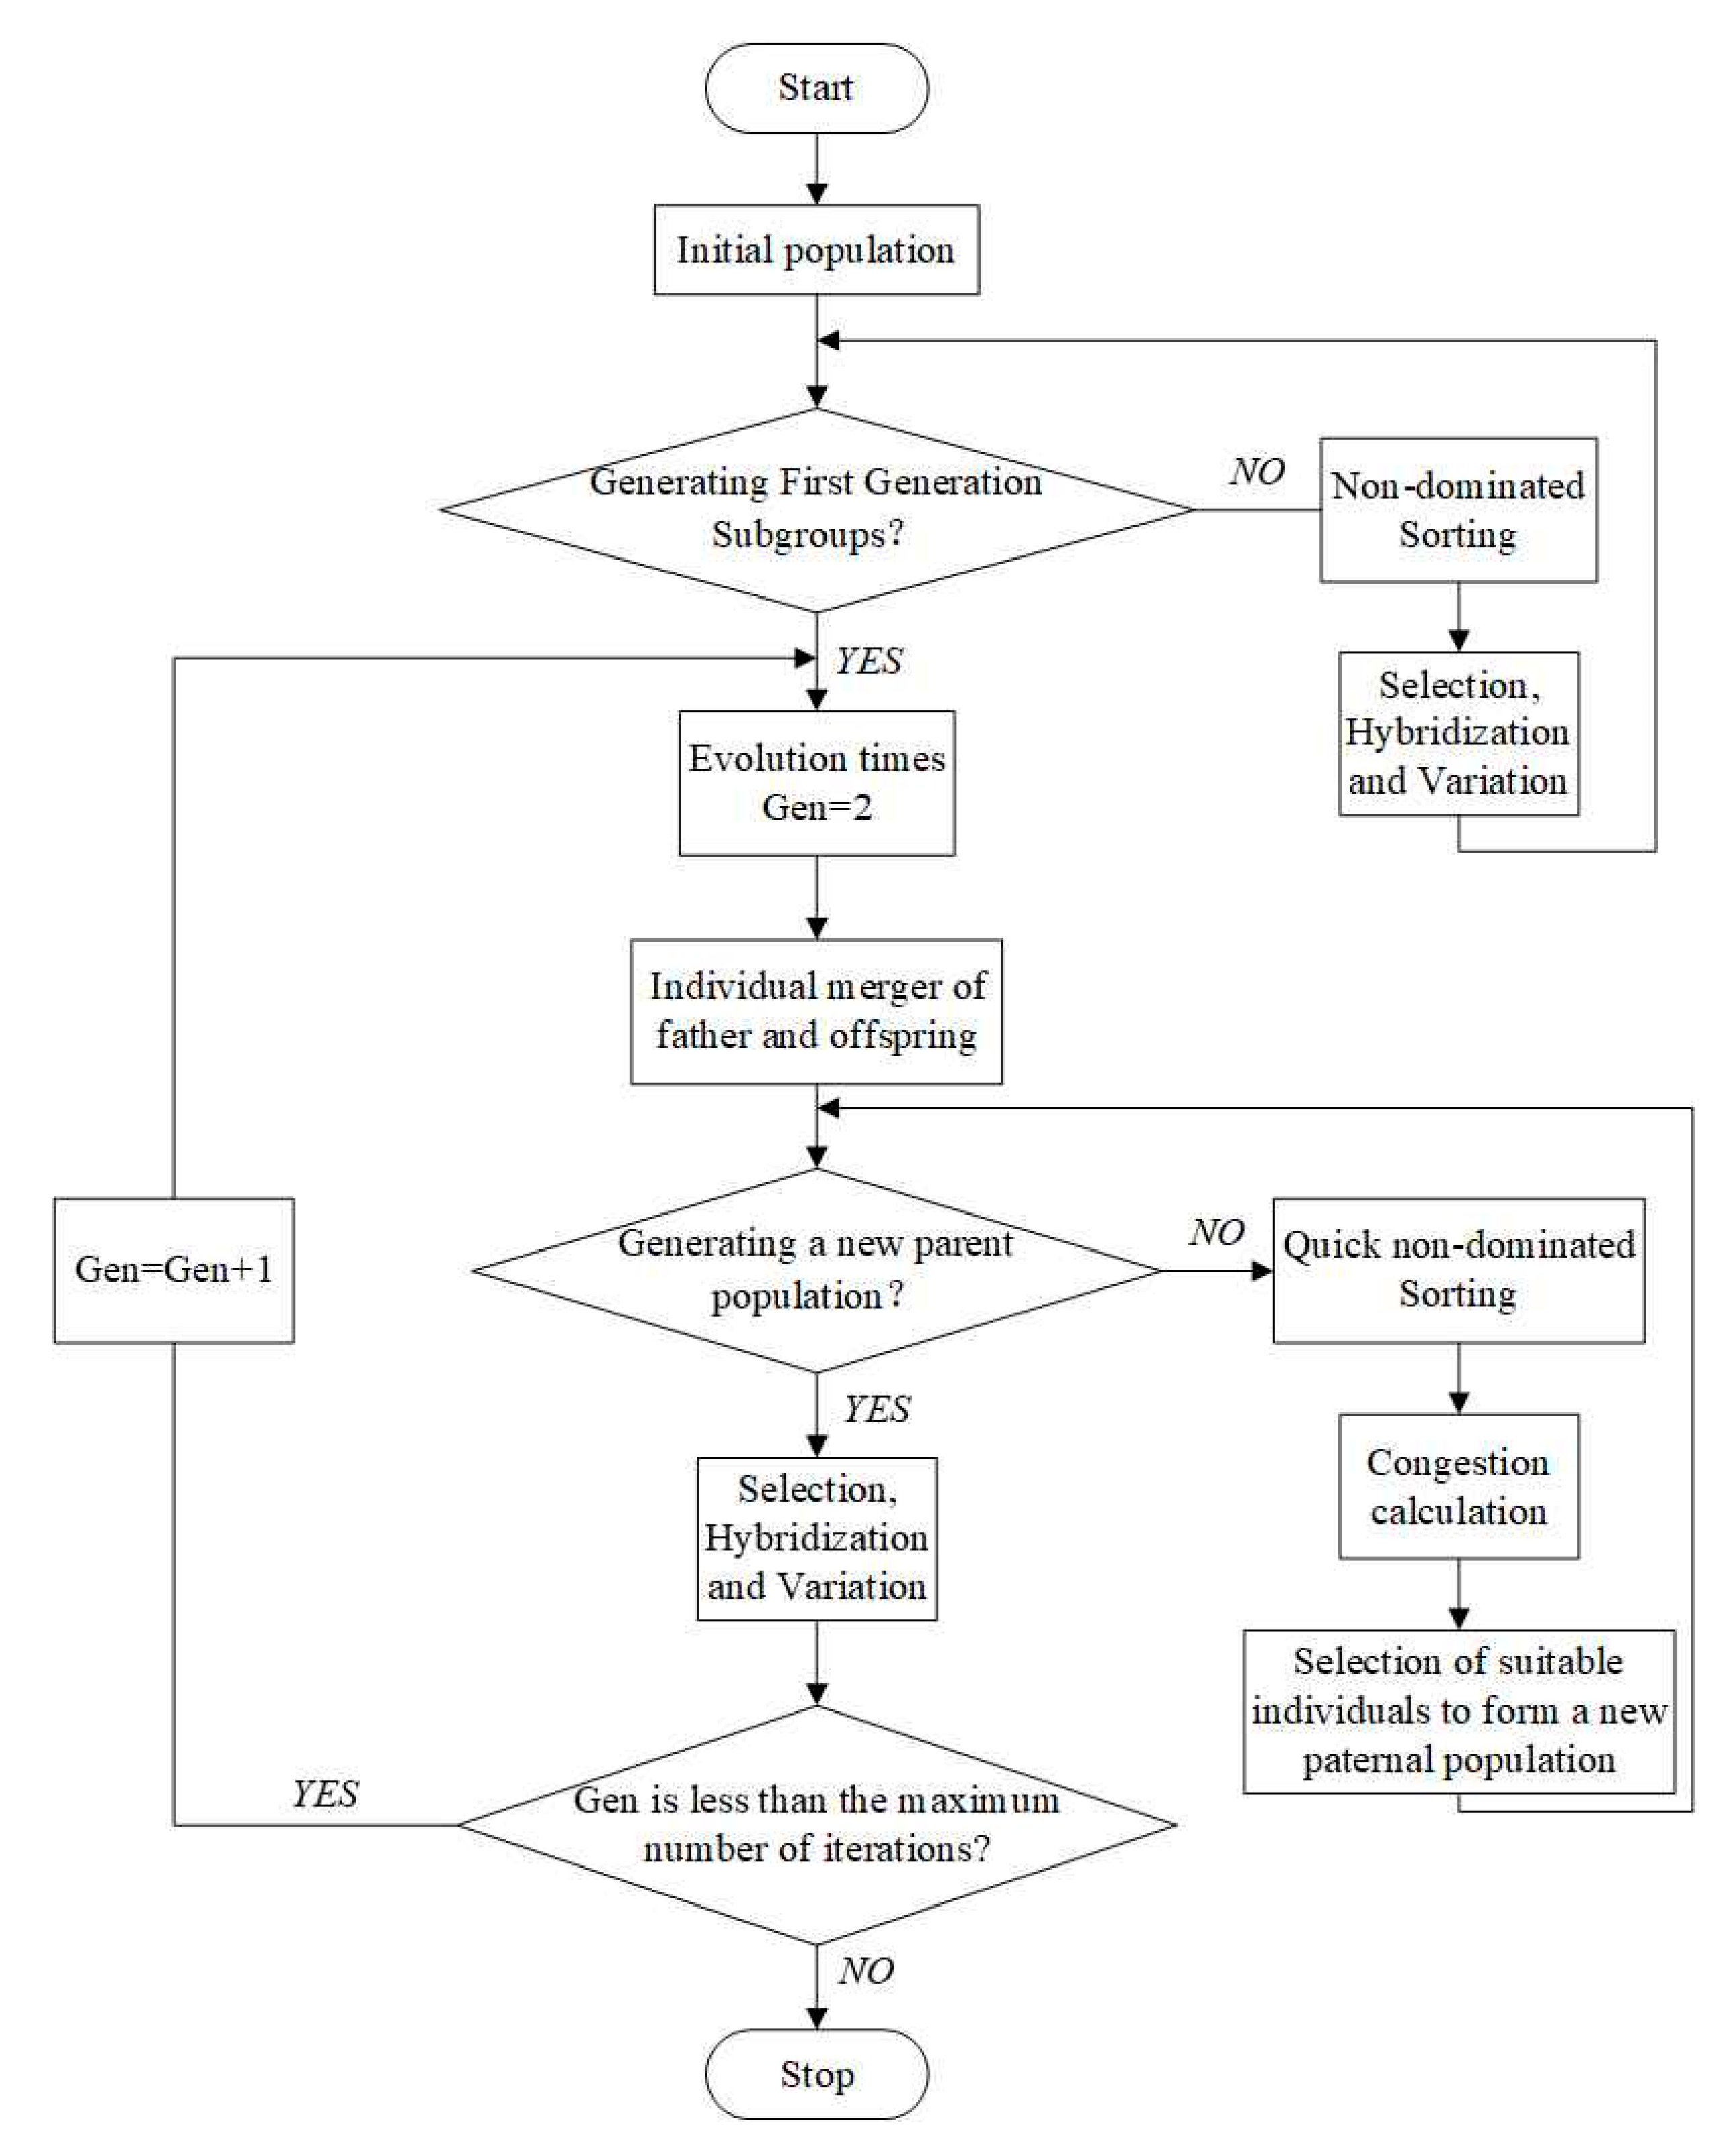
Figure 6 shows the flow chart of the NSGA-II algorithm. In this section, all of the Tin, Pin and Ftot,in are taken as the optimization variables to minimize the total EGR and maximize the SO2 yield. The optimization intervals of the variables are consistent with the previous single-variable analysis.
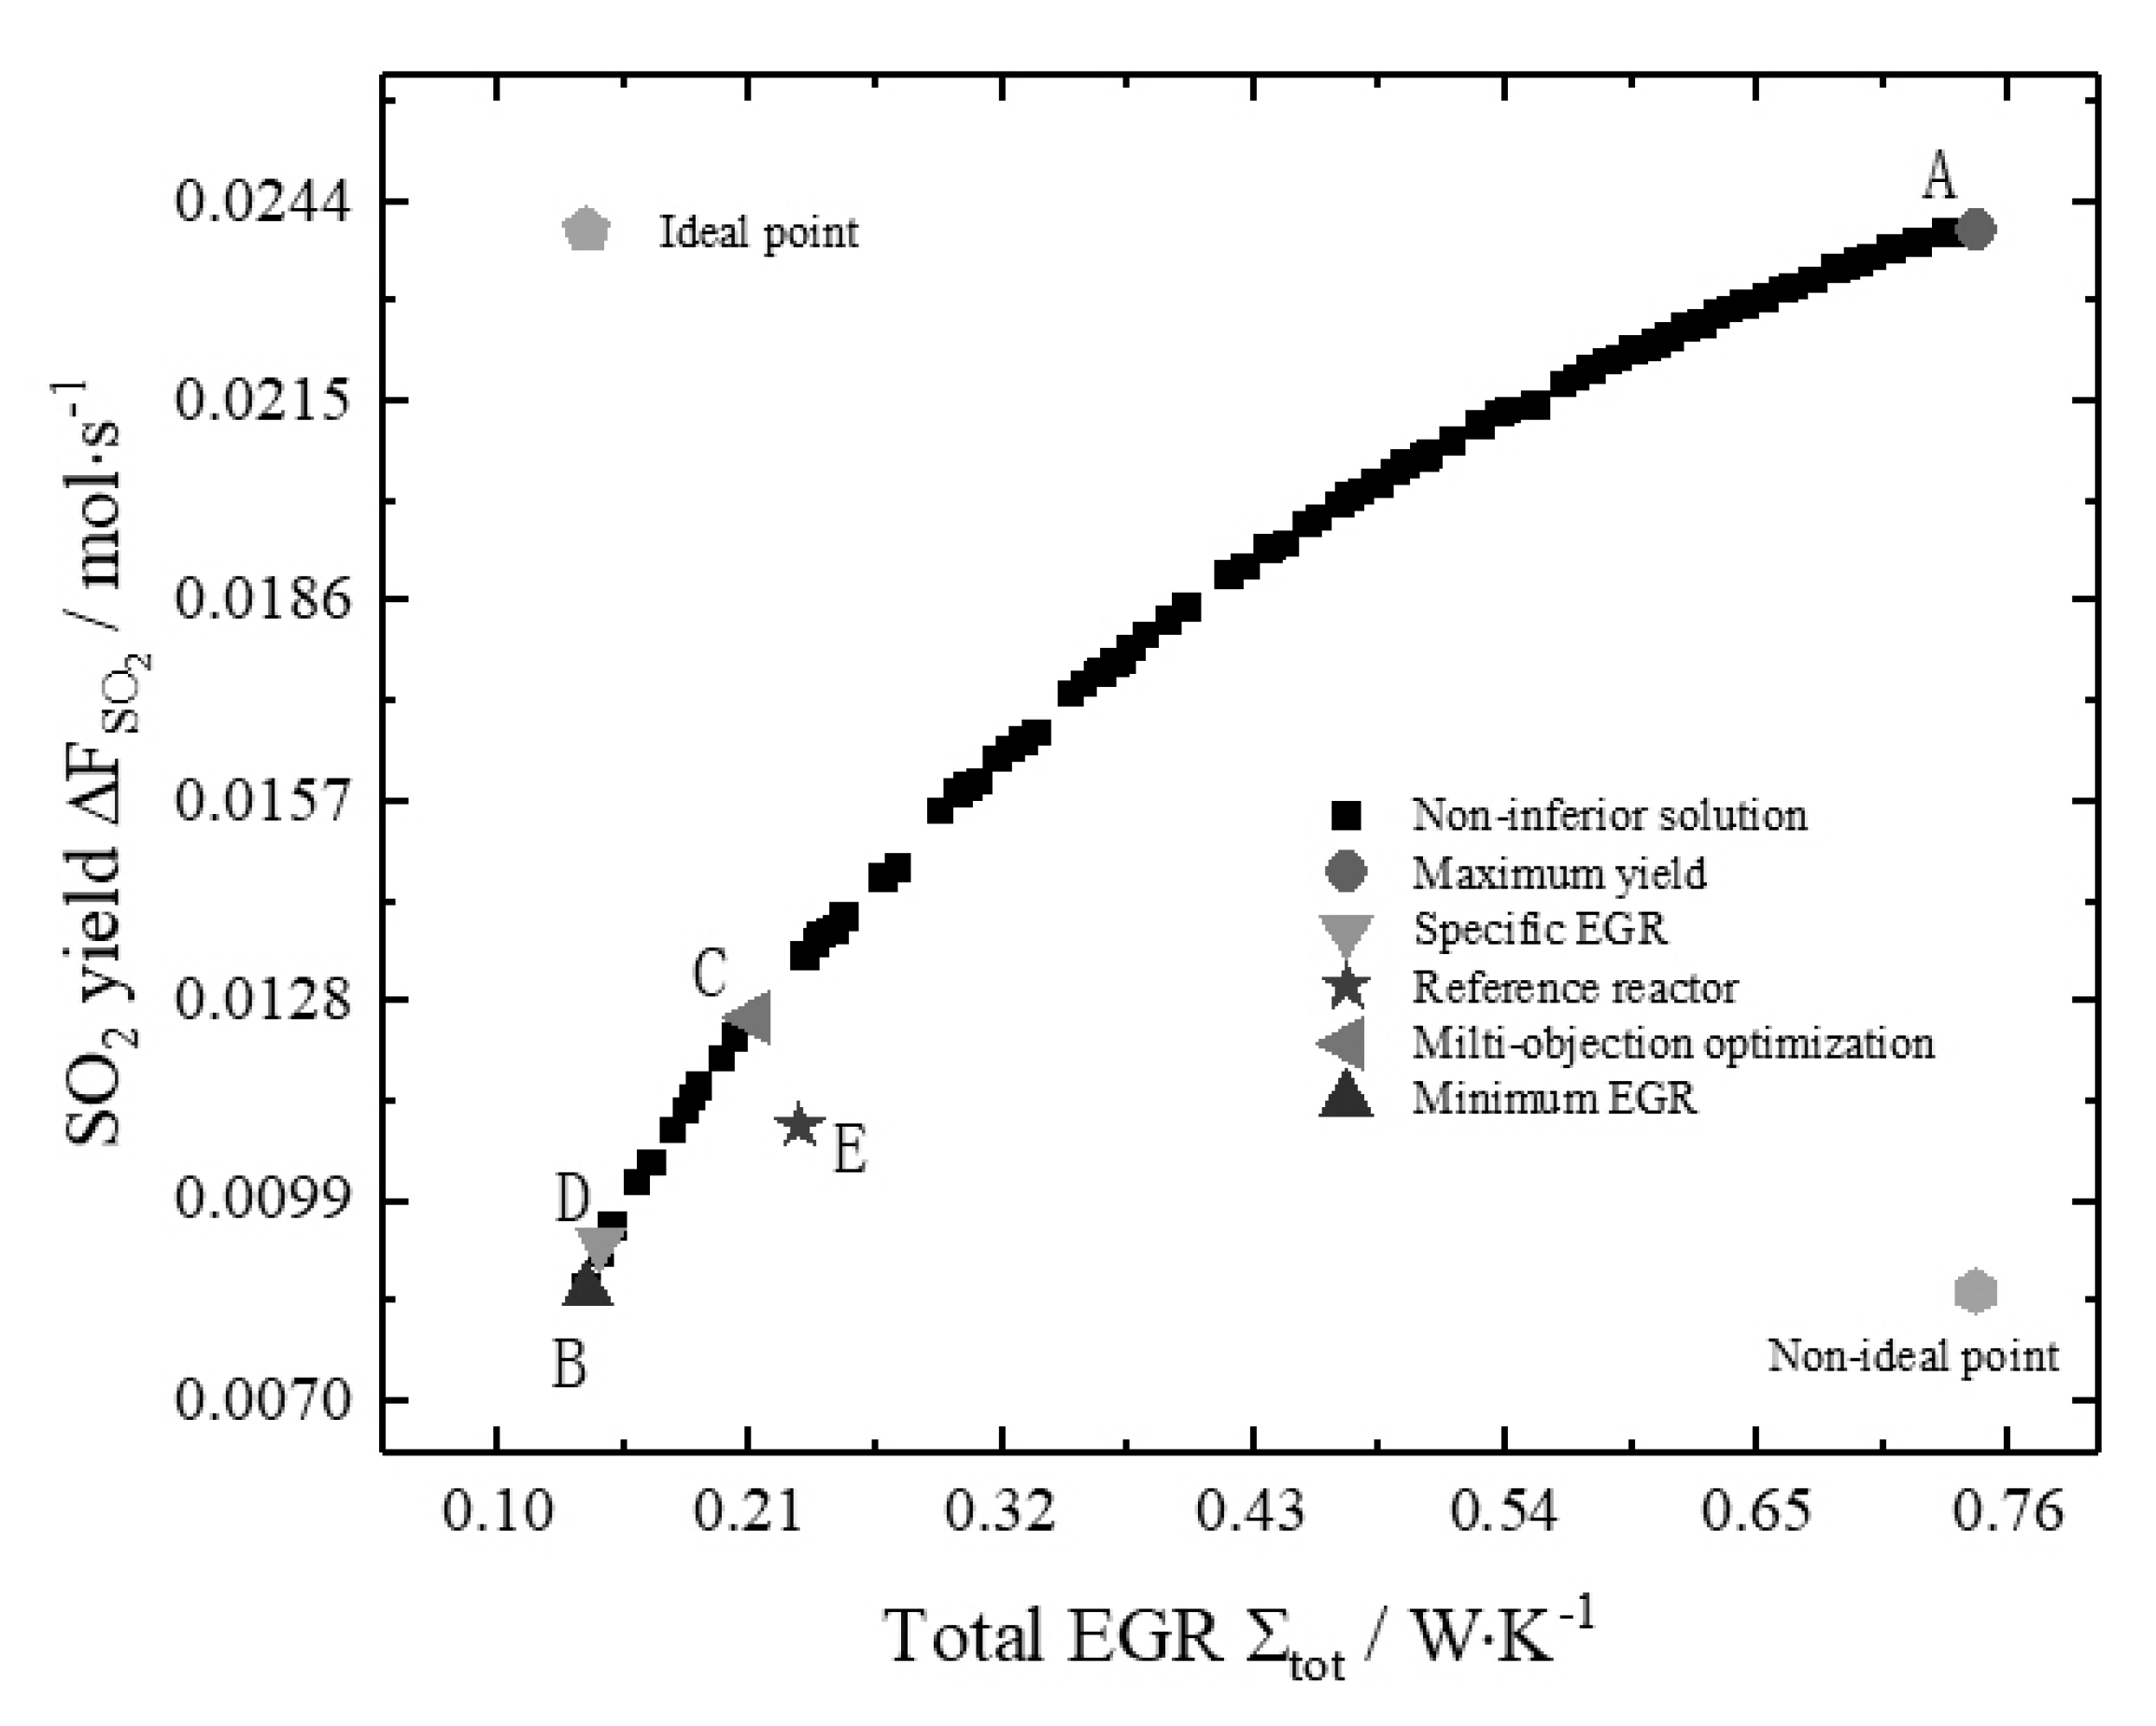
Figure 7 is Pareto optimal frontier of a reference reactor based on the objective of minimizing total EGR and maximizing SO2 yield, where points A and B represent the solution of the maximum SO2 yield and the minimum total EGR, respectively. At point A, the weighting coefficient of SO2 yield in multi-objective optimization is 1, and the weighting coefficient of total EGR is 0, it is also the solution of maximizing the SO2 yield. Similarly, point B is the solution of minimizing the total EGR. From Figure 7, it can be seen that the minimum total EGR and the maximum SO2 yield are mutually constrained, and they cannot achieve the extremum values at the same time. Only the relative optimal solutions of the two objectives under different weighting coefficients can be found, that is, the non-inferior solution. One can select the appropriate optimal solution from the Pareto-optimal solution set according to different needs to meet the different demands of decision-making purposes. Commonly used multi-objective decision-making methods are Shannon, LINMAP, and TOPSIS, but in the actual decision-making process, decision-making is usually based on actual engineering experience and personal preferences of decision-makers, there is no universal way to make decisions.
In this paper, in order to facilitate the comparison with the reference reactor, a suitable multi-objective decision point (point C) is selected for comparison. Because the solution of the minimum specific EGRs is the solution of the total EGR and the yield under a certain ratio, the decision point of the minimum specific EGR must be on the Pareto-optimal front, which can be used as an important basis to verify the accuracy of the NSGA-II algorithm results.
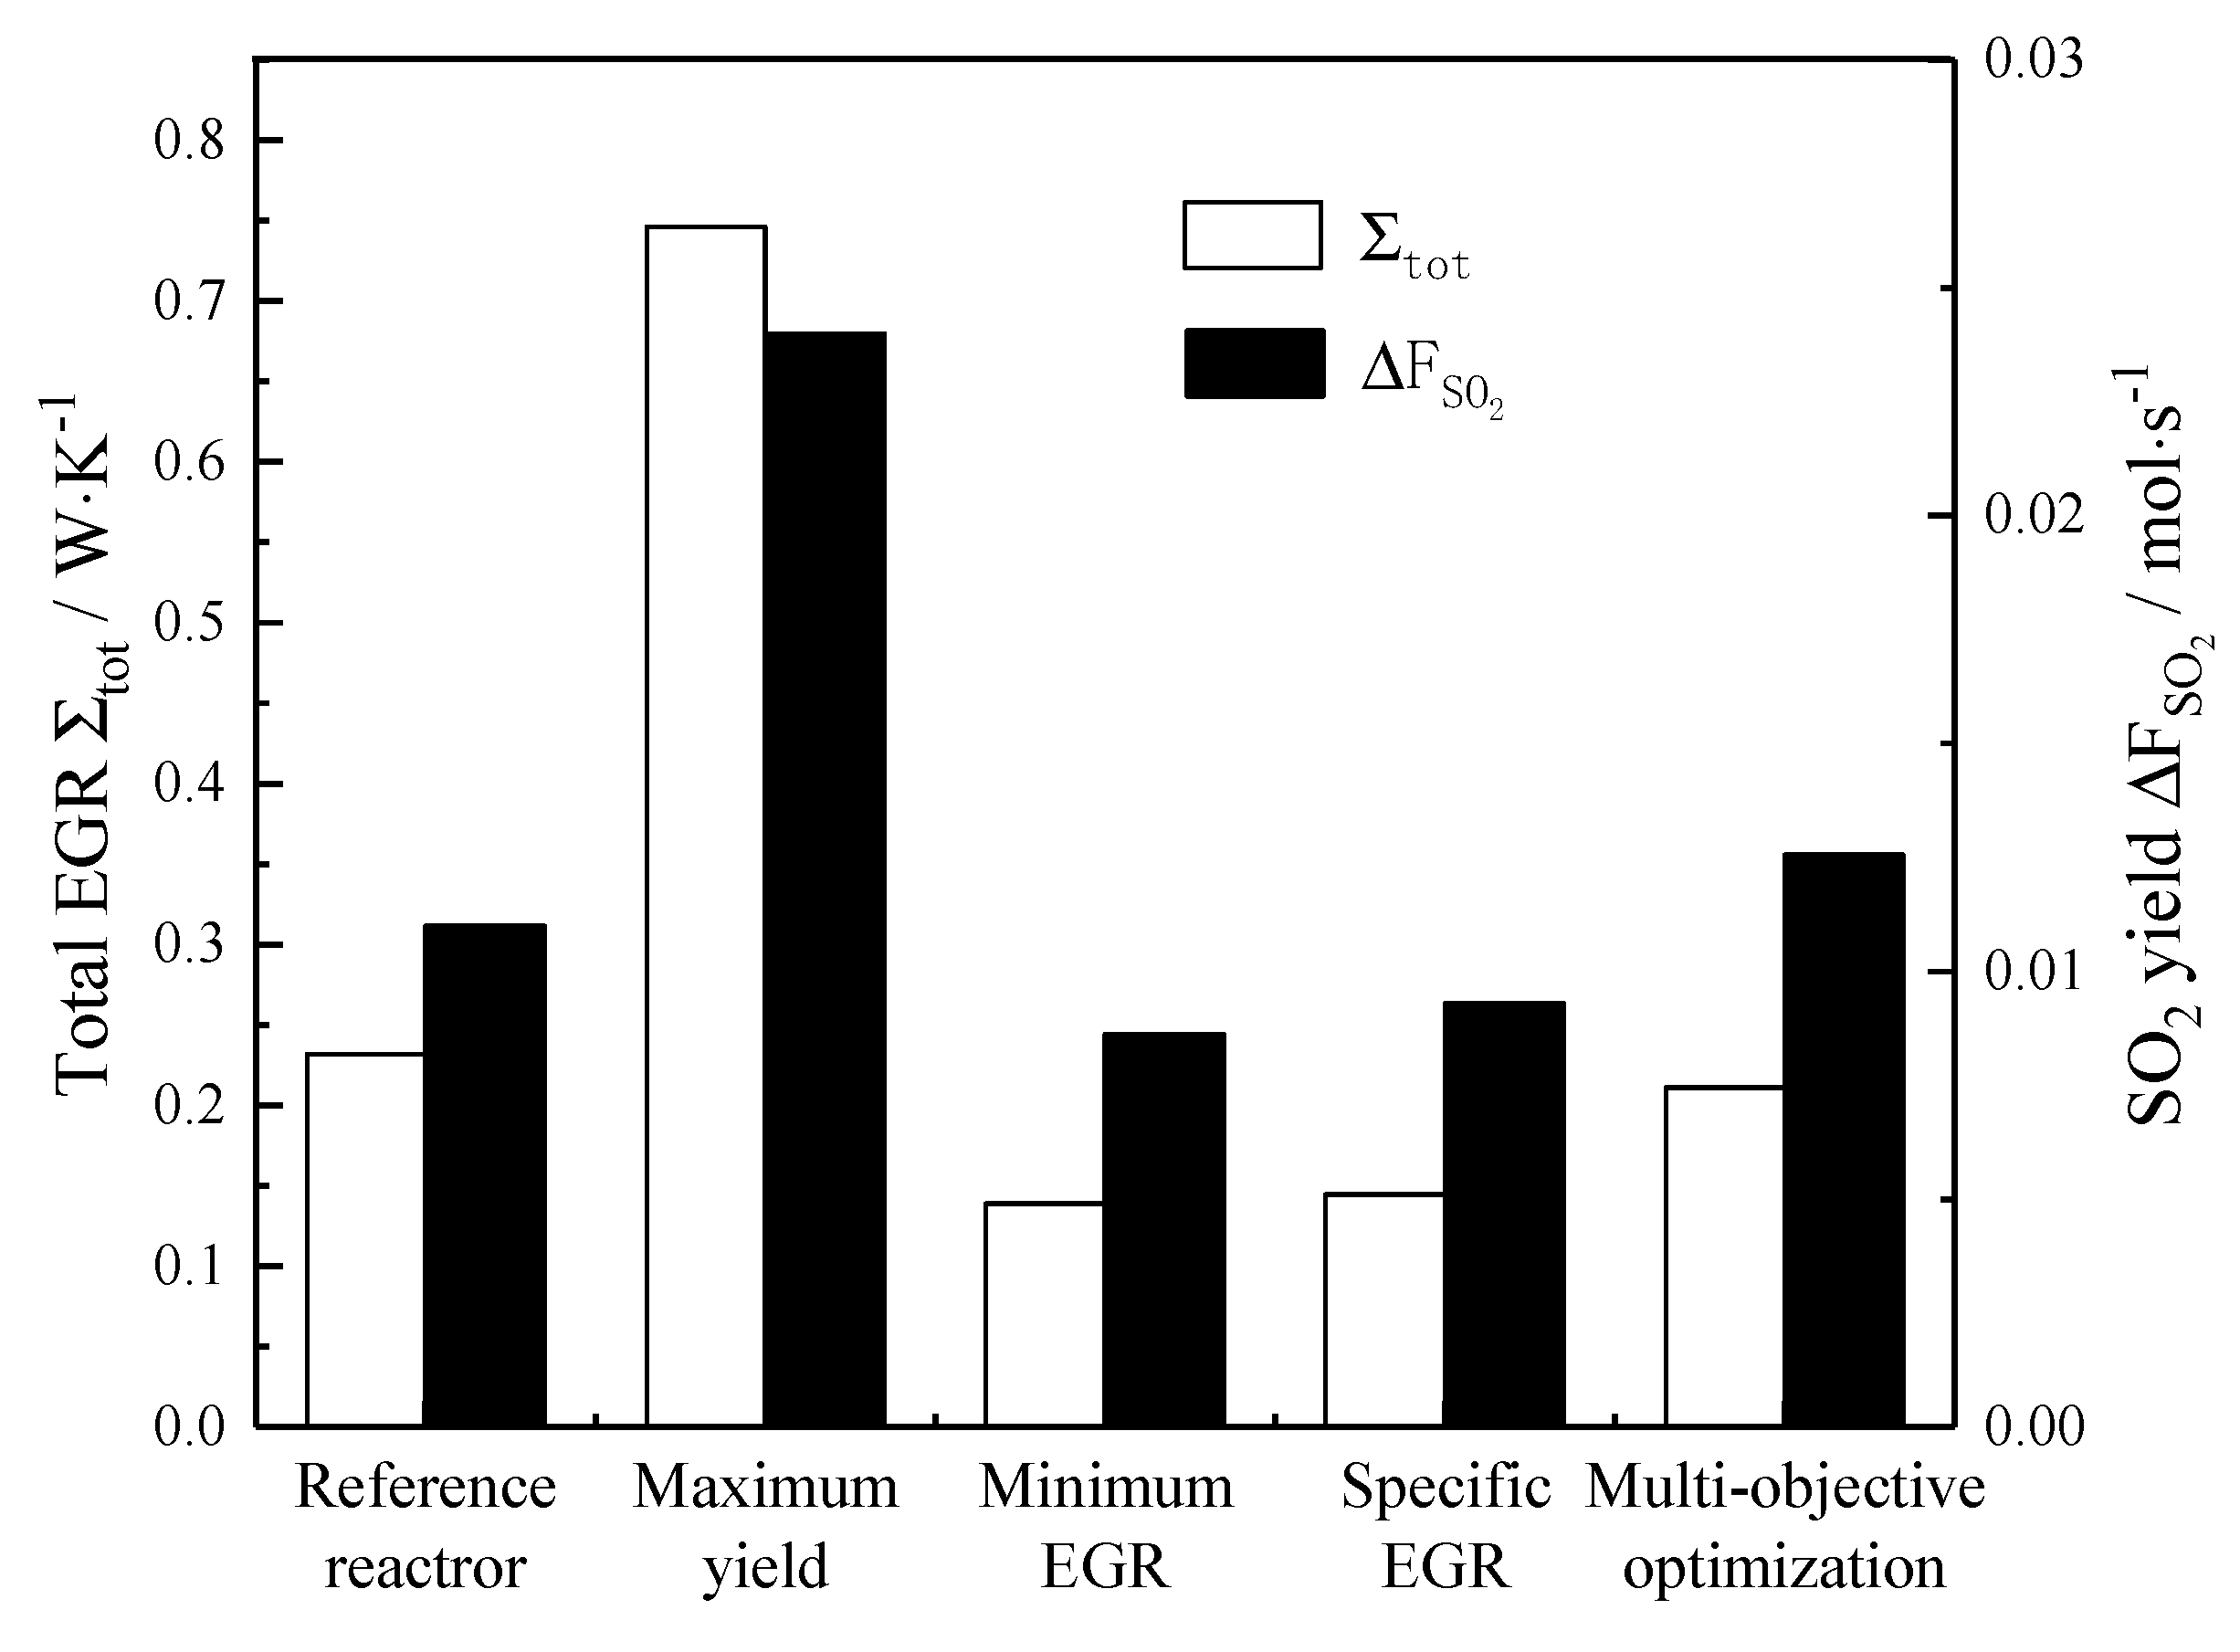
Figure 8 is the bar chart of the target value of the reference reactor under optimization and non-optimization. Table 2 lists the results of each optimization target condition. It can be seen that compared with the reference reactor, the SO2 yield of the reactor with the maximum yield increases by 118%, but the total EGR increases by 222%; the total EGR of the minimum EGR reactor decreases by 40%, and the corresponding SO2 yield also decreased by 22%; the total EGR and the SO2 yield of the reactor with the minimum specific EGR decrease by 38% and 16%, respectively. From Figure 7, it can be easily concluded that the reference reactor is not located at the Pareto optimal frontier, so the reference reactor can be optimized by Pareto improvement. A non-inferior solution (point C) is obtained by the multi-objective optimization method, in which the total EGR of the reactor decreases by 9% and the SO2 yield of the reactor increases by 14% compared to the reference reactor. Also, from Figure 7, it can be seen that a series of non-inferior solutions located at the upper left of the decision point (point E) of the reactor have good properties of reducing the total EGR and increasing the SO2 yield.
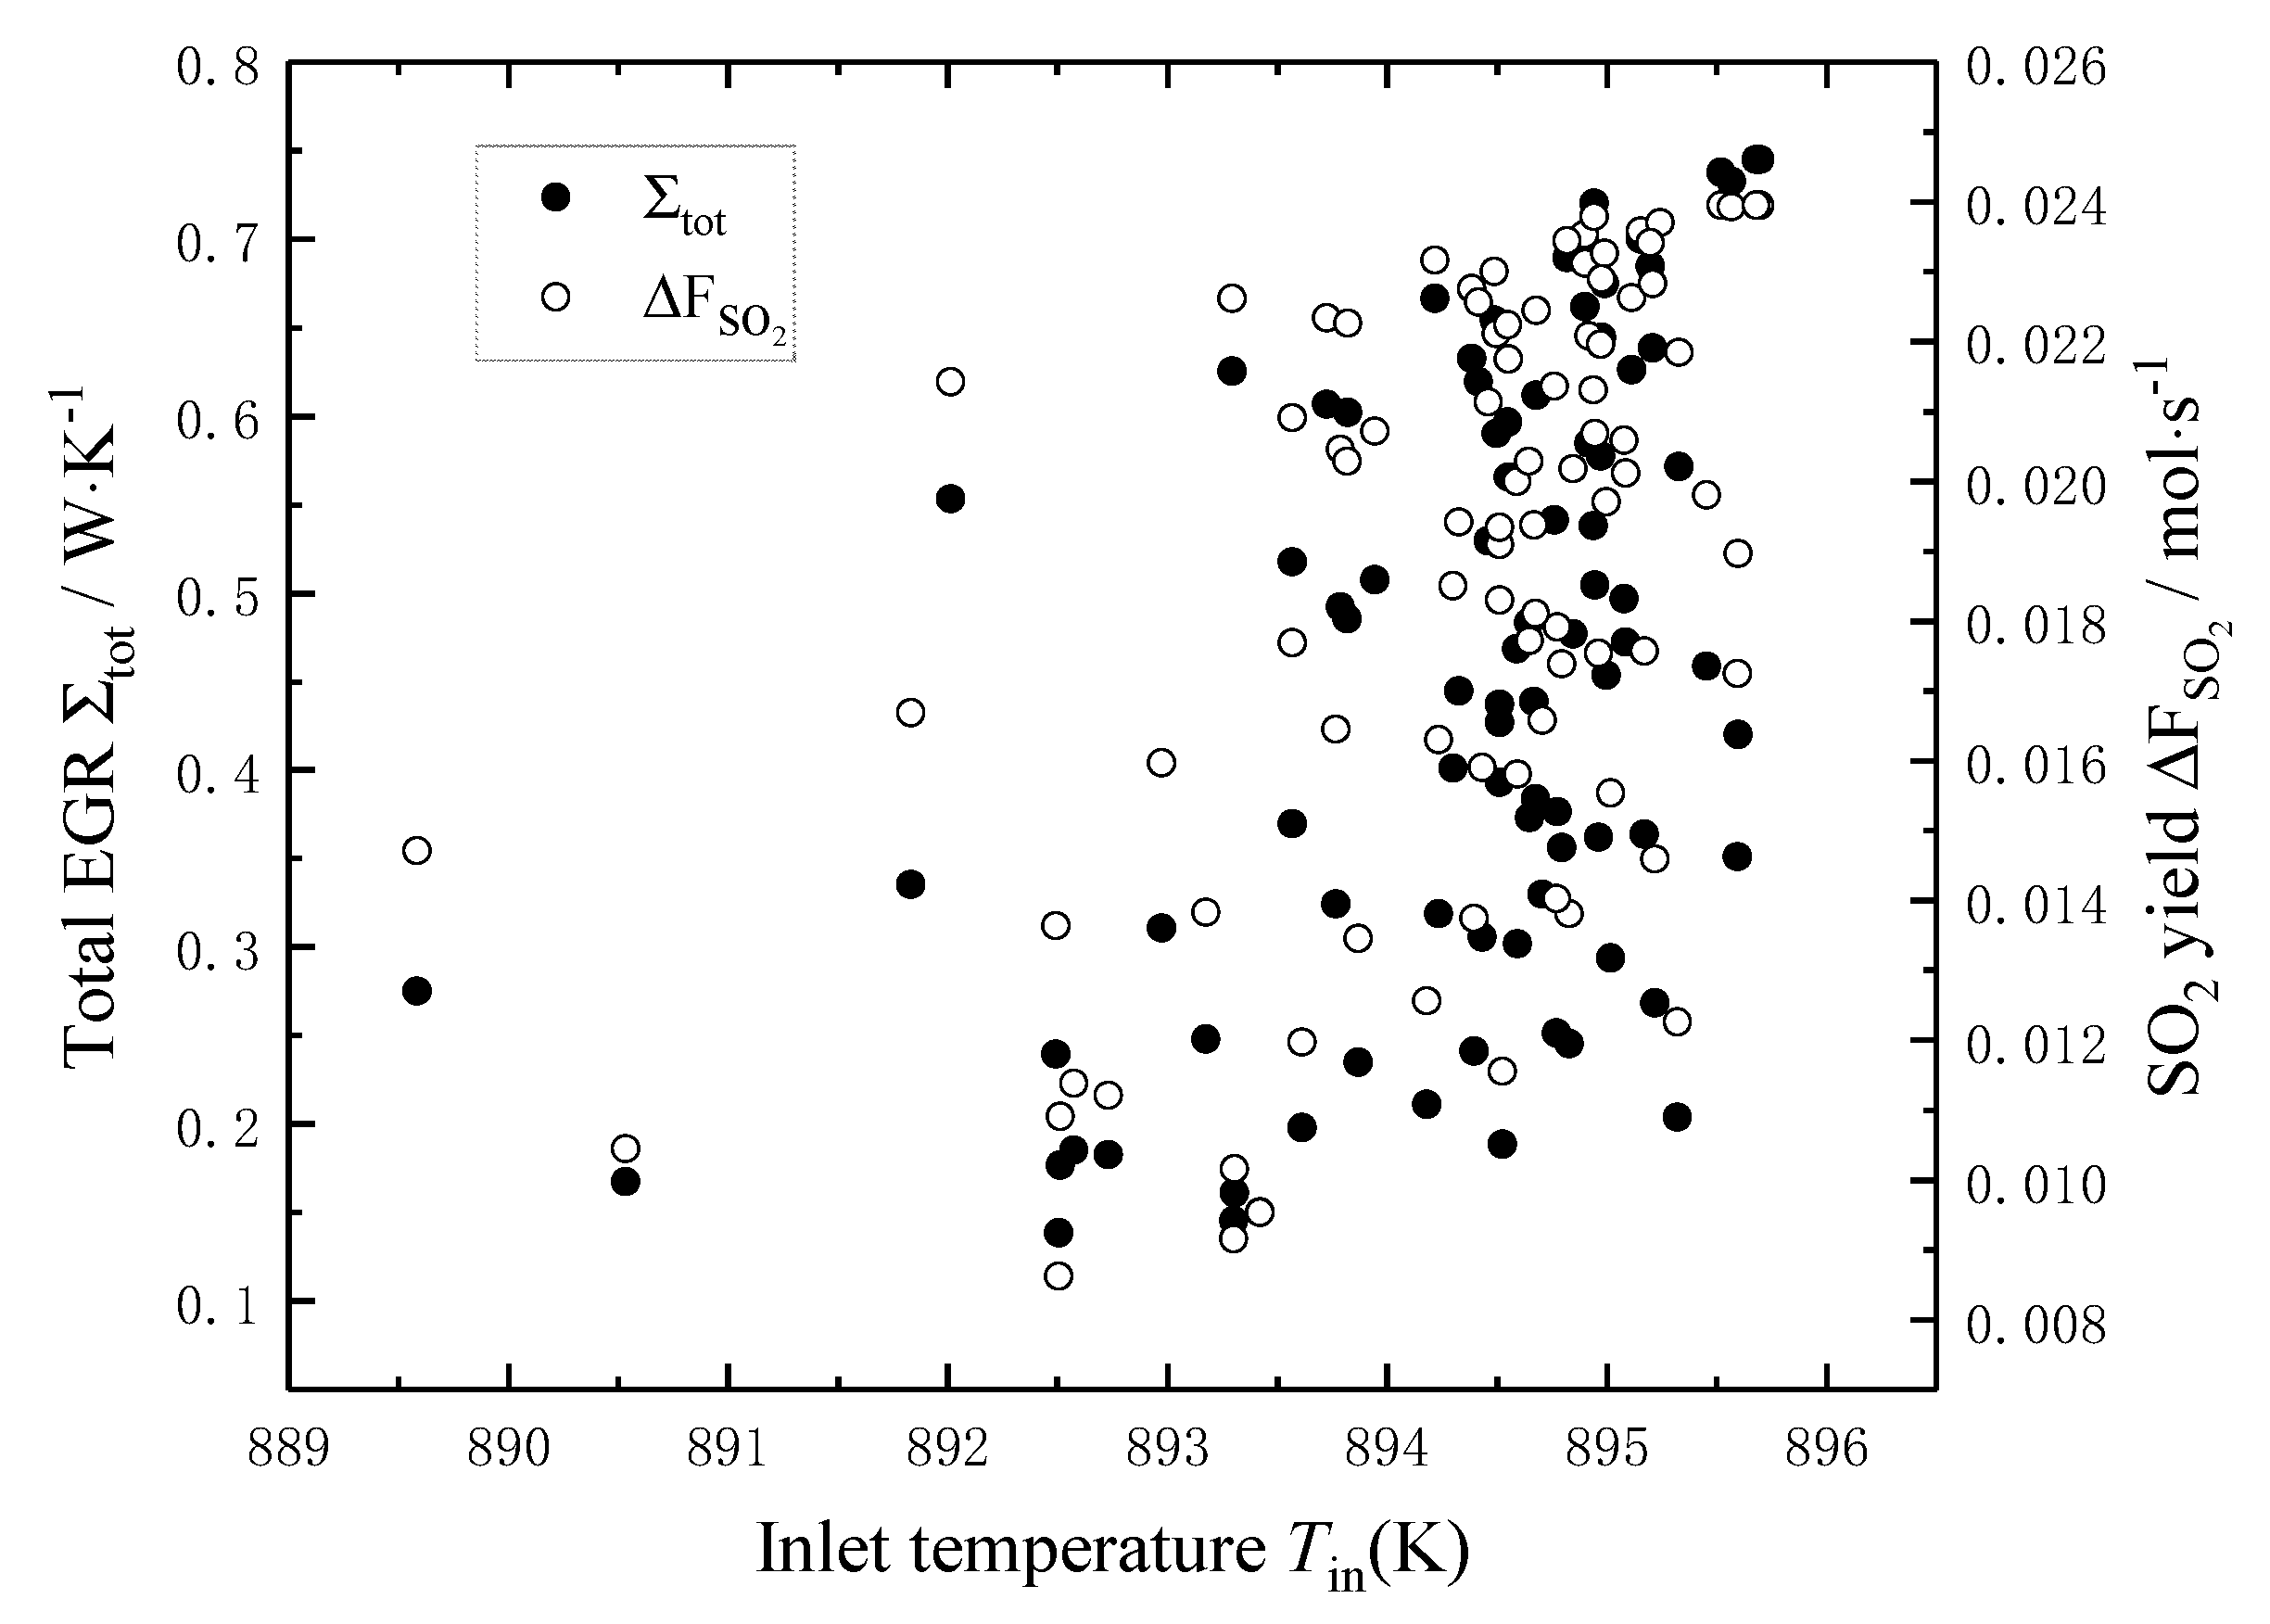
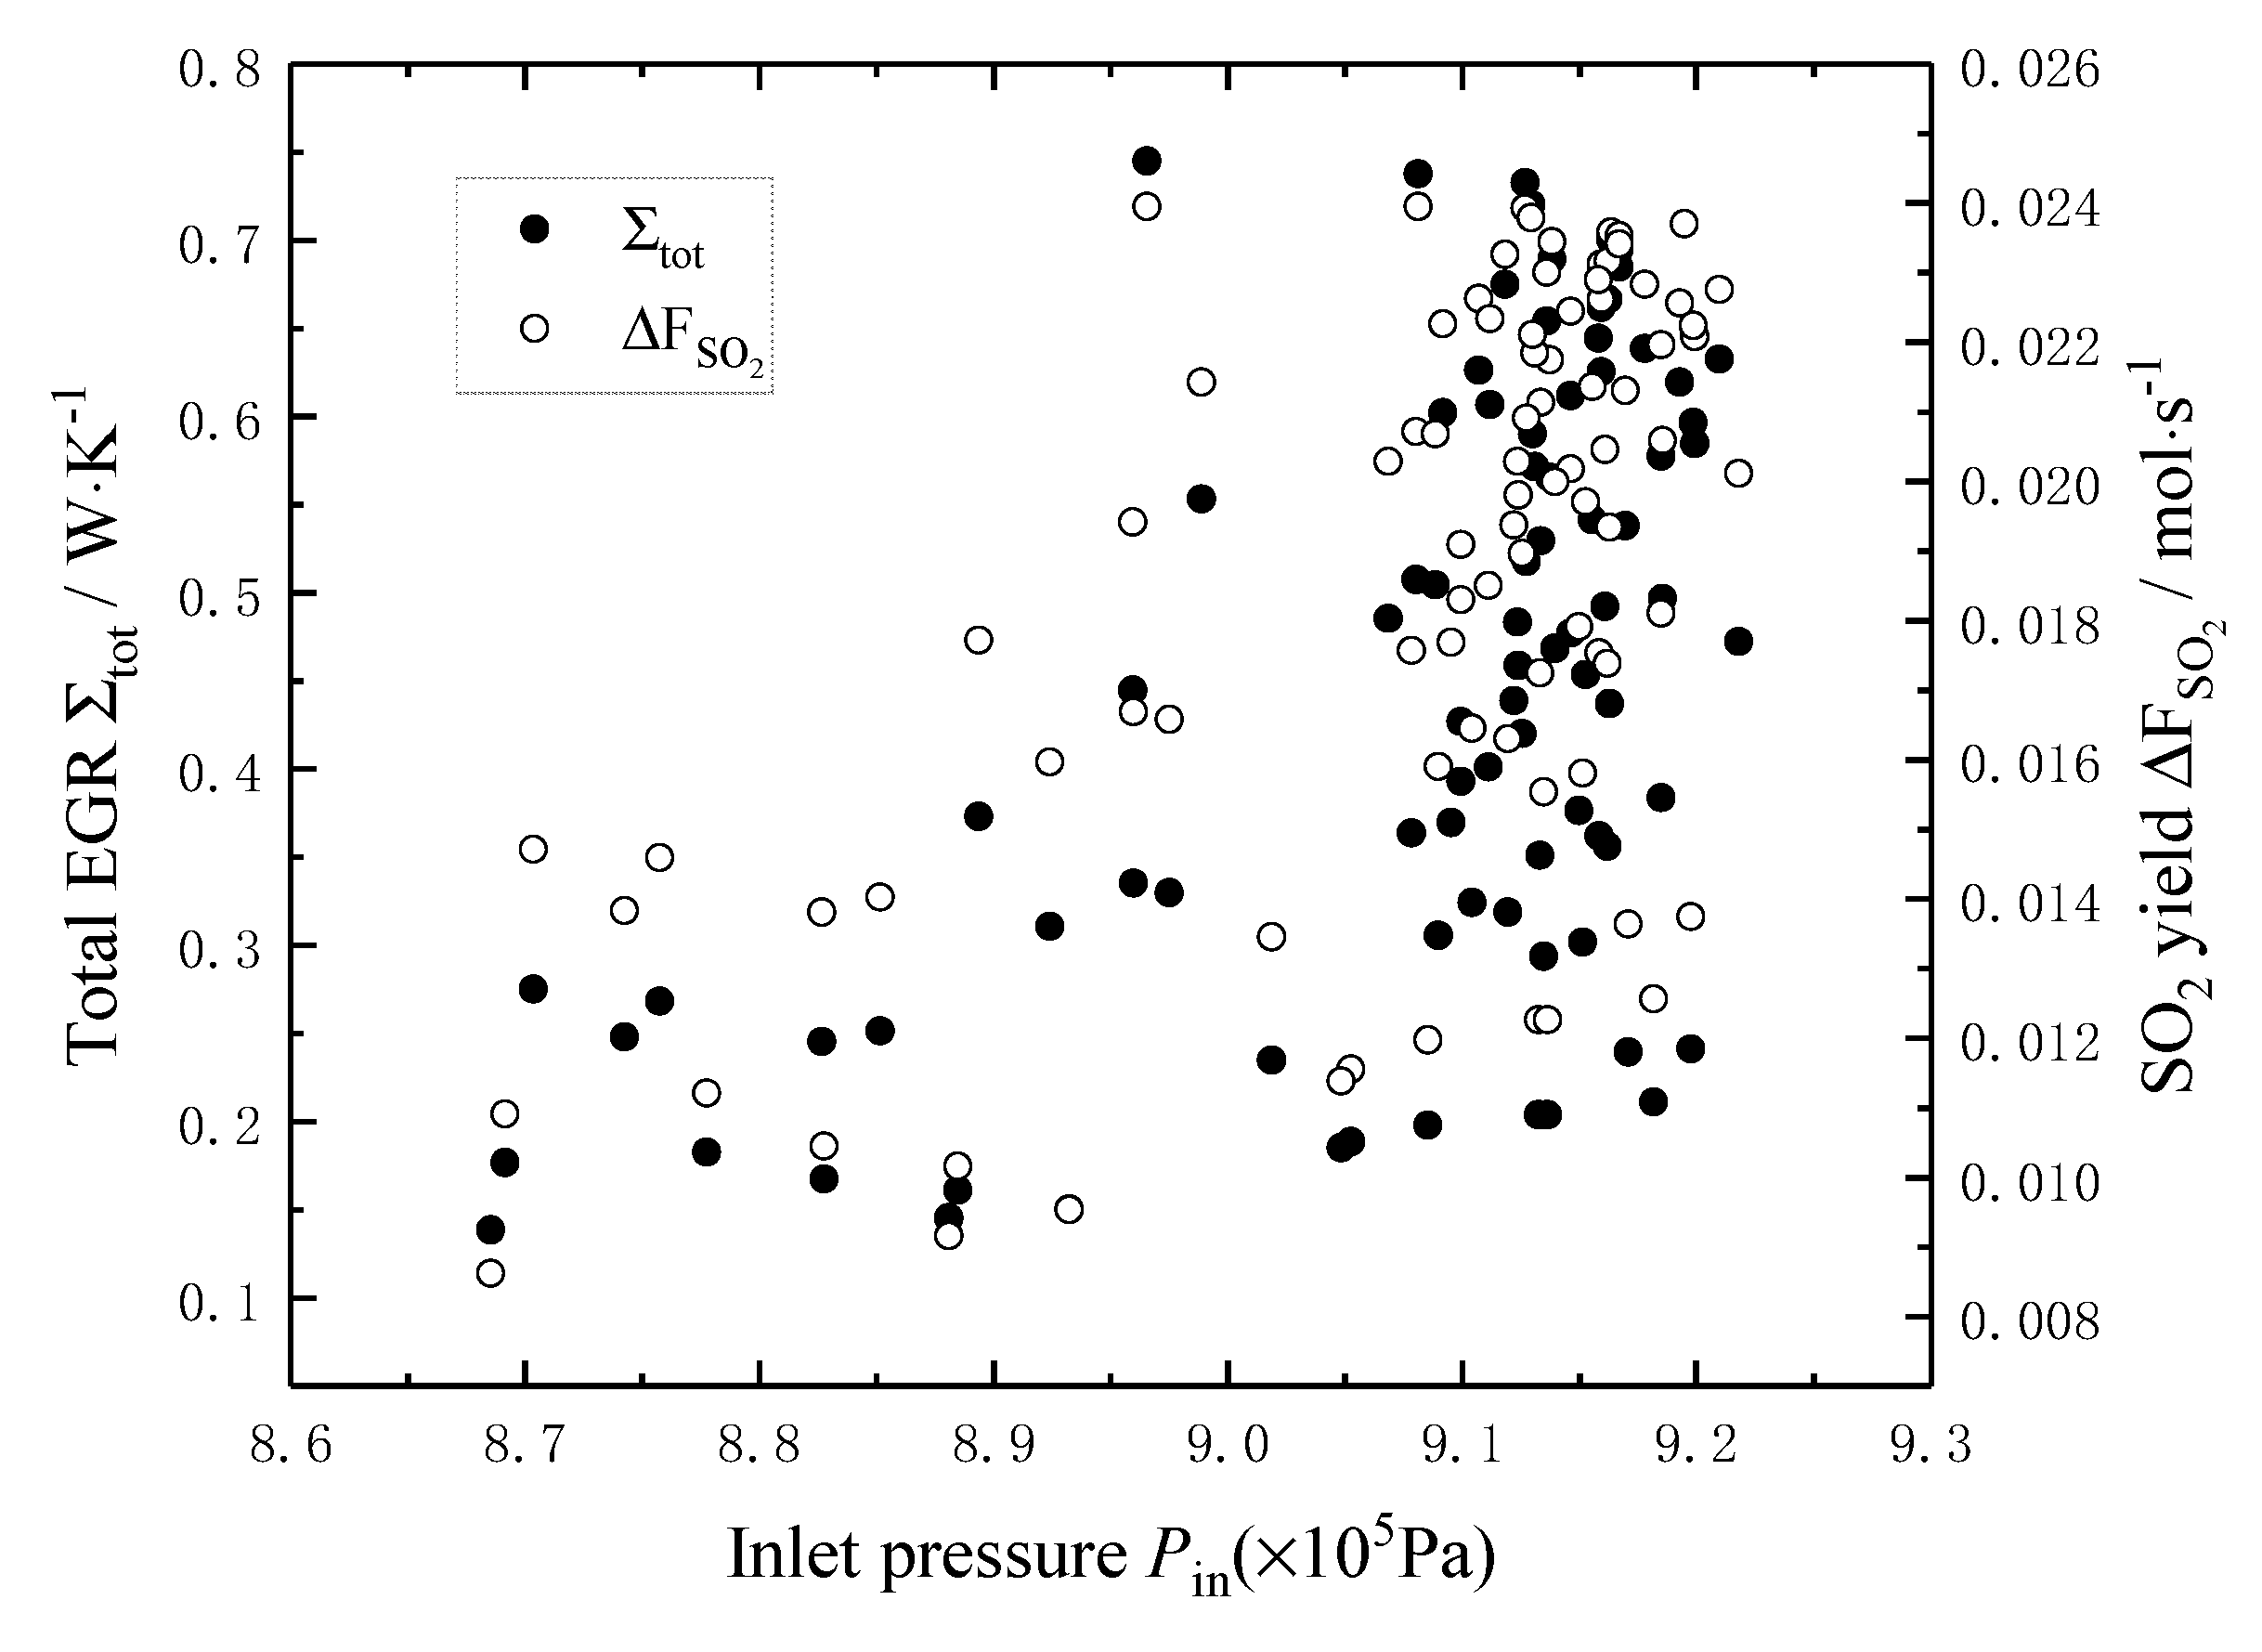
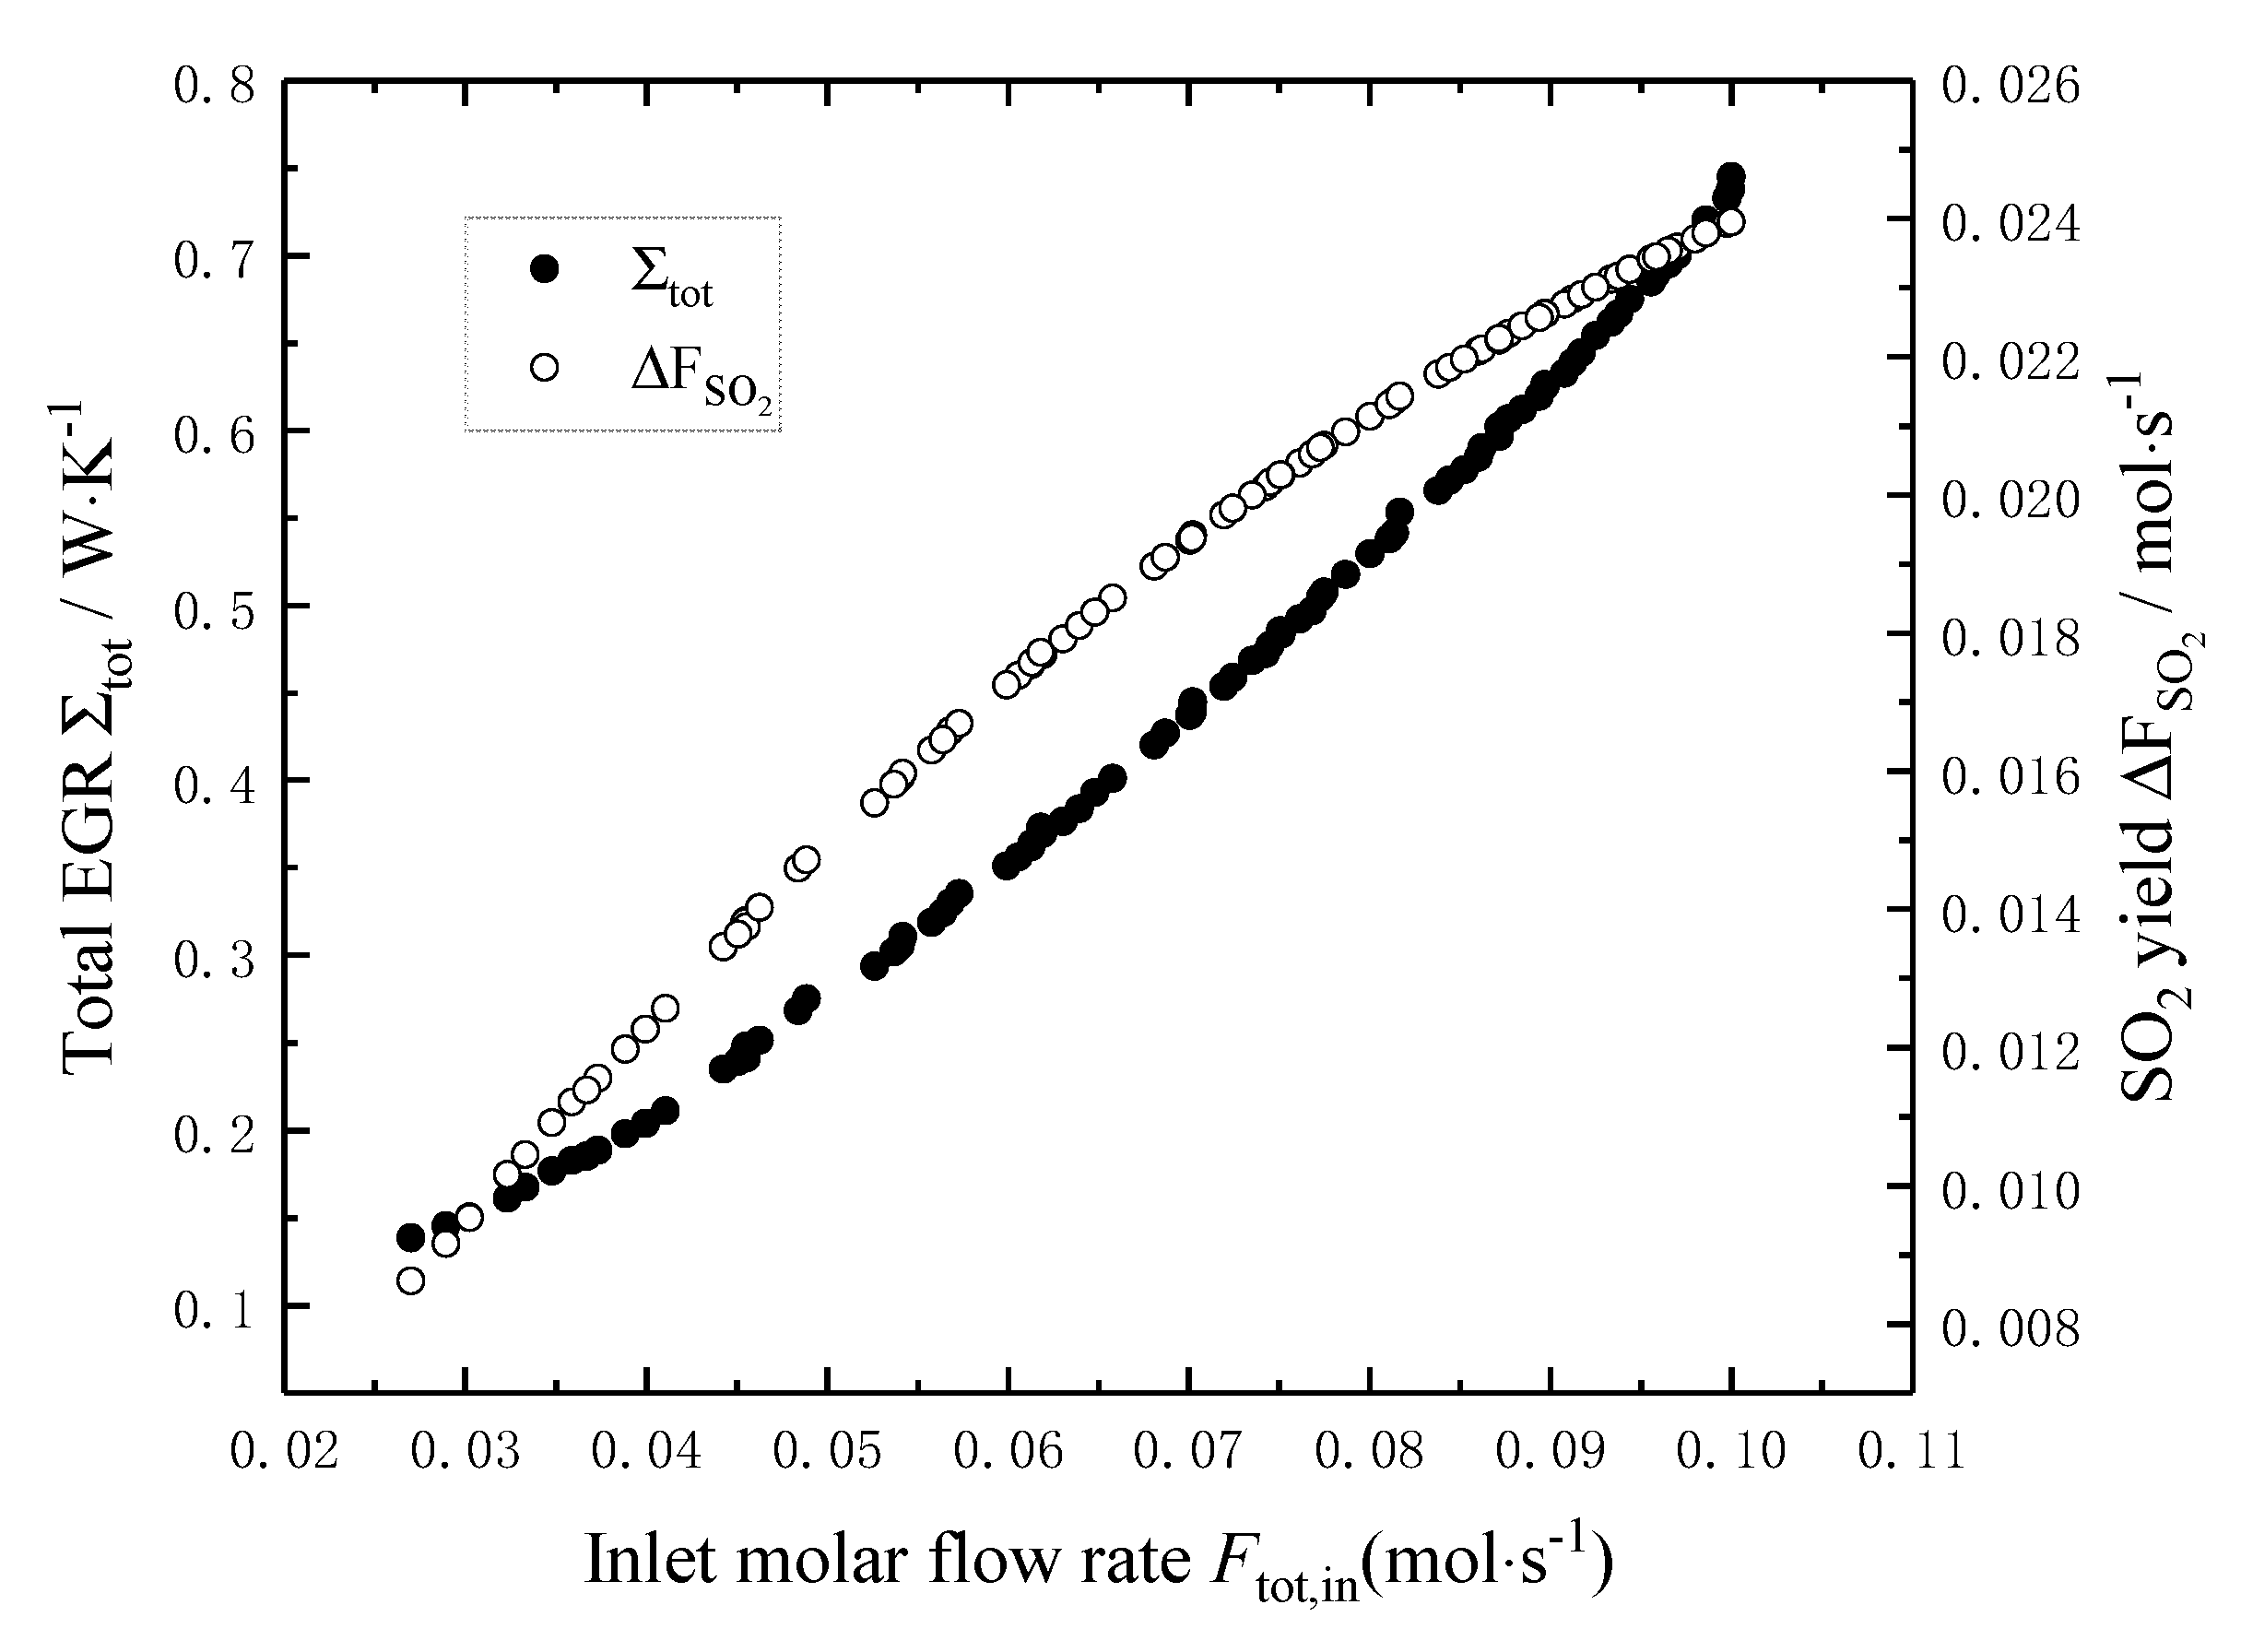
Figure 9, Figure 10 and Figure 11 show the distribution of the Tin, Pin and Ftot,in in Pareto-optimal fronts, and the black and white dots in the figures represent the total EGR and the SO2 yield, respectively, which exist in pairs. As seen from Figure 9 and Figure 10, the Tin and Pin of the reaction mixture in Pareto-optimal fronts are mainly distributed in high-temperature (892–896 K) and high-pressure (9.0–9.2 bar) area, so increasing the Tin and Pin of the reaction mixture is an important means for Pareto improvement. Figure 11 shows that the Ftot,in of the reaction mixture in Pareto-optimal fronts distributes uniformly in its optimal range, which indicates that adjusting the Ftot,in of the reaction mixture in Pareto-optimal fronts is an important means to reconcile the contradiction between the minimum total EGR and the maximum SO2 yield.
5. Conclusions
In this paper, the effects of reaction mixture inlet parameters on the total EGR and SO2 yield of the tubular plug-flow sulfuric acid decomposition reactor are analyzed, and the multi-objective optimization for the two performance objectives are carried out by using FTT. The results show that:
- (1)
- When the Tin increases from 750 °C to 900 °C, the total EGR decreases by 43% and the SO2 yield increases by 0.4%. When the Pin increases from 0.4 MPa to 1 MPa, the curve of the total EGR versus the Pin is a concave parabolic-like, the minimum value of the total EGR is 0.224 W/K when the Pin equals to 0.85 MPa, and the corresponding SO2 yield decreases by 11%. When the Ftot,in increases from 0.027mol/s to 0.10mol/s, the total EGR and the SO2 yield increase by 4.8 times and 1.8 times, respectively.
- (2)
- The reference reactor can be Pareto improvement, one of the non-inferior solutions can reduce the total EGR by 9% and increase the SO2 yield by 14% compared to those of the reference reactor.
- (3)
- FTT is a powerful theoretical tool for the performance analysis and optimization of tubular plug-flow sulfuric acid decomposition reactor. The NSGA-II algorithm is an effective mathematical tool for the multi-objective optimization of tubular plug-flow sulfuric acid decomposition reactor. The Pareto-optimal fronts obtained in this paper has a certain theoretical guiding significance for the optimal designs of the actual sulfuric acid decomposition reactors.
Author Contributions
Conceptualization, M.S., S.X. and L.C.; Funding acquisition, S.X.; Methodology, M.S., S.X. and L.C.; Software, M.S., C.W. and C.T.; Supervision, L.C.; Validation, M.S. and C.T.; Writing—original draft, M.S. and S.X.; Writing—review & editing, L.C. All authors have read and agreed to the published version of the manuscript.
Funding
This research was funded by National Natural Science Foundation of China (Grant Nos. 51976235) and 51606218) and the Hubei Province Natural Science Foundation of China (Grant No, 2018CFB708).
Acknowledgments
The authors wish to thank the Academic Editor and reviewers for their careful, unbiased and constructive suggestions, which led to this revised manuscript.
Conflicts of Interest
The authors declare no conflict of interest.
Nomenclature
| area | |
| molar constant-pressure heat capacity, | |
| catalyst pellet diameter, | |
| F | molar flow rate, |
| heat flux density, W/m2 | |
| K | equilibrium constant |
| length, m | |
| pressure, | |
| universal gas constant, | |
| r | reaction rate, |
| temperature, K | |
| v | flow velocity, |
| length, | |
| Greek letters | |
| catalyst bed porosity | |
| dynamic viscosity, | |
| rate constant of chemical reaction | |
| the stoichiometric number of reaction component | |
| density, | |
| local EGR, J/K | |
| total | |
| Gibbs free energy change of chemical reaction, J | |
| enthalpy change of chemical reaction, J | |
| Subscripts | |
| c | cross section of tubular plug-flow reactor |
| cr | chemical reaction |
| f | fluid flow |
| ht | heat transfer |
| i | component |
| in | inlet |
| j | reaction types (I) and (II) |
| out | outlet |
| catalyst pellet | |
| q | quantity of heat |
| r | reaction |
| tot | total |
| wall of tubular plug-flow reactor | |
| Abbreviations | |
| EGR | entropy generation rate |
| FTT | finite-time thermodynamics |
| H-S | hybrid-Sulphur thermochemical cycle |
| NSGA-II | second generation non-dominated solution sequencing genetic algorithm |
| S-I | sulphur-Iodine thermochemical cycle |
Appendix A
According to the Refs. [31], the component molar constant-pressure heat capacity, molar enthalpy and molar Gibbs energy can be calculated by the following formula:
where are the thermodynamic coefficients of the formula, which are listed in Table A1; is the stoichiometric number of reaction component .

Table A1.
Thermodynamic coefficients.
| Gas | ||||||||||
|---|---|---|---|---|---|---|---|---|---|---|
| SO2 | 21.430 | 74.351 | −57.752 | 16.355 | 0.087 | −305.769 | 254.887 | 298 | 1200 | |
| O2 | 29.659 | 6.137 | −1.187 | 0.096 | −0.220 | −9.861 | 237.948 | 298 | 6000 | |
| SO3 | 24.025 | 119.461 | −94.387 | 26.926 | −0.118 | −407.853 | 253.51 | 298 | 1200 | |
| H2O | 30.092 | 6.833 | 6.793 | −2.534 | 0.082 | −250.881 | 223.397 | 500 | 1700 | |
| H2SO4 | 47.289 | 190.331 | −148.123 | 43.868 | −0.740 | −758.953 | 301.296 | 298 | 1200 |
References
- Van der Ham, L.V. Minimising Entropy Production in a H2SO4 Decomposer for the Thermochemical Production of H2 from H2O. Master’s Thesis, Delft University of Technology, Delft, Norway, 2008. [Google Scholar]
- Kuchi, G.; Ponyavin, V.; Chen, Y. Numerical modeling of high-temperature shell-and-tube heat exchanger and chemical decomposer for hydrogen production. Int. J. Hydrog. Energy 2008, 33, 5460–5468. [Google Scholar] [CrossRef] [Green Version]
- Ponyavin, V.; Chen, Y.; Mohamed, T. Parametric study of sulfuric acid decomposer for hydrogen production. Prog. Nucl. Energy 2008, 50, 427–433. [Google Scholar] [CrossRef]
- Van der Ham, L.V.; Gross, J.; Verkooijen, A. Efficient conversion of thermal energy into hydrogen: Comparing two methods to reduce exergy losses in a sulfuric acid decomposition reactor. Ind. Eng. Chem. Res. 2009, 48, 8500–8507. [Google Scholar] [CrossRef]
- Wang, C.; Chen, L.G.; Xia, S.J.; Sun, F.R. Maximum production rate optimization for sulphuric acid decomposition process in tubular plug-flow reactor. Energy 2016, 99, 152–158. [Google Scholar] [CrossRef]
- Wang, C.; Xia, S.J.; Chen, L.G.; Ge, Y.L.; Zhang, L.; Feng, H.R. Effects of design parameters on entropy generation rate of sulphuric acid decomposition process. Int. J. Ambient Energy 2020, 41. [Google Scholar] [CrossRef]
- Andresen, B.; Berry, R.S.; Ondrechen, M.J.; Salamon, P. Thermodynamics for processes in finite time. Acc. Chem. Res. 1984, 17, 266–271. [Google Scholar] [CrossRef]
- Bejan, A. Entropy generation minimization: The new thermodynamics of finite-size devices and finite-time processes. J. Appl. Phys. 1996, 79, 1191–1218. [Google Scholar] [CrossRef] [Green Version]
- Chen, L.G.; Wu, C.; Sun, F.R. Finite time thermodynamic optimization or entropy generation minimization of energy systems. J. Non-Equilib. Thermodyn. 1999, 24, 327–359. [Google Scholar] [CrossRef]
- Berry, R.S.; Kazakov, V.A.; Sieniutycz, S.; Szwast, Z.; Tsirlin, A.M. Thermodynamic Optimization of Finite Time Processes; Wiley: Chichester, UK, 1999. [Google Scholar]
- Chen, L.G. Finite-Time Thermodynamic Analysis of Irreversible Processes and Cycles; Higher Education Press: Beijing, China, 2005. [Google Scholar]
- Andresen, B. Current trends in finite-time thermodynamics. Angew. Chem. Int. Edition. 2011, 50, 2690–2704. [Google Scholar] [CrossRef]
- Roach, T.N.F.; Salamon, P.; Nulton, J.; Andresen, B.; Felts, B.; Haas, A.; Calhoun, S.; Robinett, N.; Rohwer, F. Application of finite-time and control thermodynamics to biological processes at multiple scales. J. Non-Equilibr. Thermodyn. 2018, 43, 193–210. [Google Scholar] [CrossRef] [Green Version]
- Gonzalez-Ayala, J.; Santillán, M.; Santos, M.J.; Calvo-Hernández, A.; Roco, J.M.M. Optimization and stability of heat engines: The role of entropy evolution. Entropy 2018, 20, 865. [Google Scholar] [CrossRef] [Green Version]
- Fontaine, K.; Yasunaga, T.; Ikegami, Y. OTEC maximum net power output using Carnot cycle and application to simplify heat exchanger selection. Entropy 2019, 21, 1143. [Google Scholar] [CrossRef] [Green Version]
- Feidt, M.; Costea, M. Progress in Carnot and Chambadal modeling of thermomechnical engine by considering entropy and heat transfer entropy. Entropy 2019, 21, 1232. [Google Scholar] [CrossRef] [Green Version]
- Masser, R.; Hoffmann, K.H. Dissipative endoreversible engine with given efficiency. Entropy 2019, 21, 1117. [Google Scholar] [CrossRef] [Green Version]
- Dumitrascu, G.; Feidt, M.; Popescu, A.; Grigorean, S. Endoreversible trigeneration cycle design based on finite physical dimensions thermodynamics. Energies 2019, 12, 3165. [Google Scholar]
- Yasunaga, T.; Ikegami, Y. Finite-time thermodynamic model for evaluating heat engines in ocean thermal energy conversion. Entropy 2020, 22, 211. [Google Scholar] [CrossRef] [Green Version]
- Masser, R.; Hoffmann, K.H. Endoreversible modeling of a hydraulic recuperation system. Entropy 2020, 22, 383. [Google Scholar] [CrossRef] [Green Version]
- De Vos, A. Endoreversible models for the thermodynamics of computing. Entropy 2020, 22, 660. [Google Scholar] [CrossRef]
- Masser, R.; Khodja, A.; Scheunert, M.; Schwalbe, K.; Fischer, A.; Paul, R.; Hoffmann, K.H. Optimized piston motion for an alpha-type Stirling engine. Entropy 2020, 22, 700. [Google Scholar] [CrossRef]
- Wang, C.; Chen, L.G.; Xia, S.J.; Sun, F.R. Optimal concentration configuration of consecutive chemical reaction A⇔B⇔C for minimum entropy generation. J. Non-Equili. Thermodyn. 2016, 41, 313–326. [Google Scholar] [CrossRef]
- Johannessen, E.; Kjelstrup, S. Minimum entropy production rate in plug flow reactors: An optimal control problem solved for SO2 oxidation. Energy 2004, 29, 2403–2423. [Google Scholar] [CrossRef]
- Yang, H.Z.; Wen, J.; Wang, S.M.; Li, Y.Z. Thermal design and optimization of plate-fin heat exchangers based global sensitivity analysis and NSGA-II algorithm. Appl. Thermal Eng. 2018, 136, 444–453. [Google Scholar] [CrossRef]
- Mann, G.W.; Eckels, S. Multi-objective heat transfer optimization of 2D helical micro-fins using NSGA-II algorithm. Int. J. Heat Mass Transf. 2019, 132, 1250–1261. [Google Scholar] [CrossRef]
- Valencia, G.; Núñez, J.; Duarte, J. Multi-objective optimization of a plate heat exchanger in a waste heat recovery organic Rankine cycle system for natural gas engines. Entropy 2019, 21, 655. [Google Scholar] [CrossRef] [Green Version]
- Zhang, L.; Chen, L.G.; Xia, S.K.; Ge, Y.L.; Wang, C.; Feng, H.J. Multi-objective optimization for helium-heated reverse water gas shift reactor by using NSGA-II. Int. J. Heat Mass Transf. 2020, 148, 119025. [Google Scholar] [CrossRef]
- Tang, C.Q.; Feng, H.J.; Chen, L.G.; Wang, W.H. Power density analysis and multi- objective optimization for a modified endoreversible simple closed Brayton cycle with one isothermal heat process. Energy Rep. 2020, 6, 1648–1657. [Google Scholar] [CrossRef]
- Wu, Z.X.; Feng, H.J.; Chen, L.G.; Ge, Y.L. Performance optimization of a condenser in ocean thermal energy conversion (OTEC) system based on constructal theory and multi-objective genetic algorithm. Entropy 2020, 22, 641. [Google Scholar] [CrossRef]
- NIST Chemistry WebBook, NIST Standard Reference Database Number 69. June 2005. Available online: http://webbook.nist.gov/chemistry/ (accessed on 4 April 2020).
Figure 1.
The schematic diagram of S-I thermochemical cycle.

Figure 2.
Schematic of tubular plug-flow reactor.

Figure 3.
The effects of on the total EGR and the SO2 yield.

Figure 4.
Effects of on the total EGR and the SO2 yield.

Figure 5.
Effects of on the total EGR and the SO2 yield.

Figure 6.
Basic flow chart of NSGA-II algorithm.

Figure 7.
Pareto optimal frontiers of reference reactor.

Figure 8.
Comparison of total EGR and the yield of optimized objectives.

Figure 9.
Distribution of inlet temperature in Pareto-optimal fronts.

Figure 10.
Distribution of inlet pressure in Pareto-optimal fronts.

Figure 11.
Distribution of total inlet molar flow rate in Pareto-optimal fronts.

Table 1.
Parameters of the reference reactor.
| Parameter | Symbol | Value |
|---|---|---|
| Overall heat transfer coefficient/ | 170 | |
| Dynamic viscosity | 4 × 10⁻⁵ | |
| Catalyst bed porosity | 0.45 | |
| Catalyst pellet density | 4200 | |
| Catalyst pellet diameter/m | 0.003 | |
| Inner diameter of reactor/m | 0.030 | |
| Length of reactor/m | 3.090 | |
| Inlet temperature/K | Tin | 800 |
| Inlet pressure/bar | Pin | 7.1 |
| Inlet total molar flow rate | Ftot,in | 0.034 |
| Molar fraction of inlet H2SO4 | 0.094 | |
| Molar fraction of inlet SO3 | 0.425 | |
| Molar fraction of inlet H2O | 0.481 | |
| Molar fraction of inlet SO2 | 0.000 | |
| Molar fraction of inlet O2 | 0.000 |
Table 2.
Calculation results of each target.
| Reactor Inlet Parameters | EGR | SO2 Yield | |||||
|---|---|---|---|---|---|---|---|
| Temperature Tin(K) | Pressure | Molar Rate | |||||
| Reference reactor | 800 | 7.10 | 0.034 | 0.2316 | —— | 0.01100 | —— |
| Maximum yield | 896 | 8.97 | 0.010 | 0.7450 | 0.02395 | ||
| Minimum EGR | 893 | 8.69 | 0.027 | 0.1388 | 0.00862 | ||
| Specific EGR | 900 | 8.62 | 0.030 | 0.1446 | 0.00930 | ||
| Multi-objective optimization | 894 | 9.18 | 0.041 | 0.2111 | 0.01256 | ||
© 2020 by the authors. Licensee MDPI, Basel, Switzerland. This article is an open access article distributed under the terms and conditions of the Creative Commons Attribution (CC BY) license (http://creativecommons.org/licenses/by/4.0/).
Share and Cite
MDPI and ACS Style
Sun, M.; Xia, S.; Chen, L.; Wang, C.; Tang, C. Minimum Entropy Generation Rate and Maximum Yield Optimization of Sulfuric Acid Decomposition Process Using NSGA-II. Entropy 2020, 22, 1065. https://doi.org/10.3390/e22101065
AMA Style
Sun M, Xia S, Chen L, Wang C, Tang C. Minimum Entropy Generation Rate and Maximum Yield Optimization of Sulfuric Acid Decomposition Process Using NSGA-II. Entropy. 2020; 22(10):1065. https://doi.org/10.3390/e22101065
Chicago/Turabian StyleSun, Ming, Shaojun Xia, Lingen Chen, Chao Wang, and Chenqi Tang. 2020. "Minimum Entropy Generation Rate and Maximum Yield Optimization of Sulfuric Acid Decomposition Process Using NSGA-II" Entropy 22, no. 10: 1065. https://doi.org/10.3390/e22101065
Note that from the first issue of 2016, this journal uses article numbers instead of page numbers. See further details here.