1. Introduction
The demand for more advanced, more personalized treatments, increased availability of healthcare and an aging population are pushing the market and expanding medical device technology, especially in the area of wearables for continuous monitoring of physiological signals. These advancements require better analytic methods to extract the useful information contained in these data more accurately due to the huge amount of data generated by these devices. Entropy, an indicator for the degree of irregularity in a dynamic system, has been applied to more and more disciplines since its definition was extended to information theory in 1950s [
1]. As a nonlinear dynamic index, sample entropy (one type of entropy) is often used to measure the complexity of the physiological system in medical research for disease diagnosis and prognosis. Besides the routine detected indicators, this index can help doctors better confirm the diagnosis and prognosis, so as to provide better treatment and suggestions for patients’ rehabilitation. One of the most well-known examples is the use of entropy as an indicator of heart rate variability to evaluate cardiac sympathetic and parasympathetic functions [
2]. In addition to the widely used application in the diagnosis and prognosis of the cardiac autonomic nerve disease [
3,
4], entropy is also used in the diagnosis of diabetes [
5,
6,
7,
8,
9], chronic obstructive pulmonary disease [
10,
11,
12] and other diseases [
13]. The change of entropy values (decrease or increase) have been shown to be a predictor of multiple diseases [
3,
10,
11].
The data from signals measured by continuous monitoring devices, such as wearables [
7,
14], commonly have various degrees of missing values [
15] because of the patient’s unconscious movement, loose equipment and interference by other equipment. This issue of missing data is compounded by a study [
16] which showed that sample entropy can be highly sensitive to missing values. Once the data has missing fragments, entropy fluctuations will be large. More worrisome, the abnormal fluctuations will increase as the percentage of missing values increases [
17]. Handling missing values in the calculation of entropy is therefore imperative. Although there are a few studies to investigate the effect of missing values on the analytic results of nonlinearity including entropy [
16,
17], methods to deal with missing values have yet to be developed for the calculation of entropy.
Currently, there are two basic strategies to overcome this problem: ignoring/imputing missing values and modifying the method of calculating sample entropy [
18]. The issue is that common methods for imputing missing values may not work effectively for entropy calculation [
19]. An artificial effect will be introduced to the calculated value of entropy [
15] if missing values cannot be imputed in the same way as the distribution of the original data. In this paper, we propose a new method to improve the algorithm of calculating sample entropy on data with missing values that does not involve imputing missing values before entropy calculation. This provides a less intrusive way of handling missing values in the analysis of sample entropy for continuously monitoring physiological data since the new method does not add new data points. Thus removing the danger that the original structure of the data is compromised.
To demonstrate the utility of our proposed method, the following key questions need to be answered: Can the new method be applied to common types of continuously monitoring physiological data? Is the new method robust to the data size represented by the length of a time series? Is it robust to the scheme of generating missing values? How does the new method perform compared with existing methods? In this paper, we designed simulations based on experimental data to address these questions.
Our article is organized as follows: in the Methods section, we first introduce the definition of sample entropy and four methods of handling missing values. Then we present the datasets and the method we used to construct a sequence with missing values from the original sequence without missing values. In the Results section, we investigate the utility and applicability of our method to most common physiological signal types as well as the robustness of our method to both data size and scheme for generating missing values, as compared to the currently, commonly used methods. We conclude with discussion on the applicability and robustness of our method.
2. Methods
2.1. Sample Entropy
Sample entropy is a measure of irregularity, which was first proposed by Richman and Moorman [
20,
21]. It is defined as the negative natural logarithm of the conditional probability that two sequences similar for
m points remain similar at the next point with a tolerance
r.
Let
represent a time series of length
N. We define the template vector of length
m from
X:
and the distance function between two such vectors:
Then given a distance threshold
r, the number of (similar or matched) vectors that are within
r of the distance between the vectors
and
can be defined respectively as:
where
is defined as:
Then the probability that two vectors of length
m will match is defined as:
and the probability that two vectors of length
m+1 will match as:
Finally, we define the sample entropy as:
Pincus [
22] has proved that when the parameter
m = 2 and
r is between 0.1 ×
σ and 0.25 ×
σ, the sample entropy can retain enough information from time series and obtain effective statistical properties. Different
r can give different conditional probability estimates. We have showed that there is no percentage error difference of four methods in four types data when
r equal to 0.1 ×
σ, 0.15 ×
σ and 0.2 ×
σ (
Appendix A,
Figure A1). For different
r, the trend of percentage error fluctuating with the percentage of missing values is consistent, so the parameters we used are:
m = 2 and
r = 0.15 ×
σ, where σ is the standard deviation of a time series.
2.2. KeepSampEn, SkipSampEn, LinearSampEn and BootSampEn
The definition of sample entropy cannot be directly used on time series data containing missing values. In order to solve this problem, a common method [
16,
23] is to remove the missing values and connect the remaining points into a single time series, which we denote as SkipSampEn. Additionally, interpolation is commonly used in handling missing values [
24]. Two interpolation methods, linear interpolation and bootstrapping [
25,
26] which are denoted as LinearSampEn and BootSampEn respectively, are also addressed in our article. For the bootstrapping method, as described in Keun’s articles [
25,
26], ten reconstruction time series are generated from each time series containing missing values using bootstrapping method and the average value of entropy is obtained.
The major feature of our method, KeepSampEn, is that a new screening condition is added when
and
are calculated, which is that both
and
must contain only non-missing values. This condition not only ensures the existence of the distance function
, but also excludes the unmatched situation that
exists but
does not exist. So KeepSampEn is still the negative natural logarithm of the conditional probability
, but excludes the number of vector pairs of length
m and
m + 1 which contain missing values. This reduces the impact of missing values on the calculated value of sample entropy. In addition, in KeepSampEn, the standard deviation σ used to determine the tolerance value
r (
r = 0.15 ×
σ) is computed using only non-missing values, thus eliminating the impact of imputed values on the tolerance value. KeepSampEn is implemented in C and extended to multiscale sample entropy on the basis of mse.c from Costa et al. [
20,
27], other methods and the overall analysis are implemented in R language.
2.3. Experimental Datasets
To evaluate the utility of our methods compared with existing methods, some common types of physiological signals are investigated. Physiological signal is divided into electrical signals and non-electrical signals. Electrical signals mainly include electrocardiogram (ECG), electroencephalogram (EEG) and electromyogram (EMG) signals. Sample entropy of electrical signals can be used to measure the complexity of the nervous system (ECG corresponds to cardiac nervous system, EEG corresponds to central nervous system, EMG corresponds to motor nerves). Since the purpose of measurement (complexity of nervous system) and signal type (electrical signals) are consistent, we selected the ECG and EEG signal as a representative for analysis and speculated that our method can obtain the similar results in EMG data too. In the non-electrical signal, we chose airflow data and blood glucose data for analysis. They can measure the complexity of the respiratory and glycemic metabolic systems respectively which correspond to respiratory diseases, diabetes and complications. Due to the high cost and low representativeness, other non-electrical signals weren’t analyzed. In summary, these four types of data contain most of the physiological signals that can be used for continuous measurements, which can analyze the complexity of cardiovascular, diabetes, respiratory diseases and their complications.
For respiratory data, we used the retrospective data in a published study [
28] for one regularly treated, chronic obstructive pulmonary disease patient in Beijing Chaoyang Hospital. Specifically we used the air flow data collected from ventilators over the course of 20 nights. In one night, the 5 Hz ventilator collects around 100,000 total points. However due to common issues in data collection, some measuring points are inevitably missing. Therefore, certain sections of respiratory sequences without missing points were selected for the analysis in this paper. All glucose data were obtained from the First Affiliated Hospital of Guangzhou Medical University. Twenty patients with type 2 diabetes (10 males and 10 females) used the Glutalor (Glutalor Medical Inc, Exton, PA, USA) for blood glucose measurement. That study was conducted according to the principles of the Helsinki Declaration and all participants gave their informed consent. The device measured blood glucose automatically every three minutes over the 7-day metrical period. The ECG data were obtained from the Fantasia Database in the PhysioNet (
https://physionet.org/physiobank/database/fantasia/). Twenty young healthy subjects (21–34 years old) were selected and the original ECG sampling frequency was 250 Hz. They were measured while the study subjects were in a resting state while they were lying down. The RR interval is a time interval where two consecutive R waves crest in the ECG, and the sample entropy of it can reflect the complexity of ECG. After conversion, we obtained 20 original data series made up of RR intervals. The number of male and female subjects were equal. The EEG data were obtained from the CHB-MIT Scalp Database in the PhysioNet (
https://www.physionet.org/pn6/chbmit/). Twenty pediatric epilepsy patients (1.5–22 years old) were selected and the original EEG sampling frequency was 256 Hz. We used the first column of each EEG data for analysis. Yentes et al. [
29] found that sample entropy values stabilize around a length of 2000 points. Thus, except to verify the robustness to the impact of data size, we analyze the first 4000 points of each signals to rule out the effect of data length on the results (the length of glucose is only 2500, which is the maximum size in the dataset.). The choice of 4000 continuous points can make the shortest time series to reach 2000 points when the missing percentage reaches the maximum we set (i.e., 50%).
2.4. Scheme for Generating Missing Values
In actual practice, many situations lead to missing values. We consider two common situations: a single missing point and a group of missing points at a time. An example of the first situation is that outliers [
20,
30] must be identified and excluded in heartbeat signals before calculating sample entropy. A common example of the second situation is a disruption in the wireless or network transmission of data which may cause a group of missing values [
31,
32].
Given a continuous time series having
N points without missing values, we calculate its sample entropy. For convenience, we denote it as original entropy value. The total number of points marked as missing values is determined by the percentage of marked missing points
P. The
P values adopted in our research are 0% (baseline), 10%, 20%, 30%, 40%, 50%, respectively. We have designed two schemes to simulate the distribution of missing values: random sample marking and group-based random marking (
Figure 1), which correspond to the two common situations that create missing values in time series data respectively.
Random sample marking: In this scheme, the missing points are randomly marked in the time series. First, the count of missing values to be marked C is calculated in accordance with the specified missing percentage P multiplied by the total number N (C = P × N). Then, C positions are selected randomly from the original time series without replacement. Finally, each value on these positions is replaced by a special identifier (NA, for example, is commonly used in R) to indicate the missing values.
Group-based random marking: In this scheme, continuous missing points are seen as a group and the starting position of the group is randomly chosen. The process is displayed in
Figure 1. First, the original time series is divided into
M segments on average, where
M (
M =
P × 10 ×
I,
I = 1, 2, 3...) is determined by a tunable parameter factor
I. Second, we mark a missing group of length
N×
P÷
M for each segment, and the starting position of each group is selected randomly in the segment.
By marking some points as missing values, a time series containing missing values is generated. Then we calculate the entropy values of the generated data using the various methods and compare them with the original entropy value. The performance of a method is evaluated using percentage error defined as follows:
where
x is the entropy value of the modified time series with missing values;
is the entropy value of the original time series without missing values.
The percentage error represents the percentage of absolute deviation of the experimental entropy value with missing values from the original entropy value based on the original dataset. Thus, it can be used to evaluate the performance of a method in handling missing values. The smaller the percentage error, the better the method.
4. Discussion
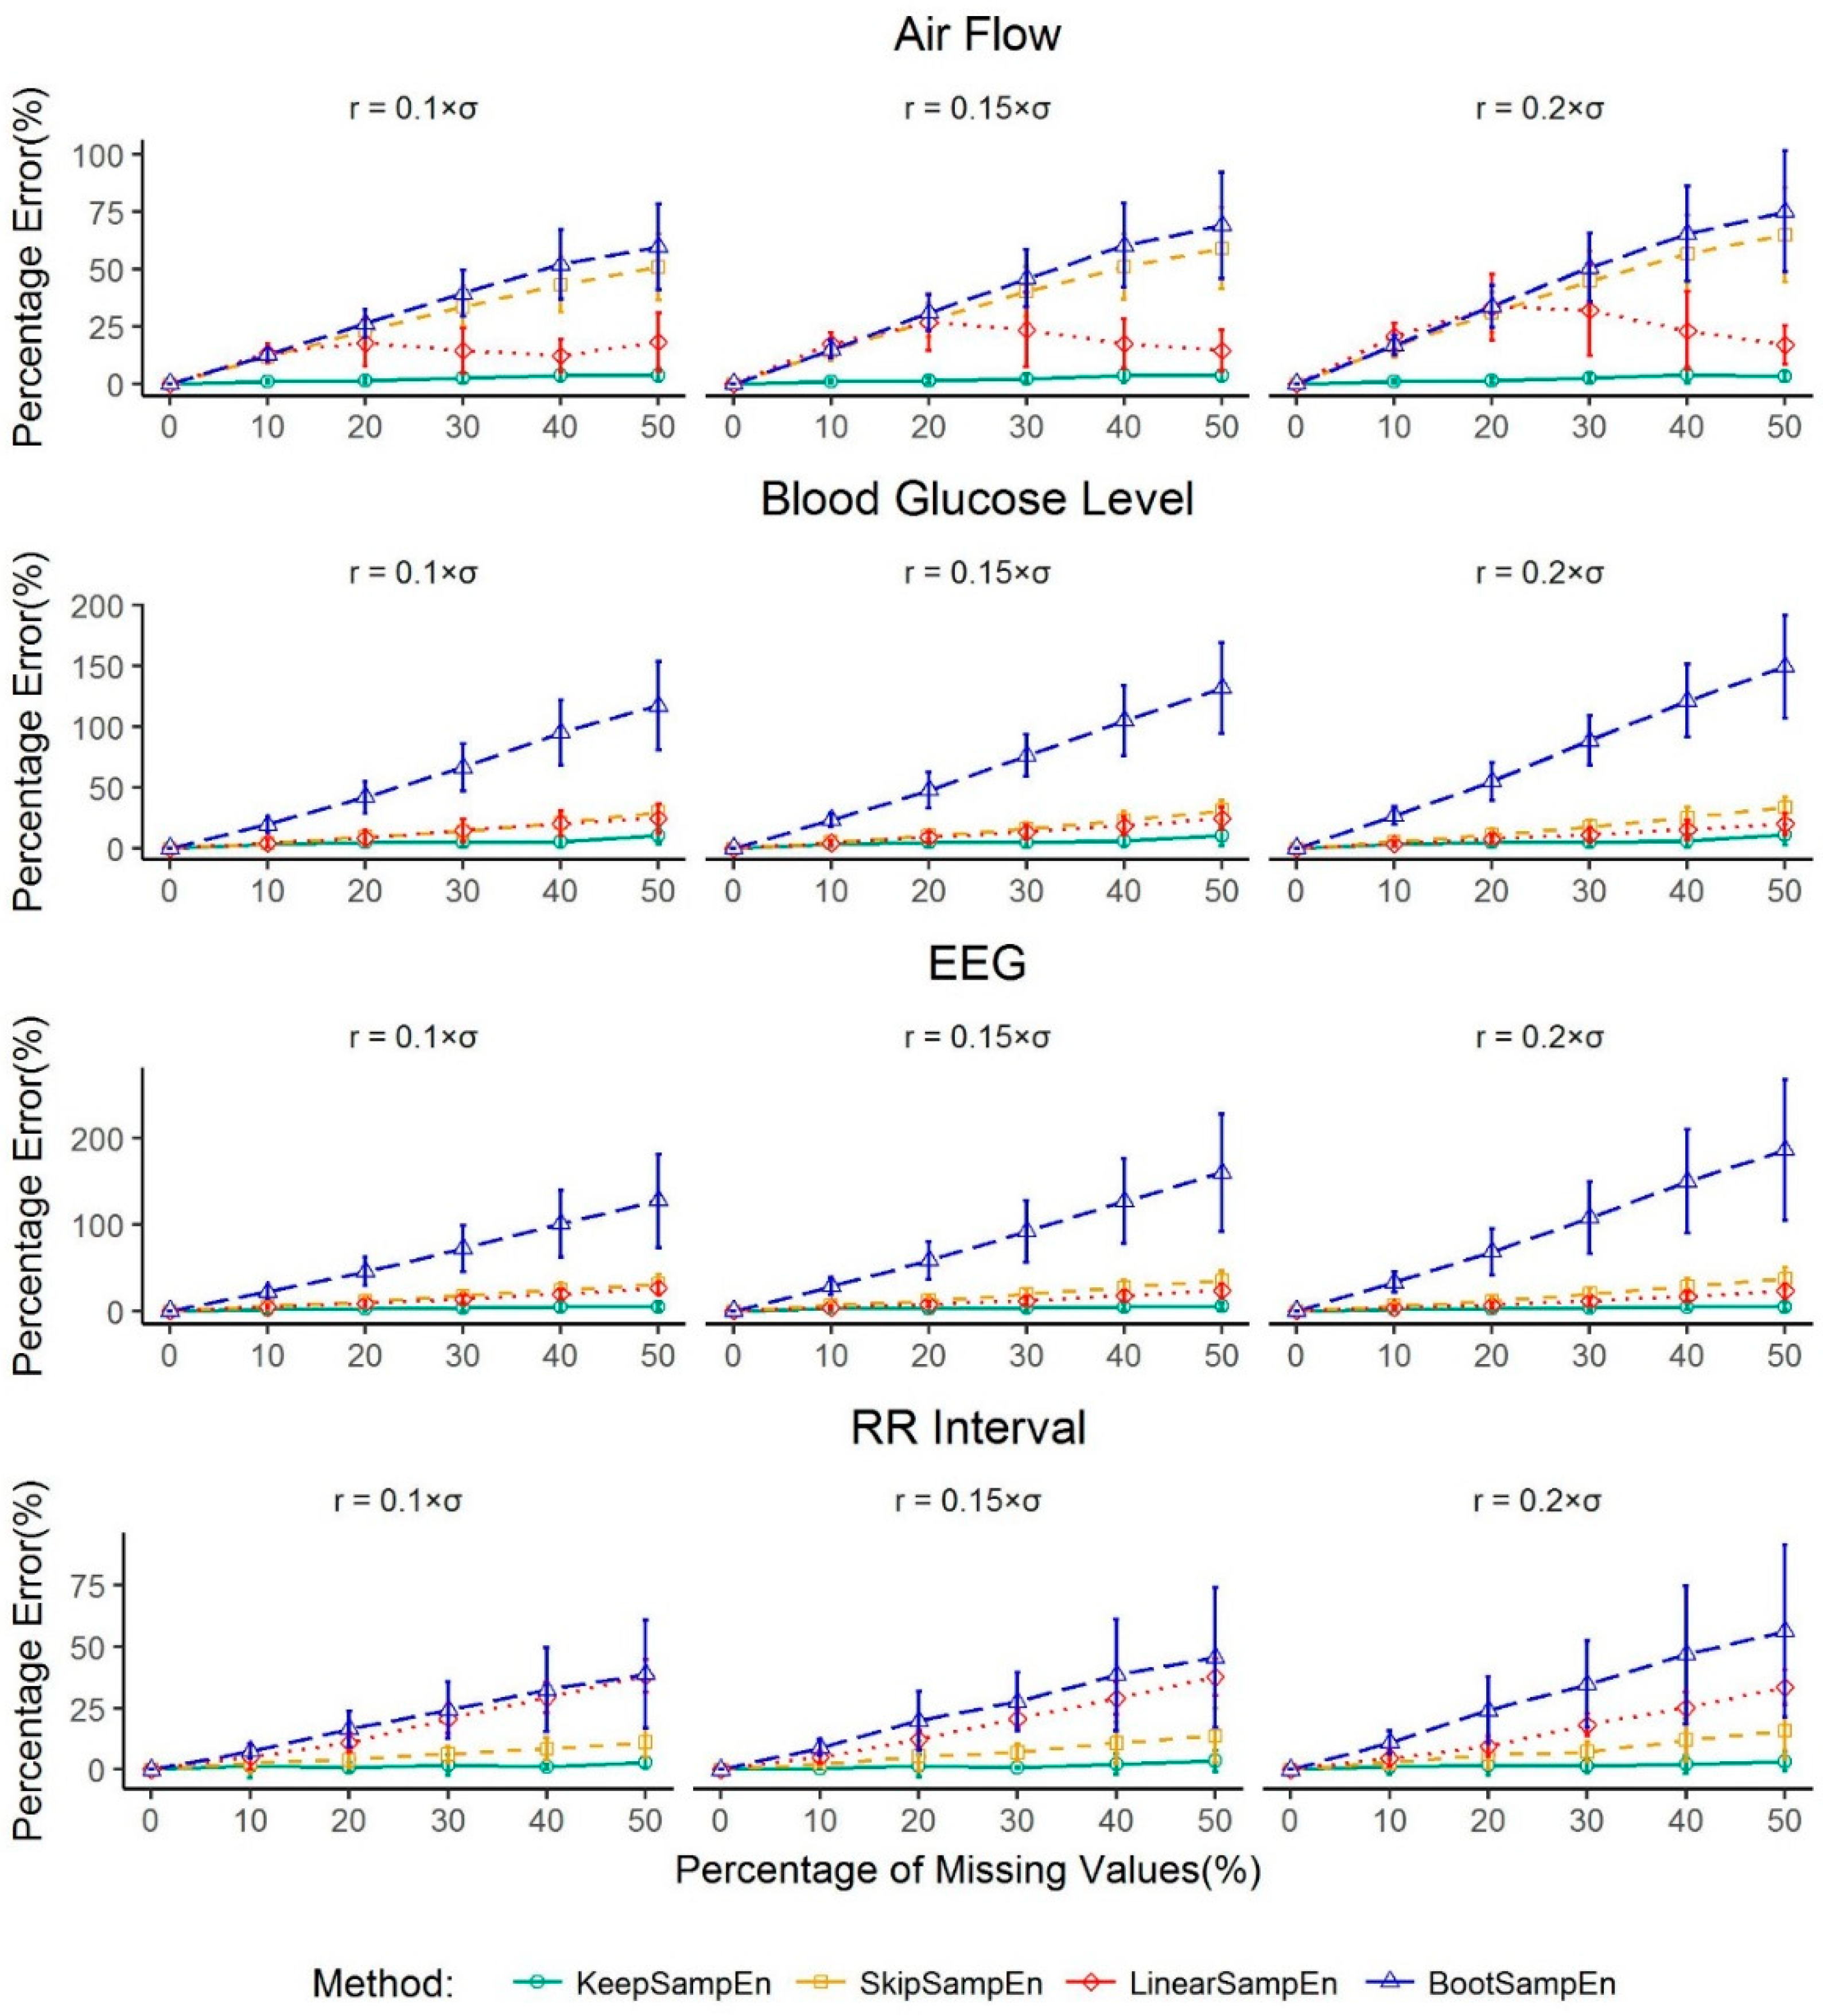
Sample entropy is a widely used metric for assessing the irregularity of physiological signals. In practice, missing values or outliers commonly exist in the data of physiological signals. If we use conventional methods (neglect/interpolation) to calculate the signal with missing values, the resulting value will have some error from the original series. In this paper, we propose a new method, KeepSampEn, to minimize the error due to missing values in sample entropy calculation. This approach is less intrusive to the structure of the original data and provides a theoretical advantage in handling missing values in the analysis of sample entropy.
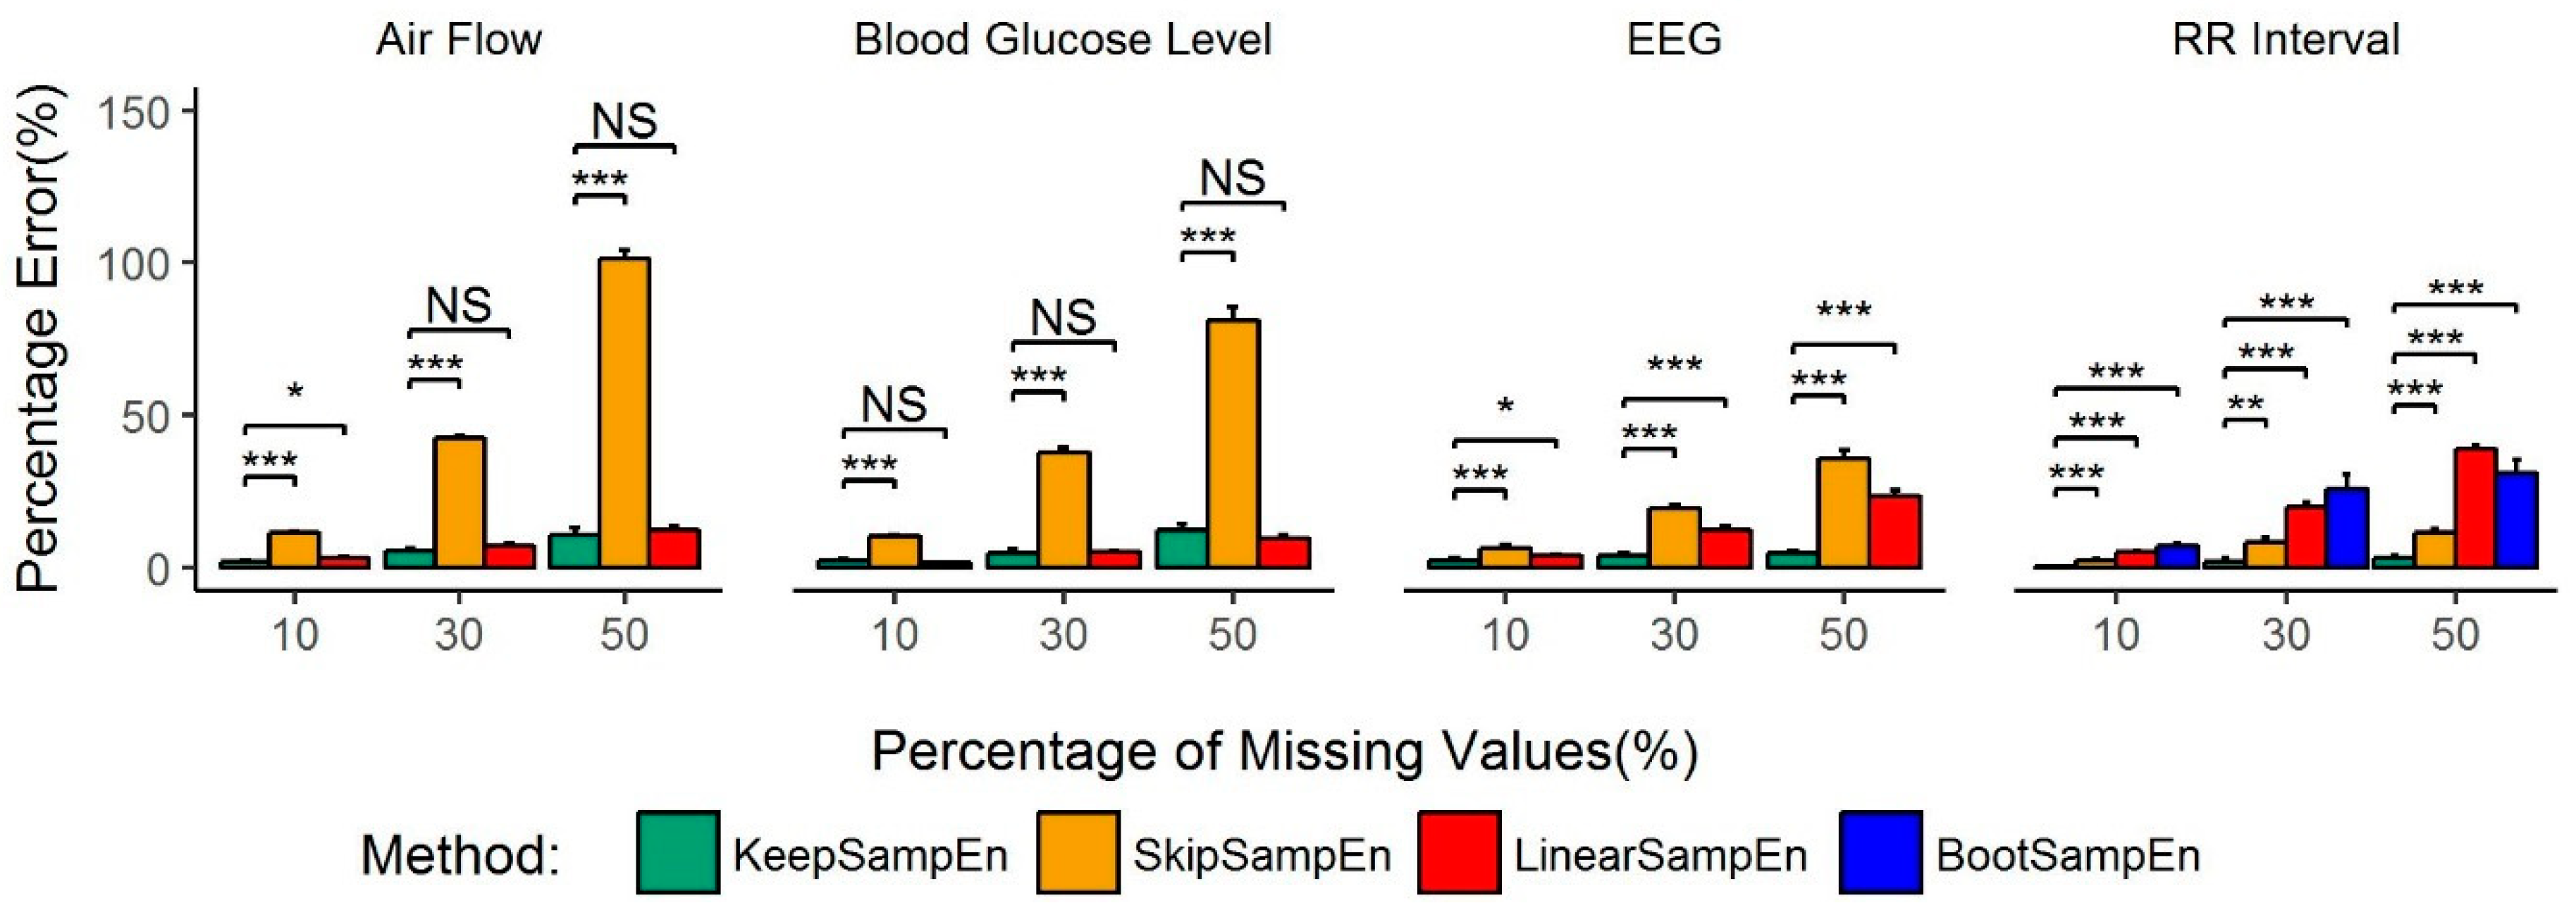
We further studied the utility, applicability and robustness of our method in practice by designing common different datasets with missing values from experimental data without missing values. This was done for most of types of physiological signals and corresponding diseases. In this paper, we use percentage error to judge the quality of various missing value processing methods. The results of our analysis demonstrate that for several common physiological data, our method can minimize the influence of missing values in the sample entropy calculation. In addition, the performance of our method is stable and robust, whereas other methods have either a poor or an unstable performance (
Figure 3).
One limitation for the use of our method is data type. We only verified that our method is suitable for ECG data, EEG data, blood glucose data, airflow data rather than all physiological data. For other electrical physiological signals such as EMG signals, we speculate that conclusion is consistent with ECG and EEG signals due to the same signal types and measurement purposes. However, if researchers want to apply KeepSampEn to other types of data, simple verification is required.
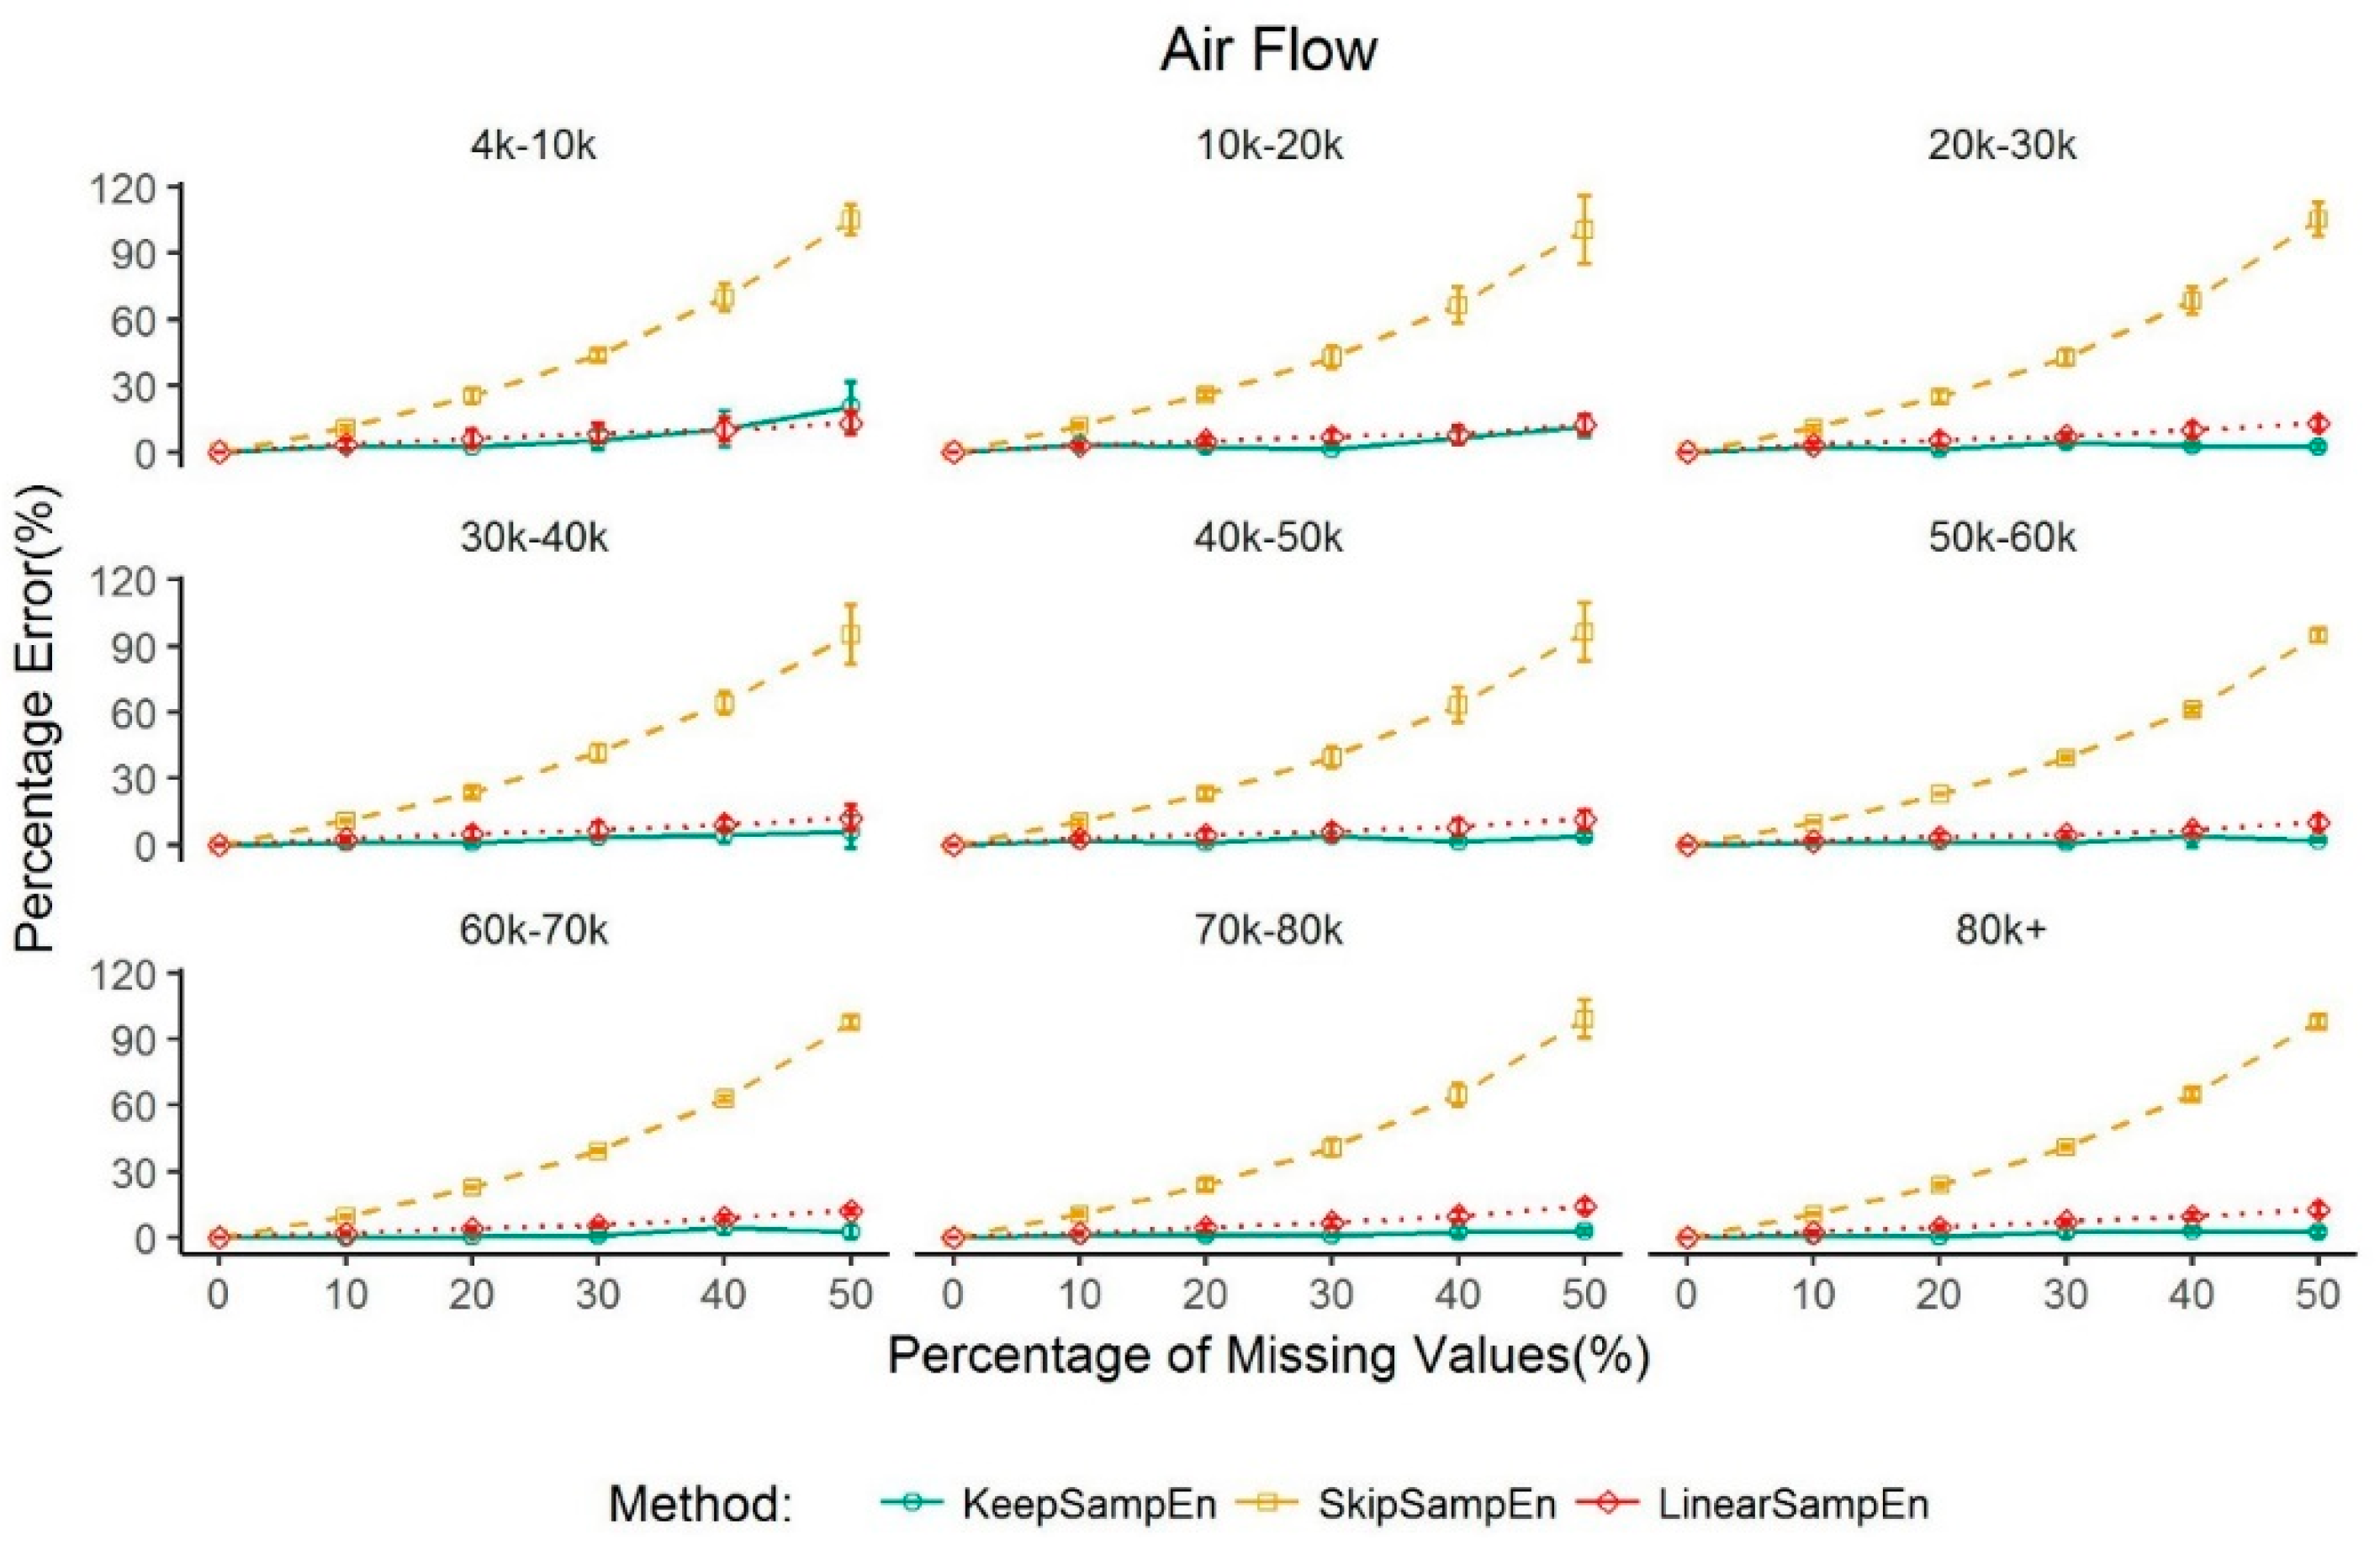
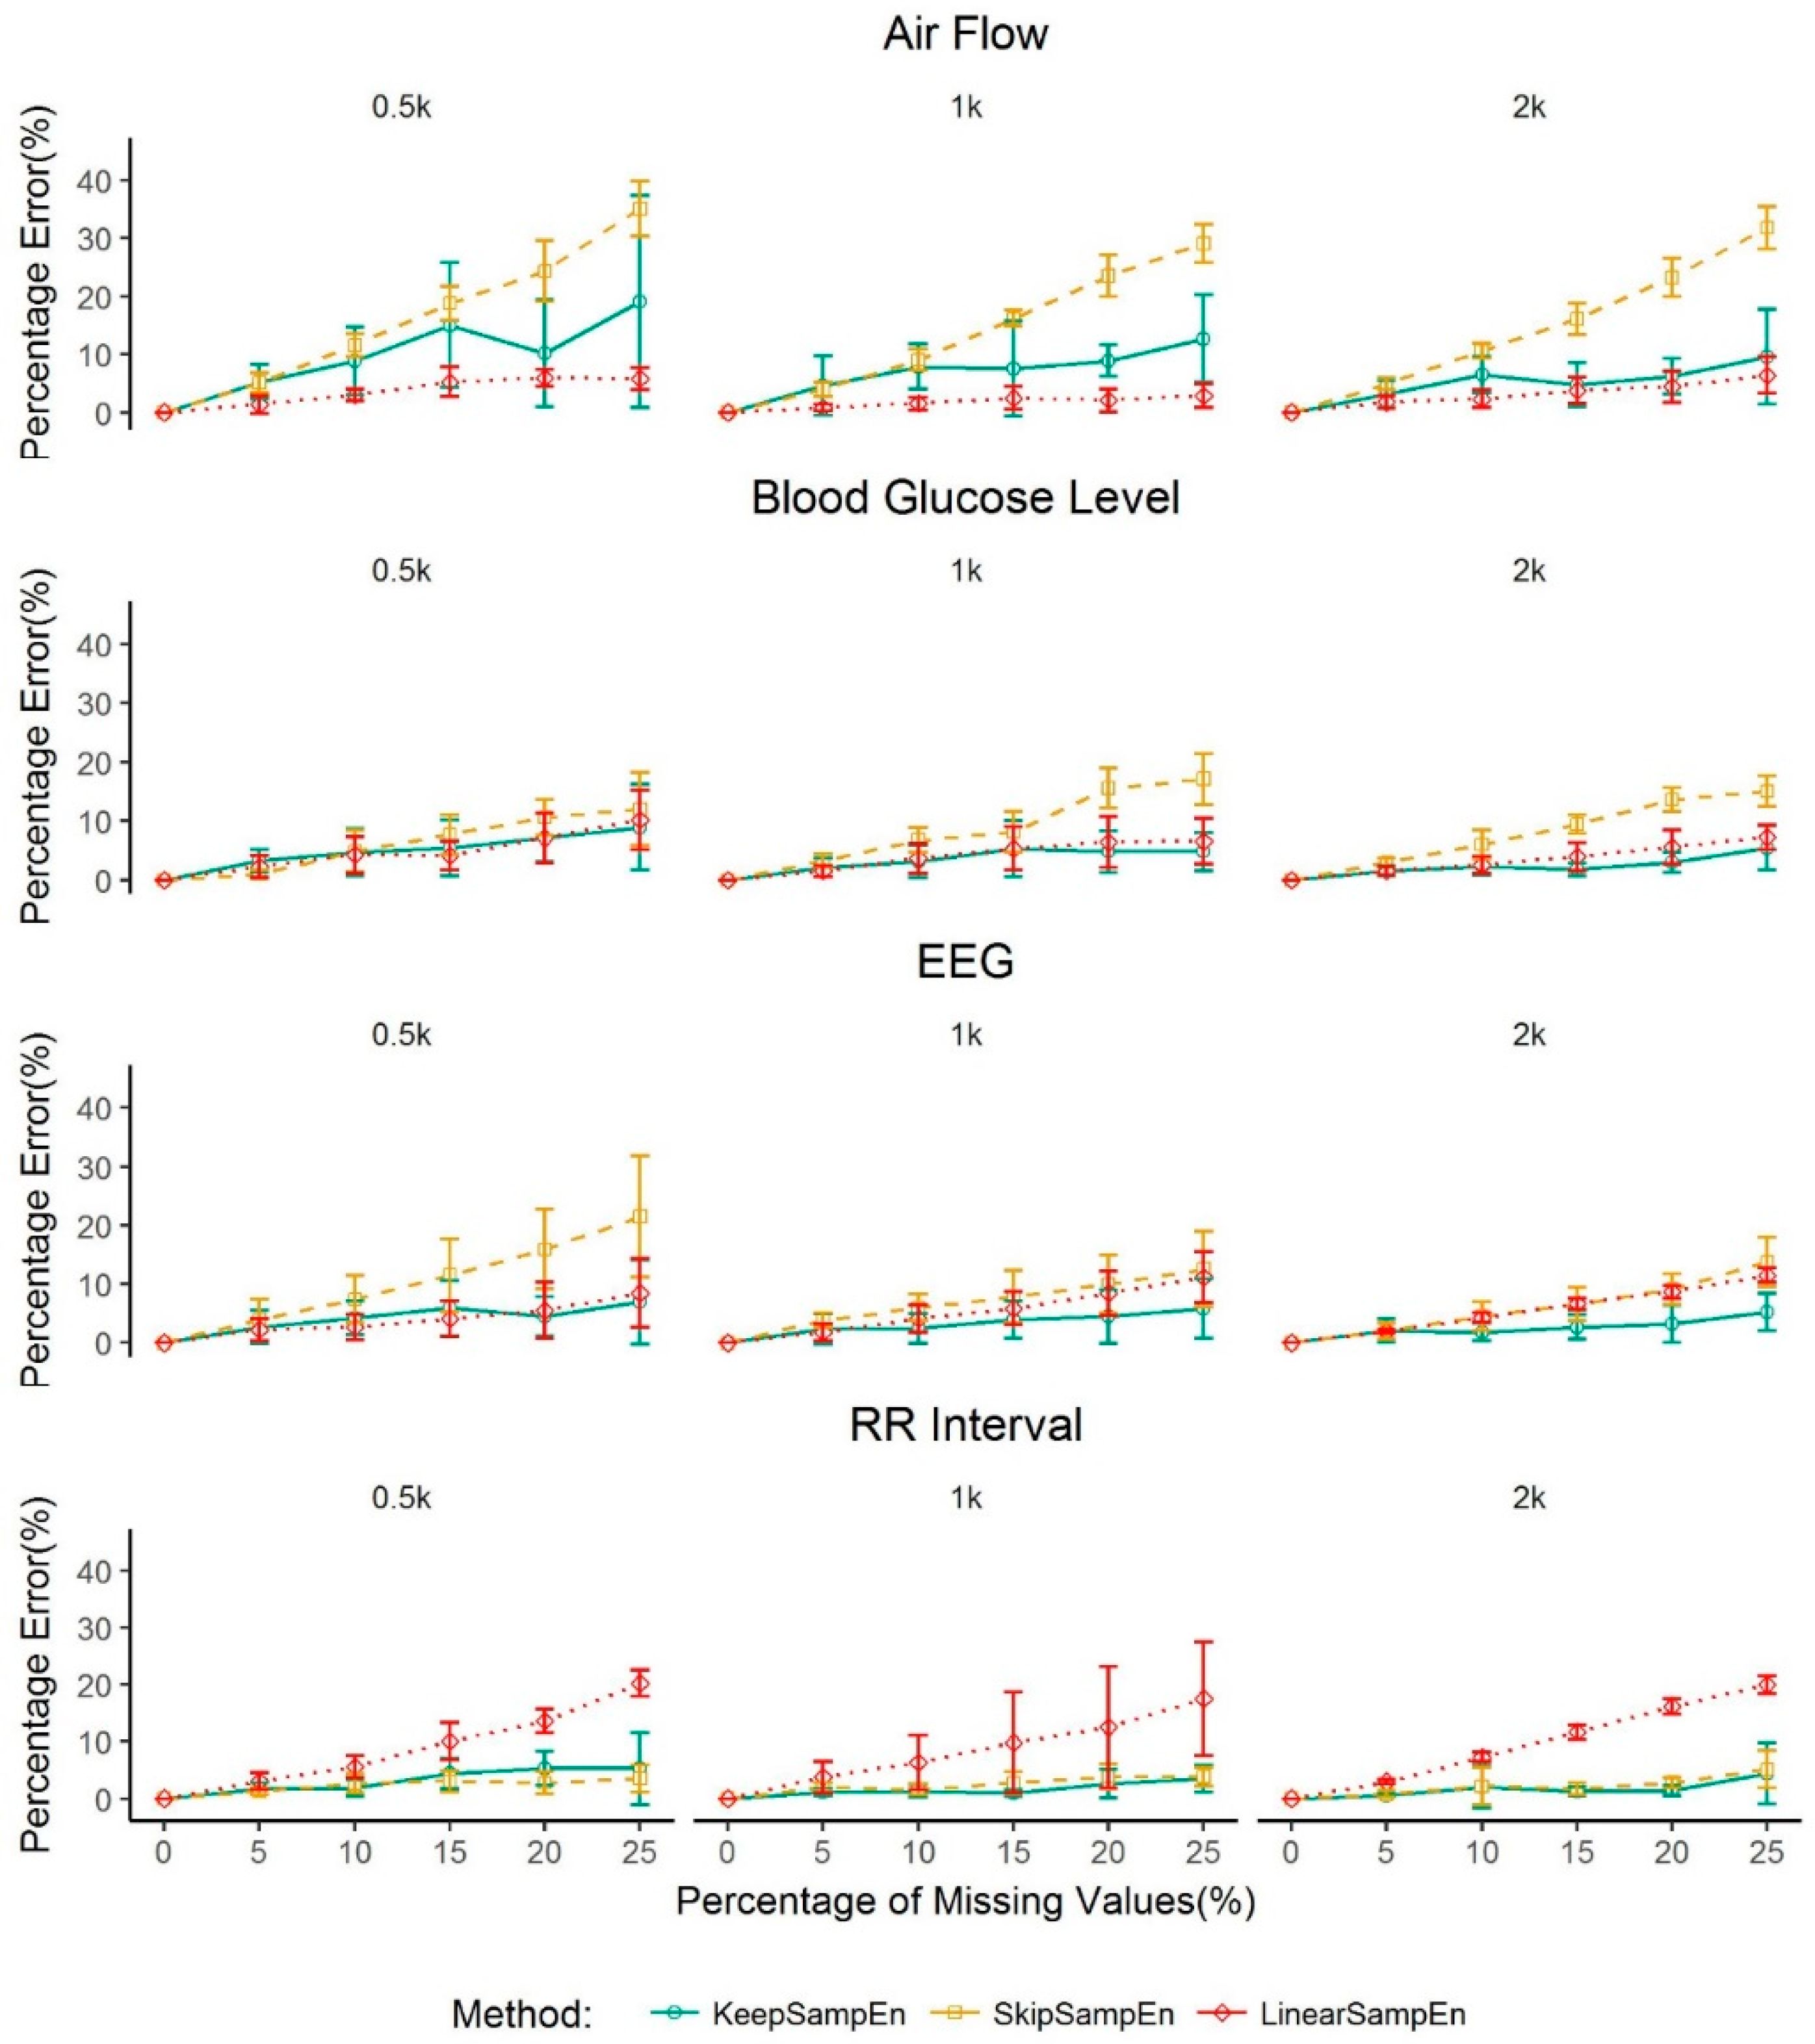
We also investigated the performance of our method in various large sizes of data. The results show that the entropy value obtained using our method is always close to the true value (i.e., the entropy value from the original data without missing values), with a percentage error less than 4.53% when the percentage of missing values is less than 30% for data sizes varying from 4000 to 80,000. We further see that the percentage error can be greater than 5% but within 15% when the percentage of missing value is above 30% but less than 50%. For a dataset with a small size (i.e., from 500 to 2000 data points), our method can control the percentage error to be less than 5% for blood glucose level, EEG and RR interval when the percentage of missing values is less than 15%. This contrasts with the entropy values obtained using other methods which greatly deviated from the true value (
Figure 4 and
Figure 5). These results may provide valuable information for data quality control in practice. That is, for the physiological signals, when a dataset has a percentage of missing values less than 30% for a large data size or 15% for a small data size of total series due to equipment or operational errors, our method can rescue the data through minimizing the impact of missing value (i.e., controlling the percentage error of the sample entropy to be less than 5%). On the other hand, if the percentage of missing values reaches 30% or more for a large data size or 15% or more for a small data size, the result of our research indicates that the calculated value of sample entropy is not reliable anymore even if we adopt the best method for handling missing values. In such a case, the data may be screened out from further analysis on sample entropy. It should be mentioned that, for air flow data, linearSampEn performs better than our method for a small dataset. However, it is easy and convenient to obtain a large dataset for air flow in real clinical settings and the size of airflow datasets is usually large in the clinical setting. Thus, we should usually not worry about the case of a small dataset of air flow. Moreover, even for air flow data, our method controls the percentage error to be less than 4.63% when percentage of missing value is 5% or less.
We further investigated whether our method will be affected by how the missing values are generated. The results indicate that our method is robust to how the missing values are generated in the continuous monitoring of physiological signals (
Figure 6).
In conclusion, our proposed KeepSampEn method has the following merits for handling missing values in the analysis of entropy for continuously monitored physiological data. First, unlike the usual ways by modifying the input data, our method keeps the input data unchanged and modifies the calculation process, which is less intrusive to the structure of original data. Second, it is effective and applicable to most common types of physiological signal data for a variety of diseases. Third, it is robust in not only how long the data is but also how the missing values are generated. This is a marked improvement over the currently used methods for handling missing values in analysis of sample entropy. With these merits, our proposed method should have broad utility in handling missing values in the analysis of sample entropy for continuously monitored physiological signals.

 ,
, 


