
Wheat Lodging Segmentation Based on Lstm_PSPNet Deep Learning Network
by
 , ,
, ,
Jun Yu
1,†,
Tao Cheng
1,†,
Ning Cai
1,
Xin-Gen Zhou
1,2,
Zhihua Diao
3,
Tianyi Wang
4,
Shizhou Du
1,5,
Dong Liang
1 and
Dongyan Zhang
1,* 1
National Engineering Research Center for Agro-Ecological Big Data Analysis & Application, Anhui University, Hefei 230601, China
2
Plant Pathology Lab, Texas A&M AgriLife Research Center, 1509 Aggie Drive, Beaumont, TX 77713, USA
3
School of Electrical Information Engineering, Zhengzhou University of Light Industry, Zhengzhou 450002, China
4
College of Engineering, China Agricultural University, P.O. Box 134, No. 17 Qinghua East Road, Haidian District, Beijing 100083, China
5
Institute of Crops, Anhui Academy of Agricultural Sciences, Hefei 230031, China
*
Author to whom correspondence should be addressed.
†
These authors contributed equally to this work.
Drones 2023, 7(2), 143; https://doi.org/10.3390/drones7020143
Submission received: 7 January 2023
/
Revised: 5 February 2023
/
Accepted: 16 February 2023
/
Published: 18 February 2023
Abstract
:Lodging is one of the major issues that seriously affects wheat quality and yield. To obtain timely and accurate wheat lodging information and identify the potential factors leading to lodged wheat in wheat breeding programs, we proposed a lodging-detecting model coupled with unmanned aerial vehicle (UAV) image features of wheat at multiple plant growth stages. The UAV was used to collect canopy images and ground lodging area information at five wheat growth stages. The PSPNet model was improved by combining the convolutional LSTM (ConvLSTM) timing model, inserting the convolutional attention module (CBAM) and the Tversky loss function. The effect of the improved PSPNet network model in monitoring wheat lodging under different image sizes and different growth stages was investigated. The experimental results show that (1) the improved Lstm_PSPNet model was more effective in lodging prediction, and the precision reached 0.952; (2) choosing an appropriate image size could improve the segmentation accuracy, with the optimal image size in this study being 468 × 468; and (3) the model of Lstm_PSPNet improved its segmentation accuracy sequentially from early flowering to late maturity, and the three evaluation metrics increased sequentially from 0.932 to 0.952 for precision, from 0.912 to 0.940 for recall, and from 0.922 to 0.950 for F1-Score, with good extraction at mid and late reproductive stages. Therefore, the lodging information extraction model proposed in this study can make full use of temporal sequence features to improve image segmentation accuracy and effectively extract lodging areas at different growth stages. The model can provide more comprehensive reference and technical support for monitoring the lodging of wheat crops at different growth stages.
1. Introduction
As one of the world’s most important food crops, wheat and its production are of great significance to ensuring global food security. For a long time, and affected by diseases and insect pests, typhoons and heavy rainfall [1,2], there have been lodging phenomena of different severity in the process of wheat planting which seriously threaten the healthy wheat production and cause severe economic losses. Rapid assessment of crop lodging areas is important for understanding the causes of lodging, yield assessment, loss estimation and agricultural research. In the monitoring of lodging, traditional methods mainly rely on manual work that is time-consuming and labor-intensive. Based on the latest information, processing technology can help accurately identify wheat collapse, provide powerful technical tools for scientific damage determination and post-disaster compensation, and provide strong support for rapidly obtaining the statistics of wheat yield. Therefore, it is of great value and significance to study nondestructive monitoring methods and technologies of wheat lodging for world food stability.
Remote sensing is a technique for acquiring information at a certain distance through specific sensors [3], and has been widely used in agricultural production in recent years. Remote sensing provides time- and space-monitoring data, and can frequently monitor the incidence, distribution and severity of lodging in large areas and different regions [4,5]. Satellite remote sensing platforms can monitor the structural and spectral properties of vegetation at different spatial and temporal scales. Some scholars have explored the application of satellite optical images in crop lodging monitoring. For example, Guan et al. proposed a lodging area estimation method based on a Sentinel 2 optimal grid unit, and a crop lodging rate using machine learning methods to overcome the limitations of traditional pixel-based mapping methods that cannot obtain quantitative lodging information [6]. In recent years, multi-source satellite remote sensing data have been continuously enriched. Synthetic aperture radar (SAR) can achieve high-resolution synthetic aperture microwave imaging coverage and all-weather capabilities, and can perceive highly sensitive crop structure changes well [7,8]. The Sentinel 1A can continuously provide C-band SAR images (in all weather and all day) with two microwave channels. The revisiting period is 12 days, and the coverage is 250 km. Shu et al. [9] used Sentinel 1A data before and after the dual-polarization development change detection method to calculate the lodging angle and monitor the lodging area in maize using plant height. Although some researchers mainly use the single polarization and dual polarization of Sentinel 1 to solve the problem of crop lodging, some researchers use the multi-configuration (multi-polarization and multi-incident angle) data of RADARSAT-2 [10,11]. In their study, the authors found that polarization ratios (especially those based on odd/even scattering) are sensitive in distinguishing lodging and non-lodging regions. However, each satellite platform contains a fixed revisit cycle, sometimes resulting in satellite-based data that cannot provide timely data for crop lodging assessment.
In recent years, with the rapid development of UAV platforms and information processing technology, UAVs have played an increasingly important role in agricultural monitoring. With the advantages of low cost, high efficiency and high flexibility, UAVs have been widely concerned and rapidly promoted and applied in precision agriculture. At present, many studies use RGB images combined with machine learning methods to extract lodging information and area [12,13]. RGB images contain three bands of red, green and blue data. Zhao Jing et al. [14] used a UAV remote sensing platform to obtain RGB visible light images after wheat lodging, extracted the digital surface model (DSM) image, calculated the overgreen vegetation (EXG) index, and obtained the DSM + RGB fusion image and the DSM + EXG fusion image. The maximum likelihood method and the random forest method were used to supervise and classify the two feature fusion images and extract the wheat lodging area. It was found that the DSM + RGB feature fusion image had the highest accuracy in extracting the wheat lodging area, with an accuracy of 93.75%. Li Guang et al. [15] extracted two single features of wheat lodging based on UAV RGB images, constructed the comprehensive features of lodging information, combined them with a K-means algorithm to construct a multi-temporal lodging area extraction method, and obtained a lodging recognition model with good generalization ability. Chauhan et al. used UAV multispectral images to classify lodging wheat with different severity by using a multi-resolution segmentation (MRS) algorithm and a nearest neighbor classification algorithm. They found that red and near-infrared band data can effectively distinguish different categories with an overall accuracy of 90% [16]. Cao et al. proposed a hybrid algorithm based on a watershed algorithm and adaptive threshold segmentation to extract wheat lodging, which is better than a single watershed algorithm [17]. The recognition accuracy of machine learning technology applied to UAV lodging monitoring is high, but its practical application is more complicated, and it is necessary for experts to select certain features.
Compared with traditional machine learning methods, deep learning is different in that it uses a feature extraction layer to accomplish automatic feature extraction. More and more scholars are beginning to use deep learning for lodging monitoring of UAV. New information processing technology plays an increasingly important role in image classification, target detection, and image segmentation using its efficient deep learning algorithms. Many scholars have conducted a lot of research on crop lodging monitoring based on UAV remote sensing technology and deep learning methods. Zhao et al. used the Unity Networking (Unet) network to extract the lodging area of late mature rice, and the dice coefficient reached 0.9442 [18]. Yang et al. used the FCN-AlexNet network to construct an extraction model suitable for rice lodging, and the extraction accuracy reached 94.43%, which was better than traditional machine methods such as the maximum likelihood method [19]. For the extraction of corn lodging area, Zheng et al. achieved an extraction accuracy of a corn lodging area of 88.65% based on the FCN8s network of VGG16 [20]. In addition, besides applying existing deep learning models, it is also an important that research is directed at improving existing models and constructing new models for high-precision estimation of specific crop lodging. For sunflower lodging monitoring, Song et al. improved the semantic segmentation network SegNet by adding skip connections, separable convolutions and conditional random fields on the basis of the original network, resulting in an accuracy of 89.8% in extracting fall; this accuracy is better than that of support vector machines (SVM), fully convolutional networks (FCN) and the original SegNet [21]. Deep learning has achieved some research results in the lodging extraction of various crops, but it has just started, and more research is urgently needed to serve practical applications. Regarding wheat lodging, most researchers have conducted wheat lodging extraction based on a single growth period, while little research has been conducted on multiple growth periods. Based on UAV remote sensing data, Zhao et al. used a convolutional neural network to construct an extraction model for two growth stages of wheat at early filling and maturity, and the average accuracy reached 89.23% [22]. Zhang et al. [23] automatically extracted wheat lodging regions based on transfer learning and a deepLab v3+ network for five fertility stages: early flowering, late flowering, filling, early maturity, and late maturity, achieving 90.7%, 87.6%, 88.8%, 92.3%, and 91.3% extraction accuracy, respectively. However, these studies only used the characteristics of each growth stage for segmentation, and did not consider that lodging information could be transmitted between different growth stages of crops in the process of temporal sequence image segmentation. When extracting the lodging information from the images of one crop growth period, the segmentation and classification accuracy of the crop’s lodging period can be improved based on the segmentation and classification information of the crop images in other periods.
The main conclusions of this study were as follows: (1) Based on UAV images, and on the basis of improving the existing deep learning methods, a lodging information extraction model is proposed which can couple the image features of a wheat multi-growth period; (2) The feasibility of the method proposed in this study for monitoring lodging information during multiple growth periods of wheat is explored.
2. Materials and Methods
2.1. Field Trial
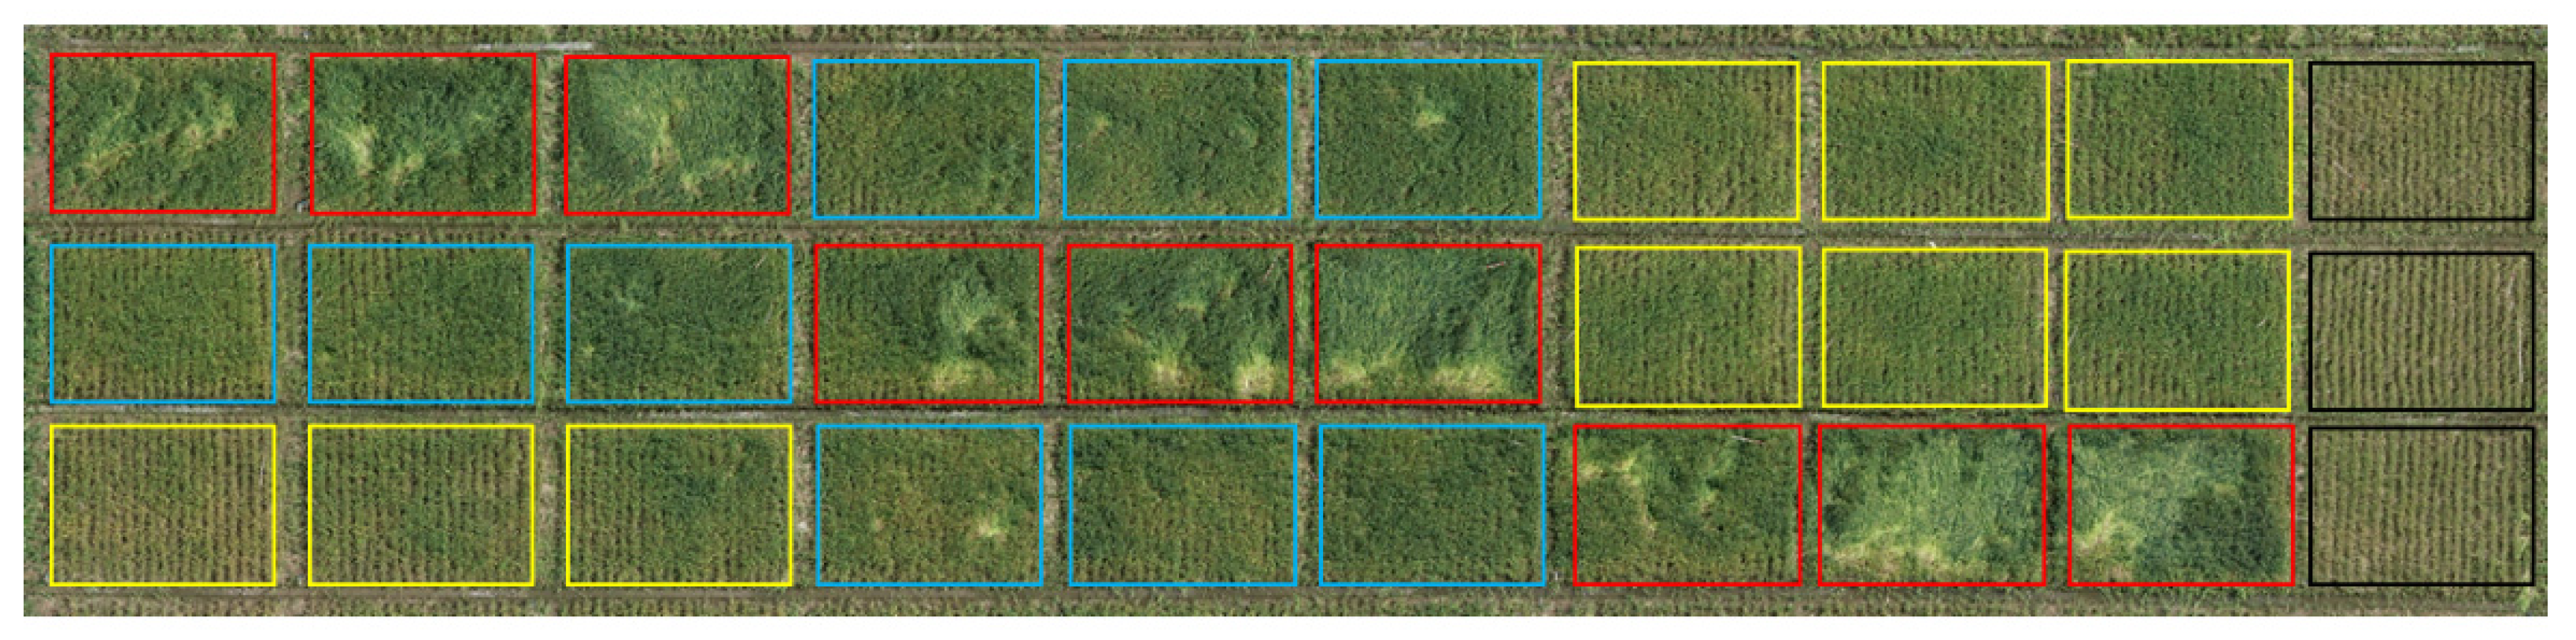
A field trial was conducted at the Baihu Farm in Lujiang County, Hefei City, Anhui Province, China (117°27′ E, 31°13′ N) in the 2018–2019 cropping season. The area had a subtropical monsoon climate, with an annual average temperature of 13–20 °C and an annual precipitation of 800–1500 mm, which was suitable for wheat production. Wheat (cv. Ningmai 13) was planted in 30 plots each with the size of 3 × 4 m. This study consisted of four base nitrogen application treatments, 0 kg/ha (black box), 120 kg/ha (yellow box), 180 kg/ha (blue box), 240 kg/ha (red box) (Figure 1). Phosphorus and potassium fertilizers are applied at planting at the same rates of P2O5 120 kg/ha and K2O 120 kg/ha. Topdressing was carried out at the wheat reviving stage.
2.2. Data Collection and Preprocessing
In this study, the UAV images and ground lodging area information were collected at the different stages of wheat growth in 2019. The UAV images were acquired at the stages of early flowering (April 20), late flowering (April 24), filling (May 1), early maturity (May 9), and late maturity (May 18). The image data were acquired by DJI 4pro (DJI Innovation Technology, Shenzhen, China) in parallel with the ground lodging survey. The flight height and speed were set at 20 m and 3 m s-1, respectively. The resolution of a single RGB image was 5472 × 3648 pixels. The spatial resolution at this altitude was 0.5 cm/pixel. DJI GS Pro software was used for the flight route design of the UAV. Both forward and side overlapping of the RGB image were set at 80%. The shooting interval of visible light camera was set at 2 s. A total of 223 RGB original images were obtained from five camera shots.
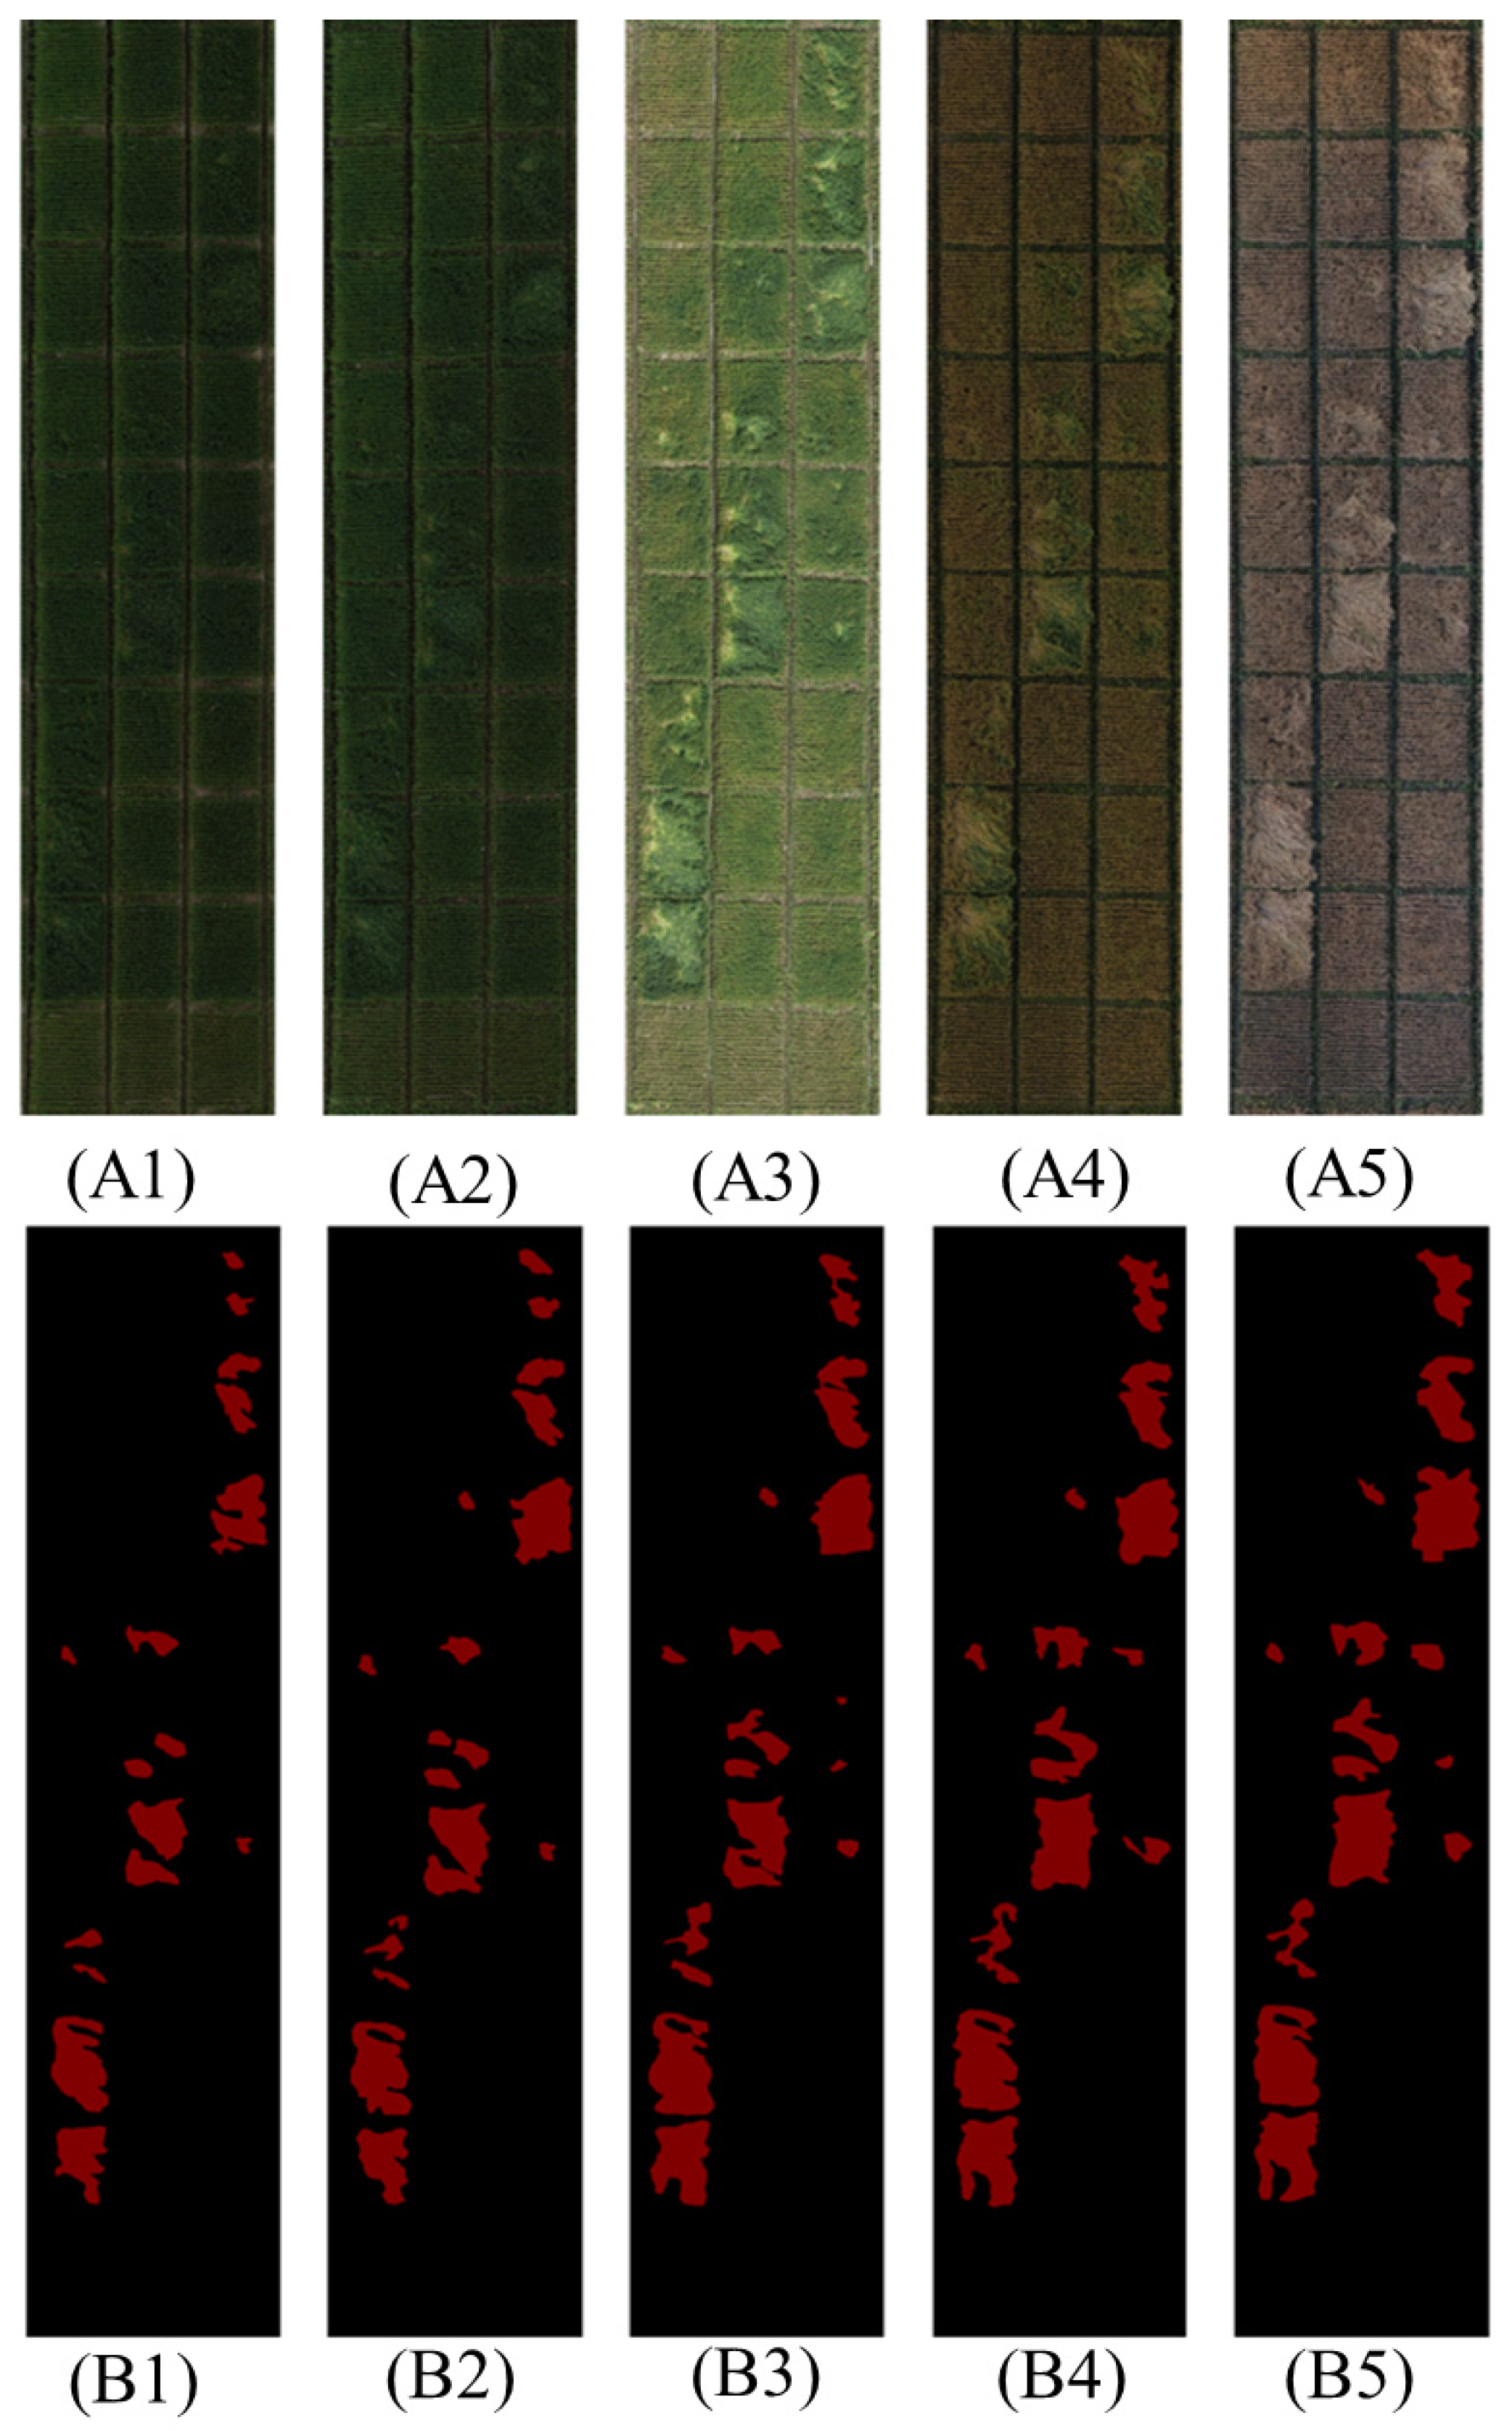
The GPS points were collected by Tianbao R2 (Trimble, Stuttgart, Germany) and used to make geometric corrections with an error of 2 cm or less. Photoscan (Agisoft, St. Petersburg, Russia) software was used to mosaic UAV images, and control points were added in the middle to complete geometric correction. The UAV images from the five wheat growth stages were obtained. The experimental area was cut out, and five RGB images with a size of 2304 × 10,000 pixels were obtained, as shown in Figure 2. The color and brightness of the observed wheat canopy images differed due to the different growth states of wheat at different growth stages.
The lodging area data were obtained based on the visible image of the UAV, acquired using Labelme software (CSAIL, Boston, MA, USA), by manually extracting the wheat lodging areas in the images with the guidance of agronomic experts.
2.3. Data Augmentation
For the pre-processed image data in the study area, slide window was performed at an interval of 468 pixels, that is, the image size was 468 × 468, and a total of 2400 RGB images were obtained. By randomly inverting, rotating, adding noise and filtering the raw data, the data are enlarged. The number of images in each group was increased to 7200, and the data were packed according to a time slice of five photos (each field was arranged according to five periods respectively) divided into 1440 groups and divided into training and test sets according to a 4:1 ratio. To avoid data imbalance between the training set and validation set caused by the differences in illumination and growth trend of UAV image data at a single growth stage, the data of each time slice were randomly disrupted and randomly extracted to form the training dataset and validation dataset. For the PSPNet model, the enlarged image can be divided in a ratio of 4:1.
For further comparative analysis of the network model, sliding Windows of other sizes were used in this study for comparison, respectively 156 × 156,312 × 312,624 × 624. The datasets’ production processes were the same as above.
2.4. Construction of a Novel Extraction Method for Wheat Lodging Information
The PSPNet network is proposed as a deep learning network to deal with segmentation problems at different scales. The network is characterized by the introduction of the pyramid pooling module (PPM), which deeply analyzes the high-dimensional feature layer with rich semantic information so that the global and local connections of the feature layer work together in the final prediction, which can improve the image segmentation quality [24]. Due to many practical problems, it is difficult to obtain high-quality data, so PSPNet has a good application in many fields, such as bridge crack monitoring [25,26], mural segmentation [27,28], remote sensing image segmentation, and so on [29,30,31]. However, in the field of crop inversion extraction, there are few studies based on using PSPNet to extract crop inversion information. The PSPNet network is suitable for scenarios in which the lodging dataset is complex and the lodging area varies in size. Although the PSPNet network model can fuse enough deep features, the shallow features are insufficient [32]. For UAV images with rich details and features, only analyzing high-dimensional features in the parsing process will inevitably cause details in the image to be lost, resulting in blurred segmentation edges [33,34].
The RGB image data obtained by the UAV are characterized by a high pixel count and many detailed features. To obtain a better segmentation effect, the segmentation model needs to take into account both the depth resolution of a single feature layer and the utilization of different dimensional features. In order to obtain a more suitable model for wheat lodging information extraction, this study combined the ConvLSTM timing sequence model, and inserted the convolutional attention module (CBAM) and the Tversky loss function to improve the PSPNet model.
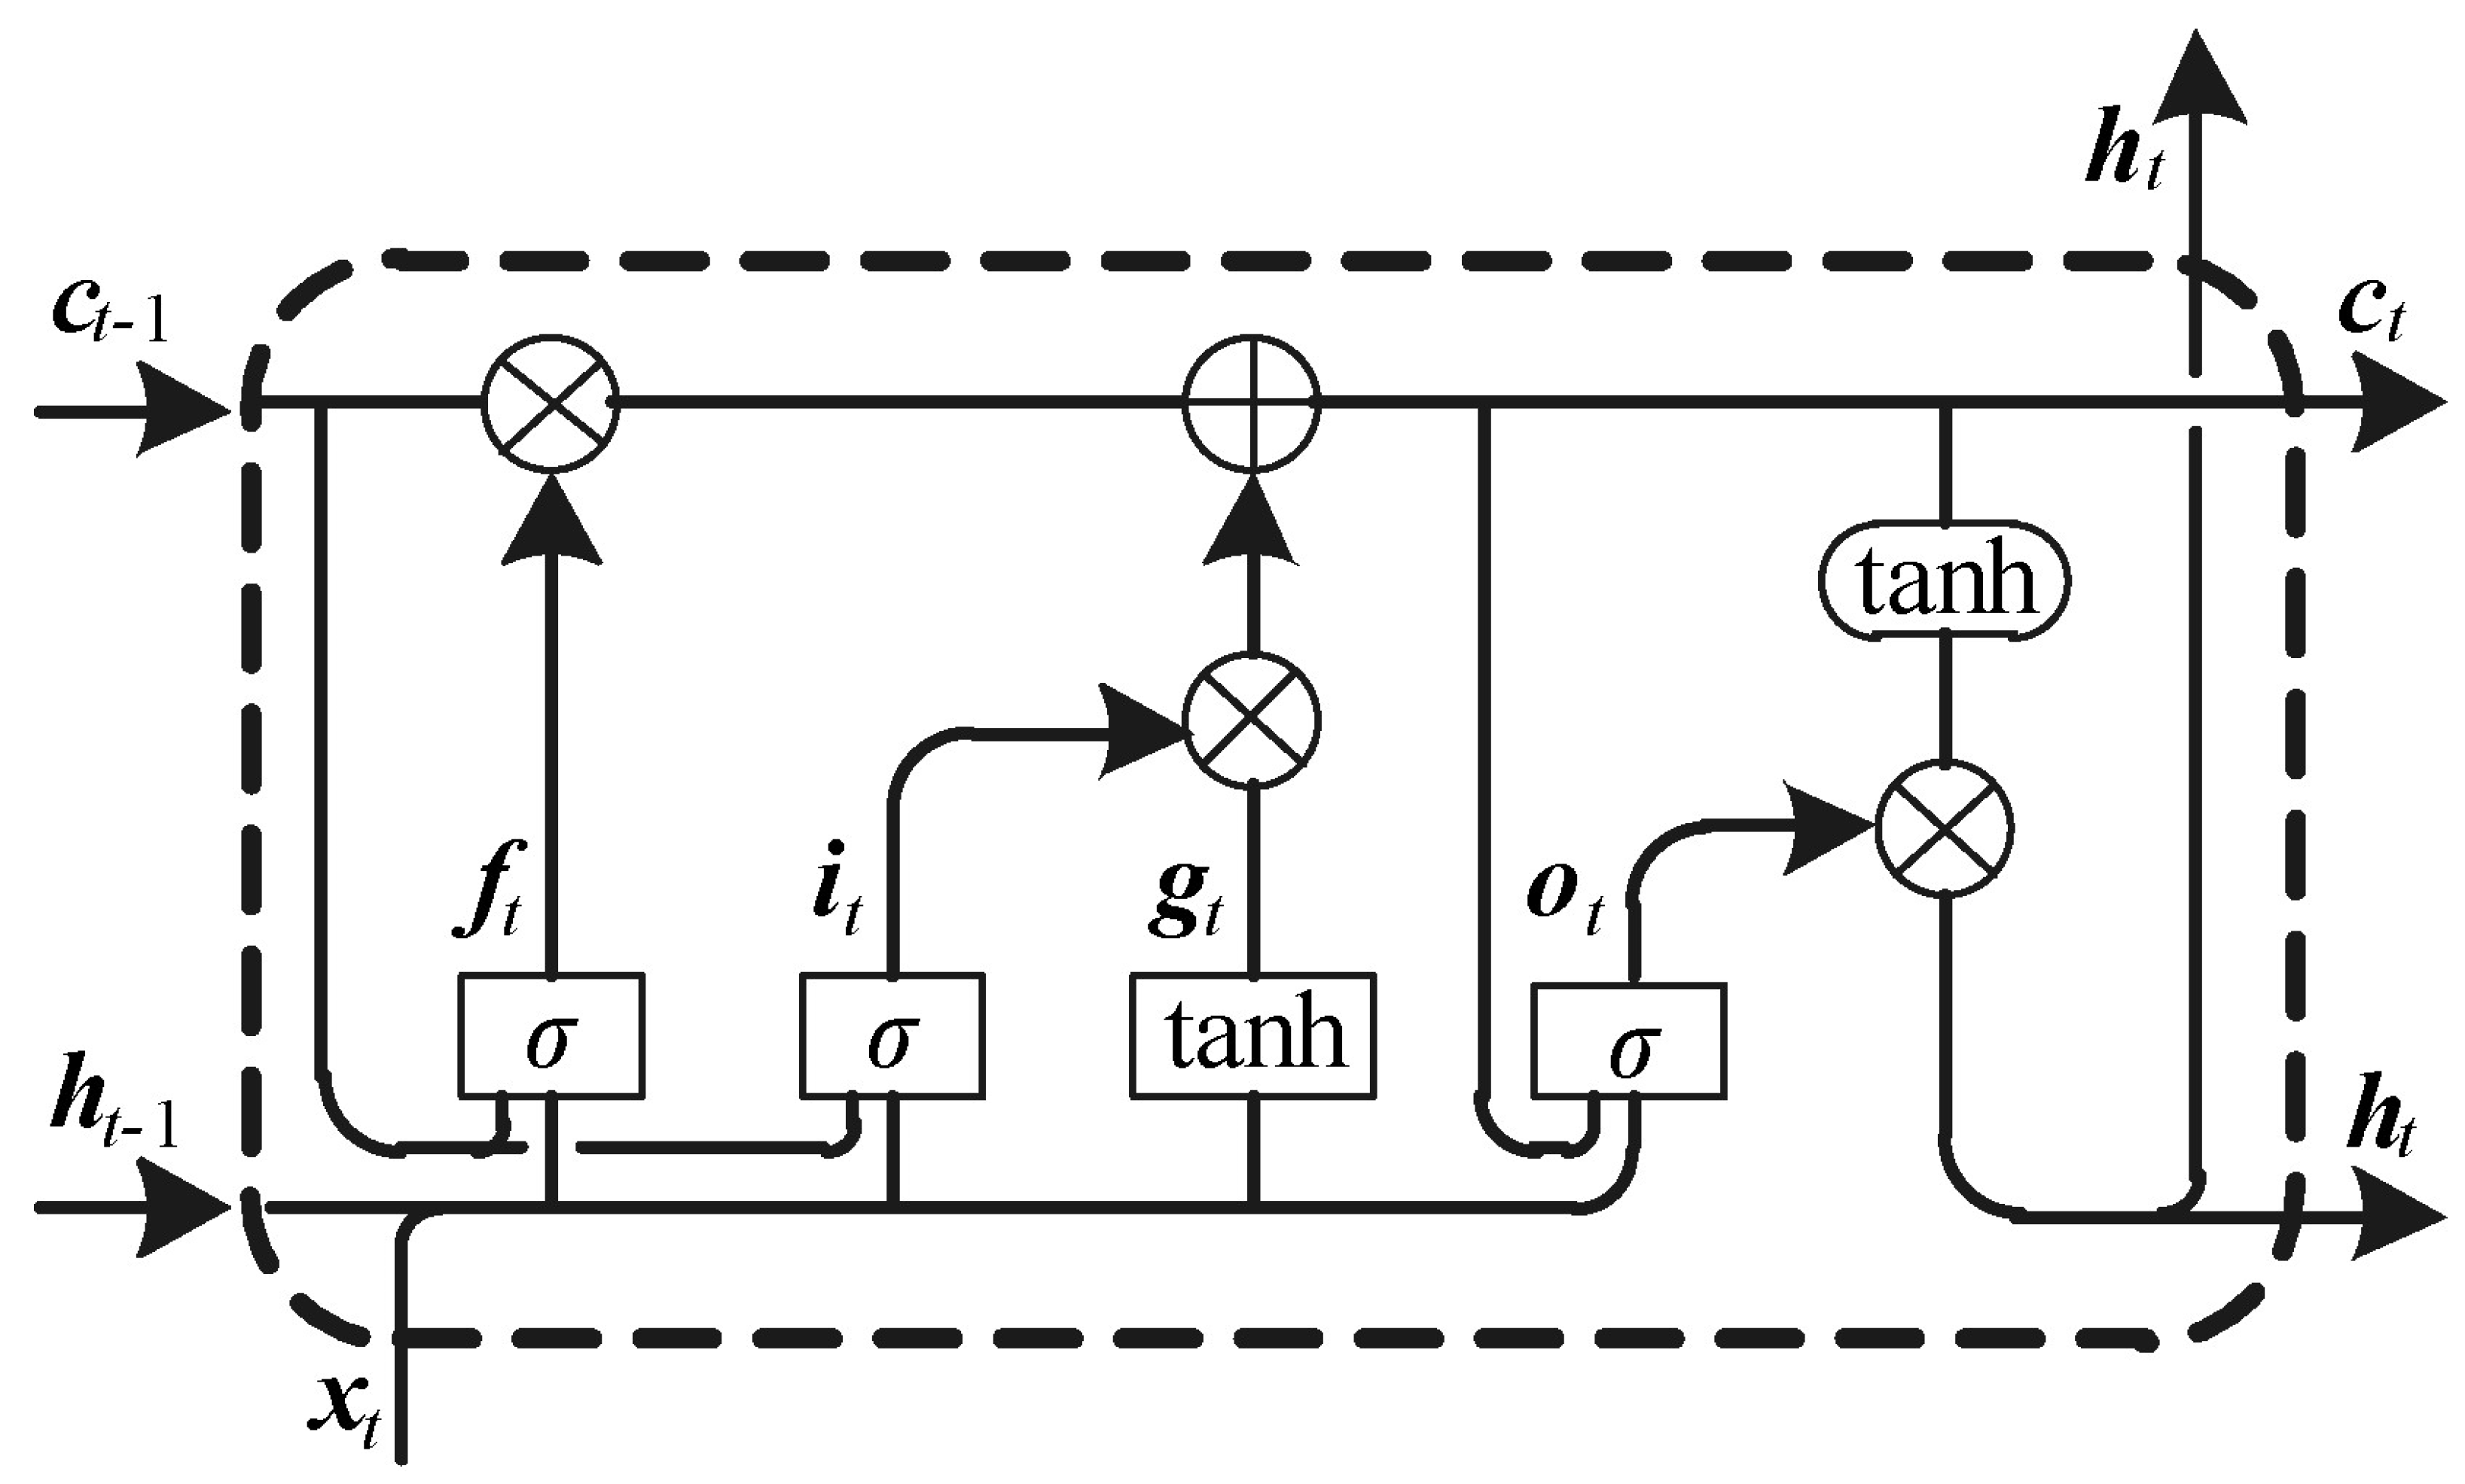
LSTM (long short term memory) is a neural network capable of memorizing long and short term information, solving the problem of feature coverage due to the excessive length of the network. It extracts the image’s information features in a similar manner to the extraction of sequence features in order to extract the image’s contextual information. ConvLSTM is a temporal series model applied to two-dimensional images [35]. Its core essence is the same as LSTM, which takes the output of the previous layer as the input of the next layer. The difference is that after adding the convolution operation, not only can the temporal series relationship be obtained, but the features and spatial features can also be extracted, much like the convolution layer. The switching between states is also replaced by convolution calculations.
where the subscript t represents the t step of ConvLSTM; xt represents the input data; and ht indicates hidden status. ct represents the state of the storage unit; and it, ft and ot are the input, forget and output doors of ConvLSTM, respectively. W and b are weights and biases that need to be learned; *, , and respectively, are the convolution operation, elements’ multiplication, Sigmoid function and function. Here, xt, ct, ht, it, ft and ot are all three-dimensional tensors, and convolution operation is used during state-to-state transition and input-to-state transition so as to retain the spatial information of wheat lodging characteristics. The internal structure of the ConvLSTM is shown in Figure 3.
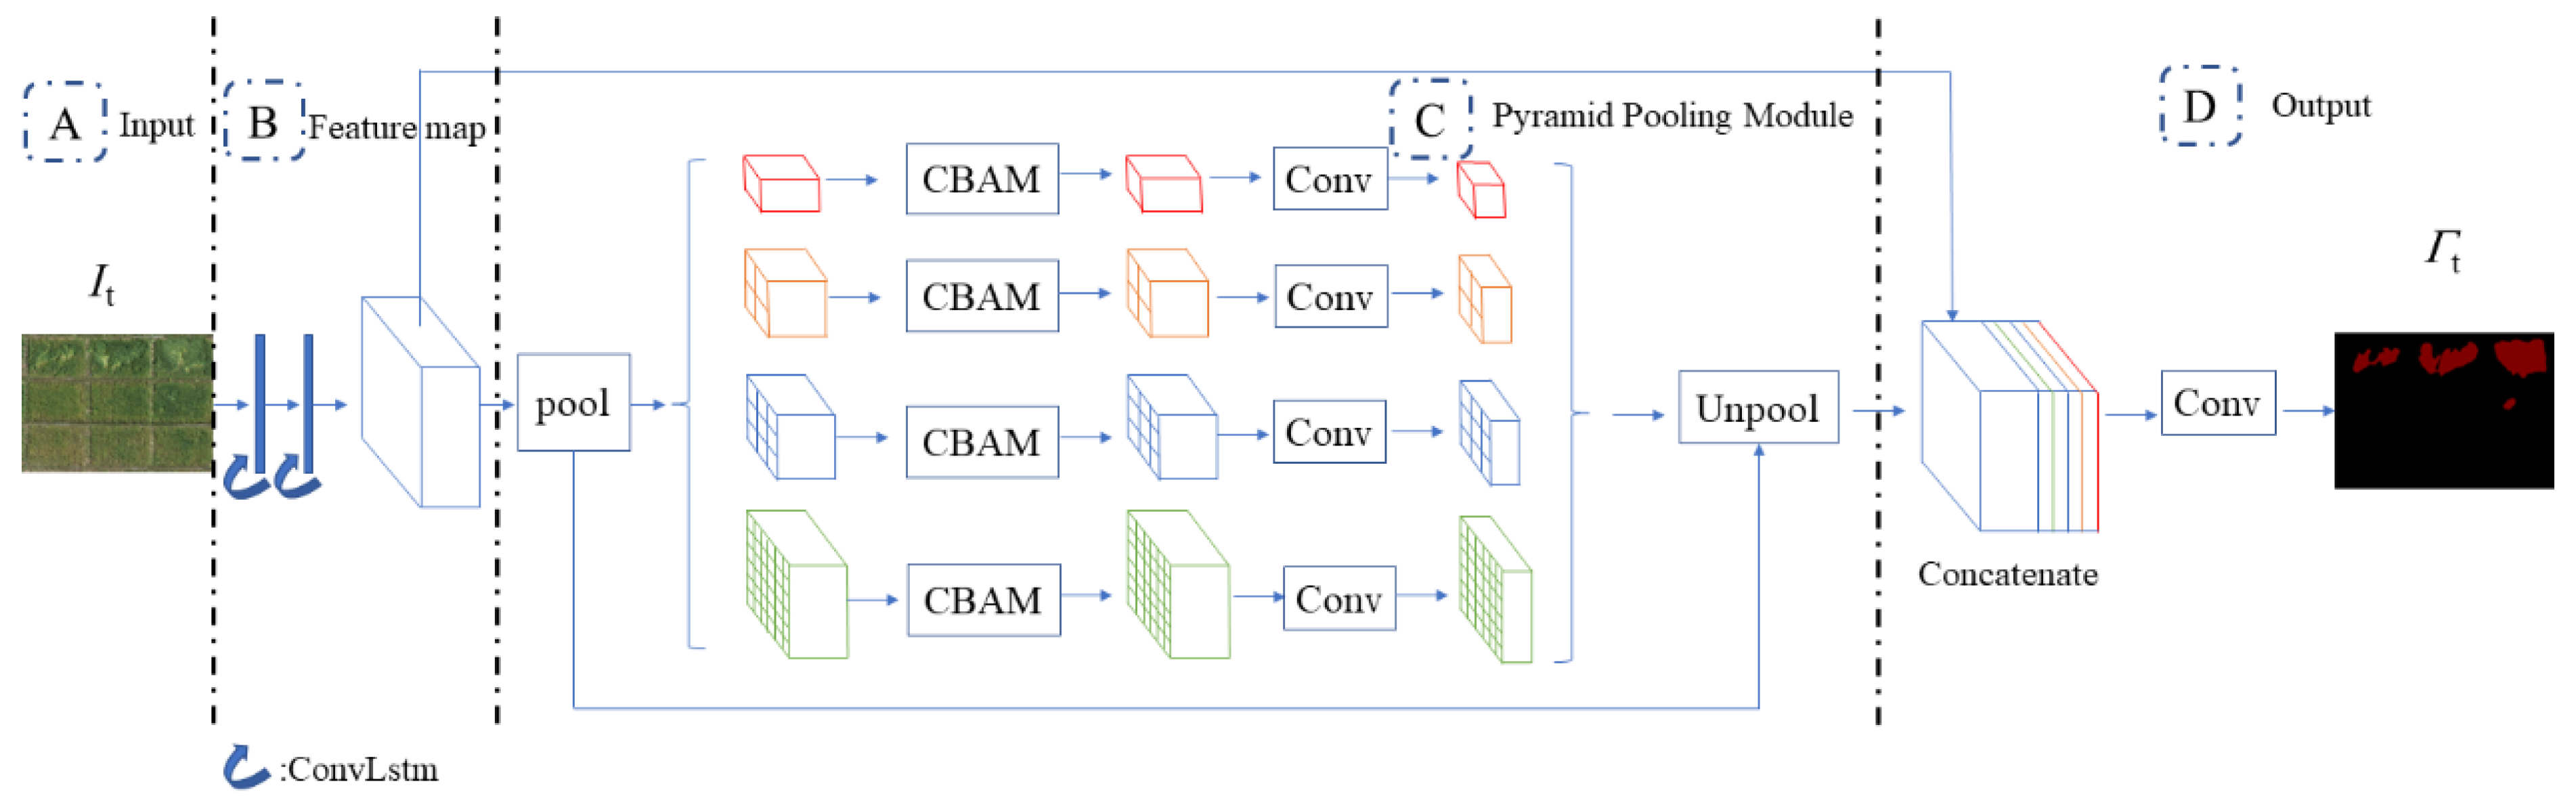
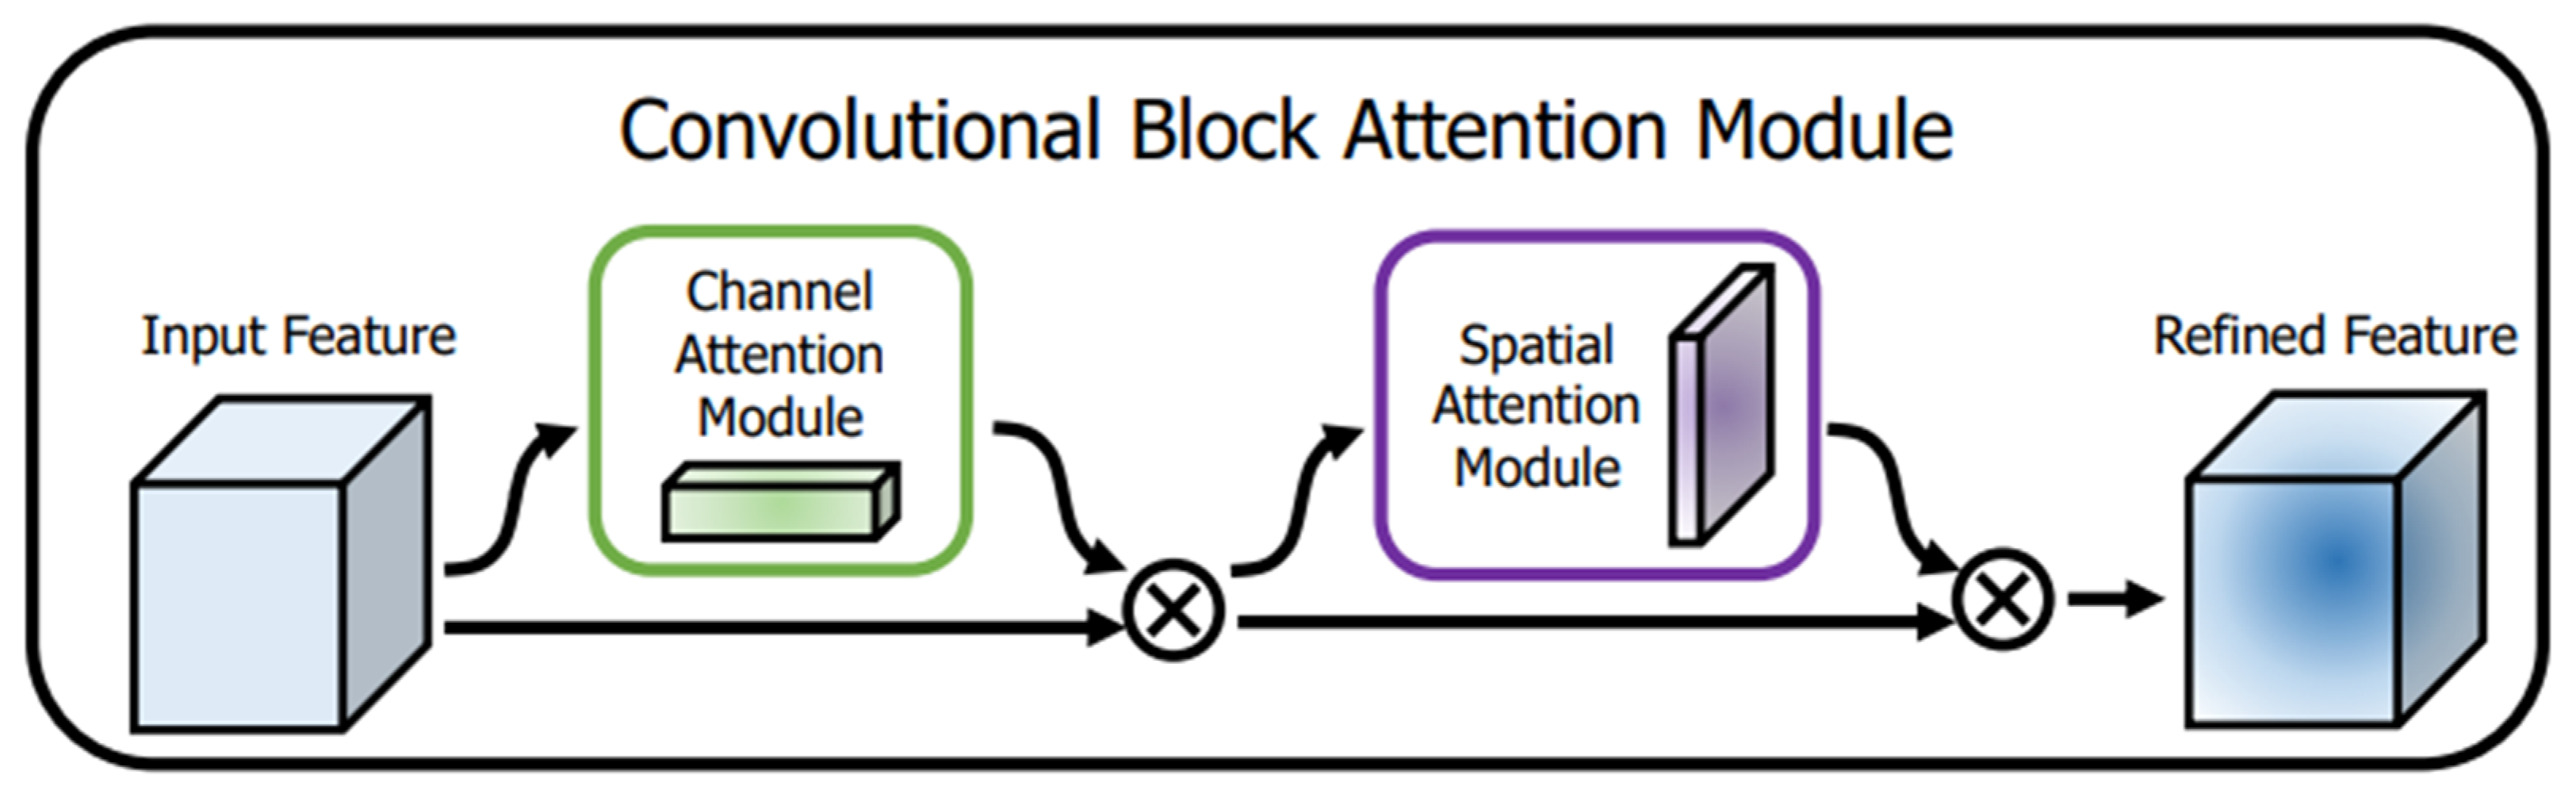
The improved model based on ConvLstm is shown in Figure 4. Symbol ‘A’ is the input section, and input ‘It’ is a series of inverted sequence images of length 5 arranged in chronological order. The output image Γt is the result of the lodging segmentation image. ‘B’ is the calculation part of feature map. The relationship between temporal sequence images was obtained through ConvLstm, and 5-dimensional data was input and divided into sample number, time slice and image length, width and height. A slice was a temporal sequence with a length of 5. ‘C’ is the improved spatial pyramid pooling module. Unlike the traditional module, the improved module uses the convolutional block attention module (CBAM) to further extract the channel and spatial information of images at each pooling scale before convolution and upsampling. The CBAM module is shown in Figure 5. Unpooling is used instead of Unsampling to further preserve the original feature information. As shown in Figure 5, there are the input, channel attention module, spatial attention module, and output. Feature , then one-dimensional convolution of the channel attention module were input, then the convolution result was multiplied by the original figure. The output result of the CAM (channel attention module) was taken as input, and two-dimensional convolution of the spatial attention module was carried out. The output was then multiplied with the original.
When the spatial pyramid module is pooled, it consists of 1 × 1, 2 × 2, 3 × 3, and 6 × 6 pooling modules, which obtain information of different scales, respectively. After CBAM, 1 × 1 convolution needs to be used, and the number of adjustment channels is 1/4 of the number of input channels, so that the features of all levels are spliced with the original feature map to form a global prior representation for subsequent segmentation prediction.
Due to the large gap between the wheat’s lodged and unlodged areas in the obtained drone images, the proportion of normal and lodging samples in the final sample was extremely uneven. In this study, the Tversky function was used as the loss function of the improved PSPNet network, which is a good balance between precision and recall. The loss function calculation formula is shown in Equation (1):
where the value of α is 0.3, the value of β is 0.7, and the value of ε is 10−7. TP (true positive) is the region that is correctly classified as lodging wheat, FP (false positive) is the region that is wrongly classified as lodging wheat, and FN (false negative) is the region that is wrongly classified as normal wheat.
2.5. Model Training
The Lstm_PSPNet network was built in the Keras framework with Tensorflow as the backend, using the optimizer Adadelta and using the original parameters by default. Using the TimeDistributed wrapper, a layer is applied to each time slice of the input (that is, each sequence of the time dimension is carried out separately as a convolution operation to extract features). The ConvLstm core was set to 5 × 5, and the convolution core was set to 3 × 3, followed by Leaky ReLU and batch normalization after ConvLstm. The batch size was set to 2 sequences, the training epoch was set to 80, and the learning rate of every ten cycles was halved.
In the same programming environment, the PSPNet network was built; the optimizer used was Adadelta and the original parameters were used by default. Based on the dataset constructed in this study, the network was trained 80 times, and the batch size was set to 10. Based on the Nvidia 3070 hardware environment, the program was written in Python 3.8 software to implement the above process.
2.6. Accuracy Evaluation
In order to evaluate the classification quality of the model, three evaluation indexes were adopted, namely Pr (precision), Rc (recall) and F1-Score. The corresponding equations are shown in Equations (5)–(7). Pr and Rc can reflect the accuracy of lodging area extraction by the model, and F1-Score integrates the results of both. The comparison of PSPNet network before and after the improvement was achieved by comparing the above three evaluation metrics.
TP, FP and FN represent the regions correctly and incorrectly classified as lodging wheat and incorrectly classified as normal wheat, respectively.
3. Results
3.1. Field Lodging Scenario
The wheat in this study had different lodging situations due to different nitrogen levels. Wheat with a basal N application rate of 120 kg/hm2 did not fall over. Wheat with a basal N application rate of 180 kg/hm2 had fewer lodging areas. The wheat with base N application of 240 kg/hm2 had the largest lodging areas, as shown in Figure 1. This study covered most of the lodging situations, which basically represent various situations that may occur in actual fields and provide effective data support for the construction of lodging monitoring models.
3.2. Comparison of PSPNet Network Segmentation Accuracy before and after Improvement
This study’s experimental results demonstrated that the one-way LSTM model has some predictive effect on wheat inversion at different fertility stages, but the focus of this study was to demonstrate how effective the improved Lstm_PSPNet is. Here, the results of late maturity of PSPNet and Lstm_PSPNet network model output were taken as examples, that was, the digital results of Pr (precision), Rc (recall) and F1-Score. As shown in Table 1, Lstm_PSPNet improved 5.1 percentage points, 6.6 percentage points, and 6.3 percentage points in precision, recall, and F1-Score, respectively, over PSPNet. The F1-Score of Lstm_PSPNet was 0.950, which was the highest accuracy, and fully balanced the prediction errors of precision and recall, indicating that the improved Lstm_PSPNet network model was more effective in lodging prediction.
3.3. Effect of Image Size on Lodging Monitoring
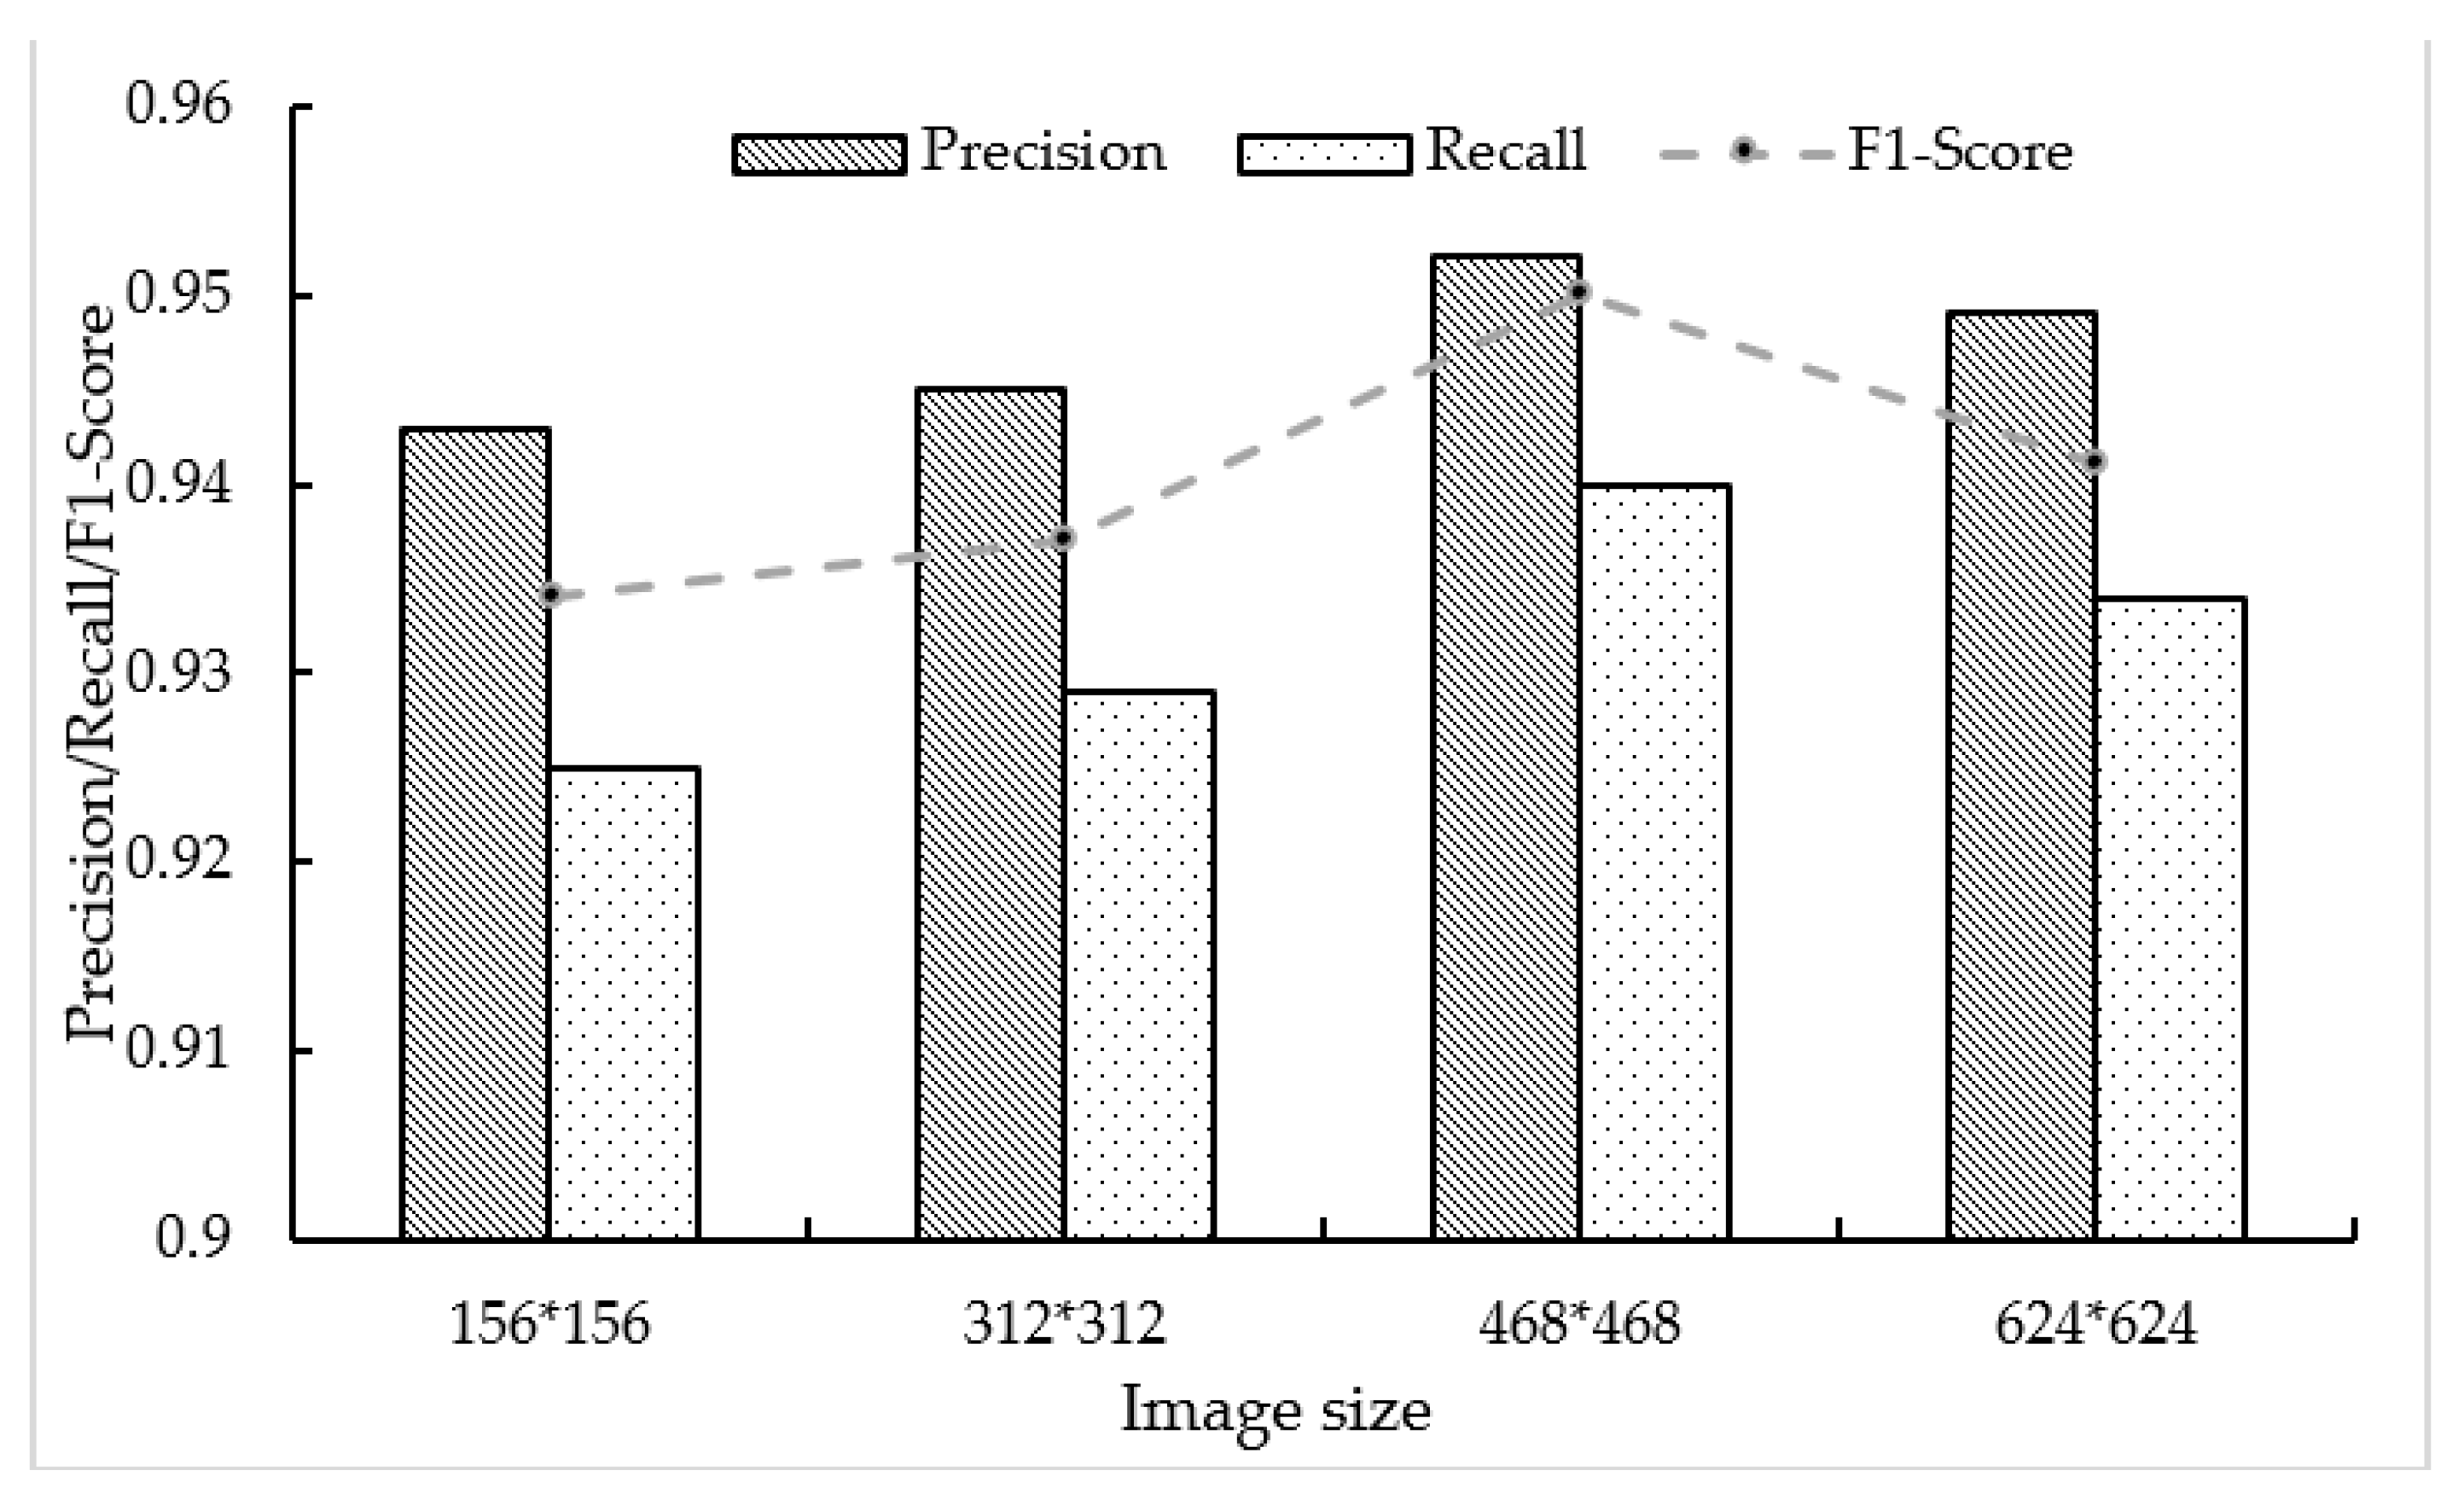
Here, the lodging monitoring effect in late maturity was taken as an example to illustrate the influence of four images sizes on the lodging segmentation effect, as shown in Figure 6. Among the four image sizes, 468 × 468 performed the best, with all three evaluation metrics outperforming the other sizes. 156 × 156 had the worst effect, with precision at 0.943, recall at 0.925 and F1-Score at 0.934, which were 0.009, 0.015 and 0.016 less than the highest precision, respectively. 624 × 624 was second only to 468 × 468, and better than 312 × 312. 312 × 312 was better than 156 × 156. It can be concluded that when the drone images are used for wheat lodging segmentation, the optimal image size is not as large as possible, and selecting the appropriate size can better improve the segmentation accuracy.
3.4. Comparison of Monitoring Effects in Different Growth Periods
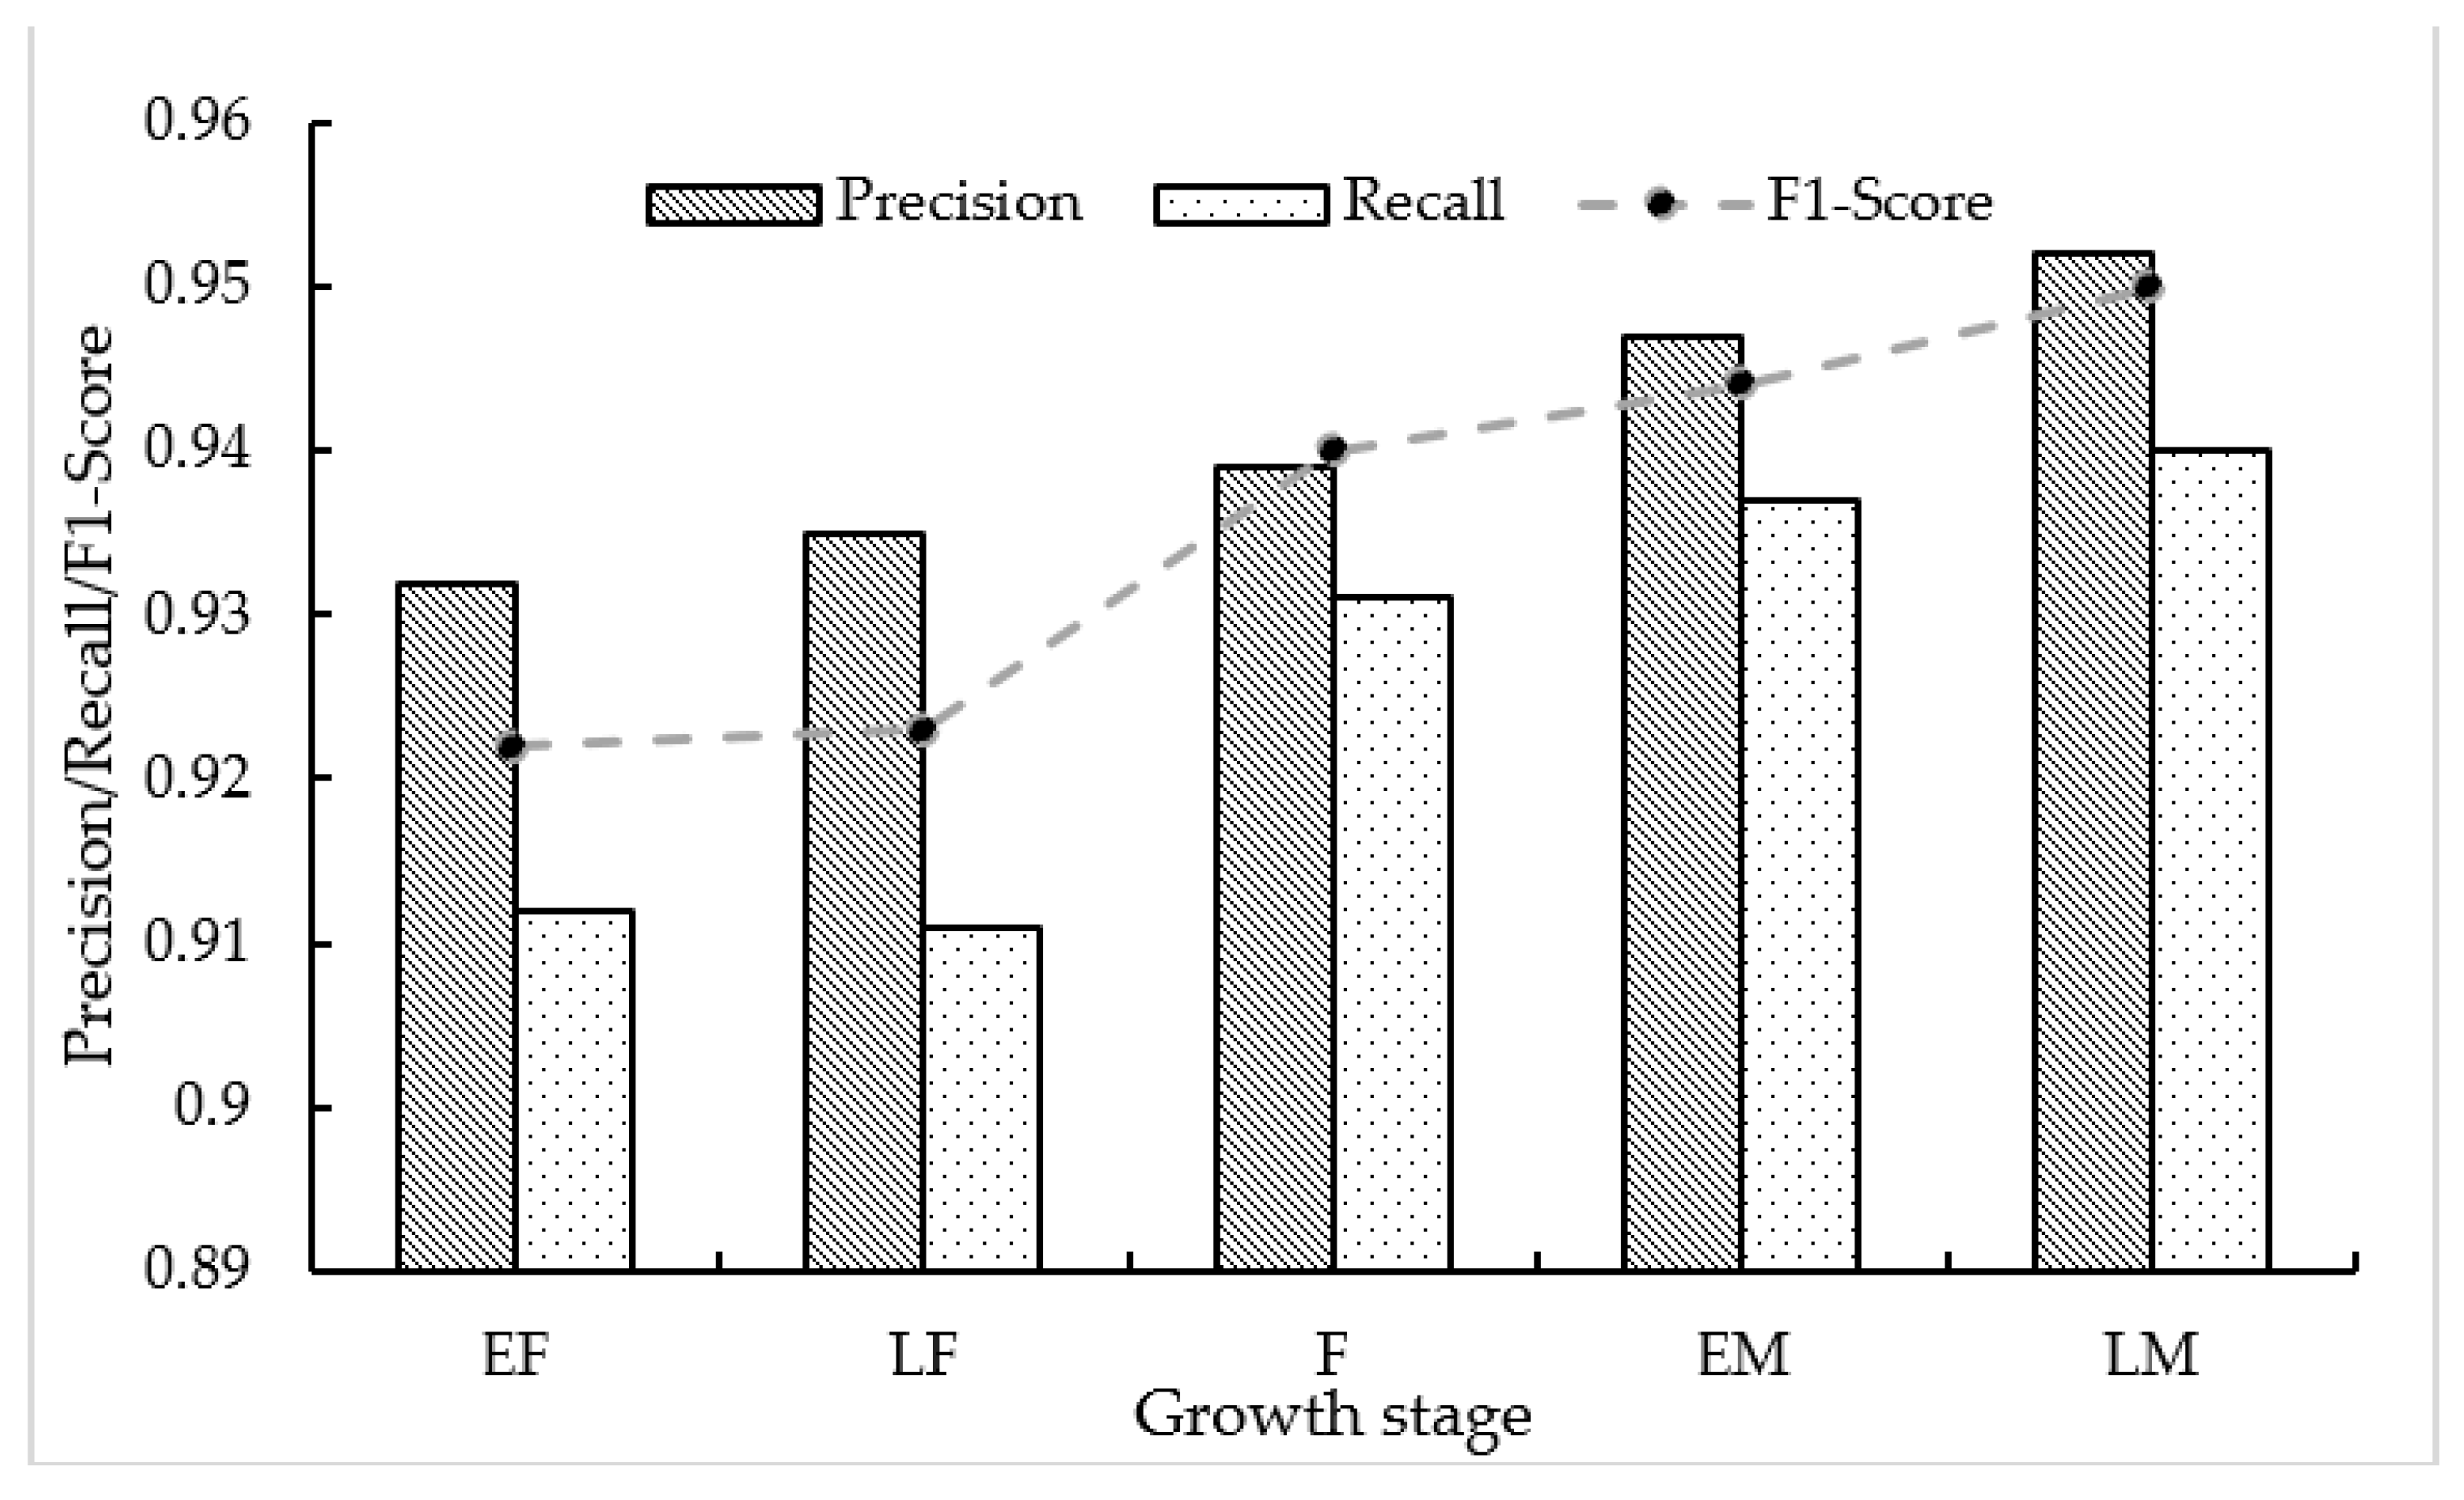
Here, the image size of 468 × 468 was taken as the experimental sample, and the results of wheat lodging extraction in five growth periods were obtained based on the Lstm_PSPNet deep learning network, as shown in Figure 7. From early flowering to late maturity, the three evaluation indexes increased successively; precision grew from 0.932 to 0.952, recall from 0.912 to 0.940, and F1-Score from 0.922 to 0.950. However, there was little difference between early and late flowering, with their F1-Scores differing by only 0.001, and the accuracy increment was larger from late flowering to late maturity. Overall, the Lstm_PSPNet model trained in this study had better extraction results in both mid and late reproductive stages.
4. Discussion
4.1. Comparative Analysis between the Method Proposed in This Paper and Previous Studies
Traditional machine learning methods, such as nearest neighbor, linear discriminant analysis, random forest (RF), neural network (NN), and support vector machine (SVM), were mostly used in previous crop lodging monitoring research. Liu et al. [36] applied SVM to the color, texture and thermal infrared features of crops to distinguish lodging and non-lodging crops. Zhang et al. [37] used the color and texture features of UAV images combined with SVM for wheat lodging detection. With the development of smart agriculture that requires high-precision and efficient crop lodging monitoring, scientists have introduced deep learning network models for image processing and data analysis [38], which have also been proven to be superior to many existing machine learning algorithms [39]. Zhang et al. [40] combined the UAV RGB images with the GoogLeNet learning algorithm for wheat lodging detection, with an accuracy of more than 90%. Hamidi Sepehr et al. [41] used computer vision and three deep learning methods (Faster R-CNN, YOLOv2 and RetinaNet) to extract corn lodging information from UAV RGB images. However, these studies only used primitive machine learning and deep learning network models to segment the features of each growth stage, and did not consider that lodging information could be transmitted between different growth stages of crops in the process of temporal sequence image segmentation. In this study, the PSPNet model is improved by introducing the ConvLSTM neural network with the ability to memorize long- and short-term information, inserting the convolutional attention module (CBAM) and the Tversky loss function to transfer the temporal sequence relationship between different growth periods network-by-network, thus improving the segmentation accuracy.
4.2. Analysis of Wheat Lodging Monitoring Effect under Different Size Images
At present, wheat lodging extraction is mostly based on a single image size, and there is little research on the exploration of image size. For example, Chauhan et al. achieved an overall accuracy of 0.9 for lodging wheat extraction of different grades based on a single-size image [16]. Zhang et al. extracted wheat inversion based on an image pixel size of 256 × 256 and obtained an extraction accuracy of about 0.92 [23]. Yang et al. achieved 89% accuracy for wheat lodging extraction based on the improved Unet model using a single-size image [42]. This study further investigated the effect of different size images on wheat lodging extraction. The results showed that the optimal image size is not as large as possible, showing an increasing trend in accuracy from 156 to 312 to 468 and a decreasing trend from 468 to 624. Intuitively, the larger the image size is, the more texture and context information it has, and the better the features can be captured. In addition, some discriminative features are better obtained when the image size becomes larger. However, when the size becomes larger, to a certain extent, limited by the size of the convolution kernel, its classification performance may remain unchanged or even deteriorate. In addition, as the size increases, hardware requirements will also increase, and the appropriate size needs to be selected in order to maximize efficiency.
4.3. Analysis of Wheat Lodging Monitoring Coupled with Images of Multiple Growth Stages
Due to the different effects of cultivation management, climate environment, diseases and other factors on crop lodging, crop lodging behaves differently in different growth periods. Most of the existing extraction methods for wheat lodging areas are based on data from a single growth period. For example, Chauhan et al. used UAV multispectral images to extract lodging based on a single growth period, and the overall accuracy reached 90% [16]. Cao et al. proposed a hybrid algorithm based on watershed algorithm and adaptive threshold segmentation for extracting wheat lodging, which achieved better segmentation results than the single watershed algorithm [17]. Zhao et al. used UAV technology and a convolutional neural network to construct a lodging extraction model for lodging wheat in two fertility stages, early filling and maturity, with an average accuracy of 89.23% [22]. In terms of wheat lodging extraction, Zhang et al. [23] analyzed the differences of more growth stages, and their deepLabv3+ network model had good monitoring effect under multiple growth stages. However, the model could not make use of temporal sequence characteristics to predict segmentation, and the results of the filling stage were better than those of early and late maturity. In this study, the model of Lstm_PSPNet made full use of the correlation between the before and after images for analysis and prediction, and its segmentation accuracy improved sequentially from early flowering to late maturity, which fully demonstrates that the use of temporal sequence features can improve segmentation accuracy. However, due to the little difference in lodging between the early flowering stage and the late flowering stage, the segmentation effect is similar. The results of this study can provide strong technical support for lodging damage monitoring.
4.4. Future Work
In this study, the data of five growth stages were collected, and the segmentation accuracy was improved by using temporal sequence characteristics which provided technical support for estimating the loss of lodging. However, in order to achieve a function similar to typhoon satellite cloud image prediction, it is necessary to collect more fertility period data and reconstruct the existing network.
5. Conclusions
In this study, the canopy images and ground lodging area information of wheat at five growth stages were collected based on UAV RGB images, and the improved Lstm_PSPNet network model was used to explore the monitoring effects of wheat lodging under different image sizes and different growth stages. The results showed that compared with the original PSPNet model, the improved Lstm_PSPNet network can improve the accuracy of wheat lodging information monitoring. Selecting the appropriate image size can ensure the maximum efficiency of lodging image information. With the advance of the growth period, the segmentation accuracy of the model was gradually improved, which fully indicates that the segmentation accuracy can be improved by using the temporal sequence characteristics of the model. The model has higher application potential in the monitoring of wheat lodging information at multi-growth stages. This study provides a more comprehensive reference and technical support for wheat multi-fertility inversion information monitoring and disaster early warning forecasting.
Author Contributions
Conceptualization, J.Y.; Data curation, T.C. and N.C.; Formal analysis, J.Y. and T.C.; Funding acquisition, D.Z.; Investigation, N.C.; Methodology, J.Y.; Project administration, D.Z.; Supervision, X.-G.Z., Z.D., T.W., S.D., D.L. and D.Z.; Visualization, T.C.; Writing—original draft, J.Y., T.C. and D.Z.; Writing—review & editing, X.-G.Z. and D.Z. All authors have read and agreed to the published version of the manuscript.
Funding
The research was supported by the Key Research and Technology Development Projects of Anhui Province (Grant No. 202004a06020045), the Science and Technology Plan of Inner Mongolia Autonomous Region Project (Grant No. 2022YFSJ0039), the Anhui Provincial Agricultural Science and Technology Achievements Project (Grant No. 2021ZH002), and the Outstanding Young Talents program in Colleges and Universities in Anhui Province (Grant No. GXYQ2020001).
Data Availability Statement
Some or all data that support the findings of this study are available from the corresponding author upon reasonable request.
Conflicts of Interest
The authors declare no conflict of interest.
References
- Bonjean, A.P.; Angus, W.J.; van Ginkel, M.; Pagesse, P.; Moore, R.F. The World Wheat Book: A History of Wheat Breeding. Cereal Res. Commun. 2001, 29, 459. Available online: https://link.springer.com/article/10.1007/BF03543695 (accessed on 15 July 2022). [CrossRef] [Green Version]
- Quang Duy, P.; Hirano, M.; Sagawa, S.; Kuroda, E. Analysis of the dry matter production process related to yield and yield components of rice plants grown under the practice of nitrogen-free basal dressing accompanied with sparse planting density. Plant Prod. Sci. 2015, 7, 155–164. [Google Scholar] [CrossRef] [Green Version]
- Pajares, G. Overview and current status of remote sensing applications based on unmanned aerial vehicles (UAVs). Photogramm. Eng. Remote Sens. 2015, 81, 281–330. [Google Scholar] [CrossRef] [Green Version]
- Vargas, J.Q.; Khot, L.R.; Peters, R.T.; Chandel, A.K.; Molaei, B. Low orbiting satellite and small UAS-based high-resolution imagery data to quantify crop lodging: A case study in irrigated spearmint. IEEE Geosci. Remote Sens. Lett. 2019, 17, 755–759. [Google Scholar] [CrossRef]
- Chauhan, S.; Darvishzadeh, R.; Boschetti, M.; Nelson, A. Discriminant analysis for lodging severity classification in wheat using RADARSAT-2 and Sentinel-1 data. ISPRS J. Photogramm. Remote Sens. 2020, 164, 138–151. [Google Scholar] [CrossRef]
- Guan, H.; Huang, J.; Li, X.; Zeng, Y.; Su, W.; Ma, Y.; Dong, J.; Niu, Q.; Wang, W. An improved approach to estimating crop lodging percentage with Sentinel-2 imagery using machine learning. Int. J. Appl. Earth Obs. Geoinf. 2022, 113, 102992. [Google Scholar] [CrossRef]
- Sukawattanavijit, C.; Chen, J.; Zhang, H. GA-SVM algorithm for improving land-cover classification using SAR and optical remote sensing data. IEEE Geosci. Remote Sens. Lett. 2017, 14, 284–288. [Google Scholar] [CrossRef]
- Chauhan, S.; Darvishzadeh, R.; Lu, Y.; Boschetti, M.; Nelson, A. Understanding wheat lodging using multi-temporal Sentinel-1 and Sentinel-2 data. Remote Sens. Environ. 2020, 243, 111804. [Google Scholar] [CrossRef]
- Shu, M.; Zhou, L.; Gu, X.; Ma, Y.; Sun, Q.; Yang, G.; Zhou, C. Monitoring of maize lodging using multi-temporal Sentinel-1 SAR data. Adv. Space Res. 2020, 65, 470–480. [Google Scholar] [CrossRef]
- Chen, J.; Li, H.; Han, Y. Fifth International Conference on Agro-Geoinformatics (Agro-Geoinformatics). In Potential ofRadarsat-2 Data on Identifying Sugarcane Lodging Caused by Typhoon; IEEE: New York, NY, USA, 2016; pp. 1–6. [Google Scholar]
- Yang, H.; Chen, E.; Li, Z.; Zhao, C.; Yang, G.; Pignatti, S.; Casa, R.; Zhao, L. Wheat lodging monitoring using polarimetric index from RADARSAT-2 data. Int. J. Appl. Earth Obs. Geoinf. 2015, 34, 157–166. [Google Scholar] [CrossRef]
- Wang, Z.; Nie, C.; Wang, H.; Ao, Y.; Jin, X.; Yu, X.; Bai, Y.; Liu, Y.; Shao, M.; Cheng, M.; et al. Detection and analysis of degree of maize lodging using UAV-RGB image multi-feature factors and various classification methods. ISPRS Int. J. Geo-Inf. 2021, 10, 309. [Google Scholar] [CrossRef]
- Bendig, J.; Bolten, A.; Bennertz, S.; Broscheit, J.; Eichfuss, S.; Bareth, G. Estimating biomass of barley using crop surface models (CSMs) derived from UAV-based RGB imaging. Remote Sens. 2014, 6, 10395–10412. [Google Scholar] [CrossRef] [Green Version]
- Zhao, J.; Pan, F.; Lan, Y.; Lu, L.; Cao, D.; Yang, D.; Wen, Y. Wheat lodging area extraction using UAV visible light remote sensing and feature fusion. Trans. Chin. Soc. Agric. Eng. 2021, 37, 73–80. [Google Scholar]
- Li, G.; Zhang, L.; Song, C.; Peng, M.; Zhang, Y.; Han, W. Extraction Method of Wheat Lodging Information Based on Multi-temporal UAV Remote Sensing Data. Trans. Chin. Soc. Agric. Mach. 2019, 50, 211–220. [Google Scholar]
- Chauhan, S.; Darvishzadeh, R.; Lu, Y.; Stroppiana, D.; Boschetti, M.; Pepe, M.; Nelson, A. Wheat lodging assessment using multispectral UAV data. Int. Arch. Photogramm. Remote Sens. Spat. Inf. Sci. 2019, 42, 235–240. [Google Scholar] [CrossRef] [Green Version]
- Cao, W.X.; Qiao, Z.Y.; Gao, Z.Y.; Lu, S.H.; Tian, F. Use of unmanned aerial vehicle imagery and a hybrid algorithm combining a watershed algorithm and adaptive threshold segmentation to extract wheat lodging. Phys. Chem. Earth 2021, 123, 103016. [Google Scholar] [CrossRef]
- Zhao, X.; Yuan, Y.T.; Song, M.D.; Ding, Y.; Lin, F.F.; Liang, D.; Zhang, D.Y. Use of Unmanned Aerial Vehicle Imagery and Deep Learning UNet to Extract Rice Lodging. Sensors 2019, 19, 3859. [Google Scholar] [CrossRef] [PubMed] [Green Version]
- Yang, M.D.; Tseng, H.H.; Hsu, Y.C.; Tsai, H.P. Semantic Segmentation Using Deep Learning with Vegetation Indices for Rice Lodging Identification in Multi-date UAV Visible Images. Remote Sens. 2020, 12, 633–654. [Google Scholar] [CrossRef] [Green Version]
- Zheng, E.G.; Tian, Y.F.; Chen, T. Region Extraction of Corn Lodging in UAV Images Based on Deep Learning. J. Henan Agric. Sci. 2018, 47, 155–160. [Google Scholar] [CrossRef]
- Song, Z.H.; Zhang, Z.T.; Yang, S.Q.; Ding, D.Y.; Ning, J.F. Identifying sunflower lodging based on image fusion and deep semantic segmentation with UAV remote sensing imaging. Comput. Electron. Agric. 2020, 179, 105812. [Google Scholar] [CrossRef]
- Zhao, B.Q.; Li, J.T.; Baenziger, P.S.; Belamkar, V.; Ge, Y.; Zhang, J.; Shi, Y. Automatic Wheat Lodging Detection and Mapping in Aerial Imagery to Support High-Throughput Phenotyping and In-Season Crop Management. Agronomy 2020, 10, 1762–1776. [Google Scholar] [CrossRef]
- Zhang, D.Y.; Ding, Y.; Chen, P.F.; Zhang, X.Q.; Pan, Z.G.; Liang, D. Automatic extraction of wheat lodging area based on transfer learning method and deeplabv3+ network. Comput. Electron. Agric. 2020, 179, 105845–105858. [Google Scholar] [CrossRef]
- Chen L C, Zhu Y, Papandreou, G. ; Zhang, X.Q.; Pan, Z.G.; Liang, D. Encoder-decoder with atrous separable convolution for semantic image segmentation//Proceedings of the European conference on computer vision (ECCV). 2018, 179, 801–818. [CrossRef] [Green Version]
- Pan, Y.; Zhang, G.; Zhang, L. A spatial-channel hierarchical deep learning network for pixel-level automated crack detection. Autom. Constr. 2020, 119, 103357. [Google Scholar] [CrossRef]
- Huyan, J.; Ma, T.; Li, W.; Yang, H.; Xu, Z. Pixelwise asphalt concrete pavement crack detection via deep learning-based semantic segmentation method. Struct. Control. Health Monit. 2022, 29, e2974. [Google Scholar] [CrossRef]
- Cao, J.; Tian, X.; Chen, Z.; Rajamanickam, L.; Jia, Y. Ancient mural segmentation based on a deep separable convolution network. Herit. Sci. 2022, 10, 11. [Google Scholar] [CrossRef]
- Wang, N.; Wang, W.; Hu, W.; Fenster, A.; Li, S. Thanka mural inpainting based on multi-Scale adaptive partial convolution and stroke-like mask. IEEE Trans. Image Process. 2021, 30, 3720–3733. [Google Scholar] [CrossRef]
- Yuan, X.; Chen, Z.; Chen, N.; Gong, J. Land cover classification based on the PSPNet and superpixel segmentation methods with high spatial resolution multispectral remote sensing imagery. J. Appl. Remote Sens. 2021, 15, 034511. [Google Scholar] [CrossRef]
- Xiang, S.; Xie, Q.; Wang, M. Semantic segmentation for remote sensing images based on adaptive feature selection network. IEEE Geosci. Remote Sens. Lett. 2021, 19, 8006705. [Google Scholar] [CrossRef]
- Li, J.; Xiu, J.; Yang, Z.; Liu, C. Dual path attention net for remote sensing semantic image segmentation. ISPRS Int. J. Geo-Inf. 2020, 9, 571. [Google Scholar] [CrossRef]
- Liu, S.W.; Zhang, Y.Y.; Cai, T.B.; Tang, X.F.; Wang, C.G. An Improved PSPnet Model for Semantic Segmentation of UAV Farmland Images. J. Irrig. Drain. 2022, 41, 101–108. [Google Scholar]
- Wang, X.; Guo, Y.; Wang, S.; Cheng, G.; Wang, X.; He, L. Rapid detection of incomplete coal and gangue based on improved PSPNet. Measurement 2022, 201, 111646. [Google Scholar] [CrossRef]
- Yuan, W.; Wang, J.; Xu, W. Shift Pooling PSPNet: Rethinking PSPNet for Building Extraction in Remote Sensing Images from Entire Local Feature Pooling. Remote Sens. 2022, 14, 4889. [Google Scholar] [CrossRef]
- Hu, W.S.; Li, H.C.; Pan, L.; Li, W.; Tao, R.; Du, Q. Spatial–spectral feature extraction via deep ConvLSTM neural networks for hyperspectral image classification. IEEE Trans. Geosci. Remote Sens. 2020, 58, 4237–4250. [Google Scholar] [CrossRef]
- Liu, T.; Li, R.; Zhong, X.; Jiang, M.; Jin, X.; Zhou, P.; Liu, S.; Sun, C.; Guo, W. Estimates of rice lodging using indices derived from UAV visible and thermal infrared images. Agric. For. Meteorol 2018, 252, 144–154. [Google Scholar] [CrossRef]
- Zhang, Z.; Igathinathane, C.; Flores, P.; Mathew, J.; Ransom, J.; Ampatzidis, Y.; Das, A.K. UAV mission height effects on wheat lodging ratio detection. Unmanned Aerial Systems in Precision Agriculture; Springer: Singapore, 2022; pp. 73–85. [Google Scholar] [CrossRef]
- Marsland, S. Machine Learning: An Algorithmic Perspective; CRC Press: Boca Raton, FL, USA, 2015. [Google Scholar] [CrossRef]
- Krizhevsky, A.; Sutskever, I.; Hinton, G.E. Imagenet classification with deep convolutional neural networks. In Proceedings of the Advances in Neural Information Processing Systems, Lake Tahoe, NV, USA, 3–6 December 2012; pp. 1097–1105. [Google Scholar] [CrossRef] [Green Version]
- Zhang, Z.; Flores, P.; Igathinathane, C.; Naik, D.L.; Kiran, R.; Ransom, J.K. Wheat lodging detection from UAS imagery using machine learning algorithms. Remote Sens. 2020, 12, 1838. [Google Scholar] [CrossRef]
- HamidiSepehr, A.; Mirnezami, S.V.; Ward, J.K. Comparison of object detection methods for corn damage assessment using deep learning. Trans. ASABE 2020, 63, 1969–1980. [Google Scholar] [CrossRef]
- Yang, B.H.; Zhu, Y.; Zhou, S.J. Accurate Wheat Lodging Extraction from Multi-Channel UAV Images Using a Lightweight Network Model. Sensors 2021, 21, 6826. [Google Scholar] [CrossRef]
Figure 1.
Experimental design of four nitrogen fertilizer treatments: 0 kg/ha (black box), 120 kg/ha (yellow box), 180 kg/ha (blue box), 240 kg/ha (red box).
Figure 1.
Experimental design of four nitrogen fertilizer treatments: 0 kg/ha (black box), 120 kg/ha (yellow box), 180 kg/ha (blue box), 240 kg/ha (red box).

Figure 2.
Visible light images and labeling results of five wheat growth stages. A1 through A5 are the visible images from the five growth stages of early flowering (A1), late flowering (A2), filling (A3), early maturity (A4) and late maturity (A5), respectively. (B1–B5) are the corresponding labels of the visible images. In the label data, the red part is the wheat lodging area, and the black part is the non-lodging area.

Figure 3.
Internal structure of ConvLSTM.

Figure 4.
Lstm PSPNet structure diagram.

Figure 5.
CBAM structure diagram.

Figure 6.
Prediction results of images of different sizes.

Figure 7.
Comparison of segmentation accuracy in each growth period.


Table 1.
Accuracy comparison of PSPNet network without and with LSTM.
| Model | Precision | Recall | F1-Score |
|---|---|---|---|
| PSPNet | 0.901 | 0.874 | 0.887 |
| Lstm_PSPNet | 0.952 | 0.940 | 0.950 |
Disclaimer/Publisher’s Note: The statements, opinions and data contained in all publications are solely those of the individual author(s) and contributor(s) and not of MDPI and/or the editor(s). MDPI and/or the editor(s) disclaim responsibility for any injury to people or property resulting from any ideas, methods, instructions or products referred to in the content. |
© 2023 by the authors. Licensee MDPI, Basel, Switzerland. This article is an open access article distributed under the terms and conditions of the Creative Commons Attribution (CC BY) license (https://creativecommons.org/licenses/by/4.0/).
Share and Cite
MDPI and ACS Style
Yu, J.; Cheng, T.; Cai, N.; Zhou, X.-G.; Diao, Z.; Wang, T.; Du, S.; Liang, D.; Zhang, D. Wheat Lodging Segmentation Based on Lstm_PSPNet Deep Learning Network. Drones 2023, 7, 143. https://doi.org/10.3390/drones7020143
AMA Style
Yu J, Cheng T, Cai N, Zhou X-G, Diao Z, Wang T, Du S, Liang D, Zhang D. Wheat Lodging Segmentation Based on Lstm_PSPNet Deep Learning Network. Drones. 2023; 7(2):143. https://doi.org/10.3390/drones7020143
Chicago/Turabian StyleYu, Jun, Tao Cheng, Ning Cai, Xin-Gen Zhou, Zhihua Diao, Tianyi Wang, Shizhou Du, Dong Liang, and Dongyan Zhang. 2023. "Wheat Lodging Segmentation Based on Lstm_PSPNet Deep Learning Network" Drones 7, no. 2: 143. https://doi.org/10.3390/drones7020143