
Expeditious Low-Cost SfM Photogrammetry and a TLS Survey for the Structural Analysis of Illasi Castle (Italy)


Department of Civil, Environmental and Architectural Engineering, University of Padua, 35131 Padua, Italy
*
Author to whom correspondence should be addressed.
Drones 2023, 7(2), 101; https://doi.org/10.3390/drones7020101
Submission received: 11 January 2023
/
Revised: 24 January 2023
/
Accepted: 28 January 2023
/
Published: 1 February 2023
(This article belongs to the Special Issue Unconventional Drone-Based Surveying)
Abstract
:The structural analysis of degraded historical buildings requires an adequate 3D model of the object. Structure from motion (SfM) photogrammetry and laser scanning geomatics techniques can satisfy this request by providing geometrically affordable data. The accuracy and resolution depend on the instruments and procedures used to extract the 3D models. This work focused on a 3D survey of Illasi Castle, a strongly degraded historical building located in northern Italy, aimed at structural analysis in the prevision of a static recovery. A low-cost drone, a single-lens reflex (SLR) camera, and a smartphone were used in the survey. From each acquired dataset, using the integration between the images acquired by the drone and the SLR camera, a 3D model of the building was extracted by means of the SfM technique. The data were compared with high-precision and high-resolution terrestrial laser scanning (TLS) acquisitions to evaluate the accuracy and performance of the fast and low-cost SfM approach. The results showed a standard deviation value for the point cloud comparisons in the order of 2–3 cm for the best solution (integrating drone and SLR images) and 4–7 cm using smartphone images. Finally, the integration of the best SfM model of the external walls and the TLS model of the internal portion of the building was used in finite element (FE) analysis to provide a safety assessment of the structure.
1. Introduction
Three-dimensional survey techniques, such as structure from motion (SfM) photogrammetry and laser scanning, with both terrestrial- and drone-based approaches are widely used in different fields (architectural, archaeological, cultural heritage, and structural) to reconstruct the geometric characteristics of objects, with the aims of documentation, analysis, preservation, maintenance, structural analysis, and restoration [1,2,3,4,5,6,7,8,9]. These techniques provide sparse and/or dense point clouds that can be used to enhance details [10]. Their use together allows for the improvement of coverage completeness, enabling the modeling of objects and complex cultural heritage buildings [11]; moreover, their integration with classical topography and the GNSS (Global Navigation Satellite System) system allows for the measurement of control networks and reference targets and the georeferencing of data in local, national, and/or international systems [12,13,14,15].
The structural analysis of historical buildings requires a detailed knowledge of their construction, where in situ investigations are carried out together with numerical analysis [16,17]. In particular, in the conservation and restoration of historical buildings, their unique characteristics must be examined, including structure type, the materials employed and their source, construction methods and enlargement, reconstruction and restoration interventions over time, types of use, etc. [18]. In order to prevent the possible damage/collapse of cultural heritage, the availability of complete and updated 3D models simplifies the planning and intervention phases. For these reasons, low-cost, expeditious, and non-destructive methods can be of great help in performing 3D surveys [19]. In many cases, a simplified model of the building is acceptable for use in seismic analysis by means of the pushover approach [20]. In this context, the use of low-cost sensors, including consumer-level smartphones, which are increasingly used in 3D model reconstruction, proved to be very useful [21,22]. Data obtained from 3D surveys (usually dense point clouds) are not directly suitable for the generation of a numerical model; generally, several operations are necessary [15]. In fact, the process of converting the acquired 3D geometric data, which provides a realistic model of the building, into a convenient format for finite element (FE) analysis software is crucial [23]. For this reason, several studies on different cases and situations are available in the literature. At present, FE analysis is used in most studies and simulation applications [24]. This procedure requires the generation of a solid model of the structure, built using basic 3D shapes, such as parallelepipeds, cones, cylinders, spheres, wedges, and toroids. The combination of these forms allows the generation of complex solids (Boolean operations) where the surfaces, volumes, and other geometric properties are known.
Many authors used terrestrial laser scanning (TLS) and SfM photogrammetric techniques, separately or integrated, to extract 3D models for the structural analysis of buildings and infrastructure. Hinks et al. [25] proposed an automatic and fast method to transform the point cloud acquired using the laser scanning technique in a solid model for FE analysis. The method requires better shape detection and the separation of the real openings and the occlusions in the laser scanning data; in many cases, integration with the SfM technique can better improve this separation. Barazzetti et al. [26] used a semiautomatic procedure to obtain a building information model (BIM) that preserved the TLS point cloud complexity of the building through the parametrization of NURBS (non-uniform rational B-splines) surfaces for a structural simulation based on FE analysis; this approach allowed the authors to take advantage of TLS surveys, which are characterized by a higher level of detail and precision than the SfM technique. Castellazzi et al. [27] created an FE model from a laser scanner survey using a semiautomatic method based on slide extraction for the creation of the discretized geometry of the studied building. The proposed method was applied to a structure with irregular geometry that could be easily acquired with dense TLS data, while using the SfM approach may not have been effective. Sánchez-Aparicio et al. [28] investigated the combined use of photogrammetric techniques (DIC and SfM) and geometrical (NURBS and Hausdorff distance) and FE strategies to assess the origin of the damage and give an evaluation of the current stability of the San Lorenzo Church (Zamora, Spain), a historical building. However, the results obtained even for a simple structure (the dome) suggested the need to restrict this strategy to constructions with large deformations, due to the SfM model’s accuracy of several millimeters. Tucci et al. [23] combined TLS surveys, deviation analysis (DA), and FE numerical modeling for a brick minaret located in Aksaray (Turkey). They extracted the different geometric parameters of the structure based on a detailed point cloud 3D mesh model and introduced a method for the direct transfer of the high accuracy of TLS based on a 3D model to FE structural analysis. From the FE analysis of this structure, variation in the maximum base shear ranging between 0.07 and 0.18 of the total weight of the minaret was observed, denoting the importance of the precise characterization of minaret geometry that can be obtained only from dense TLS data. Bassier et al. [29] presented a semi-automated approach to create accurate models of complex heritage buildings for the purpose of structural analysis. A complex mesh of the structure was created using TLS and photogrammetry; the authors used photogrammetry only for the extraction of crack information from images, which is troublesome in TLS point clouds due to the sparsity of laser scan data. For this reason, they integrated TLS and photogrammetry only partially. Rissolo et al. [30] conducted a comprehensive digital documentation of the exterior and interior surfaces and spaces of Satunsat (Mexico) by means of TLS and SfM photogrammetry in order to perform a structural health assessment and an evaluation of the varying masonry techniques employed in its construction. The authors fused the point clouds derived from the two techniques to provide the highest possible radiometric fidelity of the structures (from the SfM); however, they did not carry out a critical analysis of the quality of the extracted datasets. Bruno et al. [31] integrated TLS and drone- and terrestrial-based photogrammetry for the geometric analysis of a 19th-century bridge in Italy to better understand the historical evolution of its structural disorders and its present conservation status, and as a reliable base to define future interventions. The point clouds obtained from the two approaches were compared using only GCPs (ground control points) and merged; the authors did not provide indications on the degree of accuracy for each dataset. Selvaggi et al. [7] explored the potential contribution of TLS and classical topography to structural engineering by investigating the vertical structure of the San Luzi Church bell tower (Switzerland). Due to the position of the TLS stations, some parts of the building (in particular the roof of the tower, characterized by very sparse data) were not modeled because of missing data. Moreover, many holes were identified in the building, especially inside, due to narrow spaces; in these cases, the more flexible SfM acquisitions could help to reduce the occlusions. Fang et al. [32] integrated TLS and FE to assess the structural deformation of a historic brick masonry building, the Beamless Hall at Linggu Temple in Nanjing, China. They deduced that its asymmetrical layout under self-weight was likely the main reason for its structural deformation. This analysis was possible due to the high-resolution and high-precision data provided by TLS, which is particularly useful in the investigation of complex structures. Yang and Xu [33] used TLS and photogrammetric data to monitor composite tunnel structures and discussed segmentation deformation, cracks, and water seepage. The authors reported that deformation analysis based on TLS can effectively verify the location of water seepage and cracks, and photogrammetry technology can clearly identify and quantify the dimension of the damage. In this context, they highlighted the advantages derived from the integration of the two techniques. Many other studies integrating TLS and SfM photogrammetry for structural analysis are available in the literature.
In general, the above-mentioned works are characterized by (i) 3D data acquired by means of high-resolution and high-precision sensors; (ii) the use of expensive instruments; and (iii) little information on the time required for the survey. For these reasons, this work aimed to analyze 3D photogrammetric models extracted using expeditious survey procedures and low-cost sensors in the field of archaeology/cultural heritage, focusing on structural analysis for restoration activities. In surveys, SfM photogrammetry allows for the collection of a large amount of data in a short time, providing better coverage of the object by integrating ground- and drone-based acquisitions when compared to the expensive TLS technique. Despite the high-accuracy and high-resolution data provided by the latter approach, it requires more time for the complete survey and 3D coverage of an object.
By comparing the fast SfM models with the high-precision, high-resolution, high-cost, and time-consuming TLS data, an estimation of accuracies can be performed. In the case of poor geometric quality from the 3D photogrammetric reconstruction (low accuracy), integration with TLS data is necessary to ensure the reliability of the structural analysis; however, this integration should be limited only to critical areas where the SfM approach provides inaccurate surfaces.
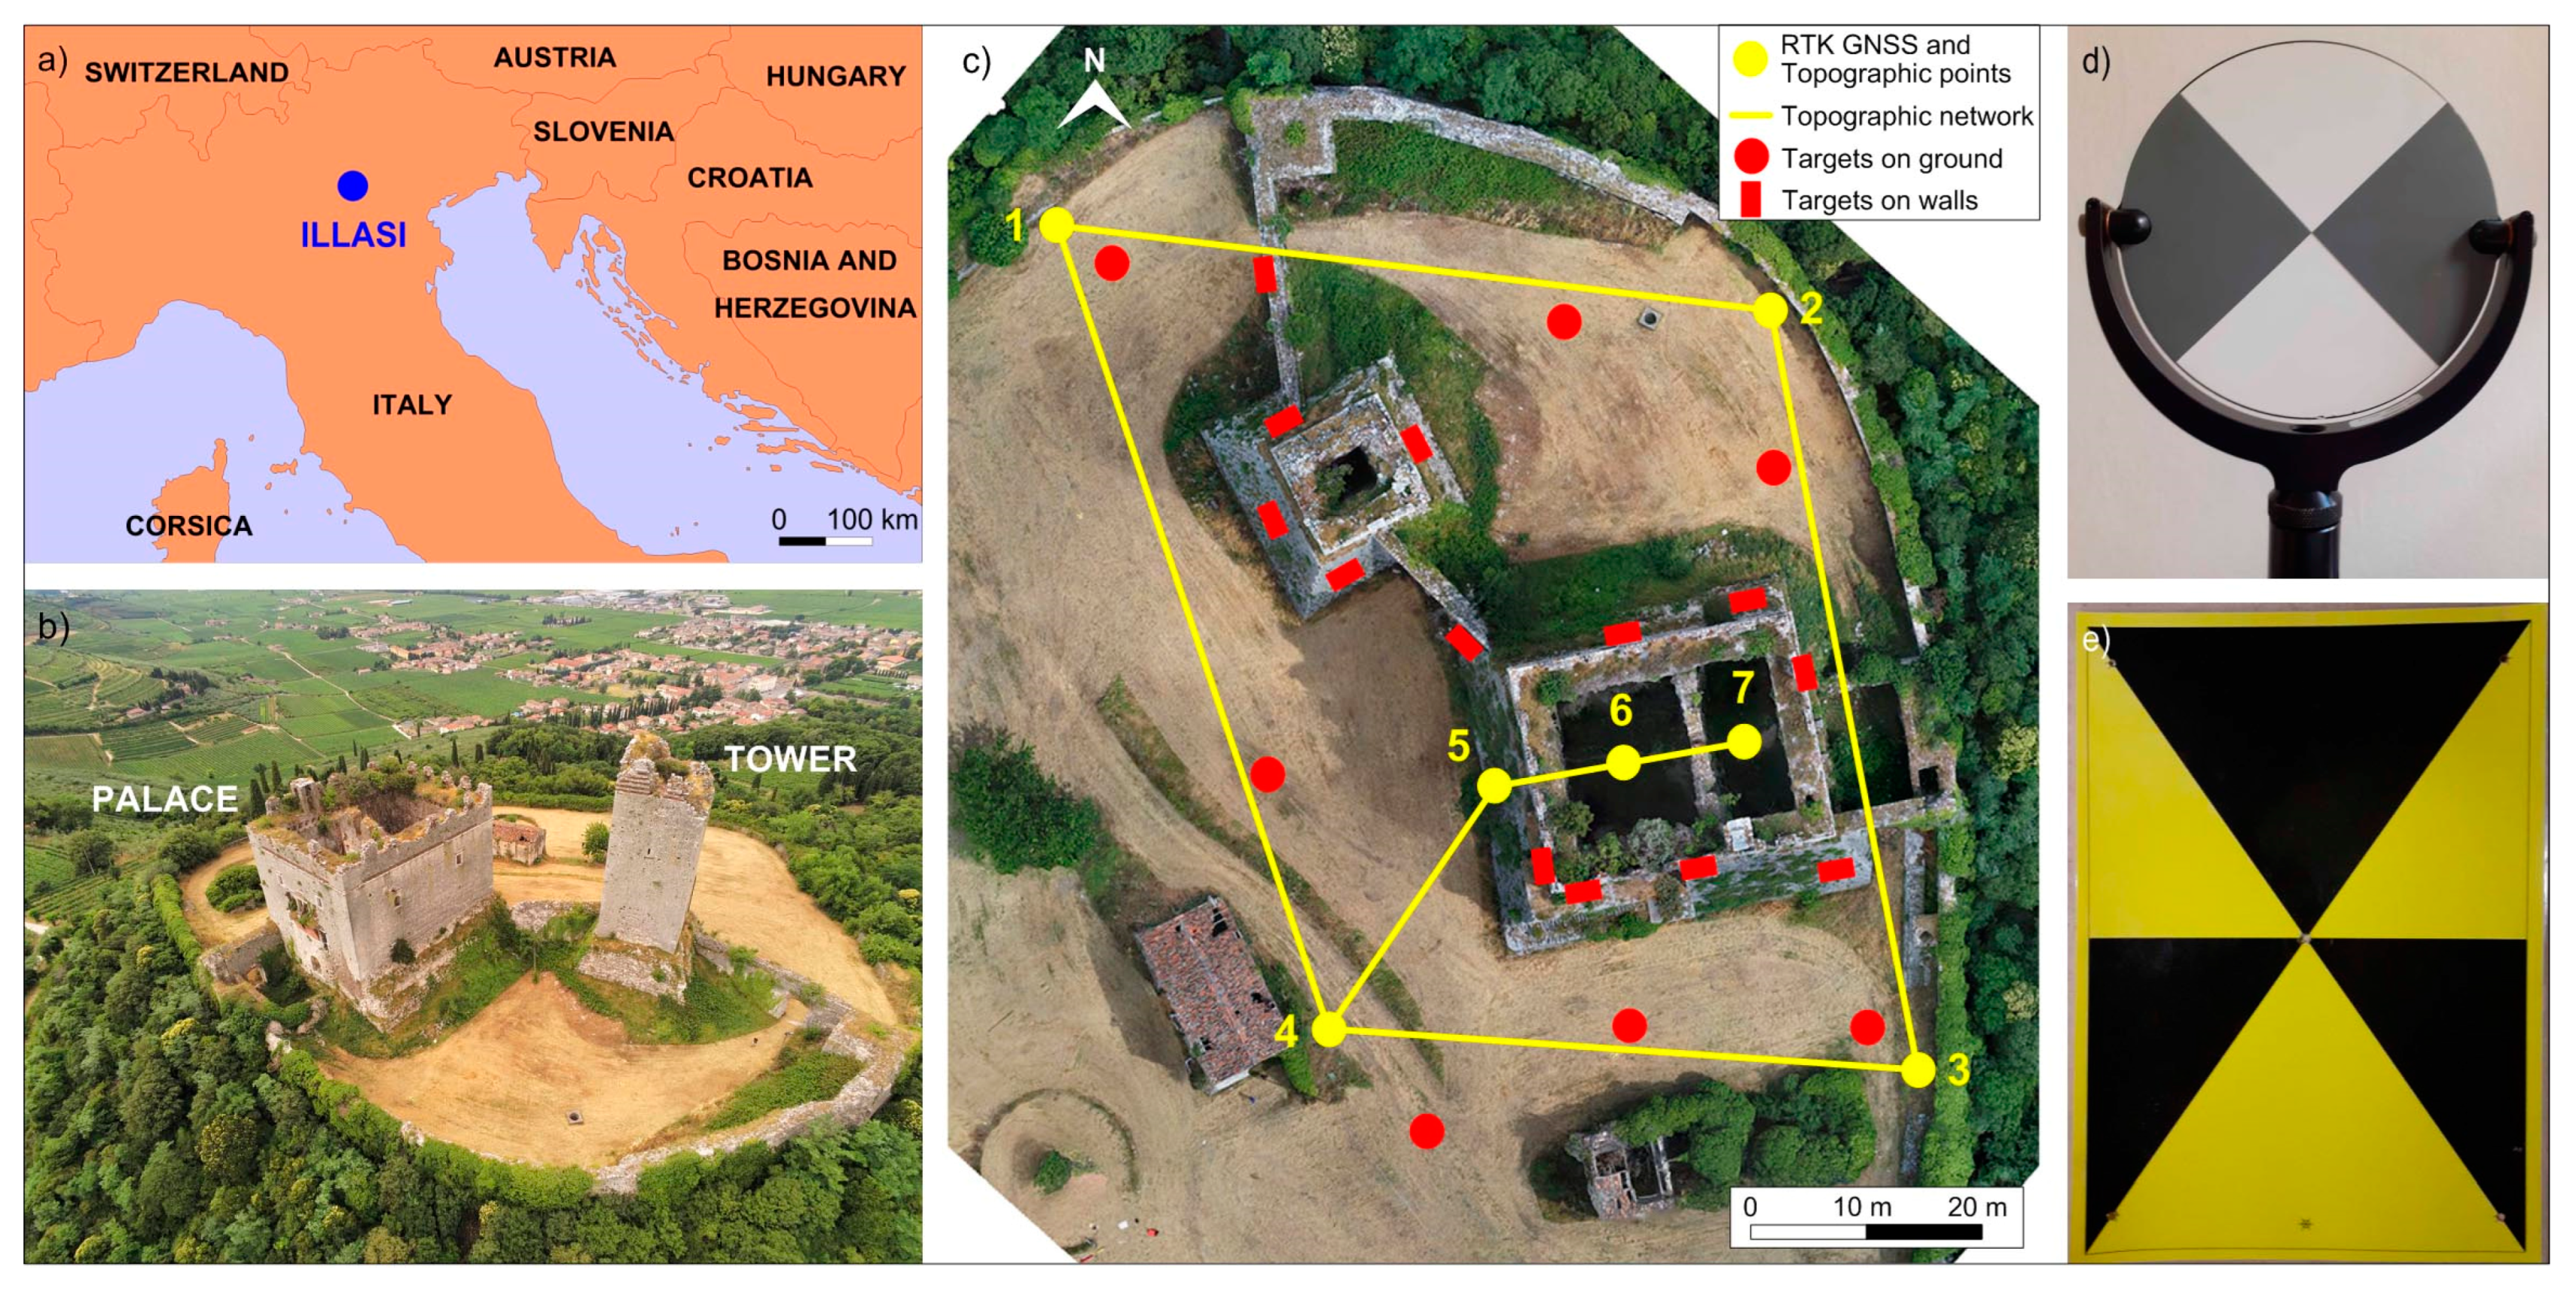
In this context, low-cost drones and consumer-level cameras (including a smartphone sensor) were applied in the survey of Illasi Castle, a medieval building located in northern Italy (Figure 1) for which future restoration activities are planned. To highlight the advantages and limitations of the 3D SfM models extracted using fast procedures, the data were (i) georeferenced using control points (CPs); (ii) validated using checkpoints (ChPs); and (iii) compared with a 3D reference model extracted from a TLS survey using the Leica ScanStation P20, a high-resolution and high-precision instrument, to evaluate the final accuracies.
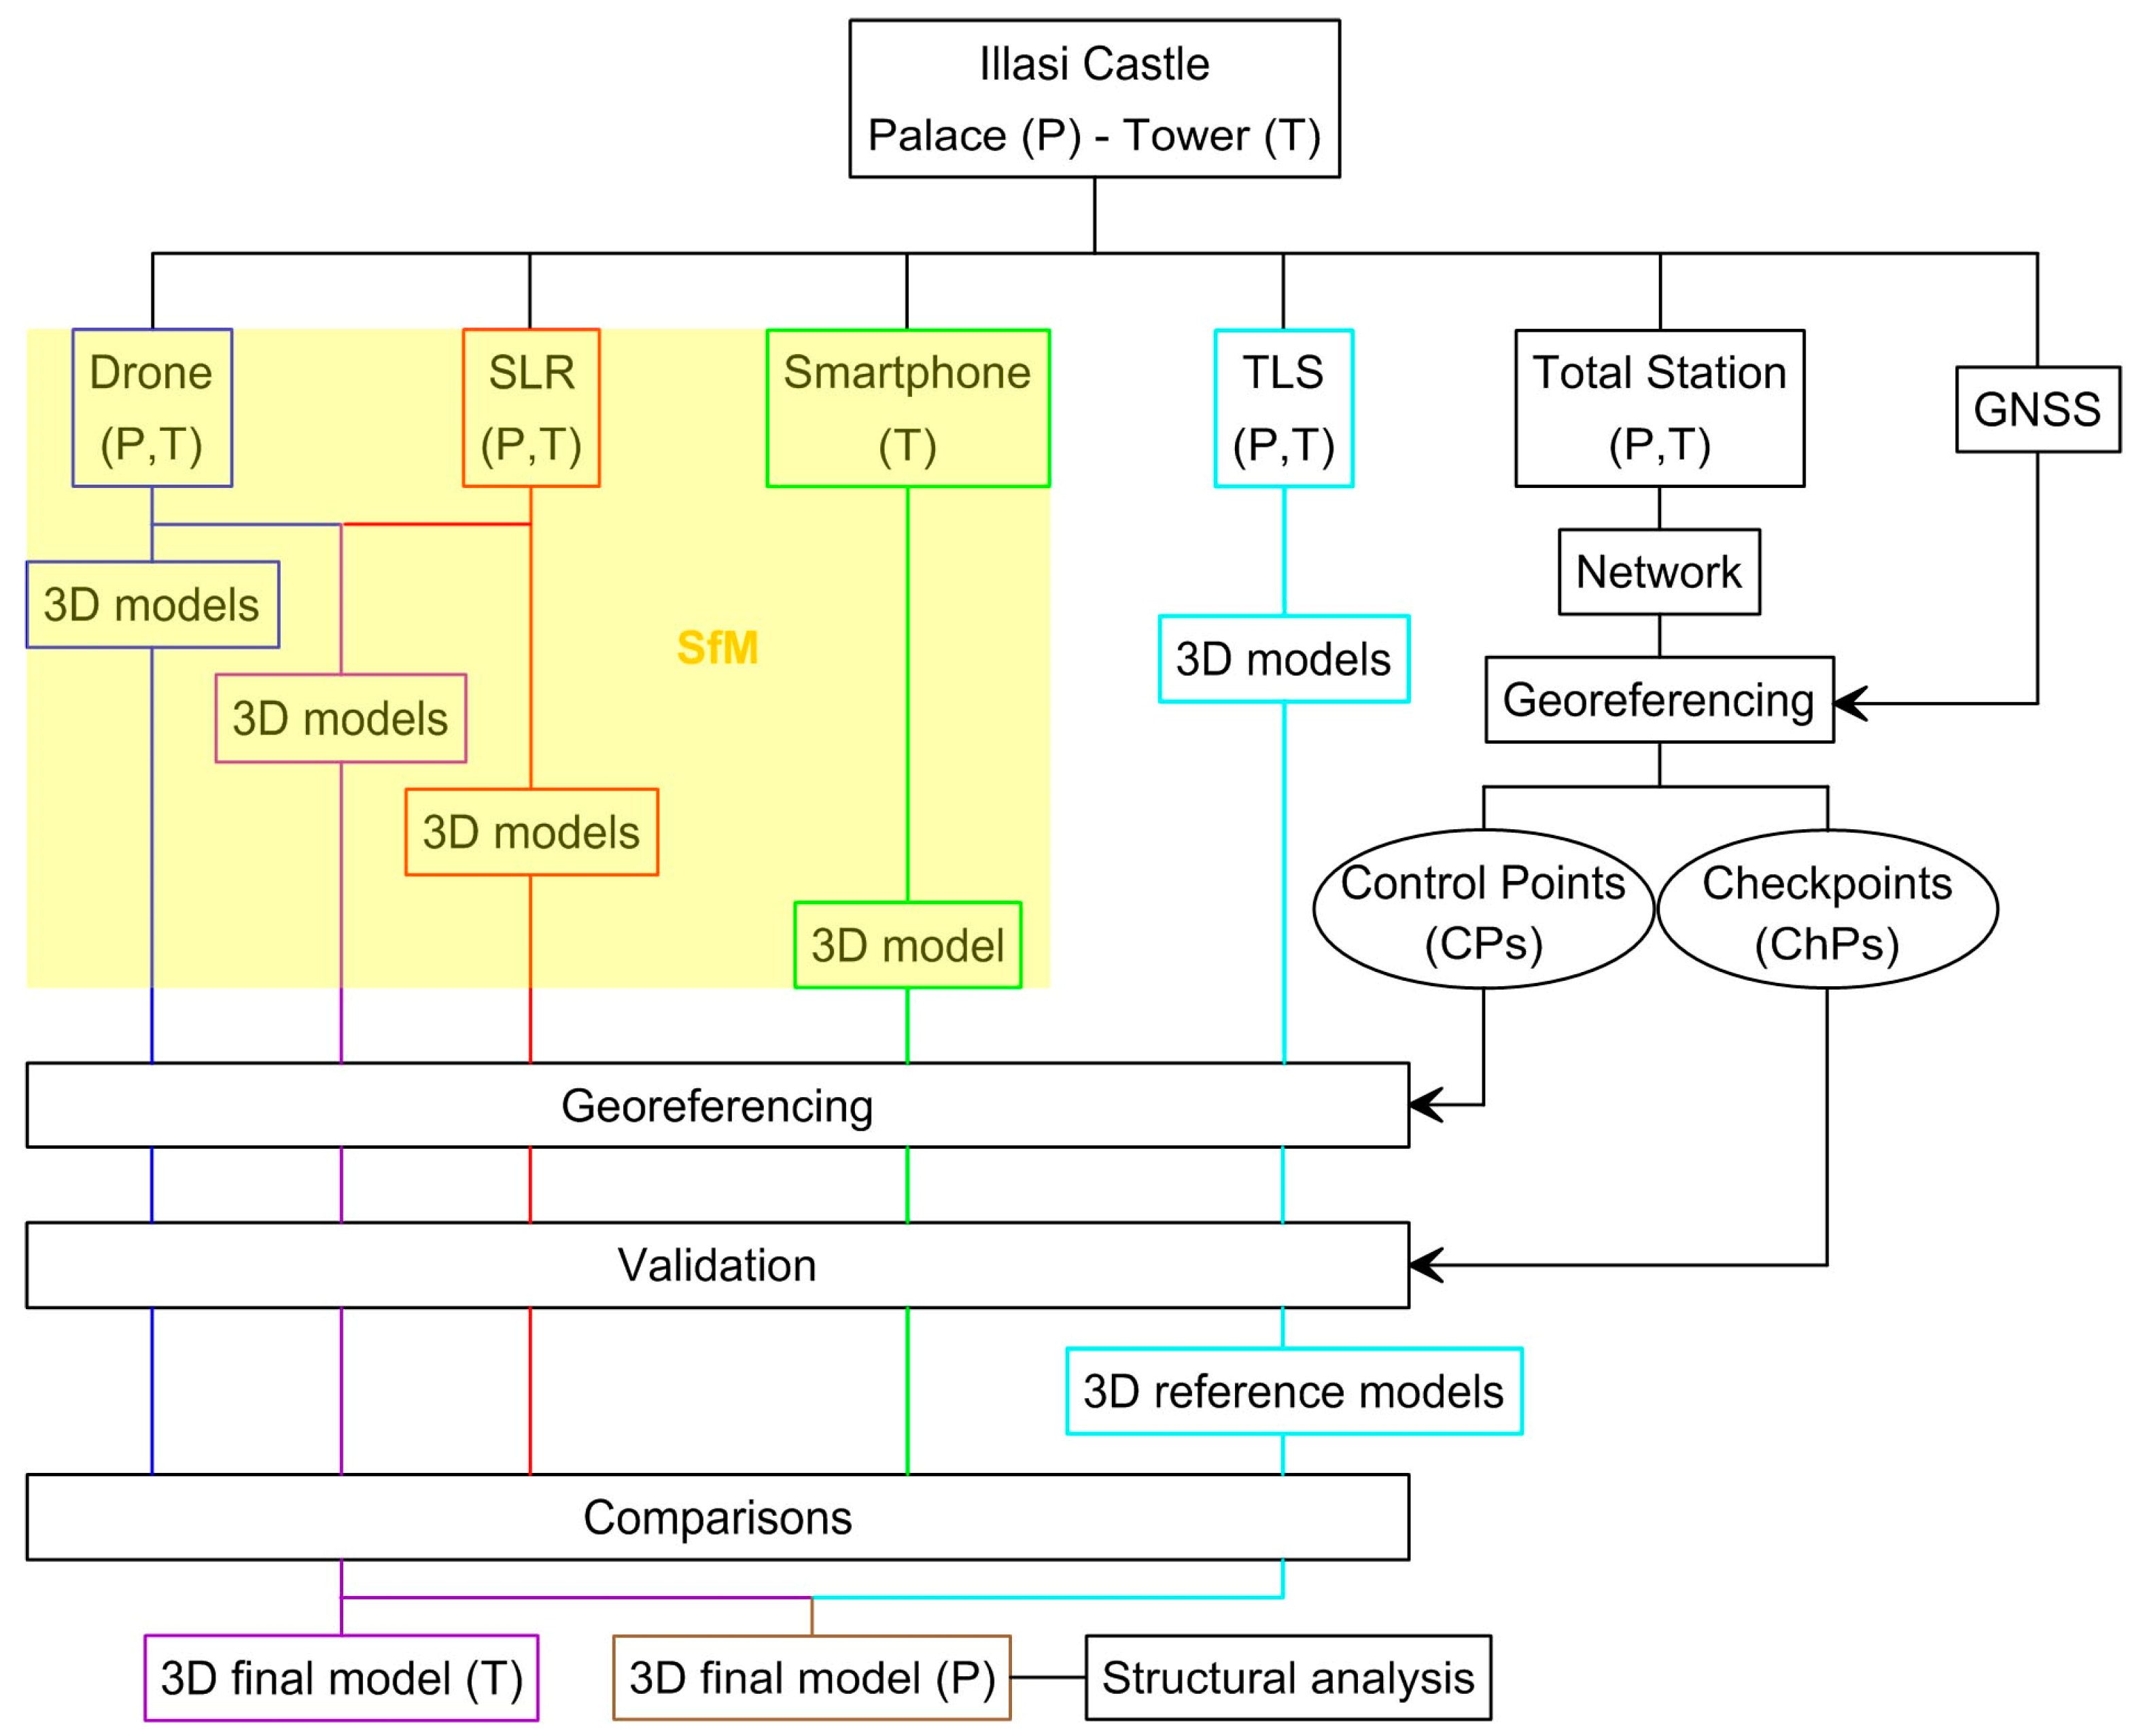
Figure 2 shows a flowchart of the methodology applied in this work. By means of different techniques and sensors, 3D models were extracted, georeferenced (using CPs), validated (using ChPs), and compared with TLS models as a reference.
Based on the results of the comparisons, the final 3D models used in the structural analysis were by obtained integrating the SfM data with TLS data only where strictly necessary, due to the high cost and time-consuming nature of the latter approach.
2. Illasi Castle
The structure under investigation is composed of two main buildings, the palace and the tower, which were built simultaneously at the beginning of the 13th century.
The castle is enclosed by an almost circular wall with a radius of about 50 m; the elevated walls constitute what remains of the structures, while the floors and the roof are no longer present.
The palace walls are approximately 27 m high. The four perimeter walls form a rectangular area of about 19.6 × 24 m, where the walls are between 2.7 and 2.8 m thick. The internal space of the building is divided into two unequal rooms by a 1.2 m thick wall, running parallel to the perimeter walls in the north–south direction, with an arch in the center.
From historical documents [34] and the most recent studies based on archaeological excavations performed in 2003–2008 [35,36], there appears to be a basement in the building, which is now covered by the ground. The floor, made up of detrital material, exhibits an irregular level, on average just under the level of the entrance door.
The tower walls are about 32 m high in the highest area. The plan of the tower has a square shape of about 10.3 × 10.3 m with a wall thickness of approximately 3.2 m. On the walls of both the palace and the tower, there are various openings at different heights (i.e., doors and windows), likely added in different periods.
Beginning in the mid-17th century, the castle was gradually abandoned, starting the process of deterioration. At present, due to the general state of decay and frequent localized collapses of material, access to the interior of the two main buildings is limited. Furthermore, the castle is protected by the Archaeological Superintendence of the Veneto Region, part of the Italian Ministry of Culture.
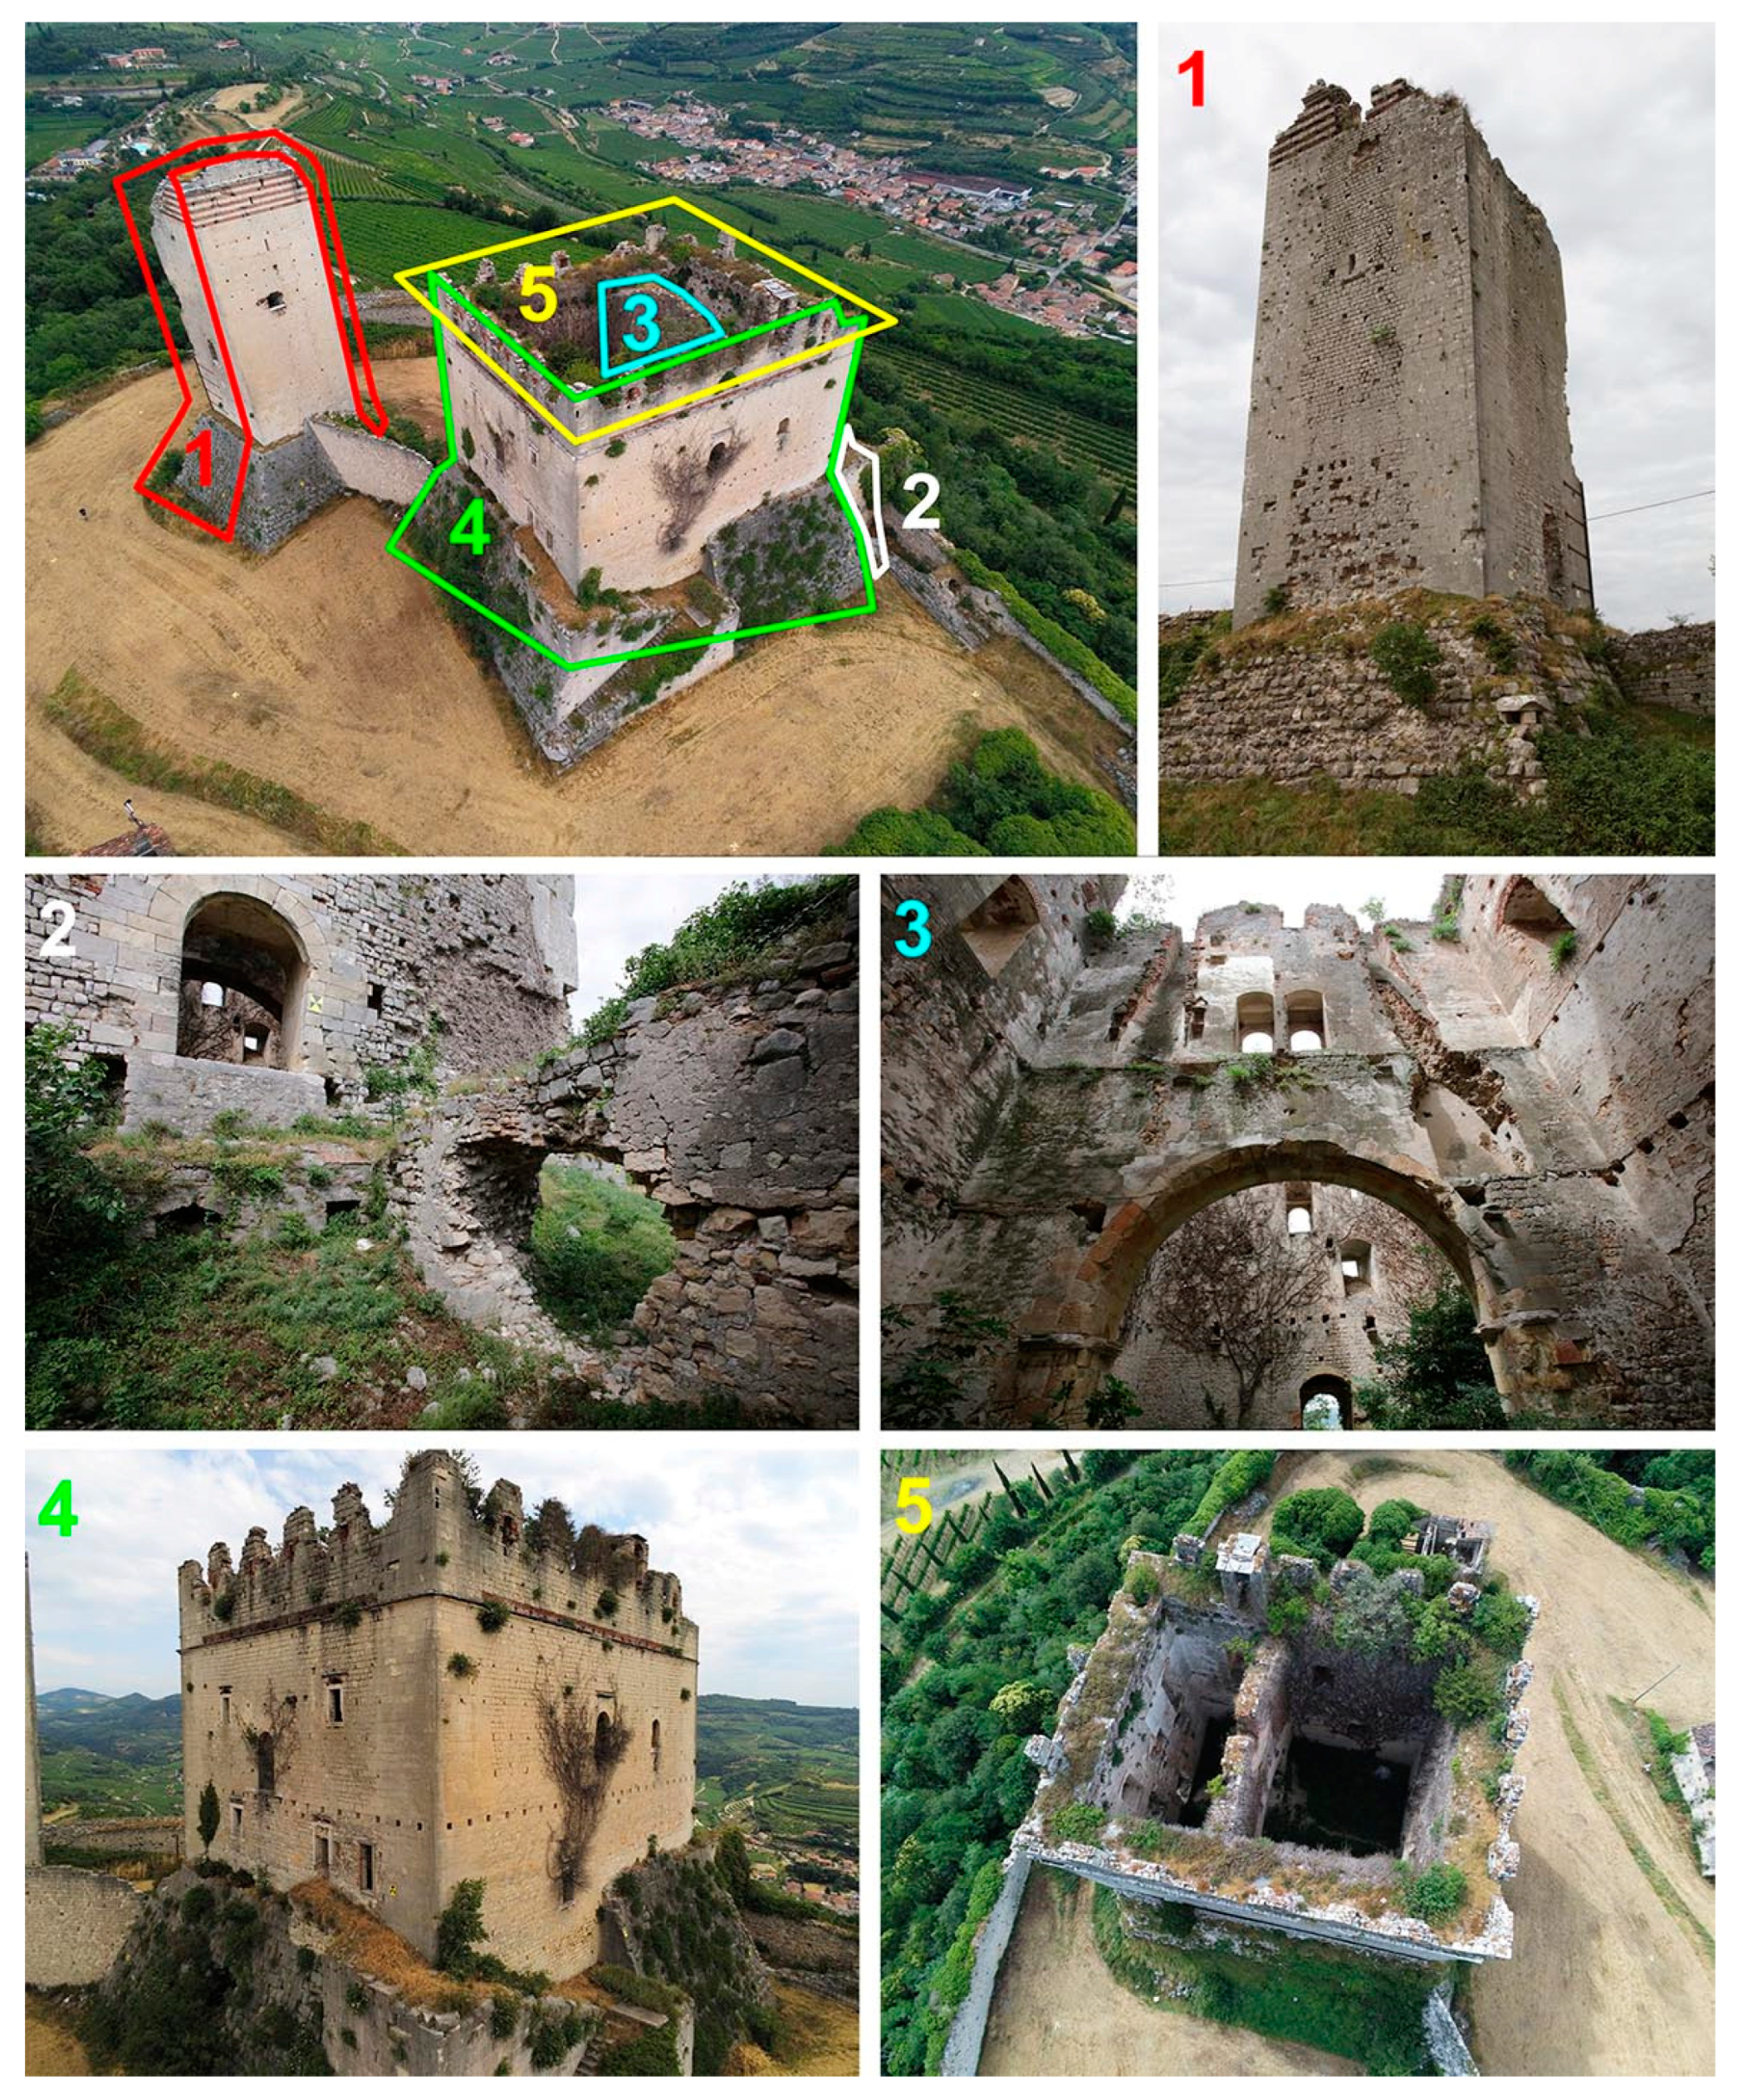
Currently, the structures are overgrown with vegetation, which was not removed before the survey both to lower costs and avoid possible collapses of the walls (Figure 3).
3. Materials and Methods
3.1. Surveys
3.1.1. RTK GNSS and Topographic Measurements of the Reference Network
A reference network is required to co-register data acquired with different techniques to the same reference system.
Here, seven intervisible wooden pickets in the ground, located inside and outside the castle, were measured with a Leica Viva GS 15 GNSS receiver using the RTK approach. In particular, 2 points inside the palace were used to acquire the visible portions of the 2 rooms separated by an arch structure; they were connected with the external points of the network by the entrance door.
Subsequently, 20 photogrammetric targets (both CPs and ChPs, Figure 1e) were positioned, 7 on the ground and 13 on the palace and tower walls (uniformly distributed and located only on accessible surfaces).
The locations of the reference points were designed for visibility and acquisition from the ground, using the SLR and smartphone cameras, and from the air, using the drone (Figure 1). All the targets and points in the network were measured in a local reference system using a Leica TCR1201 total station.
In the second phase, the coordinates of the network points and targets were transformed in the UTM 32 zone cartographic reference system using GNSS data.
3.1.2. 3D Photogrammetric Survey by Drone
The study area and the castle walls were surveyed using a low-cost drone (Parrot Anafi) equipped with a camera, which had a 1/2,4″ CMOS image sensor, a diagonal of 7.83 mm, a resolution of 21 MP, and a focal length of 4 mm (an equivalent focal length of 23 mm). The survey was performed by combining images from different flights. The flights were conducted in manual mode to better cover all the surfaces of the buildings, which are characterized by different depth plans and geometries. A total of 5 flights were executed, each taking 10–12 min, with an estimated overlap of at least 60% between subsequent images and a mean GSD (ground sample distance) of 16 mm/pixel.
The inclination of the camera was almost nadiral for the general flight from above. For the flights dedicated to the walls, two directions were used: perpendicular to the surfaces and slightly inclined.
A general flight of the study area was executed at a relative altitude between 45 and 60 m, acquiring 152 images for the survey of the top of the hill and the walls together with the internal vertical walls of the palace, which had a very complex acquisition geometry. This was due to the limited spaces inside the building that, even in the absence of the roof, did not allow for the easy movement of the drone inside the structure. Subsequently, a flight for each vertical external wall of the palace and tower was carried out at a distance of about 10 m, acquiring 258 images in total. In all cases, to achieve the best accuracy, the relations between the geometry of acquisition, coverage, overlap, and the number and distribution of targets were set according to works published previously by other authors [37,38].
3.1.3. Ground-Based Photogrammetric Acquisitions
A total of 254 images of the structures with high overlap were also acquired from the ground using a single-lens reflex (SLR) Canon EOS 5Ds camera (50.6 MP) with a full-frame 36 × 24 mm CMOS sensor, a diagonal of 43.27 mm, and a focal length of 35 mm. The survey was performed using a camera–object distance of about 5–10 m, which provided a wall pixel size of about 1.5 mm. The images were acquired from different positions around the buildings, with different inclinations of the camera, and from different perspectives.
Using the same approach and acquisition points as for the SLR camera, a survey of the tower was performed using a low-cost and commonly available device: a Redmi Note 7 smartphone equipped with a 48 MP camera and with a 1/2″ sensor that provides 8000 × 6000-pixel images. A total of 83 images were obtained (only for the tower).
3.1.4. TLS Acquisitions
A TLS survey was performed to acquire the high-resolution and high-precision data necessary to evaluate the accuracies of the 3D models generated with the SfM technique using images acquired by low-cost sensors.
A time-of-flight (TOF) Leica ScanStation P20 laser scanner was used. This instrument can acquire the coordinates of the visible surfaces in a local reference system, covering 360° in the horizontal plane and 305° in the vertical plane; it is characterized by an accuracy of 2 mm for distance and 8″ for angular measurements. The instrument was stationed at points in the reference network to acquire 6 point clouds using a resolution of 3 mm at 10 m for the 4 external scans, which were taken further away from the structure, and 6 mm at 10 m for the internal scans of the palace. It should be noted that a point cloud was not acquired from station 5 because it did not add significant information with respect to the time required for execution (Figure 1). Each scan was performed by adequately overlapping it with the previous, and at least 2 TLS targets were acquired (Figure 1d).
This relatively quick procedure was possible because of the use of “known backsight” measurements. The profile of acquisition employed here allowed us to optimize the time taken for scans, target measurements, and alignments by using the topographic network, whose points correspond to the station points and target positions. This allowed us to accurately locate, measure, and verify the positions of the scanning stations and improve and control the accuracy of the alignment and co-registration processes in the UTM 32 zone system.
Overall, using the different techniques described above, the complete survey of the study area and the castle required one working day.
3.2. 3D Data Processing
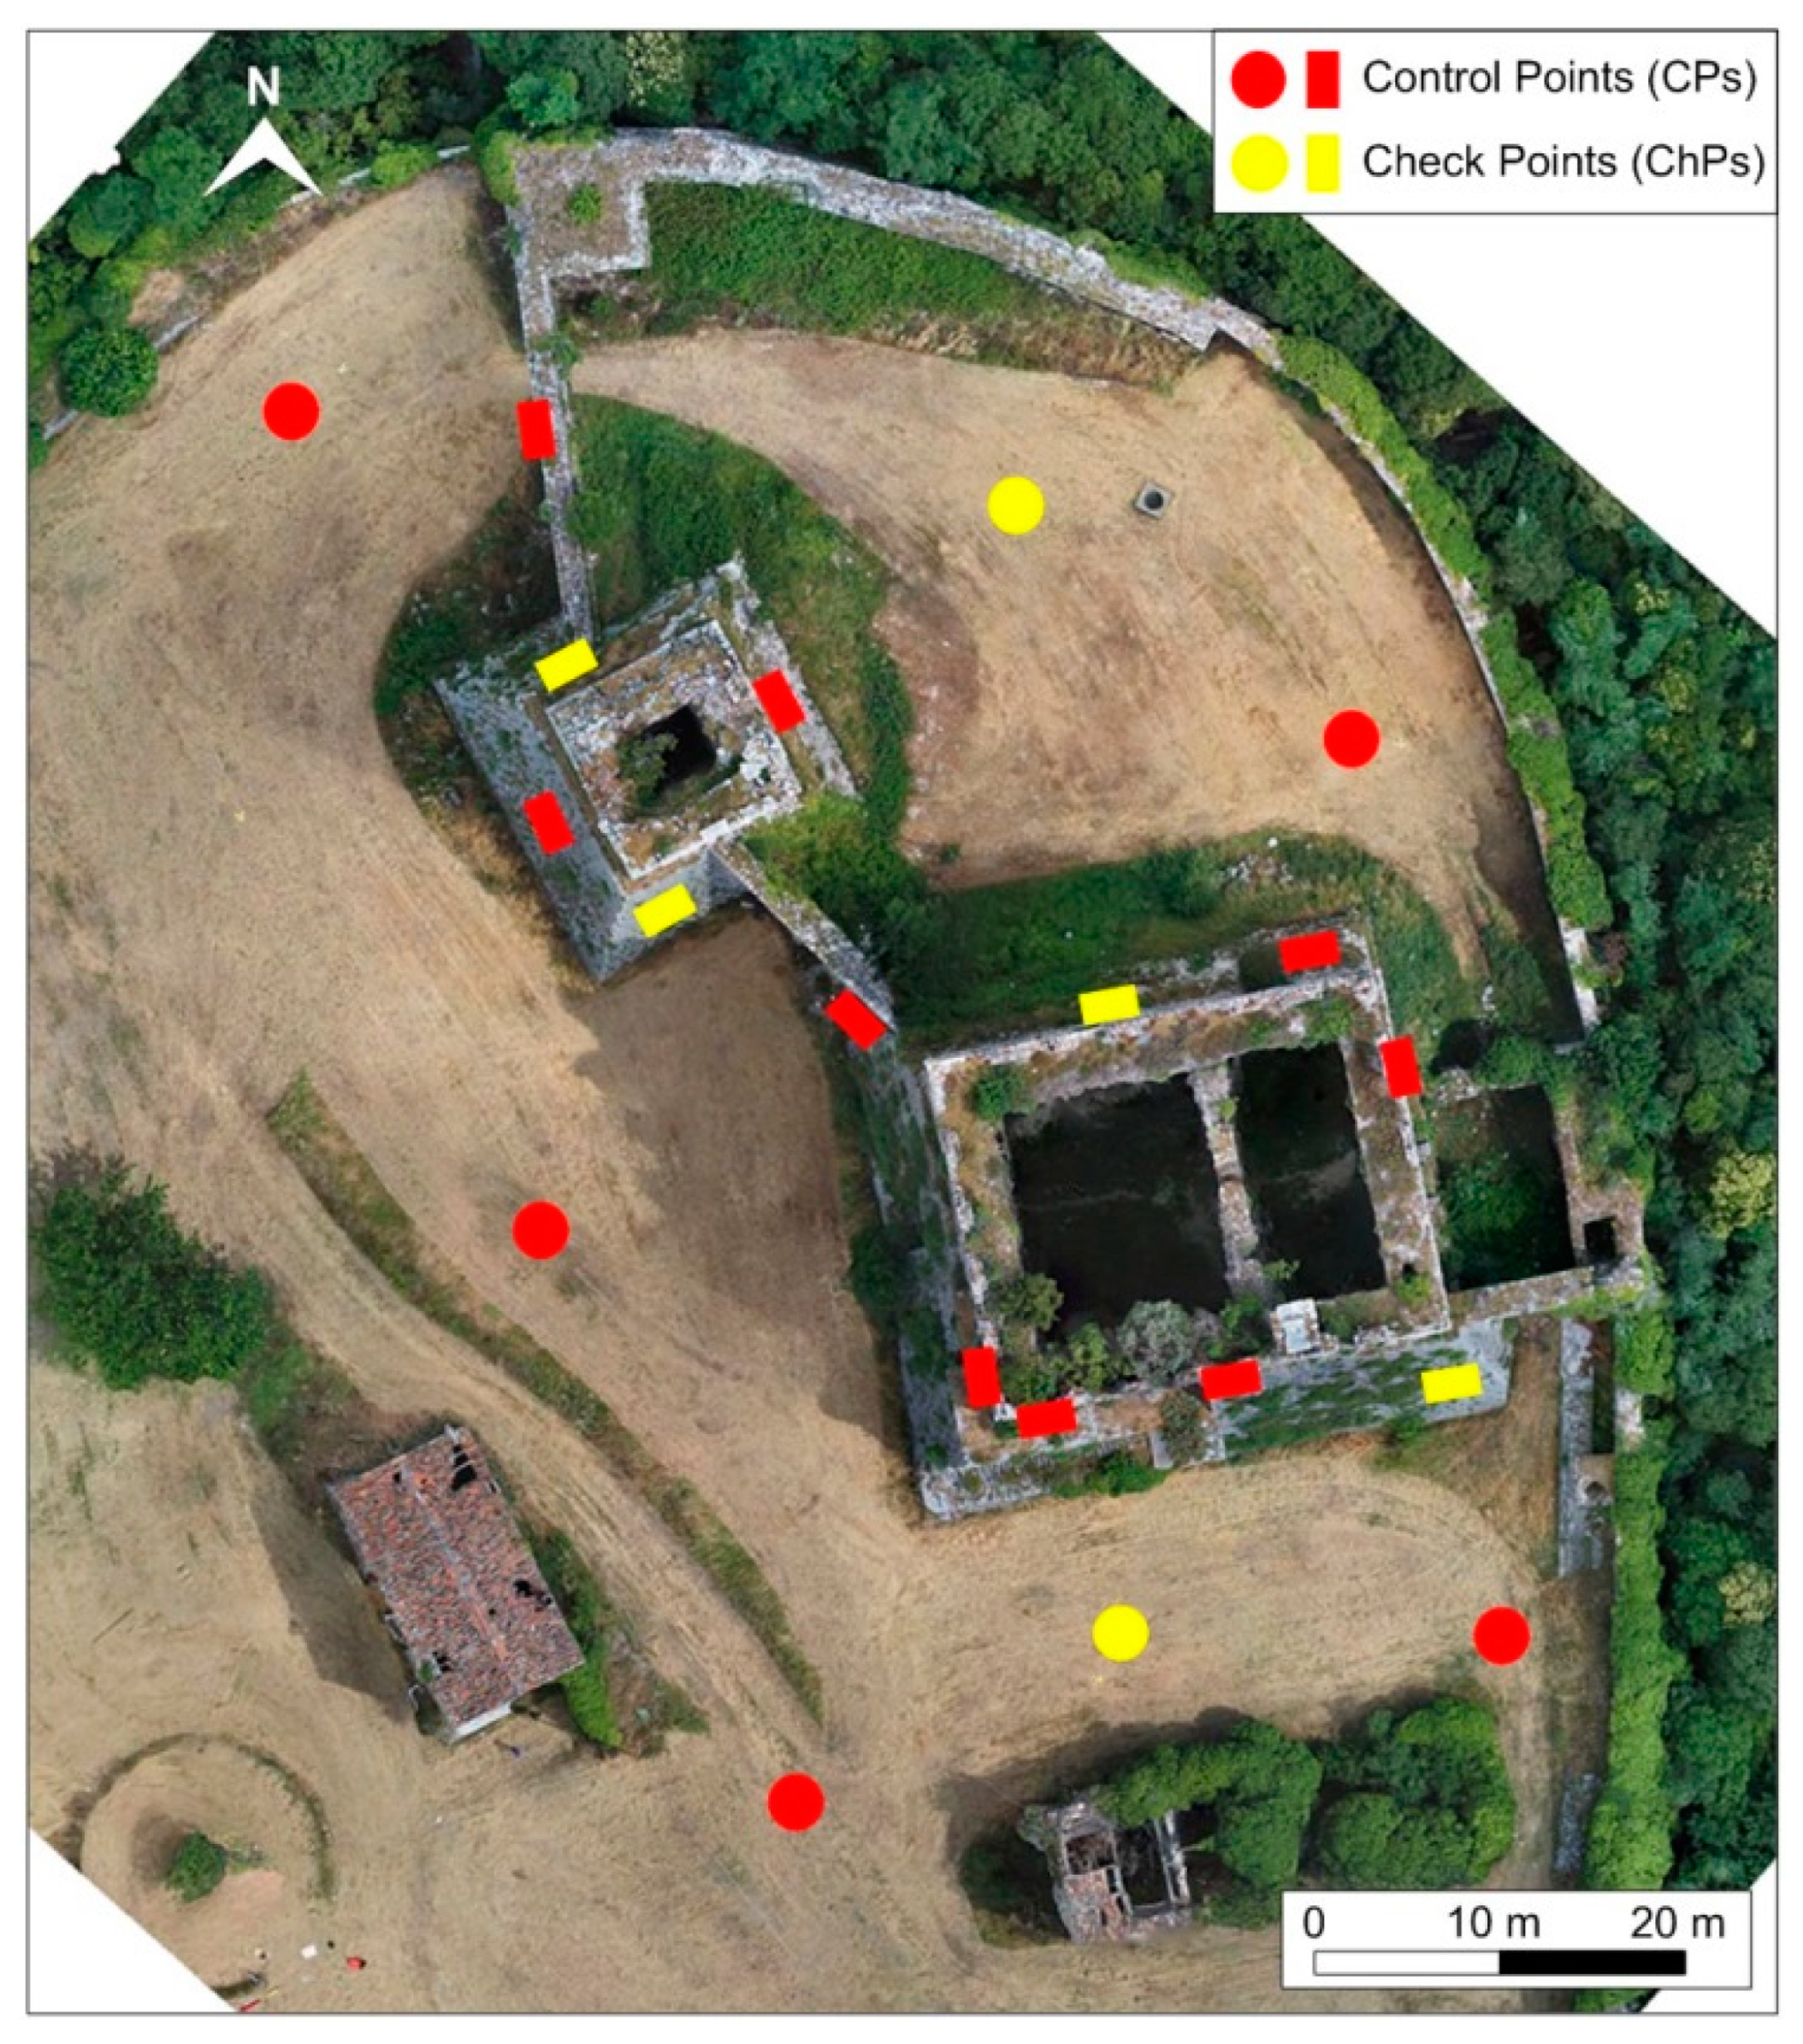
Photogrammetric 3D point clouds of the palace and the tower were generated via the SfM technique using the Agisoft Metashape software version 1.8.4 and the available reference targets. In detail, the total available points—7 ground targets and 13 wall targets (Figure 1)—were subdivided into 14 CPs (5 ground and 9 wall targets), used in model computation, and 6 ChPs (2 ground and 4 wall targets), which were not included in the processing (Figure 4).
For the photo alignment procedure, an automatic camera calibration tool was used. Subsequently, 4 different 3D models were generated using (i) the aerial-based images acquired with the drone, (ii) the ground-based images acquired with the SLR camera, (iii) the ground-based images of the tower acquired with the consumer-level smartphone camera, and (iv) the integration between the images obtained from the SLR and drone cameras. The last approach was representative of the best photogrammetric solution, integrating ground-based SLR acquisitions with images from a low-cost drone for surveying the higher portions of the buildings.
The processing parameters in the Agisoft Metashape software were set by selecting “high accuracy” for the extraction of the tie points (sparse cloud), “high quality” and “mild filtering” for the extraction of the dense cloud, and “dense cloud” and “high face count” for the extraction of the 3D mesh. The processing times on a workstation with good performance are listed in Table 1 for the different operations and datasets. It should be noted that the areas under investigation around the buildings covered by aerial and terrestrial acquisitions were very different in terms of extension, and the smartphone survey was limited to the tower. For these reasons, the models have different dimensions and the processing times had to be evaluated separately.
The processing of the dense point clouds was performed by computing the confidence values for each dataset. The results highlighted the lower reliability of point clouds corresponding to vegetated areas, some edges (especially those acquired from a complex perspective), partially shaded portions, and areas with low visibility. On the other hand, the main parts of the buildings and the ground had high confidence values, as expected.
In order to understand the potentialities and limits of a commonly available low-cost sensor in the geometric reconstruction of a historic building, the 3D model of the tower obtained from the smartphone images was extracted for a direct comparison with the point cloud provided by the SLR camera.
Moreover, the images acquired by the drone were used to extract the point cloud of the whole study area (i.e., the top of the hill that hosts the castle and surroundings).
The processing of the TLS point clouds was performed using the Cyclone software version 9.3.1, and the final 3D model was generated starting from the coordinates of the reference topographic network (the stationing of the TLS measurements) and the TLS targets.
After the generation of the different 3D global models, validation was performed for each extracted product by comparing the coordinates of the measured ChPs with those obtained by the processing.
In this context, the availability of CPs allows for the georeferencing of the data, which provides advantages for future restoration projects (here, the FE analysis was devoted to restoration), such as for the castle under investigation, while also helping to preserve the architectural and historical value of the site by providing the only complete and up-to-date survey of the buildings. Similarly, the availability of ChPs allows for an estimation of the absolute accuracy that otherwise would not be possible. Moreover, the comparison between point clouds, used to evaluate the mean distance of the two models, is possible only if the data are co-registered. In the absence of CPs, co-registration can be performed by aligning the SfM point cloud with the TLS model; however, this operation inevitably influences the results of the comparisons.
Finally, the 3D point cloud models of the castle were compared using the CloudCompare software version 2.12 alpha [39] by applying the “M3C2 distance” plugin (multiscale model to model cloud comparison (M3C2)), which is useful for determining robust signed distances directly between two aligned point clouds.
In detail, this tool allows for the calculation of the distance between two point clouds, setting one as the reference with a set of core points (using the full or resampled resolution data). In most cases, the core points are a sub-sampled version, although the computations are performed on the original full dataset. This option speeds up processing and takes into account the fact that computation results are generally required at a lower and more uniform spatial resolution [40].
To evaluate the performances of the low-cost sensors in the photogrammetric surveys, the point cloud obtained from the TLS measurements was used as a reference due to the relatively high resolution, reliability, and precision of the scanning data. Five comparisons were performed between the different datasets: (i) TLS and drone, (ii) TLS and SLR, (iii) TLS and integrated drone/SLR, (iv) TLS and smartphone, and (v) smartphone and SLR. Some specific areas of interest on the tower and castle walls were considered for more detailed distance calculations to better understand the performances of the surveys in relation to the type of surface and limitations in the geometry of the acquisitions.
4. Results and Discussion
4.1. Processing of the Point Clouds
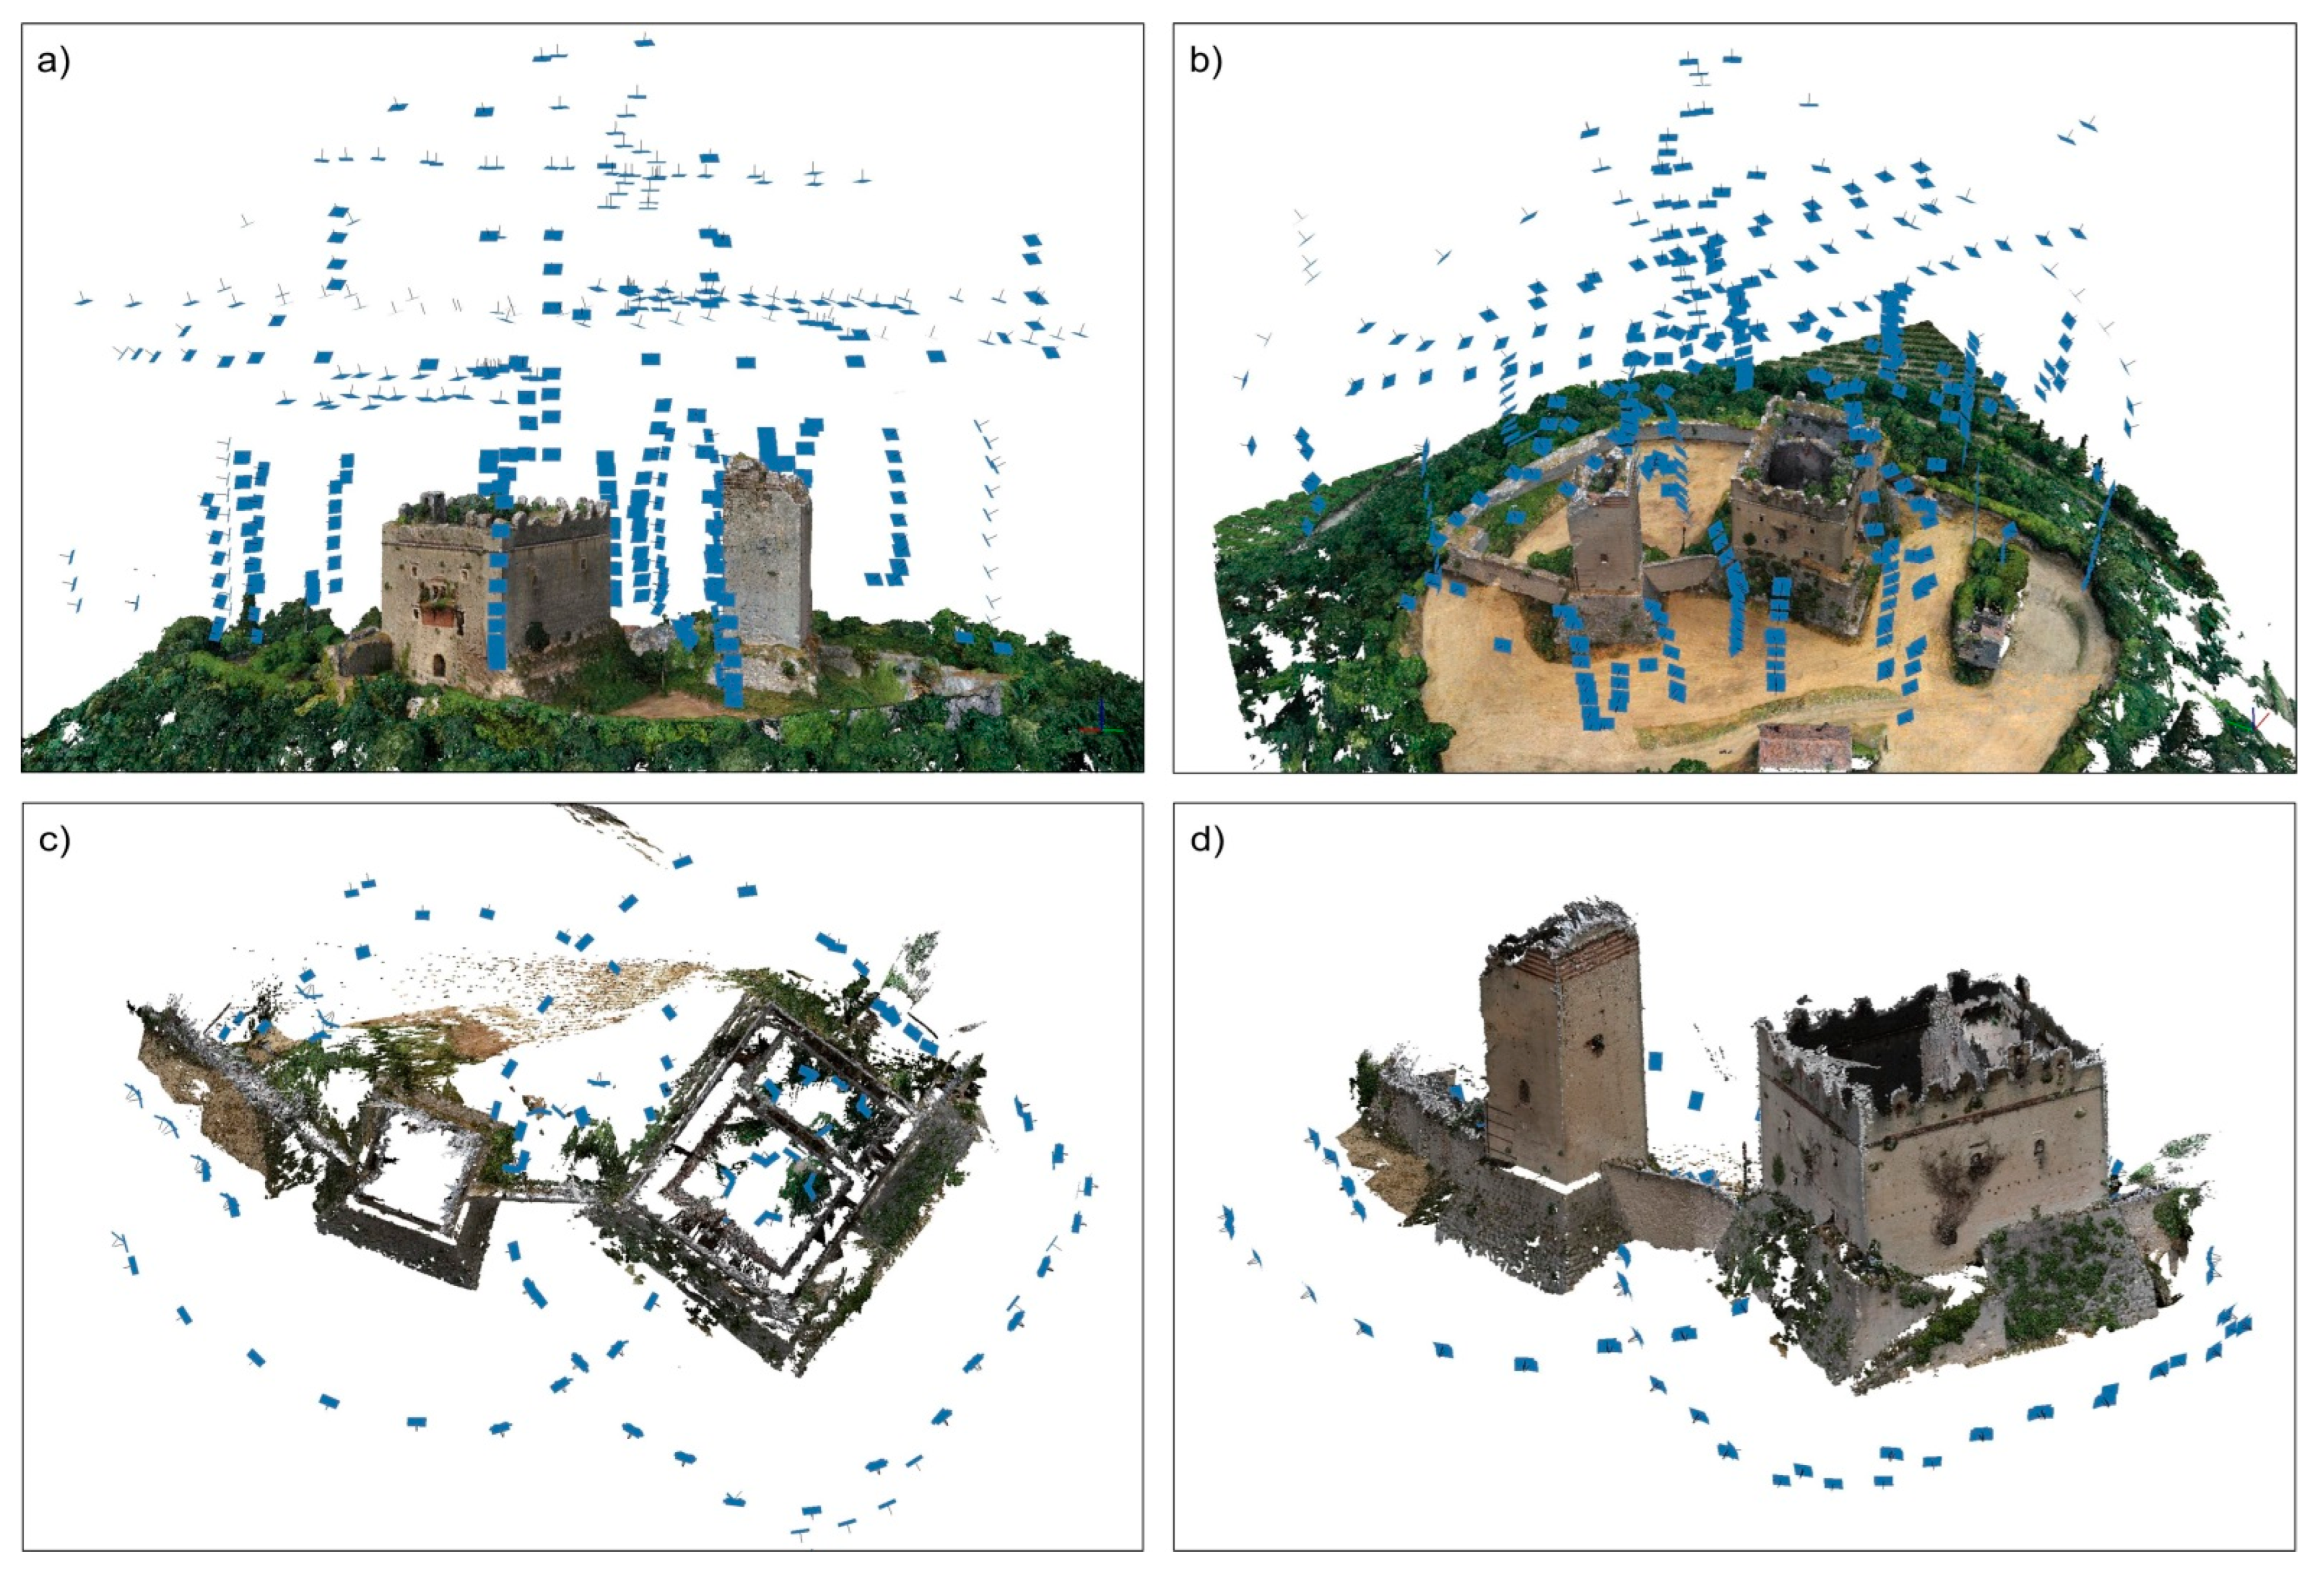
Applying the SfM technique by means of the Agisoft Metashape software, the centers of the images acquired by the drone (Figure 5a,b) and SLR (Figure 5c,d) cameras were calculated (blue flags represent the image plane).
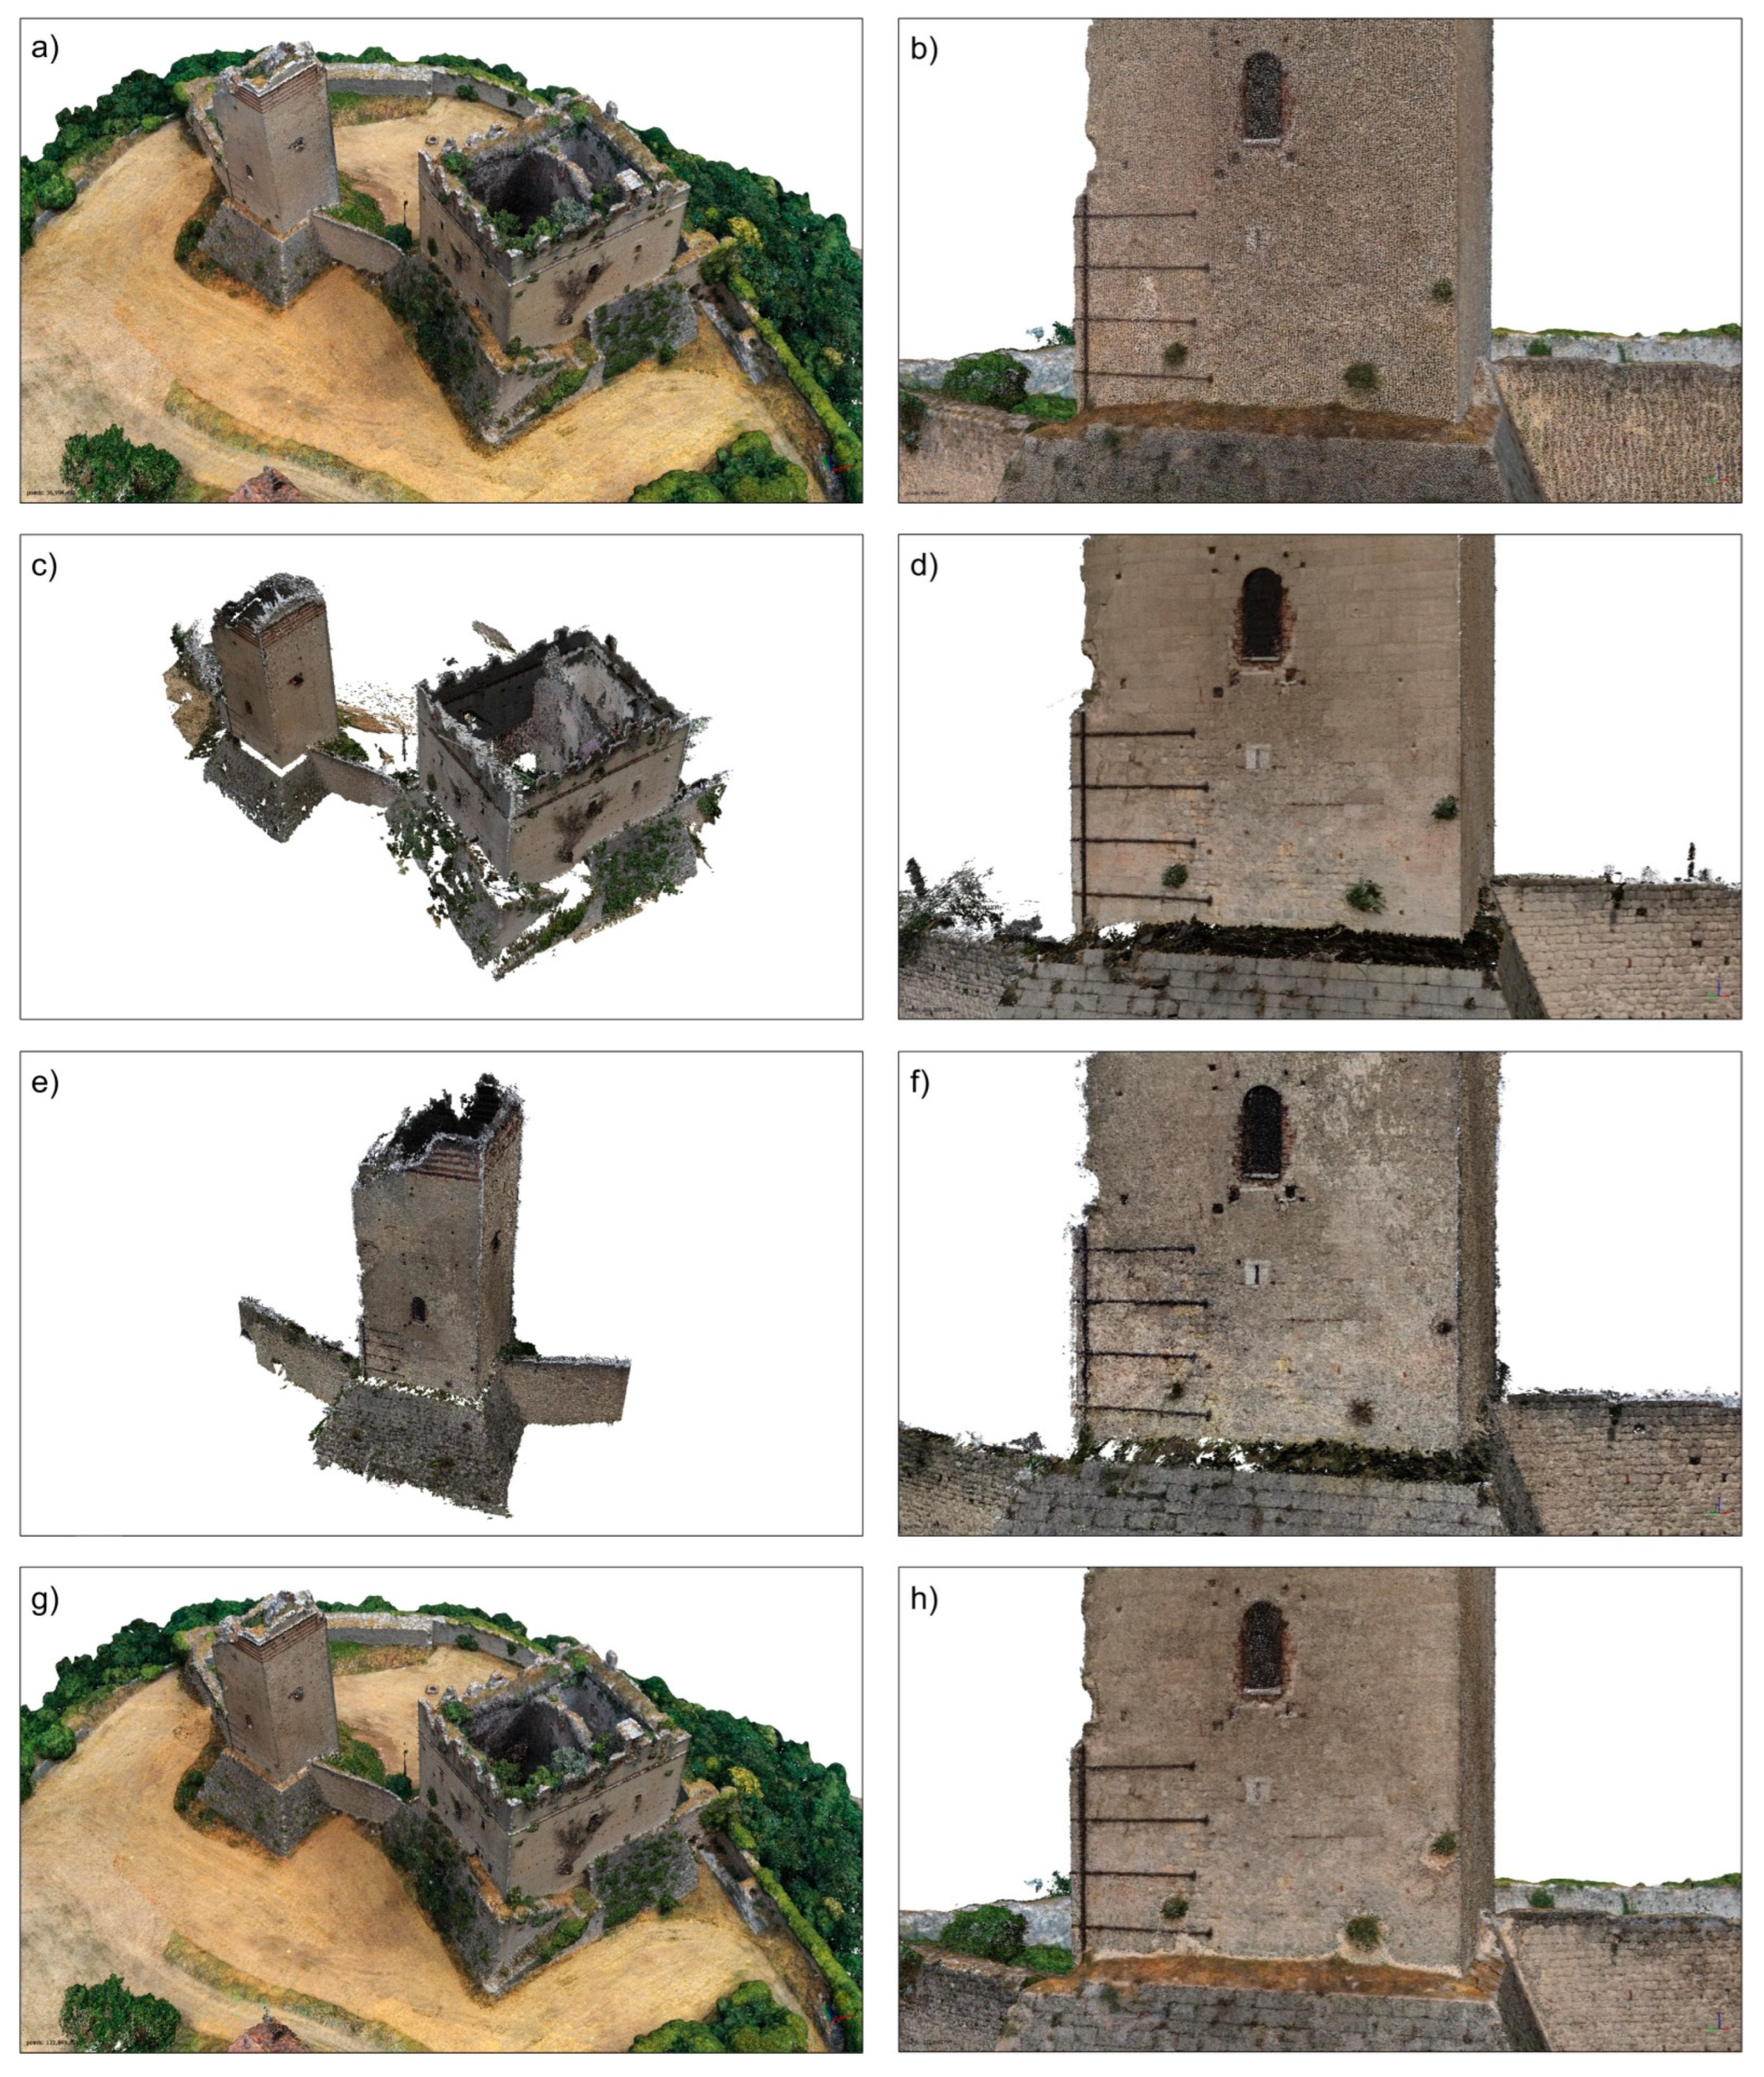
Four 3D models (both point cloud and triangular mesh models) of the castle were generated (i) using four hundred and ten images acquired with the drone and fourteen CPs (Figure 6a); (ii) using two hundred and ninety-four images acquired with the SLR camera and nine CPs (Figure 6c); (iii) using eighty-three images acquired with the smartphone camera and five CPs only for the tower (Figure 6e); and (iv) using seven hundred and four images from the drone and SLR camera together with fourteen CPs (Figure 6g). The same detail of the tower extracted using these four models is shown in Figure 6b,d,f,h, respectively.
These results highlight the differences in the four final 3D models, both in terms of the capability of detail representation (data resolution) and photographic quality. In this context, the best result with respect to completeness and cleanliness was provided by the combination of images from the SLR and drone cameras, while both the drone and smartphone models were of lower quality.
The geometric accuracy of the models was validated automatically using the Agisoft Metashape software by means of the CPs and ChPs. Table 2 provides the root-mean-square error (RMSE) of the 3D comparison for each model. Taking into account the ChPs, the best result was obtained by the model extracted using images from the SLR camera: however, data derived from the low-cost drone provided a similar RMSE value. Similar accuracies were reported by Capolupo [41], who compared the results of SfM photogrammetry with GCPs and ChPs for the All Saints’ Monastery of Cuti (Italy), and Sanseverino et al. [9], who analyzed a structure similar to that under investigation here (Calabrian fortress “Castle of Charles V”). However, in these cases, the surveys were not performed using low-cost sensors and expeditious approaches, highlighting the good results obtained in this work.
The TLS point clouds were aligned with the Cyclone software using the known coordinates of the six stations and thirteen targets. The co-registration of the scans had an average error of 3 mm, according to the results obtained in similar studies [19,26,42].
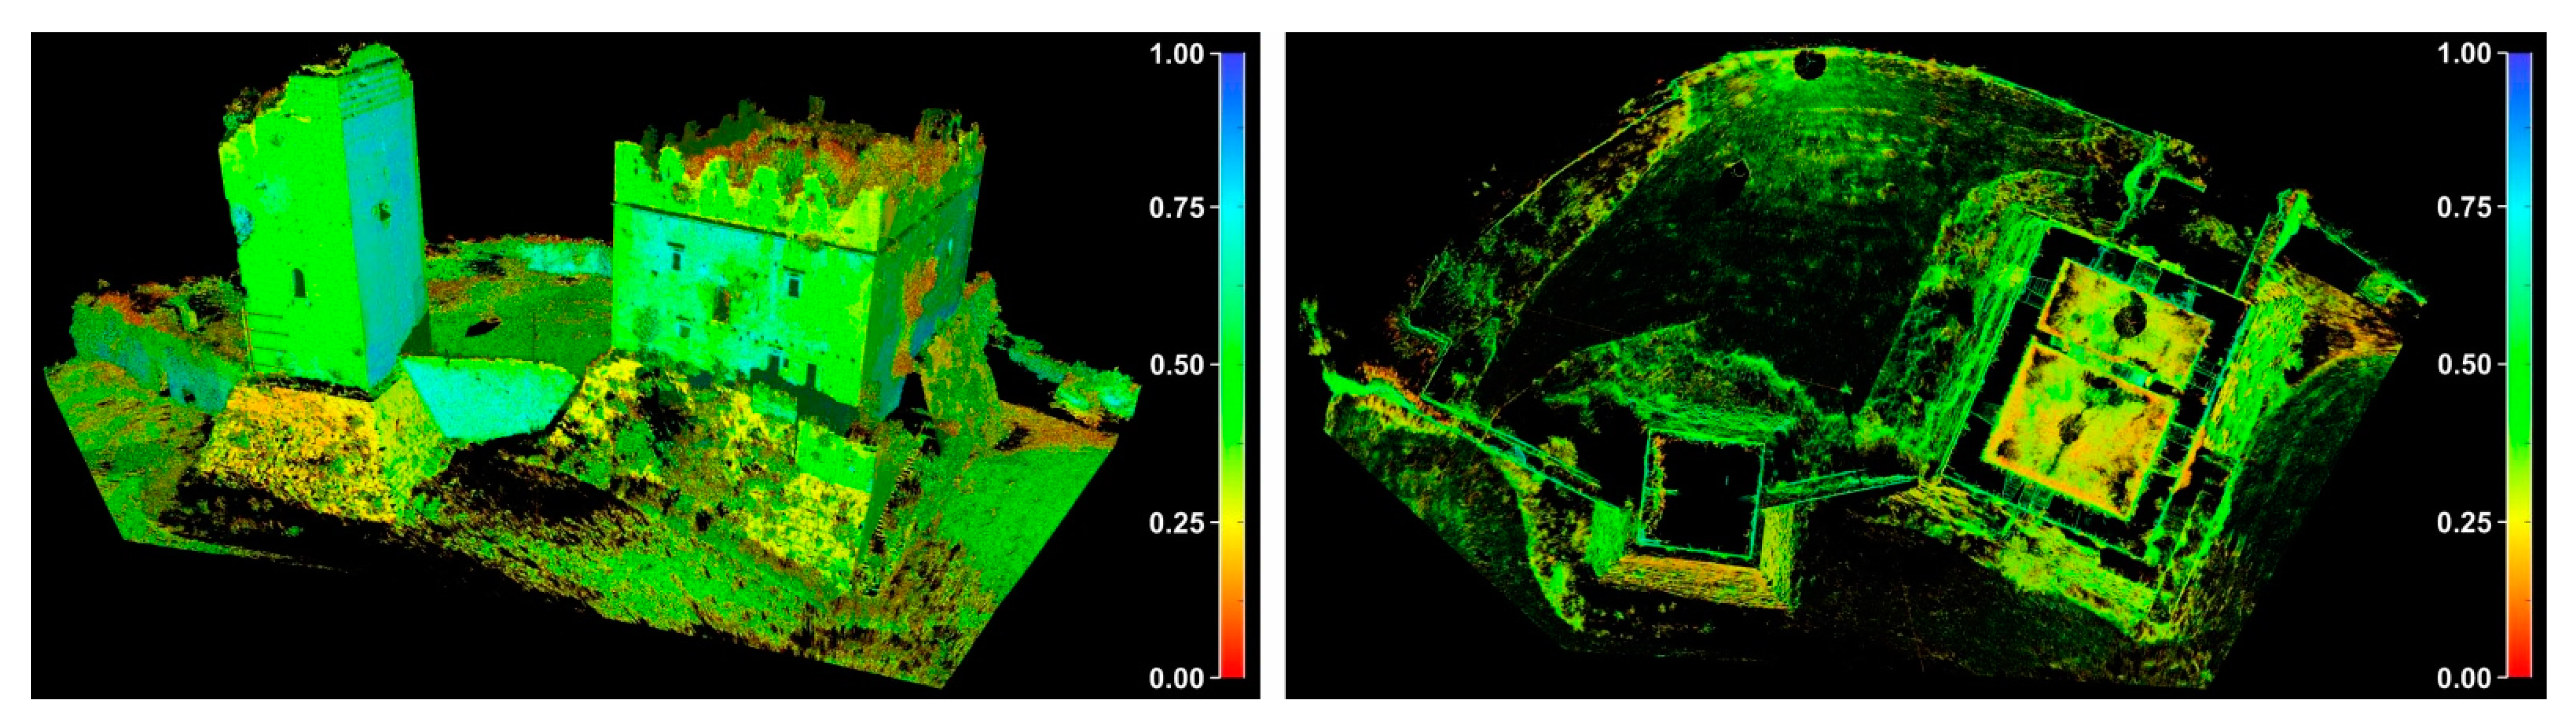
Figure 7 shows the obtained final 3D point cloud for the external walls of the tower and the palace, the internal rooms and architectural elements of the palace, and the surrounding area, representing the top of the hill where the structure is located up to the boundary walls.
4.2. Comparisons between Point Clouds
To evaluate the accuracies of the extracted low-cost photogrammetric point clouds, each of the four SfM 3D models was compared with the TLS reference model. The final TLS model was used as a reference due to the high accuracy and high resolution of the data acquired with the TLS instrument.
No filter was applied to the SfM point clouds in order to directly use all the data obtained from the processing; this choice was made because the noise produced in the data and in the low confidence points, which were different between the four datasets, influenced the comparisons and highlighted specific problems for each type of sensor. The comparisons were performed using the M3C2 distance computation plugin in CloudCompare software.
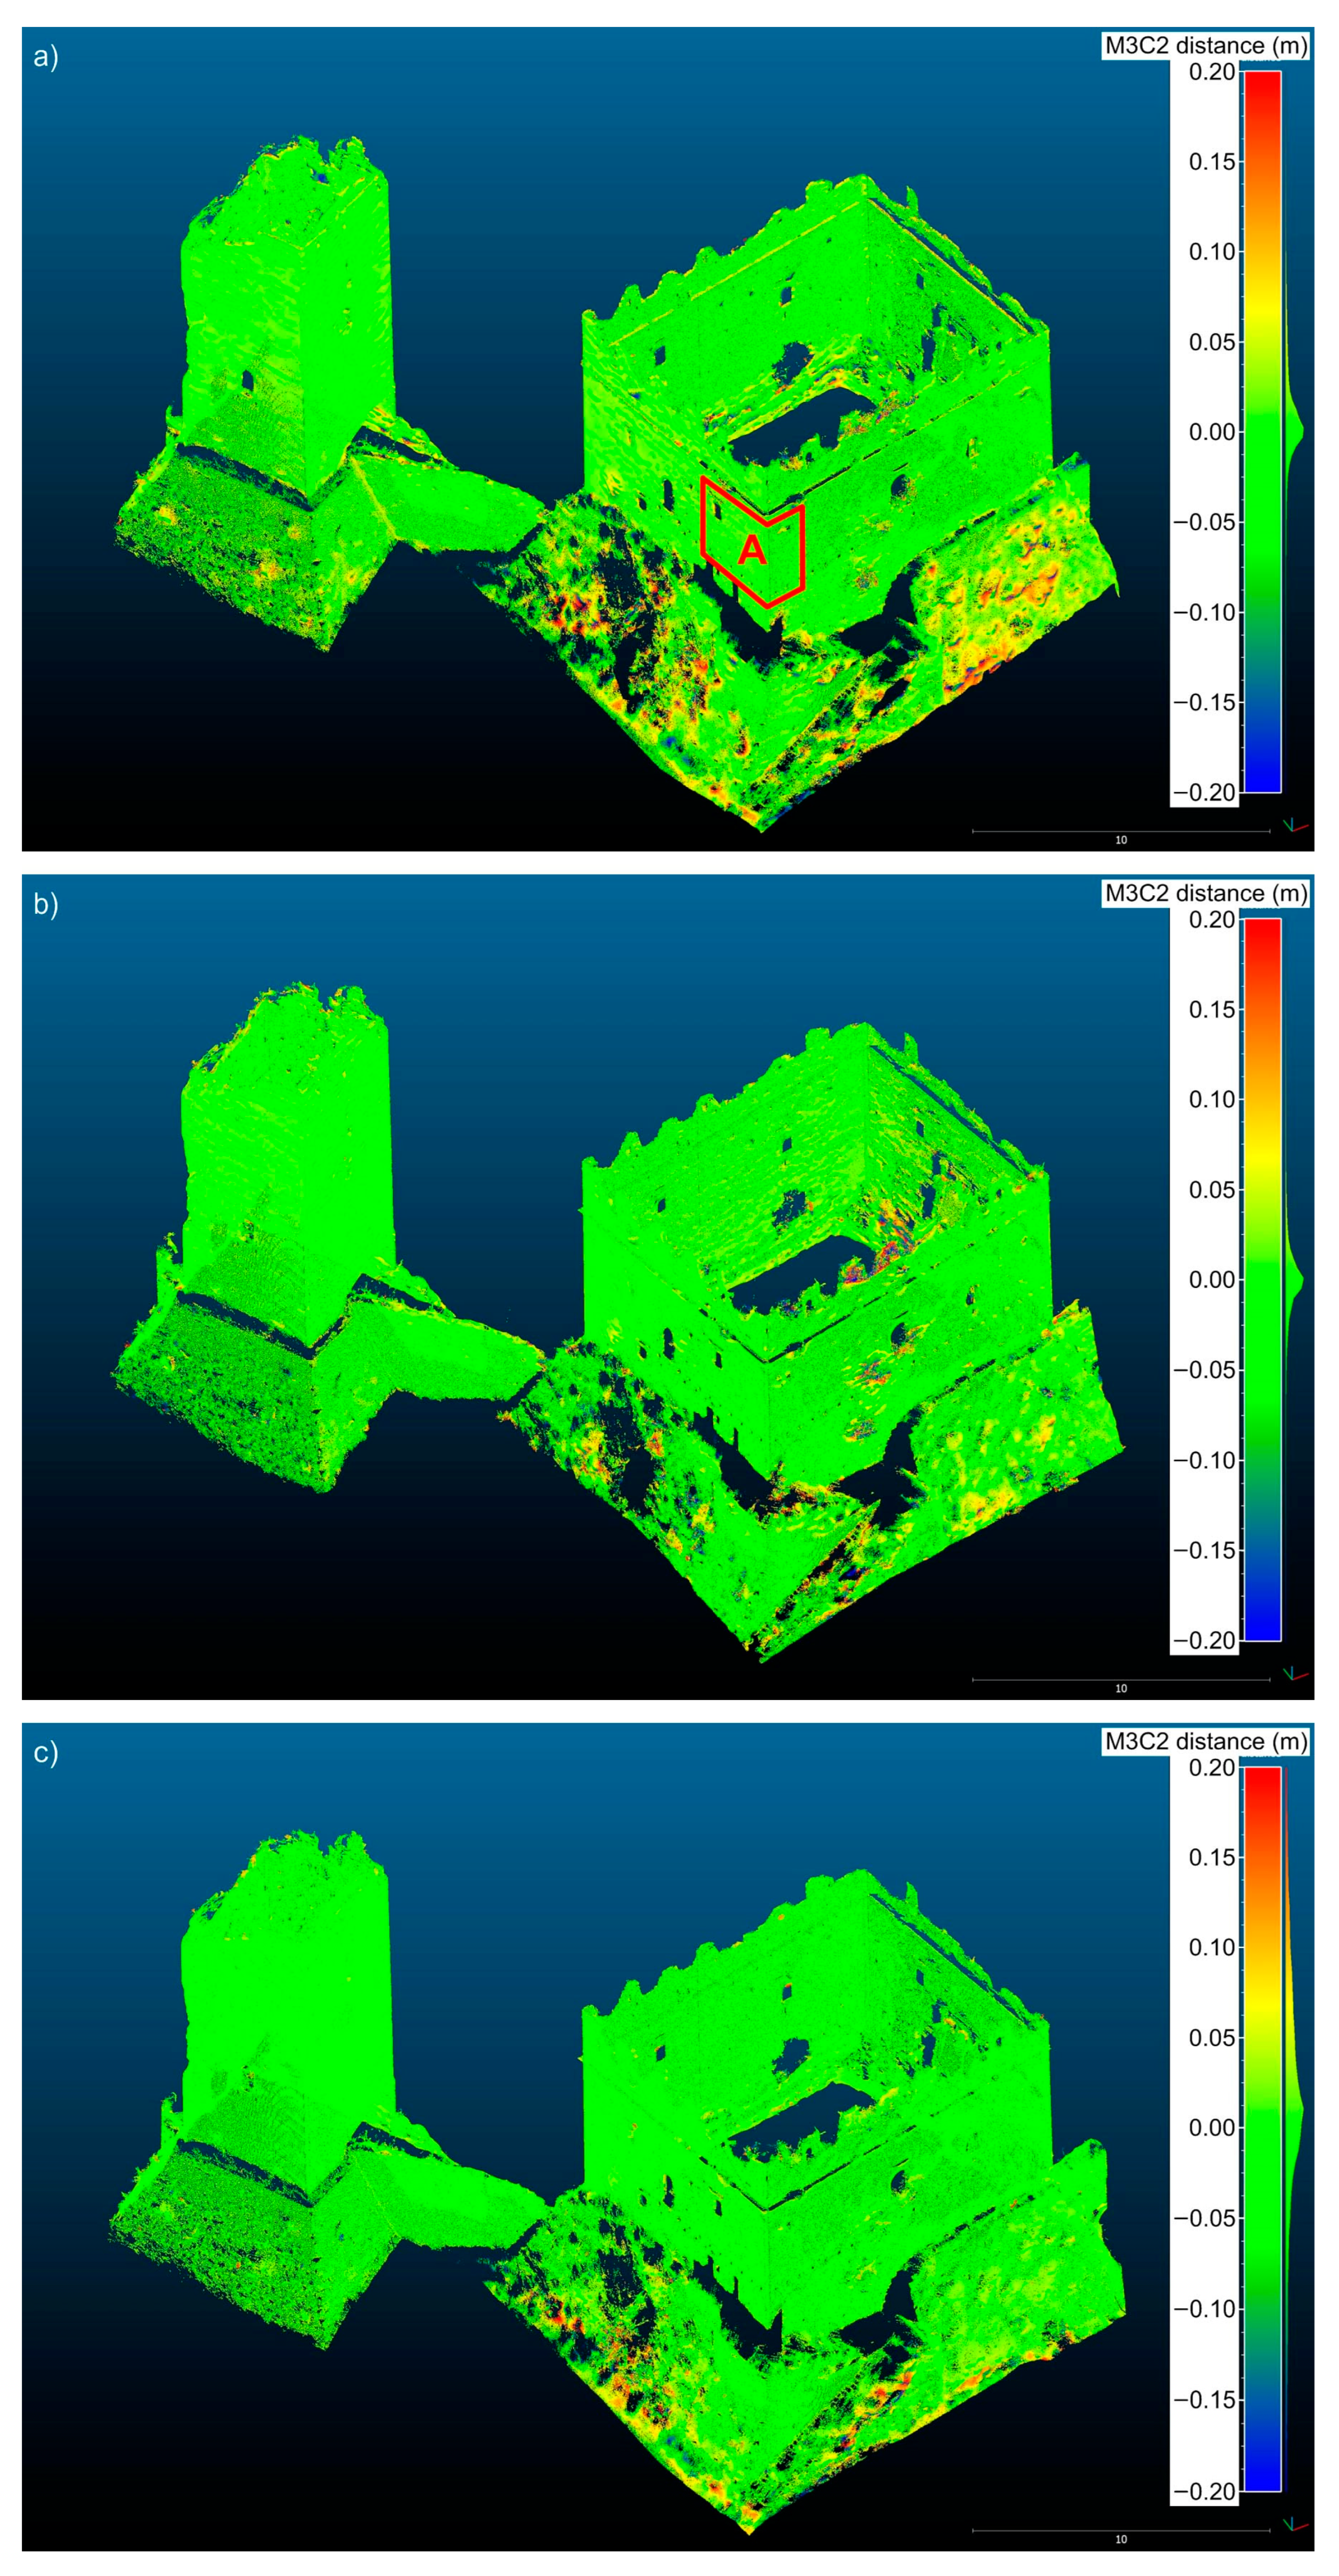
Figure 8 shows the results of the comparisons between the 3D models—TLS and drone (a), TLS and SLR (b), and TLS and drone + SLR (c)—in terms of distances between the compared point clouds. The colors, which indicate 3D distances, show maximum differences in the order of 20 cm.
The values that could be considered as outliers were mainly located in the lower part of the palace walls and the internal portions, where the vegetation (see Figure 1, Figure 3 and Figure 6) limited the reconstruction of the model, created shadow areas and, above all, represented a surface that was subject to changes during the survey.
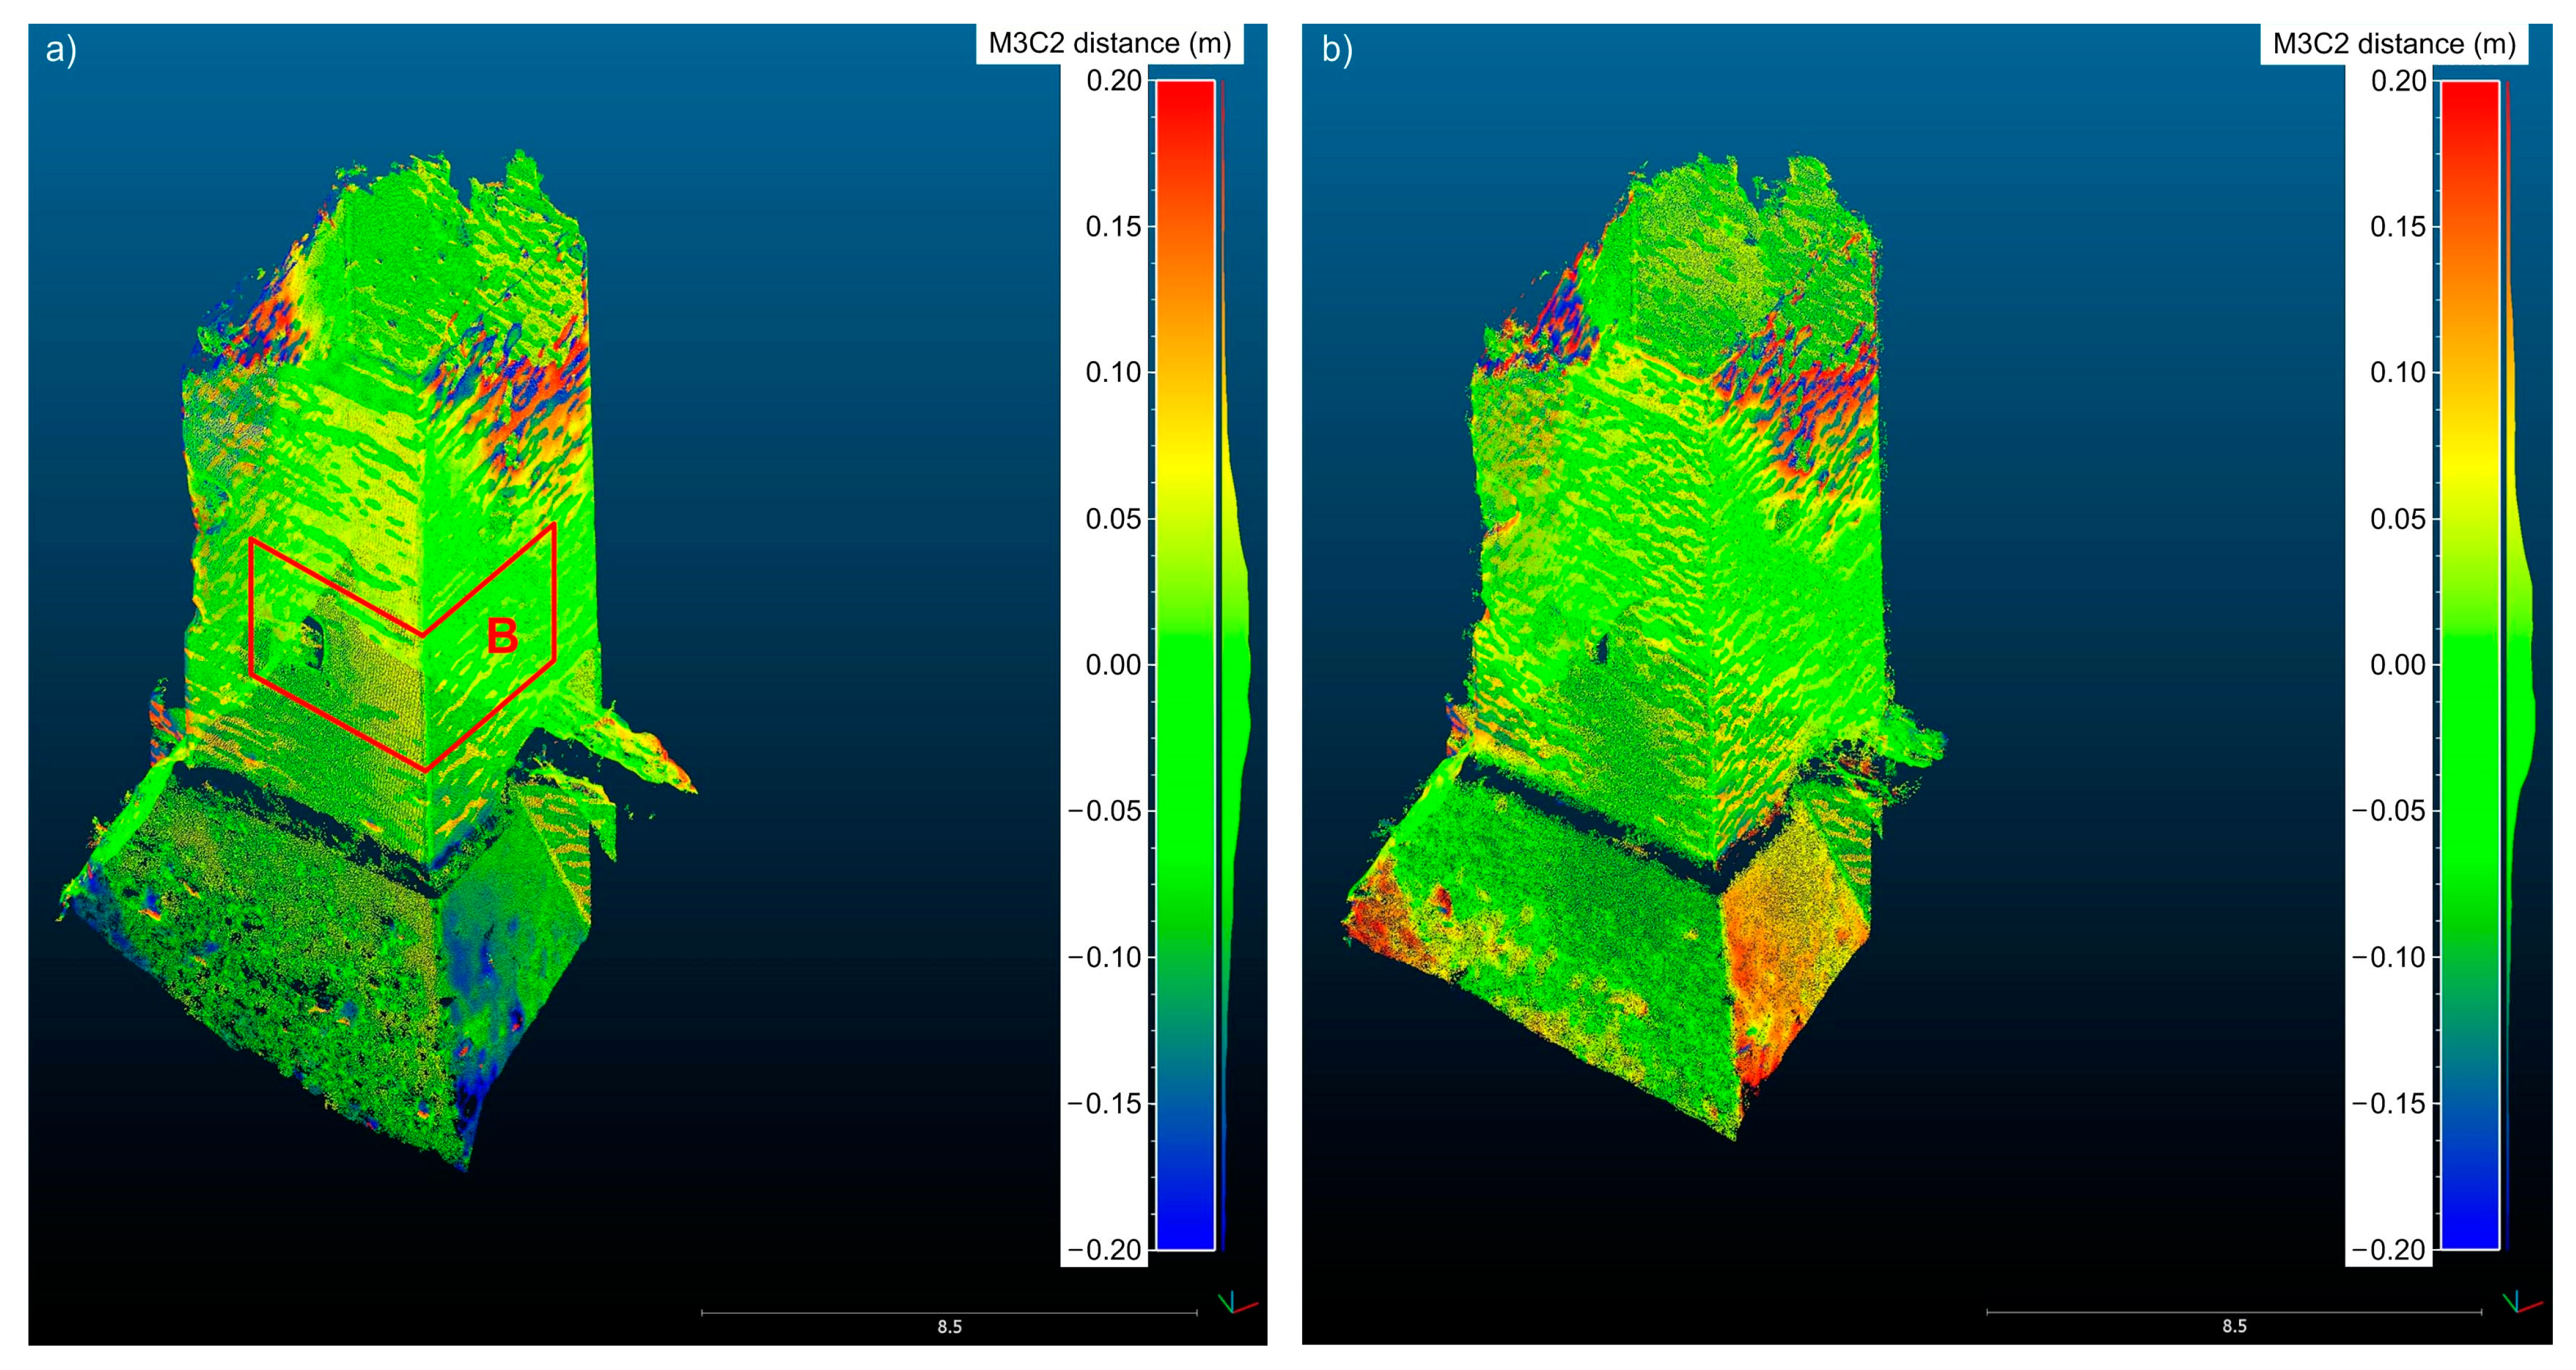
The comparisons involving the smartphone model (Figure 9, TLS and smartphone (a) and SLR and smartphone (b)), while presenting the same maximum differences included in the 20 cm range, showed more surfaces that were characterized by high distance values. This was likely due to the lower quality of the smartphone camera. In fact, (i) in the areas of the tower with more differences between the point clouds, the vegetation coverage was irrelevant (see Figure 1, Figure 3 and Figure 6), and (ii) in the same areas, the comparisons between the TLS, SLR, and drone 3D models provided good results (Figure 8). A detailed investigation highlighted that the high values were located in the upper part of the tower, over the walls connecting the tower and the palace and the tower and the boundary walls, and in the inclined walls of the lower portion, where the axis of the camera was far from being perpendicular to the surfaces. These considerations suggest a greater difficulty of the low-cost sensor in the 3D reconstruction of the structures acquired in non-optimal geometric conditions (foreshortened walls, elements in strong perspective, a complex field of view of the surfaces, etc.).
To better analyze the differences between point clouds, three areas were investigated in detail: (i) portion A of the palace (Figure 8); (ii) portion B of the tower (Figure 9); and (iii) the internal surfaces of the palace. The first two cases were considered as two elements of the walls, a corner and an opening, to generalize the study (the analyzed portion of the tower also had good conditions of acquisition for the smartphone).
Table 3 shows the results of the comparisons in terms of mean distance and standard deviation for the analysis of all available data. High standard deviation values, from 9.6 cm to 11.9 cm, were obtained using all the generated 3D data (including the portions with vegetation); these values were drastically reduced after taking into account only areas A and B (i.e., walls without vegetation). In the last case, the best results were obtained when comparing the TLS and SLR models in area A and the TLS and Drone + SLR models in area B; in addition, the values of the comparison between TLS and SfM were in agreement with those obtained by Monego et al. [43], who compared TLS and SfM 3D models of a rocky spire. Moreover, similar values were obtained by Moyano et al. [44], who validated SfM photogrammetry for heritage applications by analyzing and comparing the point density and the 3D mesh geometry obtained using the TLS technique for a 15th-century façade of Casa de Pilatos in Seville (Spain), a building comparable to the one under investigation. The comparison between smartphone and SLR, although not necessary given the results of the TLS and SLR, and TLS and smartphone comparisons, better clarified the limits, in terms of accuracies, of the SfM technique with the sensors used here.
It should be noted that, with respect to the smartphone 3D model (area B), the standard deviation of the comparison with the TLS final point cloud was decreased by 51% compared with the best SfM solution (Drone + SLR). Moreover, a standard deviation of 7.1 cm was obtained when comparing the smartphone and Drone + SLR 3D models. Although these results are noteworthy, only one specific smartphone was used in this work; in future studies, other smartphone sensors will be tested in order to better analyze their performances.
In the internal part of the palace, the comparison with TLS data was performed considering only the SfM 3D model obtained by integrating the images acquired with the drone and SLR cameras. This was because data from the drone were characterized as distorted images due to the impossibility of flying inside the rooms. Similarly, the images acquired from the ground of the upper part of the internal walls with the SLR camera had complex geometry. The integration between the two datasets was carried out to improve the final 3D SfM model. The obtained data were compared with the TLS model, and the differences between the point clouds generated a high standard deviation value (7.7 cm). The reasons for this could be (i) the explained complex photogrammetric geometric acquisitions and/or (ii) the presence of vegetation on the walls that the photogrammetric technique had more difficulty penetrating (see above) compared to the TLS method. For these reasons, the final 3D model of the palace was created via the integration of two contributions: (i) the SfM data derived from the integration of the images acquired with the drone and SLR cameras for the external surfaces due to better coverage of the shadow areas when compared to the TLS acquisitions (there were few TLS stations, Figure 1), and (ii) the TLS point cloud for the internal portion due to the low accuracy of the SfM results (Figure 10). In this case, to provide a reliable 3D model for the FE analysis, the integration of the low-cost and expeditious SfM technique with the high-cost TLS data was necessary. On one side, in general, if the FE model of a substantial structure, such as the one investigated in this work, is not very sensitive to uncertainties of a few centimeters, which are typical of the SfM technique, the results will still be acceptable; on the other hand, the complex conditions of image acquisition and the presence of significant localized vegetation in the internal portion of the palace generated artifacts in the geometry of the 3D photogrammetric model that, in many cases, could influence the structural analysis by changing the results of the FE model. In this context, the ability of the TLS technique to better penetrate the vegetation made it easier to eliminate these artifacts in the subsequent editing operations. For these reasons, the use of the TLS technique—only for critical areas and where it was strictly necessary—slightly extended the time of the survey.
4.3. Structural Analysis
The geometric 3D survey of the surfaces combined with investigations that allowed for the analysis of the characteristics of the materials and construction of the structural elements made it possible to define the resistant system of the palace. From this, once the actions on the building were defined, local and global seismic analyses were carried out on the basis of Italian legislation. For local mechanisms, rigid body kinematics analyses were performed. For global mechanisms, with the aid of an FE model, modal and pushover analyses (static non-linear) were carried out in the four main directions.
The FE model was created starting from the 3D survey. For this type of degraded historical building, the simplified 3D model was acceptable [45]. The geometric volume was created using the Leica Cyclone 3DR and Autodesk AutoCAD 2020 software version 23.1.47.0. Plans and sections were automatically extracted from the 3D model by imposing an interdistance of 1 m using the former software: a reference plane and the offset value were fixed in order to progressively intersect the point cloud along a specific direction. This creates a set of planar sections in the form of polylines, computed by interpolation between the points of the cloud and the reference plane. Subsequently, using the latter software, polylines were imported and edited to remove noise and vegetation. Points in the range of significant cut planes were used as a reference to generate, through solid modeling procedures, basic 3D shapes; from 3D shapes, the complex geometry of the building was then generated with Boolean operations. This was possible because the FE analysis of massive structures, such as the one investigated in this study, generally does not require detailed models; a few centimeters of 3D model uncertainty do not lead to significant variations in the FE model. The solid model obtained, which contains information on all geometric properties (vertices, edges, faces, and volumes) was imported into Midas FEA NX software version 1.2.0.
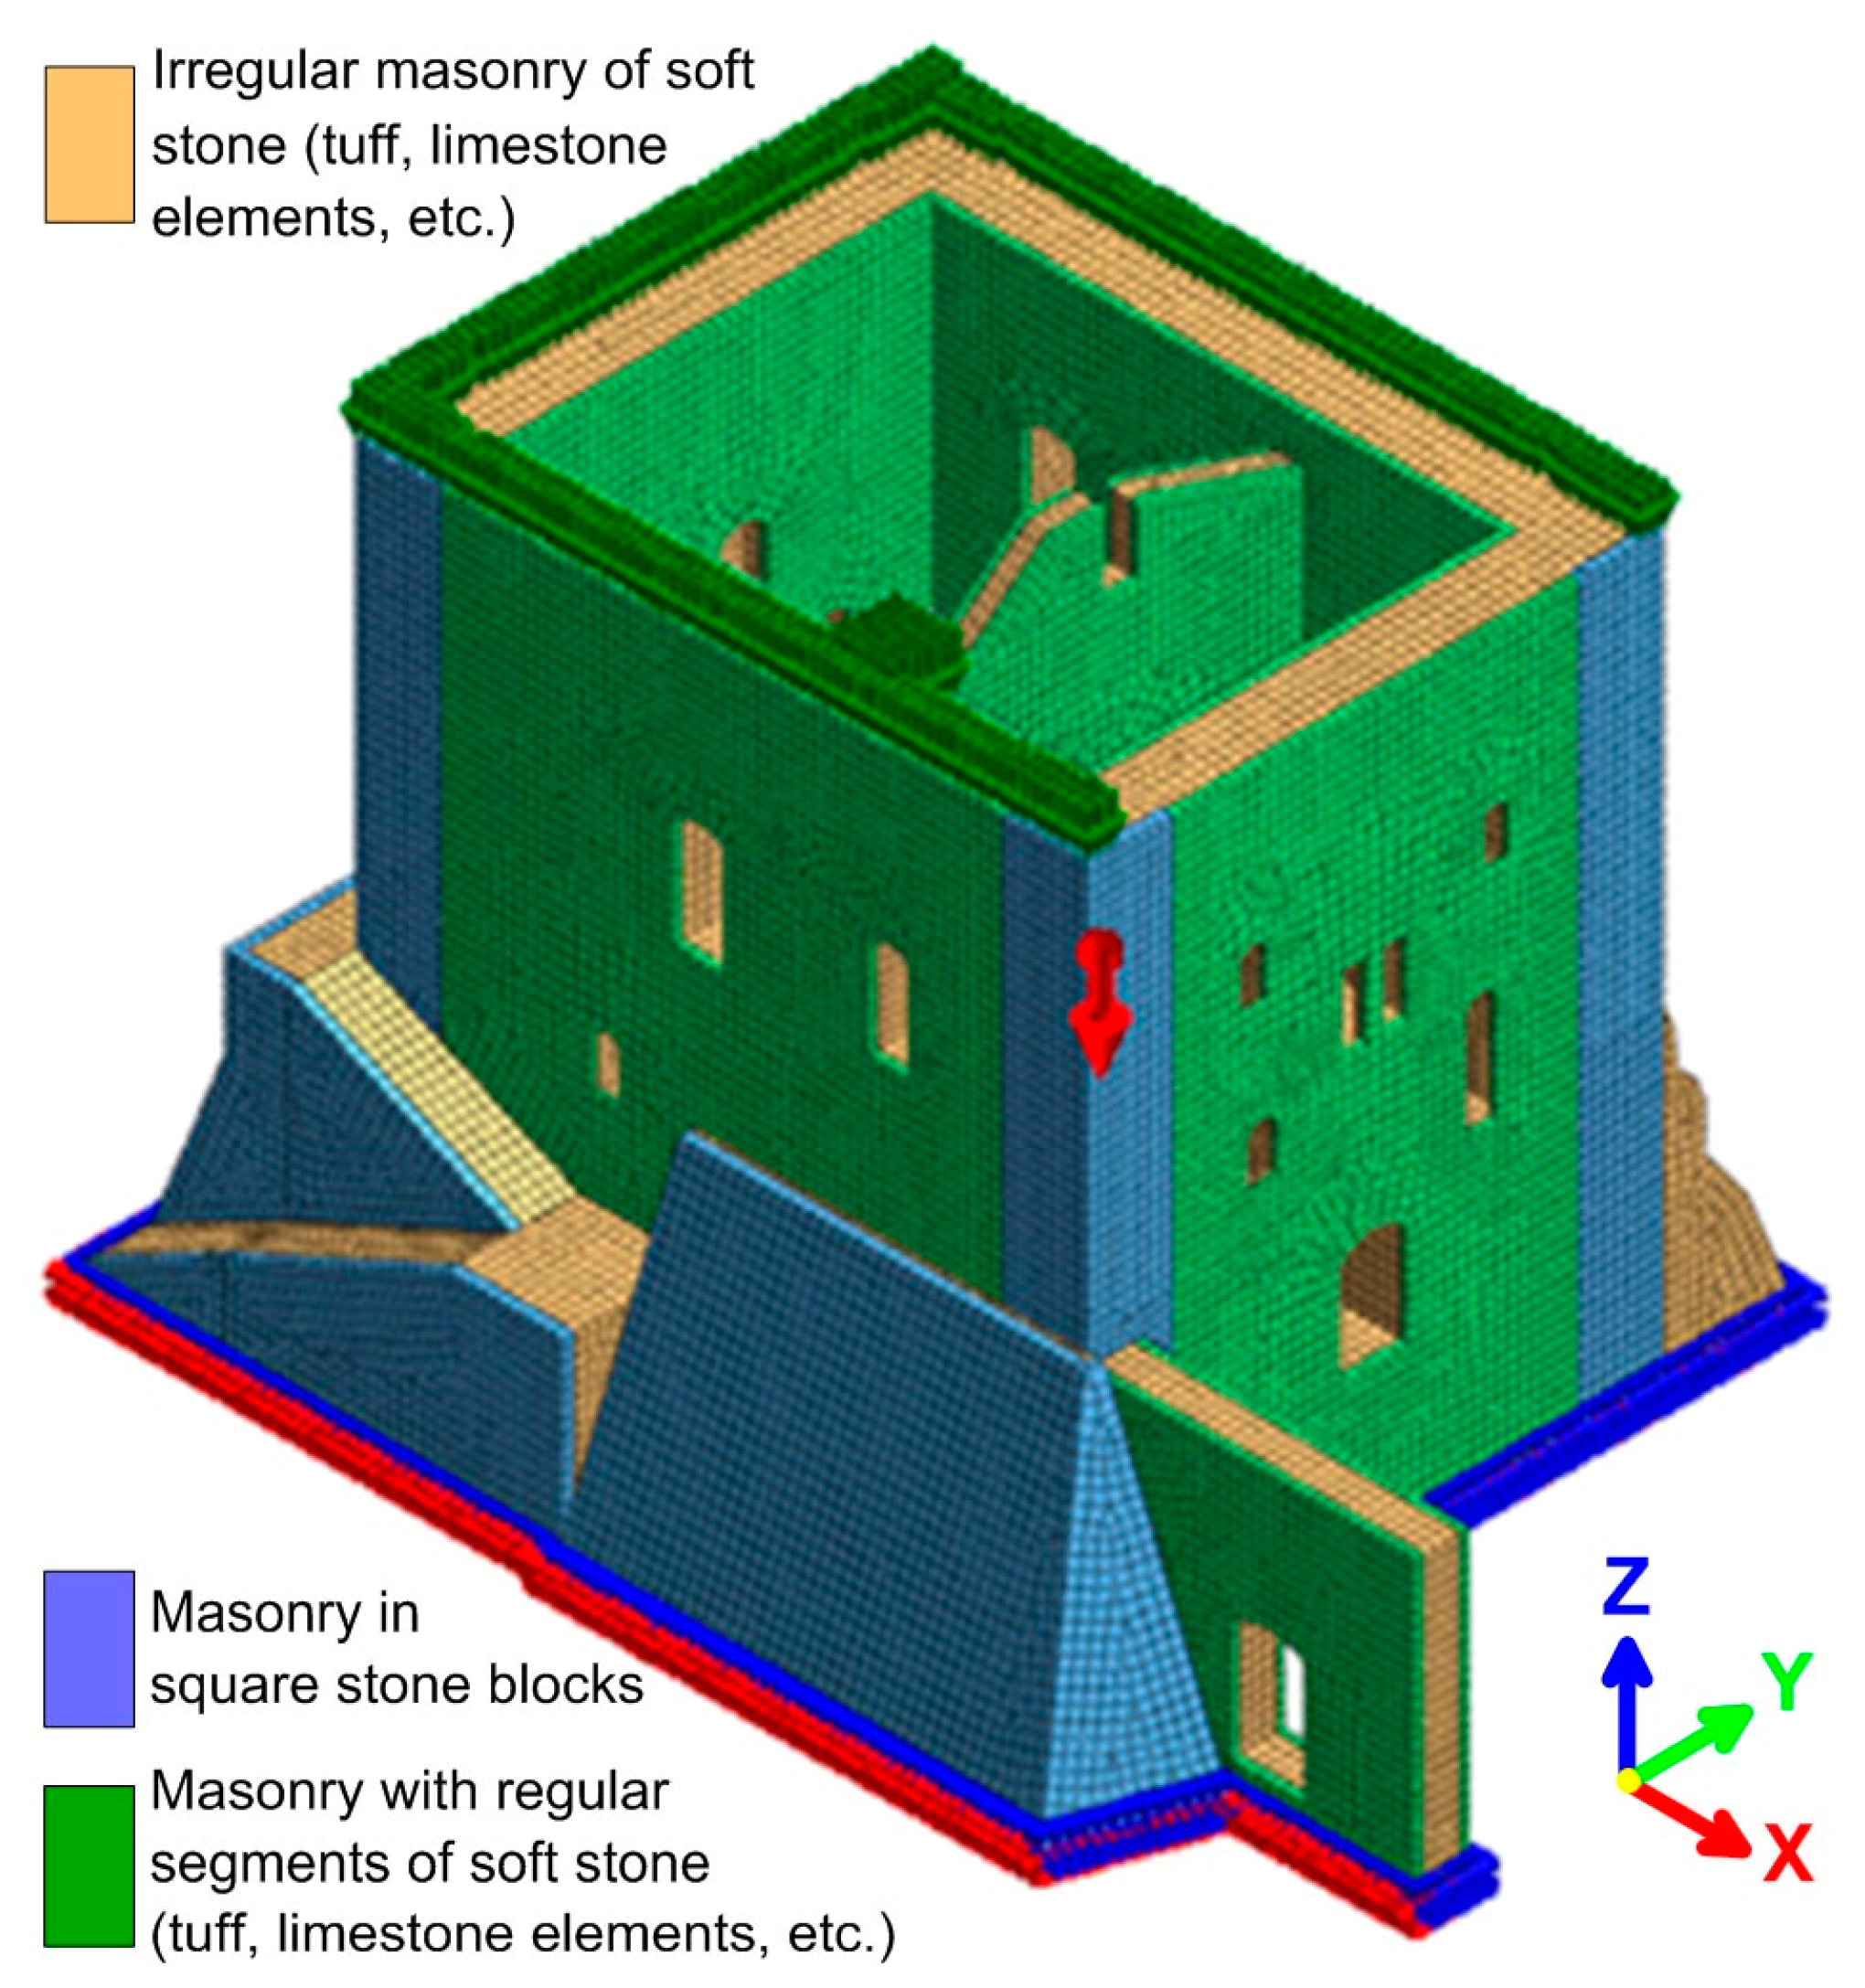
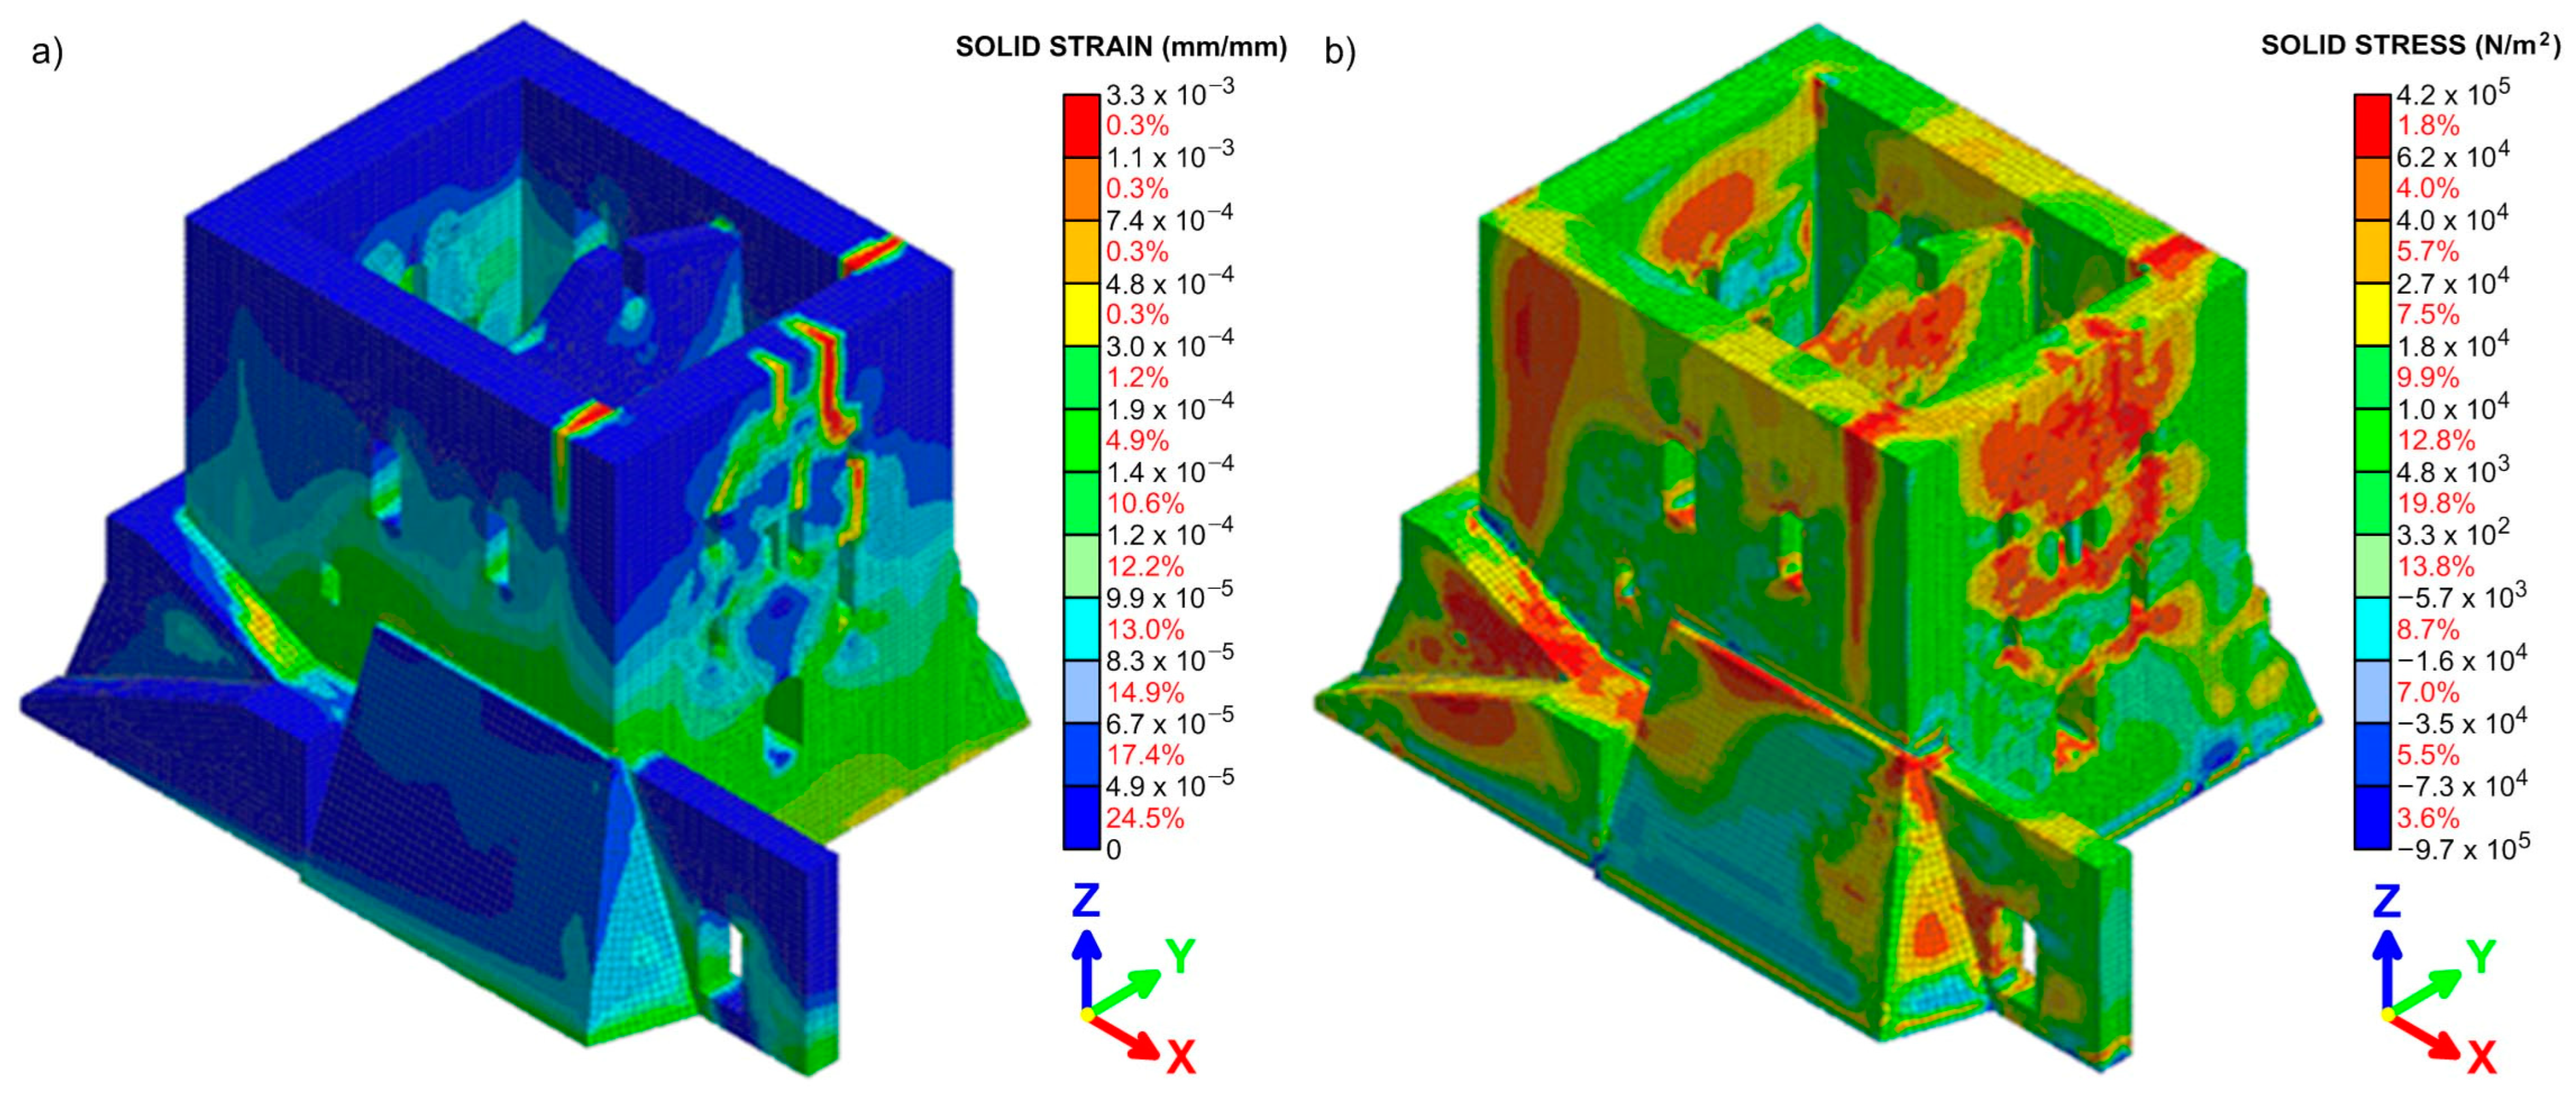
Starting from the geometry, the 3D FE discretization was carried out; the properties of the materials were attributed to the finite elements (separately for each of the wall types identified in the survey phase for the different portions of the walls [24,46]). Moreover, the gravitational loads for the pushover analysis were applied (Figure 11). The obtained results for one of the analyzed directions (in particular, along the X-axis) in terms of main strain and main stresses are shown in Figure 12.
These results were confirmed by applying the same structural analysis procedure to the 3D model extracted using only the high-cost and high-precision TLS data; no significant differences were obtained in the FE analysis with respect to the expeditious and low-cost 3D model.
On the basis of the analyses of the local and global collapse mechanisms, a safety assessment of the structure was carried out. The controls on the mechanisms were performed in terms of the relationship between seismic capacity and seismic acceleration demand. For the unsatisfied controls, an increase in safety level must be obtained with global or local interventions.
5. Conclusions
In this work, low-cost sensors and expeditious surveys were applied to generate reliable 3D models. Illasi Castle, a degraded historical building in Italy, was surveyed for structural analysis. Since very high accuracies were not required for this type of object, a low-cost drone, an SLR camera, and a smartphone were used to acquire images, and 3D models were extracted by applying SfM photogrammetry. Together with the images, a TLS survey was performed to validate the SfM models and integrate the 3D data where unsatisfactory results were obtained. All data were acquired in a single working day.
SfM photogrammetry using low-cost sensors can generate geometrically reliable point clouds. In the application considered here, an RMSE of up to 2–3 cm could be achieved. In this context, the use of a consumer-level smartphone (sensors that are increasingly used in SfM) demonstrated adequate performance considering the purposes of the survey, with a standard deviation of up to 4–7 cm when compared to the TLS and standard SfM data. In particular, taking into account the smartphone sensor used in this work, performances were strongly influenced by the geometric acquisitions, with standard deviation values that degraded rapidly when moving away from optimal conditions. It should be noted that further investigations are still required. Future studies should consider the use of different smartphones, conditions of acquisition, objects (surfaces), inclinations, fields of view, perspectives, camera–object distances, etc.
In the case study presented here, ground-based TLS acquisitions generated a shadow area in the upper portion of the walls. In this case, the use of a drone equipped with a laser scanner sensor increases the costs of the survey, while the high accuracies obtained using this technique in many cases are not required.
From the results of the structural analysis, comparable values for the relationship between the capacity and demand of the local and global mechanisms affecting the same portion of the structure were observed. Finally, a correlation between the crack pattern of the structures and the concentrations of main strains and stresses in the FE model was observed from the global analyses.
Author Contributions
Conceptualization, M.F.; methodology, M.F. and M.M.; software, M.F., P.F.G. and M.M.; validation, M.F., P.F.G. and M.M.; formal analysis, M.F. and M.M.; investigation, M.F. and M.M.; resources, M.F.; data curation, M.F.; writing—original draft preparation, M.F.; writing—review and editing, M.F., P.F.G. and M.M.; visualization, M.F. and M.M.; supervision, M.F.; project administration, M.F. All authors have read and agreed to the published version of the manuscript.
Funding
This research received no external funding.
Data Availability Statement
Not applicable.
Acknowledgments
The authors would like to thank the following Institutions: the Laboratory of Geomatics and Surveying and the Department of Civil, Environmental, and Architectural Engineering staff of the University of Padova.
Conflicts of Interest
The authors declare no conflict of interest.
References
- Grussenmeyer, P.; Landes, T.; Voegtle, T.; Ringle, K. Comparison methods of terrestrial laser scanning, photogrammetry and tacheometry data for recording of cultural heritage buildings. In Proceedings of the International Archives of the Photogrammetry, Remote Sensing and Spatial Information Sciences, Beijing, China, 3–11 July 2008; pp. 213–218. [Google Scholar]
- Fabris, M.; Boatto, G.; Achilli, V. 3D Laser scanning surveys in the modelling of cultural heritage. In Recent Advances in Non-Destructive Inspection; Meola, C., Ed.; Nova Science Publishers: New York, NY, USA, 2011; pp. 1–31. [Google Scholar]
- Fabris, M.; Achilli, V.; Artese, G.; Bragagnolo, D.; Menin, A. High resolution survey of Phaistos Palace (Crete) by TLS and terrestrial photogrammetry. In Proceedings of the International Archives of the Photogrammetry, Remote Sensing and Spatial Information Sciences, Melbourne, Australia, 25 August–1 September 2012; Volume XXXIX-B5, pp. 81–86. [Google Scholar] [CrossRef]
- Moropoulou, A.; Labropoulos, K.; Delegou, E.T.; Karoglou, M.; Bakolas, A. Non-destructive techniques as a tool for the protection of built cultural heritage. Constr. Build. Mater. 2013, 48, 1222–1239. [Google Scholar] [CrossRef]
- Santagati, C.; Lo Turco, M. From structure from motion to historical building information modeling: Populating a semantic-aware library of architectural elements. J. Electron. Imaging 2017, 26, 011007. [Google Scholar] [CrossRef]
- Bartoš, K.; Pukanská, K.; Repáň, P.; Kseňak, L.; Sabová, J. Modelling the Surface of Racing Vessel’s Hull by Laser Scanning and Digital Photogrammetry. Remote Sens. 2019, 11, 1526. [Google Scholar] [CrossRef]
- Selvaggi, I.; Bitelli, G.; Serantoni, E.; Wieser, A. Point cloud dataset and FEM for a complex geometry: The San Luzi bell tower case study. In Proceedings of the GEORES 2019—2nd International Conference of Geomatics and Restoration, Milan, Italy, 8–10 May 2019; Volume XLII-2/W11, pp. 1047–1052. [Google Scholar] [CrossRef]
- Plata, A.R.M.d.l.; Franco, P.A.C.; Franco, J.C.; Gibello Bravo, V. Protocol Development for Point Clouds, Triangulated Meshes and Parametric Model Acquisition and Integration in an HBIM Workflow for Change Control and Management in a UNESCO’s World Heritage Site. Sensors 2021, 21, 1083. [Google Scholar] [CrossRef] [PubMed]
- Sanseverino, A.; Messina, B.; Limongiello, M.; Guida, C.G. An HBIM Methodology for the Accurate and Georeferenced Reconstruction of Urban Contexts Surveyed by UAV: The Case of the Castle of Charles V. Remote Sens. 2022, 14, 3688. [Google Scholar] [CrossRef]
- Berrett, B.E.; Vernon, C.A.; Beckstrand, H.; Pollei, M.; Markert, K.; Franke, K.W.; Hedengren, J.D. Large-Scale Reality Modeling of a University Campus Using Combined UAV and Terrestrial Photogrammetry for Historical Preservation and Practical Use. Drones 2021, 5, 136. [Google Scholar] [CrossRef]
- Xu, Z.; Wu, L.; Shen, Y.; Li, F.; Wang, Q.; Wang, R. Tridimensional Reconstruction Applied to Cultural Heritage with the Use of Camera-Equipped UAV and Terrestrial Laser Scanner. Remote Sens. 2014, 6, 10413–10434. [Google Scholar] [CrossRef]
- Bitelli, G.; Dellapasqua, M.; Girelli, V.; Sanchini, E.; Tini, M. 3D geomatics techniques for an integrated approach to Cultural Heritage knowledge: The case of San Michele in Acerboli’s church in Santarcangelo di Romagna. In Proceedings of the International Archives of the Photogrammetry, Remote Sensing and Spatial Information Sciences, Florence, Italy, 22–24 May 2017; Volume XLII-5/W1, pp. 291–296. [Google Scholar] [CrossRef] [Green Version]
- Monego, M.; Menin, A.; Fabris, M.; Achilli, V. 3D survey of Sarno Baths (Pompeii) by integrated geomatic methodologies. J. Cult. Herit. 2019, 40, 240–246. [Google Scholar] [CrossRef]
- Chen, X.; Achilli, V.; Fabris, M.; Menin, A.; Monego, M.; Tessari, G.; Floris, M. Combining Sentinel-1 Interferometry and Ground-Based Geomatics Techniques for Monitoring Buildings Affected by Mass Movements. Remote Sens. 2021, 13, 452. [Google Scholar] [CrossRef]
- Betti, M.; Bonora, V.; Galano, L.; Pellis, E.; Tucci, G.; Vignoli, A. An Integrated Geometric and Material Survey for the Conservation of Heritage Masonry Structures. Heritage 2021, 4, 585–611. [Google Scholar] [CrossRef]
- Bartoli, G.; Betti, M.; Facchini, L.; Orlando, M. Non-destructive characterization of stone columns by dynamic test: Application to the lower colonnade of the Dome of the Siena Cathedral. Eng. Struct. 2012, 45, 519–535. [Google Scholar] [CrossRef]
- Lysandrou, V.; Agapiou, A. Comparison of documentation techniques for the restoration and rehabilitation of cultural heritage monuments: The example of Pyrgos ‘Troulli’ medieval tower in Cyprus. In Proceedings of the Third International Euro-Mediterranean Conference, EuroMed 2010, Lemessos, Cyprus, 8–13 November 2010. [Google Scholar]
- Solla, M.; Gonçalves, L.M.S.; Gonçalves, G.; Francisco, C.; Puente, I.; Providência, P.; Gaspar, F.; Rodrigues, H. A Building Information Modeling Approach to Integrate Geomatic Data for the Documentation and Preservation of Cultural Heritage. Remote Sens. 2020, 12, 4028. [Google Scholar] [CrossRef]
- Pieraccini, M.; Dei, D.; Betti, M.; Bartoli, G.; Tucci, G.; Guardini, N. Dynamic identification of historic masonry towers through an expeditious and no-contact approach: Application to the “Torre del Mangia” in Siena (Italy). J. Cult. Herit. 2014, 15, 275–282. [Google Scholar] [CrossRef]
- Xu, W.; Neumann, I. Finite Element Analysis based on A Parametric Model by Approximating Point Clouds. Remote Sens. 2020, 12, 518. [Google Scholar] [CrossRef]
- Ding, Y.; Zheng, X.; Zhou, Y.; Xiong, H.; Gong, J. Low-Cost and Efficient Indoor 3D Reconstruction through Annotated Hierarchical Structure-from-Motion. Remote Sens. 2019, 11, 58. [Google Scholar] [CrossRef]
- Shih, N.-J.; Wu, Y.-C. AR-Based 3D Virtual Reconstruction of Brick Details. Remote Sens. 2022, 14, 748. [Google Scholar] [CrossRef]
- Tucci, G.; Bartoli, G.; Betti, M.; Bonora, V.; Korumaz, M.; Korumaz, A.G. Advanced procedure for documenting and assessment of Cultural Heritage: From Laser Scanning to Finite Element. IOP Conf. Ser. Mater. Sci. Eng. 2018, 364, 012085. [Google Scholar] [CrossRef] [Green Version]
- Ghiassi, B.; Vermeltfoort, A.; Lourenço, P. Masonry Mechanical Properties. In Numerical Modelling of Masonry and Historical Structures—From Theory to Application, 1st ed.; Ghiassi, B., Milani, G., Eds.; Woodhead Publishing: Sawston, UK; Elsevier: Cambridge, UK, 2019; pp. 239–261. [Google Scholar]
- Hinks, T.; Carr, H.; Truong-Hong, L.; Laefer, D.F. Point Cloud Data Conversion into Solid Models via Point-Based Voxelization. J. Surv. Eng. 2013, 139, 72–83. [Google Scholar] [CrossRef]
- Barazzetti, L.; Banfi, F.; Brumana, R.; Gusmeroli, G.; Oreni, D.; Previtali, M.; Schiantarelli, G. BIM from laser clouds and finite element analysis: Combining structural analysis and geometric complexity. In Proceedings of the International Archives of the Photogrammetry, Remote Sensing and Spatial Information Sciences, Ávila, Spain, 25–27 February 2015; Volume XL-5/W4, pp. 345–350. [Google Scholar] [CrossRef]
- Castellazzi, G.; D’Altri, A.M.; Bitelli, G.; Selvaggi, I.; Lambertini, A. From Laser Scanning to Finite Element Analysis of Complex Buildings by Using a Semi-Automatic Procedure. Sensors 2015, 15, 18360–18380. [Google Scholar] [CrossRef]
- Sánchez-Aparicio, L.J.; Villarino, A.; García-Gago, J.; González-Aguilera, D. Photogrammetric, Geometrical, and Numerical Strategies to Evaluate Initial and Current Conditions in Historical Constructions: A Test Case in the Church of San Lorenzo (Zamora, Spain). Remote Sens. 2016, 8, 60. [Google Scholar] [CrossRef]
- Bassier, M.; Hardy, G.; Bejarano-Urrego, L.; Drougkas, A.; Verstrynge, E.; Van Balen, K.; Vergauwen, M. Semi-automated Creation of Accurate FE Meshes of Heritage Masonry Walls from Point Cloud Data. In Structural Analysis of Historical Constructions: An Interdisciplinary Approach; RILEM Bookseries, 18; Springer International Publishing: Cham, Switzerland, 2019; pp. 305–314. [Google Scholar] [CrossRef]
- Rissolo, D.; Hess, M.R.; Huchim Herrera, J.; Lo, E.; Petrovic, V.; Amador, F.E.; Kuester, F. Comprehensive digital documentation and preliminary structural assessment of Satunsat: A unique Maya architectural labyrinth at Oxkintok, Yucatan, Mexico. In Proceedings of the International Archives of the Photogrammetry, Remote Sensing and Spatial Information Sciences, Ávila, Spain, 1–5 September 2019; Volume XLII-2/W15, pp. 989–992. [Google Scholar] [CrossRef]
- Bruno, N.; Coïsson, E.; Diotri, F.; Ferrari, L.; Mikolajewska, S.; Morra di Cella, U.; Roncella, R.; Zerbi, A. History, Geometry, Structure: Interdisciplinary analysis of a historical bridge. In Proceedings of the International Archives of the Photogrammetry, Remote Sensing and Spatial Information Sciences, Milan, Italy, 8–10 May 2019; Volume XLII-2/W11, pp. 317–323. [Google Scholar] [CrossRef]
- Fang, J.W.; Sun, Z.; Zhang, Y.R. TLS-FEM integrated structural deformation analysis on the Beamless Hall at Nanjing, China. In Proceedings of the International Archives of the Photogrammetry, Remote Sensing and Spatial Information Sciences, Beijing, China, 28 August–1 September 2021; Volume XLVI-M-1-2021, pp. 215–220. [Google Scholar] [CrossRef]
- Yang, H.; Xu, X. Structure monitoring and deformation analysis of tunnel structure. Compos. Struct. 2021, 276, 114565. [Google Scholar] [CrossRef]
- State Archive of Verona. Private Archive of Pompei Family, (ASVr, Pompei), section XXVI, 68, section XXVII, 71, section XXVII, 73.
- Saggioro, F.; Varanini, G.M. Il castello di Illasi. Storia e archeologia. In Archaeologica; Bretschneider, G., Ed.; università degli studi di padova: Rome, Italy, 2009; Volume 151, p. 300. ISBN 9788876892370. [Google Scholar]
- Saggioro, F.; Mancassola, N. Il castello di Illasi (VR): Dati archeologici sull’insediamento medioevale. In Paesaggi, Comunità, Villaggi Medievali; Fondazione Centro Italiano di Studi sull’Alto Medioevo: Spoleto (Perugia), Italy, 2012; pp. 639–644. ISBN 9788879883474. [Google Scholar]
- Sanz-Ablanedo, E.; Chandler, J.H.; Rodríguez-Pérez, J.R.; Ordóñez, C. Accuracy of Unmanned Aerial Vehicle (UAV) and SfM Photogrammetry Survey as a Function of the Number and Location of Ground Control Points Used. Remote Sens. 2018, 10, 1606. [Google Scholar] [CrossRef] [Green Version]
- Ferrer-González, E.; Agüera-Vega, F.; Carvajal-Ramírez, F.; Martínez-Carricondo, P. UAV Photogrammetry Accuracy Assessment for Corridor Mapping Based on the Number and Distribution of Ground Control Points. Remote Sens. 2020, 12, 2447. [Google Scholar] [CrossRef]
- CloudCompare (Version 2.12 Alpha). Available online: http://www.cloudcompare.org/ (accessed on 15 July 2022).
- Lague, D.; Brodu, N.; Leroux, J. Accurate 3D comparison of complex topography with terrestrial laser scanner: Application to the Rangitikei canyon (N-Z). ISPRS J. Photogramm. Remote Sens. 2013, 82, 10–26. [Google Scholar] [CrossRef]
- Capolupo, A. Accuracy Assessment of Cultural Heritage Models Extracting 3D Point Cloud Geometric Features with RPAS SfM-MVS and TLS Techniques. Drones 2021, 5, 145. [Google Scholar] [CrossRef]
- Monego, M.; Fabris, M.; Menin, A.; Achilli, V. 3-D Survey applied to industrial archaeology by tls methodology. In Proceedings of the International Archives of the Photogrammetry, Remote Sensing and Spatial Information Sciences, Florence, Italy, 22–24 May 2017; Volume XLII-5/W1, pp. 449–455. [Google Scholar] [CrossRef]
- Monego, M.; Achilli, V.; Fabris, M.; Menin, A. 3-D Survey of Rocky Structures: The Dolomitic Spire of the Gusela del Vescovà. Commun. Comput. Inf. Sci. 2020, 1246, 211–228. [Google Scholar] [CrossRef]
- Moyano, J.; Nieto-Julián, J.E.; Bienvenido-Huertas, D.; Marín-García, D. Validation of Close-Range Photogrammetry for Architectural and Archaeological Heritage: Analysis of Point Density and 3D Mesh Geometry. Remote Sens. 2020, 12, 3571. [Google Scholar] [CrossRef]
- Quattrini, R.; Clementi, F.; Lucidi, A.; Giannetti, S.; Santoni, A. From TLS to FE analysis: Points cloud exploitation for structural behaviour definition. The San Ciriaco’s Bell Tower. In Proceedings of the International Archives of the Photogrammetry, Remote Sensing and Spatial Information Sciences, Ávila, Spain, 1–5 September 2019; Volume XLII-2/W15, pp. 957–964. [Google Scholar] [CrossRef] [Green Version]
- De Villiers, W.I. Computational and Experimental Modelling of Masonry Walling towards Performance-Based Standardisation of Alternative Masonry Units for Low-Income Housing. Dissertation Presented for the Degree of Doctor of Philosophy in Engineering in the Faculty of Engineering, at Stellenbosch University, Stellenbosch, South Africa. 2019. Available online: https://core.ac.uk/download/pdf/268883067.pdf (accessed on 6 September 2022).
Figure 1.
(a) Location of Illasi Castle in northern Italy. (b) Aerial view of the surveyed palace and tower along with the surrounding area. (c) Map of the surveyed area showing the RTK GNSS and topographic points (stations 1–7) and the topographic network with the location of the ground and wall targets (both control points (CPs) and checkpoints (ChPs)). Targets used for TLS (d) and SfM (e).

Figure 2.
Flowchart of the methodology proposed in this work.

Figure 3.
Characteristics of the tower and palace of Illasi Castle highlighting the complexity of the structures and showing the unremoved vegetation (1–5 show the portions enclosed by the colored polylines).
Figure 3.
Characteristics of the tower and palace of Illasi Castle highlighting the complexity of the structures and showing the unremoved vegetation (1–5 show the portions enclosed by the colored polylines).

Figure 4.
Separation of the available targets into 14 CPs (5 on the ground and 9 on the walls) and 6 ChPs (2 on the ground and 4 on the walls).
Figure 4.
Separation of the available targets into 14 CPs (5 on the ground and 9 on the walls) and 6 ChPs (2 on the ground and 4 on the walls).

Figure 5.
Center of image acquisitions (blue flags represent the image plane); (a,b) center of images acquired by the drone camera; and (c,d) center of images acquired by the SLR camera.
Figure 5.
Center of image acquisitions (blue flags represent the image plane); (a,b) center of images acquired by the drone camera; and (c,d) center of images acquired by the SLR camera.

Figure 6.
Three-dimensional models obtained via SfM processing of images acquired by the drone (a), SLR camera (c), and smartphone (e), and by the integration between drone and SLR imagery (g). A common detailed area of interest of each model is shown in (b,d,f,h) for the drone, SLR, smartphone, and drone together with SLR images, respectively.

Figure 7.
Different points of view of the Illasi Castle 3D model obtained from the alignment of the six TLS point clouds. Colors represent point reflectivity in the range of 0–1. On the right, the two internal rooms of the palace are visible.
Figure 7.
Different points of view of the Illasi Castle 3D model obtained from the alignment of the six TLS point clouds. Colors represent point reflectivity in the range of 0–1. On the right, the two internal rooms of the palace are visible.

Figure 8.
Comparisons between point clouds using the TLS model as reference. TLS and drone (a), TLS and SLR (b), and TLS and drone + SLR (c). Colors represent the 3D distances between models.
Figure 8.
Comparisons between point clouds using the TLS model as reference. TLS and drone (a), TLS and SLR (b), and TLS and drone + SLR (c). Colors represent the 3D distances between models.

Figure 9.
Comparisons between point clouds of the tower. TLS and smartphone (a) and SLR and smartphone (b). Colors represent the 3D distances between models.
Figure 9.
Comparisons between point clouds of the tower. TLS and smartphone (a) and SLR and smartphone (b). Colors represent the 3D distances between models.

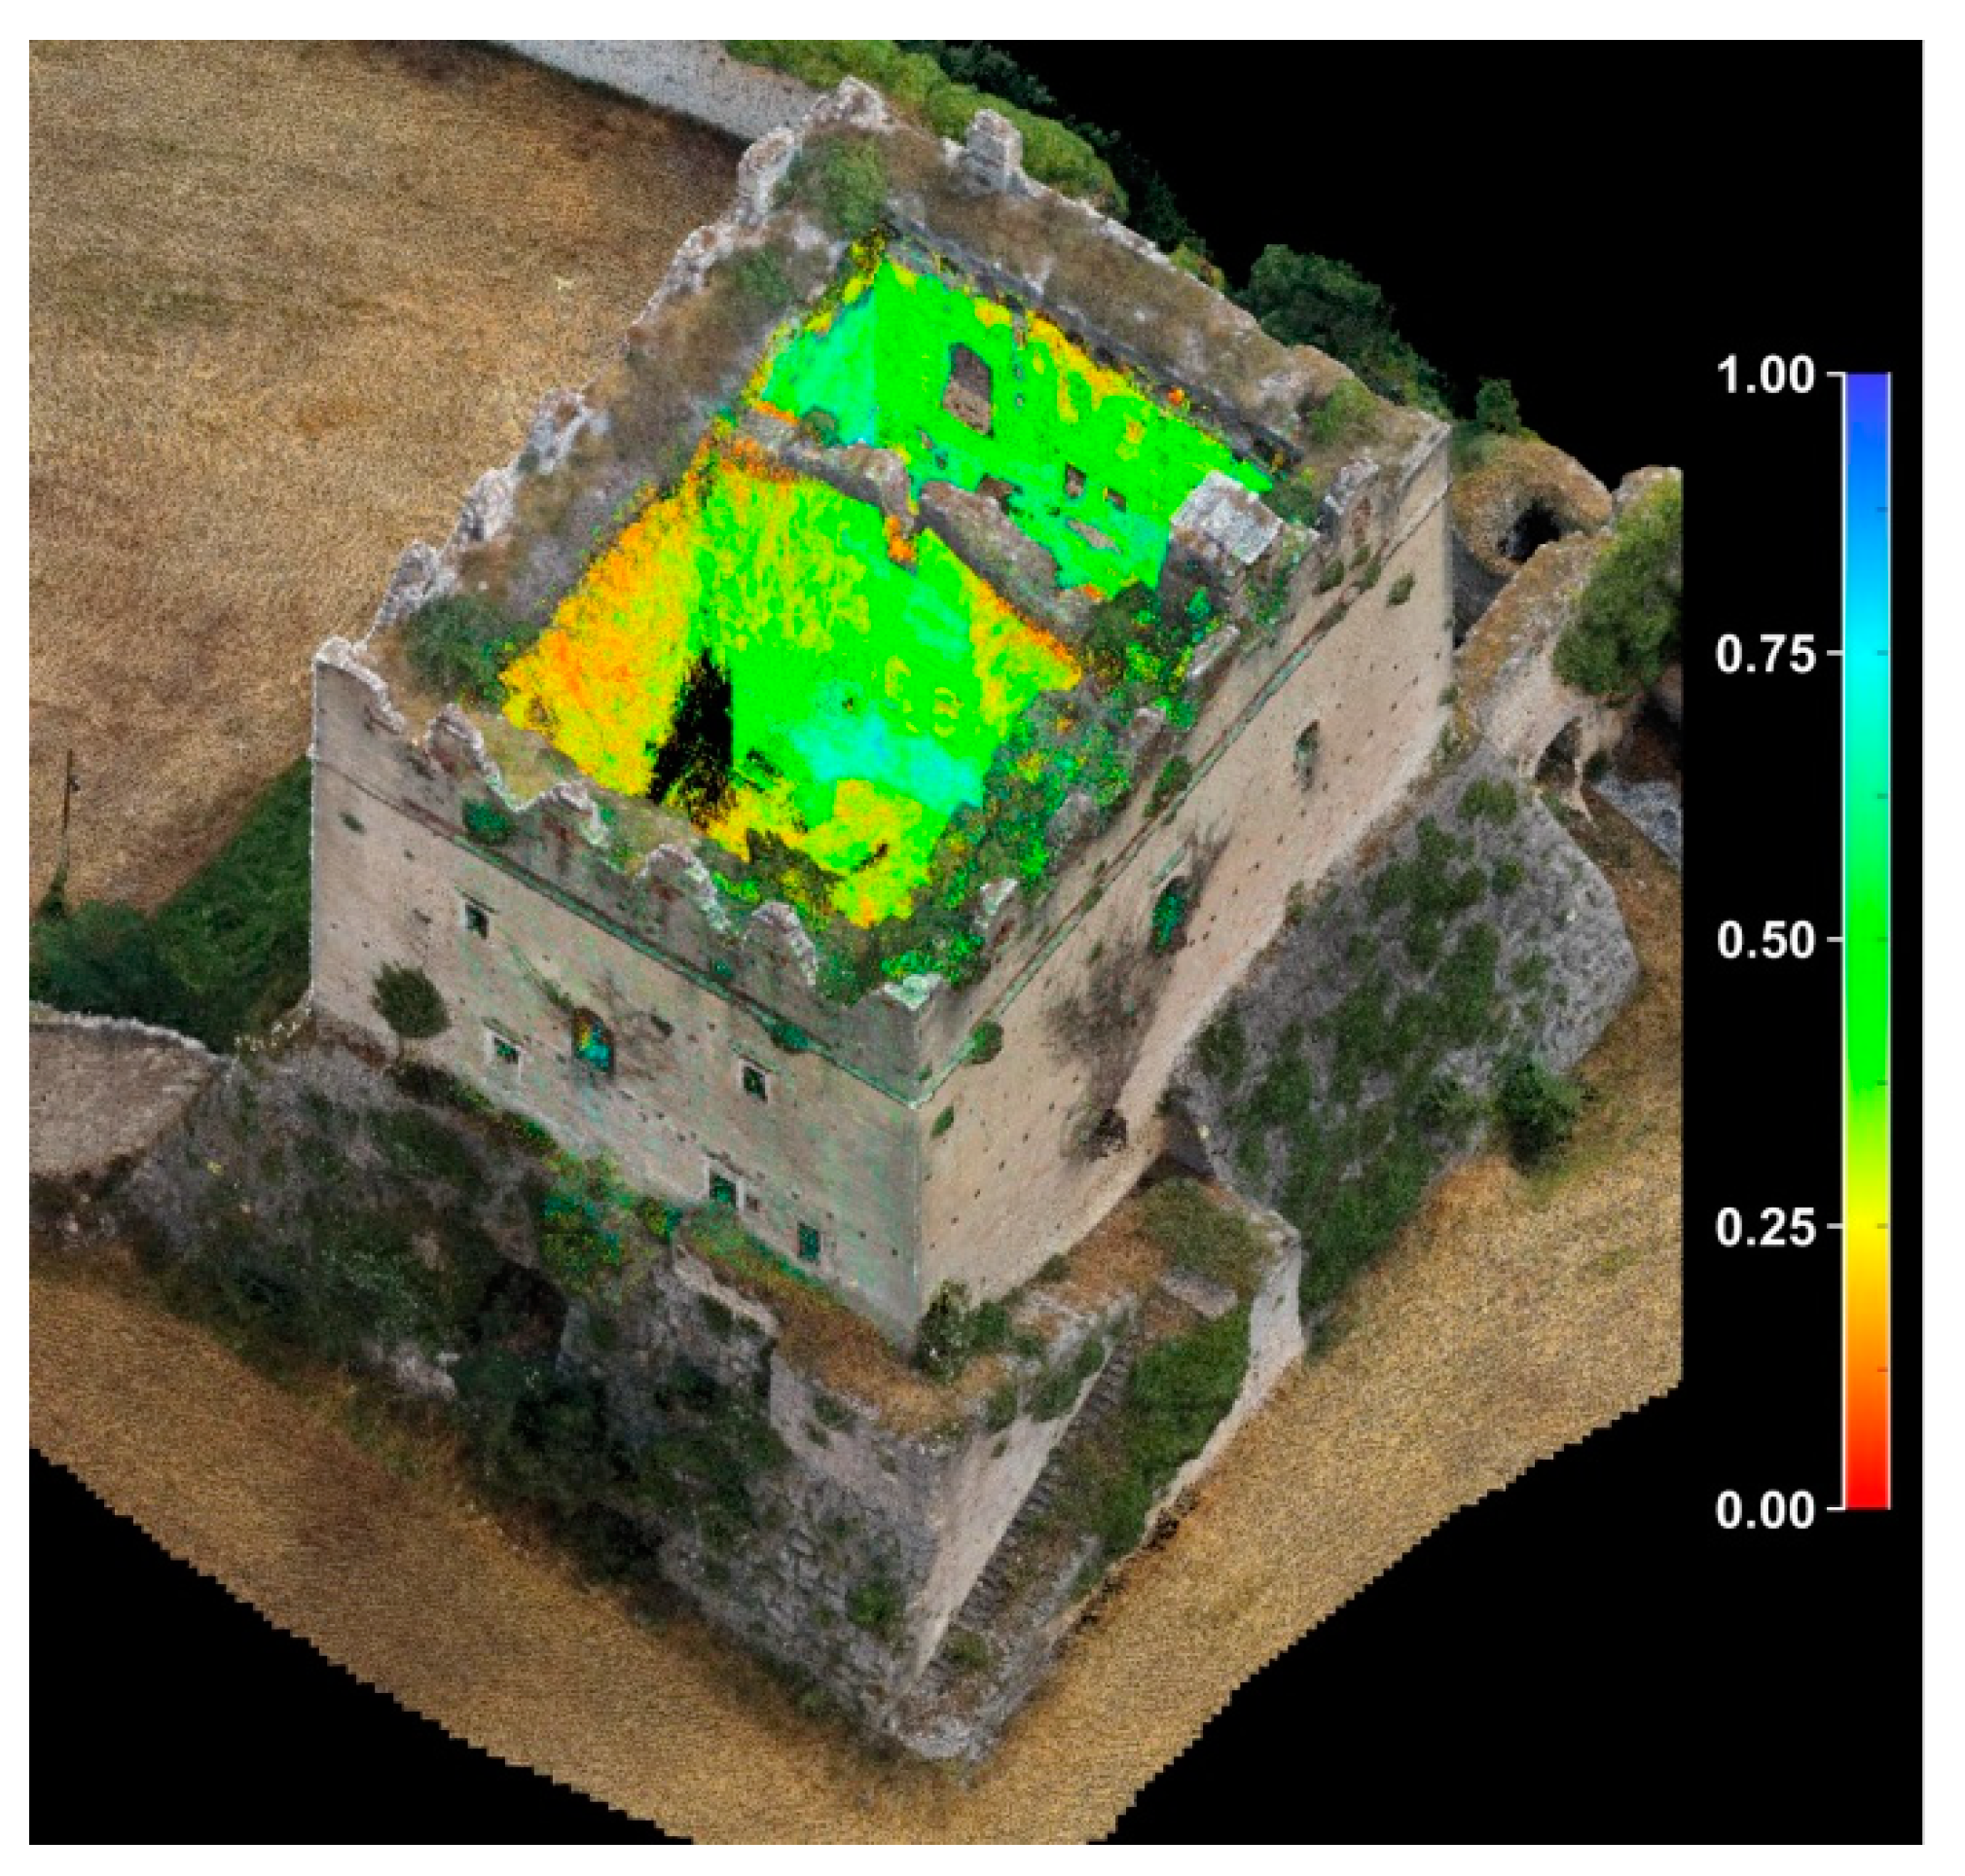
Figure 10.
Final 3D model of the palace integrating the SfM results for the external surfaces (drone + SLR, in photorealistic representation) with TLS data for the internal portions (in reflectivity representation, where colors highlight the points’ reflectivity in the range of 0–1).
Figure 10.
Final 3D model of the palace integrating the SfM results for the external surfaces (drone + SLR, in photorealistic representation) with TLS data for the internal portions (in reflectivity representation, where colors highlight the points’ reflectivity in the range of 0–1).

Figure 11.
FE model of the palace, where each wall type is represented by a different color (Midas FEA NX software).
Figure 11.
FE model of the palace, where each wall type is represented by a different color (Midas FEA NX software).

Figure 12.
Contours of main strains (a) and main stress (b) from the pushover analysis for one of the analyzed directions (along the X-axis). The red numbers, in each interval, indicate the percentage of finite elements that assumed values of solid strains and solid stress within the range of values in black.


Table 1.
Processing times related to each step of the Agisoft Metashape workflow separated for each dataset (d, h, and m indicate days, hours, and minutes, respectively). A workstation with good performance was used for the processing.
Table 1.
Processing times related to each step of the Agisoft Metashape workflow separated for each dataset (d, h, and m indicate days, hours, and minutes, respectively). A workstation with good performance was used for the processing.
| Processing Time | Operation | Drone (h, m) | SLR (h, m) | Smartphone (m) | Drone + SLR (d, h, m) |
|---|---|---|---|---|---|
| Tie points (sparse cloud) | Matching: | 0, 31 | 0, 51 | 3 | 0, 1, 16 |
| Alignment: | 0, 4 | 0, 14 | 2 | 0, 0, 23 | |
| Dense cloud | Depth map generation: | 4, 57 | 1, 38 | 14 | 0, 5, 34 |
| Dense cloud generation: | 19, 16 | 2, 48 | 15 | 2, 17, 10 | |
| 3D model (mesh) | Reconstruction: | 0, 19 | 0, 44 | 22 | 0, 1, 2 |
| Texturing: | 0, 4 | 0, 36 | 6 | 0, 1, 7 |
Table 2.
The number of CPs used in processing, available ChPs (see Figure 4), and comparisons between the 3D coordinates and the four extracted 3D photogrammetric SfM models in terms of RMSE.
Table 2.
The number of CPs used in processing, available ChPs (see Figure 4), and comparisons between the 3D coordinates and the four extracted 3D photogrammetric SfM models in terms of RMSE.
| 3D Model | N. CPs | N. ChPs | RMSE (cm) | |
|---|---|---|---|---|
| CPs | ChPs | |||
| Drone | 14 | 6 | 1.4 | 1.1 |
| SLR | 9 | 4 | 0.5 | 1.0 |
| Drone + SLR | 14 | 6 | 1.1 | 1.2 |
| Smartphone | 5 | - | 1.9 | - |
Table 3.
Mean distances and standard deviation values of the comparisons between the TLS model (as a reference) and the obtained SfM point clouds considering all the available data, area A of Figure 8 (palace), area B of Figure 9 (tower), and the internal portion of the palace.
| Mean Distance (cm) | Standard Deviation (cm) | |
|---|---|---|
| Available Data | ||
| TLS and Drone | 0.9 | 10.1 |
| TLS and SLR | –0.5 | 9.6 |
| TLS and Drone + SLR | 0.6 | 9.6 |
| TLS and Smartphone | –1.5 | 10.9 |
| Smartphone and SLR | 1.5 | 11.9 |
| Area A | ||
| TLS and Drone | 0.2 | 2.4 |
| TLS and SLR | –0.3 | 1.8 |
| TLS and Drone + SLR | 0.1 | 2.2 |
| Area B | ||
| TLS and Drone | 0.3 | 2.4 |
| TLS and SLR | 0.2 | 2.7 |
| TLS and Drone + SLR | 0.4 | 2.3 |
| TLS and Smartphone | –0.1 | 4.7 |
| Smartphone and SLR | –0.1 | 7.1 |
| Internal Palace | ||
| TLS and Drone + SLR | 1.1 | 7.7 |
Disclaimer/Publisher’s Note: The statements, opinions and data contained in all publications are solely those of the individual author(s) and contributor(s) and not of MDPI and/or the editor(s). MDPI and/or the editor(s) disclaim responsibility for any injury to people or property resulting from any ideas, methods, instructions or products referred to in the content. |
© 2023 by the authors. Licensee MDPI, Basel, Switzerland. This article is an open access article distributed under the terms and conditions of the Creative Commons Attribution (CC BY) license (https://creativecommons.org/licenses/by/4.0/).
Share and Cite
MDPI and ACS Style
Fabris, M.; Fontana Granotto, P.; Monego, M. Expeditious Low-Cost SfM Photogrammetry and a TLS Survey for the Structural Analysis of Illasi Castle (Italy). Drones 2023, 7, 101. https://doi.org/10.3390/drones7020101
AMA Style
Fabris M, Fontana Granotto P, Monego M. Expeditious Low-Cost SfM Photogrammetry and a TLS Survey for the Structural Analysis of Illasi Castle (Italy). Drones. 2023; 7(2):101. https://doi.org/10.3390/drones7020101
Chicago/Turabian StyleFabris, Massimo, Pietro Fontana Granotto, and Michele Monego. 2023. "Expeditious Low-Cost SfM Photogrammetry and a TLS Survey for the Structural Analysis of Illasi Castle (Italy)" Drones 7, no. 2: 101. https://doi.org/10.3390/drones7020101