
Lower Rates of Hypocalcemia Following Near-Infrared Autofluorescence Use in Thyroidectomy: A Meta-Analysis of RCTs
 , , , , ,
Abstract
:1. Introduction
2. Methodology
2.1. Reporting and Registration
2.2. Search Strategy
2.3. Search Query Structure
2.4. Data Screening and Selection
2.5. Inclusion and Exclusion Criteria
2.6. Data Retrieval
3. Quality Assessment
3.1. Level of Evidence
3.2. Methodology Quality
3.3. Risk of Bias Assessment
3.4. Statistical Analysis
4. Results
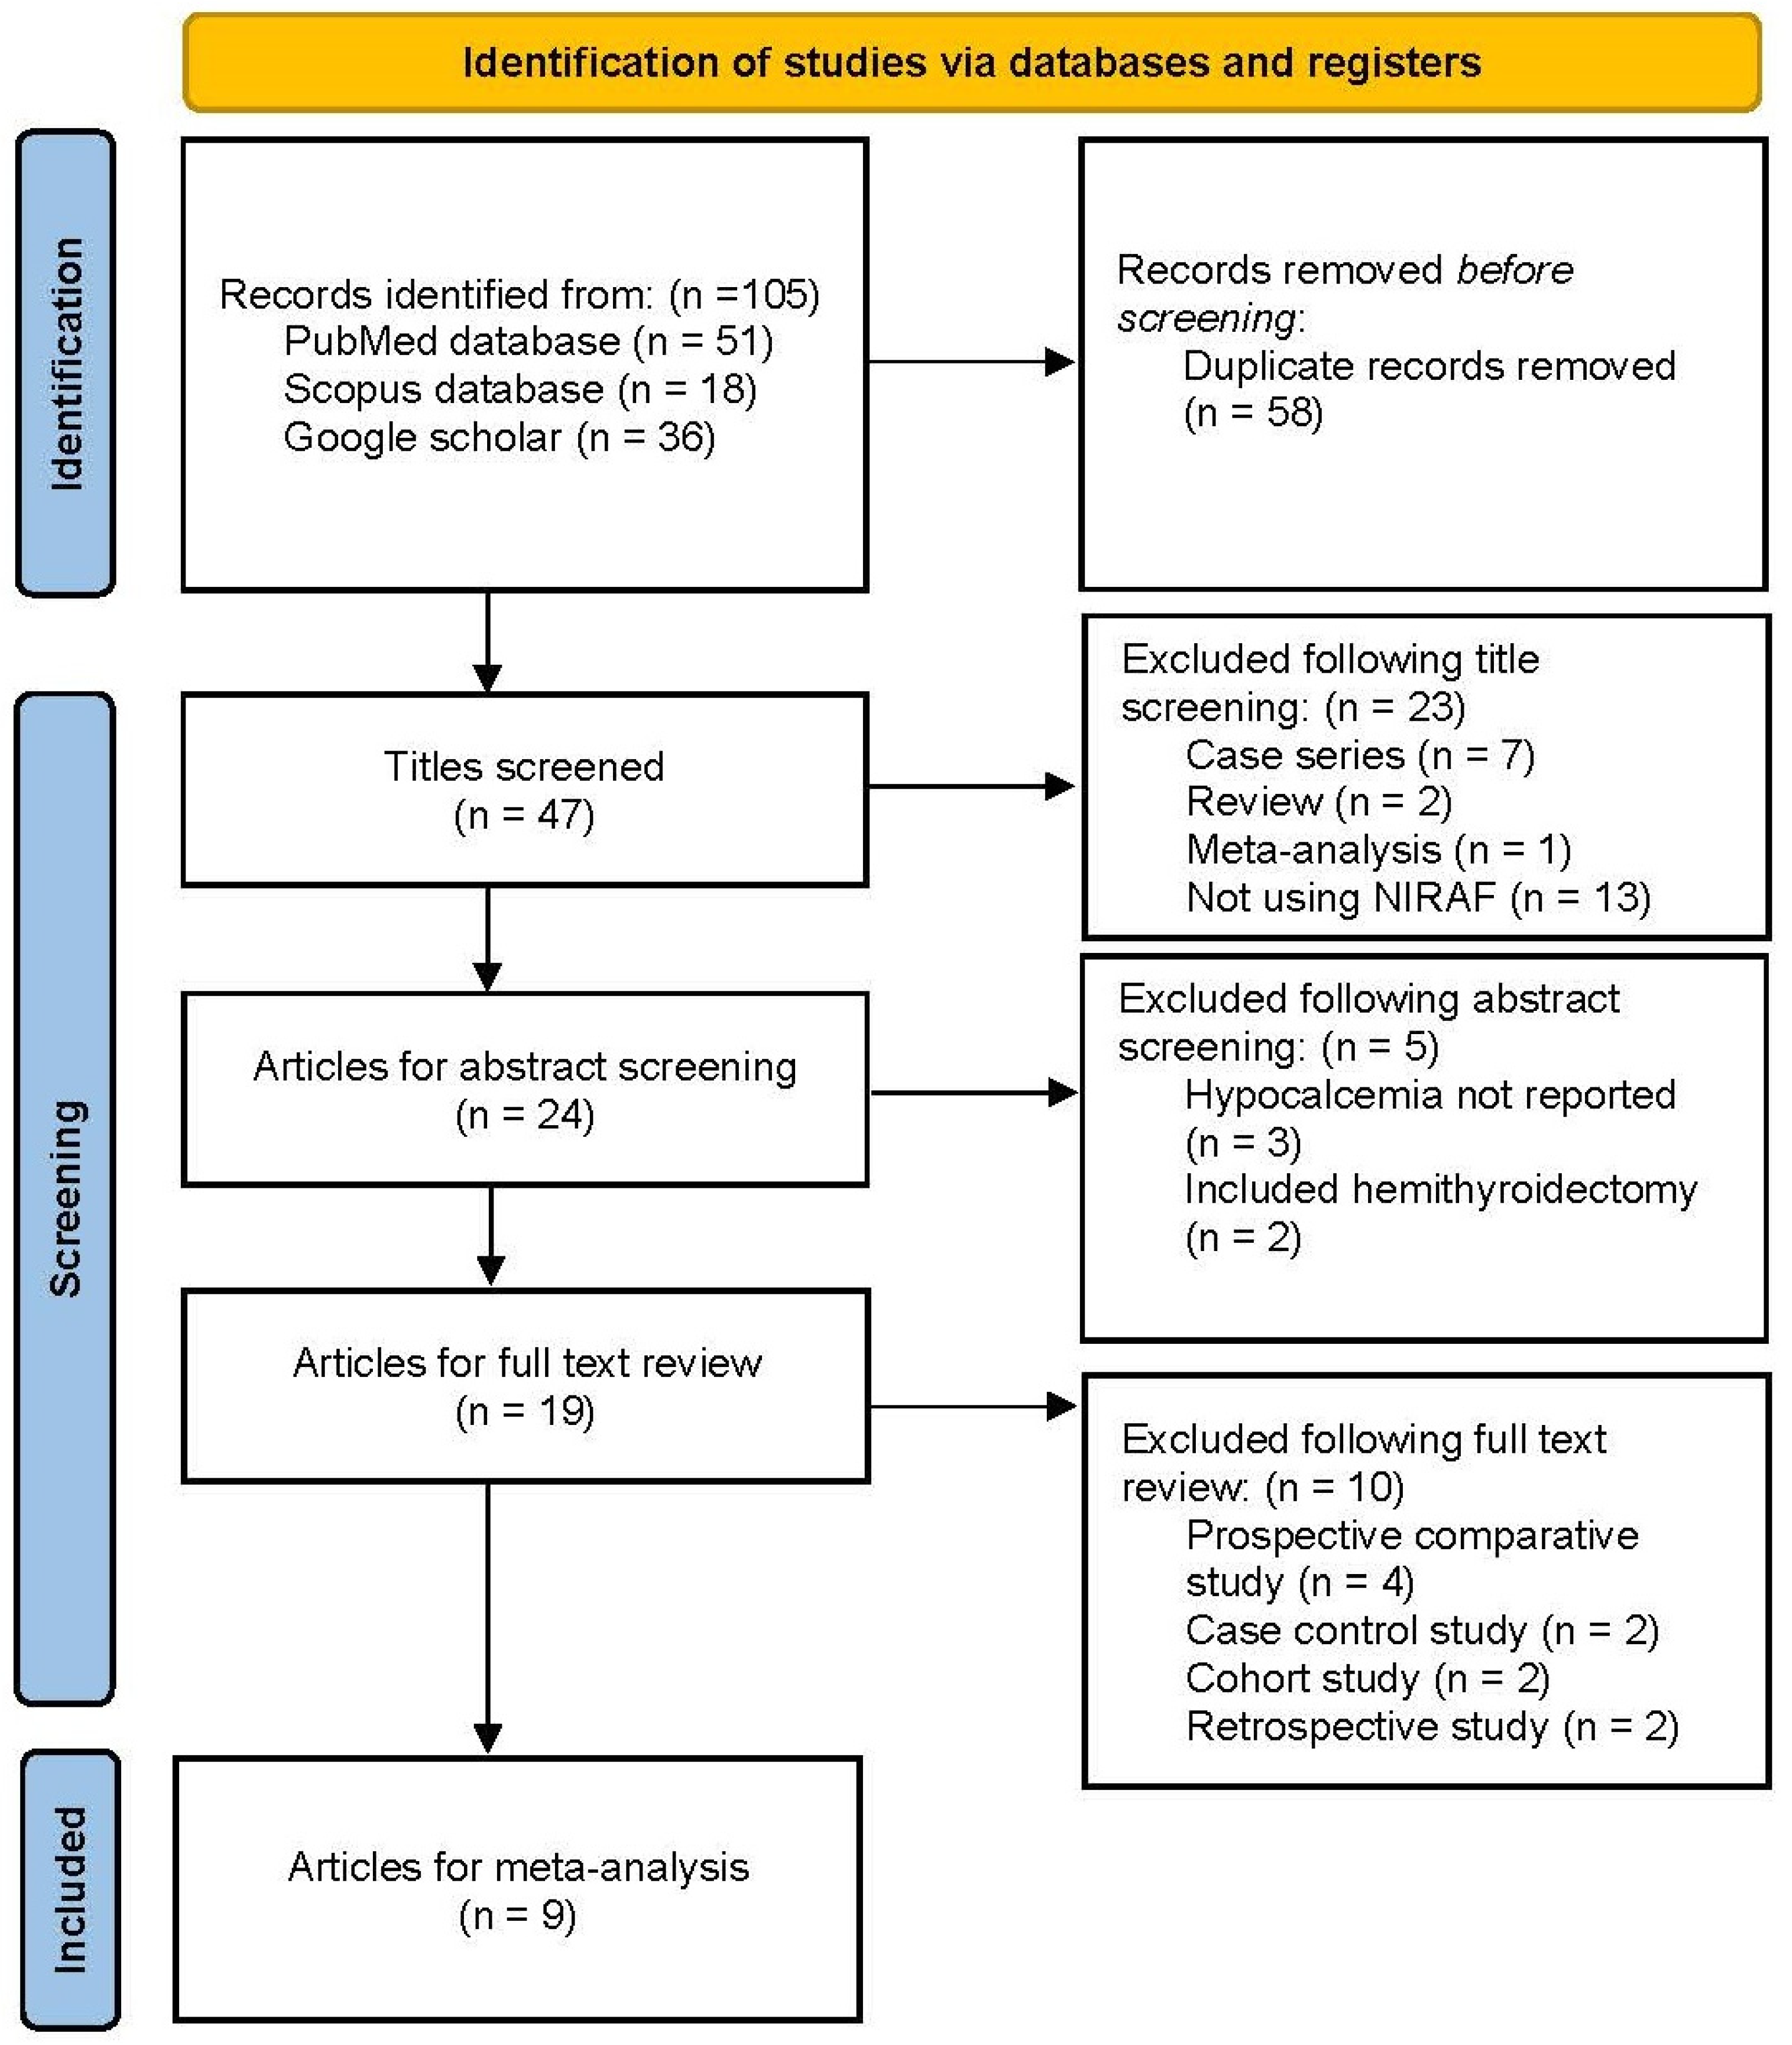
4.1. Literature Retrieval and Data Extraction
4.2. Quality of Included Studies
4.3. Publication Bias
4.4. The Overall Rate of Hypocalcemia
4.5. Temporary Hypocalcemia
4.6. Permanent Hypocalcemia
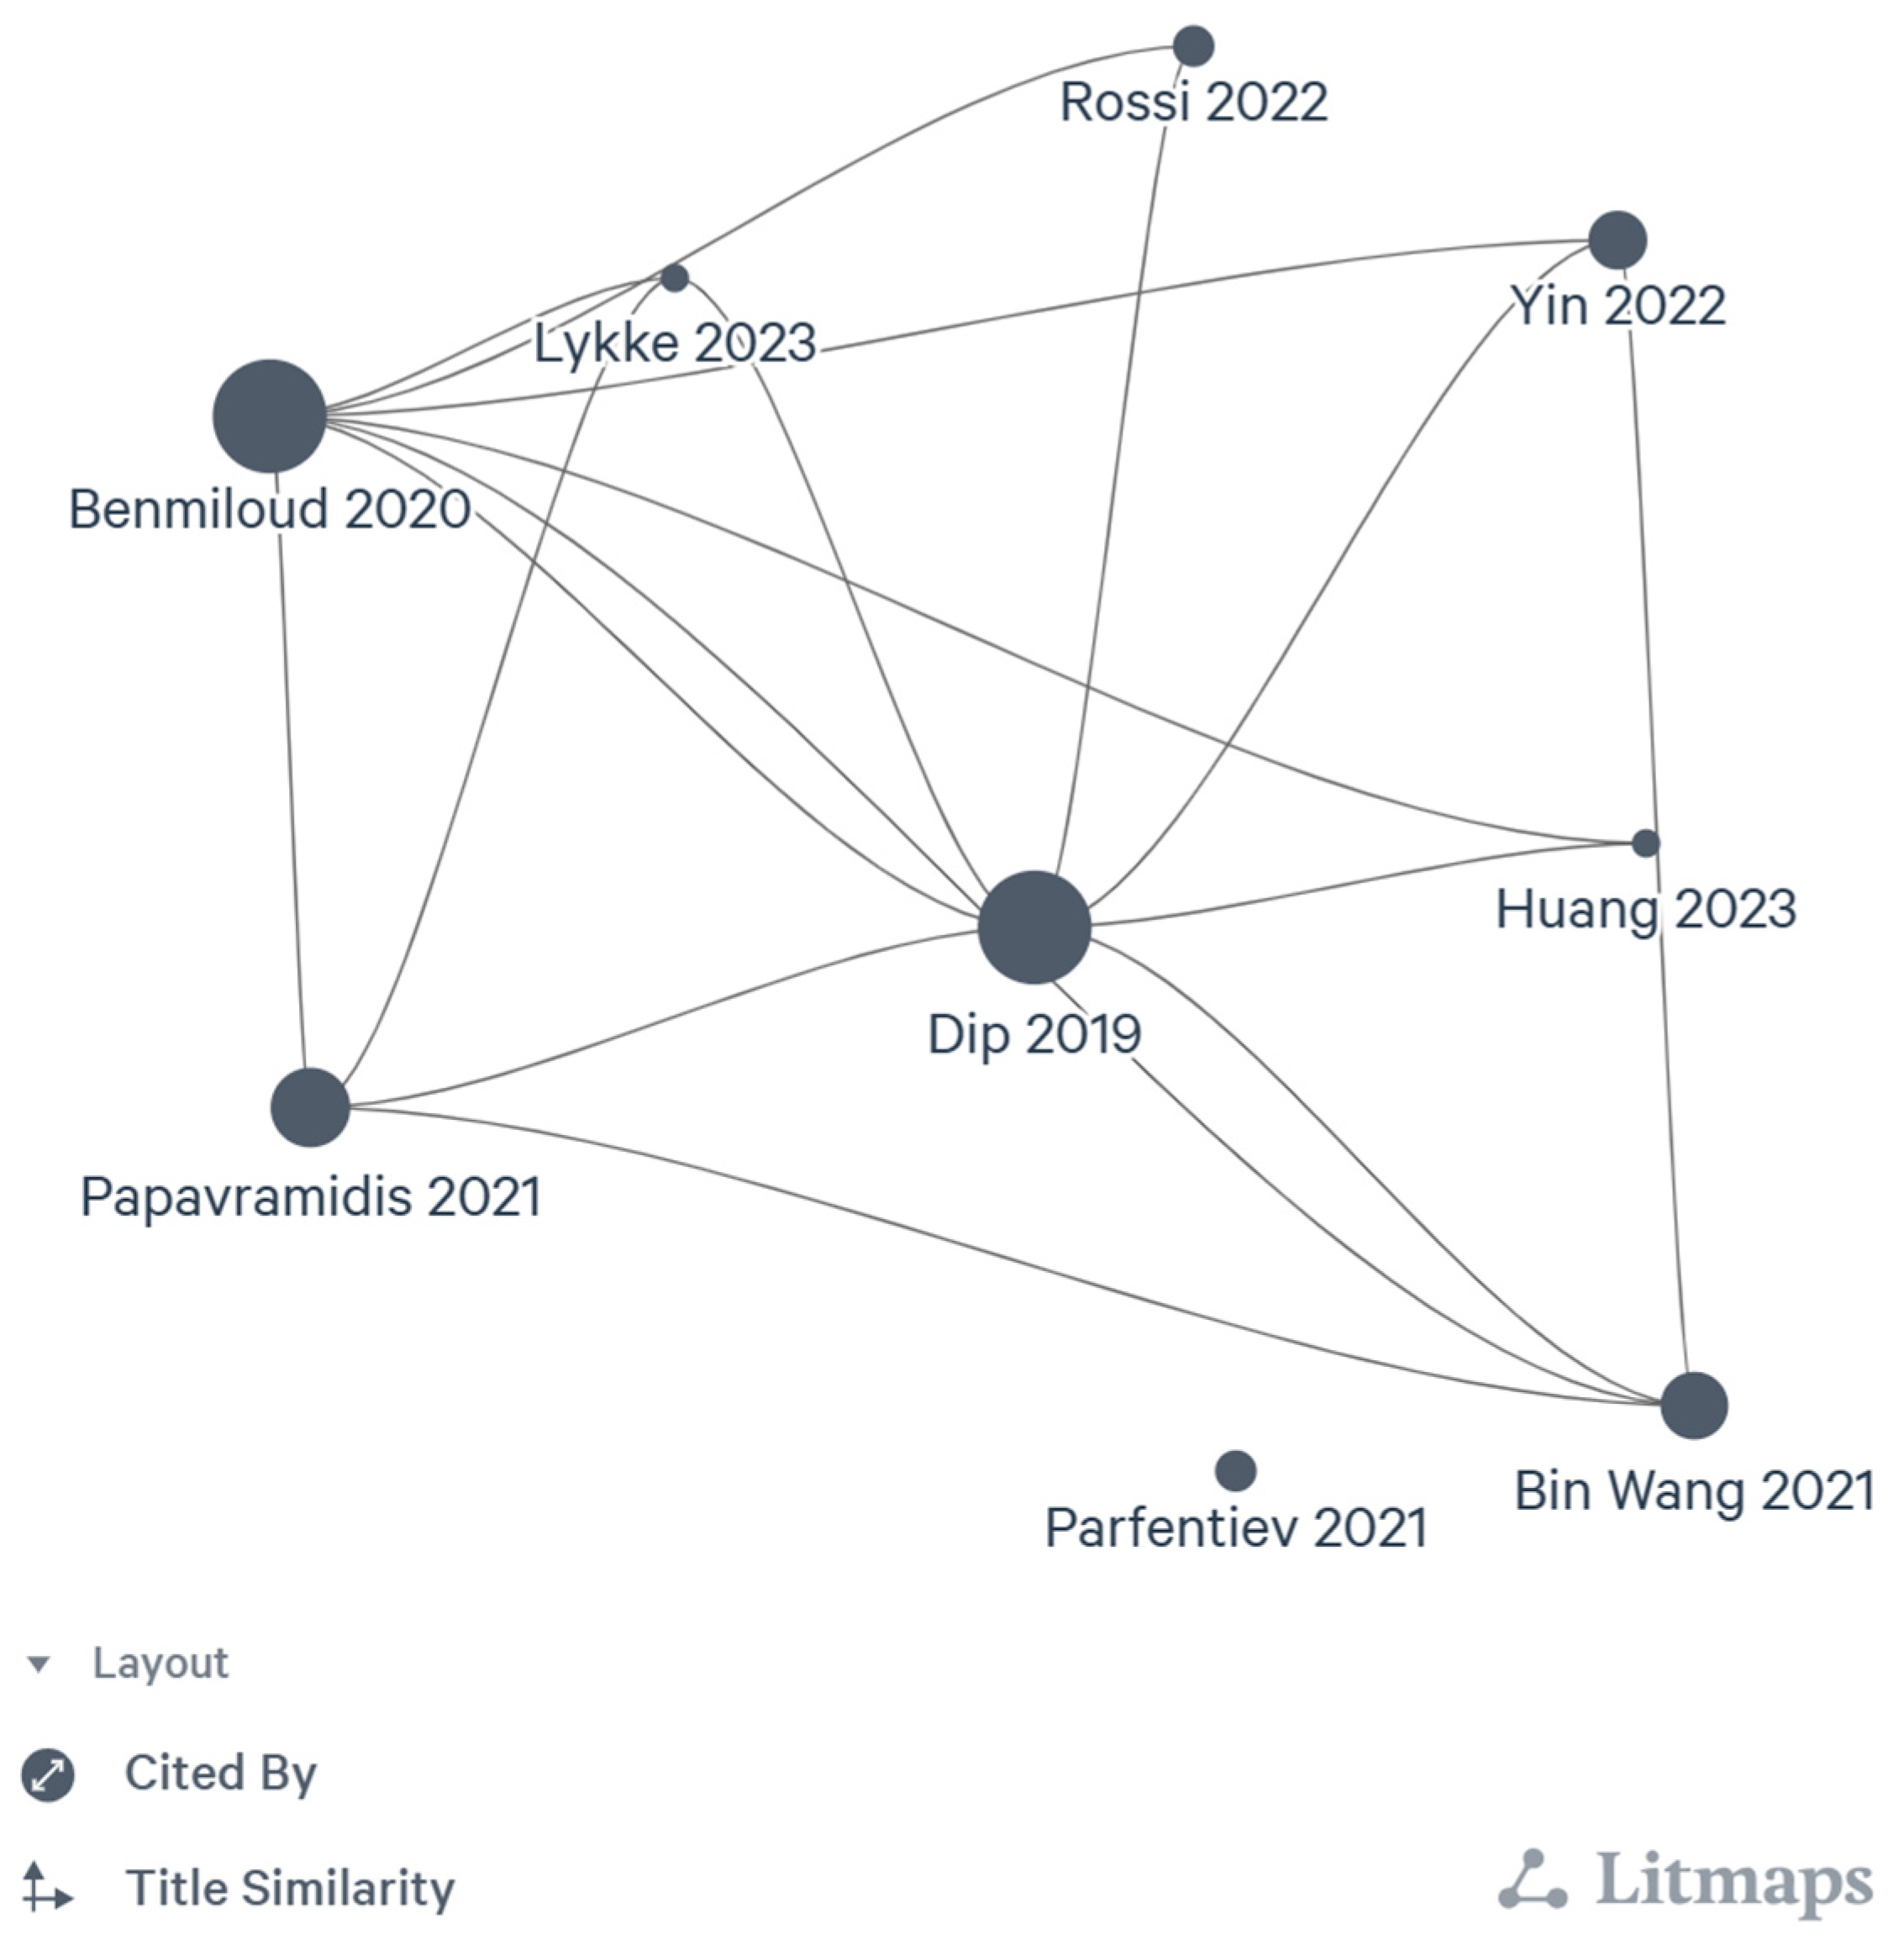
4.7. Citation Network
5. Discussion
6. Conclusions
Supplementary Materials
Author Contributions
Funding
Institutional Review Board Statement
Informed Consent Statement
Data Availability Statement
Conflicts of Interest
References
- Ritter, K.; Elfenbein, D.; Schneider, D.F.; Chen, H.; Sippel, R.S. Hypoparathyroidism after total thyroidectomy: Incidence and resolution. J. Surg. Res. 2015, 197, 348–353. [Google Scholar] [CrossRef] [PubMed]
- Edafe, O.; Balasubramanian, S.P. Incidence, prevalence and risk factors for post-surgical hypocalcaemia and hypoparathyroidism. Gland. Surg. 2017, 6 (Suppl. S1), S59–S68. [Google Scholar] [CrossRef] [PubMed]
- Bergenfelz, A.; Nordenström, E.; Almquist, M. Morbidity in patients with permanent hypoparathyroidism after total thyroidectomy. Surgery 2020, 167, 124–128. [Google Scholar] [CrossRef] [PubMed]
- Demarchi, M.S.; Karenovics, W.; Bédat, B.; Triponez, F. Intraoperative autofluorescence and indocyanine green angiography for the detection and preservation of parathyroid glands. J. Clin. Med. 2020, 9, 830. [Google Scholar] [CrossRef] [PubMed]
- Solórzano, C.; Thomas, G.; Baregamian, N.; Mahadevan-Jansen, A. Detecting the near infrared autofluorescence of the human parathyroid: Hype or opportunity? Ann Surg. 2020, 272, 973–985. [Google Scholar] [CrossRef]
- McWade, M.A.; Sanders, M.E.; Broome, J.T.; Solórzano, C.C.; Mahadevan-Jansen, A. Establishing the clinical utility of autofluorescence spectroscopy for parathyroid detection. Surgery 2016, 159, 193–203. [Google Scholar] [CrossRef]
- Tabei, I.; Fuke, A.; Fushimi, A.; Takeyama, H. Determination of the optimum excitation wavelength for the parathyroid gland using a near-infrared camera. Front. Surg. 2021, 7, 619859. [Google Scholar] [CrossRef]
- Rossi, L.; Vasquez, M.C.; Pieroni, E.; Ambrosini, C.E.; Miccoli, M.; Cetani, F.; Elisei, R.; Materazzi, G. Indocyanine green fluorescence and near-infrared autofluorescence may improve post-thyroidectomy parathyroid function. Surgery 2023, 173, 124–131. [Google Scholar] [CrossRef]
- Yin, S.; Pan, B.; Yang, Z.; Tang, M.; Mo, H.; Li, Y.; Yi, Z.; Yin, T.; Shao, C.; Yan, C.; et al. Combined use of autofluorescence and indocyanine green fluorescence imaging in the identification and evaluation of parathyroid glands during total thyroidectomy: A randomized controlled trial. Front. Endocrinol. 2022, 13, 897797. [Google Scholar] [CrossRef]
- Stack, B.C.; Bimston, D.N.; Bodenner, D.L.; Brett, E.M.; Dralle, H.; Orloff, L.A.; Pallota, J.; Snyder, S.K.; Wong, R.J.; Randolph, G.W. American association of clinical endocrinologists and American college of endocrinology disease state clinical review: Postoperative hypoparathyroidism—Definitions and management. Endocr. Pract. Off. J. Am. Coll. Endocrinol. Am. Assoc. Clin. Endocrinol. 2015, 21, 674–685. [Google Scholar] [CrossRef]
- Shamseer, L.; Moher, D.; Clarke, M.; Ghersi, D.; Liberati, A.; Petticrew, M.; Shekelle, P.; Stewart, L.A.; the PRISMA-P Group. Preferred reporting items for systematic review and meta-analysis protocols (PRISMA-P) 2015: Elaboration and explanation. BMJ 2015, 349, g7647. [Google Scholar] [CrossRef]
- Shea, B.J.; Reeves, B.C.; Wells, G.; Thuku, M.; Hamel, C.; Moran, J.; Moher, D.; Tugwell, P.; Welch, V.; Kristjansson, E.; et al. AMSTAR 2: A critical appraisal tool for systematic reviews that include randomised or non-randomised studies of healthcare interventions, or both. BMJ 2017, 358, j4008. [Google Scholar] [CrossRef] [PubMed]
- Available online: https://www.crd.york.ac.uk/prospero/display_record.php?ID=CRD42023434610 (accessed on 23 July 2023).
- Dip, F.; Falco, J.; Verna, S.; Prunello, M.; Loccisano, M.; Quadri, P.; White, K.; Rosenthal, R. Randomized controlled trial comparing white light with near-infrared autofluorescence for parathyroid gland identification during total thyroidectomy. J. Am. Coll. Surg. 2019, 228, 744–751. [Google Scholar] [CrossRef] [PubMed]
- Benmiloud, F.; Godiris-Petit, G.; Gras, R.; Gillot, J.C.; Turrin, N.; Penaranda, G.; Noullet, S.; Chéreau, N.; Gaudart, J.; Chiche, L.; et al. Association of autofluorescence-based detection of the parathyroid glands during total thyroidectomy with postoperative hypocalcemia risk: Results of the parafluo multicenter randomized clinical trial. JAMA Surg. 2020, 155, 106–112. [Google Scholar] [CrossRef] [PubMed]
- Parfentiev, R.; Grubnik, V.; Grubnik, V.; Bugridze, Z.; Giuashvili, S.; Beselia, L. Study of intraoperative indocyanine green angiography effectiveness for identification of parathyroid glands during total thyroidectomy. Georgian Med. News 2021, 314, 26–29. [Google Scholar]
- Papavramidis, T.S.; Chorti, A.; Tzikos, G.; Anagnostis, P.; Pantelidis, P.; Pliakos, I.; Panidis, S.; Papaioannou, M.; Bakkar, S.; Unal, E.; et al. The effect of intraoperative autofluorescence monitoring on unintentional parathyroid gland excision rates and postoperative PTH concentrations-a single-blind randomized-controlled trial. Endocrine 2021, 72, 546–552. [Google Scholar] [CrossRef] [PubMed]
- Wolf, H.W.; Runkel, N.; Limberger, K.; Nebiker, C.A. Near-infrared autofluorescence of the parathyroid glands during thyroidectomy for the prevention of hypoparathyroidism: A prospective randomized clinical trial. Langenbeck’s Arch. Surg. 2022, 407, 3031–3038. [Google Scholar] [CrossRef] [PubMed]
- Lykke, E.; Christensen, A.; Juhl, K.; Feldt-Rasmussen, U.; Hitz, M.F.; Sjöstedt, S.M.S.; Hahn, C.H.; Svensson, D.M.K.; Springborg, K.K.; Stage, M.G.; et al. Effect of near infrared autofluorescence guided total thyroidectomy on postoperative hypoparathyroidism: A randomized clinical trial. Eur. Arch. Oto-Rhino-Laryngol. 2023, 280, 2593–2603. [Google Scholar] [CrossRef]
- Huang, J.; He, Y.; Wang, Y.; Chen, X.; Zhang, Y.; Chen, X.; Huang, Z.; Fang, J.; Zhong, Q. Prevention of hypoparathyroidism: A step-by-step near-infrared autofluorescence parathyroid identification method. Front. Endocrinol. 2023, 14, 1086367. [Google Scholar] [CrossRef]
- Lo, C.K.L.; Mertz, D.; Loeb, M. Newcastle-Ottawa Scale: Comparing reviewers’ to authors’ assessments. BMC Med. Res. Methodol. 2014, 14, 45. [Google Scholar] [CrossRef]
- Sterne, J.A.C.; Savović, J.; Page, M.J.; Elbers, R.G.; Blencowe, N.S.; Boutron, I.; Cates, C.J.; Cheng, H.Y.; Corbett, M.S.; Eldridge, S.M.; et al. RoB 2: A revised tool for assessing risk of bias in randomised trials. BMJ 2019, 366, l4898. [Google Scholar] [CrossRef] [PubMed]
- RevMan. Available online: https://training.cochrane.org/online-learning/core-software/revman (accessed on 23 July 2023).
- Hu, D.; Wang, C.; O’connor, A.M. A method of back-calculating the log odds ratio and standard error of the log odds ratio from the reported group-level risk of disease. PLoS ONE 2020, 15, e0222690. [Google Scholar] [CrossRef] [PubMed]
- Dettori, J.R.; Norvell, D.C.; Chapman, J.R. Fixed-effect vs random-effects models for meta-analysis: 3 points to consider. Glob. Spine J. 2022, 12, 1624–1626. [Google Scholar] [CrossRef] [PubMed]
- Kossmeier, M.; Tran, U.S.; Voracek, M. Charting the landscape of graphical displays for meta-analysis and systematic reviews: A comprehensive review, taxonomy, and feature analysis. BMC Med. Res. Methodol. 2020, 20, 26. [Google Scholar] [CrossRef] [PubMed]
- Veroniki, A.A.; Jackson, D.; Viechtbauer, W.; Bender, R.; Bowden, J.; Knapp, G.; Kuss, O.; Higgins, J.P.; Langan, D.; Salanti, G. Methods to estimate the between-study variance and its uncertainty in meta-analysis. Res. Synth Methods 2016, 7, 55–79. [Google Scholar] [CrossRef]
- Higgins, J.P.T.; Thompson, S.G.; Deeks, J.J.; Altman, D.G. Measuring inconsistency in meta-analyses. BMJ 2003, 327, 557–560. [Google Scholar] [CrossRef] [PubMed]
- Bashiri, M.; Moslemi, A. The analysis of residuals variation and outliers to obtain robust response surface. J. Ind. Eng. Int. 2013, 9, 2. [Google Scholar] [CrossRef]
- Bowden, J.; Spiller, W.; Del Greco, M.F.; Sheehan, N.; Thompson, J.; Minelli, C.; Davey Smith, G. Improving the visualization, interpretation and analysis of two-sample summary data Mendelian randomization via the Radial plot and Radial regression. Int. J. Epidemiol. 2018, 47, 1264–1278. [Google Scholar] [CrossRef]
- Zhu, H.; Ibrahim, J.G.; Cho, H. Perturbation and scaled cook’s distance. Ann Stat. 2012, 40, 785. [Google Scholar] [CrossRef]
- Simmonds, M. Quantifying the risk of error when interpreting funnel plots. Syst. Rev. 2015, 4, 24. [Google Scholar] [CrossRef]
- Download R-4.3.1 for Windows. The R-Project for Statistical Computing. Available online: https://cran.r-project.org/bin/windows/base/ (accessed on 23 July 2023).
- Paras, C.; Keller, M.; White, L.; Phay, J.; Mahadevan-Jansen, A. Near-infrared autofluorescence for the detection of parathyroid glands. J. Biomed. Opt. 2011, 16, 067012. [Google Scholar] [CrossRef]
- Barbieri, D.; Indelicato, P.; Vinciguerra, A.; Salerno, E.; Battista, R.A.; Di Marco, F.; Giordano, L.; Luce, F.L.; Bondi, S.; Trimarchi, M.; et al. The impact of near-infrared autofluorescence on postoperative hypoparathyroidism during total thyroidectomy: A case–control study. Endocrine 2023, 79, 392–399. [Google Scholar] [CrossRef] [PubMed]
- Lu, W.; Chen, Q.; Zhang, P.; Su, A.; Zhu, J. Near-infrared autofluorescence imaging in thyroid surgery: A systematic review and meta-analysis. J. Investig. Surg. Off. J. Acad. Surg. Res. 2022, 35, 1723–1732. [Google Scholar] [CrossRef] [PubMed]
- Wang, B.; Zhu, C.-R.; Liu, H.; Yao, X.-M.; Wu, J. The ability of near-infrared autofluorescence to protect parathyroid gland function during thyroid surgery: A meta-analysis. Front. Endocrinol. 2021, 12, 714691. [Google Scholar] [CrossRef] [PubMed]
- Vetter, D.; Triponez, F. Near-infrared fluorescence techniques to reduce hypocalcaemia after thyroidectomy. Br. J. Surg. 2023, 18, znad221. [Google Scholar] [CrossRef] [PubMed]
- Solórzano, C.C.; Thomas, G.; Berber, E.; Wang, T.S.; Randolph, G.W.; Duh, Q.-Y.; Triponez, F. Current state of intraoperative use of near infrared fluorescence for parathyroid identification and preservation. Surgery 2021, 169, 868–878. [Google Scholar] [CrossRef]
- Han, Y.S.; Kim, Y.; Lee, H.S.; Kim, Y.; Ahn, Y.-C.; Lee, K.D. detectable depth of unexposed parathyroid glands using near-infrared autofluorescence imaging in thyroid surgery. Front. Endocrinol. 2023, 14, 1170751. [Google Scholar] [CrossRef]
- Marshall, M.V.; Rasmussen, J.C.; Tan, I.C.; Aldrich, M.B.; Adams, K.E.; Wang, X.; Fife, C.E.; Maus, E.A.; Smith, L.A.; Sevick-Muraca, E.M. Near-infrared fluorescence imaging in humans with indocyanine green: A review and update. Open Surg. Oncol. J. Online 2010, 2, 12–25. [Google Scholar] [CrossRef]
- Filho, E.B.Y.; Machry, R.V.; Mesquita, R.; Scheffel, R.S.; Maia, A.L. The timing of parathyroid hormone measurement defines the cut-off values to accurately predict postoperative hypocalcemia: A prospective study. Endocrine 2018, 61, 224–231. [Google Scholar] [CrossRef]
- Lerchenberger, M.; Al Arabi, N.; Gallwas, J.K.S.; Stepp, H.; Hallfeldt, K.K.J.; Ladurner, R. Intraoperative near-infrared autofluorescence and indocyanine green imaging to identify parathyroid glands: A comparison. Int. J. Endocrinol. 2019, 2019, 4687951. [Google Scholar] [CrossRef]
- Kiernan, C.M.; Thomas, G.; Baregamian, N.; Solórzano, C.C. Initial clinical experiences using the intraoperative probe-based parathyroid autofluorescence identification system—PTeyeTM during thyroid and parathyroid procedures. J. Surg. Oncol. 2021, 124, 271–281. [Google Scholar] [CrossRef]


| Author | Country | Year | Study Type | LOE | NOS | n | NIRAF Arm | No-NIRAF Arm | Overall Hypocalcemia | Temporary Hypocalcemia | Permanent Hypocalcemia | |||||||||
|---|---|---|---|---|---|---|---|---|---|---|---|---|---|---|---|---|---|---|---|---|
| NIRAF | No-NIRAF | NIRAF | No-NIRAF | NIRAF | No-NIRAF | |||||||||||||||
| Yes | No | Yes | No | Yes | No | Yes | No | Yes | No | Yes | No | |||||||||
| Dip et al. [14] | Argentina | 2019 | RCT | 1b | 9 | 170 | 85 | 85 | 7 | 78 | 14 | 71 | 7 | 78 | 14 | 71 | 0 | 85 | 0 | 85 |
| Benmiloud et al. [15] | France | 2020 | RCT | 1b | 9 | 245 | 121 | 120 | 11 | 110 | 26 | 94 | 0 | 121 | 2 | 118 | ||||
| Parfentiev et al. [16] | Ukraine | 2021 | RCT | 2b | 8 | 58 | 30 | 28 | 2 | 28 | 5 | 23 | 2 | 28 | 5 | 23 | 0 | 30 | 1 | 27 |
| Papavramidis et al. [17] | Greece | 2021 | RCT | 2b | 8 | 180 | 90 | 90 | 3 | 87 | 5 | 85 | 3 | 87 | 5 | 85 | ||||
| Yin et al. [9] | China | 2022 | RCT | 2b | 8 | 180 | 90 | 90 | 25 | 65 | 39 | 51 | 25 | 65 | 39 | 51 | 0 | 90 | 0 | 90 |
| Wolf et al. [18] | Germany | 2022 | RCT | 2b | 8 | 60 | 30 | 30 | 7 | 23 | 14 | 16 | 7 | 23 | 14 | 16 | ||||
| Lykke et al. [19] | Denmark | 2023 | RCT | 1b | 9 | 170 | 40 | 44 | 18 | 22 | 21 | 23 | 4 | 36 | 6 | 38 | ||||
| Rossi et al. [8] | Italy | 2023 | RCT | 1b | 9 | 200 | 100 | 100 | 12 | 88 | 18 | 82 | 1 | 99 | 4 | 96 | ||||
| Huang et al. [20] | China | 2023 | RCT | 2b | 8 | 100 | 50 | 50 | 18 | 32 | 30 | 20 | 17 | 33 | 31 | 19 | 0 | 50 | 1 | 49 |
| Overall | 1363 | 636 | 637 | 80 | 335 | 128 | 289 | 88 | 548 | 158 | 479 | 1 | 475 | 8 | 465 | |||||
| No. | Cohort | Malignancy vs. Benign | Type of Assessment | NIRAF Equipment | Parathyroid Gland Identification | Accidental Parathyroidectomy | Parathyroid Auto-Transplantation Rate | Definition of Hypocalcemia | Mean POD 1 PTH Levels |
|---|---|---|---|---|---|---|---|---|---|
| 1 | Dip et al. [14] | Malignant: 48.8%; benign cases: 51.2% | NIRAF only | Fluobeam 800 (Fluoptics, France) | NIRAF (3.7) vs. non-NIRAF arm (3.6) (p = 0.32) | NIRAF arm: 4.7% | Serum calcium levels < 8 mg/dL | ||
| 2 | Benmiloud et al. [15] | Malignant: 23.2%; benign cases: 76.8% | NIRAF only | Fluobeam 800 (Fluoptics, France) | All 4-gland identification in NIRAF (47%) vs. non-NIRAF arm (19.2%) (p < 0.001) | NIRAF arm (2.4%) vs. non-NIRAF arm (11.5%) (p = 0.006) | NIRAF arm: 2.4%; non-NIRAF arm: 11.5% (p = 0.006) | Corrected calcium levels < 8 mg/dL | NIRAF arm: 33.2 pg/mL; non-NIRAF arm: 28.6 pg/mL (p = 0.07) |
| 3 | Papavramidis et al. [17] | Malignant: 49.4%; benign cases: 50.6% | NIRAF only | Fluobeam LX (Fluoptics, France) | All 4 parathyroid glands were found in 29% of cases, and 3 glands were identified in 24.2% of the NIRAF arm | NIRAF arm (14.4%) vs. non-NIRAF arm (28.9%) (p = 0.002) | Hypocalcemia defined as serum calcium levels < 8 mg/dL | NIRAF arm: 30.4 pg/mL; non-NIRAF arm: 23.5 pg/mL (p = 0.005) | |
| 4 | Parfentiev et al. [16] | Malignant: 18.9%; benign cases: 81.1% | NIRAF followed by ICG angiography | Autofluorescence mode of Karl Storz endoscopic system with 3 chip cameras | Hypocalcemia defined as serum calcium levels < 8 mg/dL | NIRAF arm: 30.08 pg/mL; non-NIRAF arm: 30.17 pg/mL (p = 0.52) | |||
| 5 | Wolf et al. [18] | Benign: 100% | NIRAF only | Autofluorescence mode of Karl Storz endoscopic system with 3 chip cameras | NIRAF (3.03) vs. non-NIRAF arm (3.03) (p = 1) | NIRAF arm: 0.3; non-NIRAF arm: 0.4 (p = 0.53) | Hypocalcemia defined as serum calcium levels < 8 mg/dL | NIRAF arm: 26.7 pg/mL; non-NIRAF arm: 24.7 pg/ml | |
| 6 | Yin et al. [9] | Malignant: 100% | NIRAF followed by ICG angiography | Infrared camera (Nanjing Nouyuan Medical device, China) | NIRAF (3.6) vs. non-NIRAF arm (3.2) (p < 0.001) | NIRAF arm: 2.3; non-NIRAF arm: 2.2 (p = 0.6) | *Hypoparathyroidism = PTH < 12 pg/mL | NIRAF arm: 21.1 pg/mL; non-NIRAF arm: 15 pg/mL (p < 0.001) | |
| 7 | Huang et al. [20] | Malignant: 100% | NIRAF only | Infrared camera (Jinan microsmart intelligence technologies, China) | NIRAF (3.9) vs. non-NIRAF arm (3.2) (p < 0.001) | NIRAF arm: 6%; non-NIRAF arm: 34% (p < 0.001) | Serum calcium levels < 8.8 mg/dL | NIRAF arm: 21.7 pg/mL; non-NIRAF arm: 11.4 pg/mL (p < 0.001) | |
| 8 | Rossi et al. [8] | Malignant: 58%; benign cases: 42% | NIRAF followed by ICG angiography | Fluobeam LX (Fluoptics, France) | NIRAF (3.83) vs. non-NIRAF arm (3.64) (p = 0.028) | NIRAF arm (0%) vs. non-NIRAF arm (4%) | NIRAF arm: 9%; non-NIRAF arm: 34% | Corrected calcium levels < 8 mg/dL | NIRAF arm: 16.67 pg/mL; non-NIRAF arm: 15.04 pg/mL (p = 0.165) |
| 9 | Lykke et al. [19] | Malignant: 59.8%; benign cases: 40.2% | NIRAF only | Fluobeam 800 (Fluoptics, France) and Elevision IR (Medtronic, USA) | NIRAF (7.2%) vs. non-NIRAF arm (9%) (p = 0.94) | Ionic calcium levels < 4.72 mg/dL |
| Overall Hypocalcemia | Temporary Hypocalcemia | Permanent Hypocalcemia | |
|---|---|---|---|
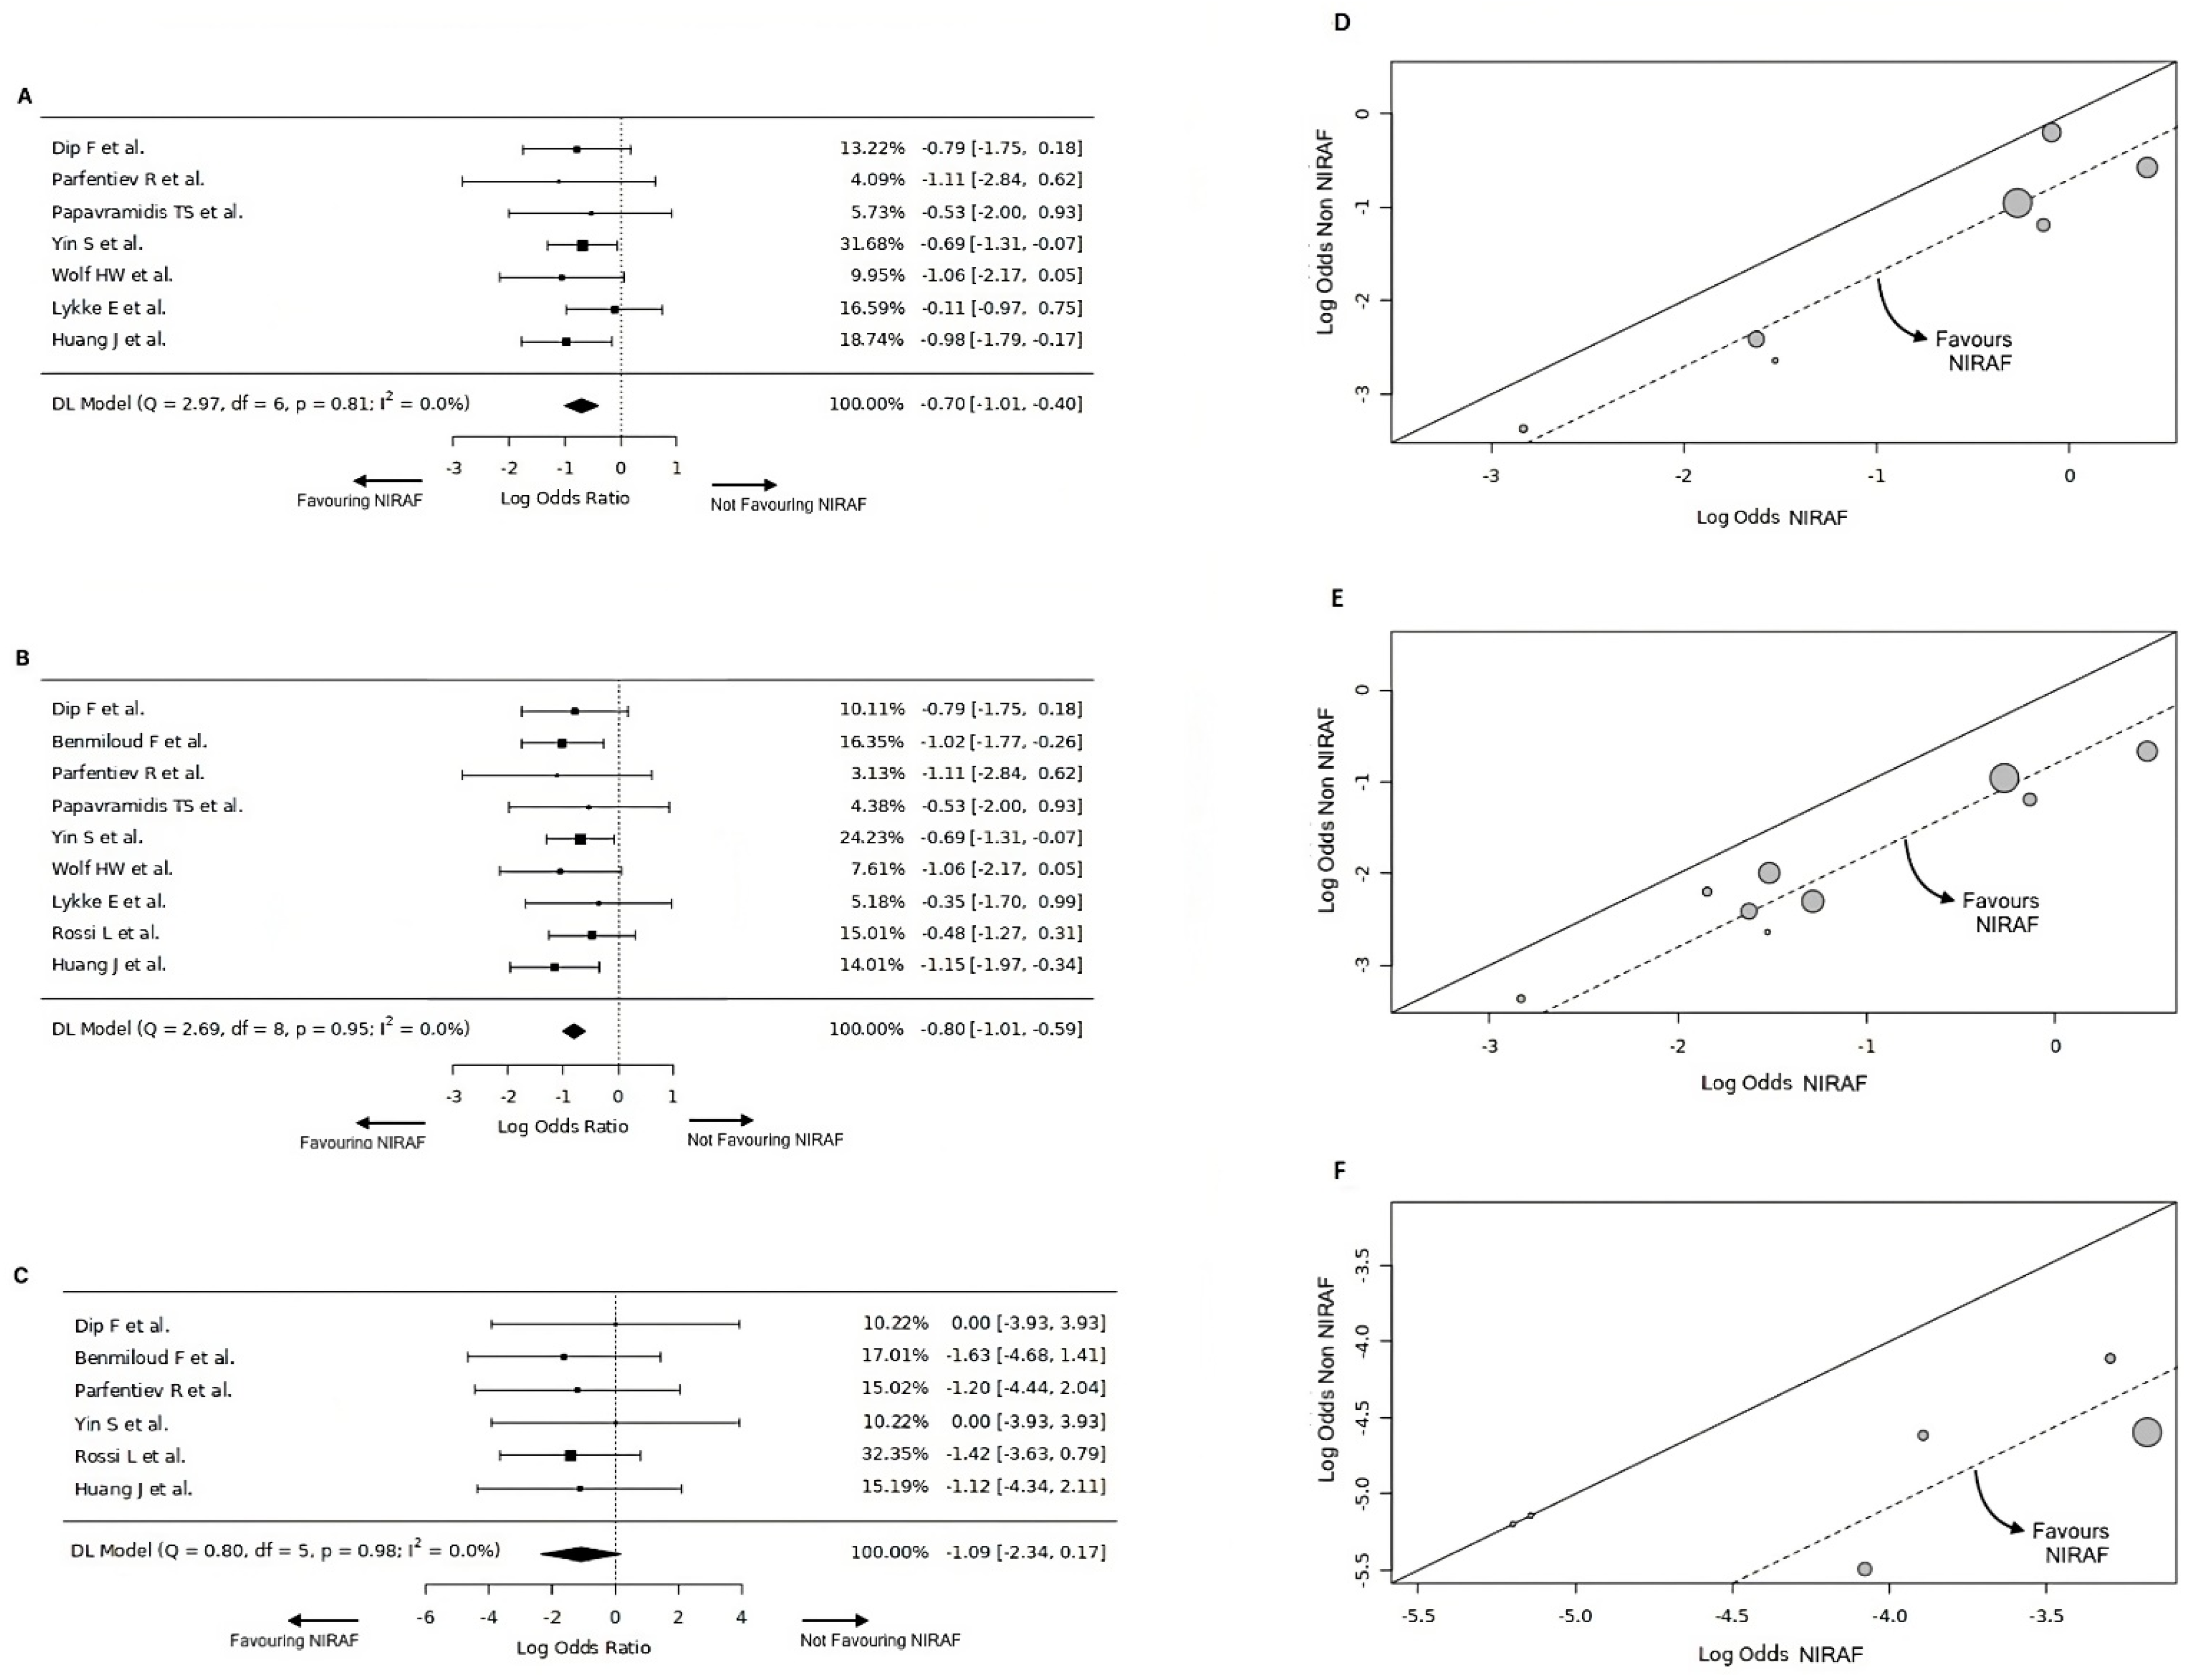
| Number of studies (k) | k = 7 | k = 9 | k = 6 |
| Log odds ratios | Range: −1.11 to −0.11 | Range: −1.15 to −0.35 | Range: −1.63 to 0 |
| Majority of estimates | Negative (100%) | Negative (100%) | Negative (in 4 out of 6 studies, 67%) |
| Estimated average log odds ratio | \hat{\μ} = −0.7 | \hat{\μ} = −0.8 | \hat{\μ} = −1.08 |
| 95% confidence interval | −1.05 to −0.35 | −1.11 to −0.49 | −2.34 to 0.17 |
| Significance of average outcome | z-score = −3.95, p-value < 0.001 | z-score = −5.1375, p-value < 0.001 | z-score = −1.6953, p-value = 0.09 |
| Maximum weightage | Yin et al. [9] (31.6%) | Yin et al. [9] (24.2%) | Rossi et al. [8] (32.3%) |
| Heterogeneity | Q-test p-value = 0.81, tau2 = 0, I2 = 0% | Q-test p-value = 0.95, tau2 = 0, I2 = 0% | Q-test p-value = 0.98, tau2 = 0, I2 = 0% |
| Outliers | No outlier studies, Studentised residuals < ±2.69 | No outlier studies, Studentised residuals < ±2.77 | No outlier studies, Studentised residuals < ±2.64 |
| Influential studies | None, Cook’s distances < 1 | None, Cook’s distances < 1 | None, Cook’s distances < 1 |
| Funnel plot asymmetry | Rank correlation p-value = 1, regression test p-value = 0.73 | Rank correlation p-value = 1, regression test p-value = 0.98 | Rank correlation p-value = 0.14, regression test p-value = 0.49 |
Disclaimer/Publisher’s Note: The statements, opinions and data contained in all publications are solely those of the individual author(s) and contributor(s) and not of MDPI and/or the editor(s). MDPI and/or the editor(s) disclaim responsibility for any injury to people or property resulting from any ideas, methods, instructions or products referred to in the content. |
© 2024 by the authors. Licensee MDPI, Basel, Switzerland. This article is an open access article distributed under the terms and conditions of the Creative Commons Attribution (CC BY) license (https://creativecommons.org/licenses/by/4.0/).
Share and Cite
Rao, K.N.; Rajguru, R.; Dange, P.; Vetter, D.; Triponez, F.; Nixon, I.J.; Randolph, G.W.; Mäkitie, A.A.; Zafereo, M.; Ferlito, A. Lower Rates of Hypocalcemia Following Near-Infrared Autofluorescence Use in Thyroidectomy: A Meta-Analysis of RCTs. Diagnostics 2024, 14, 505. https://doi.org/10.3390/diagnostics14050505
Rao KN, Rajguru R, Dange P, Vetter D, Triponez F, Nixon IJ, Randolph GW, Mäkitie AA, Zafereo M, Ferlito A. Lower Rates of Hypocalcemia Following Near-Infrared Autofluorescence Use in Thyroidectomy: A Meta-Analysis of RCTs. Diagnostics. 2024; 14(5):505. https://doi.org/10.3390/diagnostics14050505
Chicago/Turabian StyleRao, Karthik N., Renu Rajguru, Prajwal Dange, Diana Vetter, Frederic Triponez, Iain J. Nixon, Gregory W. Randolph, Antti A. Mäkitie, Mark Zafereo, and Alfio Ferlito. 2024. "Lower Rates of Hypocalcemia Following Near-Infrared Autofluorescence Use in Thyroidectomy: A Meta-Analysis of RCTs" Diagnostics 14, no. 5: 505. https://doi.org/10.3390/diagnostics14050505