Systematic Review

Diagnostic Value of Superb Microvascular Imaging in Differentiating Benign and Malignant Breast Tumors: A Systematic Review and Meta-Analysis

1
Graduate School, Guangzhou Medical University, Guangzhou 510180, China
2
Department of Ultrasound, Shenzhen Second People’s Hospital, The First Affiliated Hospital of Shenzhen University, Sungang West Road 3002, Futian District, Shenzhen 518025, China
*
Authors to whom correspondence should be addressed.
Diagnostics 2022, 12(11), 2648; https://doi.org/10.3390/diagnostics12112648
Submission received: 21 September 2022 / Revised: 26 October 2022 / Accepted: 28 October 2022 / Published: 31 October 2022

Abstract

:
Purpose: We performed a systematic review and meta-analysis of studies that investigated the diagnostic performance of Superb Microvascular Imaging (SMI) in differentiating between benign and malignant breast tumors. Methods: Studies published between January 2010 and March 2022 were retrieved by online literature search conducted in PubMed, Embase, Cochrane Library, Web of Science, China Biology Medicine Disc, China National Knowledge Infrastructure, Wanfang, and Vip databases. Pooled sensitivity, specificity, and diagnostic odd ratios were calculated using Stata software 15.0. Heterogeneity among the included studies was assessed using I2 statistic and Q test. Meta-regression and subgroup analyses were conducted to investigate potential sources of heterogeneity. Influence analysis was conducted to determine the robustness of the pooled conclusions. Deeks’ funnel plot asymmetry test was performed to assess publication bias. A summary receiver operating characteristic curve (SROC) was constructed. Results: Twenty-three studies involving 2749 breast lesions were included in our meta-analysis. The pooled sensitivity and specificity were 0.80 (95% confidence interval [CI], 0.77–0.84, inconsistency index [I2] = 28.32%) and 0.84 (95% CI, 0.79–0.88, I2 = 89.36%), respectively. The pooled diagnostic odds ratio was 19.95 (95% CI, 14.84–26.82). The area under the SROC (AUC) was 0.85 (95% CI, 0.81–0.87). Conclusion: SMI has a relatively high sensitivity, specificity, and accuracy for differentiating between benign and malignant breast lesions. It represents a promising supplementary technique for the diagnosis of breast neoplasms.

1. Introduction

Breast cancer, the most common neoplasm in women, is the leading cause of cancer-related female deaths worldwide. According to the Global Cancer Statistics (2020), breast cancer accounted for 11.7% of all new cancer diagnoses and 6.9% of all cancer-related deaths [1]. Early diagnosis is crucial for the prognosis of breast cancer patients. Wulburga et al. [2] demonstrated that early diagnosis of breast cancer is associated with a distinctly higher 5-year survival probability than diagnosis at a late stage (62.5% versus 35.8%). In addition, tumor neovascularization is strongly associated with tumor growth, invasion, and metastasis. Previous research has demonstrated that tumor growth stage can be divided into “pre-angiogenesis stage” and “angiogenesis stage”, according to whether the vascular diameter is >2 mm. When breast tumor is in the pre-angiogenesis stage (<2 mm in diameter), the extent of infiltrates is very limited; however, when tumor progresses to the angiogenesis stage (>2 mm in diameter), there is proliferation of blood vessels within lesion resulting in capillary infiltration into the surrounding tissue to absorb nutrients for sustaining tumor invasive growth and metastasis [3]. Therefore, early detection and characterization of tumor neovascularization are of great significance for the diagnosis and treatment of breast cancer [4]. Immunohistochemical evaluation of microvascular density (MVD) is the gold standard for evaluating tumor angiogenesis. However, the measurement of MVD is invasive and only available after surgery, which limits its application [5].
As a noninvasive, cost-effective, and radiation-free option, conventional ultrasound is an important screening modality for the early detection of breast lesions [6]. In addition, Color Doppler Flowing Imaging (CDFI) and Power Doppler Imaging (PDI) are widely used to display the number and characteristics of blood vessels within breast lesions [7]. However, several studies suggested that it may be difficult for CDFI and PDI to differentiate microvessels (<0.1 mm in diameter) within breast lesions [8,9,10].
With the rapid development of computer techniques in clinical ultrasonography [11], Superb Microvascular Imaging (SMI), a novel doppler technique, has been increasingly used in recent years. Moreover, the imaging principles of SMI are significantly different from CDFI. CDFI entails application of a single dimensional wall filter to remove the artifact, which contributes to the loss of low-speed flow components. In contrast, SMI uses multi-dimensional filter to separate flow signals from clutter, thus removing only the motion artifact and preserving the slow flow signals [12]. Currently, SMI is widely used for imaging of liver, thyroid, breast, and cervical lymph nodes [13].
A meta-analysis addressing this topic was published, which included 15 studies with 2071 breast lesions examined using SMI [14]. However, it had some limitations. First, the inclusion and exclusion criteria for studies were relatively less rigorous. For example, the purpose of a study included in their review was to investigate the effectiveness of SMI for the differentiation of intraductal breast lesions, not the overall breast lesions [15]. the results of the meta-analysis may have been affected by some data extraction errors [8,16,17]. Lastly, although they performed meta-regression and subgroup analysis to investigate the sources of heterogeneity, the setting of heterogeneity factors is relatively unreasonable.
Given these limitations, there was insufficient data to assess the accuracy of SMI for differentiation of breast lesions. It is necessary to reappraise the diagnostic value of SMI in differentiating benign and malignant breast tumors. In addition, there are four major diagnostic criteria of breast tumors in SMI, namely: Alder classification (AC), the presence of penetrating vessel (PV), microvascular distribution pattern (MVDP), and vascular index (VI). However, the diagnostic performance of SMI in previous studies showed variability due to the use of different diagnostic criteria. Therefore, the aim of our systematic review was to evaluate the diagnostic accuracy of SMI in differentiating benign and malignant breast tumors and to identify the diagnostic criteria associated with the best diagnostic performance.
Generally, this systematic review is structured as follows: “Introduction”, “Materials and Methods”, “Results”, “Discussion”, and” Conclusions”.

2. Materials and Methods

The guidelines of Preferred Reporting Items for Systematic Reviews and Meta-Analyses (PRISMA) of Diagnostic Test Accuracy (DTA) were followed in this systematic review [18]. which was registered on PROSPERO (https://www.crd.york.ac.uk/prospero/ (accessed on 1 February 2022)) (*registration number: CRD42021262596). In addition, the organization of the article is inspired by some high-quality studies [19,20].

2.1. Literature Search Strategy

Relevant studies published between January 2010 and March 2022 were identified by online literature search conducted in PubMed, Embase, Cochrane Library, Web of Science, China Biology Medicine Disc, China National Knowledge Infrastructure, Wanfang, and Vip databases. Medical Subject Headings (MeSH) terms as well as free words were adopted. The following search terms were used in our search strategy: “breast neoplasm (or breast carcinoma, breast cancer, breast tumor, mammary carcinoma, mammary cancer, mammary tumor)”, “superb microvascular imaging (or microvascular imaging, SMI),” “ultrasonography (or ultrasound, sonography)”, and “sensitivity and specificity (or predictive value of tests, predictive value, accuracy)”. In addition, the reference lists of relevant articles were manually screened to identify additional studies.

2.2. Study Selection

The EndNote software 20.0 (Clarivate Analytics, Philadelphia, PA, USA) was used to manage the literature retrieved from electronic databases. Two reviewers independently screened the retrieved studies for eligibility. The inclusion criteria were: (1) original research articles in which patients with suspected breast lesions were screened using SMI (regardless of whether they were assessed with other imaging modalities, such as conventional ultrasonography, mammography, CEUS, SWE, or MRI); (2) at least one of the four diagnostic criteria mentioned above was used; (3) true-positive (TP), false-positive (FP), false-negative (FN), and true negative (TN) rates could be extracted directly or indirectly; (4) 50 or more lesions were included in the study; (5) language of publication: English and Chinese; and (6) the nature of breast tumors was confirmed by surgery or aspiration biopsy.
The exclusion criteria were: (1) review articles, case reports, meta-analyses, letters, or conference abstracts; (2) duplicated publications; (3) the studies restricted to specific breast neoplasms, such as intraductal papilloma or small breast malignant tumor (less than 10 mm in diameter); and (4) the outcome indicator (TP, FP, FN, TN) cannot be directly or indirectly extracted from the article. Conflicts between individual judgments were resolved by discussion or consultation with a third author.

2.3. Data Extraction

The 2 reviewers independently extracted data pertaining to the following variables using Microsoft Excel spreadsheets: (1) general study characteristics including the first author’s name, country, publication year, number of lesions, mean age of patients, mean size of lesions, instrument used for SMI, scale, study design, diagnostic criteria; and (2) The TP, FP, FN, and TN were obtained directly or calculated based on the reported sensitivity and specificity values. In case of any missing information, the original authors were contacted for the relevant information.

2.4. Quality Assessment

All the included studies were independently assessed by 2 reviewers using the Quality Assessment of Diagnostic Accuracy Studies checklist version 2 (QUADAS-2). QUADAS-2 includes 4 items in the bias risk domain and 3 items in the applicability domain. The 4 items in the bias risk domain are: (1) patient selection; (2) index test; (3) reference standard; and (4) flow and timing. The 3 items in the applicability domain are: (1) patient selection; (2) index test; and (3) reference standard. Each item within the domains of QUADAS-2 was classified as low, high, and unclear risk. If any of the items in the domain were judged as no, it was judged as high risk. Only if all items in the domain were judged as yes, it was judged as low risk. If one or more of the items in the domain were judged to be uncertain, it was judged as uncertain risk. The quality assessment graphs were prepared using RevMan software 5.3 (The Nordic Cochrane Center, The Cochrane Collaboration, 2014).

2.5. Strategy for Data Synthesis

This study was conducted based on the guidelines for systematic reviews and meta-analyses [21,22]. TPs, FPs, FNs and TNs were used to calculate the pooled sensitivity, specificity, positive- and negative-likelihood ratios (PLRs and NLRs), and the diagnostic odds ratios (DORs) with corresponding 95% confidence intervals (CI) [23]. In addition, the summary receiver operating characteristic (SROC) analysis was performed to determine the diagnostic accuracy by measuring the area under the curve [24].
The Q test and the I2 statistic were used to assess the heterogeneity of sensitivity and specificity among studies. p values < 0.1 for Q test or I2 values > 0.5 were considered indicative of significant heterogeneity [25]. By sequentially removing one study at a time, influence analysis was conducted to determine the robustness of the pooled conclusions. Further, to investigate the source of heterogeneity, univariate meta-regression and subgroup analysis were conducted. Lastly, publication bias was evaluated with the Deeks’ funnel plot asymmetry test [26]. All statistical analyses were performed using Stata Version 15.0 (Stata Corp, College Station, TX, USA).

2.6. Heterogeneity Assessment

Some studies have shown that the epidemiology, risk factors, and tumor characteristics of breast cancer in China differ from those in Korea and other Asian countries [27,28,29]. In addition, VI is a quantitative diagnostic criteria with low operator dependence, whereas AC, PV and MVDP are qualitative diagnostic criteria with relatively high operator dependence [30]. Based on the country, diagnosis criteria, and study design, meta-regression and subgroup analysis were conducted to investigate the sources of heterogeneity. These definitions and grouping methods for included studies are described below in detail. If the country was China, it was marked Yes, otherwise marked No. Moreover, if the diagnostic criteria were VI, it was marked Yes, otherwise marked No. Furthermore, if the diagnosis basis was a prospective design, it was marked Yes, otherwise marked No. As for the definition of subgroup, the included study population was divided into two groups based on China or non-China: groups 1 and 2; diagnostic criteria were divided into four groups based on AC, PV, MVDP, and VI: groups 1,2,3 and 4. The included study design was divided into two groups based on study design: groups 1 and 2.

3. Results

3.1. Study Selection

A total of 404 articles were identified after the initial search; of these, 184 duplicated studies were removed. After reviewing the titles and abstracts, another 82 articles were excluded. After full-text assessment of the literature, 26 articles were considered eligible based on the inclusion and exclusion criteria. It is worth mentioning that two types of diagnostic basis were respectively used in two eligible studies. Ultimately, 28 studies were included in the qualitative review. In addition, a further five studies were excluded due to incomplete data. Hence, 23 studies involving 2749 lesions were included in the meta-analysis. A schematic illustration of the literature screening and selection process is presented in Figure 1 (checklist seen in Supplementary Materials).

3.2. Study Characteristics

The included studies were published between 2015 and 2021. Overall, 3732 lesions in 3579 patients were analyzed. The average age of the patients was 48.7 (range, 43.7–54.2) and the mean number of lesions per study was 133 (range, 50–300). Majority of the included studies were conducted in China [16,17,31,32,33,34,35,36,37,38,39,40,41,42,43,44,45,46,47,48]; five studies were conducted in Korea [30,49,50,51] and two studies were conducted in Turkey [52,53]. In all 23 studies, Alder classification, the presence of penetrating vessel, microvascular distribution pattern and VI were used as the diagnostic criteria of breast neoplasms and pathological results were used as the reference standard. Other main characteristics, including equipment used for SMI, scale and study design are presented in Table 1.

3.3. Quality Assessment

The results of quality assessment are presented in Figure 2 and Figure 3. With respect to the risk of bias, three studies were judged to have high risk of bias in the “patient selection” domain for not enrolling a consecutive and random sample of patients. Moreover, four studies were judged to have unclear risk of bias in the “patient selection” domain due to lack of information on whether a consecutive or random sample of patients was enrolled.11 studies had unclear risk of bias in the “index test” domain, since it was not clear whether a threshold was pre-specified, in addition, ten studies were judged to have unclear risk of bias due to lack of information on whether the index test results were interpreted without knowledge of the reference standard. As for “reference standard” domain, due to lack of information on whether the reference standard was interpreted without knowledge of the index test results, 14 studies were found to have unclear risk of bias. Moreover, there was a lack of information to determine whether reference standards correctly classified target conditions in three studies.
As for “flow and timing” domain, the analysis for all included patients was not performed in one study, leading to a high risk of bias. In addition, 22 studies were judged to have unclear risk of bias since an appropriate interval between index test and reference standard was not elaborated.
With respect to concerns regarding applicability, there were five studies with unclear concerns regarding patient selection, 14 studies with unclear concerns regarding index tests, and six with unclear concerns regarding references standard. In general, the quality of the included studies was relatively satisfactory.

3.4. Quantitative Synthesis

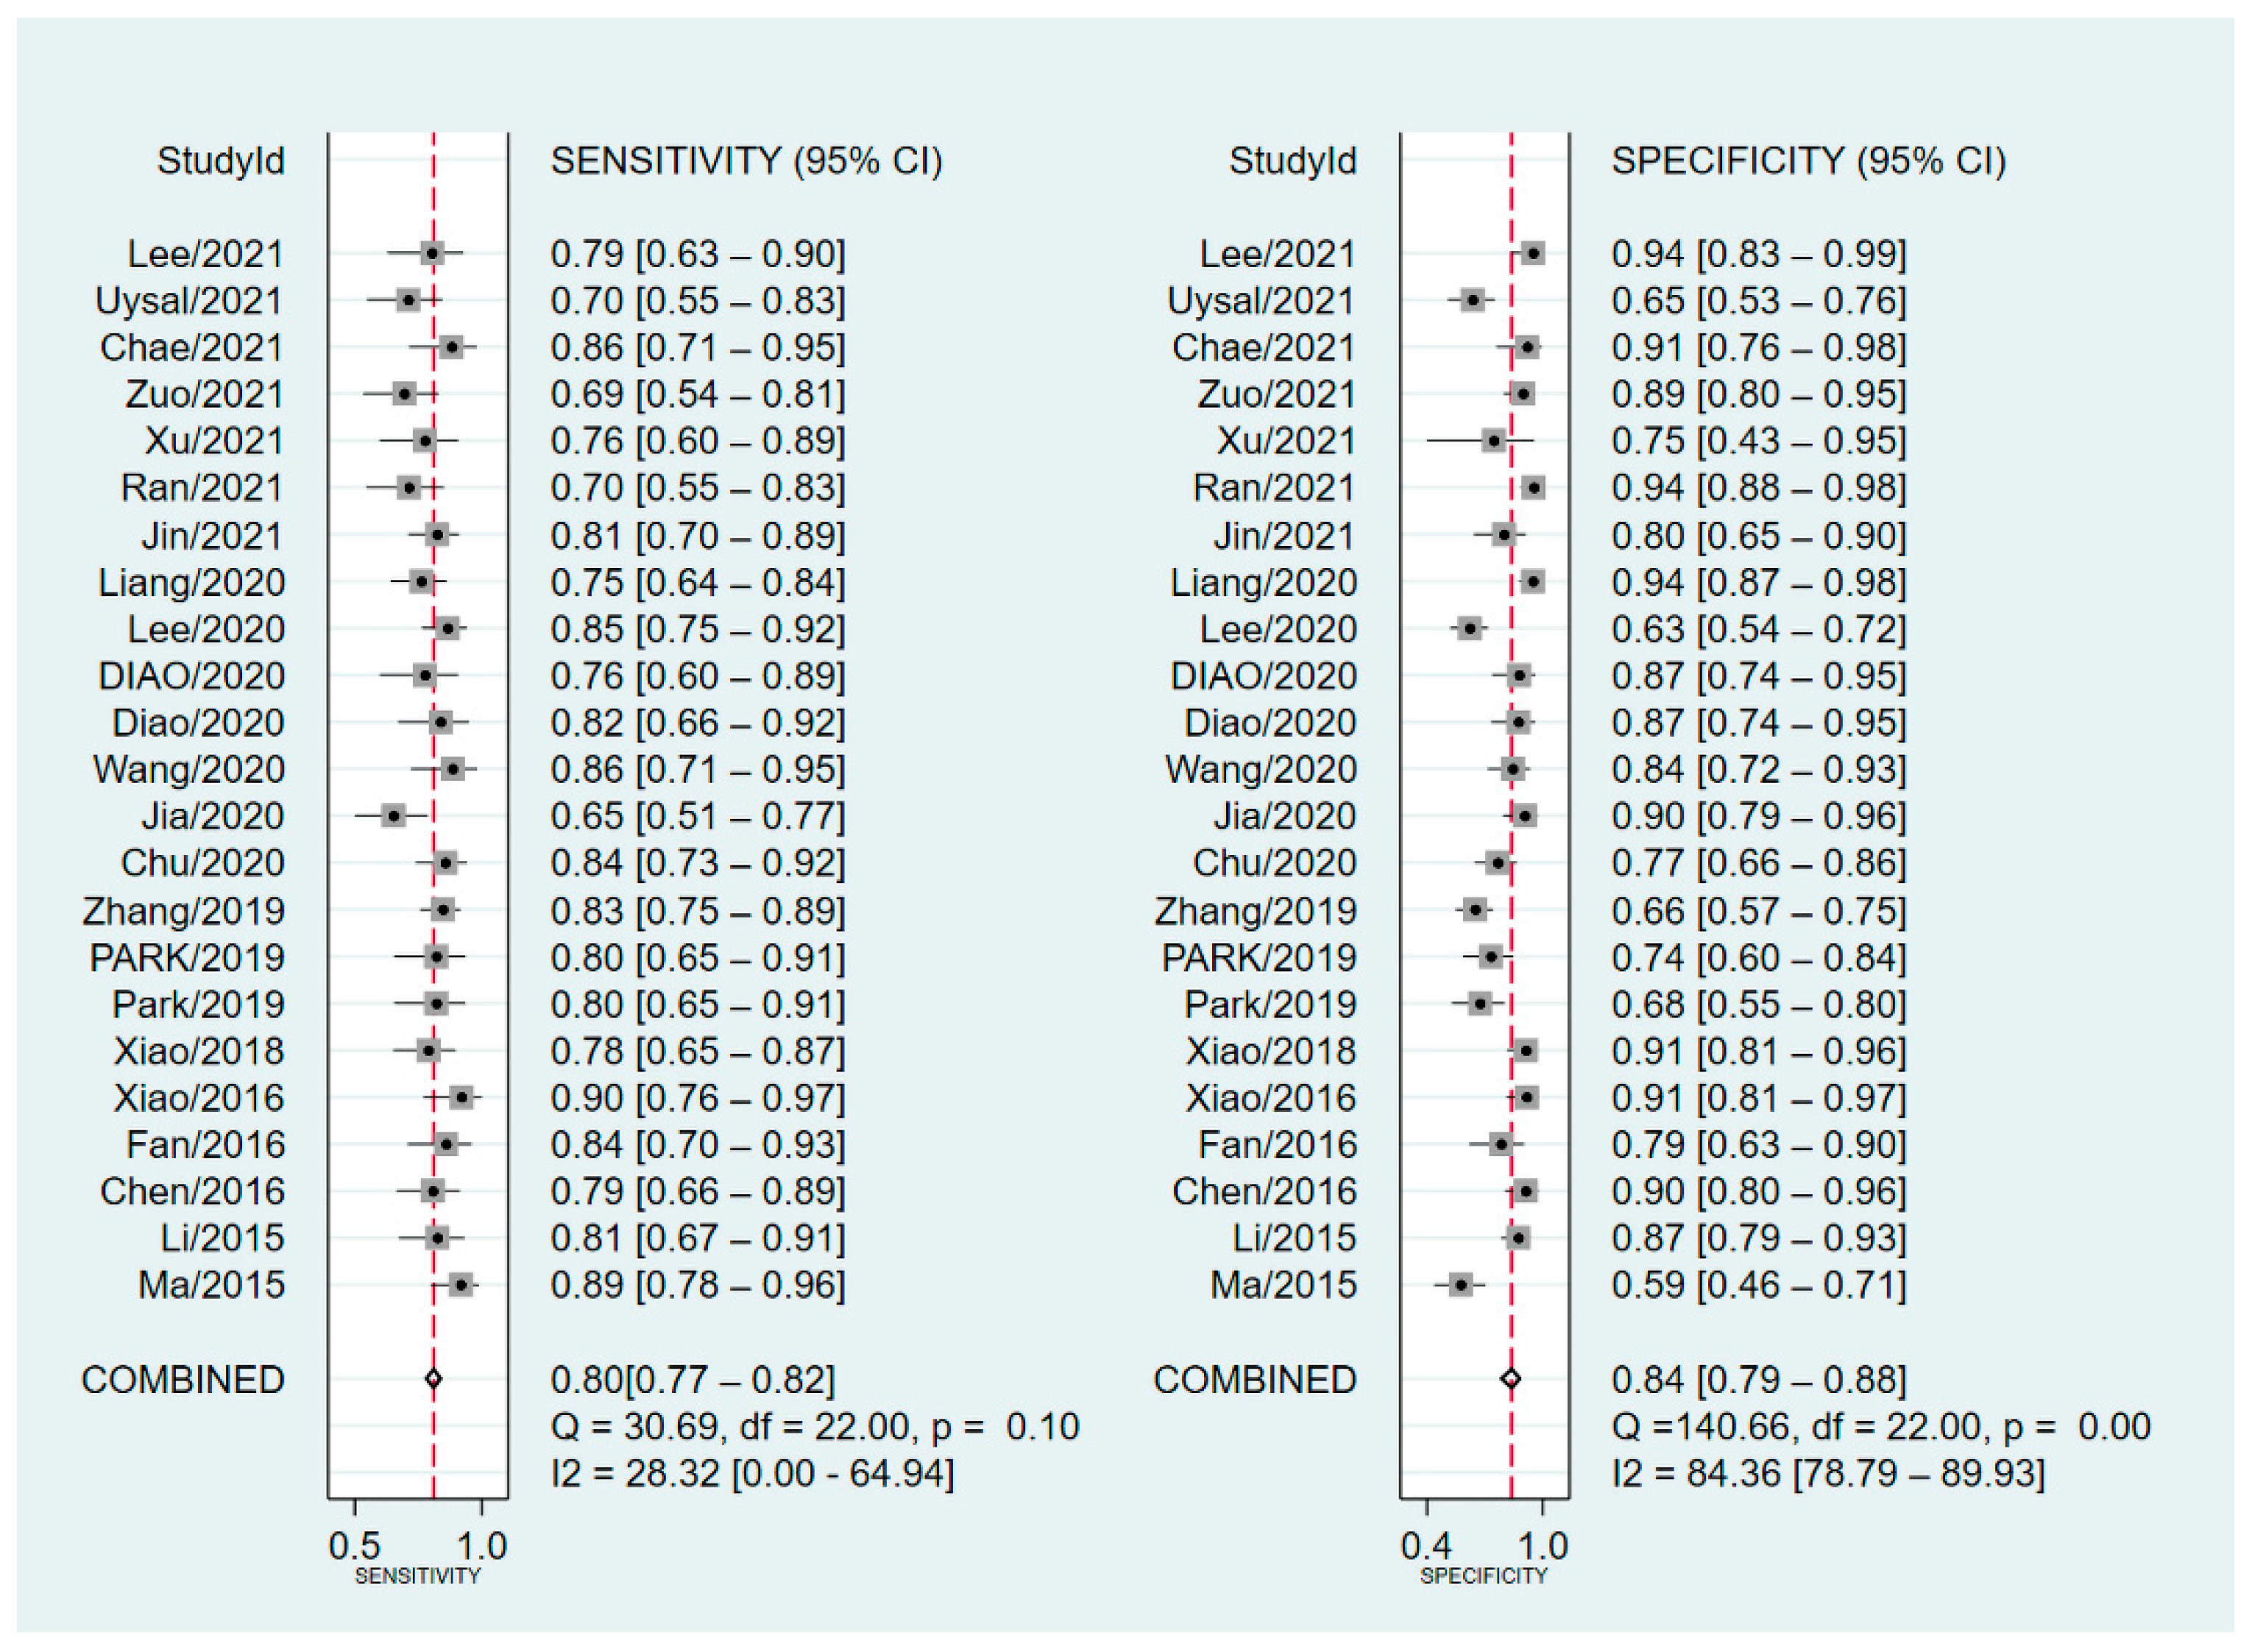
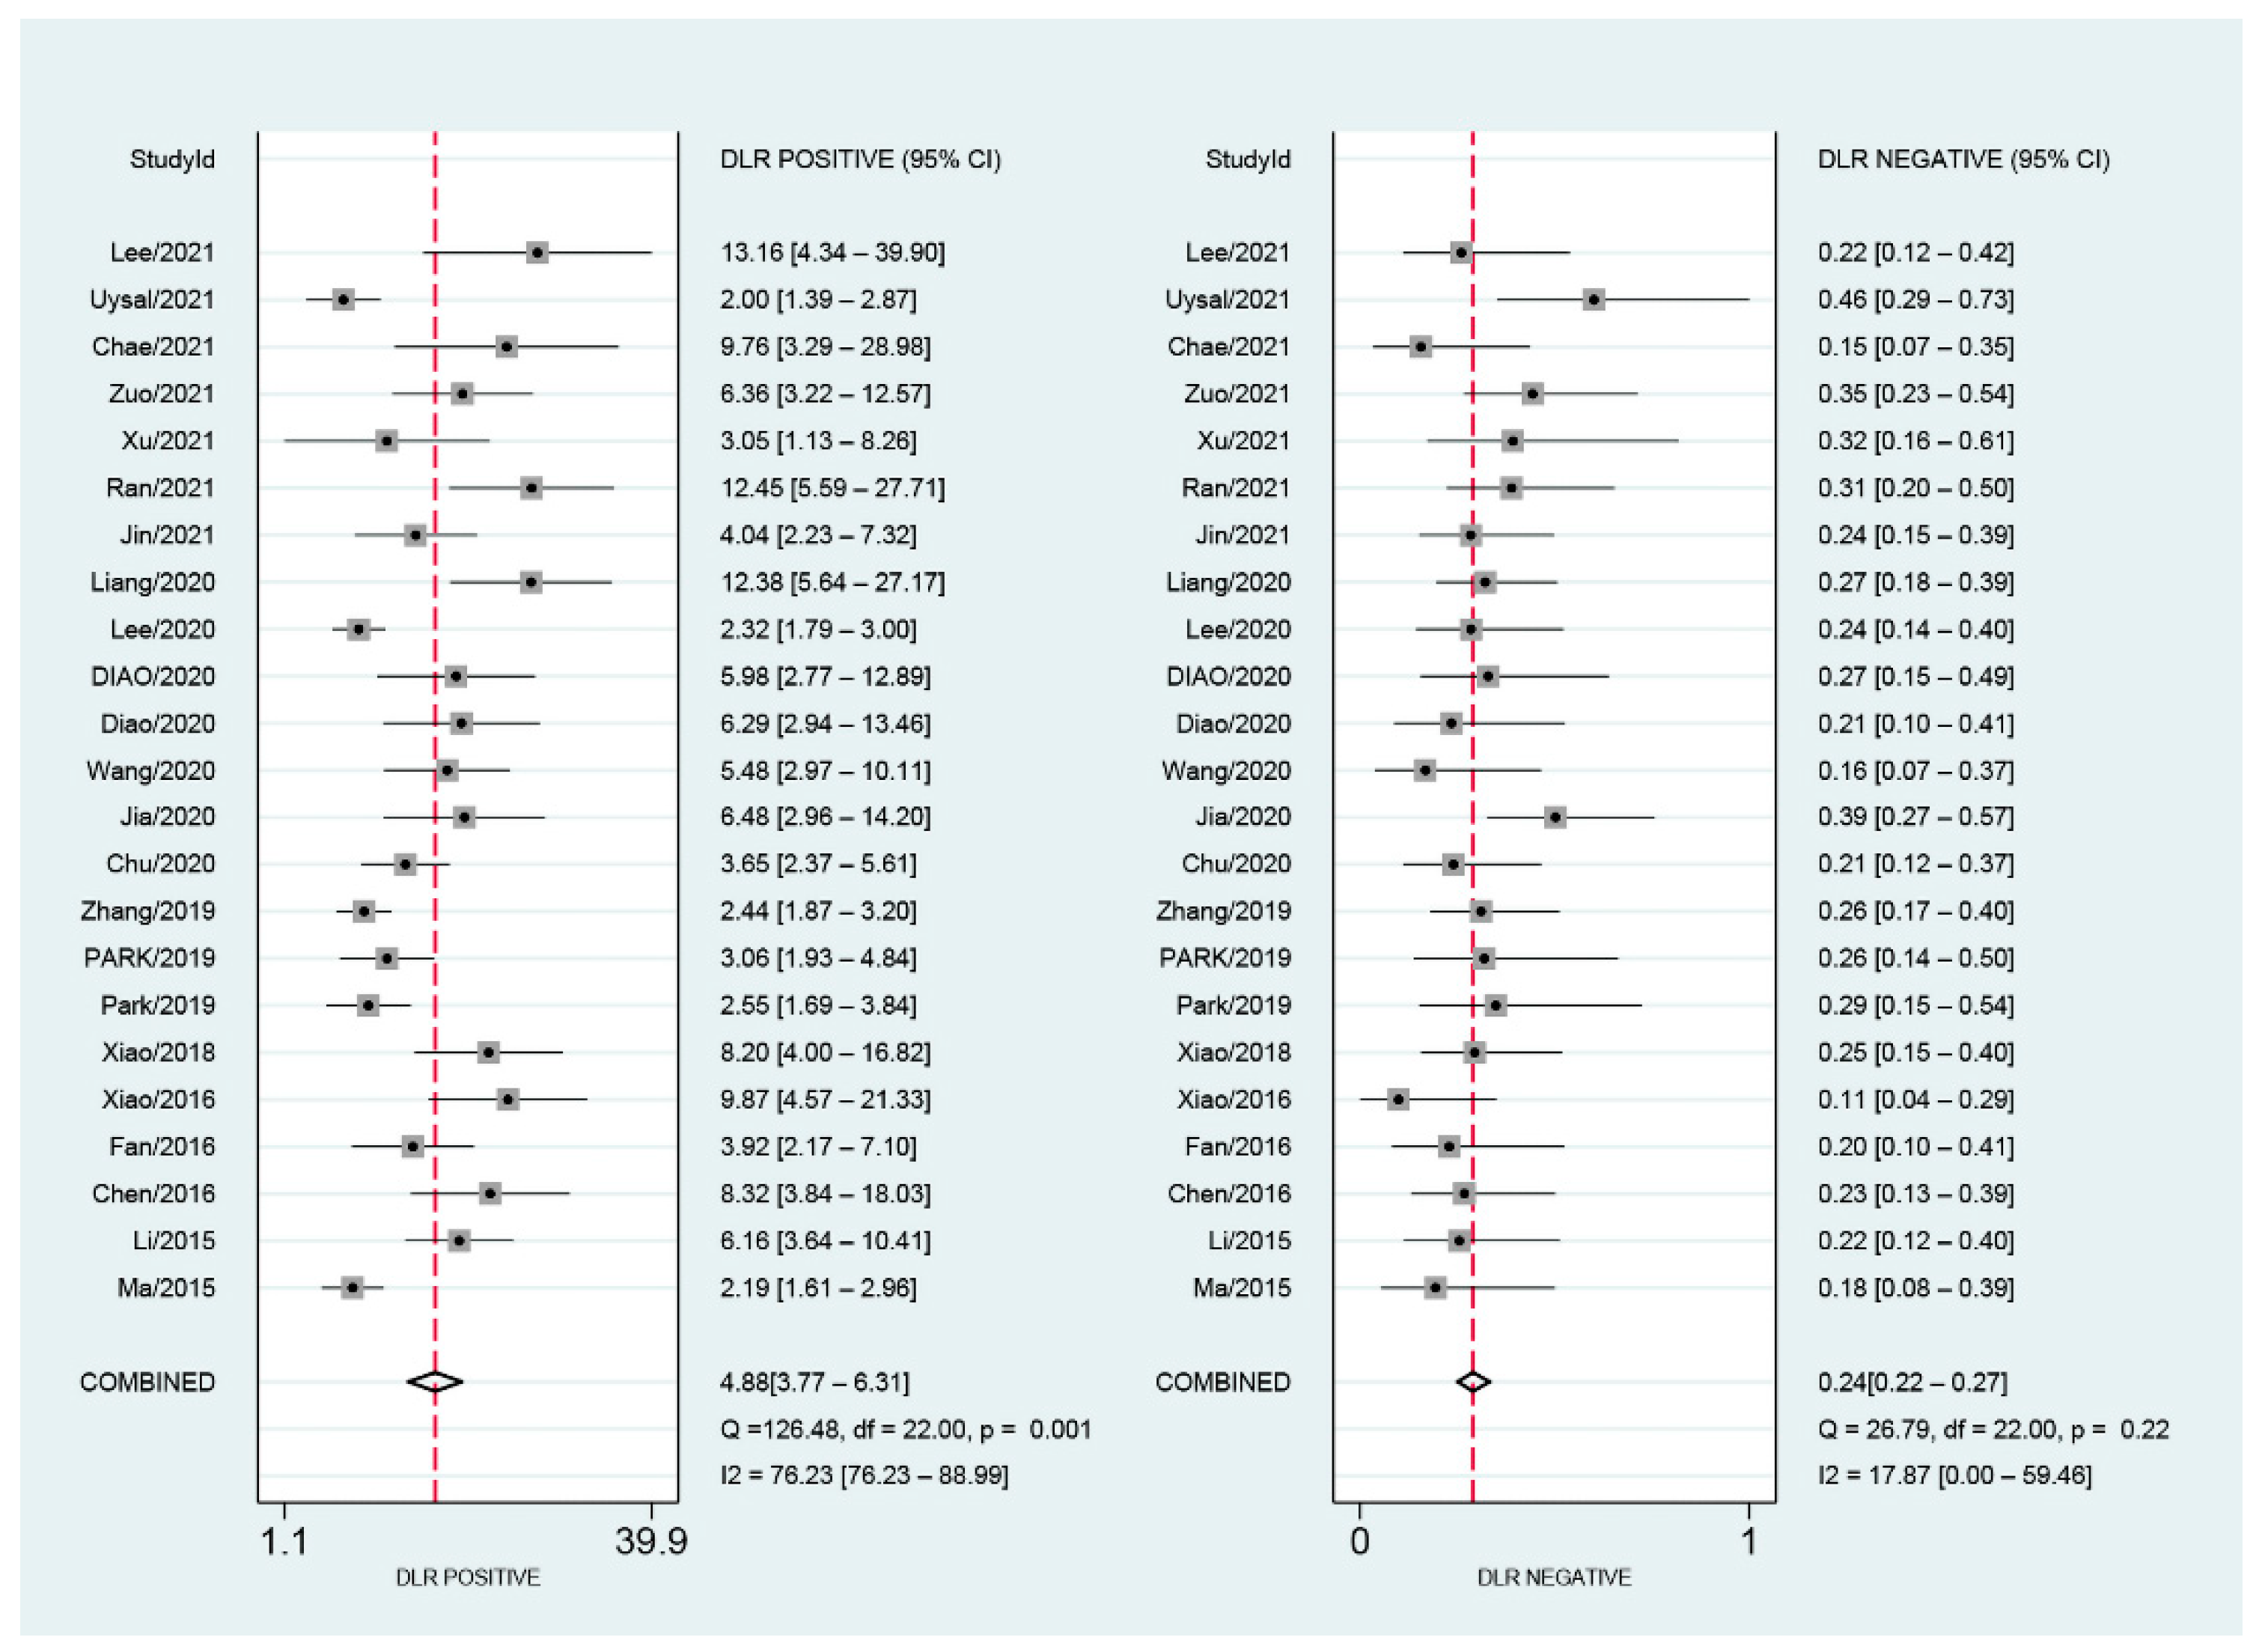
3.4.1. Diagnostic Accuracy Assessment

As shown in Figure 4, the pooled sensitivity and specificity were 0.80 (95% CI, 0.77–0.84) and 0.84 (95% CI, 0.79–0.88), respectively. There was slight heterogeneity in sensitivity (I2 = 28.32%, p = 0.10) and significant heterogeneity in specificity (I2 = 89.36%, p < 0.01). SROC for the diagnostic value of SMI using VI for differentiation of benign and malignant breast lesions is shown in Figure 5. The area under SROC (AUC) was 0.85. Figure 6 shows the summary of positive-likelihood ratios (PLRs) and negative-likelihood ratios (NLRs) of SMI for differentiating between benign and malignant breast lesions. The pooled PLR and NLR of all eligible studies were 4.88 (95% CI, 3.77–6.31) and 0.24 (95% CI, 0.22–0.27), respectively. In terms of NLR, there was a slight heterogeneity (I2 = 17.87%, p = 0.22) and in terms of PLR, there was a significant heterogeneity (I2 = 76.23%, p < 0.01). The pooled diagnostic odds ratio was 19.95 (95% CI, 14.84–26.82) (Figure 7). Moreover, the result of influence analysis showed the relative stability of the pooled conclusion of our study. (Figure 8).

3.4.2. Assessment of Publication Bias

Publication bias was assessed using the Deeks’ funnel plot asymmetry test. The results indicated no significant influence of publication bias of eligible studies (Figure 9).

3.5. Heterogeneity Assessment

We conducted meta-regression and subgroup analysis to investigate the potential source of heterogeneity. According to Figure 10, there was no statistically significant difference between sensitivity and specificity for patient mean age and lesion mean size. However, there is significant difference in sensitivity for the region of patients (p < 0.001). In addition, there are significant difference in both sensitivity and specificity for prospective study design and VI diagnostic (p < 0.001). A summary of the sensitivities, specificities, PLRs, NLRs and DORs of studies is presented in Table 2. The pooled specificities, PLRs values and DORs of the China group were higher than those of the non-China group. The pooled specificity, PLR values and DOR of the MVDP were higher than the other diagnostic criteria groups.

4. Discussion

4.1. Principal Results

In our current study, we evaluated the diagnostic performance of SMI in differentiating between benign and malignant breast lesions. In the 23 included studies, the sensitivity ranged from 0.77 to 0.82 and specificity ranged from 0.79 to 0.88. The pooled sensitivity and specificity values were 0.80 and 0.83, respectively. The pooled DOR was 19.95 and overall diagnostic accuracy, represented by AUC, was 85%. In addition, the pooled PLR and NLR of all eligible studies were 4.88 and 0.24, respectively, which indicated that SMI can be used to distinguish between benign and malignant breast tumors. However, due to the significant heterogeneity of specificity and PLR, we conducted a meta-regression and subgroup analysis. Meta-regression of the included studies indicated that region, study design, and diagnostic criteria might be potential sources of heterogeneity. However, these results require verification with follow-up studies due to the limited sample in this study. Subgroup analysis was also carried out for the diagnostic performance of SMI to differentiate benign and malignant breast lesions. There were higher pooled specificity, PLRs, and DORs in the China group compared to non-China group. It is worth mentioning that the pooled specificity, PLRs values, and DORs of the MVDP were higher than those of the other diagnostic criteria groups. Moreover, VI was roughly as effective as AC when used as the diagnostic basis for breast lesions on SMI. It is possible that the plane outlined by the sonographer with the richest blood flow signals is not the plane with the most obvious malignant characteristics, which may lead to missing important diagnostic information of breast lesions [50].

4.2. Comparison with Previous Systematic Review

A similar study was published, and the results supported the effectiveness of SMI in diagnosing breast lesions [14]. However, the meta-analysis had less rigorous criteria for selection of studies and data extraction, which may affect the credibility of the results. We conducted a relatively comprehensive literature search and employed more rigorous study selection criteria. Moreover, the application of QUADAS-2 tool is another strength of our work. Furthermore, we conducted more rational subgroup analyses to identify the sources of heterogeneity. For example, publication language should not be considered as a source of heterogeneity, because a study can be published in any language and the region of study may actually be the source of heterogeneity. Therefore, the previous study did not identify the source of heterogeneity, whereas our study suggests that region, study design, and diagnostic criteria may be potential sources of heterogeneity.

4.3. Clinical Implications of our Findings

SMI was shown to be superior to CDFI and PDI in detecting microvascular blood flow signals owing to its intelligent adaptive algorithm and powerful multidimensional wall filtering system [12]. At present, there are four main diagnostic criteria for breast tumors based on SMI, namely: AC, PV, MVDP, and VI. However, the choice of diagnostic basis is a key challenge for sonographers in clinical practice.
AC and VI are used to evaluate blood flow abundance of breast lesions. AC can be classified as grade 0, I, II, and III based on the number of blood vessels in the tumor [54]. However, the judgment of Alder grade may be affected by operator experience [51]. VI is defined as the ratio of blood vessels pixels within a lesion to pixels throughout the entire lesion, which can be calculated automatically by the built-in software of the instruments [4]. Lee et al. [30] demonstrated excellent intra-observer reproducibility and inter-observer reproducibility with respect to VI. In our meta-analysis, the pooled diagnostic performance of VI was equal to that of AC. Therefore, for inexperienced sonographers in clinical practice, VI may be a better choice, since it has similar diagnostic performance to AC but is more reproducible.
SMI enables visualization of breast tumor microvascular architecture. SMI mainly evaluates the microvascular structure from two perspectives: PVs and MVDP. In the subgroup analyses, the pooled diagnostic accuracy of the MVDP was higher than that of PV. Hence, the combination of VI and MVDP may unlock the potential of SMI for differentiating breast lesions. However, there is a paucity of relevant studies, and this requires validation in the future.

4.4. Limitations of Our Work

Some limitations of our study should be acknowledged. First, all eligible studies were conducted only in Asia, which may limit the generalizability of our results to patient populations in other parts of the world. Second, the parameter setting, and image acquisition details were not available for all studies, such as frame rate, dynamic range, and image acquisition section. It is possible that these factors contributed to heterogeneity of our study. Lastly, there were 23 eligible studies, however, only 2 of these studies used PVs as a diagnostic criterion, so a larger sample size may provide more convincing evidence. Further comprehensive studies are required to resolve these issues.

5. Conclusions

Our systematic review suggests that SMI has an encouraging diagnostic value to differentiate between benign and malignant breast tumors. Moreover, according to the subgroup analyses, MVDP may be more effective among the four main diagnostic criteria, and it may benefit sonographers in selecting appropriate diagnostic criteria. In addition, study design, region, and the selection of diagnostic criteria may be potential sources of heterogeneity. In spite of its current limitations, such as a restricted region and a relatively small sample size, SMI remains a promising supplementary tool for sonographers to distinguish between breast lesions in clinical practice.

Supplementary Materials

The following supporting information can be downloaded at: https://www.mdpi.com/article/10.3390/diagnostics12112648/s1, Word S1: PRISMA_2020_checklist.

Author Contributions

J.F., J.L. and C.J. contributed equally to this manuscript; J.F. was responsible for the literature retrieval and screening, and at the same time was responsible for the writing of the draft; J.L. and C.J. assessed the quality of the studies and performed data extraction and data pooling; Y.C. and S.C. were responsible for operating the software for statistical analysis. G.G. revised the manuscript; X.G. reviewed and edited the manuscript; All authors have read and agreed to the published version of the manuscript.

Funding

This study was supported by Key Disciplines of Shenzhen, grant number “SZXK052”.

Institutional Review Board Statement

Not applicable for studies not involving humans or animals.

Data Availability Statement

Not applicable.

Acknowledgments

We appreciate the helpful comments provided by the reviewers.

Conflicts of Interest

The authors declare no conflict of interest.

Abbreviations

ACAlder classification
AUCarea under the curve
CEUScontrast-enhanced ultrasonography
CIconfidence interval
CDFIcolor doppler flow imaging
DORdiagnostic odds ratio
FPfalse positive
FNfalse negative
I2inconsistency index square
LRlikely ratio
ORodds ratio
MRImagnetic resonance imaging
MVDPmicrovascular distribution pattern
PDIpower Doppler imaging
PVpenetrating vessel
SEstandard error
SROCsummary receiver operating characteristic curve
SMIsuperb microvascular imaging
VIvascular index
TPtrue positive
TNtrue negative

References

  1. Sung, H.; Ferlay, J.; Siegel, R.L.; Laversanne, M.; Soerjomataram, I.; Jemal, A.; Bray, F. Global Cancer Statistics 2020: GLOBOCAN Estimates of Incidence and Mortality Worldwide for 36 Cancers in 185 Countries. CA Cancer J. Clin. 2021, 71, 209–249. [Google Scholar] [CrossRef] [PubMed]
  2. Joko-Fru, W.Y.; Miranda-Filho, A.; Soerjomataram, I.; Egue, M.; Akele-Akpo, M.T.; N’da, G.; Assefa, M.; Buziba, N.; Korir, A.; Kamate, B.; et al. Breast cancer survival in sub-Saharan Africa by age, stage at diagnosis and human development index: A population-based registry study. Int. J. Cancer 2020, 146, 1208–1218. [Google Scholar] [CrossRef] [PubMed] [Green Version]
  3. Carmeliet, P.; Jain, R.K. Angiogenesis in cancer and other diseases. Nature 2000, 407, 249–257. [Google Scholar] [CrossRef] [PubMed]
  4. Park, A.Y.; Seo, B.K. Up-to-date Doppler techniques for breast tumor vascularity: Superb microvascular imaging and contrast-enhanced ultrasound. Ultrasonography 2018, 37, 98–106. [Google Scholar] [CrossRef] [PubMed] [Green Version]
  5. Schneider, B.P.; Miller, K.D. Angiogenesis of breast cancer. J. Clin. Oncol 2005, 23, 1782–1790. [Google Scholar] [CrossRef]
  6. Barba, D.; León-Sosa, A.; Lugo, P.; Suquillo, D.; Torres, F.; Surre, F.; Trojman, L.; Caicedo, A. Breast cancer, screening and diagnostic tools: All you need to know. Crit. Rev. Oncol. Hematol. 2021, 157, 103174. [Google Scholar] [CrossRef]
  7. Schroeder, R.J.; Bostanjoglo, M.; Rademaker, J.; Maeurer, J.; Felix, R. Role of power Doppler techniques and ultrasound contrast enhancement in the differential diagnosis of focal breast lesions. Eur. Radiol. 2003, 13, 68–79. [Google Scholar] [CrossRef]
  8. Zhu, Y.C.; Zu, D.M.; Zhang, Y.; Shan, J.; Shi, X.R.; Deng, S.H.; Jiang, Q. A comparative study on superb microvascular imaging and conventional ultrasonography in differentiating BI-RADS 4 breast lesions. Oncol. Lett. 2019, 18, 3202–3210. [Google Scholar] [CrossRef] [Green Version]
  9. Forsberg, F.; Kuruvilla, B.; Pascua, M.B.; Chaudhari, M.H.; Merton, D.A.; Palazzo, J.P.; Goldberg, B.B. Comparing contrast-enhanced color flow imaging and pathological measures of breast lesion vascularity. Ultrasound Med. Biol. 2008, 34, 1365–1372. [Google Scholar] [CrossRef] [Green Version]
  10. Gokalp, G.; Topal, U.; Kizilkaya, E. Power Doppler sonography: Anything to add to BI-RADS US in solid breast masses? Eur. J. Radiol. 2009, 70, 77–85. [Google Scholar] [CrossRef]
  11. Ragab, M.; Albukhari, A.; Alyami, J.; Mansour, R.F. Ensemble Deep-Learning-Enabled Clinical Decision Support System for Breast Cancer Diagnosis and Classification on Ultrasound Images. Biology 2022, 11, 439. [Google Scholar] [CrossRef] [PubMed]
  12. Park, A.Y.; Seo, B.K.; Cha, S.H.; Yeom, S.K.; Lee, S.W.; Chung, H.H. An Innovative Ultrasound Technique for Evaluation of Tumor Vascularity in Breast Cancers: Superb Micro-Vascular Imaging. J. Breast Cancer 2016, 19, 210–213. [Google Scholar] [CrossRef]
  13. Jiang, Z.Z.; Huang, Y.H.; Shen, H.L.; Liu, X.T. Clinical Applications of Superb Microvascular Imaging in the Liver, Breast, Thyroid, Skeletal Muscle, and Carotid Plaques. J. Ultrasound Med. 2019, 38, 2811–2820. [Google Scholar] [CrossRef] [PubMed]
  14. Zhong, L.; Wang, C. Diagnostic accuracy of ultrasound superb microvascular imaging for breast tumor: A meta-analysis. Med. Ultrason. 2020, 22, 313–318. [Google Scholar] [CrossRef] [PubMed]
  15. Bakdik, S.; Arslan, S.; Oncu, F.; Durmaz, M.S.; Altunkeser, A.; Eryilmaz, M.A.; Unlu, Y. Effectiveness of Superb Microvascular Imaging for the differentiation of intraductal breast lesions. Med. Ultrason. 2018, 20, 306–312. [Google Scholar] [CrossRef] [PubMed] [Green Version]
  16. Zhang, X.Y.; Zhang, L.; Li, N.; Zhu, Q.L.; Li, J.C.; Sun, Q.; Wang, H.Y.; Jiang, Y.X. Vascular index measured by smart 3-D superb microvascular imaging can help to differentiate malignant and benign breast lesion. Cancer Manag. Res. 2019, 11, 5481–5487. [Google Scholar] [CrossRef] [Green Version]
  17. Yongfeng, Z.; Ping, Z.; Wengang, L.; Yang, S.; Shuangming, T. Application of a Novel Microvascular Imaging Technique in Breast Lesion Evaluation. Ultrasound Med. Biol. 2016, 42, 2097–2105. [Google Scholar] [CrossRef]
  18. McInnes, M.D.F.; Moher, D.; Thombs, B.D.; McGrath, T.A.; Bossuyt, P.M.; Clifford, T.; Cohen, J.F.; Deeks, J.J.; Gatsonis, C.; Hooft, L.; et al. Preferred Reporting Items for a Systematic Review and Meta-analysis of Diagnostic Test Accuracy Studies: The PRISMA-DTA Statement. JAMA 2018, 319, 388–396. [Google Scholar] [CrossRef]
  19. Ramsubeik, K.; Motilal, S.; Sanchez-Ramos, L.; Ramrattan, L.A.; Kaeley, G.S.; Singh, J.A. Diagnostic accuracy of salivary gland ultrasound in Sjögren’s syndrome: A systematic review and meta-analysis. Ther. Adv. Musculoskelet. Dis. 2020, 12, 1759720x20973560. [Google Scholar] [CrossRef]
  20. Wang, J.; Zhao, R.; Cheng, J. Diagnostic accuracy of contrast-enhanced ultrasound to differentiate benign and malignant breast lesions: A systematic review and meta-analysis. Eur. J. Radiol. 2022, 149, 110219. [Google Scholar] [CrossRef]
  21. Kim, K.W.; Lee, J.; Choi, S.H.; Huh, J.; Park, S.H. Systematic Review and Meta-Analysis of Studies Evaluating Diagnostic Test Accuracy: A Practical Review for Clinical Researchers-Part I. General Guidance and Tips. Korean J. Radiol. 2015, 16, 1175–1187. [Google Scholar] [CrossRef] [PubMed] [Green Version]
  22. Lee, J.; Kim, K.W.; Choi, S.H.; Huh, J.; Park, S.H. Systematic Review and Meta-Analysis of Studies Evaluating Diagnostic Test Accuracy: A Practical Review for Clinical Researchers-Part II. Statistical Methods of Meta-Analysis. Korean J. Radiol. 2015, 16, 1188–1196. [Google Scholar] [CrossRef] [PubMed] [Green Version]
  23. Ades, A.E.; Lu, G.; Higgins, J.P. The interpretation of random-effects meta-analysis in decision models. Med. Decis. Mak. 2005, 25, 646–654. [Google Scholar] [CrossRef] [PubMed]
  24. Suh, C.H.; Park, S.H. Successful Publication of Systematic Review and Meta-Analysis of Studies Evaluating Diagnostic Test Accuracy. Korean J. Radiol. 2016, 17, 5–6. [Google Scholar] [CrossRef] [Green Version]
  25. Higgins, J.P.; Thompson, S.G.; Deeks, J.J.; Altman, D.G. Measuring inconsistency in meta-analyses. BMJ 2003, 327, 557–560. [Google Scholar] [CrossRef] [Green Version]
  26. Deeks, J.J.; Macaskill, P.; Irwig, L. The performance of tests of publication bias and other sample size effects in systematic reviews of diagnostic test accuracy was assessed. J. Clin. Epidemiol. 2005, 58, 882–893. [Google Scholar] [CrossRef]
  27. Liu, N.; Yang, D.W.; Wu, Y.X.; Xue, W.Q.; Li, D.H.; Zhang, J.B.; He, Y.Q.; Jia, W.H. Burden, trends, and risk factors for breast cancer in China from 1990 to 2019 and its predictions until 2034: An up-to-date overview and comparison with those in Japan and South Korea. BMC Cancer 2022, 22, 826. [Google Scholar] [CrossRef]
  28. Kwong, A.; Shin, V.Y.; Ho, J.C.; Kang, E.; Nakamura, S.; Teo, S.H.; Lee, A.S.; Sng, J.H.; Ginsburg, O.M.; Kurian, A.W.; et al. Comprehensive spectrum of BRCA1 and BRCA2 deleterious mutations in breast cancer in Asian countries. J. Med. Genet. 2016, 53, 15–23. [Google Scholar] [CrossRef] [Green Version]
  29. Sun, D.; Cao, M.; Li, H.; He, S.; Chen, W. Cancer burden and trends in China: A review and comparison with Japan and South Korea. Chin. J. Cancer Res. 2020, 32, 129–139. [Google Scholar] [CrossRef]
  30. Lee, E.J.; Chang, Y.W.; Oh, E.; Hwang, J.; Kim, H.J.; Hong, S.S. Reproducibility and diagnostic performance of the vascular index of superb microvascular imaging in real-time breast ultrasonography for evaluating breast masses. Ultrasonography 2021, 40, 398–406. [Google Scholar] [CrossRef]
  31. Ma, Y.; Li, G.; Li, J.; Ren, W.D. The Diagnostic Value of Superb Microvascular Imaging (SMI) in Detecting Blood Flow Signals of Breast Lesions: A Preliminary Study Comparing SMI to Color Doppler Flow Imaging. Medicine 2015, 94, e1502. [Google Scholar] [CrossRef] [PubMed]
  32. Li, X.; Kang, S.; Wang, X. Application of superb microvascular imaging and CDFI in diagnosis of breast masses. Chin. J. Med. Imaging Technol. 2015, 31, 663–667. [Google Scholar]
  33. Chen, X.; Luo, B.; Guan, X.; WU, H.; Xiao, X. Comparative study of superb microvascular imaging and contrast-enhanced ultrasonographic microvascular imaging in diagnosis of breast tumor. Chin. J. Ultrason. 2016, 25, 608–611. [Google Scholar]
  34. Xiao, X.Y.; Chen, X.; Guan, X.F.; Wu, H.; Qin, W.; Luo, B.M. Superb microvascular imaging in diagnosis of breast lesions: A comparative study with contrast-enhanced ultrasonographic microvascular imaging. Br. J. Radiol. 2016, 89, 20160546. [Google Scholar] [CrossRef] [PubMed] [Green Version]
  35. Xiao, L.; Chu, W.; Wang, H. Preliminary analysis of diagnostic efficiency of vascular morphology distribution in breast tumor by superb microvascular imaging. Chin. J. Ultrason. 2018, 12, 973–976. [Google Scholar]
  36. Xue, W. Superb microvascular imaging in diagnosis of benign and malignant breast lesions. Chin. J. Med. Imaging Technol. 2019, 12, 77–81. [Google Scholar]
  37. Diao, X.; Zhan, J.; Chen, L.; Chen, Y.; Cao, H. Role of Superb Microvascular Imaging in Differentiating Between Malignant and Benign Solid Breast Masses. Clin. Breast Cancer 2020, 20, e786–e793. [Google Scholar] [CrossRef]
  38. Liang, M.; Ou, B.; Wu, J.; Xiao, X.; Ruan, J.; Tian, J.; Xu, X.; Wang, B.; Yang, H.; Luo, B. Combined use of strain elastography and superb microvascular imaging with grayscale ultrasound according to the BI-RADS classification for differentiating benign from malignant solid breast masses. Clin. Hemorheol. Microcirc. 2020, 74, 391–403. [Google Scholar] [CrossRef]
  39. Li, W.; Wu, Y.; Zhou, W.; Zhan, W.; Zhou, Q.; Tao, L.; Yang, Y. The diagnostic value of smart three-dimensional superb microvascular imaging in differentiating benign and malignant breast lesions of BI-RADS 4. J. Diagn. Concepts Pract. 2020, 19, 583. [Google Scholar]
  40. Cai, S.; Wang, H.; Zhang, X.; Zhang, L.; Zhu, Q.; Sun, Q.; Li, J.; Jiang, Y. Superb Microvascular Imaging Technology Can Improve the Diagnostic Efficiency of the BI-RADS System. Front. Oncol. 2021, 11, 634752. [Google Scholar] [CrossRef]
  41. Chu, X.; An, X.; Yan, J.; Zhang, H. Application of Shear Wave Elastography and Superb Microvascular Imaging on Diagnosis of Benign Breast Lesions and Malignant Tumor. Imaging Sci. Photochem. 2020, 38, 1000. [Google Scholar]
  42. Fan, X.; Ji, H.; Zhang, L.; Li, S.; Yu, D.; Tian, J.; Leng, X. Application of shear wave elastography combined with superb micro-vascular imaging in diagnosing benign and malignant breast masses. Chin. J. Ultrason. 2018, 12, 143–146. [Google Scholar]
  43. Jia, L.; Zhu, W.; Wang, C. Value of Smart 3D SMI in the diagnosis of breast cancer. J. Dalian Med. Univ. 2020, 42, 348–351. [Google Scholar]
  44. Wang, K. Effect of SMI combined with SWE on the differential diagnosis of benign and malignant breast tumors. Heilongjiang Med. Pharm. 2020, 43, 191–192. [Google Scholar]
  45. Jin, P.; Li, Y. Application value of ultrasound MicroPure imaging combined with superb microvascular imaging in the differential diagnosis of benign and malignant nodules of breast. J. Bengbu Med. Coll. 2021, 46, 799–802. [Google Scholar]
  46. Ran, Q. The value of ultrasonic shear waves combined with superb microvascular imaging in evaluating the nature of breast cancer. Henan Med. Res. 2021, 30, 6657–6660. [Google Scholar]
  47. Xu, Q.; Chen, Y.; He, J.; Fang, J.; Lu, Y. Study on the screening and diagnosis value of acoustic pulse radiation force imaging combined with superb microvascular imaging in early breast cancer. Imaging Res. Med. Appl. 2021, 5, 3–5. [Google Scholar]
  48. Zuo, W.; Jin, L.; Liu, X.; Huang, S.; Zhou, H. The Diagnostic Value of Ultramicrovascular Imaging Combined with Contrast—enhanced Ultrasonography in the Diagnosis of BI-RADS 4 Breast Masses. Chin. J. ultrasound Med. 2021, 37, 974–978. [Google Scholar]
  49. Park, A.Y.; Kwon, M.; Woo, O.H.; Cho, K.R.; Park, E.K.; Cha, S.H.; Song, S.E.; Lee, J.H.; Cha, J.; Son, G.S.; et al. A Prospective Study on the Value of Ultrasound Microflow Assessment to Distinguish Malignant from Benign Solid Breast Masses: Association between Ultrasound Parameters and Histologic Microvessel Densities. Korean J. Radiol. 2019, 20, 759–772. [Google Scholar] [CrossRef]
  50. Lee, E.J.; Chang, Y.W. Combination of Quantitative Parameters of Shear Wave Elastography and Superb Microvascular Imaging to Evaluate Breast Masses. Korean J. Radiol. 2020, 21, 1045–1054. [Google Scholar] [CrossRef]
  51. Chae, E.Y.; Yoon, G.Y.; Cha, J.H.; Shin, H.J.; Choi, W.J.; Kim, H.H. Added Value of the Vascular Index on Superb Microvascular Imaging for the Evaluation of Breast Masses: Comparison With Grayscale Ultrasound. J. Ultrasound Med. 2021, 40, 715–723. [Google Scholar] [CrossRef] [PubMed]
  52. Uysal, E.; Öztürk, M.; Kilinçer, A.; Koplay, M. Comparison of the Effectiveness of Shear Wave Elastography and Superb Microvascular Imaging in the Evaluation of Breast Masses. Ultrasound Q 2021, 37, 191–197. [Google Scholar] [CrossRef] [PubMed]
  53. Arslan, F.Z.; Altunkeser, A.; Körez, M.K.; Aksoy, N.; Bayramoğlu, Z.; Karagülle, M. The Importance of Superb Microvascular Imaging for the Differentiation of Malignant Breast Lesions from Benign Lesions. Eur J. Breast Health 2022, 18, 48–54. [Google Scholar] [CrossRef] [PubMed]
  54. Adler, D.D.; Carson, P.L.; Rubin, J.M.; Quinn-Reid, D. Doppler ultrasound color flow imaging in the study of breast cancer: Preliminary findings. Ultrasound Med. Biol. 1990, 16, 553–559. [Google Scholar] [CrossRef]
Figure 1. PRISMA flow diagram depicting the literature search and study selection. *: Both Chinese and English databases have been systematically searched.
Diagnostics 12 02648 g001
Figure 2. Risk of bias and applicability concerns summary: review authors’ judgements about each domain for each eligible study.
Diagnostics 12 02648 g002
Figure 3. Risk of bias and applicability concerns graph: review authors’ judgements about each domain presented as percentages across eligible studies.
Diagnostics 12 02648 g003
Figure 4. Pooled sensitivity and specificity for Superb Microvascular Imaging to differentiate benign and malignant breast lesions.
Diagnostics 12 02648 g004
Figure 5. Summary receiver operating characteristic model for Superb Microvascular Imaging to differentiate benign and malignant breast lesions.
Diagnostics 12 02648 g005
Figure 6. Pooled positive and negative likelihood ratios for Superb Microvascular Imaging to differentiate benign and malignant breast lesions.
Diagnostics 12 02648 g006
Figure 7. Pooled diagnostic odds ratio for Superb Microvascular Imaging to differentiate benign and malignant breast lesions.
Diagnostics 12 02648 g007
Figure 8. Influence analysis for eligible studies.
Diagnostics 12 02648 g008
Figure 9. Deeks’ funnel plot of publication bias. No potential publication bias for all eligible studies was observed (p = 0.26). ESS: effective sample size.
Diagnostics 12 02648 g009
Figure 10. Meta-regression of included studies showing that patient country, predesign and VI as potential sources of heterogeneity. ***: p < 0.001.
Diagnostics 12 02648 g010
Table 1. Baseline characteristics of identified studies and enrolled patients.
AuthorYearCountryAge
(Mean, Year)
Size
(Mean, mm)
InstrumentScale
(cm/s)
lesionsSDDCTPFPTNFN
Ma2015China43.722.4Aplio 4001–2123ProAC5127396
Li2015China44.118.4Aplio 5002.6146RetroAC3813869
Chen2016China44.917.7Aplio 4001–2116RetroMVDP4265711
Fan2016China47.517.5Aplio 5001.286RetroAC379337
Zhao2016China44.514.9Aplio 5001.5–2.5135RetroNANANANANA
Xiao2016China44.118.3Aplio 400NA132RetroMVDP4576713
Xiao2018China47.219Aplio 5001–2105RetroMVDP356604
Park2019Korea45.618.7Aplio 500398ProPV3318398
PARK2019Korea45.618.7Aplio 500398ProVI3315428
Zhang2019China44.923.5Aplio 5001.2–1.6236ProVI92397619
Xue2019ChinaNANAAplio 500NA300RetroNANANANANA
Chu2020China44.419.9Aplio 5001.2142RetroAC57175711
Jia2020China4822.4Aplio 900NA114RetroMVDP3565419
Wang2020China49.929.7Aplio 5001.294RetroAC329485
Diao2020China54.215.3Aplio 500285RetroPV326407
DIAO2020China54.215.3Aplio 500285RetroMVDP296419
Lee2020Korea4911.3Aplio 8002.5200RetroVI72427313
Liang2020China43.917.4Aplio 4001.2177ProMVDP5769319
Li2020China49.8NAAplio 500NA208RetroNANANANANA
Jin2021ChinaNANAAplio 500NA123RetroAC6393615
Ran2021China49.420.1Aplio 5001.2150ProAC31610013
Xu2021China53.127.7Aplio 800NA50RetroAC29399
Zuo2021ChinaNA16Aplio 400NA122ProMVDP3386615
Chae2021Korea54.1NAAplio 8002.570RetroVI313315
Uysal2021Turkey50.5NAAplio 5003.5121RetroVI33264814
Cai2021China46.123.5Aplio 5001–2238RetroVINANANANA
Lee2021Korea4610.7Aplio 8002.588RetroVI303478
Aralan2022Turkey4921.9Aplio 3001.5–2.590RetroVINANANANA
AC, Alder classification; DC, diagnostic criteria; FN, False negative; FP, false positive; NA, not available; PV, penetrating vessel; MVDP, microvascular distribution pattern; SD, study design; TN, true negative; TP, true positive.
Table 2. Subgroup analyses for diagnostic values of Superb Microvascular Imaging to differentiate benign and malignant breast lesions.
SubgroupStudy SampleSen
[95% CI; I2, %]
Spe
[95% CI; I2, %]
PLR
[95% CI; I2, %]
NLR
[95% CI; I2, %]
DOR
[95% CI;]
Country
China170.79 [0.76, 0.82; 34.61]0.86 * [0.81, 0.90; 82.31]5.5 * [4.2, 7.3; 80.03]0.24 [0.21, 0.28; 17.43]23 * [17,31]
Korea or Turkey60.80 [0.75, 0.85; 11.41]0.77 * [0.67 0.87; 81.65]3.6 * [2.2, 6.0; 63.86]0.25 [0.18, 0.34;43.41]14 * [7,30]
Study Design
Retro160.80 [0.77, 0.83; 22.27]0.85 [0.80, 0.88; 78.68]5.2 [3.9, 6.9; 68.84]0.24 [0.20, 0.27; 32.55]22 [15,32]
Pro70.79 [0.73, 0.84; 45.12]0.82 [0.68, 0.90; 90.85]4.3 [2.5, 7.3; 79.40]0.26 [0.21, 0.32; 0.00]17 [10,29]
Diagnostic Basis
AC80.82 [0.77, 0.86; 11.98]0.82 [0.77, 0.88; 81.02]4.5 [3.1, 6.6; 60.62]0.22 [0.18, 0.28; 0.00]20 [13,31]
PV20.81 [0.71, 0.89]0.77 * [0.67, 0.85]3.8 * [1.5, 9.6]0.25 [0.15, 0.39]16 * [5,52]
MVDP70.76 [0.70, 0.80; 35.69]0.91 * [0.88, 0.93; 0.00]8.1 * [6.1, 10.8; 0.00]0.27 [0.22, 0.33; 33.58]30 * [20,46]
VI60.81 [0.77, 0.85; 22.24]0.77 [0.64, 0.87; 82.47]3.6 [2.1, 6.0; 65.20]0.24 [0.18, 0.32; 48.02]15 [7,30]
Overall230.80 [0.77, 0.84; 28.32]0.84 [0.79, 0.88; 84.36]4.9 [3.8, 6.3; 76.23]0.24 [0.22, 0.27; 17.87]20 [15,27]
AC, Alder classification; DOR, diagnostic odds ratio; MVDP, microvascular distribution pattern; NLR, negative likely ratio; PLR, positive likely ratio; PV, penetrating vessel; Sen, sensitivity; Spe, specificity; VI, vascular index; *: p < 0.05.
Publisher’s Note: MDPI stays neutral with regard to jurisdictional claims in published maps and institutional affiliations.

