Article

Biomarker Candidates for Alzheimer’s Disease Unraveled through In Silico Differential Gene Expression Analysis

by
Maria-del-Carmen Silva-Lucero
1,†,
Jared Rivera-Osorio
1,2,†,
Laura Gómez-Virgilio
1,†,
Gustavo Lopez-Toledo
1,3,
José Luna-Muñoz
4,5,
Francisco Montiel-Sosa
4,
Luis O. Soto-Rojas
6,
Mar Pacheco-Herrero
7 and
Maria-del-Carmen Cardenas-Aguayo
1,*
1
Laboratory of Cellular Reprogramming, Departamento de Fisiología, Facultad de Medicina, Universidad Nacional Autónoma de México, Av. Universidad No. 3000, Coyoacán, Mexico City 04510, Mexico
2
Instituto de Neurobiología, Faculty of Psychology, National Autonomous University of Mexico, Av. Universidad 3004 Col Copilco-Universidad, Alcaldía, Coyoacán, Mexico City 04510, Mexico
3
Department of Physiology, Biophysics and Neurosciences, CINVESTAV-IPN, Mexico City 07360, Mexico
4
National Dementia BioBank, Ciencias Biológicas, Facultad de Estudios Superiores Cuautitlán, Universidad Nacional Autónoma de México, Cuautitlán Izcalli 53150, Mexico
5
Banco Nacional de Cerebros-UNPHU, Universidad Nacional Pedro Henríquez Ureña, Santo Domingo 1423, Dominican Republic
6
Laboratorio de Patogenesis Molecular, Laboratorio 4, Edificio A4, Carrera Médico Cirujano, Facultad de Estudios Superiores Iztacala, Universidad Nacional Autónoma de México, Tlalnepantla de Baz 54090, Mexico
7
Neuroscience Research Laboratory, Faculty of Health Sciences, Pontificia Universidad Católica Madre y Maestra, Santiago de los Caballeros 51000, Dominican Republic
*
Author to whom correspondence should be addressed.
These authors contributed equally to this work.
Diagnostics 2022, 12(5), 1165; https://doi.org/10.3390/diagnostics12051165
Submission received: 23 March 2022 / Revised: 25 April 2022 / Accepted: 29 April 2022 / Published: 7 May 2022
(This article belongs to the Section Pathology and Molecular Diagnostics)

Abstract

:
Alzheimer’s disease (AD) is neurodegeneration that accounts for 60–70% of dementia cases. Symptoms begin with mild memory difficulties and evolve towards cognitive impairment. The underlying risk factors remain primarily unclear for this heterogeneous disorder. Bioinformatics is a relevant research tool that allows for identifying several pathways related to AD. Open-access databases of RNA microarrays from the peripheral blood and brain of AD patients were analyzed after background correction and data normalization; the Limma package was used for differential expression analysis (DEA) through statistical R programming language. Data were corrected with the Benjamini and Hochberg approach, and genes with p-values equal to or less than 0.05 were considered to be significant. The direction of the change in gene expression was determined by its variation in the log2-fold change between healthy controls and patients. We performed the functional enrichment analysis of GO using goana and topGO-Limma. The functional enrichment analysis of DEGs showed upregulated (UR) pathways: behavior, nervous systems process, postsynapses, enzyme binding; downregulated (DR) were cellular component organization, RNA metabolic process, and signal transduction. Lastly, the intersection of DEGs in the three databases showed eight shared genes between brain and blood, with potential use as AD biomarkers for blood tests.

1. Introduction

Alzheimer’s disease (AD) is a complex and heterogeneous neurodegenerative disorder. AD is the most common cause of dementia, accounting for 60–80% of all these cases [1]. According to the World Alzheimer Report 2021, over 55 million people globally live with dementia [2,3,4,5,6], and this number is projected to increase to 152 million by 2050 [7,8]. An estimated 6.5 million Americans aged 65 and older are living with Alzheimer’s dementia in 2022, with 73% aged 75 or older [9]. Furthermore, the Alzheimer’s Association reported that Alzheimer’s deaths jumped 16% during the coronavirus pandemic (SARS-CoV-2).
AD is a progressive age-related neurodegenerative disorder. The most common type is late-onset or sporadic AD, defined as AD with an age of onset after age 65. It is attributed to a complex combination of genes, chemicals factors, environment, and lifestyle habits [10,11]. For instance, several studies suggested an association between AD and increased blood levels of toxic metals such as copper (Cu), selenium (Se), zinc (Zn), lead (Pb), and mercury [12,13]. Several investigations focused on elucidating the influence of these toxic metals and the molecular mechanisms involved in neurodegenerative disease development [14]. Elevated levels of nonessential metals may induce various detrimental intracellular events, including oxidative stress, mitochondrial dysfunction, DNA fragmentation, protein misfolding, endoplasmic reticulum stress, autophagy dysregulation, and the activation of apoptosis that may alter neurotransmission. Living in industrial areas constitutes an environmental hazard that could be an important contributing factor for the development of AD and other diseases because of exposure to high concentrations of heavy metals. Furthermore, there is increasing evidence suggesting the role of environmental factors in the development of AD, such as exposure to polychlorinated biphenyls (PCBs) and organochlorine pesticides (OC) [15,16]. The other type of AD is early-onset (EOAD) or familial AD, which occurs at ages of onset ranging from 30 to 50 years; it is hereditary and accounts for 1%–5% of AD cases; the remaining 90% are sporadic or late-onset AD (LOAD). EOAD involves mutations in genes encoding amyloid precursor protein (APP), presenilin-1 (PS1), and presenilin-2 (PS2). Mutations in these genes might result in the alteration of amyloid beta (Aβ) peptide production (both Aβ 40 and Aβ 42, and smaller Ab peptides), leading to cell death and dementia [17,18,19].
The development of intraneuronal and extracellular lesions at vulnerable sites in the brain is central to AD. Pathological hallmarks of AD are neuritic plaques and neurofibrillary tangles related to the accumulation of the amyloid-β (Aβ) peptide in brain tissue and to cytoskeletal abnormalities that are caused by the accumulation of hyperphosphorylated microtubule-associated protein tau in neurons, respectively [5,20,21]. The progression of AD pathology begins in structures of the entorhinal cortex (EC) and hippocampus (HIP) in the prodromal stage [22,23,24,25,26].
AD is a heterogeneous disease; novel approaches to integrating genetics, expression, and epigenetics into organized molecular networks may facilitate the understanding of the pathogenesis underlying these diseases [27]. Currently, AD does not have a cure, and confirmatory diagnostics is postmortem; however, some potential biomarkers in CSF were proposed for the diagnosis of AD, such as the presence of total tau protein (T-tau) and hyperphosphorylated tau (P-tau 181 and P-tau 217), the relationship between amyloid beta 42/40 peptides, and the presence of neurofilament light protein (NfL) [28,29,30]. The use of other diagnostic biomarkers such as YKL-40 associated with neuroinflammation was suggested [31]. More studies are needed to identify potential biomarkers of this disease for developing early diagnostics and new therapeutic approaches. Several high-throughput experimental approaches involving genomewide linkage (GWL) scans, genomewide association (GWA) studies, and genomewide expression (GWE) profiling were extensively utilized to identify the underlying genetic risk factors and new biomarkers [32,33,34]. Recent discoveries indicate that comprehensive bioinformatic analyses could allow for the discovery of new therapeutic targets in AD pathology [35,36]. In this study, we performed a bioinformatics analysis of open-access RNA microarrays from AD patients’ peripheral blood and brain to explore critical genes that might be involved in AD pathogenesis and could help in improving diagnosis.

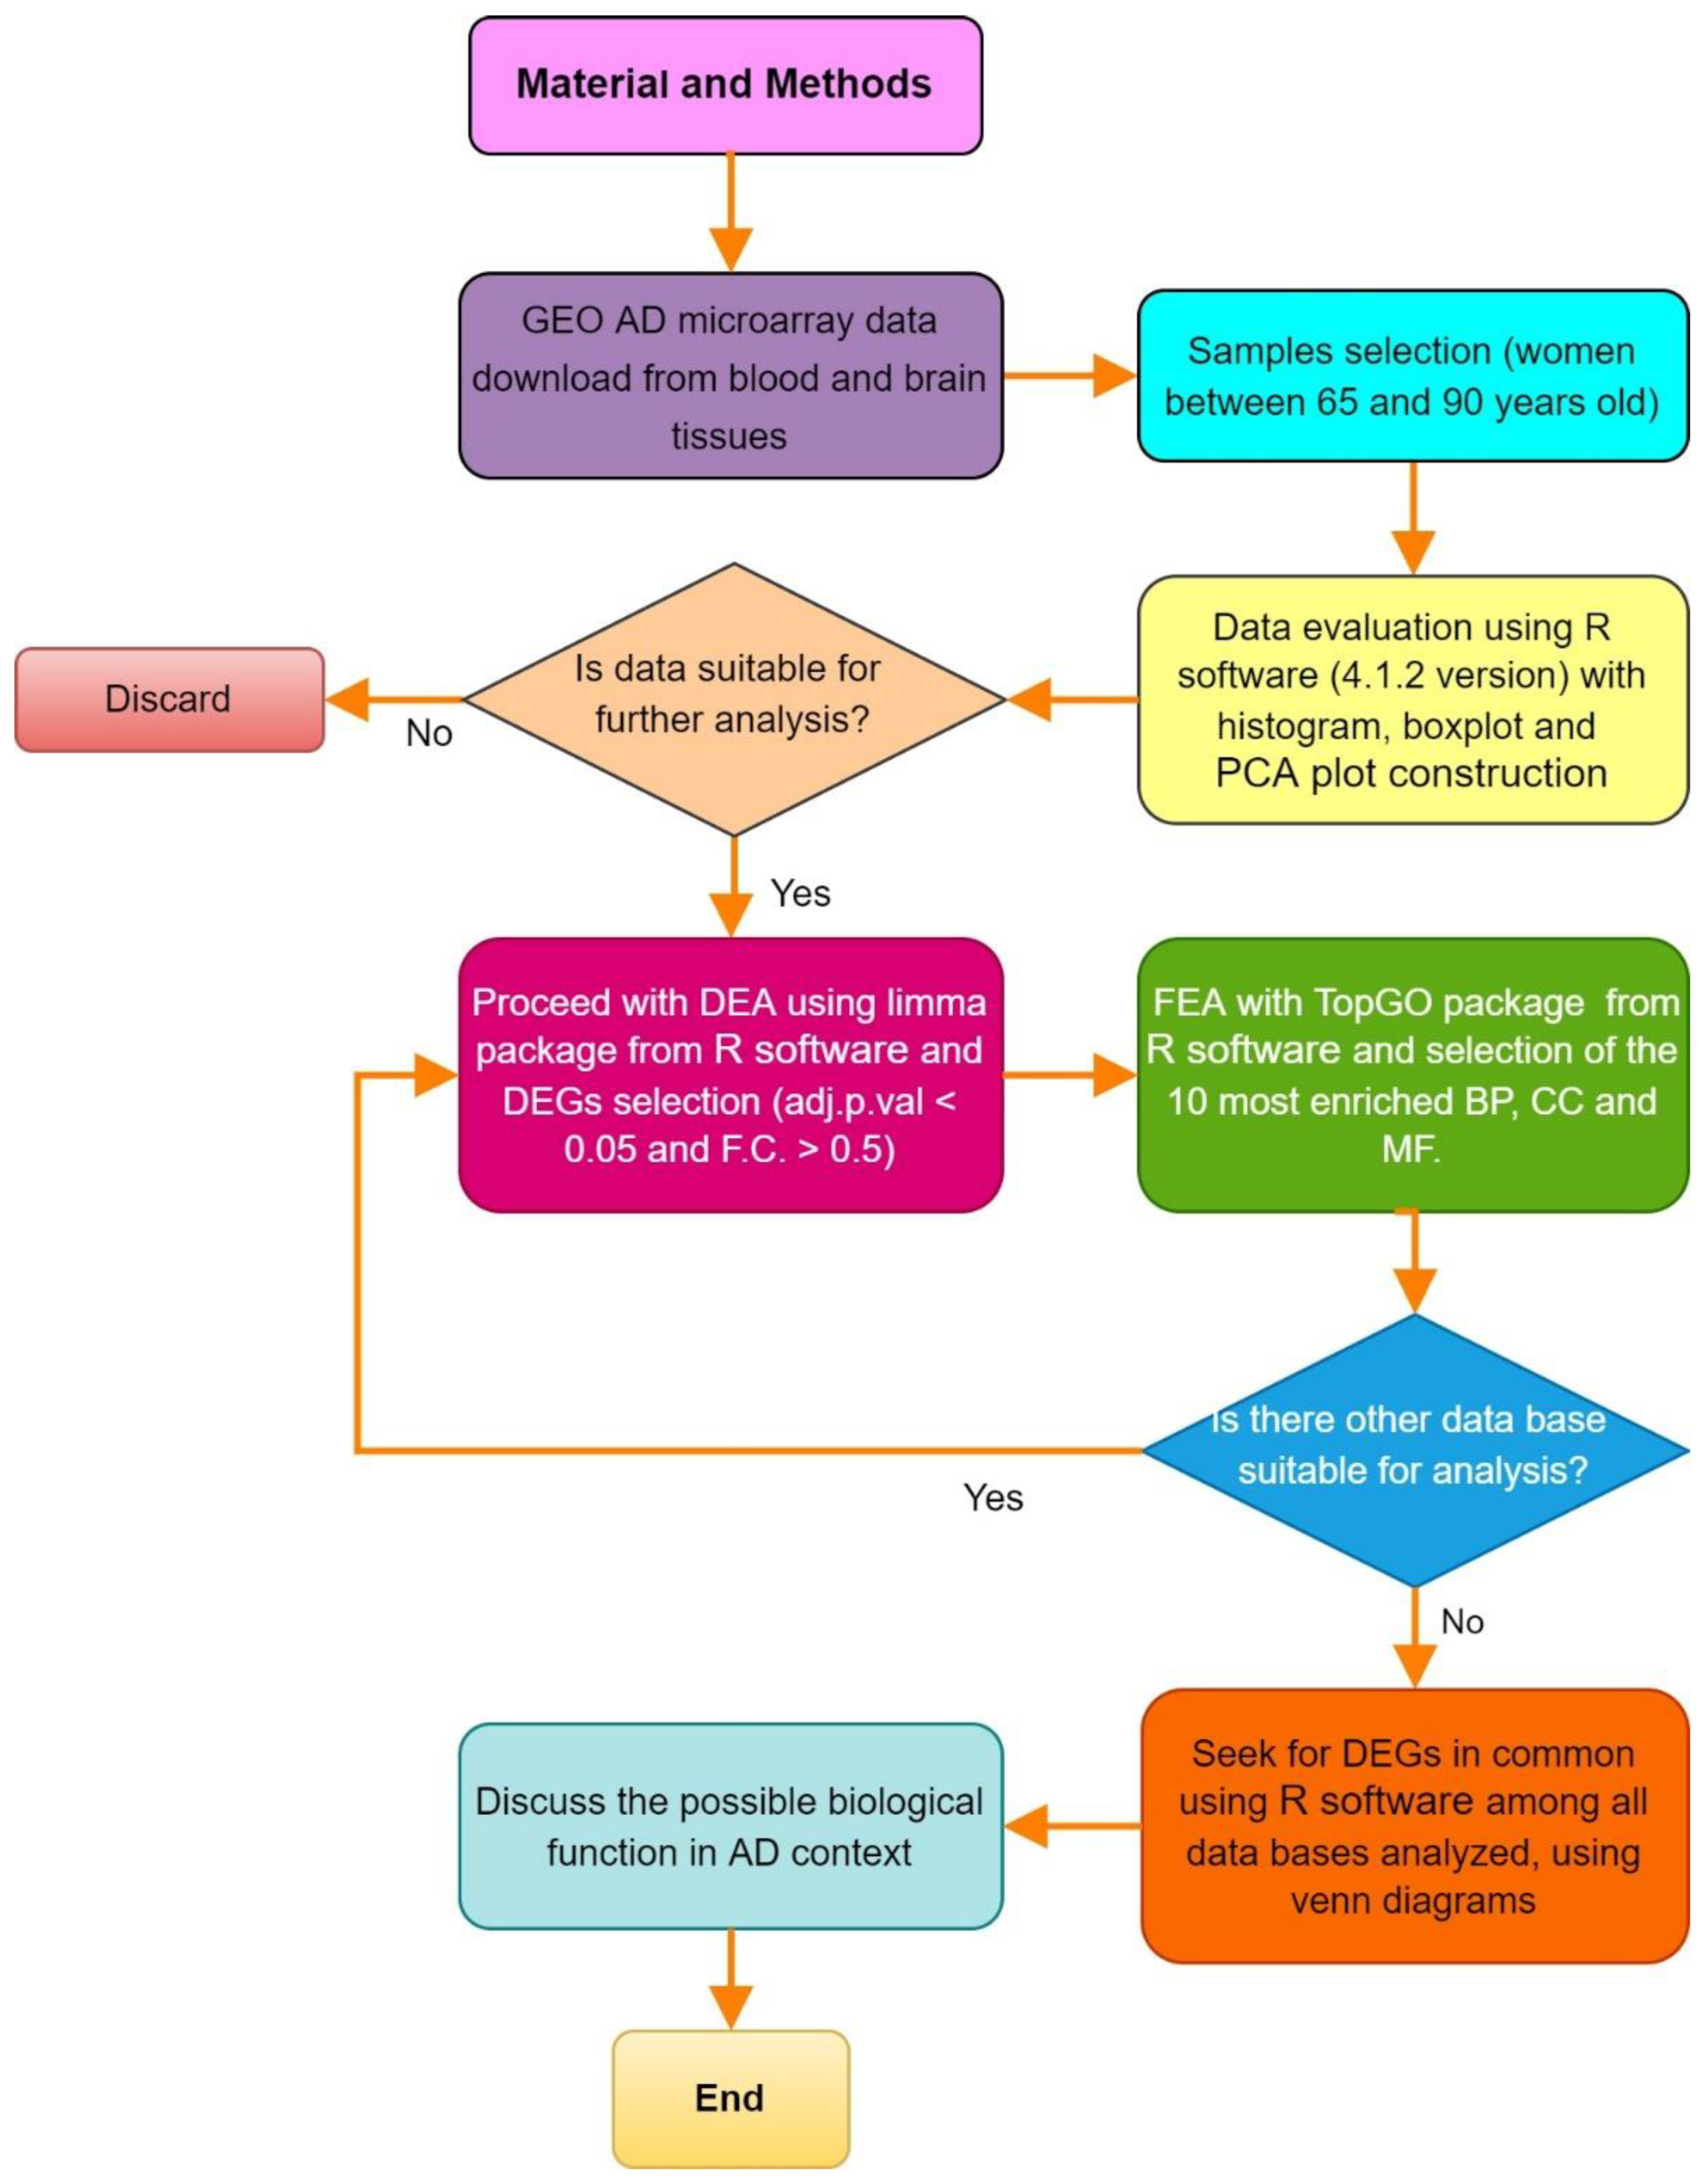
2. Materials and Methods

Figure 1 schematizes the bioinformatics analysis performed in this study. The down sections detail it to step by step.

2.1. Microarray Processing

In this work, all analyses were carried out in January 2022 with R version 4.1.2. First, we analyzed free-access microarray databases from the Gene Expression Omnibus (https://www.ncbi.nlm.nih.gov/geo/, accessed on 22 March 2022) from affected human blood (GSE4226, GSE63061, GSE85426, GSE97760, GSE140829, GSE18309) and brain areas (GSE132903, GSE118553, GSE110226, GSE84422, GSE28146, GSE33000, GSE48350, GSE4757, GSE39420) with sporadic Alzheimer disease. We only selected databases in which gene expression showed normal distribution in the histogram, similar a median across all samples in boxplot, and with AD samples and healthy samples grouped apart or with a tendency to separate in PCA plots. For further analysis, we worked with only female samples between 65 and 90 years old to reduce variability (Table 1).
Data from database GSE84422-GPL96 were preprocessed with the affy and Core R packages using the mas5 algorithm for background-noise correction and filtering absent probes. Subsequently, preprocessed data were normalized with quantile normalization and transformed into a base 2 logarithmic scale. For GSE97760 and GSE132903, we downloaded preprocessed data and normalized them with quantile normalization, and base 2 logarithmic scale transformation was applied to both.

2.2. Differential Expression Analysis

We performed differential expression analysis (DEA) with processed data between the AD and CNTRL samples of each microarray database using the Limma R package. Genes with a logarithmic fold change (logFC) > 0.5 and a corrected p-value (adj.pval) < 0.05 (Benjamini–Hochberg for multiple tests) were considered to be upregulated differentially expressed genes (DEGs); genes with logFC < −0.5 and adj.pval. < 0.05 were considered to be downregulated DEGs.

2.3. Functional Enrichment Analysis

In each database, we performed functional enrichment analysis (FEA) of up- and downregulated DEGs; we used the R topGO package with the weight01 algorithm. For statistical comparison, we carried out a Fisher’s exact test. We considered as background up and down DEGs. Lastly, we plotted the first 10 most enriched gene ontology terms (GO) for biological processes (BPs), cellular components (CCs), and molecular functions (MFs), the number of genes in each GO, and the significance of the enrichment.

2.4. Genes in Common and Selection of Genes of Interest

To find the genes of interest, we looked for genes in common with the same pattern of expression in the blood and brain datasets. We compared DEGs found in blood with DEGs found in each brain database (GSE97760 ∩ GSE84422-GPL96; GSE97760 ∩ GSE132903). Lastly, we sought genes that were shared among all comparisons.

3. Results

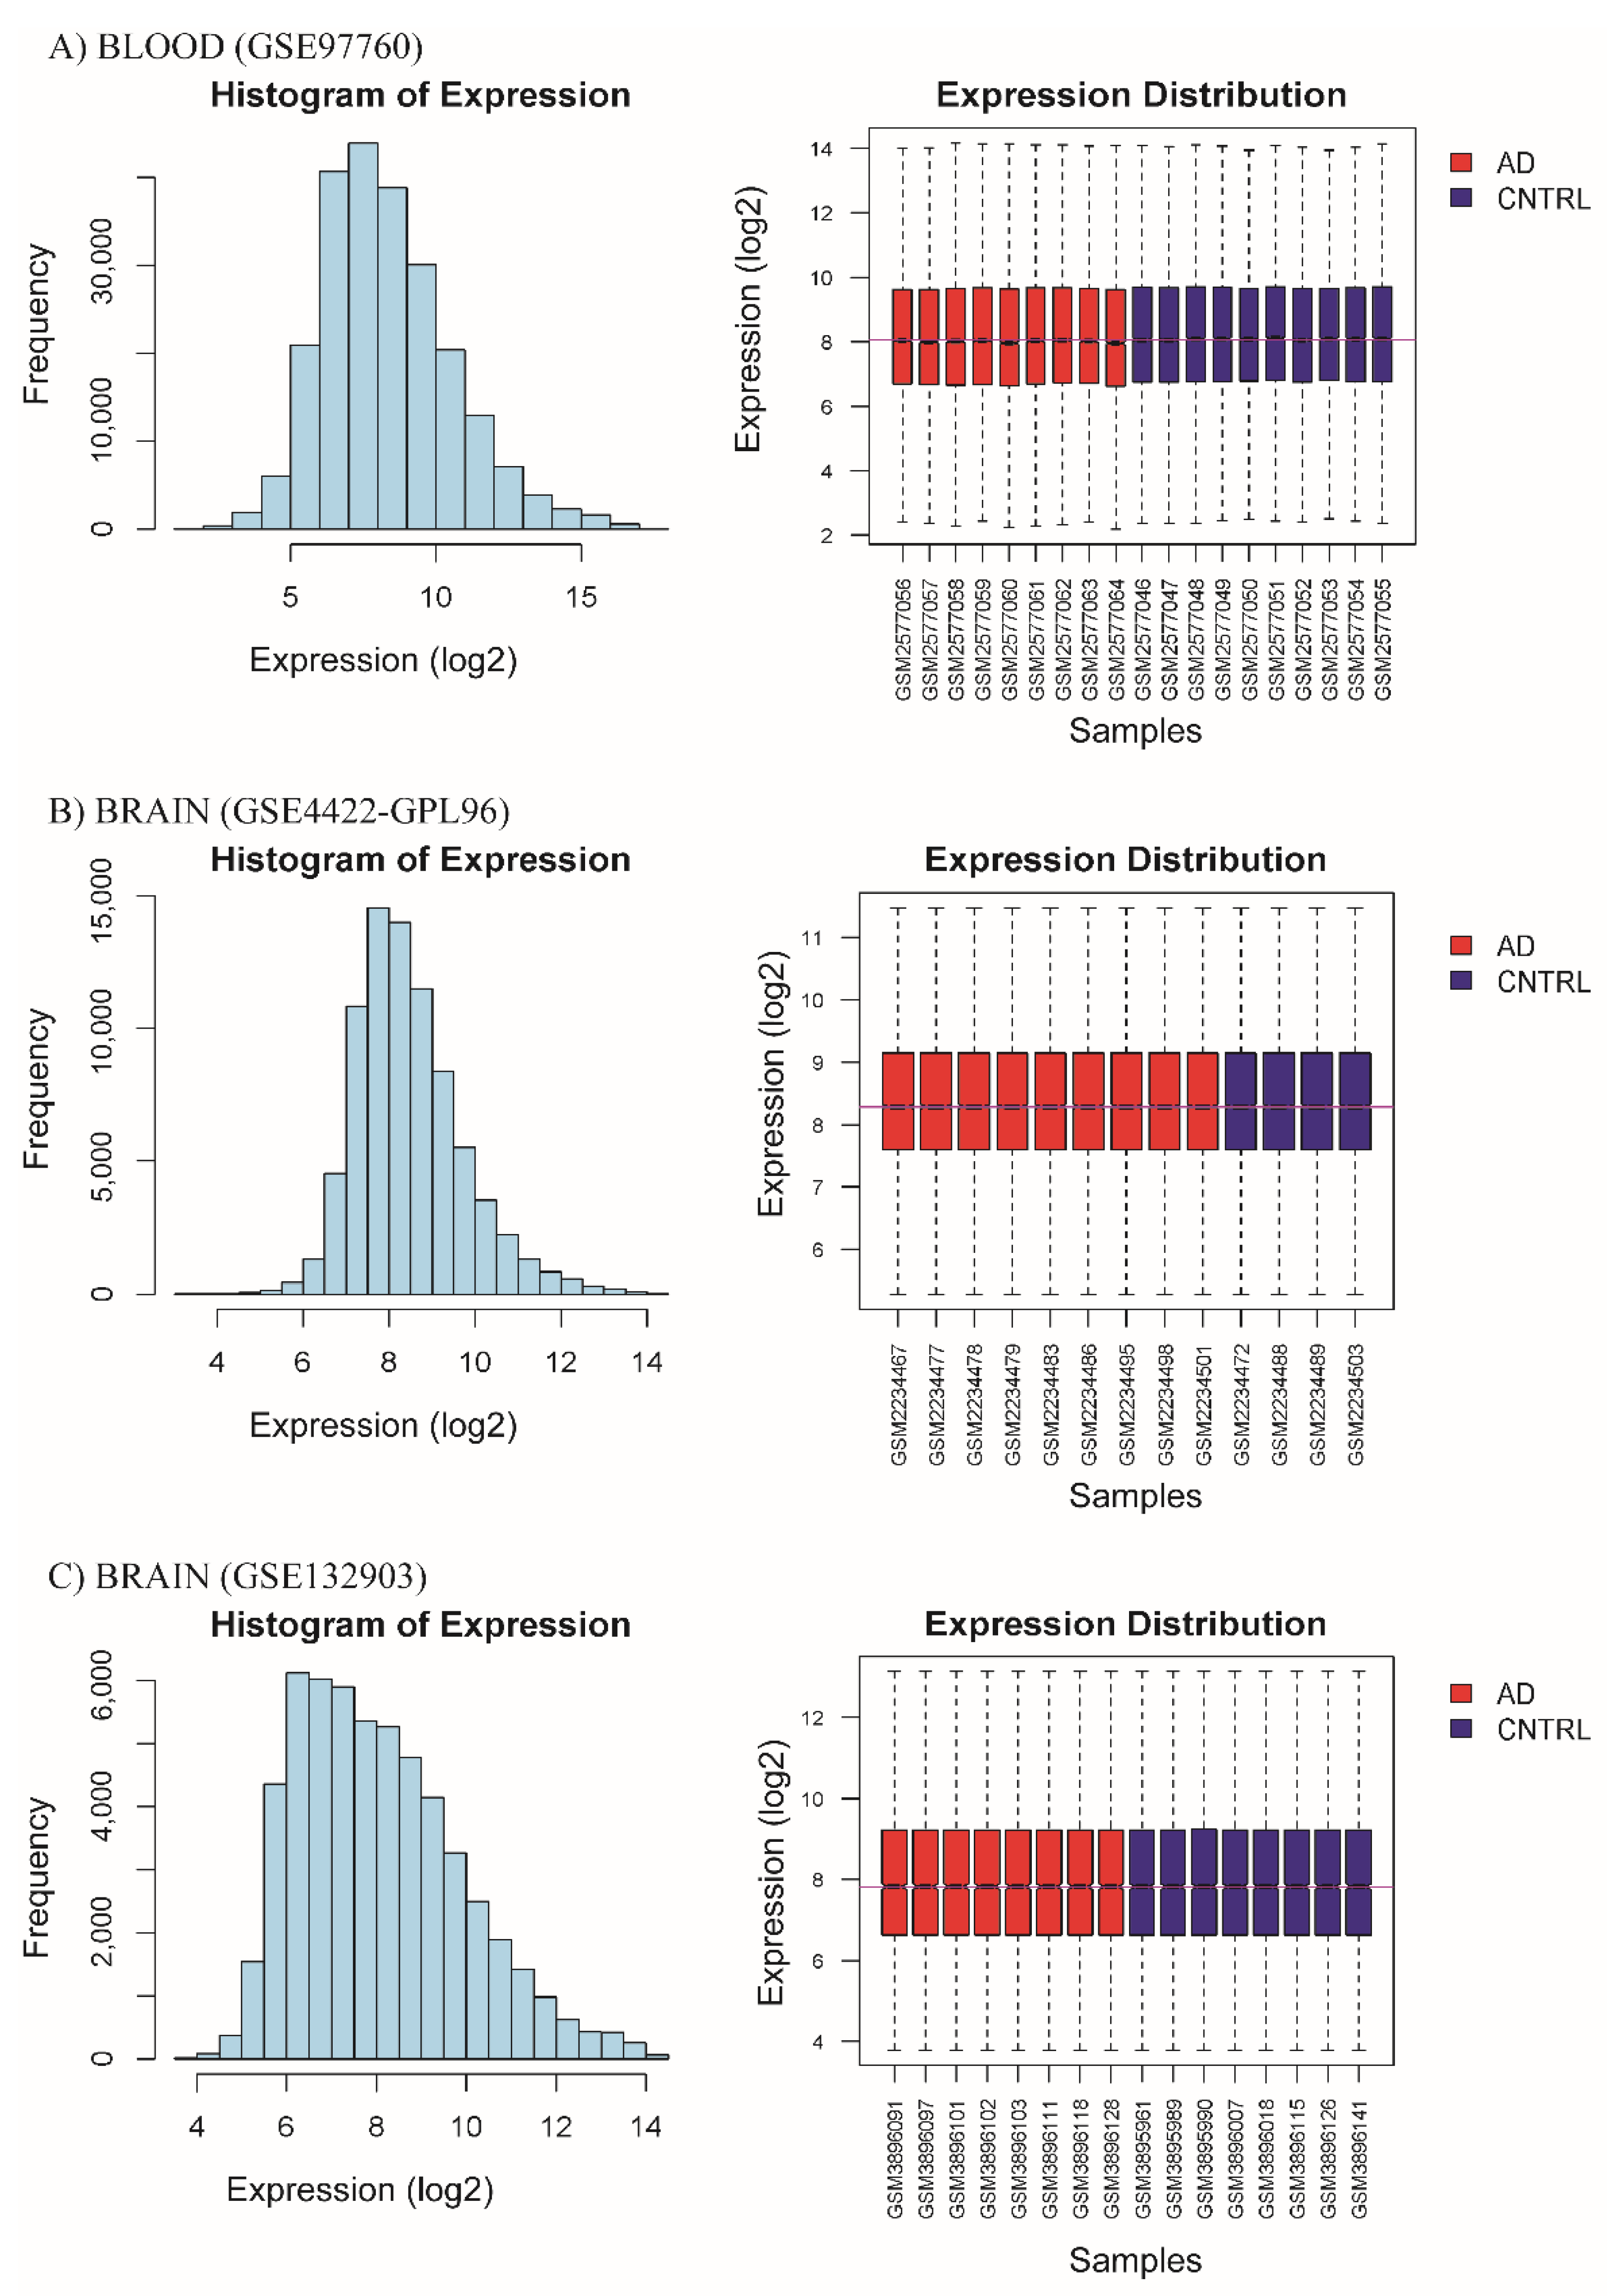
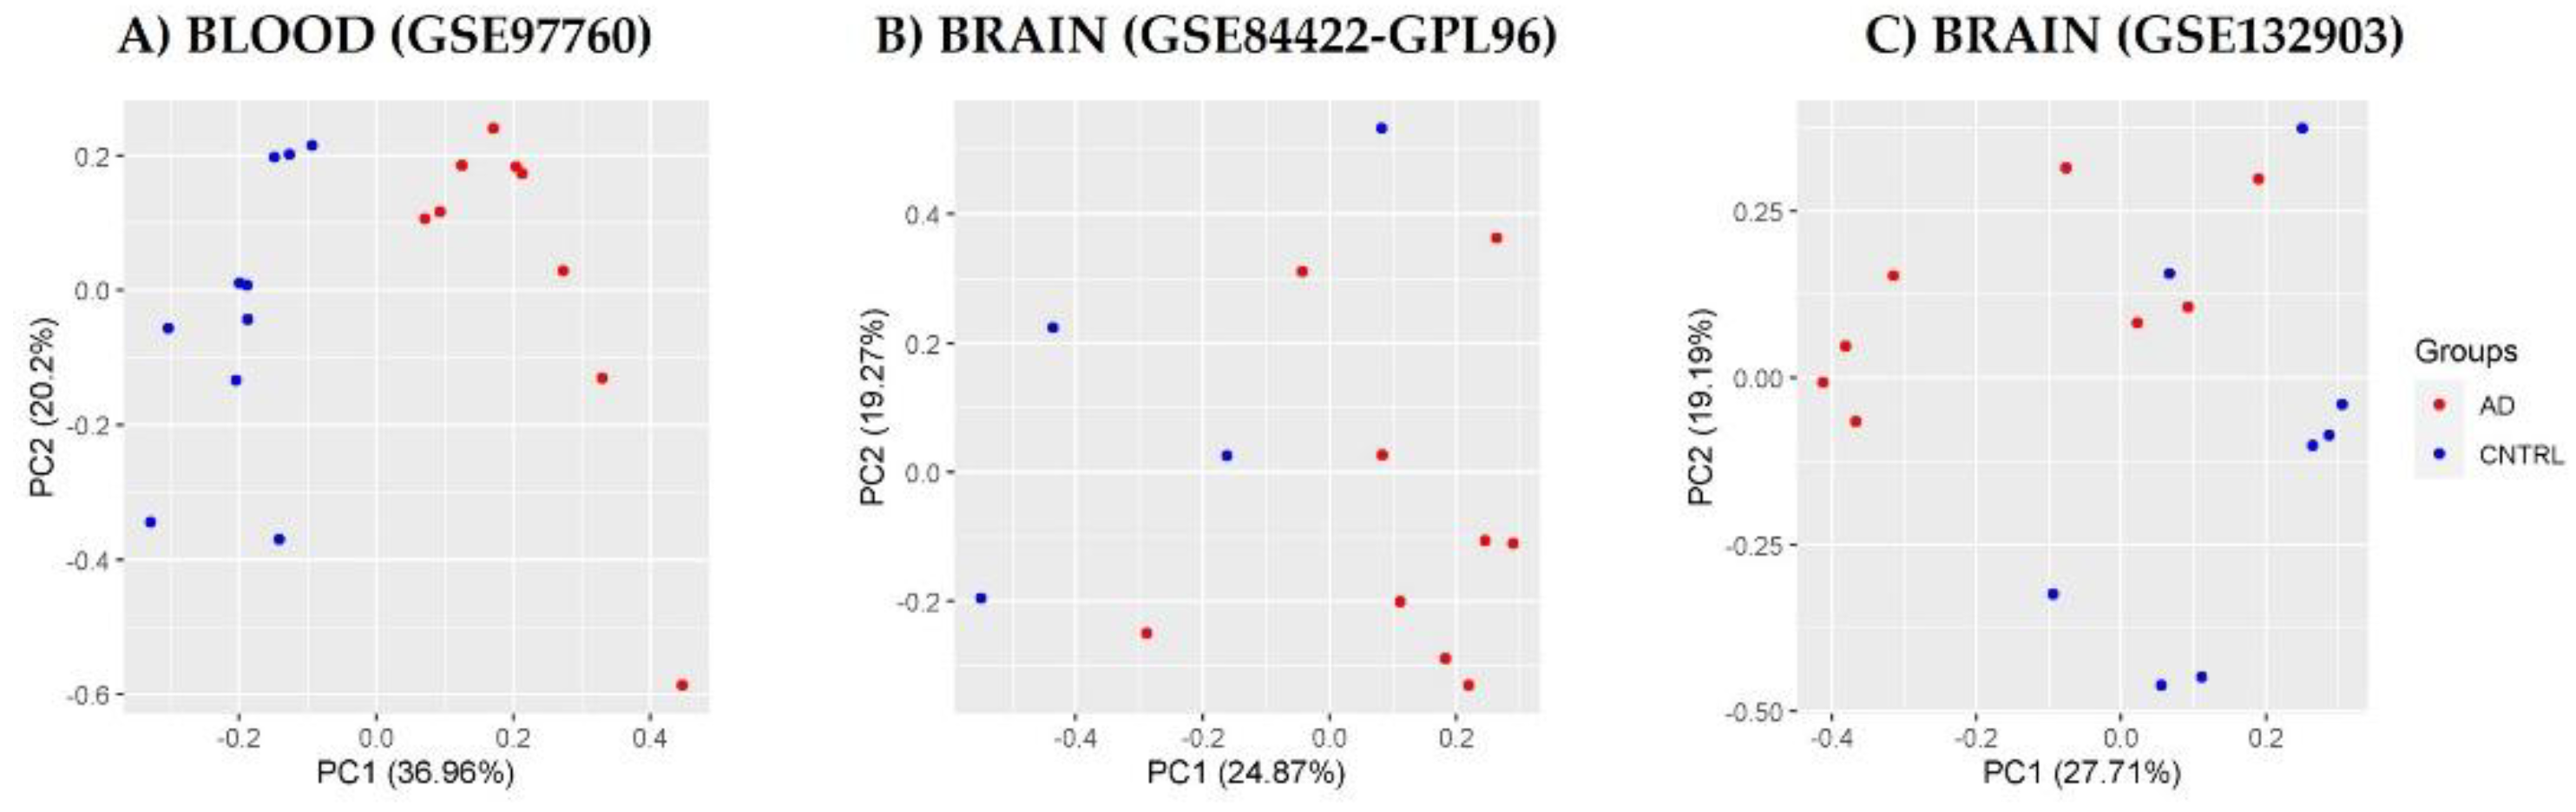
3.1. Homogenization of Raw Database Data

We selected and processed three open-access microarray databases to analyze transcriptomic differences in Alzheimer’s disease. These databases were obtained from blood samples (GSE97760, peripheral blood) and two from brain tissue (GSE84422-GPL96 of hippocamppus and GSE132903 of middle temporal gyrus). They are summarized in Table 1, they originated from patients with Alzheimer’s disease, and were compared with samples from control individuals.
Selected processed data showed normal distribution in their expression level and a similar median in all samples; this indicates that all three databases were suitable for further statistical analysis (Figure 2A–C). Subsequently, we performed principal component analysis (PCA) to observe the pattern between patient samples and controls from the processed data. Our results showed that the first and second principal components explained approximately 25% of variation in the transcriptomic profile. Subjects with Alzheimer’s disease were also grouped independently of control subjects, indicating that the two groups (patients vs. controls) differed in their transcriptional profiles (Figure 3A–C).

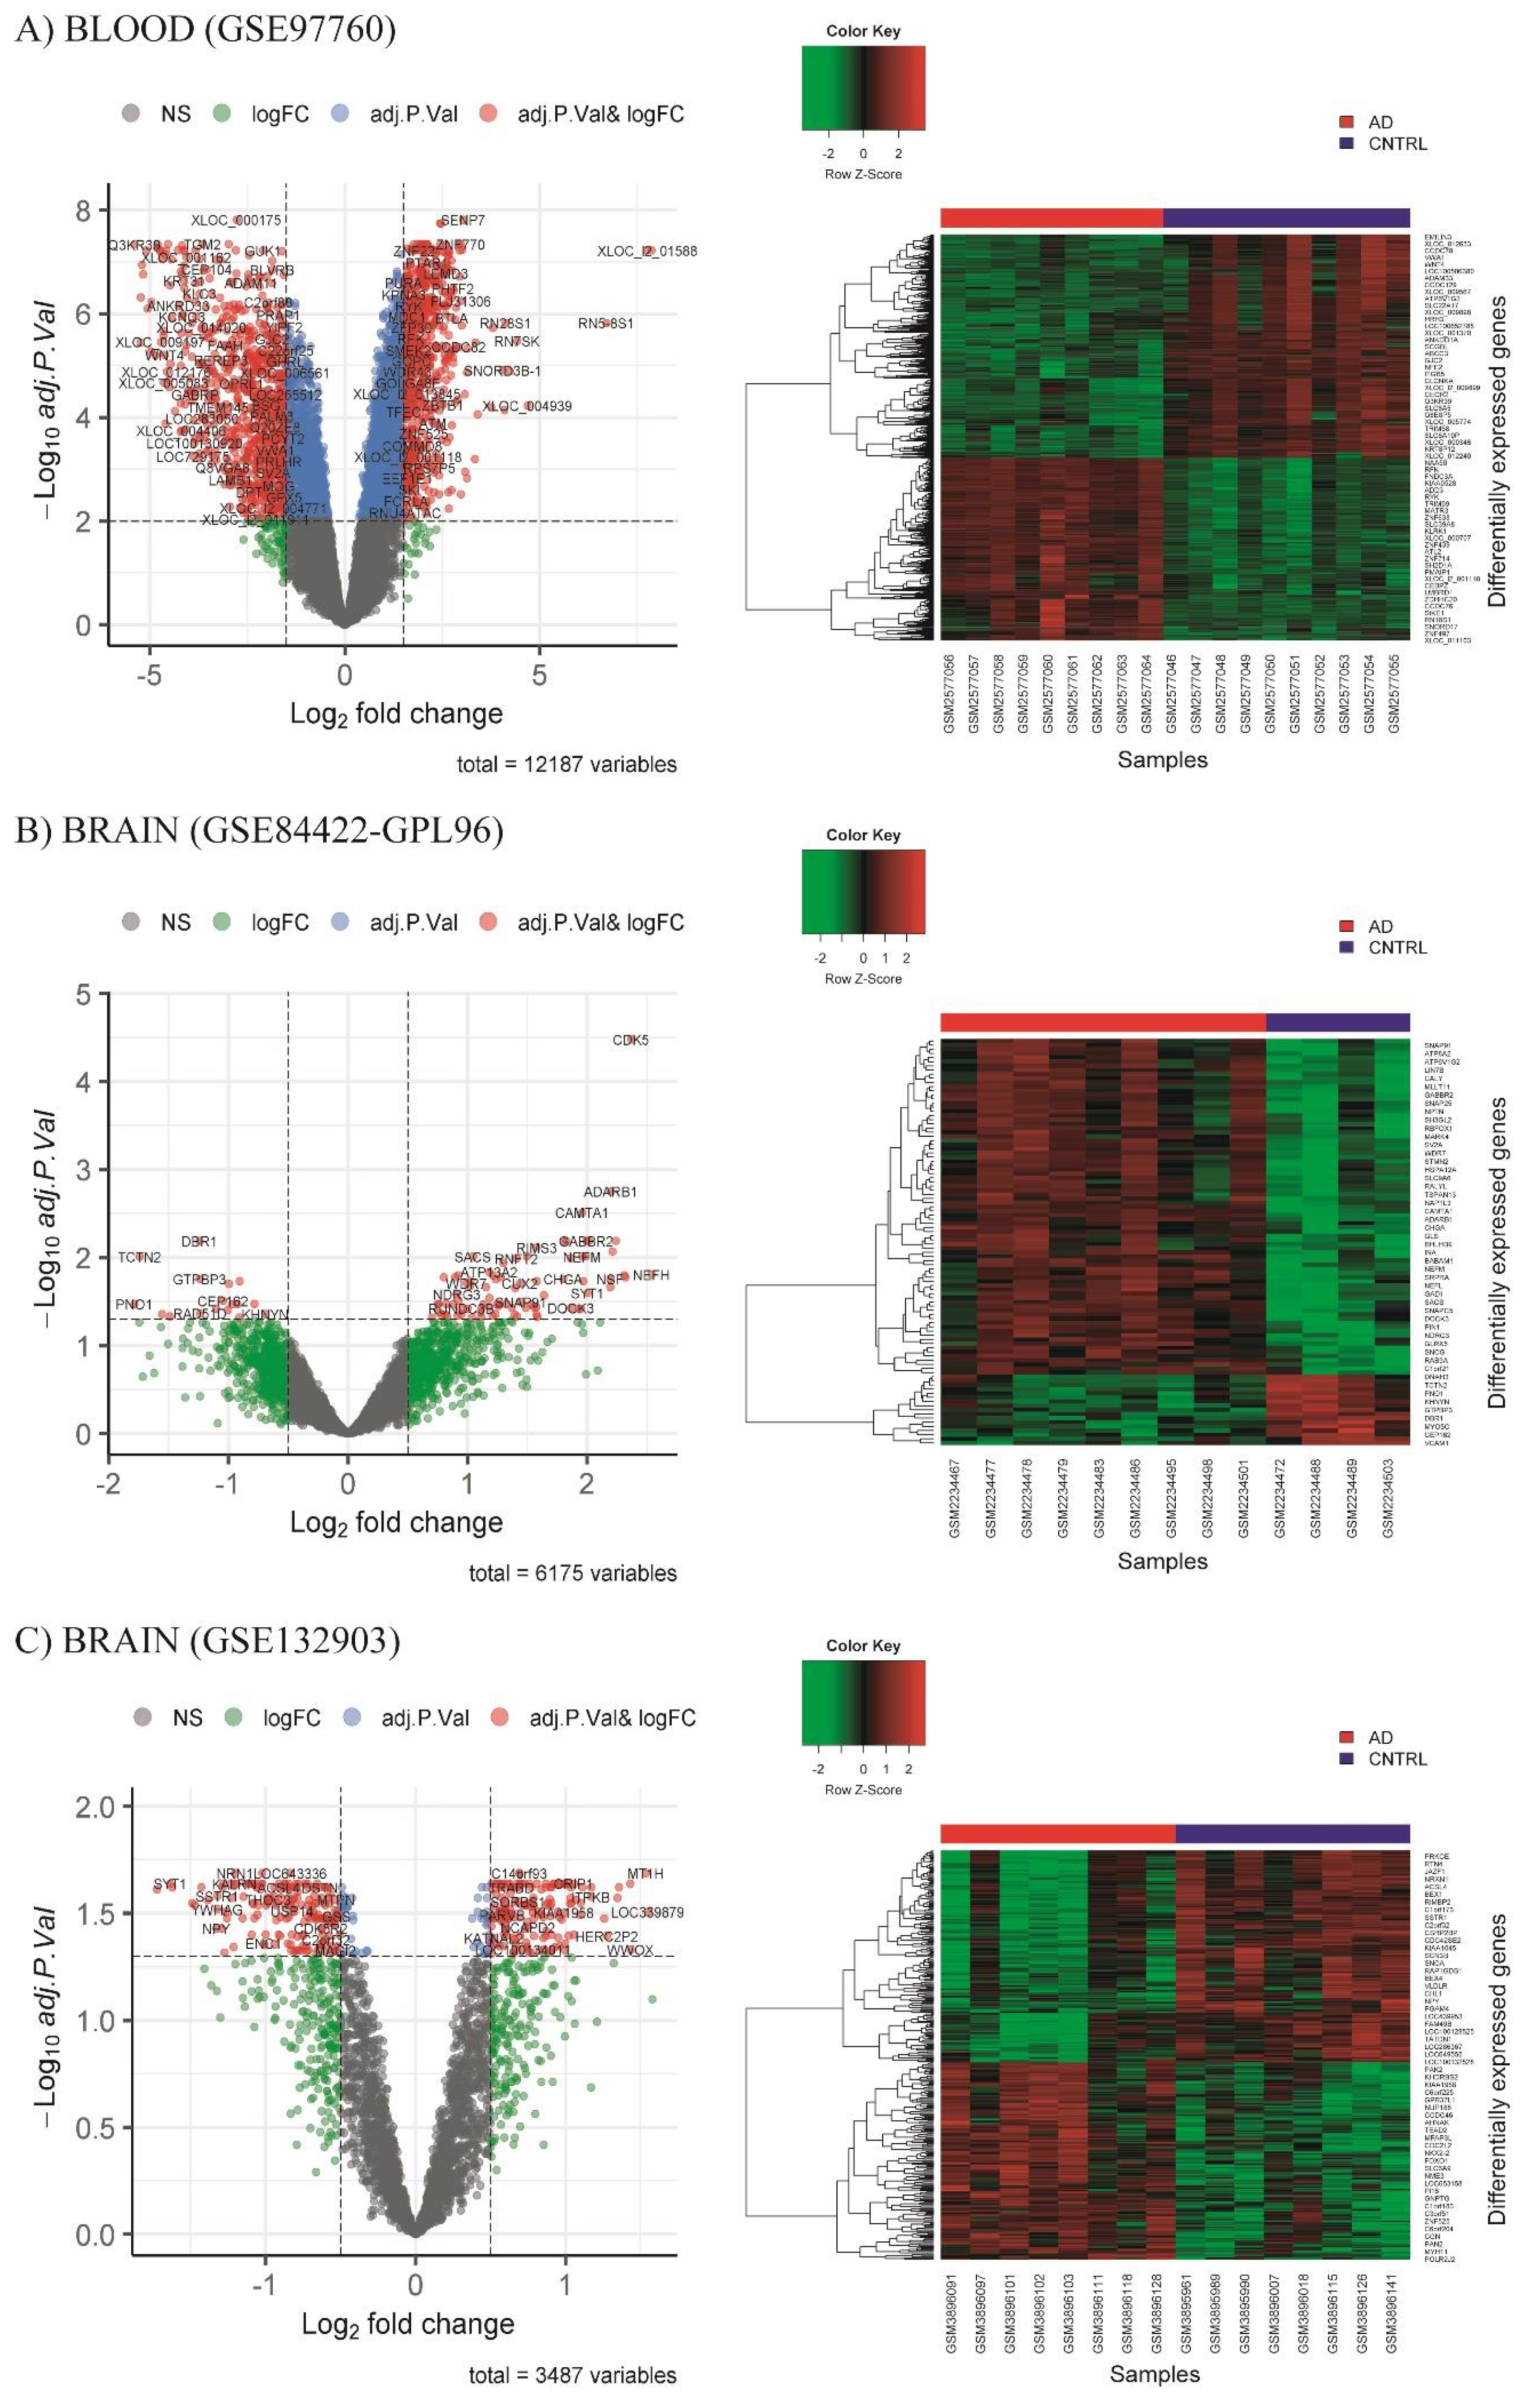
3.2. Differential Expression Analysis (DEA)

Differential expression analysis (DEA) was performed to evaluate the differences in the transcriptional profile between the groups of each database. Our results showed 850 downregulated and 693 upregulated DEGs for the blood database (Figure 4A) (GSE97760), and 17 downregulated and 81 upregulated DEGs in the brain database (GSE84422-GPL96) (Figure 4B). In the GSE132903 database, we found 167 downregulated DEGs and 156 upregulated DEGs (Figure 4C).

3.3. Functional Enrichment Analysis of DEGs

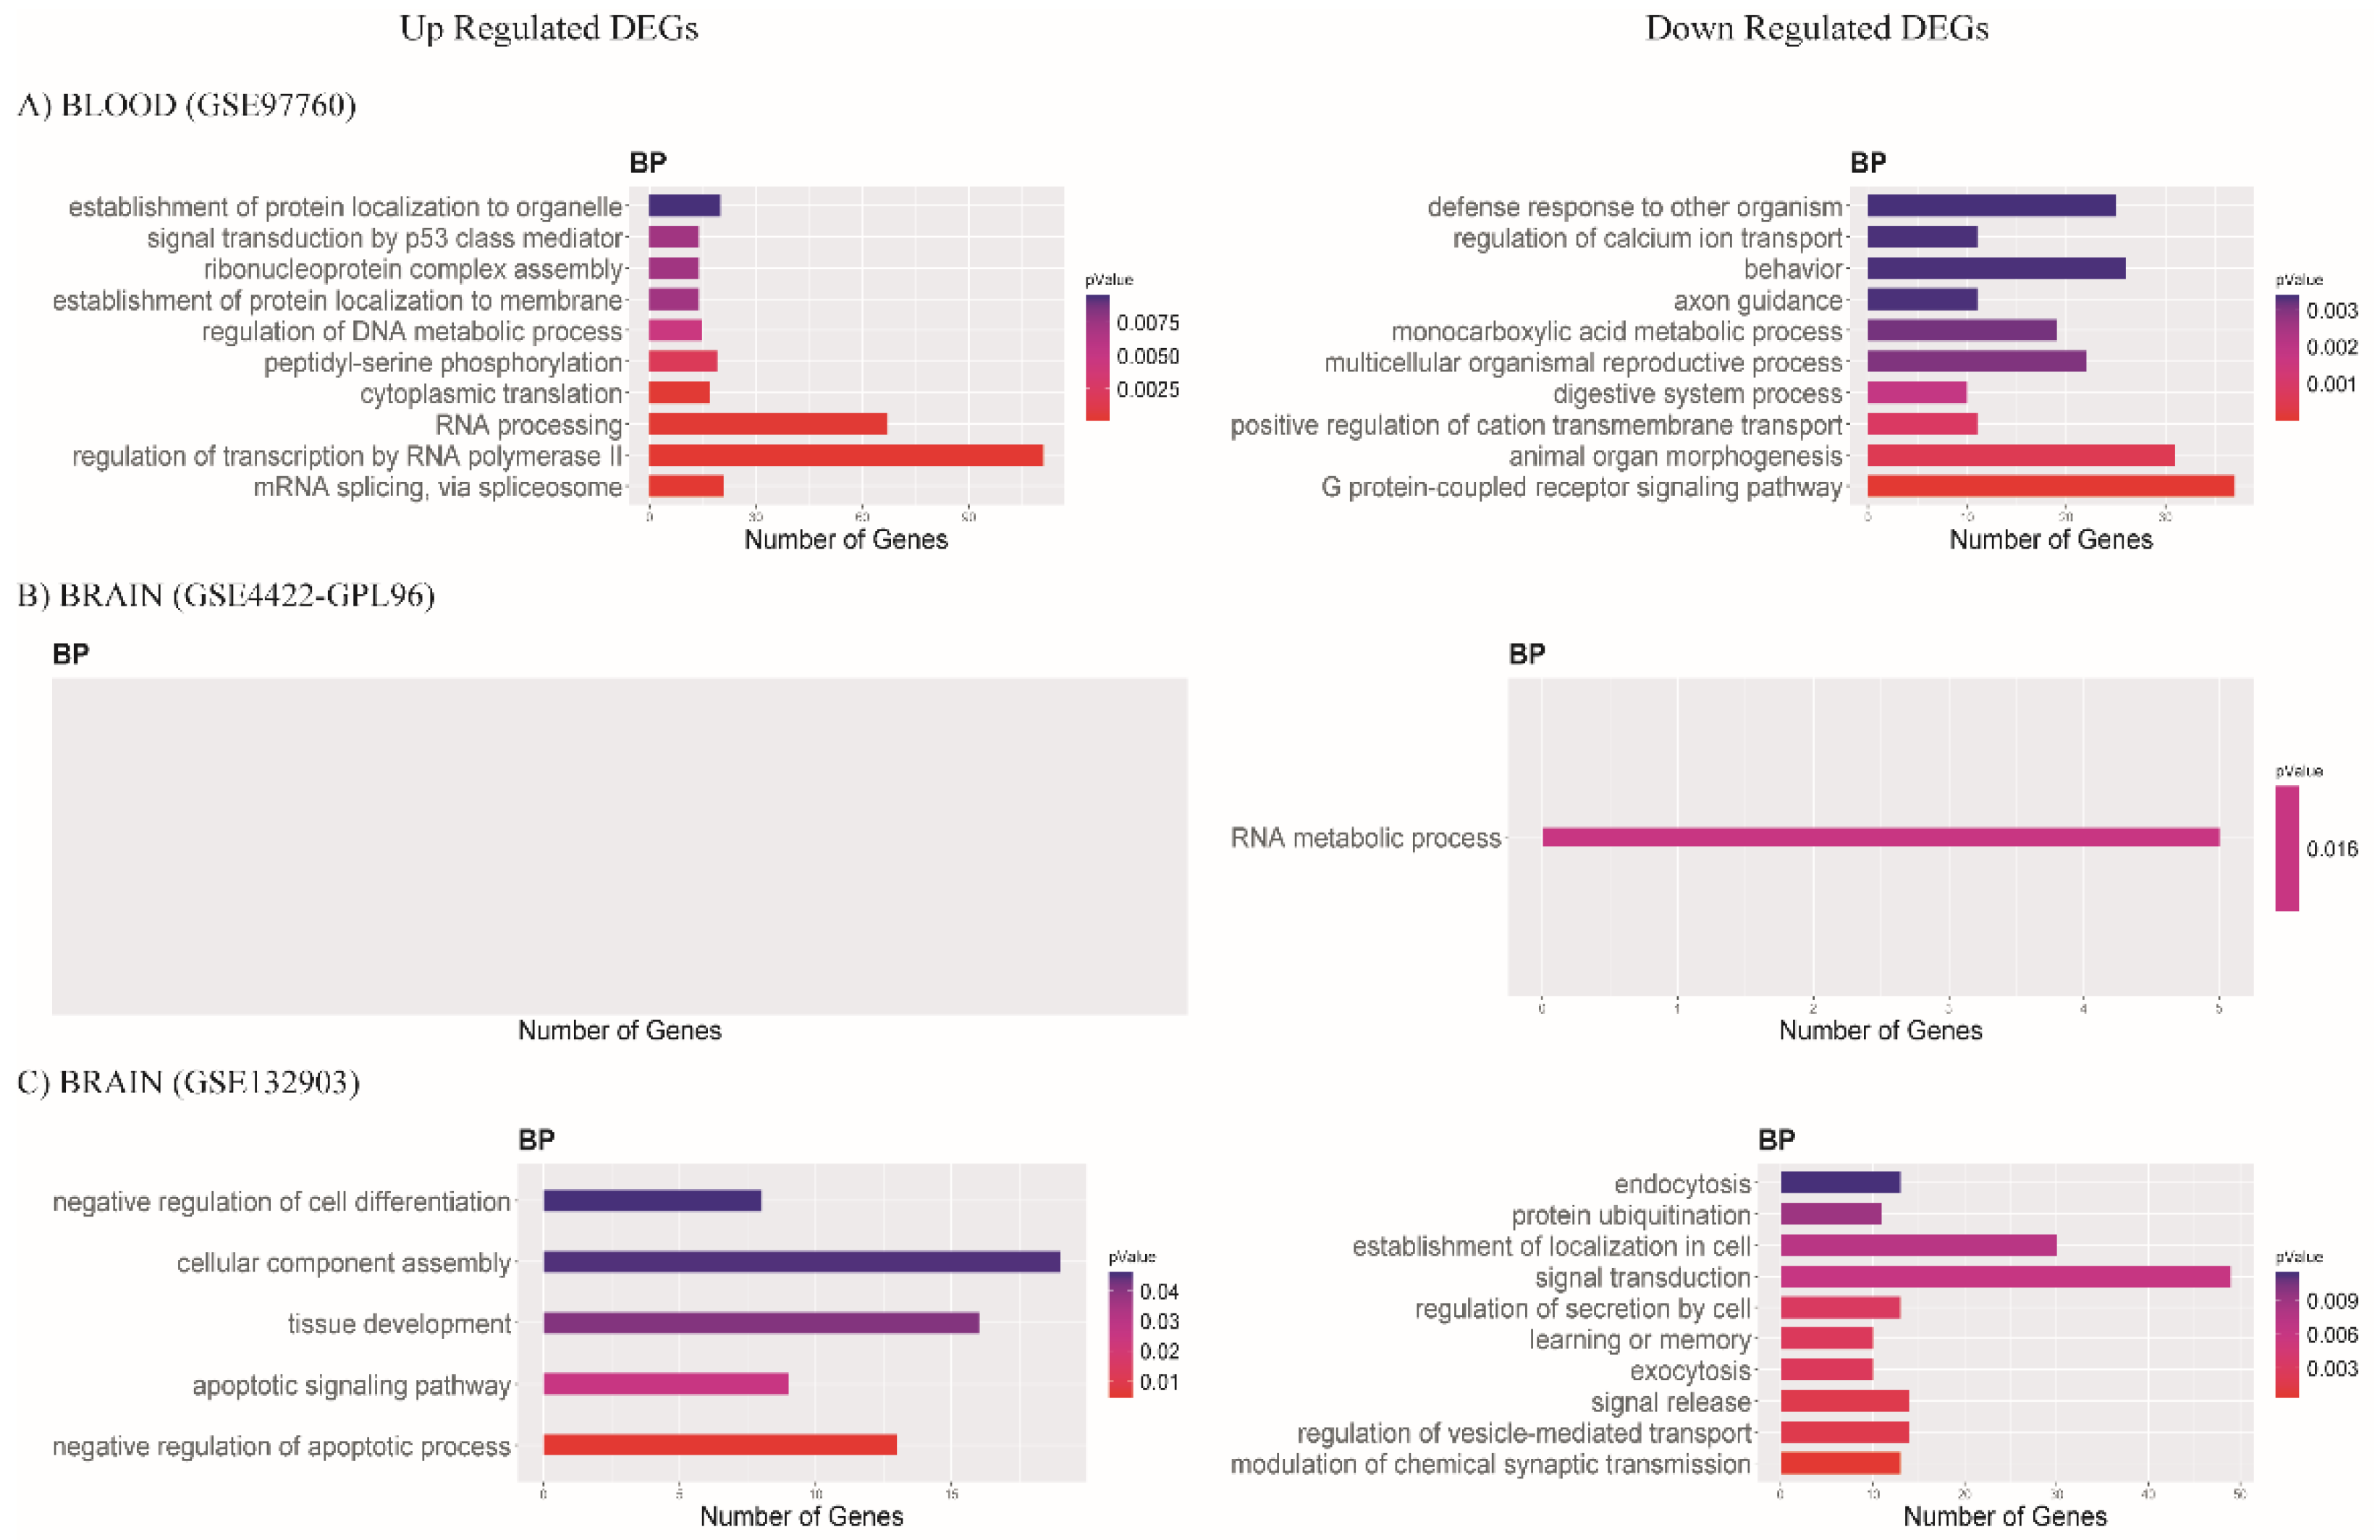
3.3.1. Biological Process

After finding many upregulated and downregulated DEGs, we determined in each database if these genes overrepresented any specific biological function, for which we performed functional enrichment analysis (FEA). For the blood database (GSE97760), we detected the enrichment of different mRNA biological processes: the regulation of transcription by RNA polymerase II and RNA processing were upregulated, while downregulated were cell development, G protein-coupled receptor signaling pathway, and animal organ morphogenesis (Figure 5A). Analysis for the brain database (GSE84422-GPL96) showed no upregulated biological processes, while downregulated processes were related to the RNA metabolic process (Figure 5B). Upregulated DEGs in the other brain database, GSE132903, were associated with cellular component assembly and the negative regulation of the apoptotic process. In contrast, those downregulated were associated with the signal transduction and establishment of localization in the cell (Figure 5C).

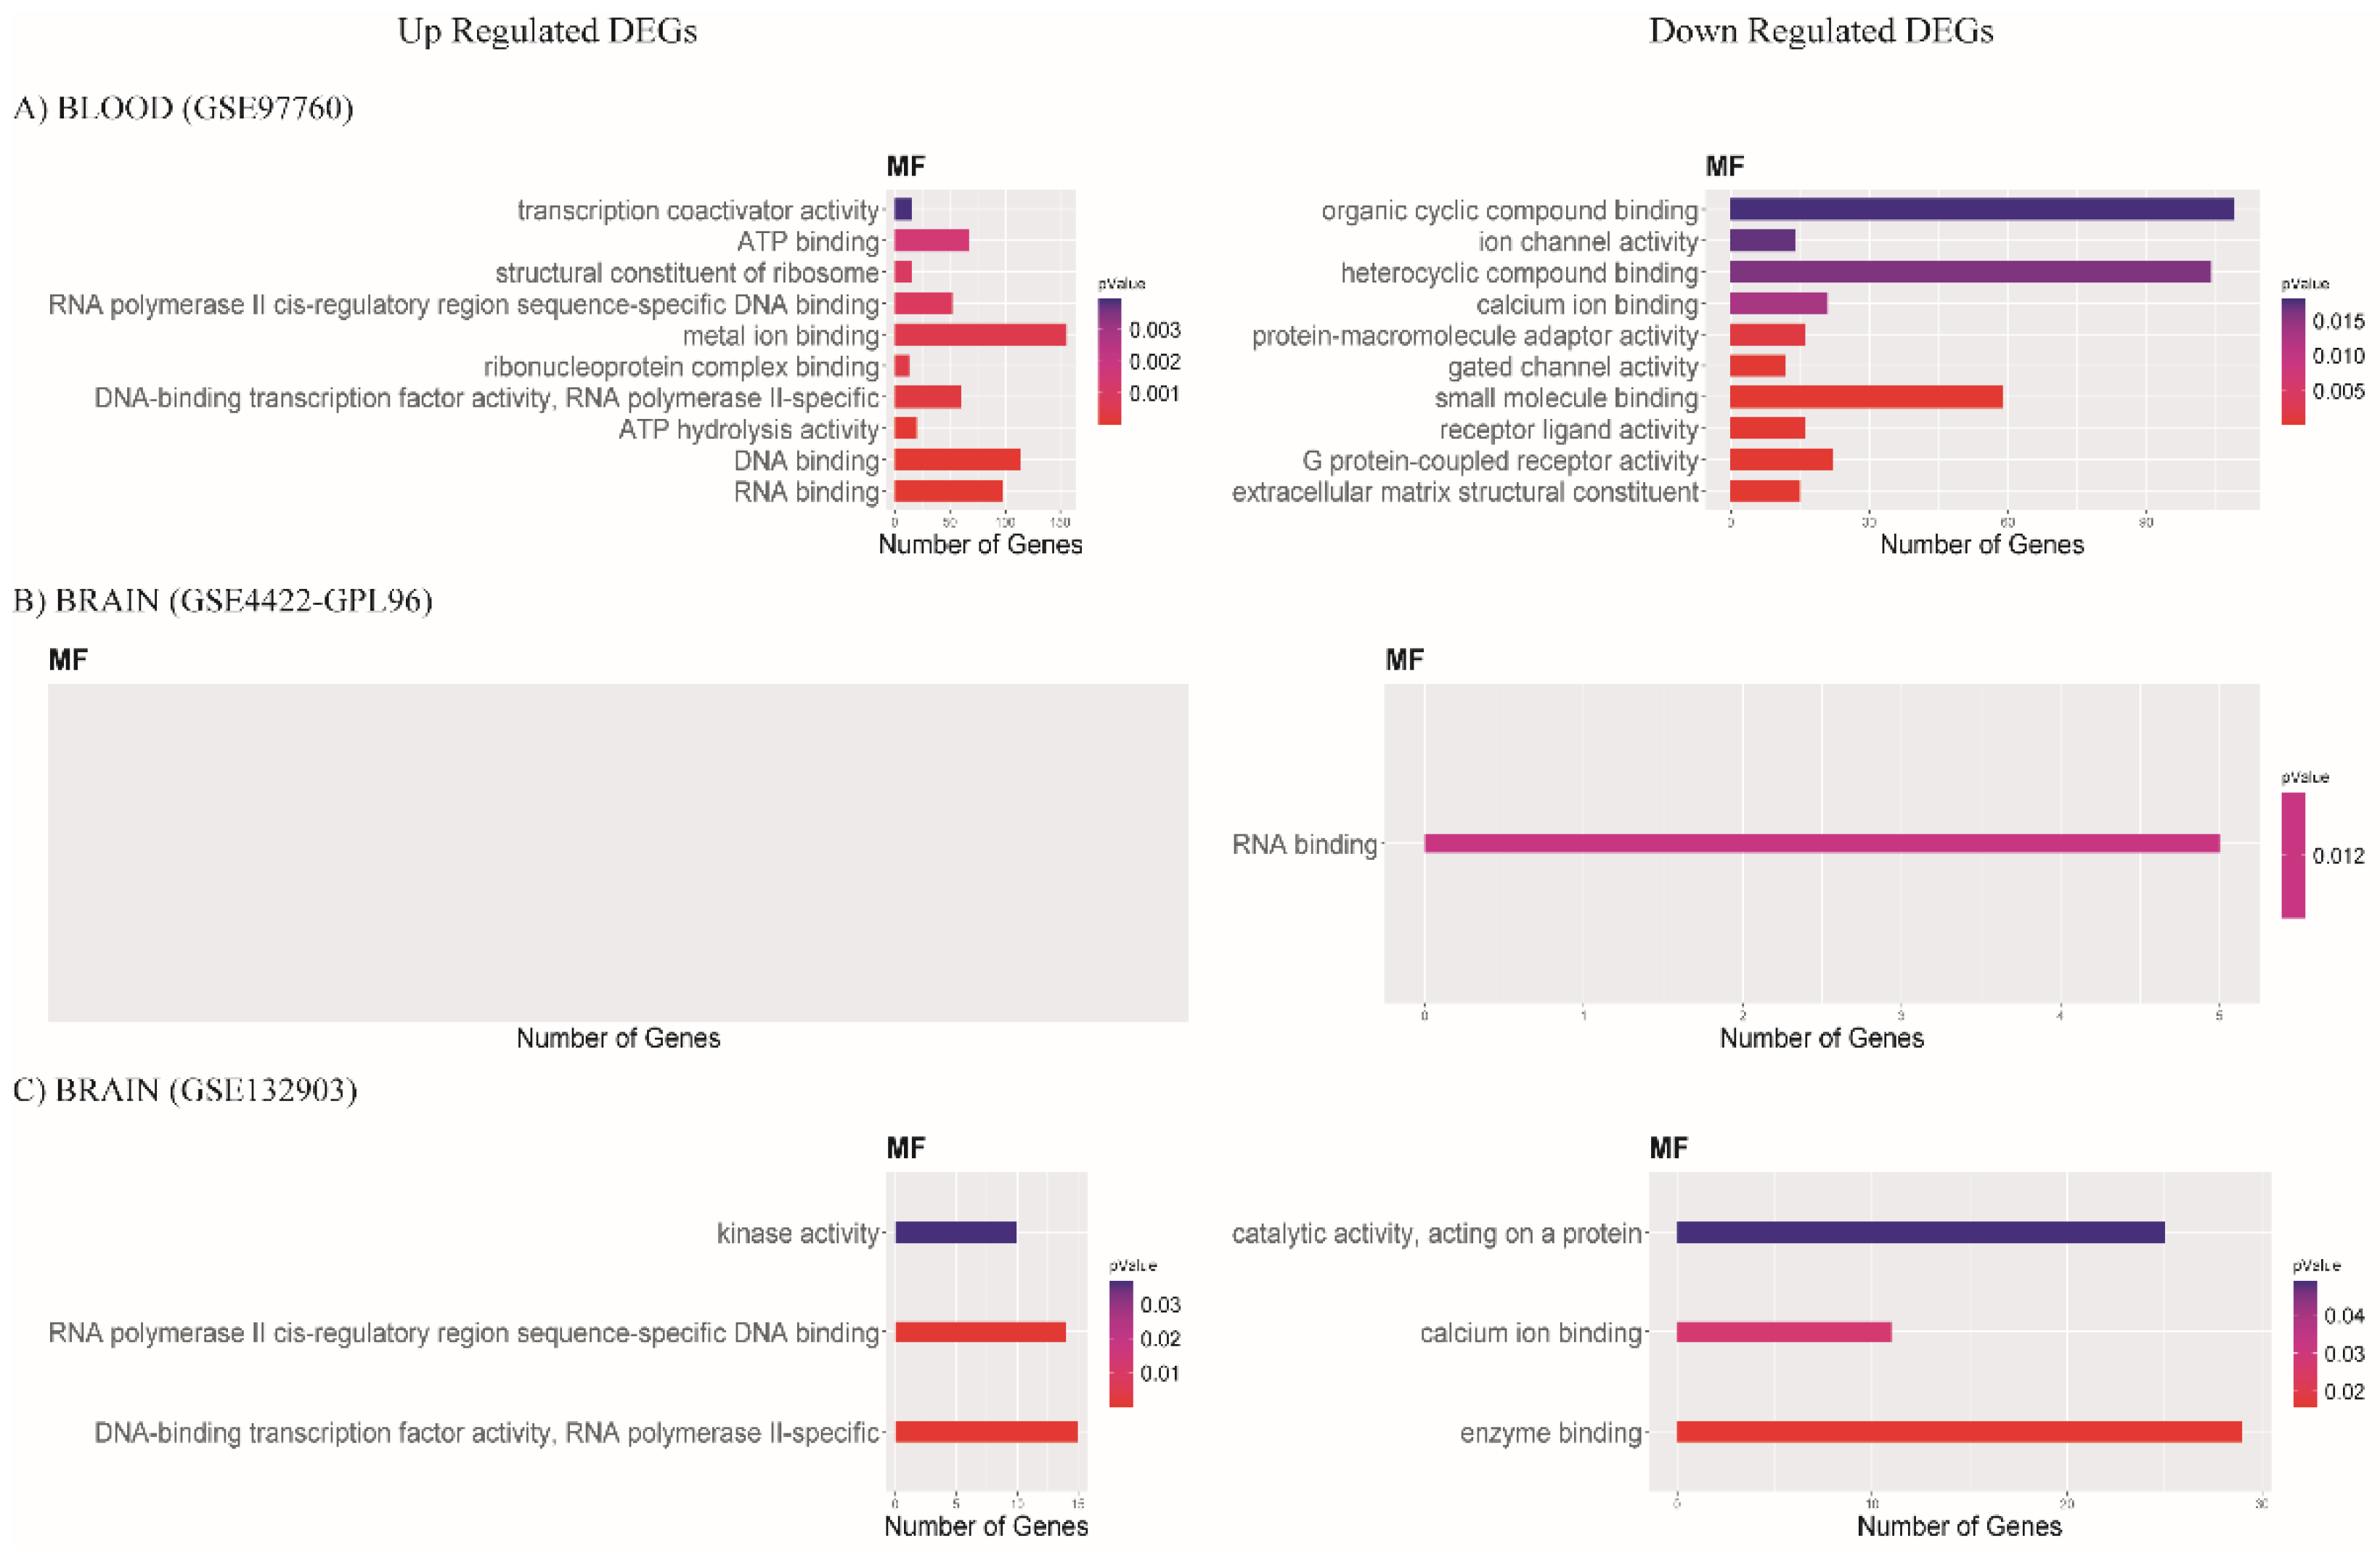
3.3.2. Molecular Function

In the case of molecular function, in the blood database (GSE97760), we found functions of metal ion binding, DNA binding, and RNA binding to be upregulated. Downregulated functions were organic cyclic compound binding, heterocyclic compound binding, and small-molecule binding (Figure 6A). In the brain database (GSE84422-GPL96), we found no upregulated molecular function, but found downregulated RNA binding function (Figure 6B). For database GSE132903, we found upregulated molecular functions to be DNA-binding transcription factor activity, RNA polymerase II cis-regulatory region sequence-specific DNA binding, and kinase activity, while downregulated were enzyme binding, catalytic activity (acting on a protein), and calcium ion binding (Figure 6C).

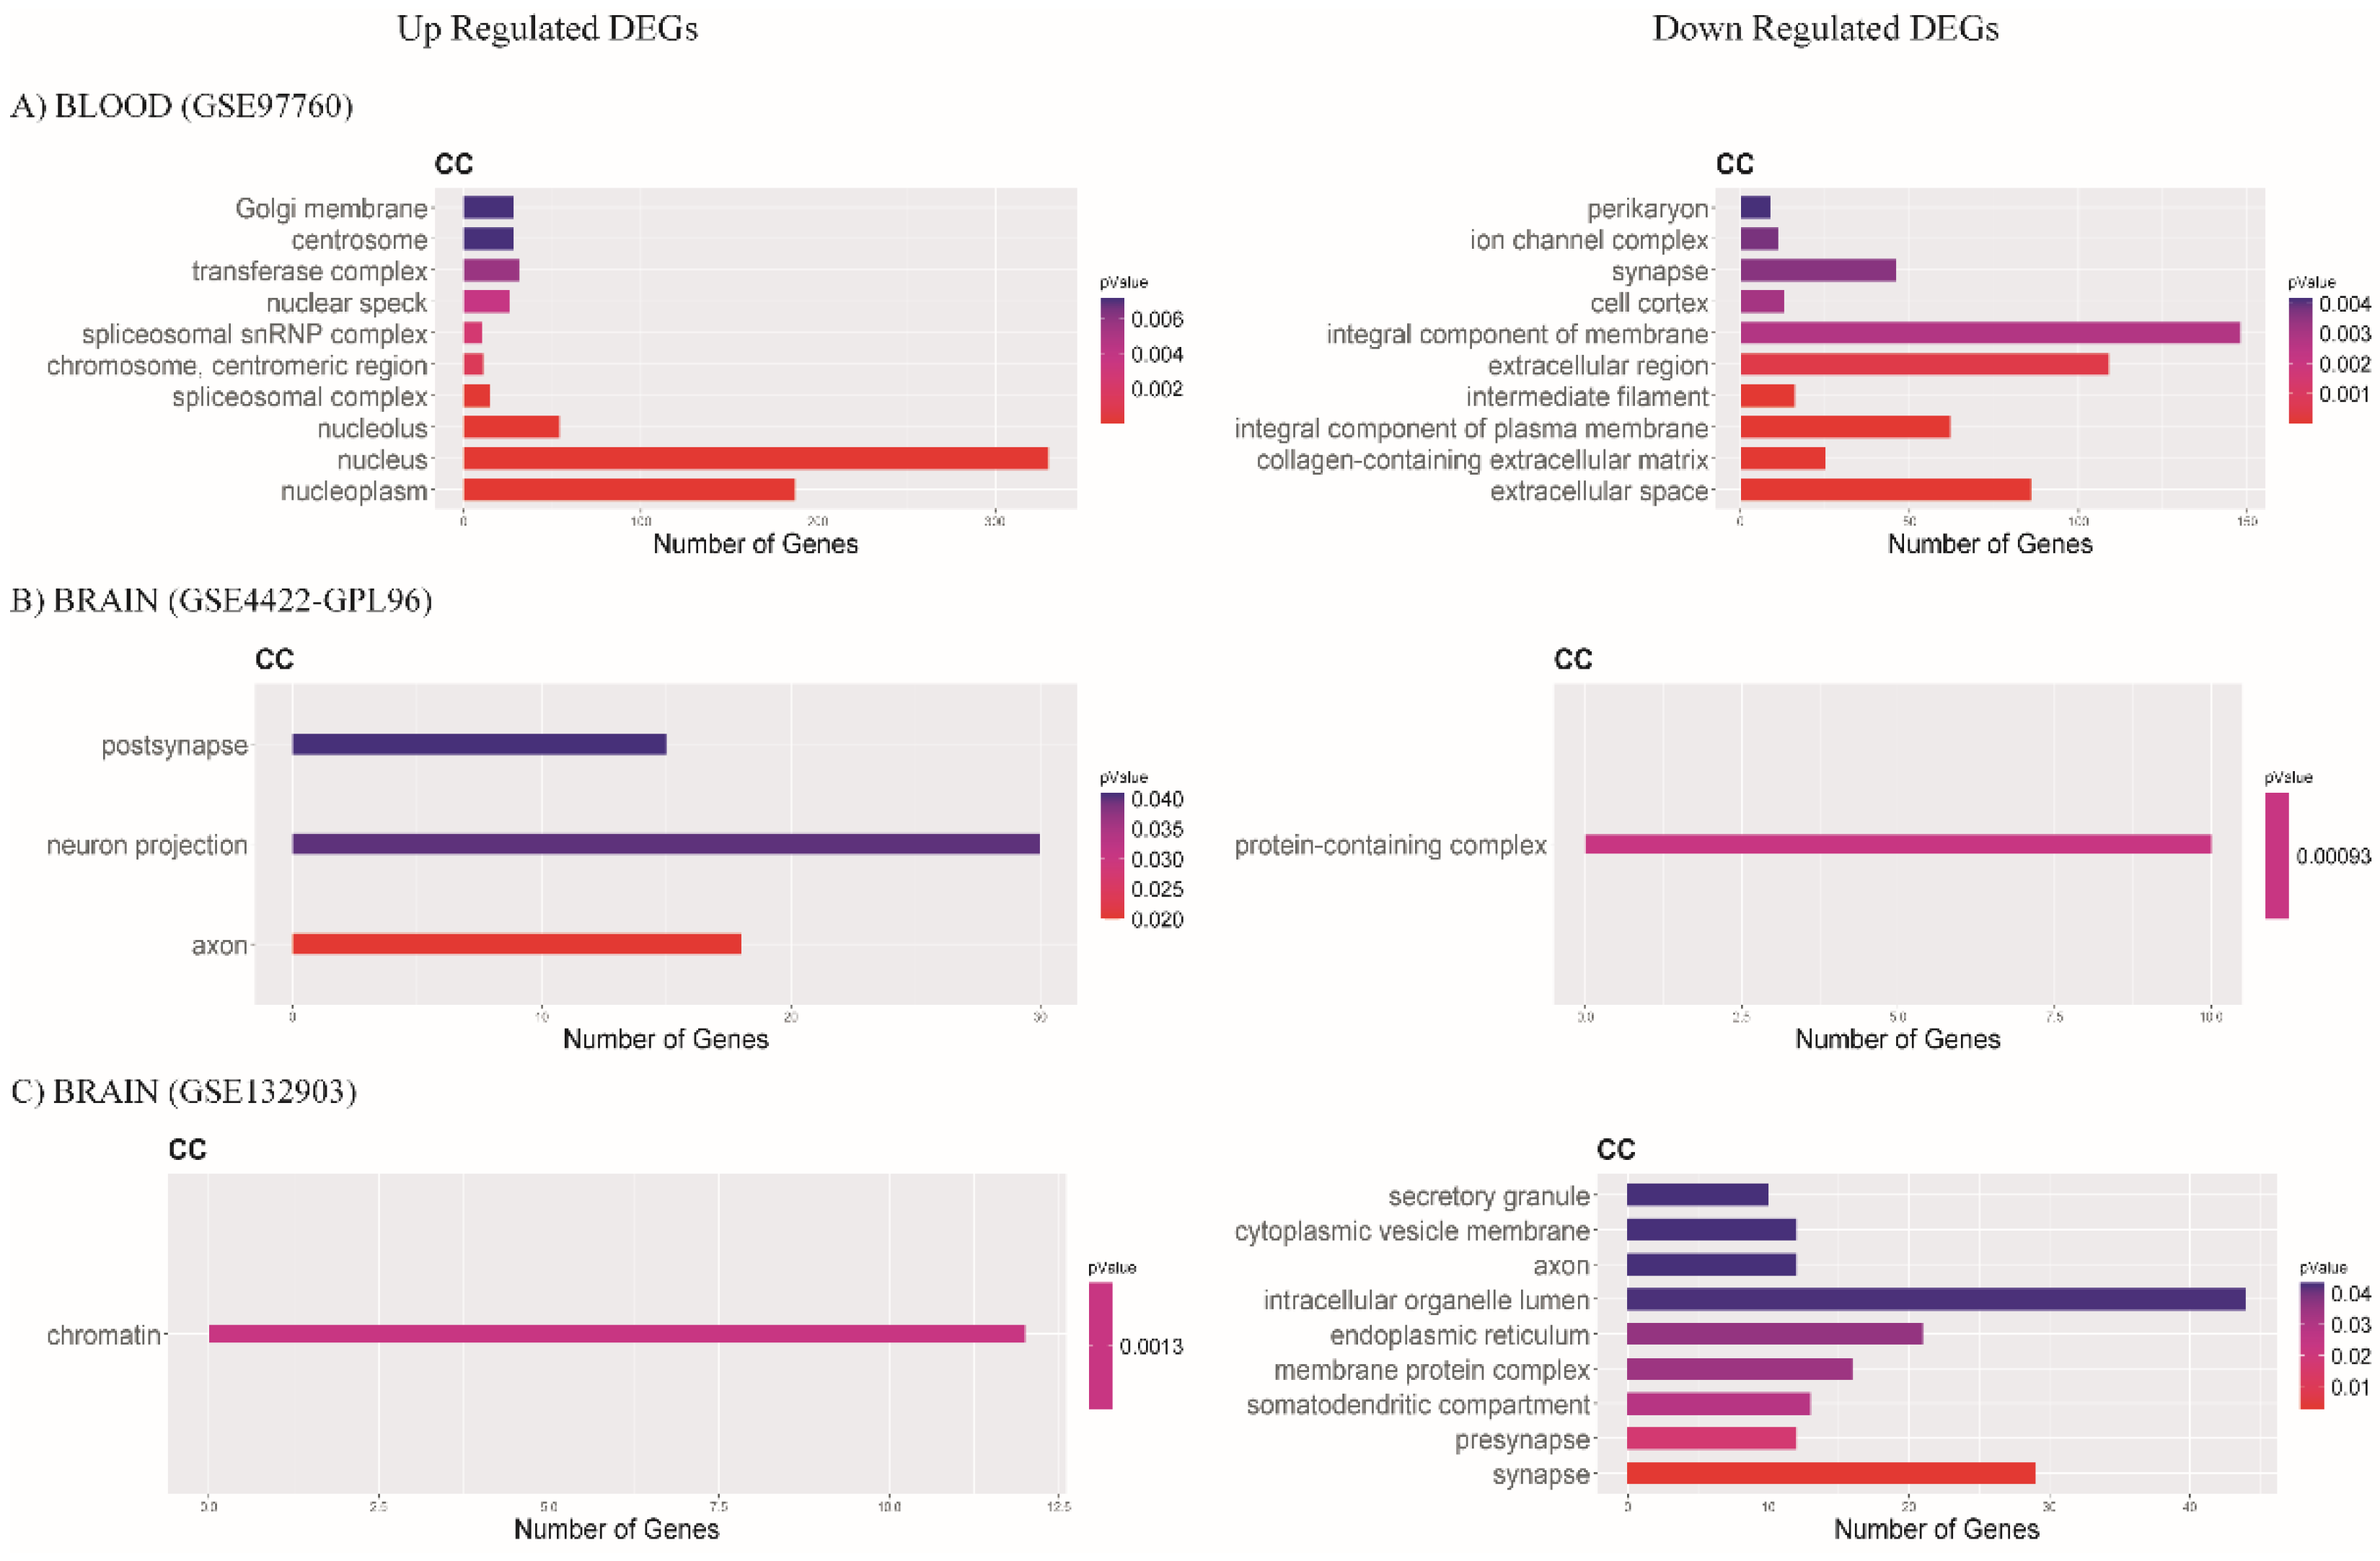
3.3.3. Cellular Component

Regarding enriched cellular components, we found that, for the blood database (GSE97760), upregulated enriched processes were the nucleus, nucleoplasm, and nucleolus. Downregulated were integral components of membrane, extracellular region, and extracellular space (Figure 7A). In the brain database (GSE84422-GPL96), we found the upregulation of cellular components related to neuron projection, axon, and postsynapse, and the protein-containing complex was downregulated (Figure 7B). In database GSE132903, we found upregulated alterations for cellular components such as chromatin, and intracellular organelle lumen, synapse, endoplasmic reticulum, and membrane protein complex were downregulated (Figure 7C).

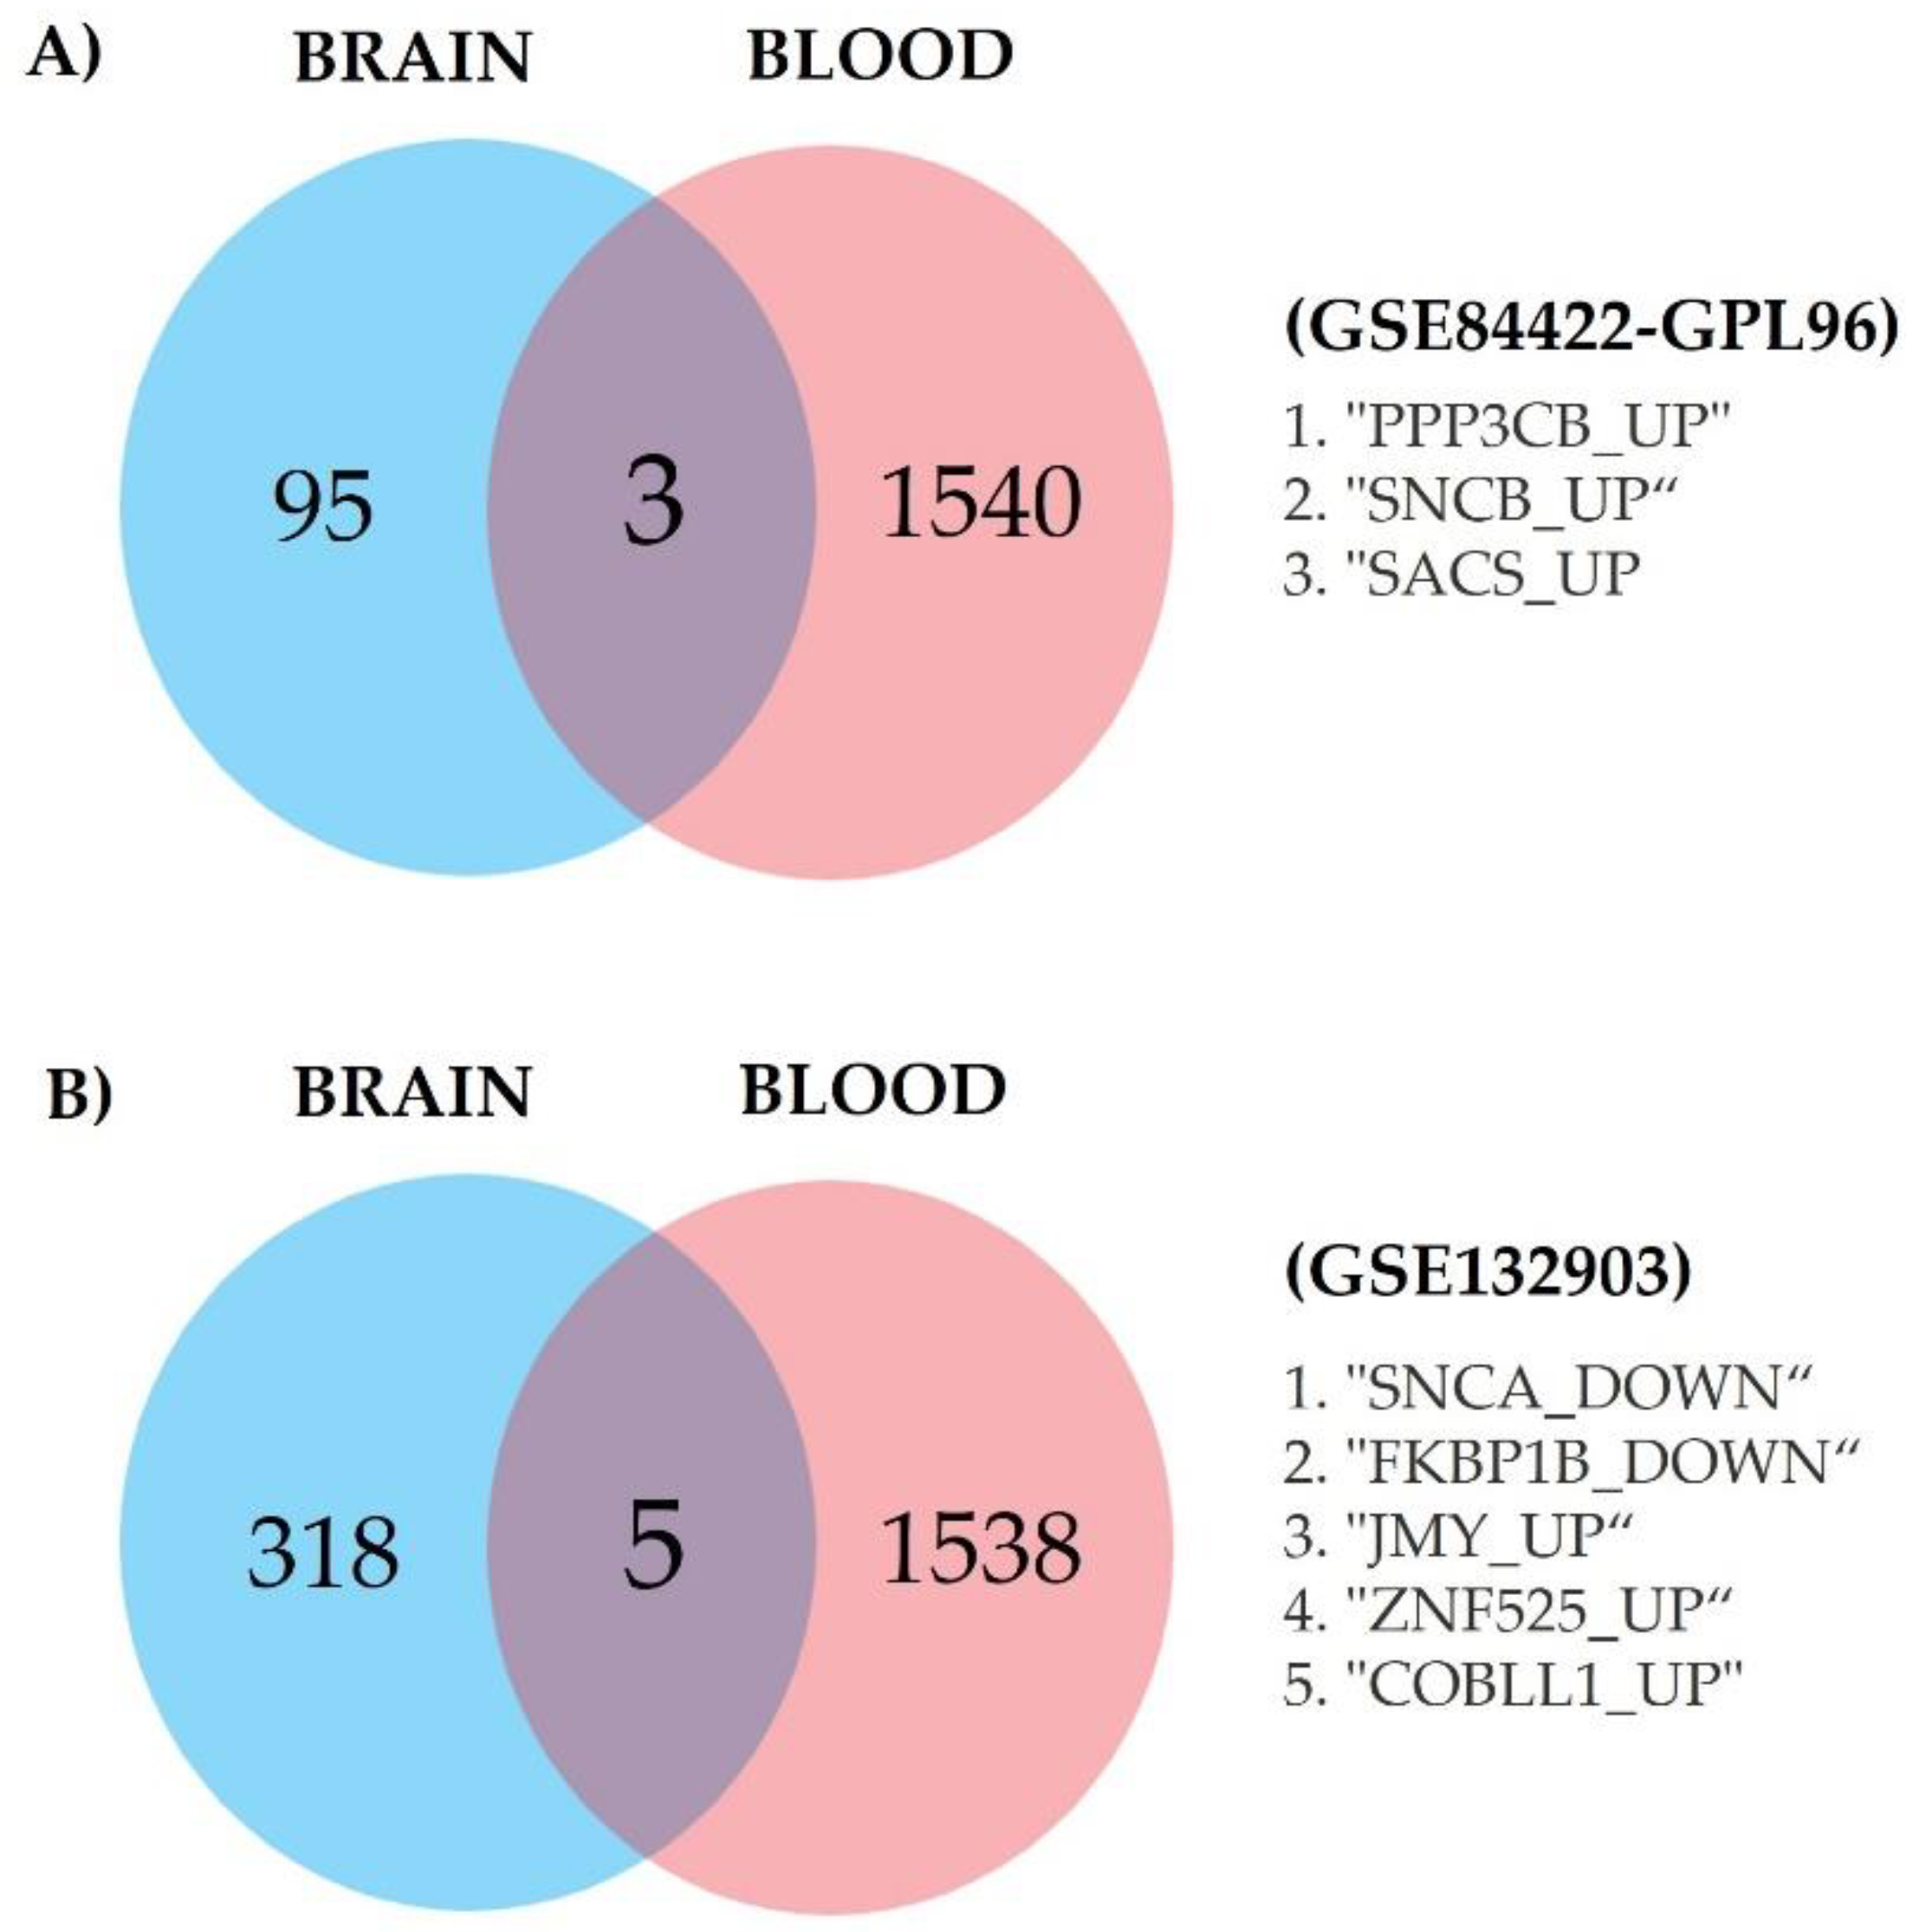
3.4. Genes of Great Interest as Potential AD Biomarkers

We looked for the intersection of genes between the two brain databases and the blood database, which are of great interest as potential AD biomarkers for blood tests. We found genes of interest in common (shared between the blood and brain databases) with the same expression pattern (up- or downregulated) between the blood and brain datasets. As mentioned in Section 2, the blood database (GSE97760) was analyzed with the two brain databases (GSE84422-GPL96 and GSE132903). In the first intersection between the blood database (GSE97760) and one of the brain databases (GSE84422-GPL96), we found three genes of interest, namely, PPP3CB, SNCB, and SACS, and all were upregulated (Figure 8A). Five genes of interest were found for the intersection between the blood database (GSE97760) and brain database GSE132903: SNCA, FKBP1B, JMY, ZNF525, and COBLL1 (Figure 8B).

4. Discussion

The analysis of the gene expression dataset and the identification of differentially expressed genes in disease compared to a healthy condition target different nodes for novel biomarker detection.
Regarding AD, previous studies showed that abnormalities in the pre- and/or postsynaptic machinery are compromised in many age-related neurological disorders, including AD [37,38,39]. Upon subjection to enrichment analysis, our DEGs revealed that they are involved in diverse processes that could be related to this neurodegenerative disease. In this sense, some enriched GO biological processes are relevant to disease due their relationship with the synaptic process. Analysis of the blood database (GSE97760) showed that downregulated DEGs are associated with axon guidance and behavior, while the brain database (GSE84422) showed downregulated DEGs associated with learning or memory. In the case of molecular function, in the blood database (GSE97760), we found downregulated molecular function of ion channel activity, calcium ion binding, and gated channel activity. In contrast, the brain database (GSE84422) showed downregulated DEGs associated with calcium ion binding. Lastly, upregulated cellular components in the brain database (GSE84422-GPL96) were related to neuron projection, axon, and postsynapse. A previous study demonstrated the association between miRNAs in AD brains and their target genes using bioinformatics analysis; findings showed dysregulated miRNAs and their target mRNAs involved in biological processes such as postsynaptic machinery, neurotransmission, and neuronal viability in AD [40]. Lastly, the results of an approach to identify common signature patterns across public AD studies suggest that AD gene regulatory networks (GRNs) show significant enrichment for key signaling mechanisms involved in neurotransmission. Prioritized genes were prominent in synaptic transmission and implicated in cognitive deficits [41].
The results of the present bioinformatic analysis to explore critical genes potentially involved in the pathogenesis of AD revealed eight interesting genes, which are described below.
The first gene to emerge from the intersection analysis of open-access microarray databases GSE97760 (peripheral blood) and GSE84422-GPL96 (hippocampus) was calcineurin A subunit β (PPP3CB), which is upregulated.
Calcineurin is a major calmodulin-binding protein in the brain and the only serine/threonine phosphatase under the control of Ca2+/calmodulin. Calcineurin is always present as a heterodimer, and it consists of a 58–64 kDa catalytic subunit, calcineurin A, and a 19 kDa regulatory subunit, calcineurin B [42]. The calcineurin A subunit is differentiated into three types, namely, Aα, Aβ (PPP3CB), and Aγ, derived from three different genes. Calcineurin Aα and Aβ are highly expressed in the brain, whereas calcineurin Aγ expression is specific for the testis [43].
A study showed that calcineurin Aβ is upregulated in the hippocampus in the early stages of AD, and these are data correlated with our finding of the upregulation of calcineurin A subunit β in both the blood and brain databases. In that study, the authors compared gene expression in the hippocampus, a region relatively susceptible to neurodegeneration by neurofibrillary tangles (NFTs), with its expression in the parietal cortex, a brain region more resistant to this type of degeneration [44].
At the molecular level, calcineurin may be involved in the regulation of tau phosphorylation in AD brains [45,46]. Another possible explanation of the role of calcineurin Aβ in AD is that calcineurin may be involved in neuronal cell death triggered by insults that increase cytosolic Ca2+ [47] or that the overexpression of calcineurin triggers cytochrome c/caspase-3-dependent apoptosis in neurons [48]. Lastly, one study concluded that the increased expression of calcineurin Aβ might alter APP metabolism and lead to increased production of amyloid Aβ, a major cause of AD. Therefore, the downregulation of calcineurin Aβ levels could be used as a potential therapeutic agent to reduce amyloid Aβ levels [49].
The second gene obtained in our study is beta-synuclein (SNCB), which is upregulated. Beta-synuclein (βSyn) is a presynaptic protein that is expressed in the central nervous system (CNS) and highly enriched in the hippocampus [50]. A significant advantage of βSyn compared with other synaptic CSF markers, such as neurogranin, is its specific expression in the CNS, which is why the release of βSyn from degenerating neurons is more likely to also be detected in blood [51].
The physiological function of βSyn is unclear, and it was studied in the context of α-synucleinopathies such as Parkinson’s disease (PD) and dementia with Lewy bodies (DLB) [52,53]. No significant changes in βSyn levels were observed in CSF and serum from PD patients. Therefore, it is unlikely that changes in βSyn in AD are due to α-synuclein copathology. Because the pattern of βSyn changes in CSF and serum resembles other synaptic proteins in neurodegenerative diseases, total βSyn levels reflect synaptic degeneration rather than specific changes associated with βSyn pathology [51].
The establishment of a new detection method for beta-synuclein provides evidence that beta-synuclein is a novel diagnostic and predictive biomarker candidate for AD when measured in CSF. The CSF levels of presynaptic beta-synuclein could be used as a marker of synaptic degeneration and may thus be suitable as a measurement in clinical trials targeting synapse loss AD [54].
The third gene, a product of intersection analysis, is sacsin (SACS), which is a cochaperone that acts as a regulator of Hsp70 chaperone machinery and may be involved in the processing of other ataxia-linked proteins. SACS was upregulated in AD tissue. SACS encodes the sacsin protein, which contains a UbL domain at the N terminus, a DnaJ domain, and a HEPN domain at the C terminus. The gene is highly expressed in the central nervous system, and is also found in the skin, skeletal muscle, and in small amounts in the pancreas [55].
Sacsin is predominantly localized in the cytoplasm and in mitochondria. Sacsin interacts with dynamin-related protein 1 (DRP1), a GTPase that mediates mitochondrial fission. In a sacsin knockout mouse, mitochondria appeared to be overly fused and showed reduction in mobility [56]. These data suggest that sacsin may also participate in mitochondrial fission. Mitochondrial dysfunction is a common feature in many neurodegenerative diseases such as Alzheimer’s [57].
The first gene to emerge from our intersection analysis of open-access microarray databases GSE97760 (peripheral blood) and GSE132903 (middle temporal gyrus) was alpha-synuclein (SNCA), which is downregulated.
α-Synuclein (αSyn) is predominantly expressed within presynaptic terminals of neurons [58]. The expression of αSyn can mainly be found in the cerebral cortex, cerebellum, striatum, thalamus, hippocampus, and olfactory bulb [59]. α-Synuclein is a small 140-residue protein translated from 5 SNCA gene exons located on the long arm of chromosome 4 [60]. The primary structure of αSyn is subdivided into three regions: an amphipathic N-terminal, a hydrophobic core region known as the NAC, and an unstructured acidic C-terminal.
In addition to AD brain pathology, including Aβ and tau lesions, studies documented the occurrence of comorbid αSyn or Lewy-related pathology (LRP) in more than 50% of autopsy-confirmed AD brains [61]. The co-occurrence of LRP in AD is associated with the immunohistochemical colocalization of αSyn and tau pathology [62], and to a lesser extent to αSyn and Aβ pathology [63].
A study conducted with CSF samples collected over a period of 7 years as part of the Alzheimer’s Disease Neuroimaging Initiative (ADNI) showed that lower α-syn/p-tau181 levels were associated with both the faster progression of cognitive decline and the conversion of MCI into AD [64]. The results of another study showed lower levels of α-syn and its heterocomplexes (i.e., α-syn/Aβ and α-syn/tau) in red blood cells (RBCs) of AD patients compared with healthy controls (HCTLS). Both α-syn/Aβ and α-syn/tau heterodimers in RBCs distinguished AD participants from healthy controls with sufficient accuracy. These data suggest that α-syn heteroaggregates in erythrocytes are a potential tool for the early diagnosis of AD on blood tests [65].
The second obtained gene is FKBP prolyl isomerase 1B (FKBP1B), which is downregulated.
FK506-binding proteins 1a and 1b (FKBP1a/1b) are immunophilin proteins that bind immunosuppressive drugs FK506 and rapamycin. Many immunophilins exhibit peptidyl-prolyl isomerase activity, and function as protein chaperones and structural stabilizers [66,67]. Microarray studies revealed that FKBP1b gene expression was downregulated in the hippocampus of aging rats and in early Alzheimer’s disease patients. These results suggest that declining FKBP function is a key factor in age-related Ca2+ dysregulation in the brain [68]. Furthermore, one paper reported gene therapy approaches, and found that increasing FKBP1b reversed calcium dysregulation and memory impairment in aging rats, allowing for them to perform as well as young rats on a memory task [69].
Other genes in analysis (JMY, ZNF525, and COBLL1) were not previously associated with Alzheimer’s disease. However, they could be considered in future studies. JMY is a gene that encodes for junction-mediating and regulatory protein, and it acts as both a nuclear p53/TP53-cofactor and a cytoplasmic regulator of actin dynamics depending on conditions [70]. During autophagy, actin filament networks move and remodel cellular membranes to form autophagosomes that enclose and metabolize cytoplasmic contents. LC3 and STRAP regulate JMY’s actin assembly activities in trans during autophagy [70]. Thus, the connection of JYM to AD may be at the level of autophagy regulation, since autophagy is impaired in AD neurons and other peripheral cells. ZNF525 encodes for zinc finger protein 525, which may be involved in transcriptional regulation. Sterner et al. (2013) reported that the expression of ZNF525 in the cerebral cortex broadly mirrors developmental patterns of cortical glucose consumption [71]. Therefore, this protein could be related to brain metabolic function, which is affected in AD. In turn, Cordon-Bleu WH2 repeat-protein-like 1 (COBLL1) enables cadherin binding activity and it is located in extracellular exosomes. An important paralog of this gene is COBL, which is involved in neural tube formation [72,73]. Gene Ontology (GO) annotations related to this gene include actin binding. Diseases associated with COBLL1 include macular degeneration age-related 10 (ARMD10). An association among COBLL1 rs7607980 C allele, lower serum insulin levels, and lower insulin resistance was reported in overweight and obese children. Hyperglycemia is a risk factor for dementia [74,75].
Bioinformatics analysis has been applied to many diseases in recent decades in the search for identifying new biomarkers for disease diagnosis and treatment [76,77,78].
DEGs in AD were also studied. Results in Gene Ontology (GO) terms of those articles are similar to ours [40,79]. Our results are reliable for the following reasons: (1) This study follows statistical test models along with gene enrichment to better understand detailed molecular mechanisms underlying AD and thus assist in the selection of possible biomarkers for patients with the disease. (2) The three selected datasets are all based on the same platform. They could be combined into one dataset for normalized analysis, which would improve the credibility of the results. (3) During investigation, the original data were processed to ensure that the information was valid and consistent.
However, there were a few limitations in our study. The sample size for microarray analysis was small (we selected three datasets with a sample size of 58), which may have caused a relatively high rate of false-positive results. Moreover, no experimental verification was performed. Thus, to verify the current results, further studies are warranted to elucidate the biological function of these genes in AD besides their potential use as reliable molecular biomarkers for disease.
In summary, eight genes involved in AD pathogenesis identified in our bioinformatic study shared between the blood database and the two brain tissue databases are potential biomarkers for AD. More research is warranted in order to validate its detection in patients’ peripheral blood samples or CSF. Among these presumptive AD biomarkers are calcineurin subunit β, a serine/threonine phosphatase under the control of Ca2+/calmodulin; β-synuclein, which is associated with synaptic degeneration; α-synuclein, which is associated with the occurrence of comorbid LRP in AD; and FKBP prolyl isomerase 1B (FKBP1B), a chaperone involved in age-related Ca2+ dysregulation in the brain. The SACS gene may be another candidate molecule for AD diagnosis because of its involvement in mitochondrial dysfunction, which is part of the pathophysiology of AD, and three genes JMY, ZNF525, and COBLL1, which are involved in the generation of autophagosomes, transcription regulation glucose consumption, and cadherin/actin binding linked to lower serum insulin levels, respectively, could also be useful in AD diagnosis.

5. Conclusions

The differential gene expression analysis of tissue (hippocampus and middle temporal gyrus) and peripheral blood databases from Alzheimer’s disease patients resulted in the functional enrichment of DEGs showing UR pathways of behavior, nervous system processes, postsynapses, and enzyme binding, while cellular component organization, RNA metabolic process, and signal transduction were DR. Lastly, the intersection of DEGs in the three databases revealed eight common genes in the brain and blood that could be validated in samples from different ethnic groups, such as Mexican AD patients, as potential new biomarkers with possible application for AD diagnostic blood tests.

Author Contributions

J.R.-O., database search, design, and methodology and analysis; M.-d.-C.S.-L., L.G.-V., M.-d.-C.C.-A., interpretation and writing of the article; G.L.-T., J.L.-M., F.M.-S., L.O.S.-R. and M.P.-H., review, and editing; M.-d.-C.C.-A., project conception and design, writing, paper review and editing, and project supervision. All authors have read and agreed to the published version of the manuscript.

Funding

This research was funded by DGAPA/PAPIIT UNAM, grant numbers IA210620, IA208118, and IA202021, and by the Mexican National Research Council (CONACYT), Ciencia Básica y/o Ciencia de Frontera Modalidad: Paradigmas y Controversias de la Ciencia 2022, grant number 319578, and Fondo nacional de ciencia, tecnología. República Dominicana 2018-2019-2A3-208 to J-L.M. and M.-P.H.

Institutional Review Board Statement

Not applicable.

Informed Consent Statement

Not applicable.

Data Availability Statement

All analyzed databases are open-access from GEO2R (See Table 1, https://www.ncbi.nlm.nih.gov/geo/, accessed on 22 March 2022).

Acknowledgments

We would like to thank CONACYT for the PhD fellowship granted to Gustavo Lopez-Toledo, and the master’s degree fellowship given to Jared Rivera-Osorio. We thank the postdoctoral program from DGAPA/UNAM (2018–2020), and CONACYT for the postdoctoral fellowship (2020 to 2022) granted to Maria del Carmen Silva-Lucero. We thank the postdoctoral program from DGAPA/UNAM for the postdoctoral fellowship granted to Laura Gomez-Virgilio (2022–2023).

Conflicts of Interest

The authors declare no conflict of interest.

References

  1. Lopez, O.L.; Kuller, L.H. Epidemiology of aging and associated cognitive disorders: Prevalence and incidence of Alzheimer’s disease and other dementias. Handb. Clin. Neurol. 2019, 167, 139–148. [Google Scholar] [CrossRef]
  2. Nichols, E.; Szoeke, C.E.I.; Vollset, S.E.; Abbasi, N.; Abd-Allah, F.; Abdela, J.; Aichour, M.T.E.; Akinyemi, R.O.; Alahdab, F.; Asgedom, S.W.; et al. Global, regional, and national burden of Alzheimer’s disease and other dementias, 1990–2016: A systematic analysis for the Global Burden of Disease Study 2016. Lancet Neurol. 2019, 18, 88–106. [Google Scholar] [CrossRef] [Green Version]
  3. Wu, Y.-T.; Beiser, A.S.; Breteler, M.M.B.; Fratiglioni, L.; Helmer, C.; Hendrie, H.C.; Honda, H.; Ikram, M.A.; Langa, K.M.; Lobo, A.; et al. The changing prevalence and incidence of dementia over time—Current evidence. Nat. Rev. Neurol. 2017, 13, 327–339. [Google Scholar] [CrossRef] [PubMed] [Green Version]
  4. Hendriks, S.; Peetoom, K.; Bakker, C.; Van Der Flier, W.M.; Papma, J.M.; Koopmans, R.; Verhey, F.R.J.; De Vugt, M.; Köhler, S.; Withall, A.; et al. Global Prevalence of Young-Onset Dementia. JAMA Neurol. 2021, 78, 1080. [Google Scholar] [CrossRef] [PubMed]
  5. 2022 Alzheimer’s disease facts and figures. Alzheimer’s Dement. 2022, 18, 700–789. [CrossRef]
  6. Gauthier, S.R.-N.P.; Morais, J.A.; Webster, C. World Alzheimer Report 2021: Journey through the Diagnosis of Dementia. Alzheimer´s Disease International (ADI): London, UK. 2021, pp. 1–314. Available online: https://www.alzint.org/what-we-do/research/world-alzheimer-report/ (accessed on 22 March 2022).
  7. Patterson, C. World Alzheimer Report 2018. The State of the Art of Dementia Research: New Frontiers. Alzheimer Disease International (ADI), The Global Voice on Dementia. London, UK. 2018, pp. 1–48. Available online: https://www.alzint.org/what-we-do/research/world-alzheimer-report/ (accessed on 22 March 2022).
  8. Livingston, G.; Huntley, J.; Sommerlad, A.; Ames, D.; Ballard, C.; Banerjee, S.; Brayne, C.; Burns, A.; Cohen-Mansfield, J.; Cooper, C.; et al. Dementia prevention, intervention, and care: 2020 report of the Lancet Commission. Lancet 2020, 396, 413–446. [Google Scholar] [CrossRef]
  9. Rajan, K.B.; Weuve, J.; Barnes, L.L.; McAninch, E.A.; Wilson, R.S.; Evans, D.A. Population estimate of people with clinical Alzheimer’s disease and mild cognitive impairment in the United States (2020–2060). Alzheimer’s Dement. 2021, 17, 1966–1975. [Google Scholar] [CrossRef]
  10. Barnes, L.L.; Wilson, R.S.; Schneider, J.A.; Bienias, J.L.; Evans, D.A.; Bennett, D.A. Gender, cognitive decline, and risk of AD in older persons. Neurology 2003, 60, 1777–1781. [Google Scholar] [CrossRef]
  11. Wilson, R.S.; Mendes De Leon, C.F.; Barnes, L.L.; Schneider, J.A.; Bienias, J.L.; Evans, D.A.; Bennett, D.A. Participation in cognitively stimulating activities and risk of incident Alzheimer disease. JAMA 2002, 287, 742–748. [Google Scholar] [CrossRef]
  12. Živančević, K.; Baralić, K.; Bozic, D.; Miljaković, E.A.; Djordjevic, A.B.; Ćurčić, M.; Bulat, Z.; Antonijević, B.; Bulat, P.; Đukić-Ćosić, D. Involvement of environmentally relevant toxic metal mixture in Alzheimer’s disease pathway alteration and protective role of berberine: Bioinformatics analysis and toxicogenomic screening. Food Chem. Toxicol. 2022, 161, 112839. [Google Scholar] [CrossRef]
  13. Lafta, H.; AlMayaly, I. Potential effect of several heavy metals with Alzheimer’s disease infection. Ann. Rom. Soc. Cell Biol. 2021, 25, 3476–3484. [Google Scholar]
  14. Živančević, K.; Baralić, K.; Jorgovanović, D.; Buha Djordjević, A.; Ćurčić, M.; Antonijević Miljaković, E.; Antonijević, B.; Bulat, Z.; Đukić-Ćosić, D. Elucidating the influence of environmentally relevant toxic metal mixture on molecular mechanisms involved in the development of neurodegenerative diseases: In silico toxicogenomic data-mining. Environ. Res. 2021, 194, 110727. [Google Scholar] [CrossRef] [PubMed]
  15. Medehouenou, T.C.M.; Ayotte, P.; Carmichael, P.-H.; Kröger, E.; Verreault, R.; Lindsay, J.; Dewailly, É.; Tyas, S.L.; Bureau, A.; Laurin, D. Exposure to polychlorinated biphenyls and organochlorine pesticides and risk of dementia, Alzheimer’s disease and cognitive decline in an older population: A prospective analysis from the Canadian Study of Health and Aging. Environ. Health 2019, 18, 57. [Google Scholar] [CrossRef] [Green Version]
  16. Yan, D.; Zhang, Y.; Liu, L.; Yan, H. Pesticide exposure and risk of Alzheimer’s disease: A systematic review and meta-analysis. Sci. Rep. 2016, 6, 32222. [Google Scholar] [CrossRef] [Green Version]
  17. Bagyinszky, E.; Youn, Y.C.; An, S.; Kim, S. The genetics of Alzheimer’s disease. Clin. Interv. Aging 2014, 9, 535–551. [Google Scholar] [CrossRef] [PubMed] [Green Version]
  18. Karch, C.M.; Goate, A.M. Alzheimer’s Disease Risk Genes and Mechanisms of Disease Pathogenesis. Biol. Psychiatry 2015, 77, 43–51. [Google Scholar] [CrossRef] [Green Version]
  19. Bertram, L.; Tanzi, R.E. The genetic epidemiology of neurodegenerative disease. J. Clin. Investig. 2005, 115, 1449–1457. [Google Scholar] [CrossRef] [Green Version]
  20. Sato, C.; Barthélemy, N.R.; Mawuenyega, K.G.; Patterson, B.W.; Gordon, B.A.; Jockel-Balsarotti, J.; Sullivan, M.; Crisp, M.J.; Kasten, T.; Kirmess, K.M.; et al. Tau Kinetics in Neurons and the Human Central Nervous System. Neuron 2018, 97, 1284–1298.e1287. [Google Scholar] [CrossRef] [Green Version]
  21. Hanseeuw, B.J.; Betensky, R.A.; Jacobs, H.I.L.; Schultz, A.P.; Sepulcre, J.; Becker, J.A.; Cosio, D.M.O.; Farrell, M.; Quiroz, Y.T.; Mormino, E.C.; et al. Association of Amyloid and Tau With Cognition in Preclinical Alzheimer Disease. JAMA Neurol. 2019, 76, 915. [Google Scholar] [CrossRef] [Green Version]
  22. Wang, Y.; Cai, L.; Zhou, K.; Cui, M.; Yao, S. Biodistribution and Dosimetry Evaluation for a Novel Tau Tracer [(18)F]-S16 in Healthy Volunteers and Its Application in Assessment of Tau Pathology in Alzheimer’s Disease. Front. Bioeng. Biotechnol. 2021, 9, 812818. [Google Scholar] [CrossRef]
  23. Gomar, J.J.; Tan, G.; Halpern, J.; Gordon, M.L.; Greenwald, B.; Koppel, J. Increased retention of tau PET ligand [(18)F]-AV1451 in Alzheimer’s Disease Psychosis. Transl. Psychiatry 2022, 12, 82. [Google Scholar] [CrossRef] [PubMed]
  24. Binder, J.; Ursu, O.; Bologa, C.; Jiang, S.; Maphis, N.; Dadras, S.; Chisholm, D.; Weick, J.; Myers, O.; Kumar, P.; et al. Machine learning prediction and tau-based screening identifies potential Alzheimer’s disease genes relevant to immunity. Commun. Biol. 2022, 5, 125. [Google Scholar] [CrossRef] [PubMed]
  25. Malek-Ahmadi, M.; Perez, S.E.; Chen, K.; Mufson, E.J. Braak Stage, Cerebral Amyloid Angiopathy, and Cognitive Decline in Early Alzheimer’s Disease. J. Alzheimers Dis. 2020, 74, 189–197. [Google Scholar] [CrossRef] [PubMed]
  26. MacDonald, A.B. Alzheimer’s disease Braak Stage progressions: Reexamined and redefined as Borrelia infection transmission through neural circuits. Med. Hypotheses 2007, 68, 1059–1064. [Google Scholar] [CrossRef]
  27. Reitz, C. Genetic diagnosis and prognosis of Alzheimer’s disease: Challenges and opportunities. Expert Rev. Mol. Diagn. 2015, 15, 339–348. [Google Scholar] [CrossRef] [Green Version]
  28. Albert, M.S.; Dekosky, S.T.; Dickson, D.; Dubois, B.; Feldman, H.H.; Fox, N.C.; Gamst, A.; Holtzman, D.M.; Jagust, W.J.; Petersen, R.C.; et al. The diagnosis of mild cognitive impairment due to Alzheimer’s disease: Recommendations from the National Institute on Aging-Alzheimer’s Association workgroups on diagnostic guidelines for Alzheimer’s disease. Alzheimer’s Dement. 2011, 7, 270–279. [Google Scholar] [CrossRef] [Green Version]
  29. Hane, F.T.; Robinson, M.; Lee, B.Y.; Bai, O.; Leonenko, Z.; Albert, M.S. Recent Progress in Alzheimer’s Disease Research, Part 3: Diagnosis and Treatment. J. Alzheimer’s Dis. 2017, 57, 645–665. [Google Scholar] [CrossRef] [Green Version]
  30. Olsson, B.; Lautner, R.; Andreasson, U.; Öhrfelt, A.; Portelius, E.; Bjerke, M.; Hölttä, M.; Rosén, C.; Olsson, C.; Strobel, G.; et al. CSF and blood biomarkers for the diagnosis of Alzheimer’s disease: A systematic review and meta-analysis. Lancet Neurol. 2016, 15, 673–684. [Google Scholar] [CrossRef]
  31. Craig-Schapiro, R.; Perrin, R.J.; Roe, C.M.; Xiong, C.; Carter, D.; Cairns, N.J.; Mintun, M.A.; Peskind, E.R.; Li, G.; Galasko, D.R.; et al. YKL-40: A Novel Prognostic Fluid Biomarker for Preclinical Alzheimer’s Disease. Biol. Psychiatry 2010, 68, 903–912. [Google Scholar] [CrossRef] [Green Version]
  32. Talwar, P.; Silla, Y.; Grover, S.; Gupta, M.; Agarwal, R.; Kushwaha, S.; Kukreti, R. Genomic convergence and network analysis approach to identify candidate genes in Alzheimer’s disease. BMC Genom. 2014, 15, 199. [Google Scholar] [CrossRef] [Green Version]
  33. Jung, Y.; Kim, Y.; Bhalla, M.; Lee, S.; Seo, J. Genomics: New Light on Alzheimer’s Disease Research. Int. J. Mol. Sci. 2018, 19, 3771. [Google Scholar] [CrossRef] [PubMed] [Green Version]
  34. Bellenguez, C.; Kucukali, F.; Jansen, I.E.; Kleineidam, L.; Moreno-Grau, S.; Amin, N.; Naj, A.C.; Campos-Martin, R.; Grenier-Boley, B.; Andrade, V.; et al. New insights into the genetic etiology of Alzheimer’s disease and related dementias. Nat. Genet. 2022, 54, 412–436. [Google Scholar] [CrossRef] [PubMed]
  35. Alves, S.R.; da Cruz, E.S.C.; Martins, I.; Henriques, A.G.; da Cruz, E.S.O.A.B. A Bioinformatics Approach Toward Unravelling the Synaptic Molecular Crosstalk Between Alzheimer’s Disease and Diabetes. J. Alzheimers Dis. 2022, 86, 1917–1933. [Google Scholar] [CrossRef] [PubMed]
  36. Liu, M.; Li, S.; Ma, C.; Wang, X.; Shuang, Y.; Lin, H.; Guan, Z.; Yang, L. Bioinformatics analysis indicates that microRNA-628-5p overexpression may alleviate Alzheimer’s disease by targeting TYROBP. Mol. Med. Rep. 2020, 23, 142. [Google Scholar] [CrossRef]
  37. Jha, S.K.; Jha, N.K.; Kumar, D.; Sharma, R.; Shrivastava, A.; Ambasta, R.K.; Kumar, P. Stress-Induced Synaptic Dysfunction and Neurotransmitter Release in Alzheimer’s Disease: Can Neurotransmitters and Neuromodulators be Potential Therapeutic Targets? J. Alzheimers Dis. 2017, 57, 1017–1039. [Google Scholar] [CrossRef]
  38. Morton, H.; Kshirsagar, S.; Orlov, E.; Bunquin, L.E.; Sawant, N.; Boleng, L.; George, M.; Basu, T.; Ramasubramanian, B.; Pradeepkiran, J.A.; et al. Defective mitophagy and synaptic degeneration in Alzheimer’s disease: Focus on aging, mitochondria and synapse. Free Radic. Biol. Med. 2021, 172, 652–667. [Google Scholar] [CrossRef]
  39. Sadleir, K.R.; Kandalepas, P.C.; Buggia-Prevot, V.; Nicholson, D.A.; Thinakaran, G.; Vassar, R. Presynaptic dystrophic neurites surrounding amyloid plaques are sites of microtubule disruption, BACE1 elevation, and increased Abeta generation in Alzheimer’s disease. Acta Neuropathol. 2016, 132, 235–256. [Google Scholar] [CrossRef] [Green Version]
  40. Ceylan, H. Integrated Bioinformatics Analysis to Identify Alternative Therapeutic Targets for Alzheimer’s Disease: Insights from a Synaptic Machinery Perspective. J. Mol. Neurosci. 2022, 72, 273–286. [Google Scholar] [CrossRef]
  41. Kawalia, S.B.; Raschka, T.; Naz, M.; de Matos Simoes, R.; Senger, P.; Hofmann-Apitius, M. Analytical Strategy to Prioritize Alzheimer’s Disease Candidate Genes in Gene Regulatory Networks Using Public Expression Data. J. Alzheimers Dis. 2017, 59, 1237–1254. [Google Scholar] [CrossRef] [Green Version]
  42. Hemenway, C.S.; Heitman, J. Calcineurin. Structure, function, and inhibition. Cell Biochem. Biophys. 1999, 30, 115–151. [Google Scholar] [CrossRef]
  43. Hemmings, B.A.; Adams-Pearson, C.; Maurer, F.; Muller, P.; Goris, J.; Merlevede, W.; Hofsteenge, J.; Stone, S.R. alpha- and beta-forms of the 65-kDa subunit of protein phosphatase 2A have a similar 39 amino acid repeating structure. Biochemistry 1990, 29, 3166–3173. [Google Scholar] [CrossRef] [PubMed]
  44. Hata, R.; Masumura, M.; Akatsu, H.; Li, F.; Fujita, H.; Nagai, Y.; Yamamoto, T.; Okada, H.; Kosaka, K.; Sakanaka, M.; et al. Up-regulation of calcineurin Abeta mRNA in the Alzheimer’s disease brain: Assessment by cDNA microarray. Biochem. Biophys. Res. Commun. 2001, 284, 310–316. [Google Scholar] [CrossRef] [PubMed]
  45. Gong, C.X.; Shaikh, S.; Wang, J.Z.; Zaidi, T.; Grundke-Iqbal, I.; Iqbal, K. Phosphatase activity toward abnormally phosphorylated tau: Decrease in Alzheimer disease brain. J. Neurochem. 1995, 65, 732–738. [Google Scholar] [CrossRef]
  46. Arif, M.; Wei, J.; Zhang, Q.; Liu, F.; Basurto-Islas, G.; Grundke-Iqbal, I.; Iqbal, K. Cytoplasmic retention of protein phosphatase 2A inhibitor 2 (I2PP2A) induces Alzheimer-like abnormal hyperphosphorylation of Tau. J. Biol. Chem. 2014, 289, 27677–27691. [Google Scholar] [CrossRef] [PubMed] [Green Version]
  47. Shibasaki, F.; McKeon, F. Calcineurin functions in Ca(2+)-activated cell death in mammalian cells. J. Cell Biol. 1995, 131, 735–743. [Google Scholar] [CrossRef] [PubMed]
  48. Asai, A.; Qiu, J.; Narita, Y.; Chi, S.; Saito, N.; Shinoura, N.; Hamada, H.; Kuchino, Y.; Kirino, T. High level calcineurin activity predisposes neuronal cells to apoptosis. J. Biol. Chem. 1999, 274, 34450–34458. [Google Scholar] [CrossRef] [PubMed] [Green Version]
  49. Utreja, S.; Miller, S.J.; Saunders, A. Calcineurin overexpression regulates APP metabolism. Adv. Alzheimer’s Dis. 2013, 2, 8. [Google Scholar] [CrossRef]
  50. Mori, F.; Tanji, K.; Yoshimoto, M.; Takahashi, H.; Wakabayashi, K. Immunohistochemical comparison of alpha- and beta-synuclein in adult rat central nervous system. Brain Res. 2002, 941, 118–126. [Google Scholar] [CrossRef]
  51. Oeckl, P.; Halbgebauer, S.; Anderl-Straub, S.; von Arnim, C.A.F.; Diehl-Schmid, J.; Froelich, L.; Grimmer, T.; Hausner, L.; Denk, J.; Jahn, H.; et al. Targeted Mass Spectrometry Suggests Beta-Synuclein as Synaptic Blood Marker in Alzheimer’s Disease. J. Proteome Res. 2020, 19, 1310–1318. [Google Scholar] [CrossRef]
  52. Galvin, J.E.; Uryu, K.; Lee, V.M.; Trojanowski, J.Q. Axon pathology in Parkinson’s disease and Lewy body dementia hippocampus contains alpha-, beta-, and gamma-synuclein. Proc. Natl. Acad. Sci. USA 1999, 96, 13450–13455. [Google Scholar] [CrossRef] [Green Version]
  53. Hayashi, J.; Carver, J.A. beta-Synuclein: An Enigmatic Protein with Diverse Functionality. Biomolecules 2022, 12, 142. [Google Scholar] [CrossRef] [PubMed]
  54. Halbgebauer, S.; Oeckl, P.; Steinacker, P.; Yilmazer-Hanke, D.; Anderl-Straub, S.; von Arnim, C.; Froelich, L.; Gomes, L.A.; Hausner, L.; Huss, A.; et al. Beta-synuclein in cerebrospinal fluid as an early diagnostic marker of Alzheimer’s disease. J. Neurol. Neurosurg. Psychiatry 2020, 92, 249–356. [Google Scholar] [CrossRef] [PubMed]
  55. Parfitt, D.A.; Michael, G.J.; Vermeulen, E.G.; Prodromou, N.V.; Webb, T.R.; Gallo, J.M.; Cheetham, M.E.; Nicoll, W.S.; Blatch, G.L.; Chapple, J.P. The ataxia protein sacsin is a functional co-chaperone that protects against polyglutamine-expanded ataxin-1. Hum. Mol. Genet. 2009, 18, 1556–1565. [Google Scholar] [CrossRef] [PubMed] [Green Version]
  56. Girard, M.; Lariviere, R.; Parfitt, D.A.; Deane, E.C.; Gaudet, R.; Nossova, N.; Blondeau, F.; Prenosil, G.; Vermeulen, E.G.; Duchen, M.R.; et al. Mitochondrial dysfunction and Purkinje cell loss in autosomal recessive spastic ataxia of Charlevoix-Saguenay (ARSACS). Proc. Natl. Acad. Sci. USA 2012, 109, 1661–1666. [Google Scholar] [CrossRef] [Green Version]
  57. Misrani, A.; Tabassum, S.; Yang, L. Mitochondrial Dysfunction and Oxidative Stress in Alzheimer’s Disease. Front. Aging Neurosci. 2021, 13, 617588. [Google Scholar] [CrossRef]
  58. Maroteaux, L.; Scheller, R.H. The rat brain synucleins; family of proteins transiently associated with neuronal membrane. Brain Res. Mol. Brain Res. 1991, 11, 335–343. [Google Scholar] [CrossRef]
  59. Iwai, A.; Masliah, E.; Yoshimoto, M.; Ge, N.; Flanagan, L.; de Silva, H.A.; Kittel, A.; Saitoh, T. The precursor protein of non-A beta component of Alzheimer’s disease amyloid is a presynaptic protein of the central nervous system. Neuron 1995, 14, 467–475. [Google Scholar] [CrossRef] [Green Version]
  60. Siddiqui, I.J.; Pervaiz, N.; Abbasi, A.A. The Parkinson Disease gene SNCA: Evolutionary and structural insights with pathological implication. Sci. Rep. 2016, 6, 24475. [Google Scholar] [CrossRef]
  61. Hamilton, R.L. Lewy bodies in Alzheimer’s disease: A neuropathological review of 145 cases using alpha-synuclein immunohistochemistry. Brain Pathol. 2000, 10, 378–384. [Google Scholar] [CrossRef]
  62. Arai, Y.; Yamazaki, M.; Mori, O.; Muramatsu, H.; Asano, G.; Katayama, Y. Alpha-synuclein-positive structures in cases with sporadic Alzheimer’s disease: Morphology and its relationship to tau aggregation. Brain Res. 2001, 888, 287–296. [Google Scholar] [CrossRef]
  63. Wirths, O.; Weickert, S.; Majtenyi, K.; Havas, L.; Kahle, P.J.; Okochi, M.; Haass, C.; Multhaup, G.; Beyreuther, K.; Bayer, T.A. Lewy body variant of Alzheimer’s disease: Alpha-synuclein in dystrophic neurites of A beta plaques. Neuroreport 2000, 11, 3737–3741. [Google Scholar] [CrossRef] [PubMed]
  64. Wang, H.; Stewart, T.; Toledo, J.B.; Ginghina, C.; Tang, L.; Atik, A.; Aro, P.; Shaw, L.M.; Trojanowski, J.Q.; Galasko, D.R.; et al. A Longitudinal Study of Total and Phosphorylated alpha-Synuclein with Other Biomarkers in Cerebrospinal Fluid of Alzheimer’s Disease and Mild Cognitive Impairment. J. Alzheimers Dis. 2018, 61, 1541–1553. [Google Scholar] [CrossRef] [PubMed] [Green Version]
  65. Baldacci, F.; Daniele, S.; Piccarducci, R.; Giampietri, L.; Pietrobono, D.; Giorgi, F.S.; Nicoletti, V.; Frosini, D.; Libertini, P.; Lo Gerfo, A.; et al. Potential Diagnostic Value of Red Blood Cells alpha-Synuclein Heteroaggregates in Alzheimer’s Disease. Mol. Neurobiol. 2019, 56, 6451–6459. [Google Scholar] [CrossRef] [PubMed]
  66. Kang, C.B.; Hong, Y.; Dhe-Paganon, S.; Yoon, H.S. FKBP family proteins: Immunophilins with versatile biological functions. Neurosignals 2008, 16, 318–325. [Google Scholar] [CrossRef]
  67. Jakob, R.P.; Zoldak, G.; Aumuller, T.; Schmid, F.X. Chaperone domains convert prolyl isomerases into generic catalysts of protein folding. Proc. Natl. Acad. Sci. USA 2009, 106, 20282–20287. [Google Scholar] [CrossRef] [Green Version]
  68. Gant, J.C.; Blalock, E.M.; Chen, K.C.; Kadish, I.; Porter, N.M.; Norris, C.M.; Thibault, O.; Landfield, P.W. FK506-binding protein 1b/12.6: A key to aging-related hippocampal Ca2+ dysregulation? Eur. J. Pharmacol. 2014, 739, 74–82. [Google Scholar] [CrossRef] [Green Version]
  69. Gant, J.C.; Chen, K.C.; Kadish, I.; Blalock, E.M.; Thibault, O.; Porter, N.M.; Landfield, P.W. Reversal of Aging-Related Neuronal Ca2+ Dysregulation and Cognitive Impairment by Delivery of a Transgene Encoding FK506-Binding Protein 12.6/1b to the hippocampus. J. Neurosci. 2015, 35, 10878–10887. [Google Scholar] [CrossRef] [Green Version]
  70. Hu, X.; Mullins, R.D. LC3 and STRAP regulate actin filament assembly by JMY during autophagosome formation. J. Cell Biol. 2019, 218, 251–266. [Google Scholar] [CrossRef] [Green Version]
  71. Sterner, K.N.; McGowen, M.R.; Chugani, H.T.; Tarca, A.L.; Sherwood, C.C.; Hof, P.R.; Kuzawa, C.W.; Boddy, A.M.; Raaum, R.L.; Weckle, A.; et al. Characterization of human cortical gene expression in relation to glucose utilization. Am. J. Hum. Biol. 2013, 25, 418–430. [Google Scholar] [CrossRef]
  72. Carroll, E.A.; Gerrelli, D.; Gasca, S.; Berg, E.; Beier, D.R.; Copp, A.J.; Klingensmith, J. Cordon-bleu is a conserved gene involved in neural tube formation. Dev. Biol. 2003, 262, 16–31. [Google Scholar] [CrossRef] [Green Version]
  73. Ravanelli, A.M.; Klingensmith, J. The actin nucleator Cordon-bleu is required for development of motile cilia in zebrafish. Dev. Biol. 2011, 350, 101–111. [Google Scholar] [CrossRef] [PubMed] [Green Version]
  74. Mancina, R.M.; Burza, M.A.; Maglio, C.; Pirazzi, C.; Sentinelli, F.; Incani, M.; Montalcini, T.; Pujia, A.; Congiu, T.; Loche, S.; et al. The COBLL1 C allele is associated with lower serum insulin levels and lower insulin resistance in overweight and obese children. Diabetes Metab. Res. Rev. 2013, 29, 413–416. [Google Scholar] [CrossRef] [PubMed] [Green Version]
  75. Kim, W.J.; Lee, S.J.; Lee, E.; Lee, E.Y.; Han, K. Risk of Incident Dementia According to Glycemic Status and Comorbidities of Hyperglycemia: A Nationwide Population-Based Cohort Study. Diabetes Care 2022, 45, 134–141. [Google Scholar] [CrossRef] [PubMed]
  76. Sun, Y.; Chen, G.; Liu, Z.; Yu, L.; Shang, Y. A bioinformatics analysis to identify novel biomarkers for prognosis of pulmonary tuberculosis. BMC Pulm. Med. 2020, 20, 279. [Google Scholar] [CrossRef]
  77. Zhao, X.M.; Li, Y.B.; Sun, P.; Pu, Y.D.; Shan, M.J.; Zhang, Y.M. Bioinformatics analysis of key biomarkers for retinoblastoma. J. Int. Med. Res. 2021, 49, 3000605211022210. [Google Scholar] [CrossRef]
  78. Wei, D.; Li, R.; Si, T.; He, H.; Wu, W. Screening and bioinformatics analysis of key biomarkers in acute myocardial infarction. Pteridines 2021, 32, 79–92. [Google Scholar] [CrossRef]
  79. Yu, W.; Yu, W.; Yang, Y.; Lu, Y. Exploring the Key Genes and Identification of Potential Diagnosis Biomarkers in Alzheimer’ s Disease Using Bioinformatics Analysis. Front. Aging Neurosci. 2021, 13, 602781. [Google Scholar] [CrossRef]
Figure 1. Flowchart of bioinformatics analysis performed in this study with detailed software, database, and tools used for each step (AD, Alzheimer´s disease; GEO, Gene Expression Omnibus; PCA, principal component analysis; DEA, differential expression analysis; DEGs, differentially expressed genes; FEA, functional enrichment analysis; GO, gene ontology; BP, biological processes; CC, cellular component; MF, molecular function).
Diagnostics 12 01165 g001
Figure 2. Homogenization of data, distribution histogram of logarithmic-scale expression after processing data, and Tukey diagrams with expression value distribution in a logarithmic scale of each subject in both groups (CNTL and AD). Data of (A) blood tissue from database GSE97760, (B) brain tissue from database GSE84422-GPL96, and (C) brain tissue from database GSE132903.
Diagnostics 12 01165 g002
Figure 3. Principal component analysis (PCA) of processed data (CNTL and AD). Data of (A) blood database GSE97760, (B) brain database GSE84422-GPL96, and (C) brain database GSE132903.
Diagnostics 12 01165 g003
Figure 4. Volcano plot of up- and downregulated differentially expressed genes (DEGs) when comparing Alzheimer’s disease (AD) samples with healthy control samples (CNTRL), and heat map with logarithmic scale expression of DEGs in AD and CNTRL samples. CNTRL in blue, AD in red, purple line = median value, principal component 1, Dim1; principal component 2, Dim2; not significant, NS; genes with −0.5 > fold change < 0.5 (green dots); genes with −0.5 > fold change < 0.5 and adjusted p value (adj.P.val) < 0.05 (red dots). Data of (A) blood GSE97760, (B) brain GSE84422-GPL96, and (C) brain GSE132903.
Diagnostics 12 01165 g004
Figure 5. Bar plots show biological process (BP) and most enriched GO terms with p-value < 0.05. Color scale represents p-value; X axis indicates number of genes in each GO term. Data of (A) blood GSE97760, (B) brain database GSE84422-GPL96, and (C) brain database GSE132903.
Diagnostics 12 01165 g005
Figure 6. Bar plots show molecular functions (MFs); most enriched GO terms with p-value < 0.05. Color scale represents p-value; X axis shows the number of genes in each GO term. Data of (A) blood database GSE97760, (B) brain database GSE84422-GPL96, and (C) brain database GSE132903.
Diagnostics 12 01165 g006
Figure 7. Bar plots show cell components (CC); most enriched GO terms with p-value < 0.05. Color scale represents p-value; X axis shows the number of genes in each GO term. Data of (A) blood database GSE97760, (B) brain database GSE84422-GPL96, and (C) brain database GSE132903.
Diagnostics 12 01165 g007
Figure 8. Venn diagram of overlap between genes from differential expression analysis and weighted gene correlation network analysis for AD phenotype (DEGs+WGCNA), previously reported differentially expressed genes, and list of mapped genes obtained from genomewide association studies (AD GWAS); intersection (∩). (A) GSE97760 ∩ GSE84422-GPL96; (B) GSE97760 ∩ GSE132903.
Diagnostics 12 01165 g008
Table 1. Selected database characteristics.
GEO IDTissueSamplesConditionRacePublication and Last Update Date
GSE97760Peripheral bloodCNTRL: 10
AD: 9
CNTRL: healthy
AD: sporadic/advanced
CNTRL: not provided
AD: not provided
Published on 14 April 2017/updated on 27 March 2018
GSE84422-GPL96HippocampusCNTRL: 4
AD: 9
CNTRL: healthy
AD: sporadic/definite
CNTRL: 4 white
AD: 8 white/1black
Published on 19 August 2016/updated on 26 June 2019
GSE132903Middle temporal gyrusCNTRL: 8
AD: 8
CNTRL: healthy
AD: sporadic/advanced
CNTRL: not provided
AD: not provided
Updated on 18 September 2019
Publisher’s Note: MDPI stays neutral with regard to jurisdictional claims in published maps and institutional affiliations.

