Article

Bio-Imaging-Based Machine Learning Algorithm for Breast Cancer Detection

by
Sadia Safdar
1,
Muhammad Rizwan
1,
Thippa Reddy Gadekallu
2,*,
Abdul Rehman Javed
3,
Mohammad Khalid Imam Rahmani
4,
Khurram Jawad
4,* and
Surbhi Bhatia
5
1
Department of Computer Science, Kinnaird College for Women, Lahore 44000, Pakistan
2
School of Information Technology and Engineering, Vellore Institute of Technology, Vellore 632014, India
3
Department of Cyber Security, Air University, Islamabad 44000, Pakistan
4
College of Computing and Informatics, Saudi Electronic University, Riyadh 11673, Saudi Arabia
5
Department of Information Systems, College of Computer Science & Information Technology, King Faisal University, Hofuf 31982, Saudi Arabia
*
Authors to whom correspondence should be addressed.
Diagnostics 2022, 12(5), 1134; https://doi.org/10.3390/diagnostics12051134
Submission received: 2 March 2022 / Revised: 26 April 2022 / Accepted: 27 April 2022 / Published: 3 May 2022
(This article belongs to the Special Issue AI as a Tool to Improve Hybrid Imaging in Cancer)

Abstract

:
Breast cancer is one of the most widespread diseases in women worldwide. It leads to the second-largest mortality rate in women, especially in European countries. It occurs when malignant lumps that are cancerous start to grow in the breast cells. Accurate and early diagnosis can help in increasing survival rates against this disease. A computer-aided detection (CAD) system is necessary for radiologists to differentiate between normal and abnormal cell growth. This research consists of two parts; the first part involves a brief overview of the different image modalities, using a wide range of research databases to source information such as ultrasound, histography, and mammography to access various publications. The second part evaluates different machine learning techniques used to estimate breast cancer recurrence rates. The first step is to perform preprocessing, including eliminating missing values, data noise, and transformation. The dataset is divided as follows: 60% of the dataset is used for training, and the rest, 40%, is used for testing. We focus on minimizing type one false-positive rate (FPR) and type two false-negative rate (FNR) errors to improve accuracy and sensitivity. Our proposed model uses machine learning techniques such as support vector machine (SVM), logistic regression (LR), and K-nearest neighbor (KNN) to achieve better accuracy in breast cancer classification. Furthermore, we attain the highest accuracy of 97.7% with 0.01 FPR, 0.03 FNR, and an area under the ROC curve (AUC) score of 0.99. The results show that our proposed model successfully classifies breast tumors while overcoming previous research limitations. Finally, we summarize the paper with the future trends and challenges of the classification and segmentation in breast cancer detection.

1. Introduction

Cells are the building blocks of human tissues, and tissues eventually form organs. Every cell has some functions to perform; once their work is done, they die. However, sometimes, cells do not die after their performance due to internal and external issues, and new tissues are formed without need. This abnormal division of cells or production of extra cells causes tumors. Different factors such as alcohol consumption, obesity, birth control pills or injections, estrogen, progesterone, diethylstilbestrol during pregnancy, radiation treatment, and inheritance mutations can cause breast cancer. In the same manner, some factors can reduce the chances of breast cancer, such as breastfeeding, early age pregnancy, and hormonal balance [1]. The uncontrolled division of cells can occur in any body part, but here, we discuss the cells in the glands that produce milk (called lobules). Their abnormal growth causes breast cancer [2]. New research shows that breast cancer is about 23% in females out of all cancer types, which is much more rational than in males. Every eighth or ninth female is exposed to breast cancer at any stage of their life in Europe [3]. According to the World Health Organization (WHO), early cancer detection considerably increases the probability of making suitable decisions for a successful treatment plan [
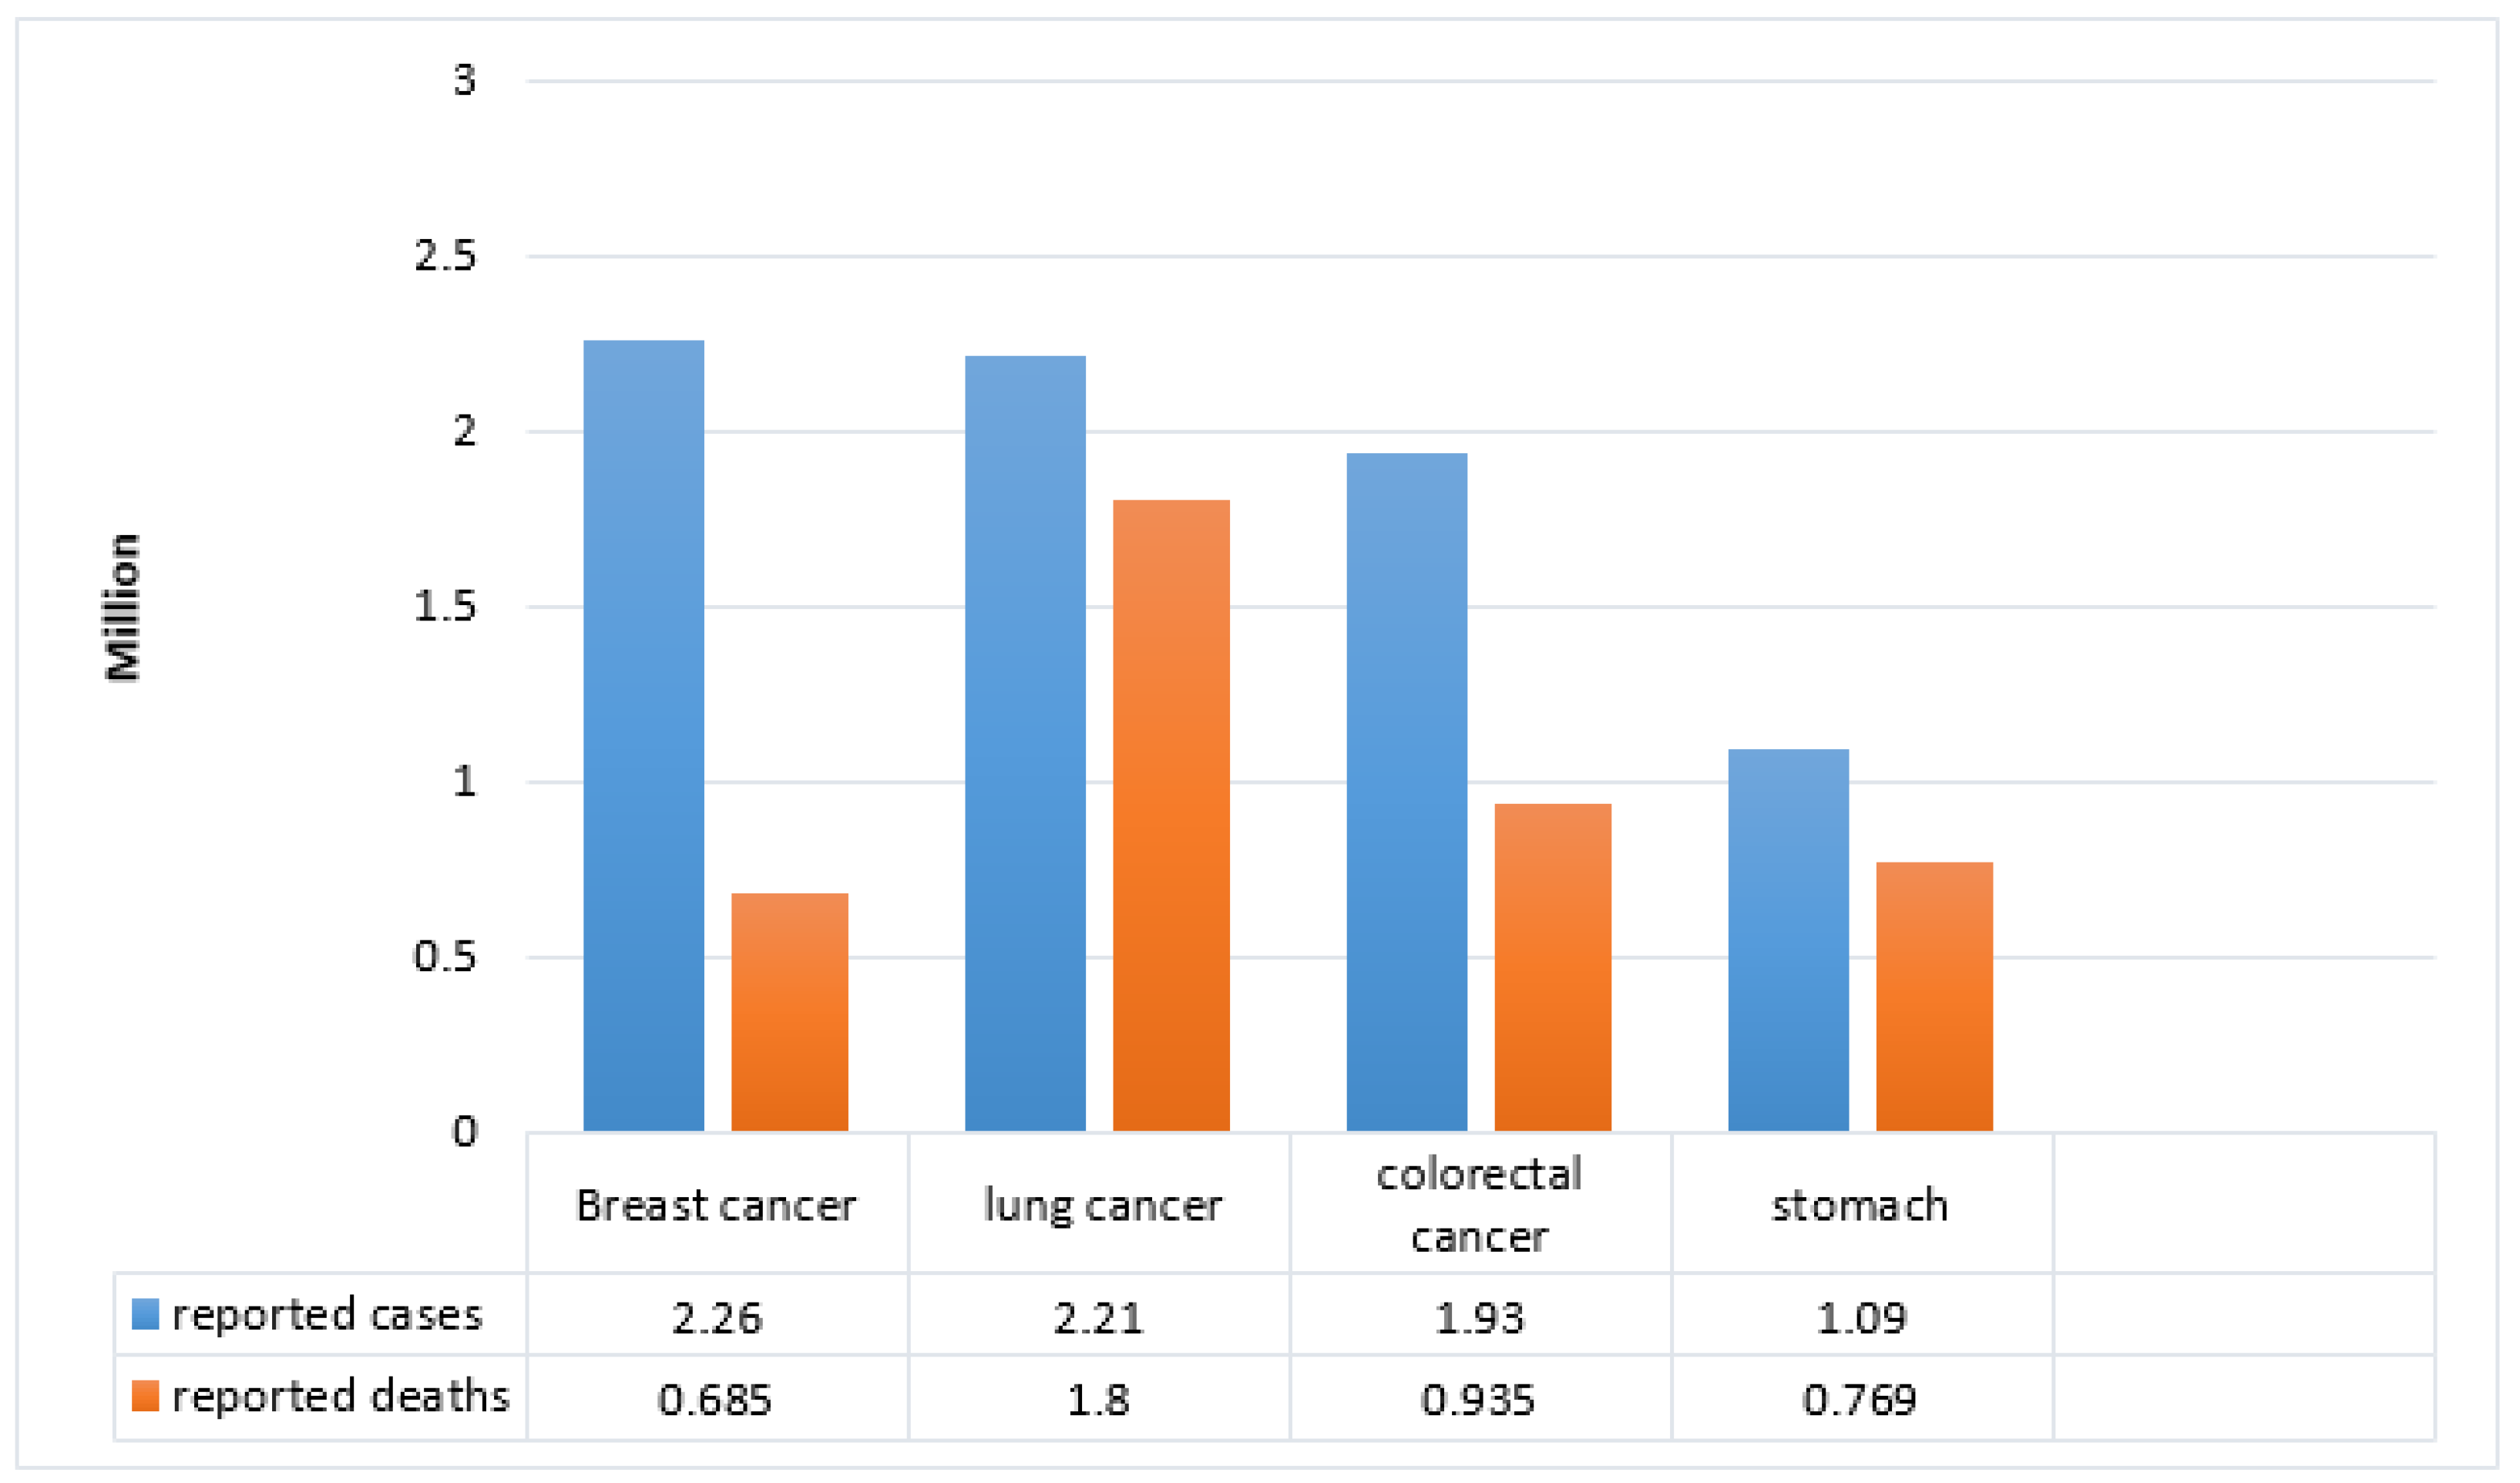
4]. There are different types of cancers worldwide causing a considerable rate of annual deaths as illustrated [5] in Figure 1.
Breast cancer has a high mortality rate; early detection is required to avoid this. Early diagnosis of breast mass can improve the survival rate in women [6]. Therefore, automatic systems to improve breast cancer masses detectors are becoming better day by day to help radiologists [7]. Our research aims to facilitate physicians to diagnose breast cancer at its early stages. In the past, many AI techniques have been applied to classify tumors. Our contribution improves the detection accuracy rate using the SVM, which helps the healthcare system detect tumors in the initial stages to avoid further complications [8]. Below are the key contributions of this research.
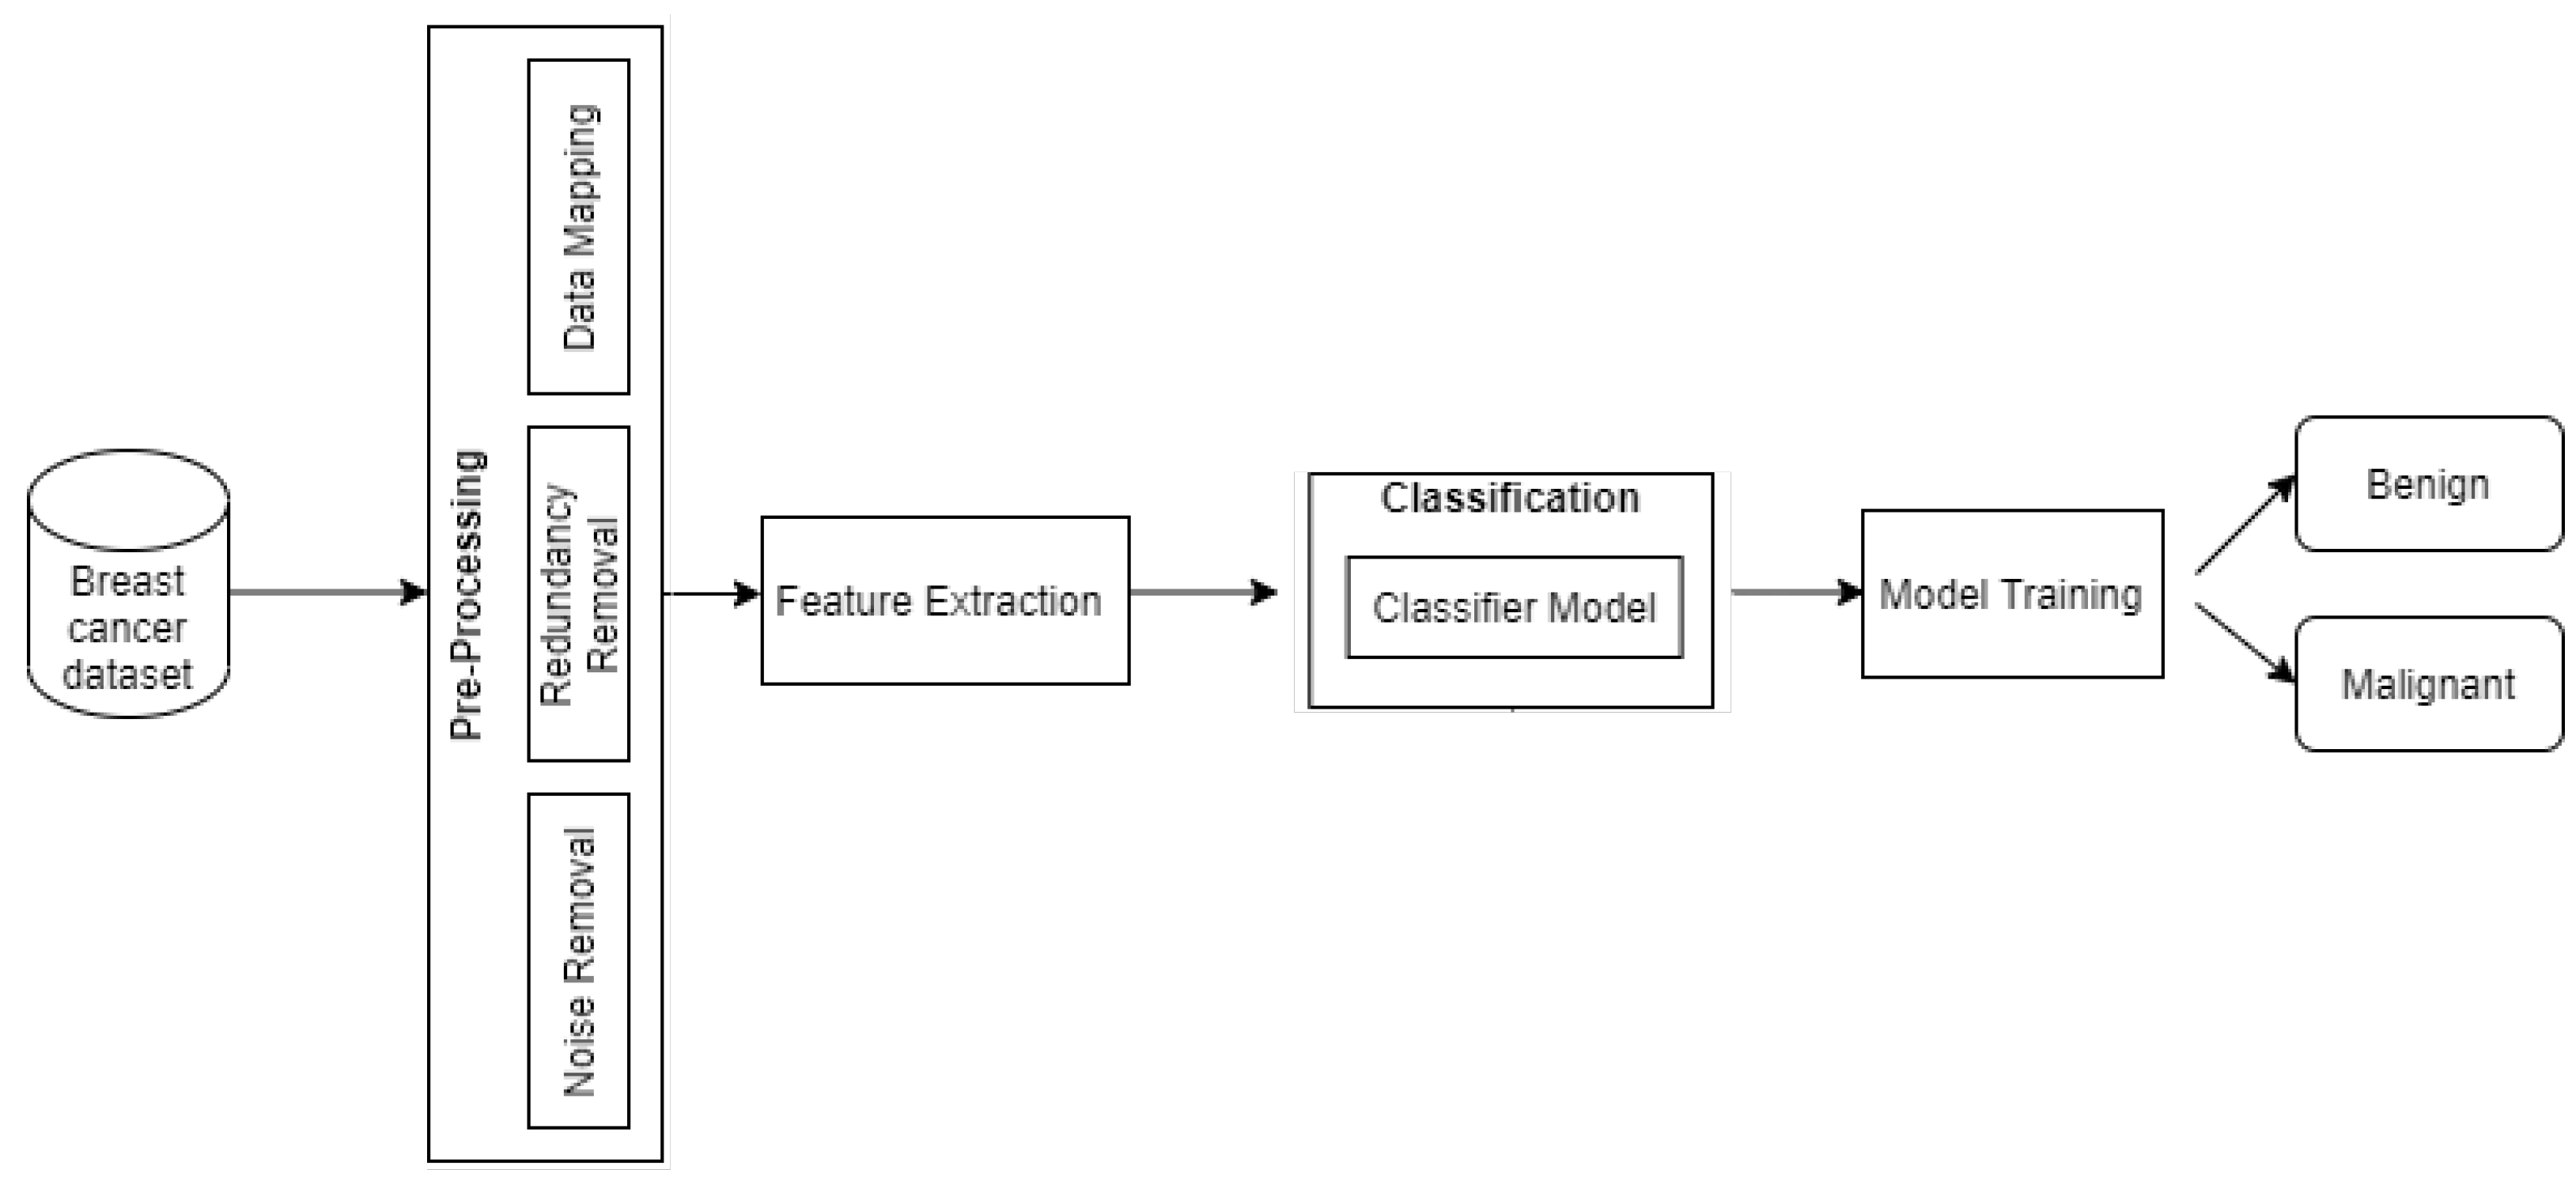
  • We apply preprocessing techniques and segmentation to patient data collected from the mammograms’ Breast Cancer Wisconsin Diagnostic Dataset (BCWD).
  • We bring forth the classification of patient’s data (cancerous or non-cancerous) by using the SVM classifier.
  • We contribute to precisely detecting the Breast Cancer stage (Benign or Malignant) by using SVM, KNN, and LR.
  • We reduce the false-negative rate (FNR) and false-positive rate (FPR) without reducing the degree of precision and accuracy.
  • We compare our proposed results with state-of-the-art models to assess performance.
  • We practically implement the simulations for data classification through SVM, KNN, and LR, furthermore helping to increase the accuracy rate by approximately 97.7 % with an error rate of  2.3%.
The rest of the paper is organized as follows. Section 3 presents related work that is done in this field by researchers. Section 4 explains the whole proposed methodology, Section 5 explains SVM, KNN, and LR in detail with simulation results and discussion. Finally, the paper is concluded in Section 6.

2. Background

Breast tumors are benign (not harmful) and malignant (cancer, harmful). Benign tumors are not harmful usually. It does not diffuse to other parts or organs of the body. It exceptionally invades the neighboring cells and tissues. It usually does not grow back and is removable by proper chemotherapy or surgery. Malignant tumors are hazardous to life as they can penetrate the neighboring cells and tissues. They can move to the other parts of the body as well, which can lead to death [9].

2.1. Medical Images

Working on digital images is a challenging task [10,11,12,13]. Digital Image processing automation is used extensively in medical technology, but its crucial threat is that mortality is elevated due to cancer. To improve the early diagnosis of tumors, a dataset of medical images is required to train the system for cancer detection. The suspected tissue images are segmented by dividing the image-based data into different attributes such as texture, color, and intensity [14]. Medical images are used to obtain helpful information such as the location and size of any disease in the human body. It helps to find the exact location of pectoral tumor muscles and damaged tissues [15].

Types of Medical Images

Researchers use different medical images (i.e., thermograph, magnetic resonance imaging (MRI), X-ray mammograms, ultrasound images, histopathological images) to train the algorithms to diagnose the tumor.
Thermography is an advanced and cost-effective method for screening breast cells that do not allow the body cells to face ionizing radiation. Cancer symptoms include angiogenesis, swelling, nitric oxide vasodilatory phenomena, and estrogen. Thermography plays a vital role in improving breast cancer detection and classification [16]. The patients who have high risks of tumor are given magnetic resonance imaging (MRI), where the other imaging techniques fail to detect any abnormality. It is not very frequently used due to its high cost. Mammography is a very commonly used technique for tissue screening to diagnose a tumor. The golden way of screening the breast is mammography in the past, but its interpretation is problematic because it specifies tiny, subtle features and malignancies in patients [17]. This screening technique is not effective on density breasts. Young females have more risk of radiation-induced breast cancer because their undifferentiated cells are prone to be influenced by ionizing radiation as compared to old females [18]. For the detection and diagnosis of tumors in the dense breast, ultrasound is subordinate to mammographic screening. Therefore, results are dependent on tumor size, breast density, tools, and the experience of physicians [19]. Different techniques such as MRI, ultrasound, mammography, and thermography are done in clinical analysis. Moreover, in histopathology, suspected patients undergo a needle tissue biopsy. Pathologists take hematoxylin and eosin (H&E) stained tissue samples of patients and investigate those tissues under the microscope. This analysis is hectic and time consuming. That is why in the last decade, computer-aided diagnosis (CAD) systems have been automated, with advanced techniques to diagnose tumors [20].

2.2. Machine Learning Techniques

Machine learning is a branch of artificial intelligence (AI) in which different algorithms are used to differentiate normal and tumor cells. Some techniques are SVM, KNN, LR, Naïve Bayesian network, artificial neural network, decision tree, and random forest. Machine learning has been used in many healthcare applications such as physical activity recognition and cognitive health assessment [21,22,23,24].

2.3. Deep Learning Techniques

Deep learning is a sub-branch of machine learning that eventually relates to artificial intelligence (AI). Deep learning has been used in many healthcare applications such as dementia detection and cognitive health assessment [25,26,27,28,29,30,31]. Some techniques distinguish tumor cells from normal cells, such as convolutional neural networks (CNN), RNN, and DNN. These techniques can be used in the segmentation and classification of normal and abnormal breast cells. This paper initially reviews the methods for the effective segmentation and classification of tumors used by researchers and proposes a model for classification using SVM, KNN, and LR. To enhance accuracy in cancer detection, different AI techniques are experimented with to obtain accurate decisions about disease stages that can be minor or acute. Different AI techniques have been developed [32,33] for precise automated diagnosis. Some of the most effective techniques are CNN, SVM, and genetic machine learning algorithms. Researchers are working hard to merge two or more artificial techniques from the last decade to produce new hybrid techniques for better accuracy.
Different AI techniques are applied these days to improve the flaws of tumor detection. SVM, KNN, and LR are effective combinations to classify diseases. These techniques are applied to multidimensional datasets to predict precisely whether the tissues or cells are healthy or infected. The collected raw data are processed and stored in a database. Then, we apply different classifier algorithms to that dataset to obtain better results. The main concern of this research is to differentiate between benign and malignant tumors. Accordingly, we propose KNN, SVM, and LR to differentiate benign from malignant tumors. This research will help radiologists, physicians, and health consultants to diagnose the initial stage, Benign, or acute stage, Malignant. The whole experimentation is done on the Breast Cancer Wisconsin (Diagnostic) Dataset collected from the Kaggle Website.

3. Related Works

Breast cancer is a deadly disease in the present era. Different researchers are working hard to help diagnose it at the initial stage to avoid an acute phase. In this classification field, CNN and SVM are essential to help the researchers to classify patients’ data. Here, we overview different machine learning and deep learning techniques on different bio-images. However, our primary focus is on mammographic images.
The authors in [34] have proposed a cloud and decision-based fusion AI system using a hierarchical DL (CF-BCP) model to predict breast cancer. This simulation uses MATLAB (2019a) and deep learning techniques, i.e., CNN and DELM on 7909 and 569 fused samples. Their model attains 97.975% accuracy in the detection of breast cancer. The research in [35] analyzed SVM, KNN, LR, random forest, naïve Bayes, and decision tree techniques on a dataset from Dr. William H. Walberg of Wisconsin Hospital breast cancer in the early stages. The LR model gave the best result with 98.1% accuracy. The study in [36] compares different classification methods such as KNN, decision tree, SVM, Bayesian network, and naïve Bayes under the WEKA environment to check the best accuracy. The overall experiment shows that Bayesian network gave the highest accuracy with fewer features. Still, the highest accuracy for the more featured dataset was given by SVM. The study in [37] reviews several segmentation techniques on ultrasound and mammographic images. For this, preprocessing is necessary to remove the redundant data. High-quality data will help achieve the best possible accuracy in classifying whether the cancer is benign or malignant.
The authors in [38] proposed a model based on the local pixel information and neural network for segmentation and extraction of the region of interest (ROI) on a dataset having 250 ultrasound images using machine learning ANN and BPNN to differentiate benign and malignant tumors. They have done breast cancer classification on two datasets, the first having 380 and the second having 163 ultrasound images from University Hospital, Amman, Jordan. They used CNN and SVM classifiers for the feature extraction and classification of breast cancer. They successfully achieved the performance of 94.2% [39]. The proposed work in [40] classifies breast cancer that is benign or malignant. The authors used 151 images, out of which 79 images are benign tumors (BIRADS 2–3) and 72 are malignant tumors (BIRADS 4–5) for the experiment. They used CAD systems, specifically random forest (RF), SVM, CNN, and conducted Segmentation, Feature Extraction, and Classification, attaining the accuracy of 80.00%, 77.78%, and 85.42%, respectively. Ultrasound-based existing research is mentioned in Table 1.
The authors in [41] proposed a parallel model including CNN and RNN to classify hematoxylin–eosin-stained breast biopsy images. They experiment on three datasets: BACH2018 has 400 images. Bio-imaging2015 has 249 histology images, and Extended Bioimaging2015 includes 1319 images to classify normal tissues, benign lesions, carcinomas, and invasive carcinomas. The authors in [42] have proposed a new hybrid convolutional and recurrent deep neural network for the classification of breast cancer. They used recurrent neural network (RNN), CNN, SVM, and NVIDIA GPUs on an Image Net dataset, ICIAR, ISBI, ICPR, and MICCAI, having 3771 images, 249 images from Bioimaging2015, and 400 histopathological images in 2019. The highest accuracy achieved was 91.3%. The authors in [43] have introduced a novel transfer learning-based approach to automate normal tissues, benign lesions, and malignant lesions. They applied the deep neural network ResNet-18 and enhanced its adoption by using global contrast normalization (GCN) on data augmentation. They used DNN and softmax classifier on 7909 histopathological images from Anatomy and Cytopathology (P&D) Lab, Brazil, and conducted binary classification. The authors in [44] used Breast Cancer Computer-Aided Diagnosis (BC-CAD) and deep neural network (DNN) and RNN binary classification techniques on 92 histopathological images from Wisconsin UCI to differentiate normal and tumor cells. The proposed methodology in [45] focused on CNN, ML, DL, IHC-Net, a combination of naïve Bayes, SVM, and RFD as segmentation, feature extraction, and classification techniques. They used a dataset of 400 histopathological images and finally obtained the best accuracy (98.24%). The classifier with hand-engineered features gave more performance with a 98.41% F-score and 97.66%. Histopathological image dataset-based research and its results are given in Table 2.
SVM is used to obtain better results in classification in [46]. CAD systems follow two segmentation methods. First, one region of interest (ROI) is detected, and second, they use a threshold. The author used a DCNN architecture named AlexNet to classify two classes. They used y(DDSM) and DDSM (CBIS-DDSM) datasets. AUC obtained an accuracy of about 88% using the (CBIS-DDSM) dataset, the accuracy of DCNN also improved to 73.6% and overall AUC with the involvement of SVM obtained an accuracy of 94%. The work in [47] applied the CNN technique to train two datasets: the Full-Field Digital Mammography Dataset (FFDM) and the Digital Dataset of Screening Mammography (DDSM), the latter having 14,860 Mammographic images. CNN, AlexNet, and ImageNet are used to classify benign and malignant.
The authors in [48] worked on the segmentation and classification of breast cancer using DL, SVM Soft-Max function, and Sigmoid function on a dataset of 400 mammographic images. They found that SVM showed better results than DL techniques. The authors in [49] proposed different segmentation techniques such as HDF K-means clustering, OKFCA, OKFC algorithm, fuzzy and region growing technique, and AOKFCA algorithm on a dataset of 322 mammographic images from the Society (MIAS) database. The whole experiment shows that MFKFCS produces the highest accuracy of 80.42%. Mammographic dataset-based research and its results are given in Table 3.
Thermograms are also used in breast cancer classification. The authors have used a public dataset containing 146 breast thermograms (117 benign and 29 malignant) and achieved a sensitivity of around (79.86%) [51]. The authors in [50] proposed a method to detect breast cancer using mammograms. This study employs preprocessing, segmentation, feature extraction, and classification. Breast cancer is classified using LR, AdaBoost, decision tree, KNN, and random forest classifiers. The obtained accuracy was 90%, 85%, 57%, 54%, 76%, and 61% for SVM, LR, AdaBoost, decision tree, KNN, and random forest classifiers, respectively. Overall, SVM achieved the highest accuracy among others.
From the above literature review, mammographic bio-imaging shows low response accuracy compared to histopathological bio-imaging. We propose a model by applying machine learning techniques such as SVM, KNN, and LR on mammographic bio-imaging to enhance the accuracy of breast cancer detection. This research will help the radiologists and physicians diagnose this disease, and accordingly, they will prescribe precautions and medication to the patients.

4. Proposed Methodology

This study detects masses in mammograms and identifies benign and malignant tissues. This paper proposes a new CAD system. It involves preprocessing of the dataset, feature extraction, and classification. The confusion matrix, the receiver-operating curve (ROC), and the AUC evaluate a classifier for precise accuracy. The whole process of segmentation and classification is mentioned in Figure 2.

4.1. Dataset Description

The Breast Cancer Wisconsin Diagnostic Dataset (BCWD) is collected from the Kaggle Website (https://www.kaggle.com/uciml/breast-cancer-wisconsin-data accessed on 1 January 2022). This breast cancer database was initially obtained from Madison University of Wisconsin Hospitals. It is mammographic data that contain attributes such as clump thickness, cell size uniformity, cell shape, marginal adhesion, single epithelial cell size, bare nuclei, bland chromatin, normal nucleoli, and mitoses. The dataset contains 699 instances from different patients. It combines eight different data groups containing two classes with 458 benign and 241 malignant instances. We divide the data into two parts, 60% as training data and the remaining 40% as test data, and conduct simulation accordingly.

4.2. Preprocessing

As the collected data need refinement, different techniques are implemented to improve the raw data to obtain better results. There are two main steps: Extraction and Classification to convert raw data into compelling, valuable data. Preprocessing consists of the following steps. Data transformation involves converting the data files that are understandable to human beings. File format, data magnification, and data mapping are helpful to enhance accuracy. We used normalization to remove noise and data redundancy in our scenario and map the dataset. Data noise is removed by using a Gaussian filter. Data redundancy and inconsistency are also removed manually. These factors affect the overall accuracy of any model. Enigmatic and missing values cause inaccuracy. We stabilize the data flaws manually by inserting mean and median values and eliminating the record in which 60% of values are missing.

4.3. Classification

Classification is used to differentiate benign from malignant tumors to treat patients accordingly. Data mining is a required field to analyze data and conduct estimations [52]. Many issues are resolved during run time. Extensive data mining is used effectively in pattern recognition. Text mining is done in feature selection. For breast cancer detection, the following parameters are used: Uniformity-cell-shape, Uniformity-cell-size, Bare-nuclei, Bland chromatin, the thickness of clumps, and normal-nucleoli. We use 5-folds cross-validation in all models on training data using MATLAB to obtain trained and give better accuracy on test data. Then, we conduct a simulation of test data. The above attributes help to attain high accuracy in test data. Different classification techniques in machine learning can obtain the highest accuracy. All three techniques that are used in this simulation are given below.

4.4. K-Nearest Neighbor Model

KNN is a classification algorithm in machine learning that predicts the accuracy of disease detection. All KNN models such as Fine, Medium, Coarse, Cosine, Cosine, and Weighted KNN are used in the simulation.
  • Find the K, for instance, ( x i , t i ) nearest to the test instance x.
  • Output of classification is majority class, as shown in Equation (1).
Y = a γ g max t z r = 1 k δ ( t z , t γ )
The implementation of KNN on medical data goes through a series of steps that are mentioned in the below Algorithm 1.
Algorithm 1 KNN Algorithm to Differentiate Benign or Malignant Tumor
1:
Identification: Disease
2:
Dataset: WBCD from Kaggle
3:
Build the training normal dataset D; D ← Dataset (699 entries)
4:
Input: Data ← Text
5:
Output: Normal cells, Benign or Malignant
6:
for each instance X in the test data do
7:
   if X has an unknown system call then
8:
     X is abnormal
9:
   else
10:
     for each instance D_j   in   training   data do
11:
        calculate sim(X, D_j)
12:
        if sim(X, D_j)   equals   to   1.0 then
13:
          X is normal; exist
14:
          Find k biggest scores of sim(X,D)
15:
          calculate sim-avg for k-nearest neighbors
16:
        end if
17:
     end for
18:
   end if
19:
end for
20:
if sim-avg is greater than threshold then
21:
   X is normal
22:
else
23:
   X is abnormal
24:
end if

4.5. Logistic Regression Model

This algorithm consists of only one model to check the accuracy rate of the disease. Implementation of the LR model on medical data goes through the following steps that are mentioned in the below Algorithm 2.
Algorithm 2 Logistic regression Algorithm to differentiate Benign or Malignant tumor
1:
Identification: Disease
2:
Data-set: WBCD from Kaggle
3:
D ← Dataset (699 entries)
4:
Input: Training set x 1 , y 1 , , x m , y m , learning rate η > 0 , maximum number of iterations T, initial hyper-plane w 1 , initial bias b 1
5:
Set w ˜ 1 = b 1 w 1 R d + 1
6:
Construct augmented training features: x ˜ 1 , , x ¯ m
7:
for  t = 1 , 2 , , T   do
8:
   Calculate value of objective function: o b j t = i = 11 m ln 1 + exp y i w ˜ t x ¯ i
9:
   Compute gradient: g ˜ t = i = 1 m y i 1 + exp x ̲ i , x ¯ i R d + 1
10:
   Gradient descent step: w ˜ t + 1 = w ˜ t η g t
11:
end for
12:
return Output: Extract w T + 1 and b T + 1 from w ¯ T + 1 and return them
Here, we throw light on the overall working of this algorithm as mentioned in the following Equations (2)–(6).
Odds Ratio = log P 1 P = m x + b
P 1 P = e m x + b
J ( θ ) = y · log ( y ^ ) + ( 1 y ) · log ( 1 y ^ ) n
where
y ^ = 1 1 + e m x + b
For
y = 0 y = 1

4.6. Support Vector Machine Model

The segmentation of breast cancer is used to eliminate various abnormalities from data. In this step, data are classified as either benign or malignant based on its features. SVM takes instances and assigns them a specific class for proper evaluation. Data ambiguity is eliminated, and cases are evaluated to predict accurate results. The resolution is enhanced and removes the unwanted pixels by image masking. The gray-scale conversion eventually sets the image size to check whether it is according to the threshold. This process of normalization is completed, and the threshold is calculated by using the methodology of Otsu threshold [53]. SVM implementation on medical data goes through the different steps mentioned in the Algorithm 3.
There are numerous classifiers, and SVM is one of them. All SVM models such as Linear, Quadratic, Cubic, Fine Gaussian, Medium Gaussian, and Coarse Gaussian SVM are used in the simulation. We train the dataset and evaluate the results accordingly in MATLAB. Here, we explain the SVM algorithm, and its working is given below in Equations (7)–(14).
f ( x ) = sign λ . y . K x i · x j
K x i · x j = exp x i x j 2 + y i y j 2 w i d t h hist
λ L = 0
y = 1 y = 1
DotProduct = x 1 · cos θ
cos 2 θ + sin 2 θ = 1
sin θ = x i x j 2 + y x i y x j 2 x 2 ¯
x 1 · x 2 = x 1 2 + y 1 2 · 1 x 1 x 2 2 + y 1 y 2 2 x 2 2 + y 2 2
Algorithm 3 SVM Algorithm to Differentiate Benign or Malignant Tumor
1:
Identification: Disease
2:
Data-set: BCWD from Kaggle
3:
Require: X and y loaded with training labeled data, ∝← 0 or ∝← partially trained SVM
4:
Input: Data ← Text
5:
Output: Normal cells, Benign or Malignant
6:
C ← Dataset (699 entries)
7:
repeat
8:
for x i , y i , x j , y j do
9:
        Optimize i and j
10:
           Evaluate input values
11:
           Evaluate Accuracy
12:
        Evaluate Confusion matrix
13:
end for
14:
until no change in ∝ or other resource constraint criteria met
15:
Ensure: Retain only the support vector ( i > 0)
16:
return: Output = 0

5. Evaluation and Results

According to the literature review of existing work, the overall histopathological bio-images show better accuracy results than others, as mentioned in Table 4. We use accuracy as an evaluation measure. “Accuracy is derived by dividing the number of correct predicted classes by the total number of samples evaluated, as shown in Equation (15)”.
Accuracy = T P + T N T N + F P + F N + T P
Sensitivity or recall is used to calculate the fraction of positive patterns that are correctly classified, as shown in Equation (16). The accuracy is directly related to the true-negative and false-positive classes. Here, true positive (TP) indicates that cancer exists and is predicted positive. True negative (TN) indicates that cancer exists but is predicted negative. False positive (FP) indicates that cancer does not exist but is predicted to be positive. False negative (FN) indicates that cancer does not exist and is predicted negatively.
Recall = T P T P + F N
Precision is used to compute the percentage of “positive patterns correctly predicted by all predicted patterns in a positive class”, as shown in Equation (17).
Precision = T P T P + F P
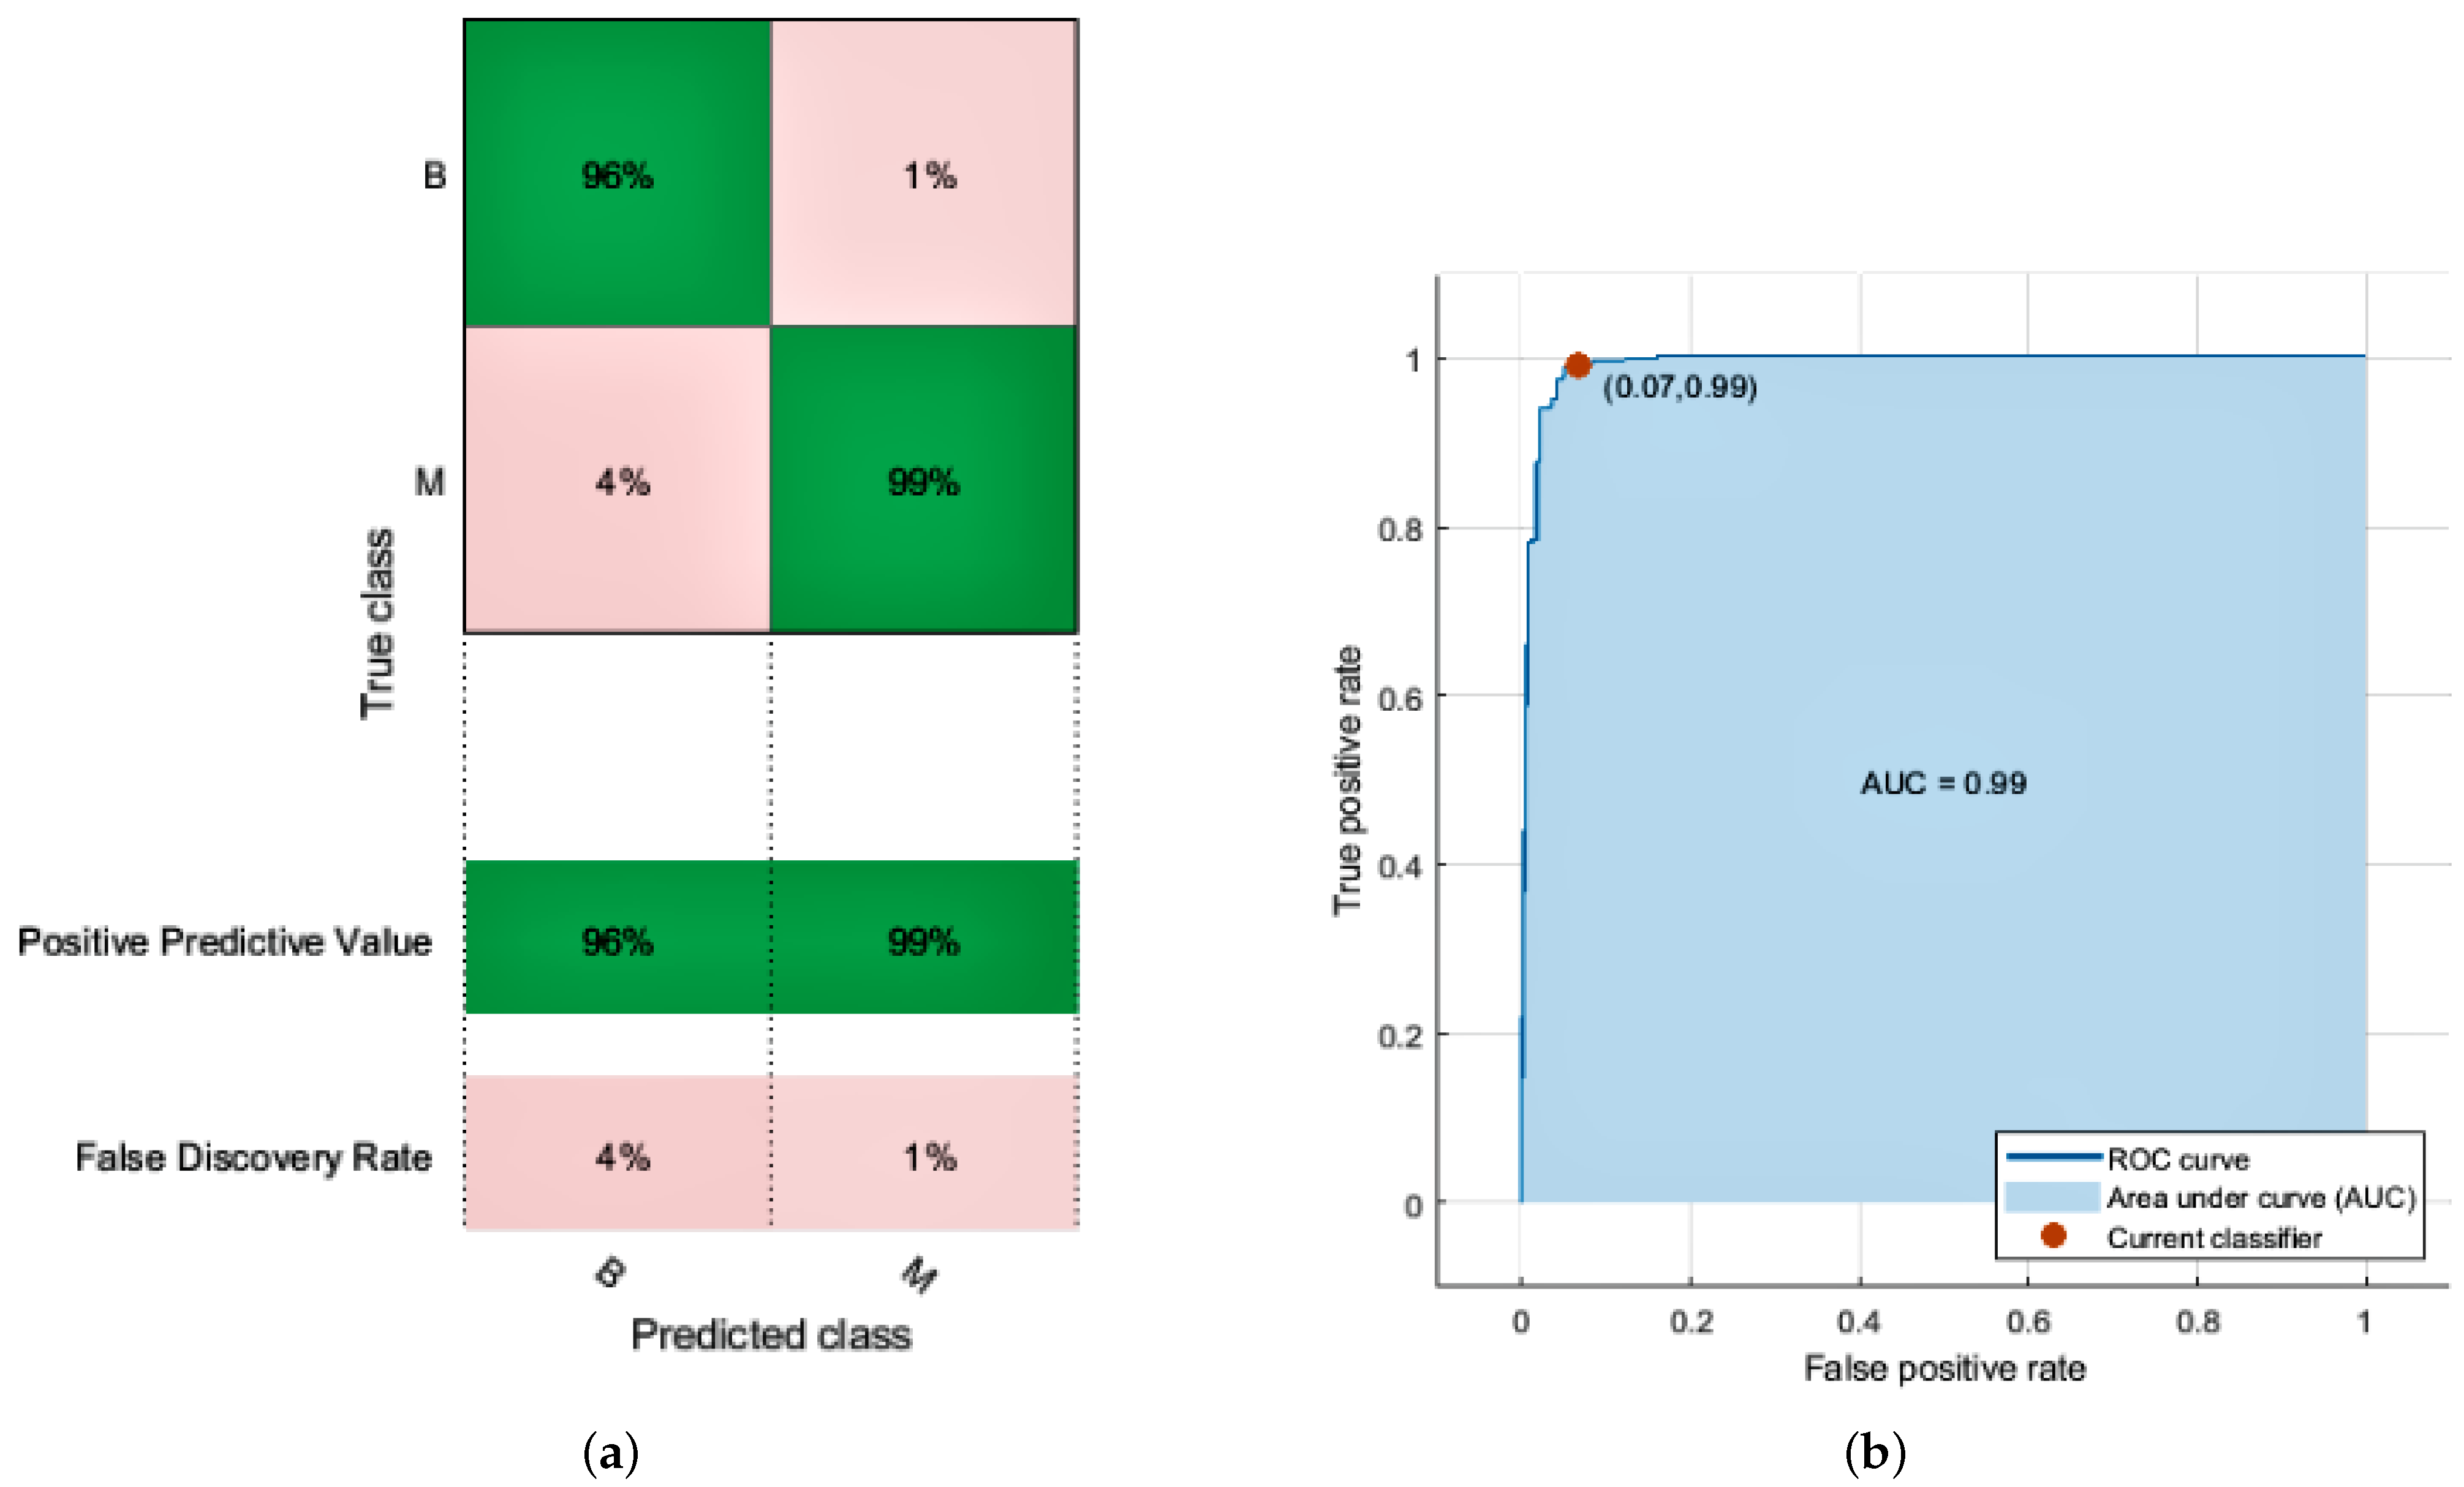
KNN relies on distances between neighbors measured by Euclidean, and data normalization helps to enhance classification accuracy. In the KNN model, a k-value is required to predict the unknown points to differentiate the classes eventually. A k-value decides the number of nearest neighbors to obtain the value for unlabeled data. The k-value is always a positive integer. We used an odd number of neighbors (3,5,7) and k at the value of 7 to give the best result in the simulation.The KNN employed in the proposed approach achieves the highest accuracy of 100% in the training dataset and 97.0% in the test with the weighted model. This model has a prediction speed of 2500 observations per second and a training time of 6.1157 s. The fine model achieved 94% accuracy with a prediction speed of 2500 observations per second and a training time of 2.9811 s. The medium model of KNN achieved 96% accuracy with a prediction speed of 1500 observations per second and a training time of 3.9217 s. Coarse gave us the least accuracy out of all the KNN models. When no other classifier is available, the results achieved by employing KNN are satisfactory; nevertheless, because the value of the k is chosen at random, its performance is less than the SVM classifier. The receiver operating characteristic (ROC) curve plot graph defines the diagnostic capability of a binary classifier. The ROC graph contains FPR on the x-axis and TRP on the y-axis. The limit for the x and y-axis lies between 0 and 1 to plot a graph of all possible threshold values of the classifier. So, the ROC curve gave us a tradeoff between cost and benefit. As we obtained more values close to 1, our model attains high accuracy. The confusion matrix and ROC curve of the KNN classifier is given in Figure 3a,b. We achieve the following accuracy from KNN models as given in Table 5.
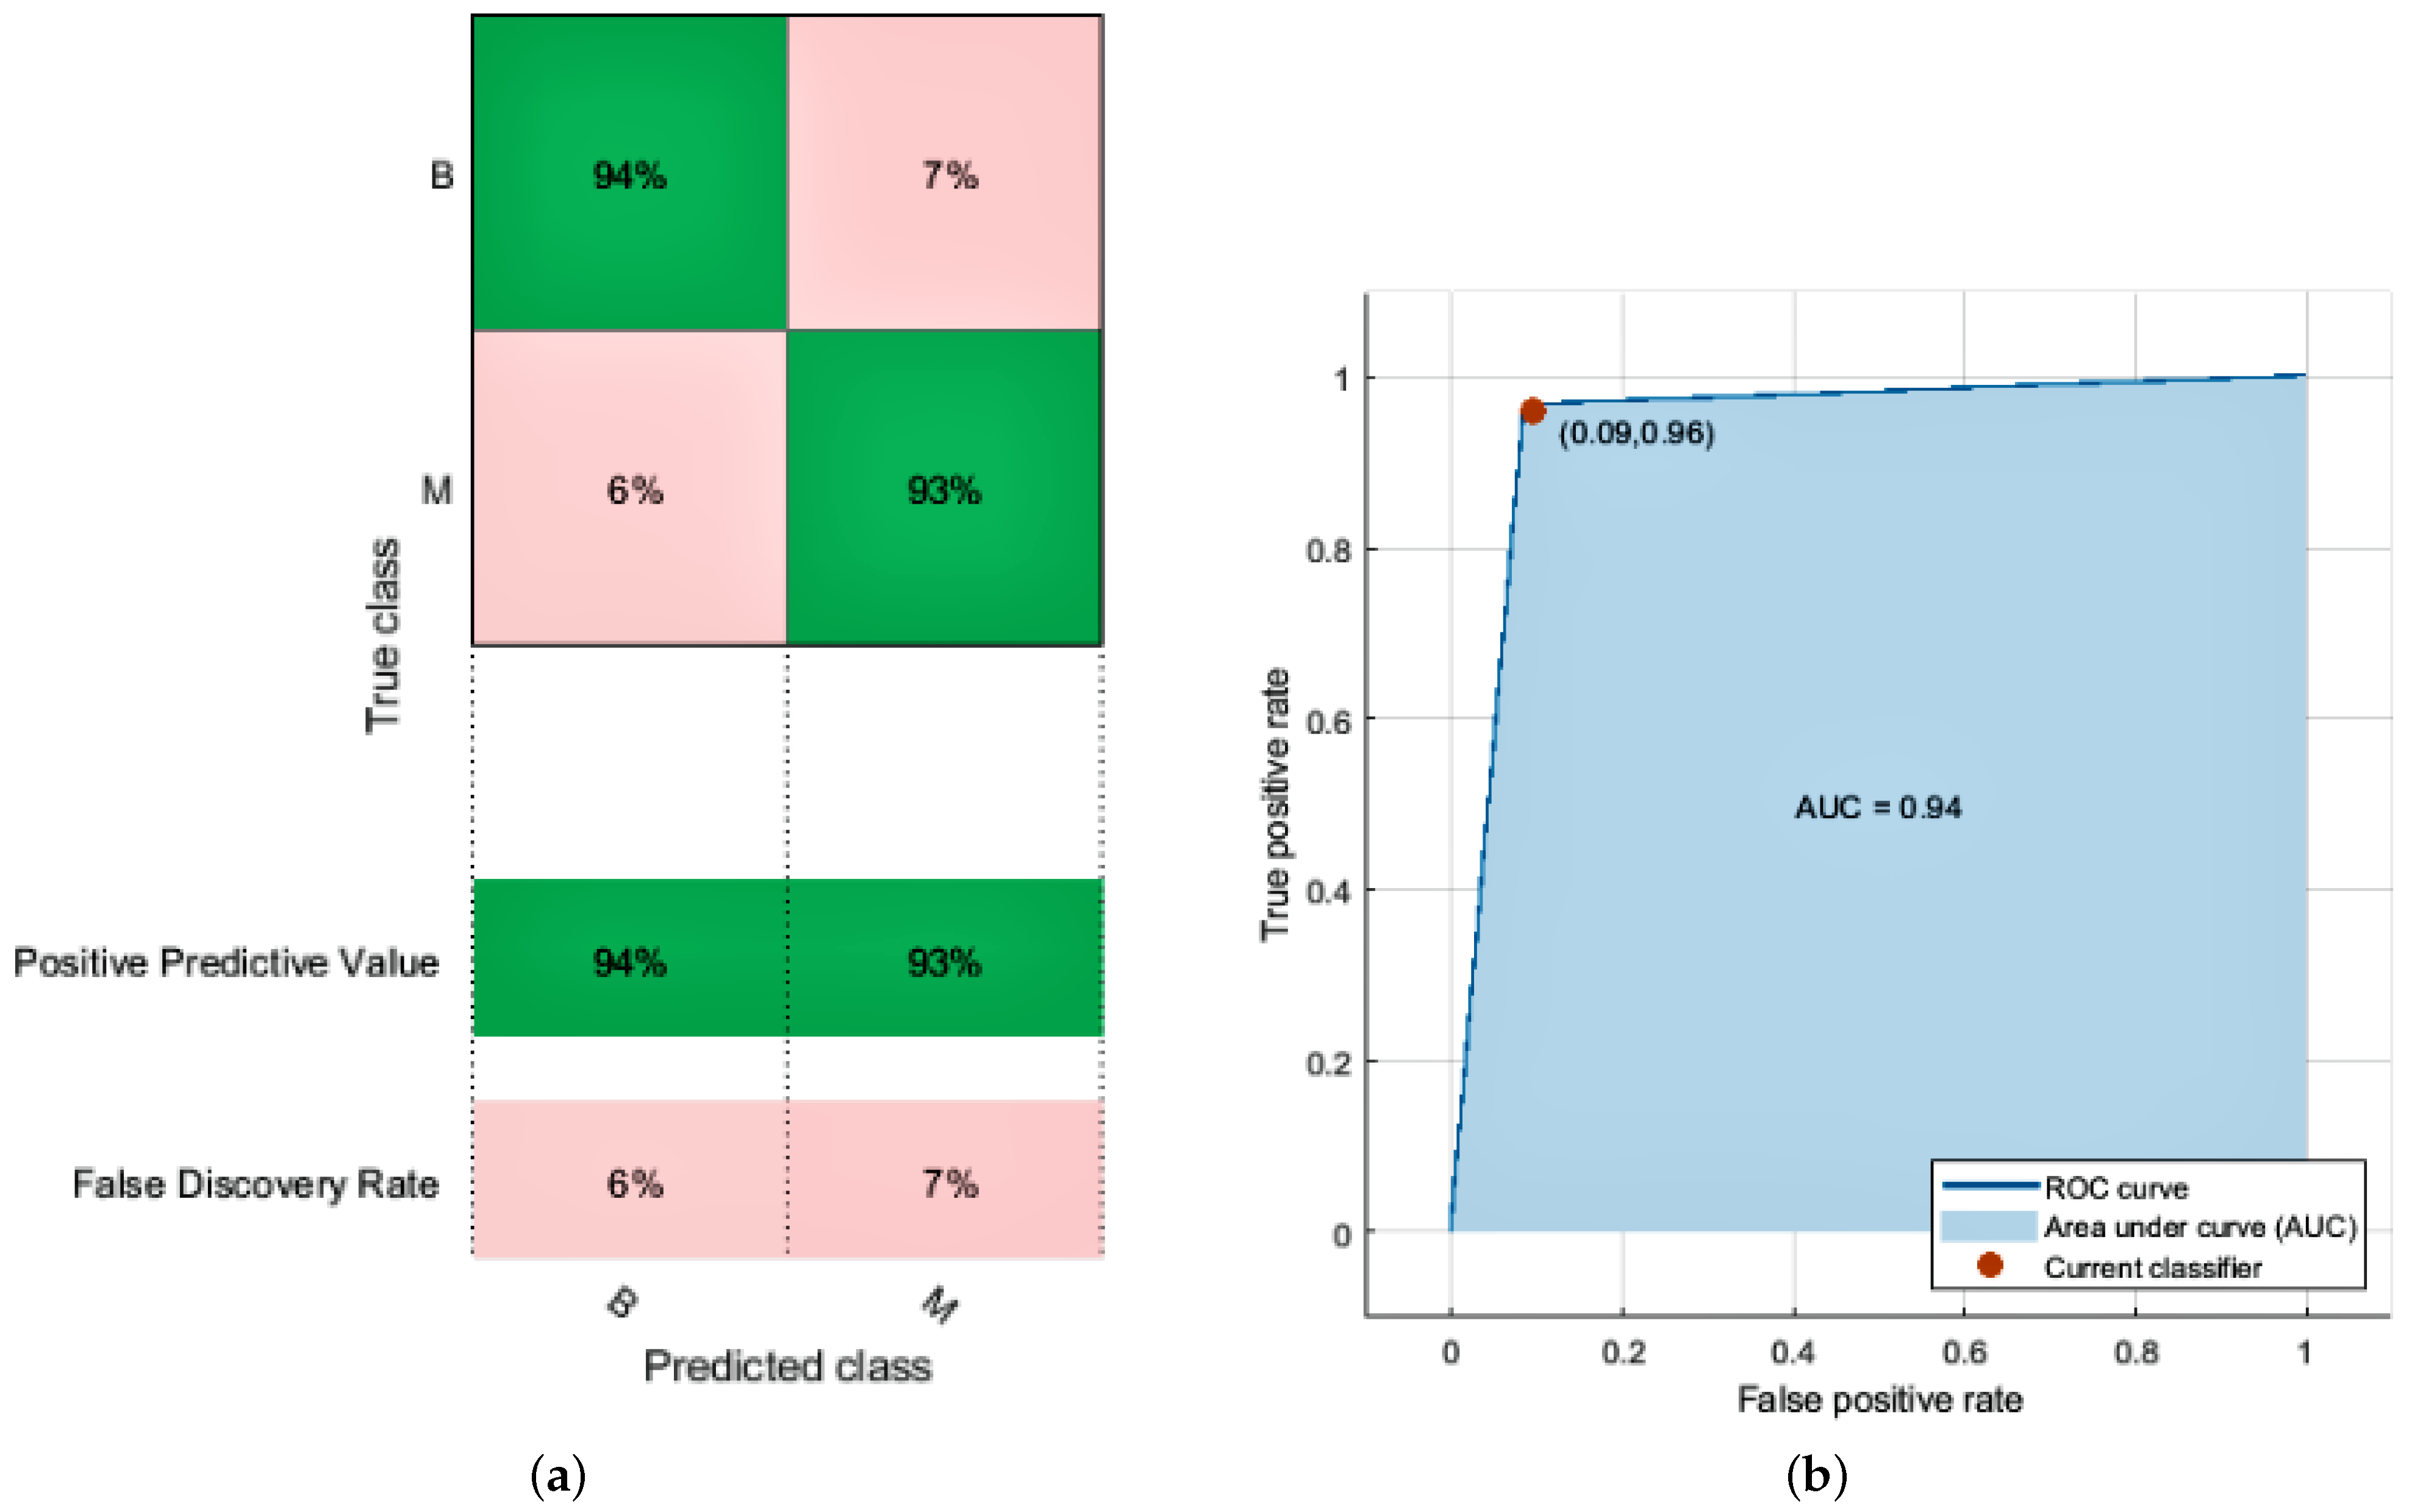
The logistic regression model’s perimeters are estimated using LR classification. The LR classifier achieves 94.0% accuracy with a prediction speed of 2400 observations per second and a training time of 52.778 s. The confusion matrix and ROC curve of the LR classifier are given in Figure 4a,b. We achieve the following accuracy by using this model given in Table 6.
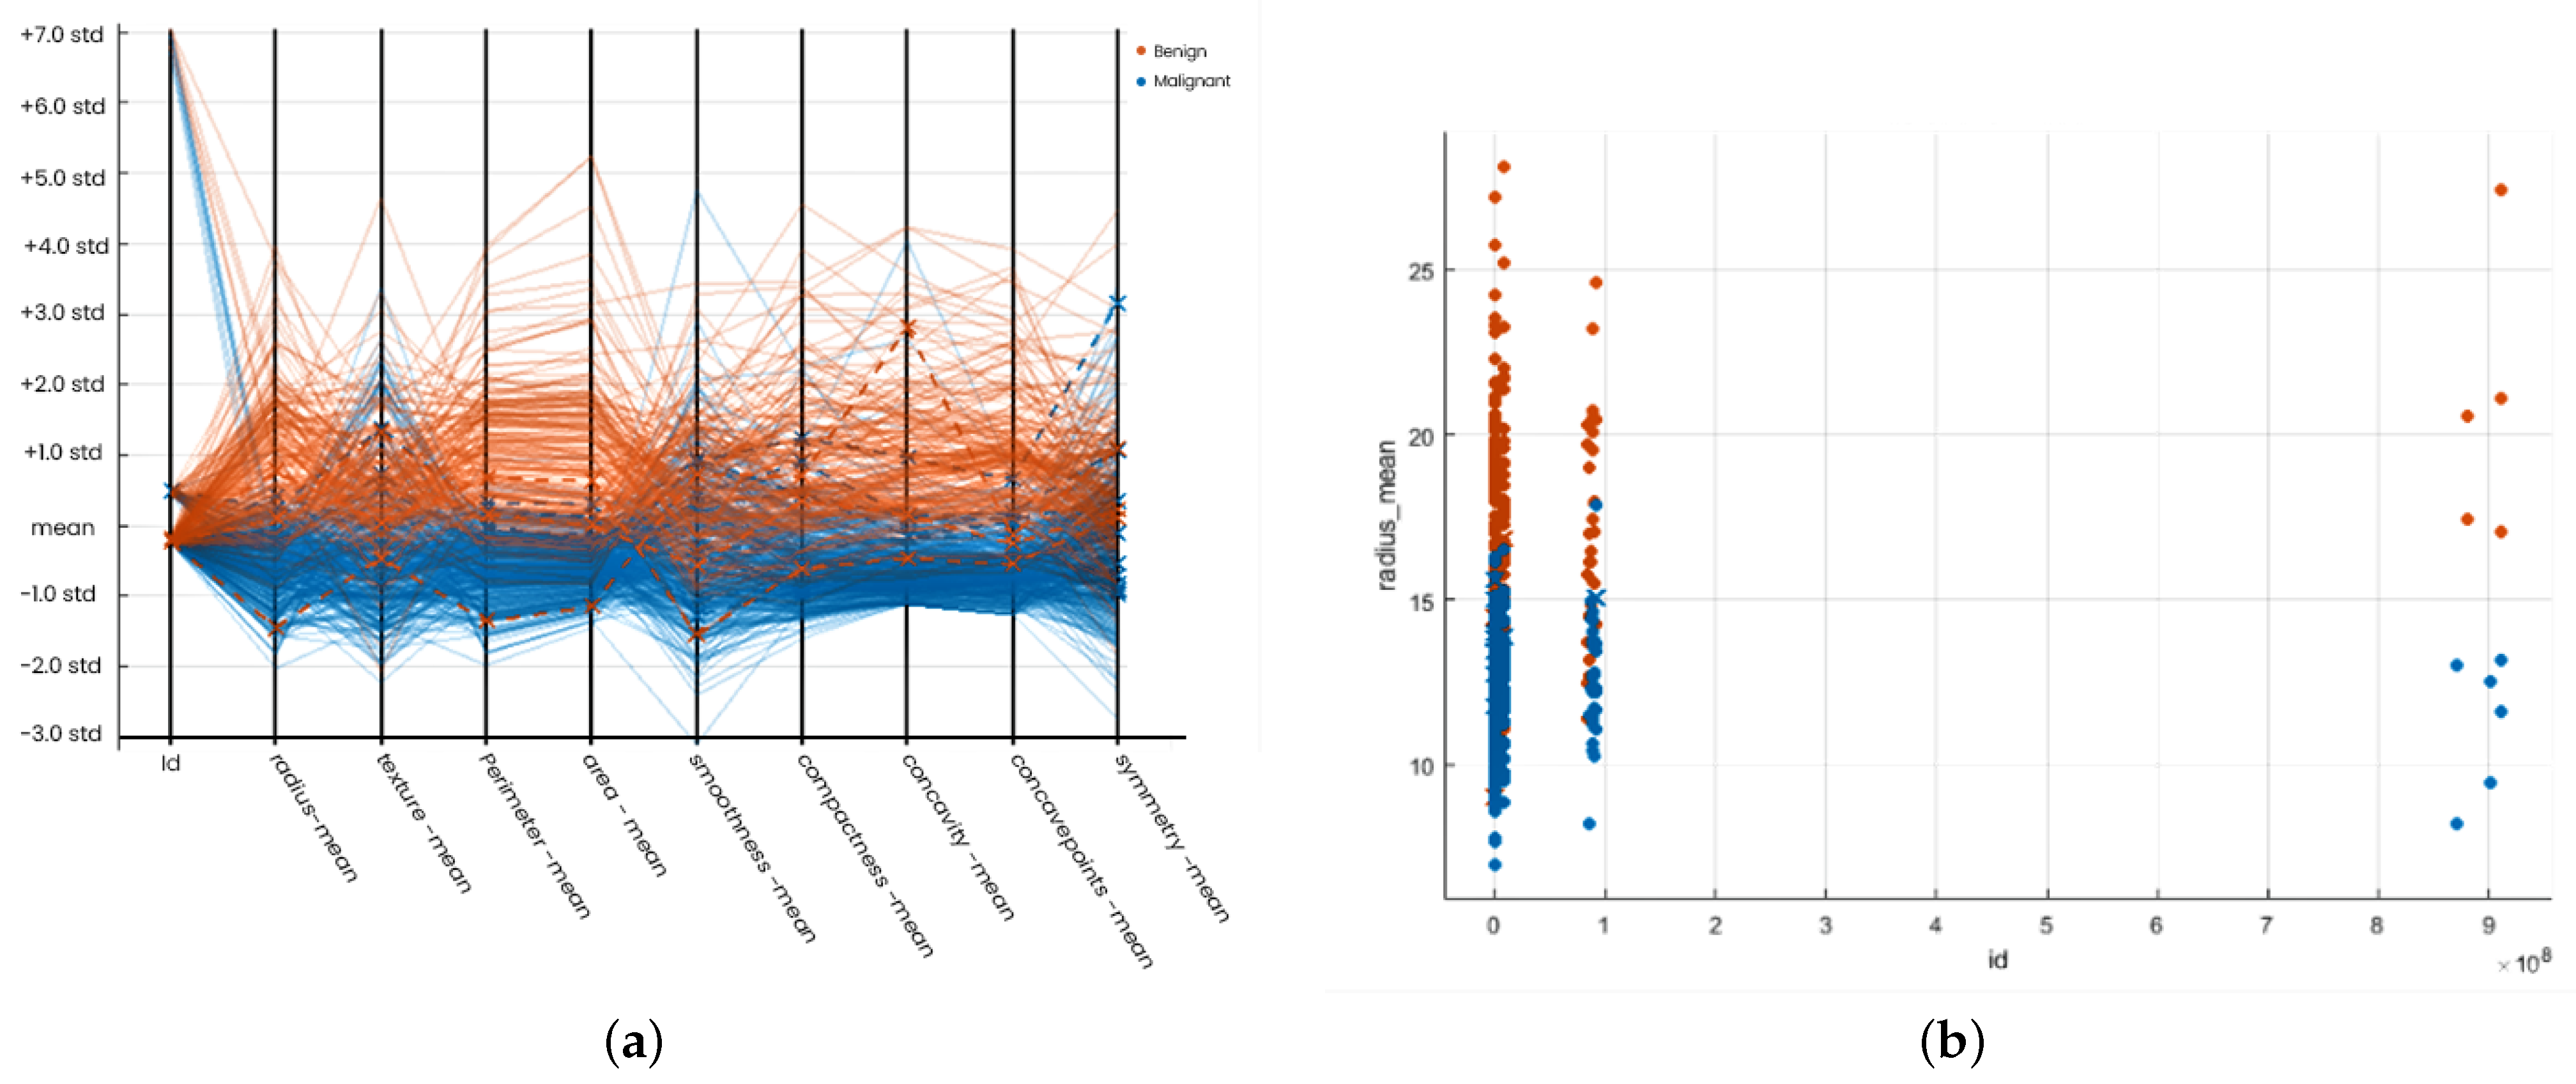
We simply tuned our model using parameters in SVM. We have two classes, malignant and benign, graded by colors: blue color for malignant and red for benign. Tuning the area-mean and concave points-mean proves efficient classifiers. Our data lie in different magnitudes. We use unity-based normalization and tuned all data records to a 0–1 range. SVM creates a hyper plane that divides the two classes into malignant and benign. To avoid under fitting and over fitting problems, we optimized the parameters by applying C parameter and Gamma techniques. SVM achieves the highest accuracy of 97.7% with quadratic and cubic models. The quadratic model takes 2.4081 s to train with a prediction speed of 3700 observations per second, while the cubic model takes 4.7405 s to train with a prediction speed of 2300 observations per second. Quadratic is the best fit model regarding prediction speed and training time. With a prediction speed of 2000 observations per second, the linear model achieved 97.5% accuracy in 3.509 s. With fine Gaussian, SVM achieved the lowest accuracy. Overall, the number of positive identifiers in both classes is much more than the incorrect ones. These findings show that SVM can forecast breast cancer and distinguish between benign and malignant tumors.
After overall simulation, we obtain a confusion matrix; the receiver operating characteristic (ROC), parallel coordination, and scattered plot of SVM models are given in Figure 5a,b and Figure 6a,b, respectively. Finally, we obtain the following accuracy percentage of different SVM models given in Table 7.

6. Conclusions

Different bio-images are used in the existing work to evaluate which bio-imaging can help differentiate benign and malignant tumors with high accuracy. Based on previous work, we conclude that mammograms and histopathological datasets play a vital role in classifying and effectively diagnosing breast cancer. The actual goal of this research work is to evaluate the accuracy of the machine learning techniques, i.e., SVM, LR, and KNN. We select these techniques as these techniques are the best-proven approaches to diagnosing diseases in the healthcare sector. The MATLAB environment enhances the accuracy of the state-of-the-art models in the simulation. The proposed approach effectively improves the cancer detection rate using instances from the dataset. The simulation results show that quadratic and cubic models of SVM achieved an accuracy of 97.7% based on rules. Still, the overall average accuracy of KNN is higher than SVM. With our contribution, cancer detection accuracy goes up. The positive prediction rate for benign is 97% and 99% for malignant, whereas the false prediction rate for benign is 3% and 1% for malignant. Overall, the proposed model accuracy increases by decreasing false positives and false negatives. This model is designed precisely to diagnose whether a patient is suffering from benign or malignant tumors. Future research can be done toward the microscopic classification of anomalies. Multilayered neural network architecture can be used in the future for complex features.

Author Contributions

Conceptualization, S.S., A.R.J. and M.R.; Data curation, M.R.; Formal analysis, S.S., K.J. and M.K.I.R.; Funding acquisition, M.K.I.R., K.J. and S.B.; Investigation, T.R.G. and S.S.; Methodology, M.K.I.R., K.J and S.S.; Project administration, K.J., M.K.I.R. and A.R.J.; Resources, S.B., T.R.G. and A.R.J.; Software, S.S.; Supervision, K.J., S.S., K.J. and M.K.I.R.; Validation, M.R. and S.B.; Visualization, M.R., S.B. and K.J.; Writing—review and editing, T.R.G., A.R.J., M.K.I.R. and S.B. All authors have read and agreed to the published version of the manuscript.

Funding

This research received no external funding.

Institutional Review Board Statement

Not applicable.

Informed Consent Statement

Not applicable.

Data Availability Statement

Conflicts of Interest

The authors declare no conflict of interest.

References

  1. Chaurasia, V.; Pal, S. A novel approach for breast cancer detection using data mining techniques. Int. J. Innov. Res. Comput. Commun. Eng. 2017, 2. [Google Scholar]
  2. Omondiagbe, D.A.; Veeramani, S.; Sidhu, A.S. Machine learning classification techniques for breast cancer diagnosis. IOP Conf. Ser. Mater. Sci. Eng. 2019, 495, 12033. [Google Scholar] [CrossRef]
  3. Yurttakal, A.H.; Erbay, H.; İkizceli, T.; Karacavus, S.; Çinarer, G. A comparative study on segmentation and classification in breast mri imaging. Instute Integr. Omics Appl. Biotechnol. 2018, 9, 23–33. [Google Scholar]
  4. Krithiga, R.; Geetha, P. Breast cancer detection, segmentation and classification on histopathology images analysis: A systematic review. Arch. Comput. Methods Eng. 2020, 28, 2607–2619. [Google Scholar] [CrossRef]
  5. Ferlay, J.; Colombet, M.; Soerjomataram, I.; Mathers, C.; Parkin, D.; Piñeros, M.; Znaor, A.; Bray, F. Estimating the global cancer incidence and mortality in 2018: GLOBOCAN sources and methods. Int. J. Cancer 2019, 144, 1941–1953. [Google Scholar] [CrossRef] [Green Version]
  6. Abbas, S.; Jalil, Z.; Javed, A.R.; Batool, I.; Khan, M.Z.; Noorwali, A.; Gadekallu, T.R.; Akbar, A. BCD-WERT: A novel approach for breast cancer detection using whale optimization based efficient features and extremely randomized tree algorithm. PeerJ Comput. Sci. 2021, 7, e390. [Google Scholar] [CrossRef]
  7. Punitha, S.; Amuthan, A.; Joseph, K.S. Benign and malignant breast cancer segmentation using optimized region growing technique. Future Comput. Inform. J. 2018, 3, 348–358. [Google Scholar] [CrossRef]
  8. Abbasi, M.U.; Kamal, M.; Tariq, M. Improved and Secured Electromyography in the Internet of Health Things. IEEE J. Biomed. Health Inform. 2021. [Google Scholar] [CrossRef]
  9. DeSantis, C.E.; Ma, J.; Gaudet, M.M.; Newman, L.A.; Miller, K.D.; Goding Sauer, A.; Jemal, A.; Siegel, R.L. Breast cancer statistics, 2019. CA Cancer J. Clin. 2019, 69, 438–451. [Google Scholar] [CrossRef]
  10. Bhattacharya, S.; Maddikunta, P.K.R.; Pham, Q.V.; Gadekallu, T.R.; Chowdhary, C.L.; Alazab, M.; Piran, M.J. Deep learning and medical image processing for coronavirus (COVID-19) pandemic: A survey. Sustain. Cities Soc. 2021, 65, 102589. [Google Scholar] [CrossRef]
  11. Gadekallu, T.R.; Rajput, D.S.; Reddy, M.; Lakshmanna, K.; Bhattacharya, S.; Singh, S.; Jolfaei, A.; Alazab, M. A novel PCA–whale optimization-based deep neural network model for classification of tomato plant diseases using GPU. J. Real-Time Image Process. 2021, 18, 1383–1396. [Google Scholar] [CrossRef]
  12. Gadekallu, T.R.; Alazab, M.; Kaluri, R.; Maddikunta, P.K.R.; Bhattacharya, S.; Lakshmanna, K. Hand gesture classification using a novel CNN-crow search algorithm. Complex Intell. Syst. 2021, 7, 1855–1868. [Google Scholar] [CrossRef]
  13. Gadamsetty, S.; Ch, R.; Ch, A.; Iwendi, C.; Gadekallu, T.R. Hash-Based Deep Learning Approach for Remote Sensing Satellite Imagery Detection. Water 2022, 14, 707. [Google Scholar] [CrossRef]
  14. Gayathri, B.; Raajan, P. A survey of breast cancer detection based on image segmentation techniques. In Proceedings of the 2016 International Conference on Computing Technologies and Intelligent Data Engineering (ICCTIDE’16), Kovilpatti, India, 7–9 January 2016; pp. 1–5. [Google Scholar]
  15. Houssein, E.H.; Emam, M.M.; Ali, A.A.; Suganthan, P.N. Deep and machine learning techniques for medical imaging-based breast cancer: A comprehensive review. Expert Syst. Appl. 2020, 167, 114161. [Google Scholar] [CrossRef]
  16. Singh, D.; Singh, A.K. Role of image thermography in early breast cancer detection-Past, present and future. Comput. Methods Programs Biomed. 2020, 183, 105074. [Google Scholar] [CrossRef]
  17. Lotter, W.; Diab, A.R.; Haslam, B.; Kim, J.G.; Grisot, G.; Wu, E.; Wu, K.; Onieva, J.O.; Boyer, Y.; Boxerman, J.L.; et al. Robust breast cancer detection in mammography and digital breast tomosynthesis using an annotation-efficient deep learning approach. Nat. Med. 2021, 27, 244–249. [Google Scholar] [CrossRef]
  18. Yousefi, B.; Akbari, H.; Maldague, X.P. Detecting Vasodilation as Potential Diagnostic Biomarker in Breast Cancer Using Deep Learning-Driven Thermomics. Biosensors 2020, 10, 164. [Google Scholar] [CrossRef]
  19. Kim, S.Y.; Choi, Y.; Kim, E.K.; Han, B.K.; Yoon, J.H.; Choi, J.S.; Chang, J.M. Deep learning-based computer-aided diagnosis in screening breast ultrasound to reduce false-positive diagnoses. Sci. Rep. 2021, 11, 395. [Google Scholar] [CrossRef]
  20. Yan, R.; Ren, F.; Wang, Z.; Wang, L.; Ren, Y.; Liu, Y.; Rao, X.; Zheng, C.; Zhang, F. A hybrid convolutional and recurrent deep neural network for breast cancer pathological image classification. In Proceedings of the 2018 IEEE International Conference on Bioinformatics and Biomedicine (BIBM), Madrid, Spain, 3–6 December 2018; pp. 957–962. [Google Scholar]
  21. Fayyaz, M.; Farhan, A.A.; Javed, A.R. Thermal Comfort Model for HVAC Buildings Using Machine Learning. Arab. J. Sci. Eng. 2021, 47, 2045–2060. [Google Scholar] [CrossRef]
  22. Sarwar, M.U.; Javed, A.R. Collaborative health care plan through crowdsource data using ambient application. In Proceedings of the 2019 22nd International Multitopic Conference (INMIC), Islamabad, Pakistan, 29–30 November 2019; pp. 1–6. [Google Scholar]
  23. Usman Sarwar, M.; Rehman Javed, A.; Kulsoom, F.; Khan, S.; Tariq, U.; Kashif Bashir, A. Parciv: Recognizing physical activities having complex interclass variations using semantic data of smartphone. Softw. Pract. Exp. 2021, 51, 532–549. [Google Scholar] [CrossRef]
  24. Javed, A.R.; Sarwar, M.U.; Khan, S.; Iwendi, C.; Mittal, M.; Kumar, N. Analyzing the effectiveness and contribution of each axis of tri-axial accelerometer sensor for accurate activity recognition. Sensors 2020, 20, 2216. [Google Scholar] [CrossRef] [PubMed] [Green Version]
  25. Javed, A.R.; Fahad, L.G.; Farhan, A.A.; Abbas, S.; Srivastava, G.; Parizi, R.M.; Khan, M.S. Automated cognitive health assessment in smart homes using machine learning. Sustain. Cities Soc. 2021, 65, 102572. [Google Scholar] [CrossRef]
  26. Basheer, S.; Bhatia, S.; Sakri, S.B. Computational modeling of dementia prediction using deep neural network: Analysis on OASIS dataset. IEEE Access 2021, 9, 42449–42462. [Google Scholar] [CrossRef]
  27. Bhalla, K.; Koundal, D.; Bhatia, S.; Khalid, M.; Rahmani, I.; Tahir, M. Fusion of infrared and visible images using fuzzy based siamese convolutional network. Comput. Mater. Contin. 2022, 70, 5503–5518. [Google Scholar] [CrossRef]
  28. Prakashkar, H.; Pandya, S. DemCare Application for Dementia Diagnosis Using Machine Learning Classifiers. Ann. Rom. Soc. Cell Biol. 2021, 25, 18145–18168. [Google Scholar]
  29. Ghayvat, H.; Pandya, S.; Patel, A. Deep learning model for acoustics signal based preventive healthcare monitoring and activity of daily living. In Proceedings of the 2nd International Conference on Data, Engineering and Applications (IDEA), Bhopal, India, 28–29 February 2020; pp. 1–7. [Google Scholar]
  30. Javed, A.R.; Sarwar, M.U.; Khan, H.U.; Al-Otaibi, Y.D.; Alnumay, W.S. PP-SPA: Privacy preserved smartphone-based personal assistant to improve routine life functioning of cognitive impaired individuals. Neural Process. Letters 2021, 1–18. [Google Scholar] [CrossRef]
  31. Javed, A.R.; Sarwar, M.U.; Beg, M.O.; Asim, M.; Baker, T.; Tawfik, H. A collaborative healthcare framework for shared healthcare plan with ambient intelligence. Hum.-Centric Comput. Inf. Sci. 2020, 10, 40. [Google Scholar] [CrossRef]
  32. Goldenberg, S.L.; Nir, G.; Salcudean, S.E. A new era: Artificial intelligence and machine learning in prostate cancer. Nat. Rev. Urol. 2019, 16, 391–403. [Google Scholar] [CrossRef]
  33. Bataineh, A.A. A comparative analysis of nonlinear machine learning algorithms for breast cancer detection. Int. J. Mach. Learn. Comput. 2019, 9, 248–254. [Google Scholar] [CrossRef]
  34. Siddiqui, S.Y.; Naseer, I.; Khan, M.A.; Mushtaq, M.F.; Naqvi, R.A.; Hussain, D.; Haider, A. Intelligent Breast Cancer Prediction Empowered with Fusion and Deep Learning. CMC-Comput. Mater. Contin. 2021, 67, 1033–1049. [Google Scholar] [CrossRef]
  35. Ak, M.F. A comparative analysis of breast cancer detection and diagnosis using data visualization and machine learning applications. Healthcare 2020, 8, 111. [Google Scholar] [CrossRef]
  36. Kumar, A.; Sushil, R.; Tiwari, A. Comparative Study of Classification Techniques for Breast Cancer Diagnosis. Int. J. Comput. Sci. Eng. 2019, 7, 234–240. [Google Scholar] [CrossRef]
  37. Dabass, J.; Arora, S.; Vig, R.; Hanmandlu, M. Segmentation techniques for breast cancer imaging modalities-a review. In Proceedings of the 2019 9th International Conference on Cloud Computing, Data Science & Engineering (Confluence), Noida, India, 10–11 January 2019; pp. 658–663. [Google Scholar]
  38. Zeebaree, D.Q.; Haron, H.; Abdulazeez, A.M.; Zebari, D.A. Machine learning and region growing for breast cancer segmentation. In Proceedings of the 2019 International Conference on Advanced Science and Engineering (ICOASE), Zakho-Duhok, Iraq, 2–4 April 2019; pp. 88–93. [Google Scholar]
  39. Daoud, M.I.; Abdel-Rahman, S.; Bdair, T.M.; Al-Najar, M.S.; Al-Hawari, F.H.; Alazrai, R. Breast Tumor Classification in Ultrasound Images Using Combined Deep and Handcrafted Features. Sensors 2020, 20, 6838. [Google Scholar] [CrossRef]
  40. Chang, Y.W.; Chen, Y.R.; Ko, C.C.; Lin, W.Y.; Lin, K.P. A Novel Computer-Aided-Diagnosis System for Breast Ultrasound Images Based on BI-RADS Categories. Appl. Sci. 2020, 10, 1830. [Google Scholar] [CrossRef] [Green Version]
  41. Yao, H.; Zhang, X.; Zhou, X.; Liu, S. Parallel structure deep neural network using CNN and RNN with an attention mechanism for breast cancer histology image classification. Cancers 2019, 11, 1901. [Google Scholar] [CrossRef] [Green Version]
  42. Yan, R.; Ren, F.; Wang, Z.; Wang, L.; Zhang, T.; Liu, Y.; Rao, X.; Zheng, C.; Zhang, F. Breast cancer histopathological image classification using a hybrid deep neural network. Methods 2020, 173, 52–60. [Google Scholar] [CrossRef]
  43. Boumaraf, S.; Liu, X.; Zheng, Z.; Ma, X.; Ferkous, C. A new transfer learning based approach to magnification dependent and independent classification of breast cancer in histopathological images. Biomed. Signal Process. Control 2021, 63, 102192. [Google Scholar] [CrossRef]
  44. Zemouri, R.; Omri, N.; Morello, B.; Devalland, C.; Arnould, L.; Zerhouni, N.; Fnaiech, F. Constructive deep neural network for breast cancer diagnosis. IFAC-PapersOnLine 2018, 51, 98–103. [Google Scholar] [CrossRef]
  45. Mahanta, L.B.; Hussain, E.; Das, N.; Kakoti, L.; Chowdhury, M. IHC-Net: A fully convolutional neural network for automated nuclear segmentation and ensemble classification for Allred scoring in breast pathology. Appl. Soft Comput. 2021, 103, 107136. [Google Scholar] [CrossRef]
  46. Ragab, D.A.; Sharkas, M.; Marshall, S.; Ren, J. Breast cancer detection using deep convolutional neural networks and support vector machines. PeerJ 2019, 7, e6201. [Google Scholar] [CrossRef]
  47. Aboutalib, S.S.; Mohamed, A.A.; Berg, W.A.; Zuley, M.L.; Sumkin, J.H.; Wu, S. Deep learning to distinguish recalled but benign mammography images in breast cancer screening. Clin. Cancer Res. 2018, 24, 5902–5909. [Google Scholar] [CrossRef] [PubMed] [Green Version]
  48. Surendhar, S.P.A.; Vasuki, R. Breast cancers detection using deep learning algorithm. Mater. Today Proc. 2021, in press. [Google Scholar]
  49. Punithavathi, V.; Devakumari, D. A new proposal for the segmentation of breast lesion in mammogram images using optimized kernel fuzzy clustering algorithm. Mater. Today Proc. 2021, in press. [Google Scholar] [CrossRef]
  50. Gnanasekaran, V.S.; Joypaul, S.; Sundaram, P.M.; Chairman, D.D. Deep learning algorithm for breast masses classification in mammograms. IET Image Process. 2020, 14, 2860–2868. [Google Scholar] [CrossRef]
  51. Krawczyk, B.; Schaefer, G. Breast thermogram analysis using classifier ensembles and image symmetry features. IEEE Syst. J. 2013, 8, 921–928. [Google Scholar] [CrossRef]
  52. Khan, R.U.; Zhang, X.; Alazab, M.; Kumar, R. An improved convolutional neural network model for intrusion detection in networks. In Proceedings of the 2019 Cybersecurity and cyberforensics conference (CCC), Melbourne, Australia, 8–9 May 2019; pp. 74–77. [Google Scholar]
  53. Bangare, S.L.; Dubal, A.; Bangare, P.S.; Patil, S. Reviewing otsu’s method for image thresholding. Int. J. Appl. Eng. Res. 2015, 10, 21777–21783. [Google Scholar] [CrossRef]
Figure 1. WHO statistics of reported cases and causalities worldwide by cancer.
Diagnostics 12 01134 g001
Figure 2. Proposed breast cancer classification model.
Diagnostics 12 01134 g002
Figure 3. Results of K-Nearest Neighbor. (a) Confusion matrix; (b) AUC of KNN.
Diagnostics 12 01134 g003
Figure 4. Results of Logistic Regression. (a) Confusion matrix; (b) AUC of LR.
Diagnostics 12 01134 g004
Figure 5. Results of Support Vector Machine. (a) Confusion Matrix; (b) AUC of SVM.
Diagnostics 12 01134 g005
Figure 6. Results Plot Support Vector Machine. (a) Parallel co-ordination of SVM; (b) Scattered plot of SVM.
Diagnostics 12 01134 g006
Table 1. Existing techniques on ultrasound images dataset.
Ref.DiseaseDataset SourceDataset TypeDataset DescriptionToolsTechniquesAccuracy
[20]Breast cancerSeoul National University Hospital, Severance Hospital and Samsung Medical CenterUltrasound images164 imagesDL-CAD software, DL-CAD based quantitative featuresFeature extractionsensitivity 95%
[39]MalignantNot givenUltrasound images250 imagesML ANN, BPNNSegmentation RIO95.4%
 [40]Breast cancerUniversity Hospital, Amman, Jordan.Ultrasound images1st = 380 images, 2nd dataset includes 163 imagesCNN, SVM classifiersFeature extraction, classification96.1% CONV feature 94.2%
[41]Benign or malignantNot givenUltrasound images151 imagesCAD system, SVM, CNNSegmentation, feature extraction, classificationSVM, RF, and CNN 80.0%, 77.78%, 85.42%
Table 2. Existing techniques on histopathological images dataset.
Ref.DiseaseDataset SourceDataset TypeDataset DescriptionToolsTechniquesAccuracy
[32]Breast cancerICIAR 2018Histopathological images1568 images, 249 Bioimaging 2015, 400 ICIAR2018DNN, CNN, RNN, LSTMSegmentation, feature extraction, classification90.5% for 4-class classification task
[42]Breast cancerOpen sourceHistopathological imagesBACH2018 (400 images), Bioimaging 2015 (249 images), Extended Bioimaging 2015 (1319 images)CNN, RNNClassification K-foldSingle Model 97.5%, Ensemble Model 97.5%, CNN 82.1%
[43]Breast cancerImageNet dataset, ICIAR, ISBI, ICPR, MICCAIHistopathological images3771 imagesRNN CNN SVM, NVIDIA GPUsClassification91.3% for the 4-class classification task
[44]Breast cancerAnatomy and Cytopathology Lab, Brazil.Histopathological images7909 imagesDNN, GCN, softmax classifierBinary classification99.44% and 99.01%
[45]Breast cancerWisconsin UCIHistopathological images92 imagesDNN, RNNBinary classificationDNN gave better results
[46]Breast cancerNot givenHistopathological images400 imagesCNN ML, DL, IHC-Net, Naïve Bayes, SVM and RFDSegmentation, feature extraction, classification(98.24%), Ensemble classifier 98.41% F-score and 97.66%
Table 3. Existing techniques on mammographic images dataset.
Ref.DiseaseDataset SourceDataset TypeDataset DescriptionToolsTechniquesAccuracy
[7]Breast cancerMassachusetts General HospitalMammographic imagesDDSM 2500 imagesFFNN, GLCM, GLRLM, DFOSegmentation, Feature extraction, classification90%, FFNN 98%
[17]Breast cancerDatabase for Mastology Research (DMR)Mammographic images208 imagesRFM AlexNet, GoogLe-Net, ResNet-18, VGG-16, VGG-19Segmentation, Feature extraction, classification78.16% 73.3–81.07%
[19]Breast cancerUS Chinese hospitalMammographic imagesDDSM OMI-DBCNN, MILClassificationNot given
[47]Breast cancerOpen sourceMammographic imagesDDSM 2620 cases CBISD DSM 1644 picsDCNN AlexNet, DCNN SVMSegmentation, feature extraction RIOSVM 87.2%, AUC 94%
[48]Breast cancerNot givenMammographic imagesFFDM, DDSM 14,860 imagesCNN AlexNet, ImageNetclassification95%
[49]Breast cancerPrivateMammographic images400 imagesDL, SVM Soft-Max function, Sigmoid functionSegmentation, classificationSVM Show better result than DL
[50]Breast cancerSociety (MIAS) databaseMammographic images322 imagesHDF, OKFCA, OKFC Algorithm, fuzzySegmentationMFKFCS produces 80.42%
Table 4. Comparison of existing bio-imaging studies.
ReferenceBioimaging TypeMethodologyAccuracy
[12]Ultrasound imagesDL-CAD95%
[21]Ultrasound imagesML, ANN, BPNN95.4%
[22]Ultrasound imagesCNN, SVM96.1%
[23]Ultrasound imagesSVM, RF, CNN80.0%, 77.78%, 85.42%
[13]Histopathological imagesDNN, CNN, RNN90.5%
[24]Histopathological imagesRNN, CNN97.5%, 82.1%
[25]Histopathological imagesRNN, CNN, SVM91.3%
[10]Mammographic imagesRFM, AlexNet,78%
[29]Mammographic imagesDCNN AlexNet, DCNN SVM94%
[30]Mammographic imagesCNN AlexNet, ImageNet95%
[32]Mammographic imagesHFD, OK-FCA, OKFC, Fuzzy80.42%
This paperMammographic imagesSVM, KNN, Logistic regression97.7%
Table 5. Accuracy of KNN model.
KNN ModelAccuracyPrediction SpeedTraining Time
Fine94.6%2500 obs/s2.9811 s
Medium96.3%1500 obs/s3.6813 s
Coarse92.8%1600 obs/s3.9217 s
Cosine96.1%1800 obs/s4.9151 s
Cubic95.8%320 obs/s10.718 s
Weighted97.0%2500 obs/s6.1157 s
Table 6. Accuracy of Logistic Regression Model.
Logistic Regression ModelAccuracyPrediction SpeedTraining time
Logistic regression94.0%2400 obs/s52.778 s
Table 7. Accuracy of SVM model.
SVM ModelAccuracyPrediction SpeedTraining Time
Linear97.5%2000 obs/s3.5090 s
Quadratic97.7%3700 obs/s2.4081 s
Cubic97.7%2300 obs/s4.7405 s
Fine Gaussian77.7%1900 obs/s6.0672 s
Medium Gaussian97.4%3500 obs/s6.4526 s
Coarse Gaussian95.3%3700 obs/s6.7769 s
Publisher’s Note: MDPI stays neutral with regard to jurisdictional claims in published maps and institutional affiliations.

