
Comparison between Widefield Optical Coherence Tomography Devices in Eyes with High Myopia

 , , ,
, , ,
Abstract
:1. Introduction
2. Materials and Methods
2.1. Study Population
2.2. Study Protocol
2.3. Assessment of Axial Length
2.4. Imaging Protocol
2.5. OCT Analysis
2.6. Statistical Analysis
3. Results
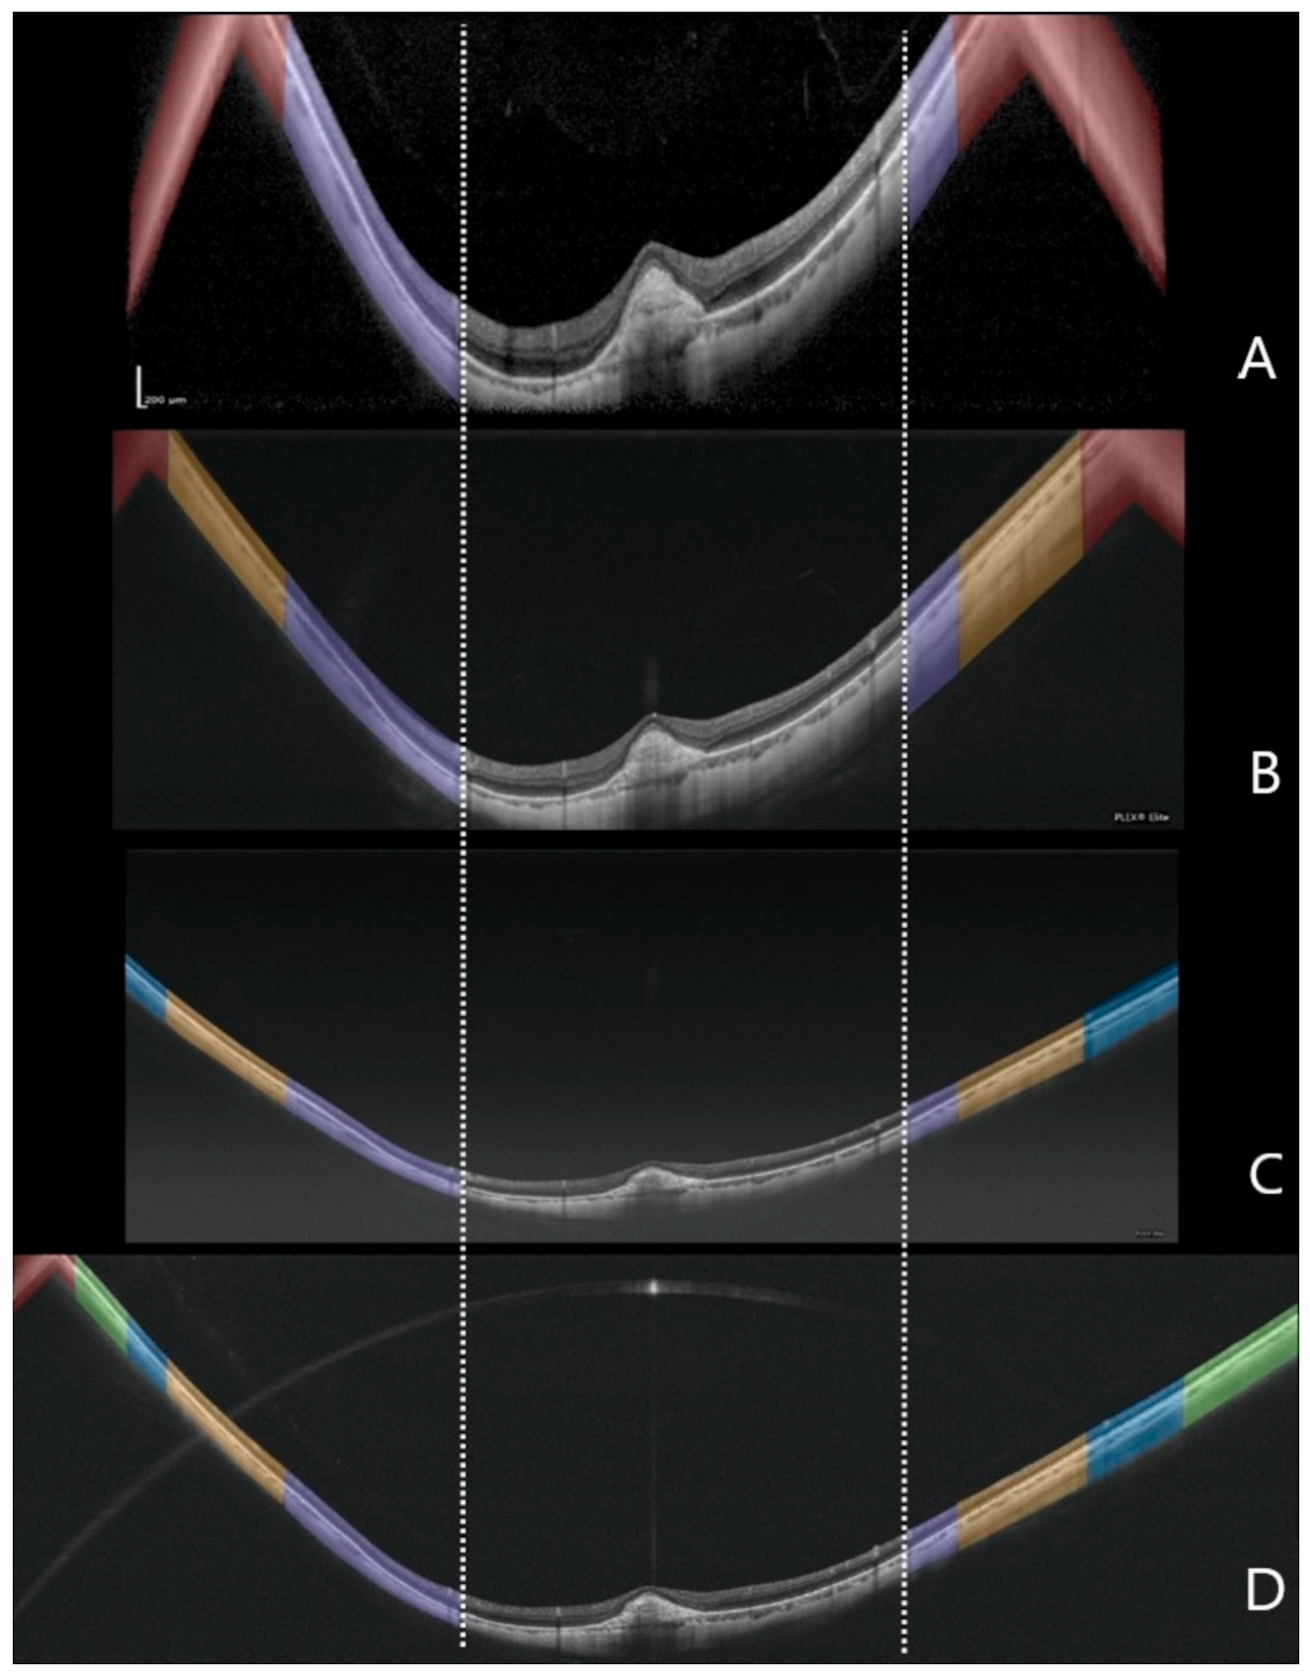
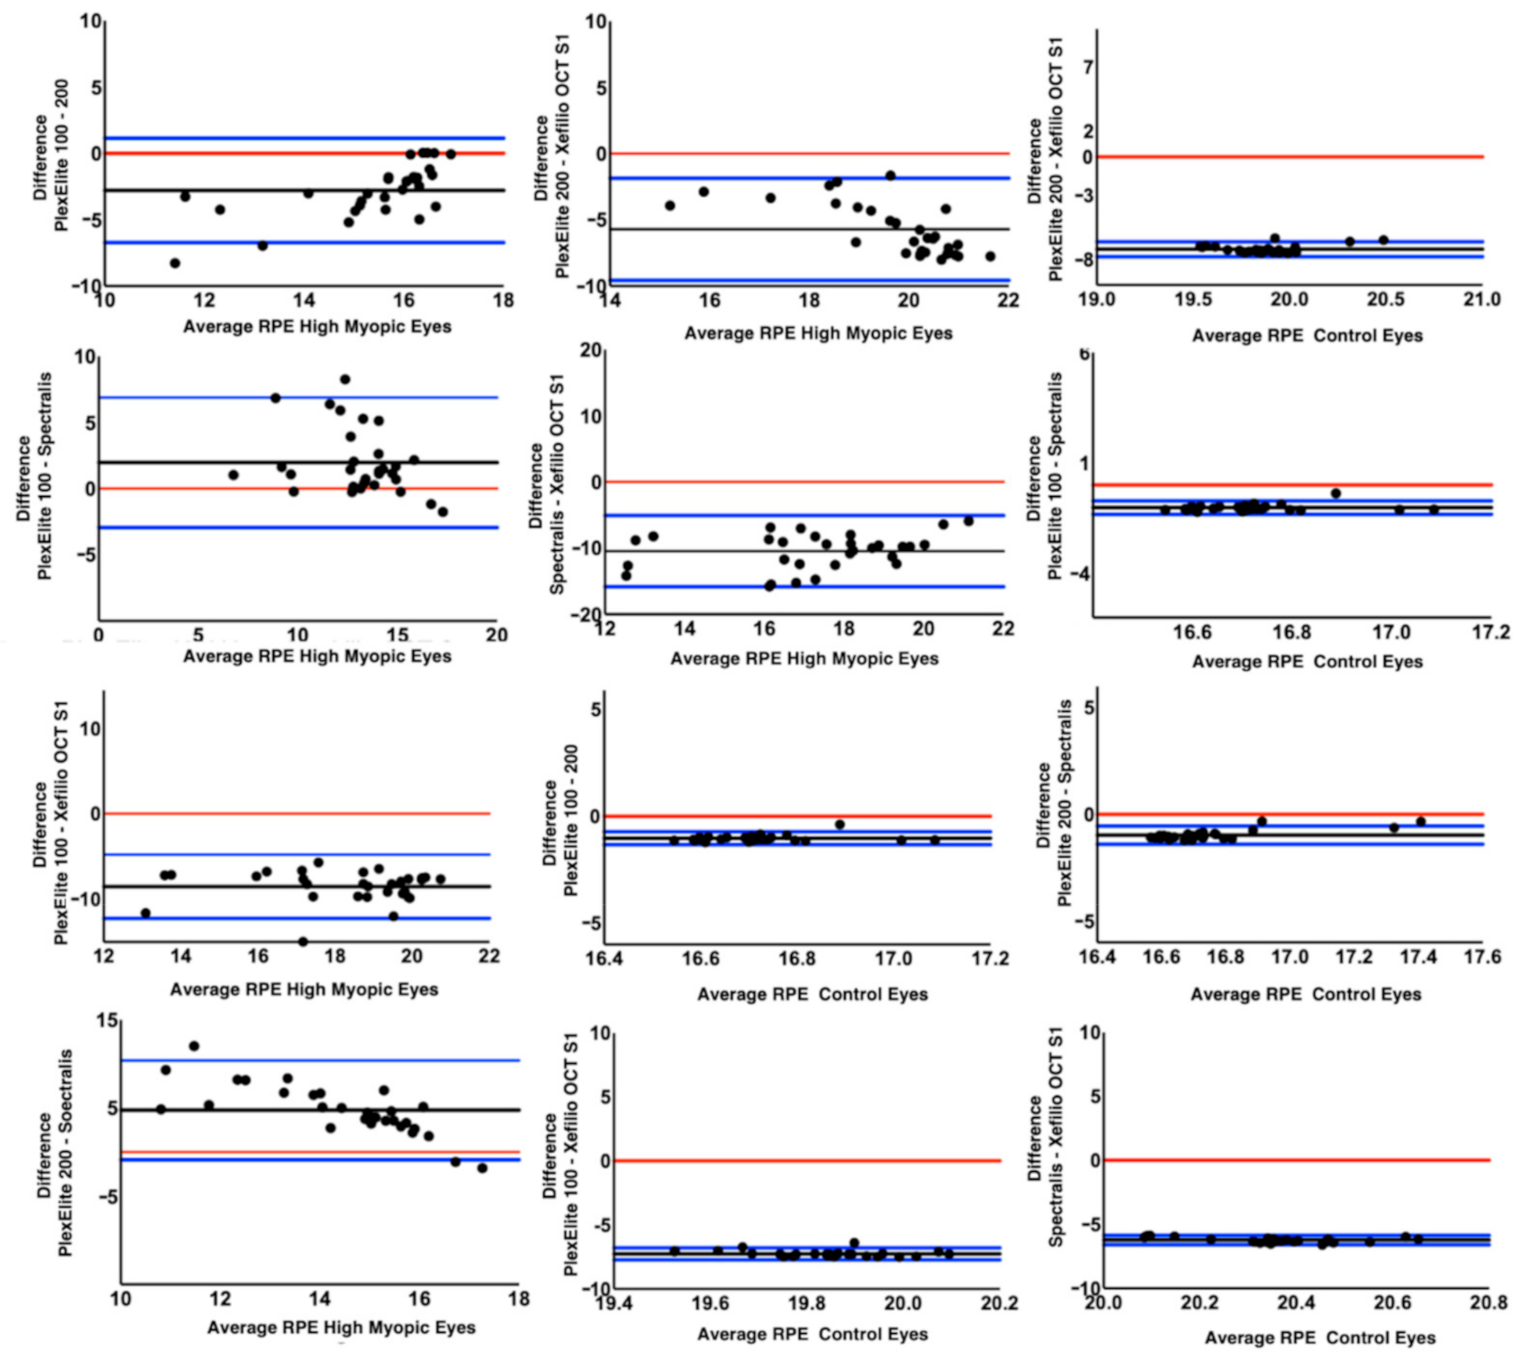
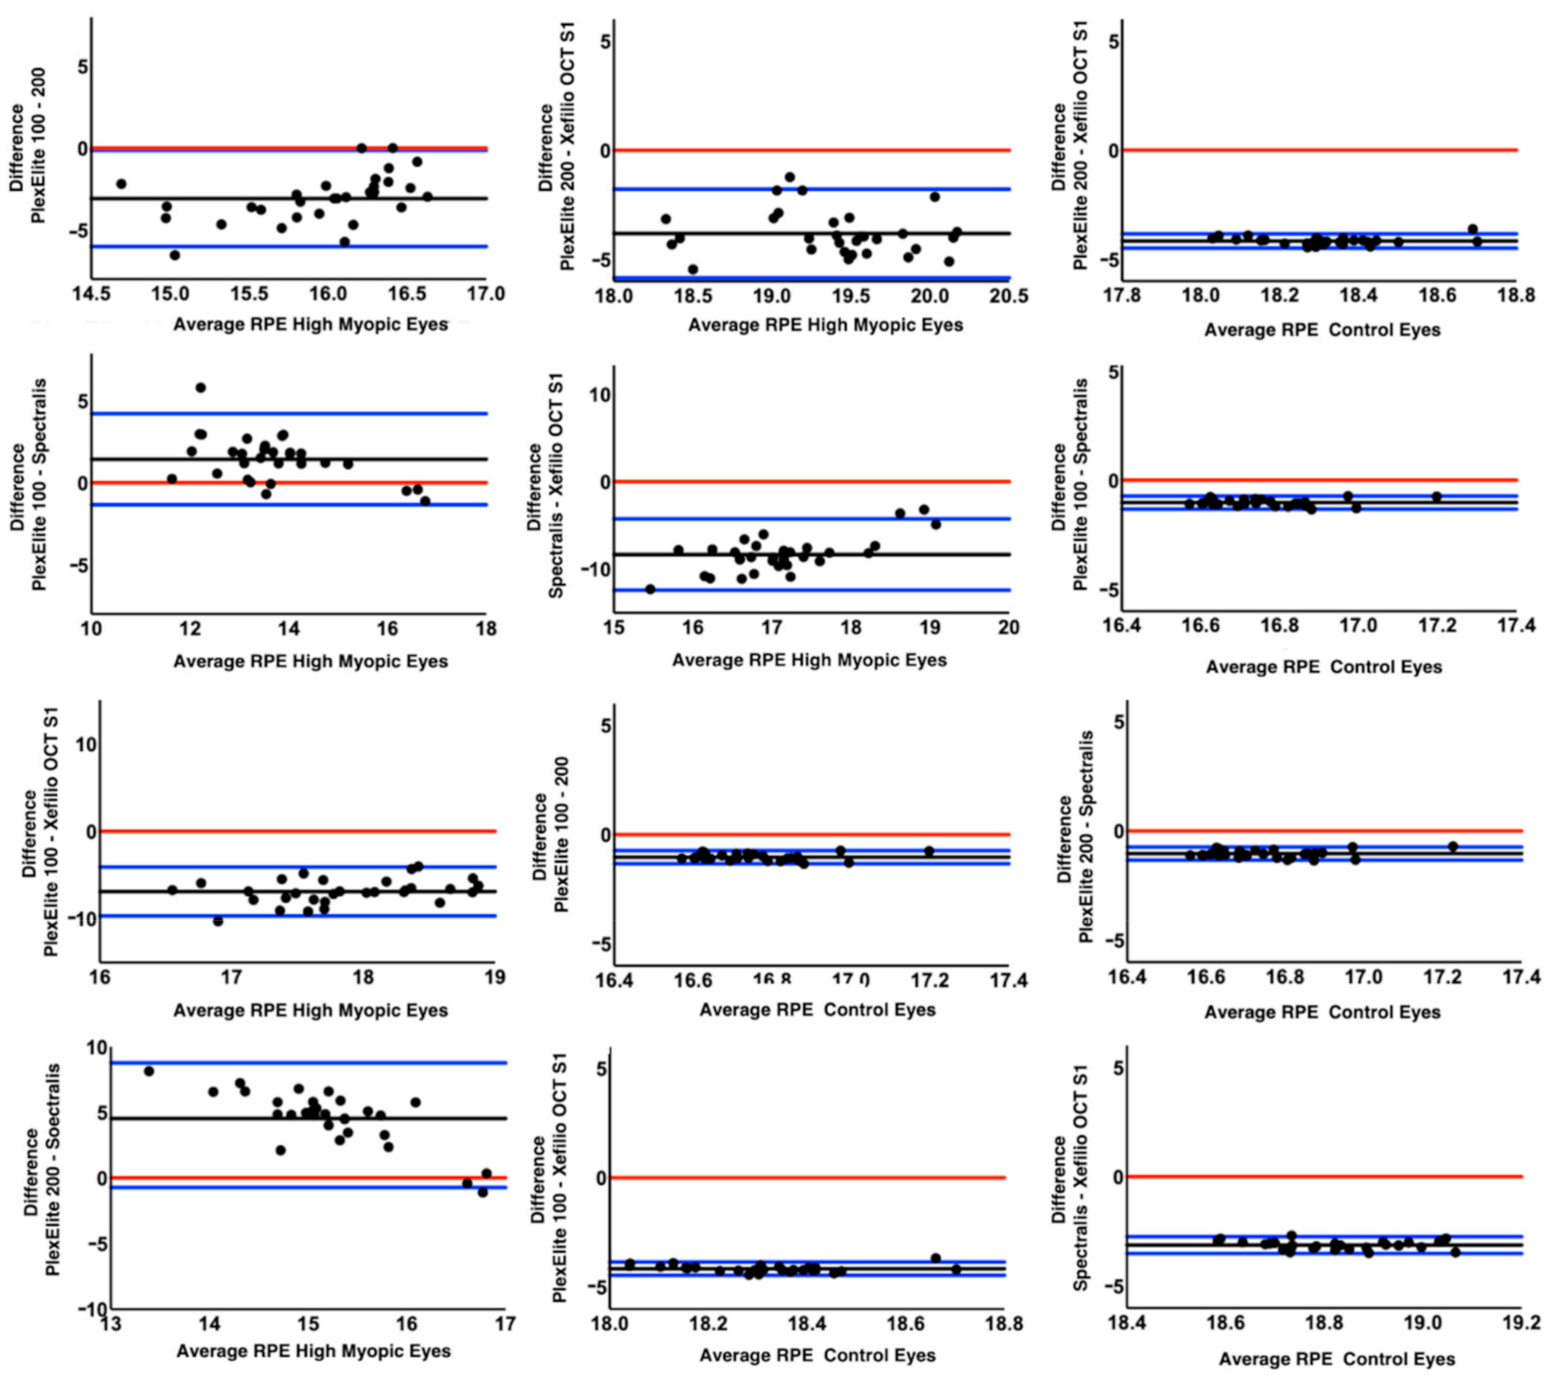
3.1. RPE Length
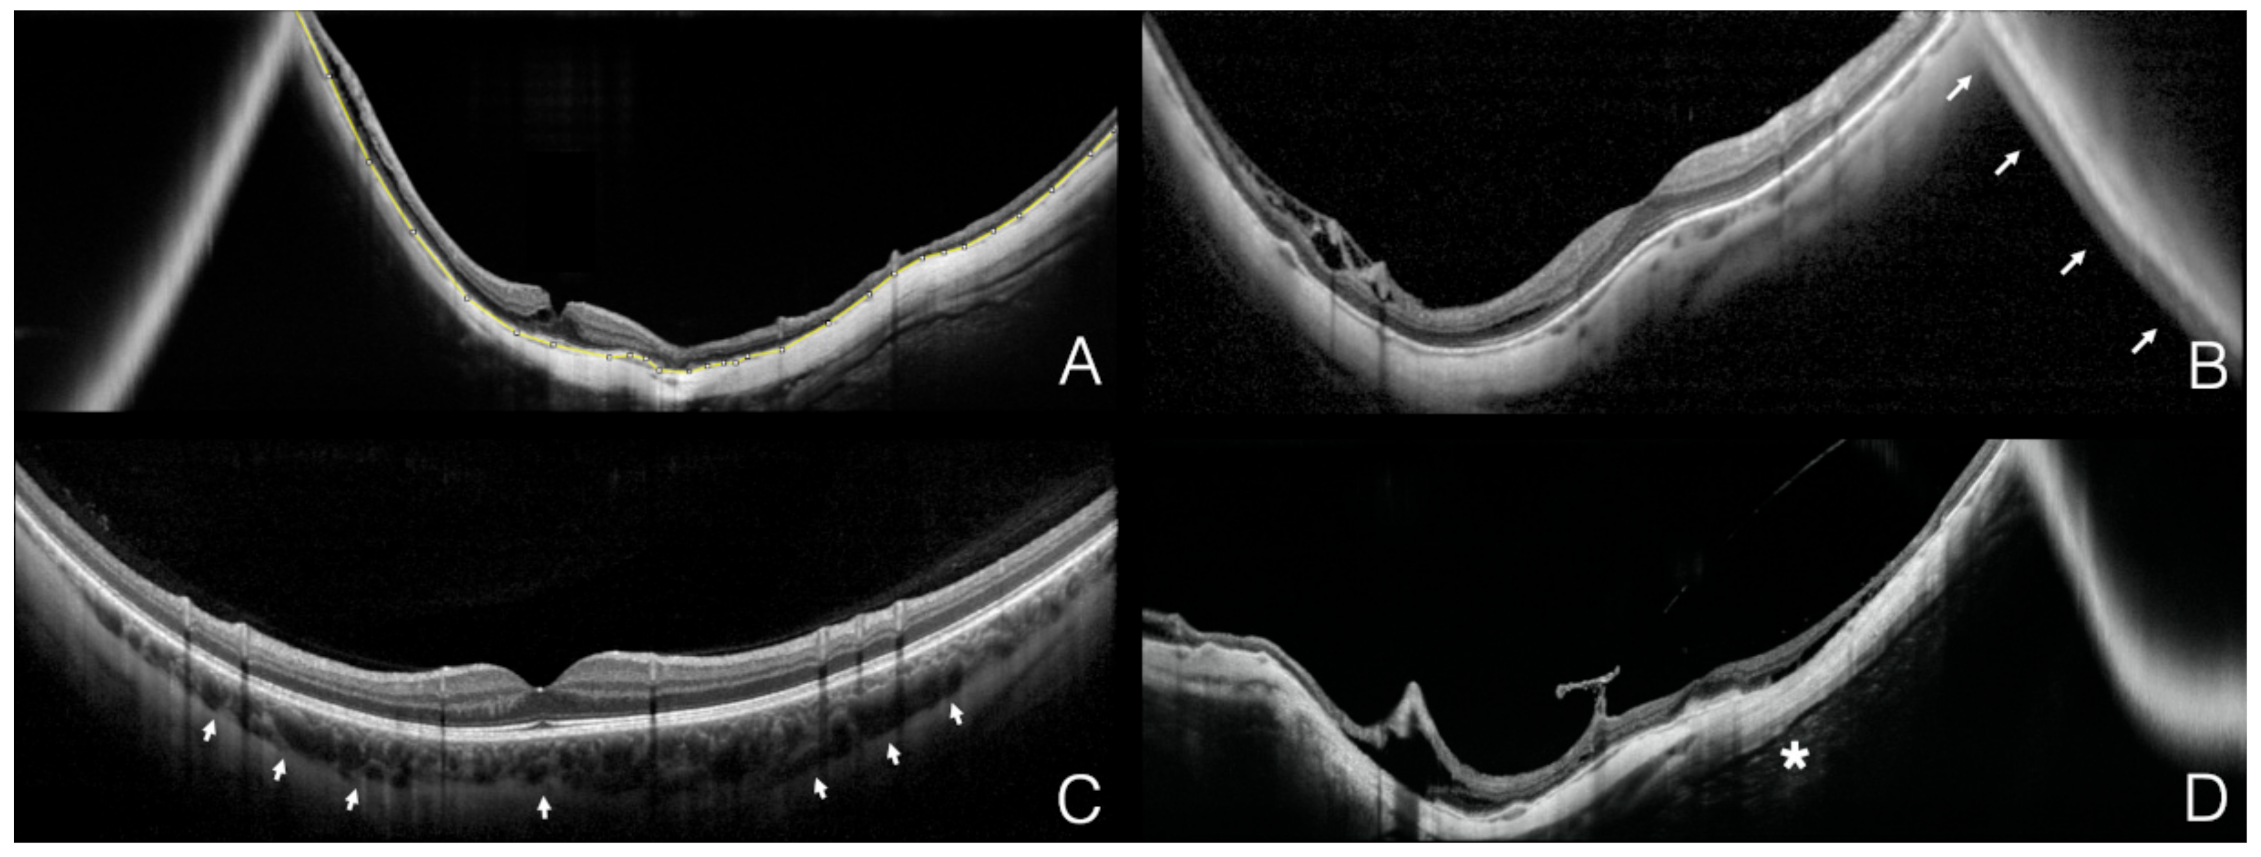
3.2. Conjugate Image Artifact
3.3. Sclerochoroidal Interface Visibility
3.4. Retrobulbar Tissue Visibility
4. Discussion
Supplementary Materials
Author Contributions
Funding
Institutional Review Board Statement
Informed Consent Statement
Data Availability Statement
Conflicts of Interest
References
- Holden, B.A.; Fricke, T.R.; Wilson, D.A.; Jong, M.; Naidoo, K.S.; Sankaridurg, P.; Wong, T.Y.; Naduvilath, T.J.; Resnikoff, S. Global Prevalence of Myopia and High Myopia and Temporal Trends from 2000 through 2050. Ophthalmology 2016, 123, 1036–1042. [Google Scholar] [CrossRef] [PubMed] [Green Version]
- Morgan, I.G.; Ohno-Matsui, K.; Saw, S.-M. Myopia. Lancet 2012, 379, 1739–1748. [Google Scholar] [CrossRef]
- Moriyama, M.; Ohno-Matsui, K.; Hayashi, K.; Shimada, N.; Yoshida, T.; Tokoro, T.; Morita, I. Topographic Analyses of Shape of Eyes with Pathologic Myopia by High-Resolution Three-Dimensional Magnetic Resonance Imaging. Ophthalmology 2011, 118, 1626–1637. [Google Scholar] [CrossRef] [PubMed]
- Ruiz-Medrano, J.; Montero, J.A.; Flores-Moreno, I.; Arias, L.; García-Layana, A.; Ruiz-Moreno, J.M. Myopic maculopathy: Current status and proposal for a new classification and grading system (ATN). Prog. Retin. Eye Res. 2019, 69, 80–115. [Google Scholar] [CrossRef] [PubMed]
- La Spina, C.; Corvi, F.; Bandello, F.; Querques, G. Static characteristics and dynamic functionality of retinal vessels in longer eyes with or without pathologic myopia. Graefe’s Arch. Clin. Exp. Ophthalmol. 2016, 254, 827–834. [Google Scholar] [CrossRef] [PubMed]
- Ohno-Matsui, K.; Lai, T.Y.; Lai, C.-C.; Cheung, C.M.G. Updates of pathologic myopia. Prog. Retin. Eye Res. 2016, 52, 156–187. [Google Scholar] [CrossRef]
- French, A.N.; Morgan, I.G.; Burlutsky, G.; Mitchell, P.; Rose, K.A. Prevalence and 5- to 6-Year Incidence and Progression of Myopia and Hyperopia in Australian Schoolchildren. Ophthalmology 2013, 120, 1482–1491. [Google Scholar] [CrossRef] [PubMed]
- Querques, G.; Corvi, F.; Balaratnasingam, C.; Casalino, G.; Parodi, M.B.; Introini, U.; Freund, K.B.; Bandello, F. Lacquer Cracks and Perforating Scleral Vessels in Pathologic Myopia: A Possible Causal Relationship. Am. J. Ophthalmol. 2015, 160, 759–766. [Google Scholar] [CrossRef] [PubMed]
- Huang, D.; Swanson, E.A.; Lin, C.P.; Schuman, J.S.; Stinson, W.G.; Chang, W.; Hee, M.R.; Flotte, T.; Gregory, K.; Puliafito, C.A. Optical coherence tomography. Science 1991, 254, 1178–1781. [Google Scholar] [CrossRef] [PubMed] [Green Version]
- Drexler, W.; Morgner, U.; Ghanta, R.K.; Kärtner, F.X.; Schuman, J.S.; Fujimoto, J.G. Ultrahigh-resolution ophthalmic optical coherence tomography. Nat. Med. 2001, 7, 502–507. [Google Scholar] [CrossRef] [PubMed]
- Spaide, R.F.; Koizumi, H.; Pozonni, M.C. Enhanced Depth Imaging Spectral-Domain Optical Coherence Tomography. Am. J. Ophthalmol. 2008, 146, 496–500. [Google Scholar] [CrossRef] [PubMed]
- Pang, C.E.; Freund, K.B.; Engelbert, M. Enhanced vitreous imaging technique with spectral-domain optical coherence tomography for evaluation of posterior vitreous detachment. JAMA Ophthalmol. 2014, 132, 1148–1150. [Google Scholar] [CrossRef] [PubMed] [Green Version]
- Ohno-Matsui, K.; Akiba, M.; Ishibashi, T.; Moriyama, M. Observations of Vascular Structures within and Posterior to Sclera in Eyes with Pathologic Myopia by Swept-Source Optical Coherence Tomography. Investig. Opthalmology Vis. Sci. 2012, 53, 7290–7298. [Google Scholar] [CrossRef] [PubMed] [Green Version]
- Takahashi, H.; Tanaka, N.; Shinohara, K.; Yokoi, T.; Yoshida, T.; Uramoto, K.; Ohno-Matsui, K. Ultra-Widefield Optical Coherence Tomographic Imaging of Posterior Vitreous in Eyes with High Myopia. Am. J. Ophthalmol. 2019, 206, 102–112. [Google Scholar] [CrossRef] [PubMed]
- Cereda, M.G.; Corvi, F.; Cozzi, M.; Pellegrini, M.; Staurenghi, G. Optical coherence tomography 2: Diagnostic tool to study periph-eral vitreoretinal pathologies. Retina 2019, 39, 415–421. [Google Scholar] [CrossRef] [PubMed]
- Ho, J.; Castro, D.P.E.; Castro, L.C.; Chen, Y.; Liu, J.; Mattox, C.; Krishnan, C.; Fujimoto, J.G.; Schuman, J.S.; Duker, J.S. Clinical Assessment of Mirror Artifacts in Spectral-Domain Optical Coherence Tomography. Investig. Opthalmol. Vis. Sci. 2010, 51, 3714–3720. [Google Scholar] [CrossRef] [PubMed]
- Invernizzi, A.; Giani, A.; Cigada, M.; Staurenghi, G. Retrobulbar Structure Visualization with Enhanced Depth Imaging Optical Coherence Tomography. Investig. Opthalmol. Vis. Sci. 2013, 54, 2678–2684. [Google Scholar] [CrossRef] [PubMed] [Green Version]
- Yamanari, M.; Lim, Y.; Makita, S.; Yasuno, Y. Visualization of phase retardation of deep posterior eye by polarization-sensitive swept-source optical coherence tomography with 1-microm probe. Opt. Express. 2009, 17, 12385–12396. [Google Scholar] [CrossRef] [PubMed] [Green Version]
- Shinohara, K.; Moriyama, M.; Shimada, N.; Yoshida, T.; Ohno-Matsui, K. Characteristics of Peripapillary Staphylomas Associated With High Myopia Determined by Swept-Source Optical Coherence Tomography. Am. J. Ophthalmol. 2016, 169, 138–144. [Google Scholar] [CrossRef] [PubMed]
- Karska-Basta, I.; Kubicka-Trząska, A.; Chrząszcz, M.; Pociej-Marciak, W.; Romanowska-Dixon, B. Toxocara Optic Disc Granulo-ma: Deep Range Imaging Optical Coherence Tomography Findings. Case Rep. Ophthalmol. 2019, 10, 339–343. [Google Scholar] [CrossRef] [PubMed]


| Device | Version | Wavelength | Technology | Scan Speed | Field of View | X, Y, Z Scan Dimension | Z Scan Pixels µm/pixel |
|---|---|---|---|---|---|---|---|
| Spectralis SD-OCT2 | 1.10.4.0 | 880 µm | Spectral domain | 85,000 A-scan/s | 55° | 17.8 mm, 17.8 mm, 1.9 mm | 496 pixel 3.87 µm/pixel |
| Plex Elite 100 kHz | 2.0.1.47652 | 1060 µm | Swept source | 100,000 A-scan/s | 56° | 16 mm, 16 mm, 3 mm | 1536 pixel 1.95 µm/pixel |
| Plex Elite 200 kHz | 2.0.1.47652 | 1060 µm | Swept source | 100,000 A-scan/s | 56° | 16 mm, 16 mm, 6 mm | 3072 pixel 1.95 µm/pixel |
| Xephilio OCT-S1 | 1.0.0.18 | 1060 µm | Swept source | 100,000 A-scan/s | 80° by 70° | 23 mm, 20 mm, 5.3 mm | 1324 pixel 4 µm/pixel |
| Features | Spectralis SD-OCT 2 | Plex Elite 100 kHz | Plex Elite 200 kHz | Xephilio OCT-S1 |
|---|---|---|---|---|
| RPE length horizontal scan, mm | ||||
| High Myopia | 12.05 | 14.01 | 16.81 | 22.52 |
| Controls | 17.16 | 16.02 | 16.25 | 23.46 |
| RPE length vertical scan, mm | ||||
| High Myopia | 12.96 | 14.4 | 17.58 | 21.29 |
| Controls | 17.13 | 16.2 | 16.26 | 20.49 |
| Conjugate Image Artifact, n (%) | ||||
| High Myopia | 61 (51) | 54 (45) | 6 (5) | 39 (33) |
| Controls | 8 (6) | 4 (3) | 1 (0) | 1 (0) |
| Sclerochoroidal interface, n (%) | ||||
| High Myopia | 120 (100) | 120 (100) | 120 (100) | 120 (100) |
| Controls | 120 (100) | 120 (100) | 120 (100) | 120 (100) |
| Retrobulbar tissue visibility, n (%) | ||||
| High Myopia | 21 (18) | 53 (44) | 47 (39) | 32 (27) |
| Controls | 0 (0) | 3 (3) | 3 (3) | 1 (1) |
Publisher’s Note: MDPI stays neutral with regard to jurisdictional claims in published maps and institutional affiliations. |
© 2021 by the authors. Licensee MDPI, Basel, Switzerland. This article is an open access article distributed under the terms and conditions of the Creative Commons Attribution (CC BY) license (https://creativecommons.org/licenses/by/4.0/).
Share and Cite
Corvi, F.; Zicarelli, F.; Airaldi, M.; Parrulli, S.; Cozzi, M.; Monteduro, D.; Romano, F.; Sadda, S.R.; Staurenghi, G. Comparison between Widefield Optical Coherence Tomography Devices in Eyes with High Myopia. Diagnostics 2021, 11, 658. https://doi.org/10.3390/diagnostics11040658
Corvi F, Zicarelli F, Airaldi M, Parrulli S, Cozzi M, Monteduro D, Romano F, Sadda SR, Staurenghi G. Comparison between Widefield Optical Coherence Tomography Devices in Eyes with High Myopia. Diagnostics. 2021; 11(4):658. https://doi.org/10.3390/diagnostics11040658
Chicago/Turabian StyleCorvi, Federico, Federico Zicarelli, Matteo Airaldi, Salvatore Parrulli, Mariano Cozzi, Davide Monteduro, Francesco Romano, SriniVas R. Sadda, and Giovanni Staurenghi. 2021. "Comparison between Widefield Optical Coherence Tomography Devices in Eyes with High Myopia" Diagnostics 11, no. 4: 658. https://doi.org/10.3390/diagnostics11040658