1. Introduction
The classical indicators for evaluating the function of the left ventricle in an echocardiogram show that the heart is shaped like a sphere, causing many errors. To counteract this, the myocardial performance index (MPI), designed by Tei et al. [
1], was created on the basis of the fact that the isovolumetric contraction time (IVCT) is increased in the event of systolic failure, and that the isovolumetric relaxation time (IVRT) is increased in the event of systolic and relaxation disorders. The MPI, also called the Tei index (TI), is produced by dividing the sum of the IVCT and the IVRT by the ejection time (ET), which can easily quantitatively evaluate the overall cardiac function by combining the heart systolic and relaxation functions and does not rely on geometric assumptions. If the heart function is abnormal, the isovolumetric time is extended and the ET is reduced, which in turn increases the MPI [
1,
2].
The MPI, meanwhile, measures each waveform using Doppler signals from the aortic valve and mitral valve inflow blood flow in the left ventricle, which is not measured in the same heart cycle, and thus it is difficult to determine if there is an excessive variation of heart rate. Friedman et al. devised a modified MPI measurement method for applying MPI to fetuses, which allows the Doppler measurement position to be obtained simultaneously from one cross-section by placing the position of the Doppler measurement tool in the middle of the ventricle inlet and outlet [
3]. Hernandez et al. enhanced the reproducibility of measurements by using valve signals that appear as high signals in the waveform as valve clicks, on the basis of Friedman’s method’s high variability of measurements due to the absence of a clear reference point at the measurement site [
4]. This modified myocardial performance index (Mod-MPI) has been verified by several researchers for clinical validity and is widely used to assess the function of the heart in intrauterine growth retardation (IUGR), preeclampsia, gestational diabetes, and twin-to-twin transfusion syndrome (TTTS) [
5,
6,
7,
8]. To this day, many authors have published research results on fetal MPI, but each study has shown a large difference in the results [
8,
9]. In general, the MPI is measured 0.53 ± 0.31 from mid-term to early term pregnancy (18 to 31 weeks pregnant) [
3], but there has been no report of the standard time to do so. This is due to the nature of ultrasound testing, which must be measured at the subjective judgment of the examiner, and to overcome these problems, several recent studies have developed various methods of automatically measuring the MPI [
10,
11,
12].
It is very important to use the left ventricular filling time to assess the performance of the heart. On the basis of this, Ahsan et al. developed a new index to measure the MPI and called it the K-index (KI) [
12]. Since the KI is produced by dividing the sum of the IVRT and the IVCT by the ventricular filling time (FT) and is very closely related to an increase in placental blood flow, it is clinically more useful to assess the MPI on the basis of the filling time (FT) than using the ET.
Ultrasound examination has the advantage of being able to acquire images in real time using non-invasive testing methods, but it also has the disadvantage of showing differences in diagnostic results depending on the equipment and the inspector’s proficiency and knowledge. Because ultrasound is an operator dependent technique, objective and quantitative image evaluation is required.
In this study, we developed an automated program to calculate the MPI to measure the cardiac time intervals and TI and KI in the left ventricle of fetuses during pregnancy. In addition, we aimed to confirm the agreement between the values measured by automatic detection and the actual measurements taken during the test.
2. Materials and Methods
2.1. Subjects
This study is a prospective cross-sectional study conducted on 133 pregnant women who visited the hospital for prenatal examination from April 2019 to February 2020. The subjects were healthy single-fertile pregnant women without complications such as gestational diabetes and gestational hypertension, and were classified into 3 groups according to the gestational age: the early pregnancy women who visited at 12 weeks, the mid-pregnancy women who visited at 22 weeks, and the late pregnancy women who visited at 31 weeks. In addition, if a pregnant woman was in a high-risk group or an obstetrician had diagnosed IUGR during prenatal examinations, the subject was excluded from the study, as well as if the quality of the images was poor or if the ventricle inflow and outflow blood were not sufficiently included. Ultrasound examination was conducted by an ultrasound technician with more than 5 years of experience, and the Doppler waveform was obtained with minimal movement of the fetus. All tests were conducted under the mother’s voluntary participation and were approved by the Institutional Review Board (IRB) of the Catholic University of Busan (CUPIRB-2019-009) on 27 March 2019.
2.2. Data Acquisition
Doppler images of the left ventricle were obtained from pregnant women who had ultrasound tests performed during pregnancy. A total of 133 waveforms were analyzed, 47 in early, 54 in mid-, and 32 in late pregnancy.
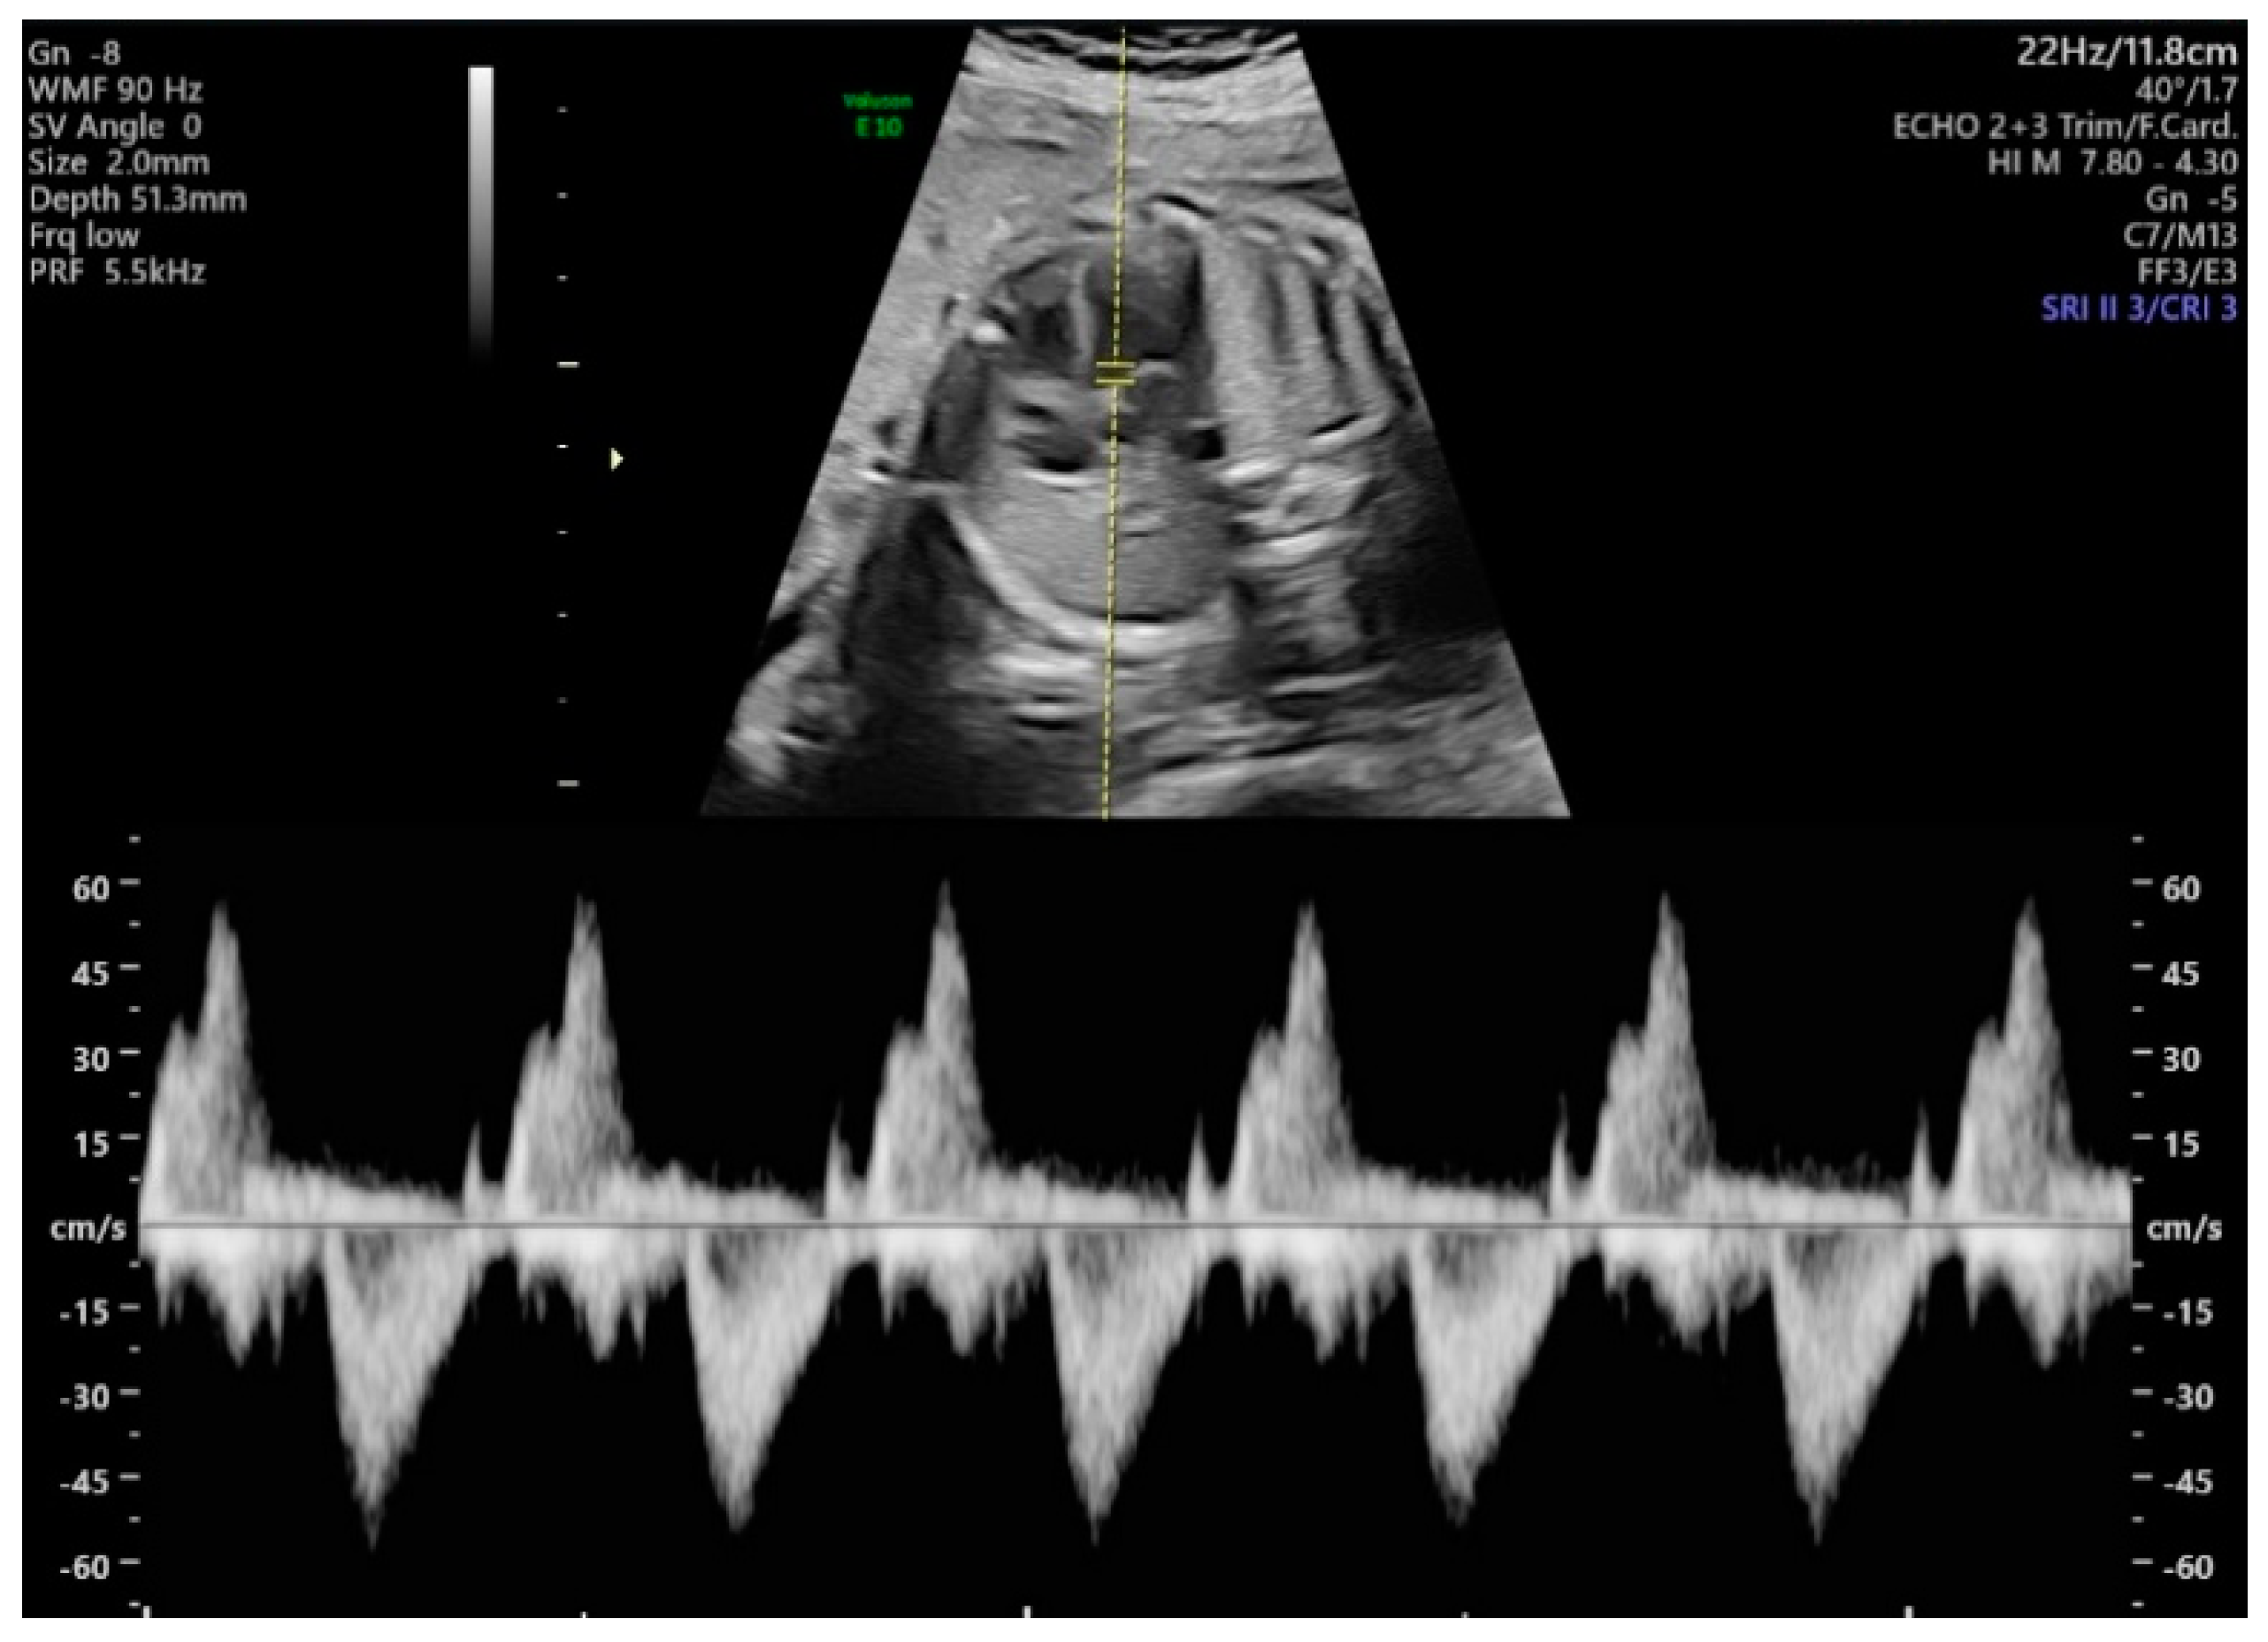
The methods used for acquiring Doppler waveforms for measuring the MPI were as follows. First, the aortic cortical part of the fetus was checked by turning the probe slightly in the direction of the fetus’ shoulder in the apical four-chamber view. Next, the pulse Doppler mode was executed, the sample volumes were positioned close to the aorta and the mitral valve, and the blood flow waveforms were obtained. Using the invert function during the examination, we set the left ventricle inflow blood flow to positive and the outflow blood flow to negative; the sweep speed was set to 5, and the sample volume size was fixed at 2 mm. Other ultrasound settings included low Doppler gain, 60 Hz wall motion filter, 8.3 kHz PRF (pulse repetition frequency), less than 0.4 thermal index and less than 0.7 mechanical index, and angle of insonation less than 20. The equipment used was a Voluson E10 ultrasound machine (GE Healthcare, Chicago, IL, USA) with a 3.5 MHz convex array probe (C2-D). The two-dimensional (2D) images and Doppler waveforms of the measurements are shown in
Figure 1, including more than 4 cycles per fetus. During the examination, one operator performed a measurement of time intervals at the same time and stored both manual and original images. Automatic measurements were made on stored images. To assess intraoperator variability, we took measurements again by the same operator on a different time.
2.3. Signal Processing of Data for Automatic Measurment
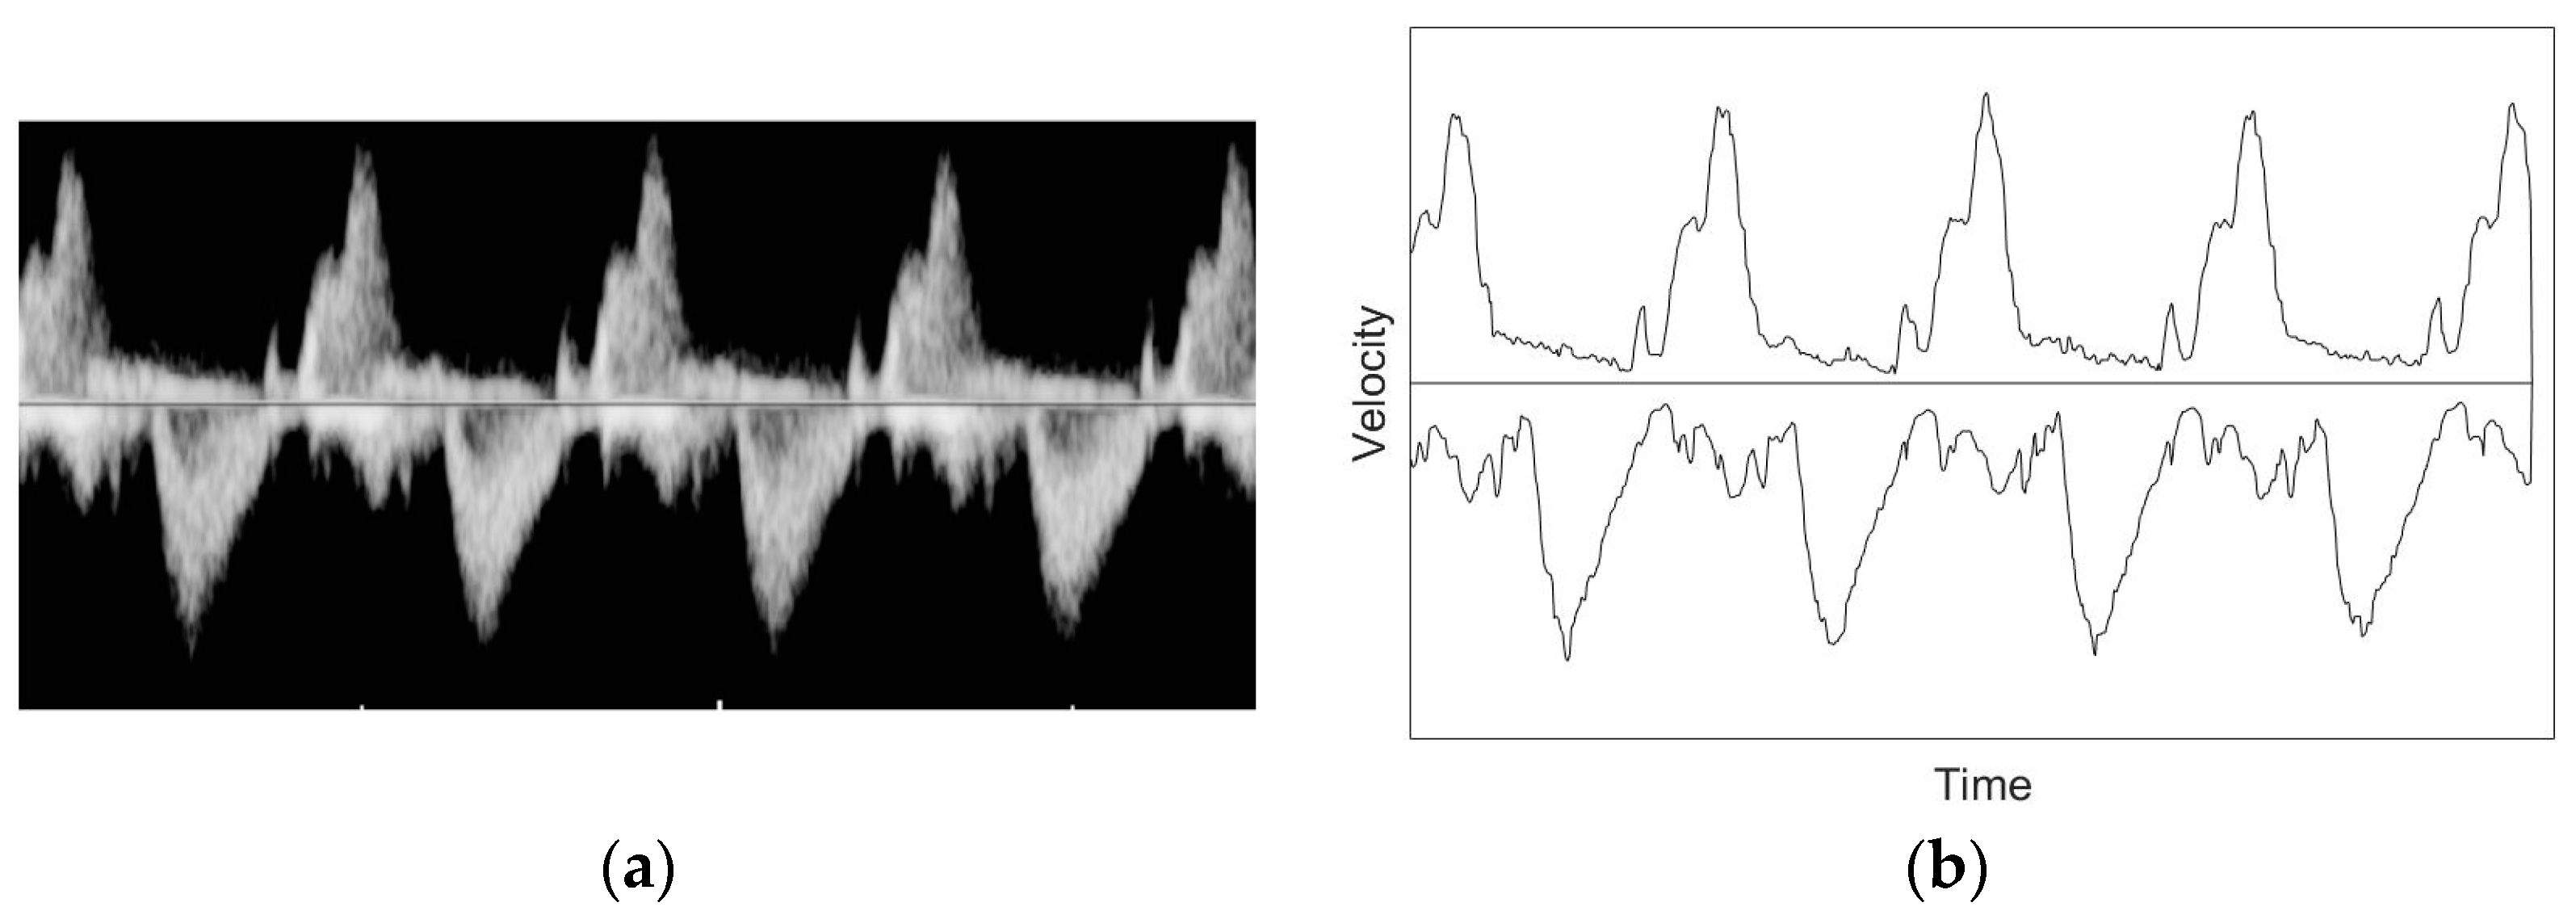
First of all, the noise in the data was reduced for a smooth measurement of the time intervals due to the fact that the existing waveforms contained variation and discontinuity. The first Doppler waveform acquired was transformed into binary images, made into simple graph images along the contour, and low-pass filters were applied to eliminate the fine variation of the signal. The Butterworth low-pass filter (BLPF) was used in this study, which generates no ripple in the passband and attenuates unwanted frequency signals outside this band. The transfer function of the BLPF is
where
is the frequency input and
is the cut-off frequency.
means the order of the filter, and the higher the order, the higher the decrease rate increases, and the frequency at the point where
of the transmission function is located is the cut-off frequency. These operations can be obtained from Equations (2) and (3).
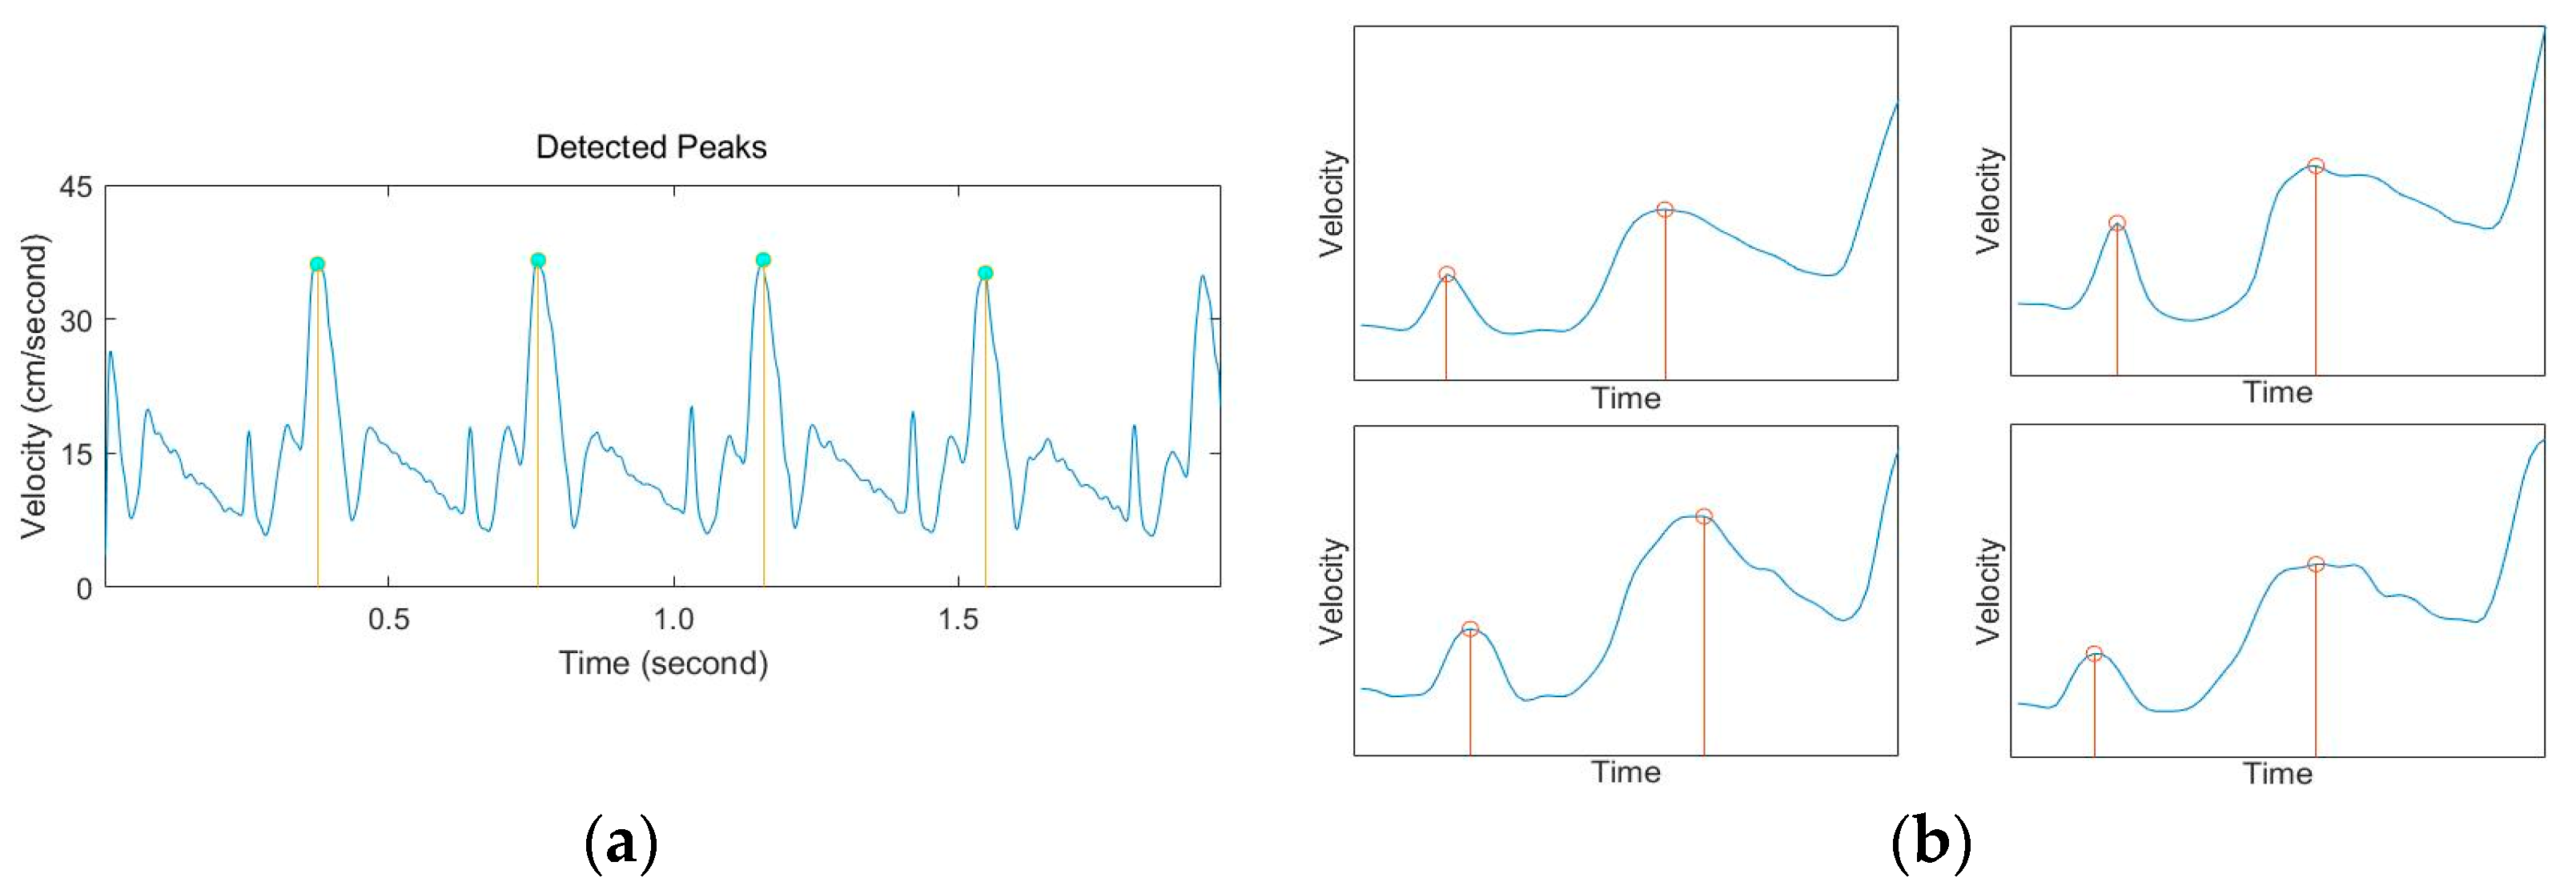
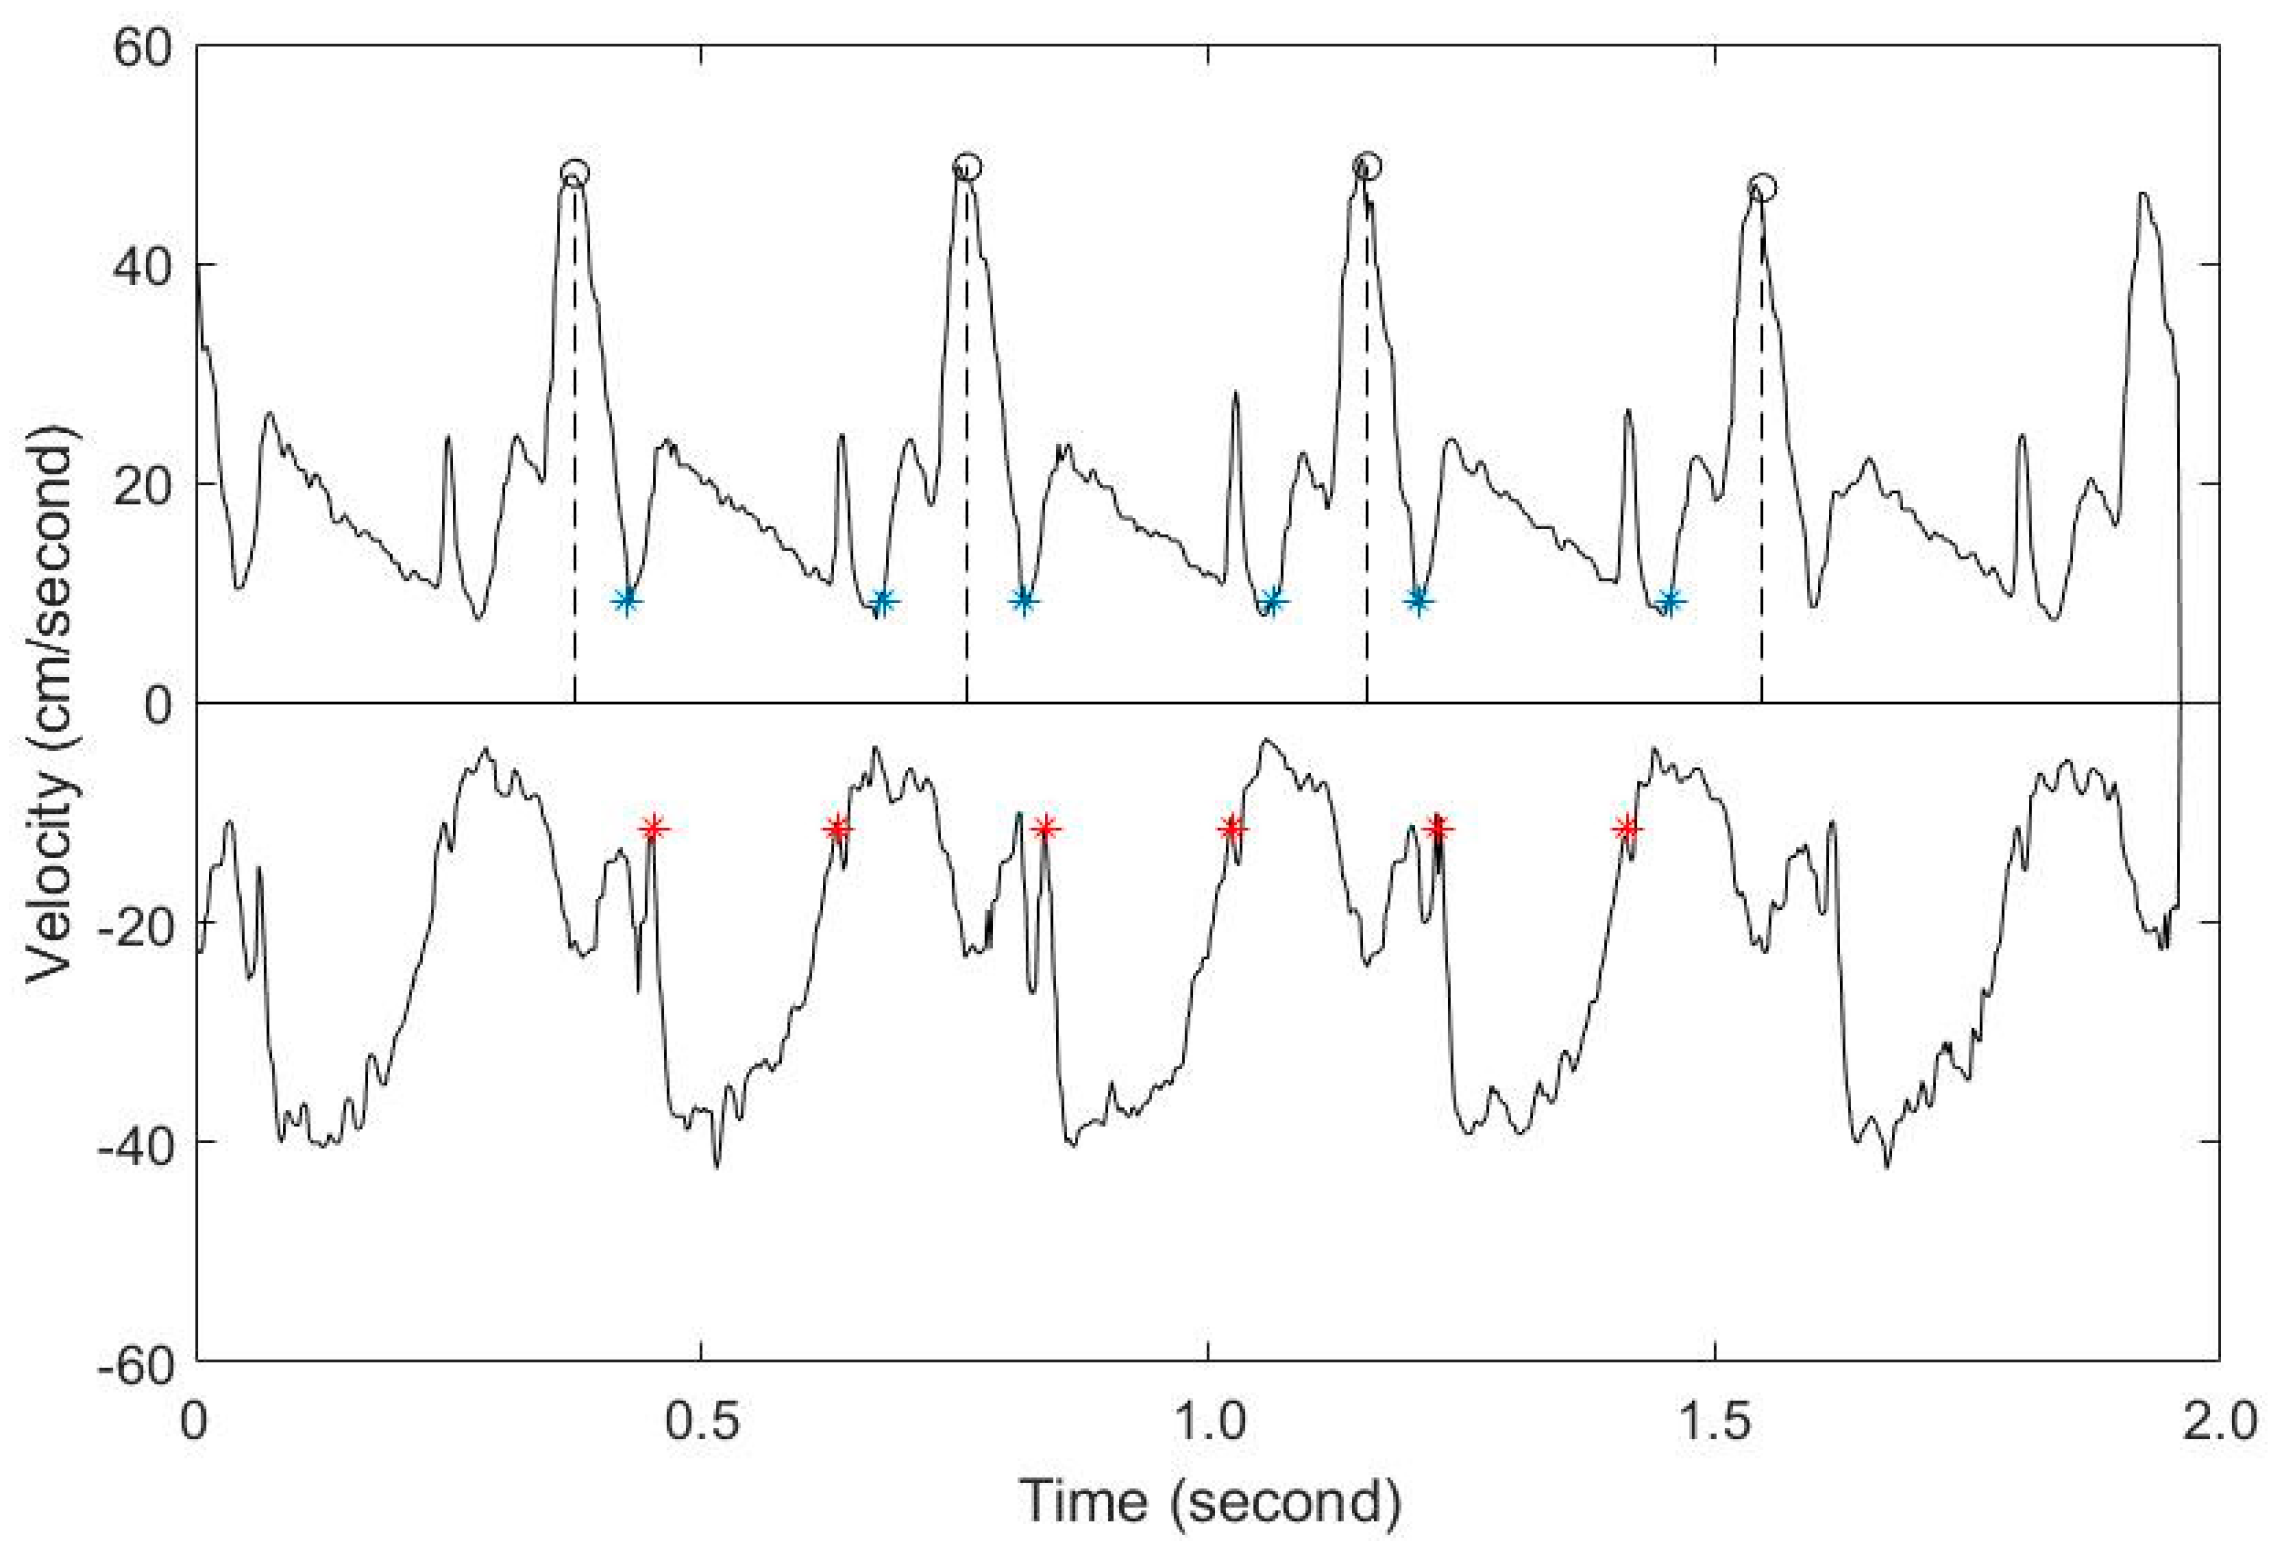
After reducing the high-frequency signal of the graph using low-pass filters, we applied the peak detection function to find the regularity of the graph according to the heart cycle. Time when blood comes into the left ventricle consists of the early diastolic period (E wave) and the atrial contraction period (A wave). Unlike adults, fetuses are more dominant in A wave, and thus the most prominent value in the graph is A wave [
13,
14,
15]. Therefore, in this study, we wanted to obtain each cardiac interval and the MPI on the basis of the maximum value of the A wave, and we used the automatic multiscale-based peak detection (AMPD) algorithm to automatically measure it.
AMPD is a peak detection method proposed by Scholkmann et al. [
16] that calculates the local maxima scalogram (LMS) from the target signal and stochastically determines the location of the peak component. Finally, the peak position is detected using the fact that the standard deviation of the scalogram is minimal. AMPD has features that make it easy for users to detect peaks without having to enter specific variables. To detect peaks using AMPD, we first used the peak characteristics that rise in the positive direction. When the quantified Doppler signal with a total length of
is
, the three signals
are compared with a sample clearance of
on both sides of
to calculate the local maximum value of
.
If
is the largest of the three compared values, the component value is
, and any value
can be used to calculate the LMS matrix, where
is an arbitrary value between
and
and
is a constant
. The LMS matrix contains information about the distribution of local maximum values.
The next step is to obtain the sum
of each row of the LMS matrix. The total sum of each row in the
array has a relatively small value.
The vector
contains the information about the scale-dependent distribution of the zeros. The global minimum of
is called the “Lambda (
) index” and is the largest local representation of the
array in the size array. The
value is used to reduce and relocate the previously obtained LMS matrix. The relocated LMS matrix can estimate the position of the peak by obtaining the standard deviation
on the basis of the column.
The peaks obtained using AMPD correspond to the A wave of the blood flow into the left ventricle and are the basis for each cycle on the graph. After setting the measurement criteria, we should determine the time of blood inflow and outflow through the process of local peak detection, which finds the maximum value by specifying a certain range. When a certain range is specified toward the negative direction of the A wave, 2 small peaks appear, corresponding to signals from the E wave and the aortic valve close to the A wave. The minimum value located between the 2 peaks is the starting point for the FT, which indicates the onset of the relaxation of the blood flow. By moving further to the left in the same way and specifying a certain range, the end point of the ET that corresponds to the maximum value of the (–) axis can be obtained. Then again, specifying a certain range on the right side of the A wave provides the FT’s end point and the ET’s starting point.
To assess intraoperator variability, measurements were taken again by the same method on a different cycle.
2.4. Calculating the MPI
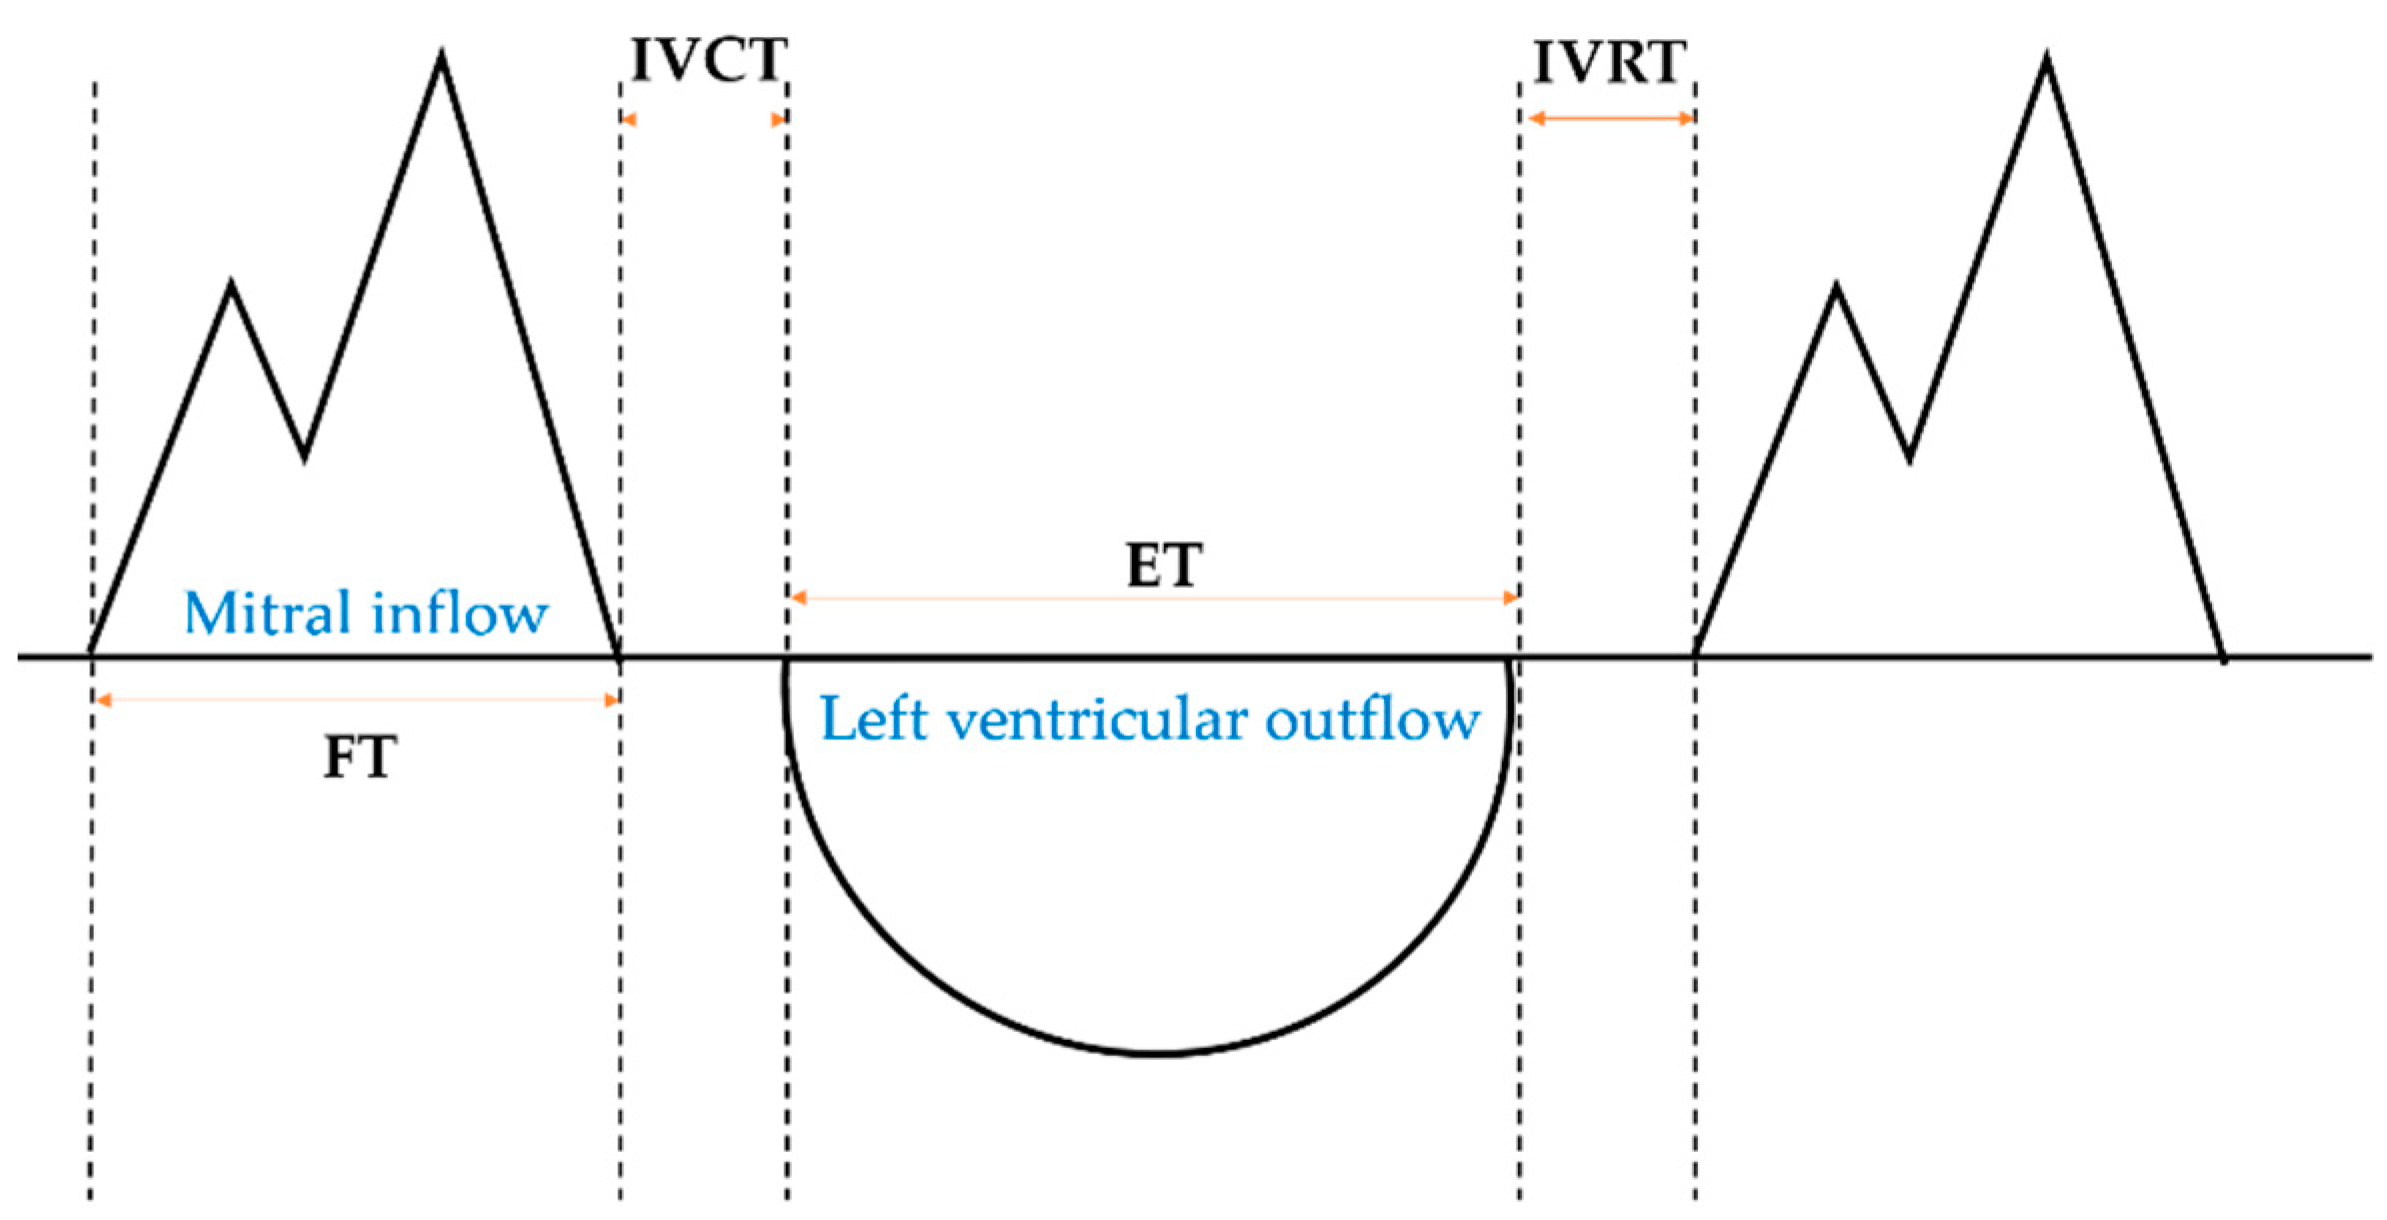
The data obtained from the Doppler graph are signals for the beginning and end of the ET and of the FT, respectively, which can be used to obtain the ET, FT, IVCT, and IVRT and to calculate the MPI (
Figure 2).
The MPI, which focuses on the contraction function of the left ventricle, is also called the Tei index (TI). It is expressed as follows [
1]:
KI is a type of MPI devised by Ahsan et al., focusing on the relaxation function of the left ventricle. It is expressed as follows [
12]:
The flowchart of the image processing conducted in this study is shown in
Figure 3.
2.5. Statistical Analysis
The mean and variance of fetal cardiac intervals measured by automatic and manual method were compared. Intra-observer reproducibility was assessed using intraclass correlation coefficients (ICCs) with 95% confidence interval (CI). All statistical significance levels (p-values) in the data were tested below the 0.05 level and IBM SPSS Statistics version 25 (IBM Corp., Armonk, NY, USA) was used for the statistical analysis.
4. Discussion
The myocardial performance index (MPI) is useful for assessing fetal blood flow anomalies, due to its advantage of being able to assess both the relaxation and contraction performance of the left ventricle [
1]. The MPI can be obtained simply by using a formula that combines the heart’s ejection and filling times, provided only the appropriate waveform is obtained for such measurements. Since 1995, when the MPI was first designed, conventional researchers have tried to use Doppler to measure the fetal MPI and to present criteria, but the results vary depending on the type of examination equipment, the quality of the images acquired, and the proficiency of the tester [
8,
9]. In particular, in the process of measuring the time interval directly on Doppler waveforms acquired during an examination, the location of the caliper specified by each inspector changes each time, which also causes variation in the measurement value. This is due to the limitation of ultrasonic testing being a semi-quantitative evaluation method, and thus it has been mentioned numerous times before that there is a need for quantitative and objective measurements. Therefore, in order to overcome the limitations of these ultrasound examinations, this study was conducted to develop algorithms applicable to actual clinical trials using automated programs. To obtain the MPI, ventricular ejection time (ET) and ventricular filling time (FT), as well as the isovolumetric contraction time (IVCT) and isovolumetric relaxation time (IVRT), should be measured first. In this study, the characteristics of the blood flow waveform were analyzed and the method of calculating the MPI after automatic measurement of time intervals at each cycle of the graph was applied. Therefore, automated measurements can be made in the same way in all cases, enabling objective measurements.
After Tei et al. first devised the MPI, Friedman et al. proposed a new method of simultaneously measuring both incoming and outgoing blood flow in a single test. Until now, this has been used primarily for the application of the MPI to fetuses, and the Doppler waveform was acquired in this study as well. In Friedman’s study, the MPI measured in 74 fetuses from 18 to 31 weeks of pregnancy was 0.53, and the MPI increased significantly as the number of weeks of pregnancy increased [
3]. Hernandez et al., who measured the heart cycle on the basis of valve signals and who measured the MPI in 557 fetuses at 0.35 in mid-term pregnancy (19 weeks) and 0.37 in late-term pregnancy (39 weeks), similarly observed an increase in the MPI as pregnancy continued [
4]. A number of subsequent studies have measured the MPI and have shown the same trend, but the measurements themselves vary considerably [
3,
4,
8,
9,
11,
17,
18,
19]. This is due to the characteristics of ultrasound testing, which require measurement with subjective judgment, and attempts to automatically measure the MPI using computers to overcome these problems were underway until recently. In Ahsan et al.’s case, the MPI was measured on the basis of the fetal electrocardiogram (ECG) signals during the test, and a total of 55 fetuses were obtained with a result value of 0.75, but there was no significant difference between the trimesters of pregnancy [
12]. However, advanced studies have already shown that the MPI increases as the fetus grows, and it takes certain equipment and complex processes to extract the actual fetus’ ECG signals; thus, various inconveniences need to be dealt with prior to clinical applications. Later, Lee’s study developed a program to measure the TI on the basis of valve signals, and observed that the TI measured in 222 fetuses was 0.33 at the beginning of pregnancy, 0.50 at the end of pregnancy, and that the TI increased as the pregnancy continued [
11].
Emphasizing the importance of the diastolic rather than the systolic phase, Ahsan et al. proposed a new MPI measurement method called the KI, and 55 fetuses were measured as 1.00 and 0.87 during and at the end of pregnancy, and the KI decreased as pregnancy continued. However, in this study, there was no significant difference in the KI in terms of the trimester of pregnancy in automatic measurement. It is theoretically correct for normal fetuses to increase in their KI as the IVCT increases by a certain amount as the number of weeks increases, but in Ahsan et al.’s study, as in this study, conflicting results were observed. In fetal circulation, some of the blood flow from the placenta goes directly through the foramen ovale to the left ventricle, but some reaches the left ventricle through the lungs, and the KI is assumed to be due to this complex flow of blood. Further research will be needed on whether the performance of a fetus’ heart affects the actual KI.
During pregnancy, cardiac time intervals and MPI change as the fetal heart grows and changes. The results of this study show that IVCT and IVRT increased as the number of weeks increased during pregnancy, and that the value of MPI increased as pregnancy continued. Such changes in each cycle over the duration of pregnancy can be explained as changes in the development of the fetal heart during pregnancy. As the fetus continues to conceive, the contraction ratio of the heart muscle increases and the thickness of the heart muscle increases, thereby increasing the fetal ventricular elasticity. This increase in relaxation ability causes E-wave to grow and consequently increases the value of MPI as pregnancy progresses.
In this study, the intra-observer reproducibility was confirmed in automatic and manual measurements. At all values, the intra class coefficient of automatic measurements was shown to be higher than the manual measurements. In other words, the automated program developed in this study indicates that fetal heart performance can be assessed quantitatively rather than manual method.
This study evaluated only healthy mothers and normal fetuses with no history of disease. This is the biggest limitation of this study, and the clinical validity of the automation program should be ensured later through comparative analysis with abnormal fetuses or high-risk mothers. The second biggest limitation in this study is the amount of data. It is difficult to represent the entire pregnant population because only 133 pregnant women were studied. However, the results of previously published prior studies differed from study to study due to the method of measurement, which relied on the subjective judgment of the examiner. This study is meaningful in that the self-developed automation program presented normal reference values of the fetal left ventricular MPI accordingly. Through this study, it is judged that it can be usefully applied as basic data for the quantitative evaluation of ultrasound examinations, as well as for the evaluation of fetuses’ heart functions in the future.


