
AriAplBud: An Aerial Multi-Growth Stage Apple Flower Bud Dataset for Agricultural Object Detection Benchmarking

Independent Researcher, Oak Brook, IL 60523, USA
Data 2024, 9(2), 36; https://doi.org/10.3390/data9020036
Submission received: 31 December 2023
/
Revised: 31 January 2024
/
Accepted: 9 February 2024
/
Published: 11 February 2024
Abstract
:As one of the most important topics in contemporary computer vision research, object detection has received wide attention from the precision agriculture community for diverse applications. While state-of-the-art object detection frameworks are usually evaluated against large-scale public datasets containing mostly non-agricultural objects, a specialized dataset that reflects unique properties of plants would aid researchers in investigating the utility of newly developed object detectors within agricultural contexts. This article presents AriAplBud: a close-up apple flower bud image dataset created using an unmanned aerial vehicle (UAV)-based red–green–blue (RGB) camera. AriAplBud contains 3600 images of apple flower buds at six growth stages, with 110,467 manual bounding box annotations as positive samples and 2520 additional empty orchard images containing no apple flower bud as negative samples. AriAplBud can be directly deployed for developing object detection models that accept Darknet annotation format without additional preprocessing steps, serving as a potential benchmark for future agricultural object detection research. A demonstration of developing YOLOv8-based apple flower bud detectors is also presented in this article.
Dataset: https://osf.io/wexu7/.
Dataset License: CC BY 4.0 DEED
Keywords:
classification; CNN; deep learning; drone; open-source; orchard; precision agriculture; RGB; UAV; YOLOv81. Summary
Object detection is the computer vision task of simultaneously localizing and classifying objects in images [1]. The advent of deep convolutional neural networks (CNNs) in the past decade has enabled the convenient identification of numerous image object types with one single algorithm [2], which could be extremely challenging, if not impossible, using traditional rule-based image processing techniques. Due to their promising potential, object detectors have been widely implemented in various disciplines [3], including agriculture. Agricultural studies utilizing object detectors typically fall into the realm of precision agriculture, with goals of minimizing agricultural inputs and maximizing agricultural outputs [4,5].
Supervised deep learning generally requires large volumes of ground truth data for model development, and CNN-based object detection is no exception. Image annotations such as bounding boxes and pixel masks can be extremely time-consuming to prepare; hence, large public datasets with readily available annotations are commonly used as benchmarks to test newly developed algorithms. Some well-known examples include ImageNet [6], MS COCO [7], PASCAL VOC [8], etc. However, such public datasets might not be sufficient to fully reveal the utility of object detectors in agriculture, as botanical objects can naturally have complex structures, high distribution density, and ambiguous characteristics, unlike artificial objects. Hence, dedicated agricultural benchmark datasets would be more suitable for evaluating object detector performance in plant-related identification tasks.
In the current literature, very few agricultural datasets intended for benchmarking object detectors remain available in public repositories. MTDC [9], created by Zou et al., is a time series maize tassel detection dataset. The image sequences were collected from four experimental fields across China from 2010 to 2015 using a digital camera with a fixed position and angle, covering six maize cultivars. The dataset in total includes 361 images with three different resolutions, 3456 × 2304, 3648 × 2736, and 4272 × 2848, and was annotated by 13,562 bounding boxes. Dang et al. released a 12-class cotton field weed dataset consisting of 5648 RGB images and 9370 bounding boxes, which was initially named DeepCottonWeeds [10] but renamed later as CottonWeedDet12 [11]. The weed images were captured using hand-held smartphones and digital cameras at Mississippi State University research farms from June to September of 2021. MinneApple [12], prepared by Hani et al., is an apple fruit detection and segmentation dataset comprising 1001 images annotated by 41,325 polygons. The images have a resolution of 1280 × 720, and were extracted from smartphone videos collected in the Horticultural Research Center of University of Minnesota from June of 2015 to September of 2016. Given the vast diversity of potential object detection research topics in agriculture, encompassing various types of crops, weeds, plant organs, diseases, and even manmade objects, substantial future efforts by the research community are still in need to enrich the comprehensiveness of public agricultural benchmark datasets.
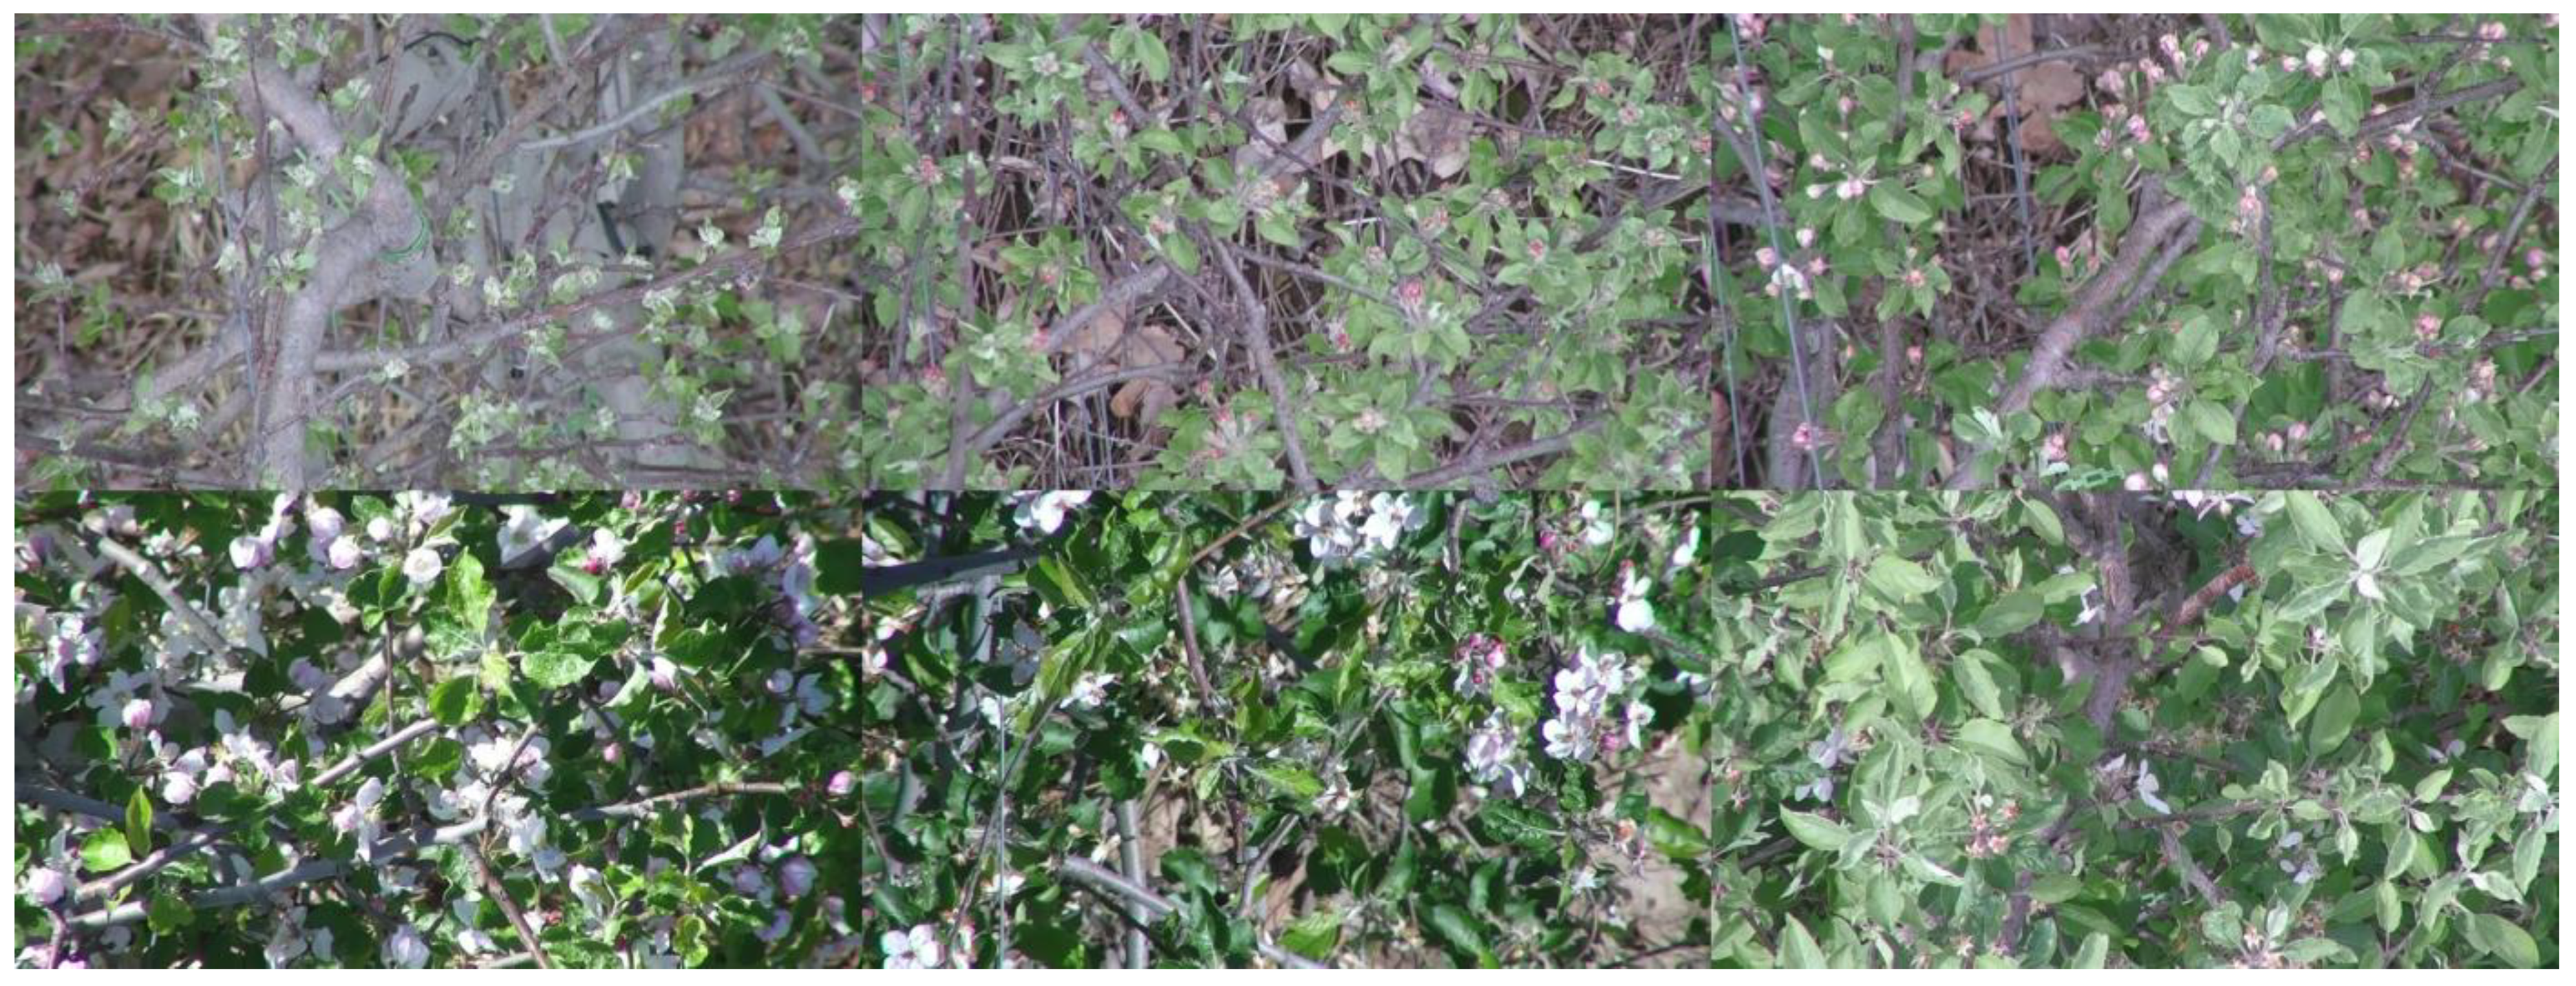
Frost is one of the most devastating natural disasters to agriculture worldwide [13]. However, current orchard frost protection methods remain rudimentary [14], and research regarding modernized precise frost management is lacking, even though technologies such as unmanned aerial vehicles (UAVs) and thermal imaging are becoming more accessible and affordable. Aiming to innovate an autonomous aerial sensing solution that can determine orchard local heating needs during frost events based on plant developmental stages [15,16], AriAplBud, an aerial apple flower bud red–green–blue (RGB) image dataset, was created, and is presented in this article. The dataset images were captured using a UAV over an apple orchard on nine dates, covering six unique apple flower bud growth stages from dormancy to senescence (Figure 1). Over 110,000 bounding box annotations were prepared on 3600 images in Darknet format. The subsequent article sections describe the data collection, image annotation, and dataset format of AriAplBud in detail, provide a YOLOv8-based model development demonstration using AriAplBud, and finally discuss the characteristics of AriAplBud.
In addition to the aforementioned public agricultural datasets [9,10,11,12], the open-sourcing of AriAplBud is intended to promote and accelerate deep learning-based computer vision research in agriculture. To date, the dataset has been utilized in three journal publications [15,17,18] and one dissertation [19] regarding CNN-based apple flower bud classification. One of the most widely adopted object detection frameworks, YOLO [20,21], was utilized and investigated in the studies, representing state-of-the-art object detectors. As a brief summary, the previous research topics included:
- Network size influence on YOLOv4 performance [15];
- YOLOv4 sensitivity analysis regarding white noise, motion blur, hue shift, saturation change, and intensity change of test images, and dataset size, annotation quality, negative sample presence, image sequence, and image distortion level of training datasets [18];
- YOLOv7 and YOLOv4 accuracy comparison under varying levels of training image annotation quality [17].
2. Dataset Creation
2.1. Orchard Location
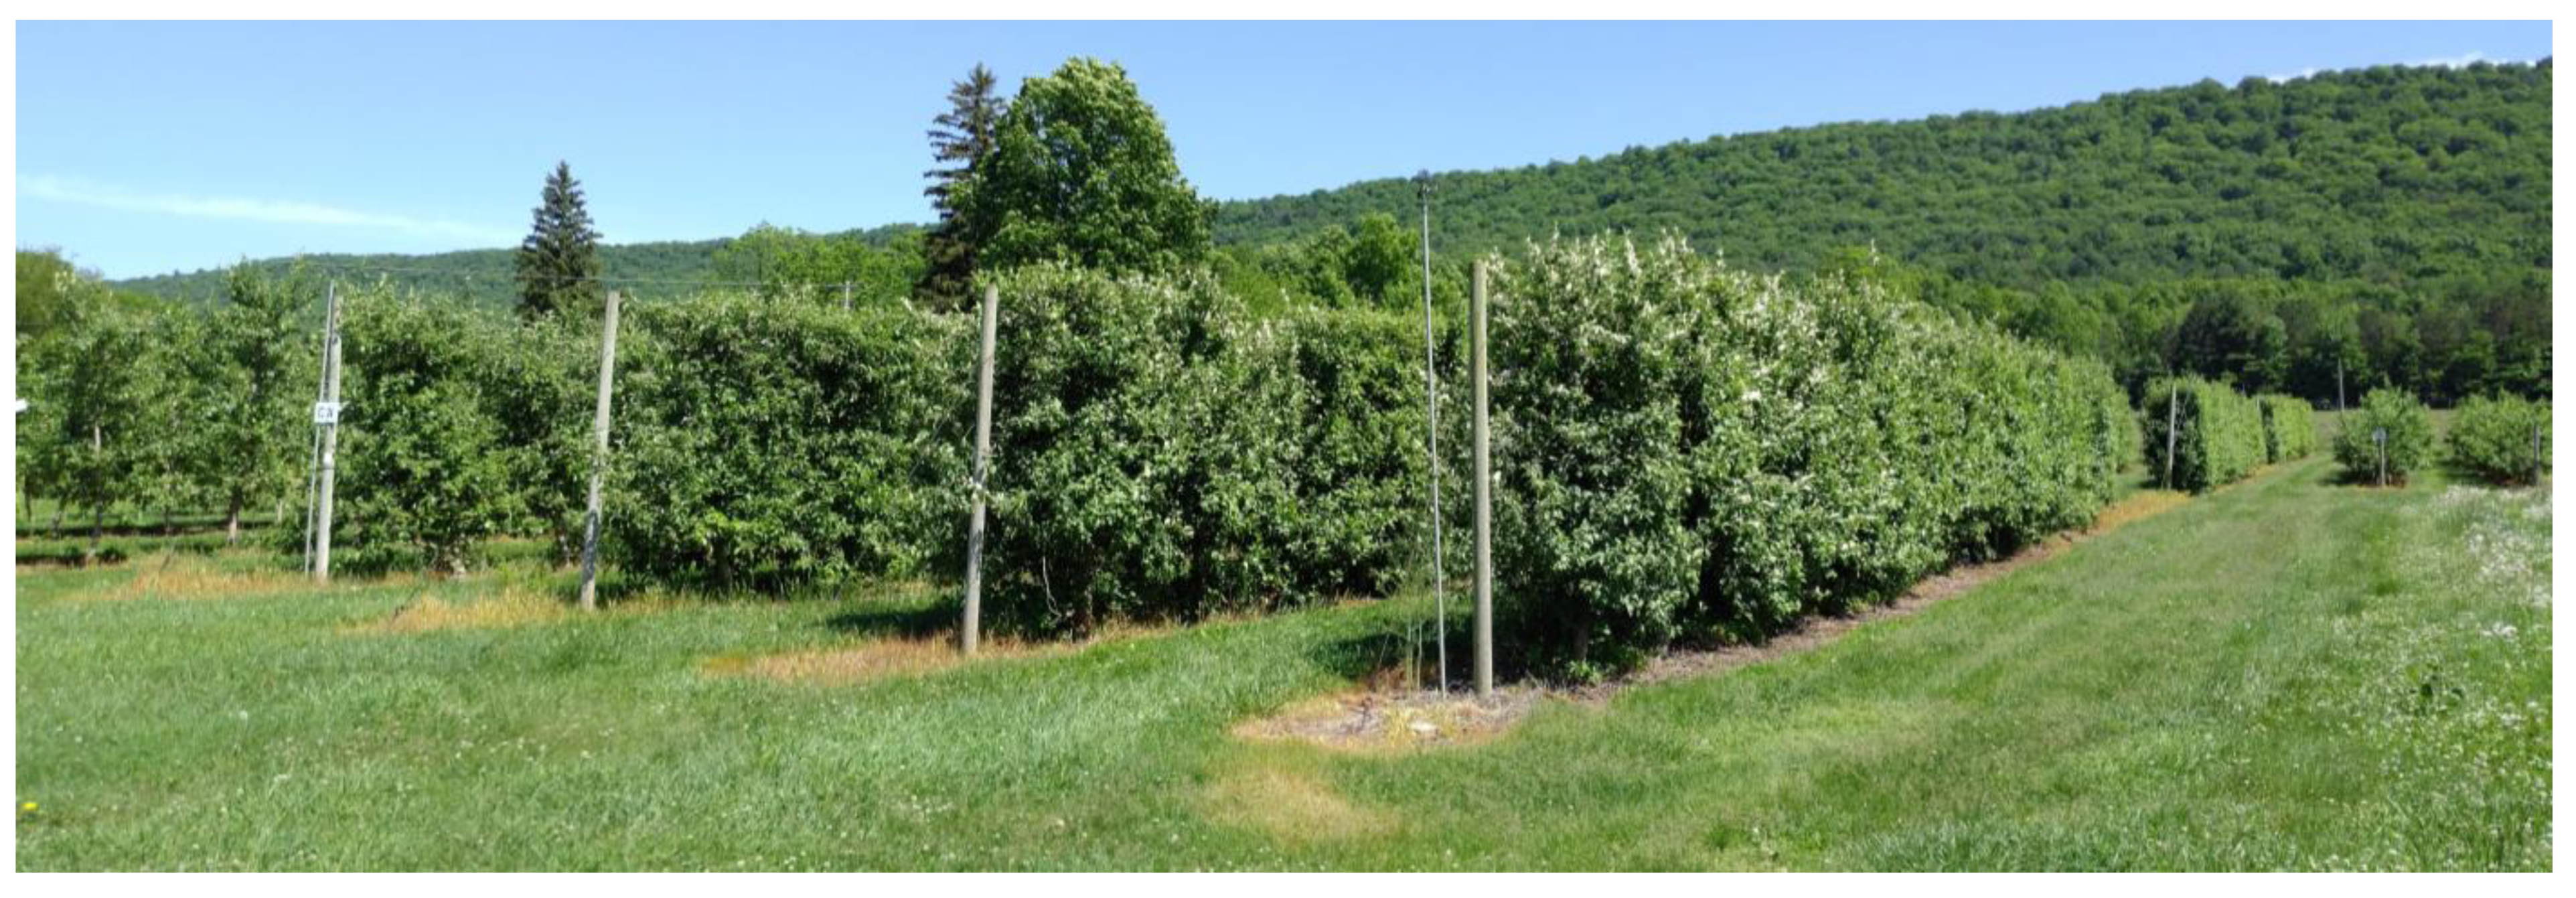
The data collection apple orchard of AriAplBud was located at the Russell E. Larson Agricultural Research Center of Penn State (40.707918° N, 77.954370° W), which no longer exists. The apple orchard had dimensions of 25 m by 15 m, consisting of two apple cultivars, namely, Jonagold and Daybreak Fuji. Each cultivar had 32 trees planted in two rows, with an approximate 1.7 m tree spacing and 2.7 m tree height (Figure 2).
2.2. Data Collection
A Matrice 600 Pro (DJI, Shenzhen, China) was used as the sensor carrying UAV for data collection, and a Zenmuse Z30 (DJI, Shenzhen, China) was selected as the RGB camera to capture the apple flower bud close-up images due to its exceptional optical zoom capability. Eight data collection sessions were conducted in April and May of 2020. During the flight missions, the UAV was manually controlled to hover above the apple trees at an above-ground level (AGL) of 10 m or 15 m so as to not cause disturbance to the tree canopies, and fly through the entire orchard at a speed no faster than 0.1 m/s to ensure image quality. The data collection sessions typically lasted 40 to 90 min, during which roughly 600 to 1100 images were captured per session with the camera zoomed in 30 times at a 90° pitch angle. Later, in September, an additional data collection session was conducted to capture empty orchard images containing no apple flower buds as negative training samples. Data collection dates and corresponding growth stages are presented in the next section.
2.3. Image Annotation
Traditionally, apple flower buds are classified into nine growth stages, including silver tip, green tip, half-inch green, tight cluster, first pink, full pink, first bloom, full bloom, and petal fall [22]. Since plant growth is a continuous gradual process, apple flower buds transitioning from one growth stage to another often lack distinct characteristics, and certain stages were observed to be rather challenging to distinguish in the captured images. As a result, a six-class system was adopted during image annotation by combining sliver tip and green tip as tip, first pink and full pink as pink, and first bloom and full bloom as bloom. To help further reduce the difficulty and improve the objectivity and consistency of the image annotation process, the following annotation guidelines were specified and implemented for AriAplBud:
- Annotate an apple flower bud as a tip when the leaves of the flower bud are not open at all;
- Annotate an apple flower bud as a half-inch green when the leaves of the flower bud are open but the florets of the flower bud are not visible;
- Annotate an apple flower bud as a tight cluster when the florets of the flower bud are visible but show no pink color;
- Annotate an apple flower bud as a pink when the florets of the flower bud show pink color, or annotate an apple flower as a pink when the petals of the flower have yet turned mostly white;
- Annotate an apple flower as a bloom when the petals of the flower are mostly white or at least one petal is attached to the receptacle of the flower;
- Annotate an apple flower bud as a petal fall when no petals are attached to the receptacles of all the flowers, or annotate an apple flower as a petal fall when no petals are attached to the receptacles of the flower;
- For stages at or before tight cluster, include the entire apple flower bud in a bounding box;
- For stages at or after pink, exclude the apple flower bud leaves from a bounding box;
- For stages at or before tight cluster, each bounding box should contain only one apple flower bud;
- For bloom stage, each bounding box should contain only one apple flower;
- For pink and petal fall stages, annotate the flowers that belong to the same apple flower bud and are relatively close to each other in one bounding box; otherwise, annotate each flower with one bounding box;
- When knowing an apple flower bud or an apple flower exists, but the complete shape of it cannot be identified due to image blurriness or dense flower bud distribution, do not annotate;
- When in doubt whether an apple bud is a vegetative or flower bud, do not annotate.
Due to resource constraints, only 450 images were randomly selected from each of the first eight dates for image annotation. In total, 3600 images were annotated by the author and four trained research assistants in Darknet format using the open-source annotation tool YOLO-Label [23], and all the flower bud annotations were double-checked and reannotated when necessary by the author to ensure their style consistency, accuracy, and completeness. Table 1 lists the image annotation numbers of different growth stages at each data collection date.
3. Dataset Description
AriAplBud includes 3600 positive samples containing at least one apple flower bud and 2520 negative samples containing no apple flower bud, for a total of 6120 images saved in JPG format with a resolution of 1920 × 1080. The negative sample number was intentionally determined to be 70% of the positive sample number, so that equal positive and negative training sample numbers can be achieved when 70% of the positive samples are used for model development.
AriAplBud images are stored in nine folders depending on when they were captured, and the folder names represent the data collection dates of the images within the folders. For example, the folder name “041920” represents a data collection date of 19 April 2020. The first eight folders from “041920” to “052120” each contain 450 annotated positive samples, and the last folder, “092520”, contains the 2520 negative samples. Within each folder, the images were named by appending a four-digit suffix identification number to their folder name. For example, the first image in the folder “042820” was named as “042820_0001.jpg”, and the last image in the folder “050720” was named as “050720_0450.jpg”. Such a naming convention gives unique names to all the images in AriAplBud and allows them to be placed in the same folder when desired.
Along with each JPG image file in all the folders, there is also a corresponding TXT text file with an identical file name, containing the apple flower bud annotations for the image. For the negative samples in the folder “092520”, the text files are simply empty, indicating that no apple flower bud exists in the images. Similarly to the JPG image numbers, the first eight folders from “041920” to “052120” contain 450 text files, and the last folder, “092520”, contains 2520 text files. The apple flower bud annotations are in standard Darknet format, which defines a bounding box annotation in an image by a row vector of five values:
- <object_class> <x_center> <y_center> <x_width> <y_height>,
where:
- <object_class> is the zero-based index for apple flower bud growth stage, ranging from 0 to 5 as an integer and representing tip, half-inch green, tight cluster, pink, bloom, and petal fall, respectively;
- <x_center> is the bounding box center horizontal position relative to image width, ranging from 0 to 1 as a floating-point number;
- <y_center> is the bounding box center vertical position relative to image height, ranging from 0 to 1 as a floating-point number;
- <x_width> is the bounding box width relative to image width, ranging from 0 to 1 as a floating-point number;
- <y_height> is the bounding box height relative to image height, ranging from 0 to 1 as a floating-point number.
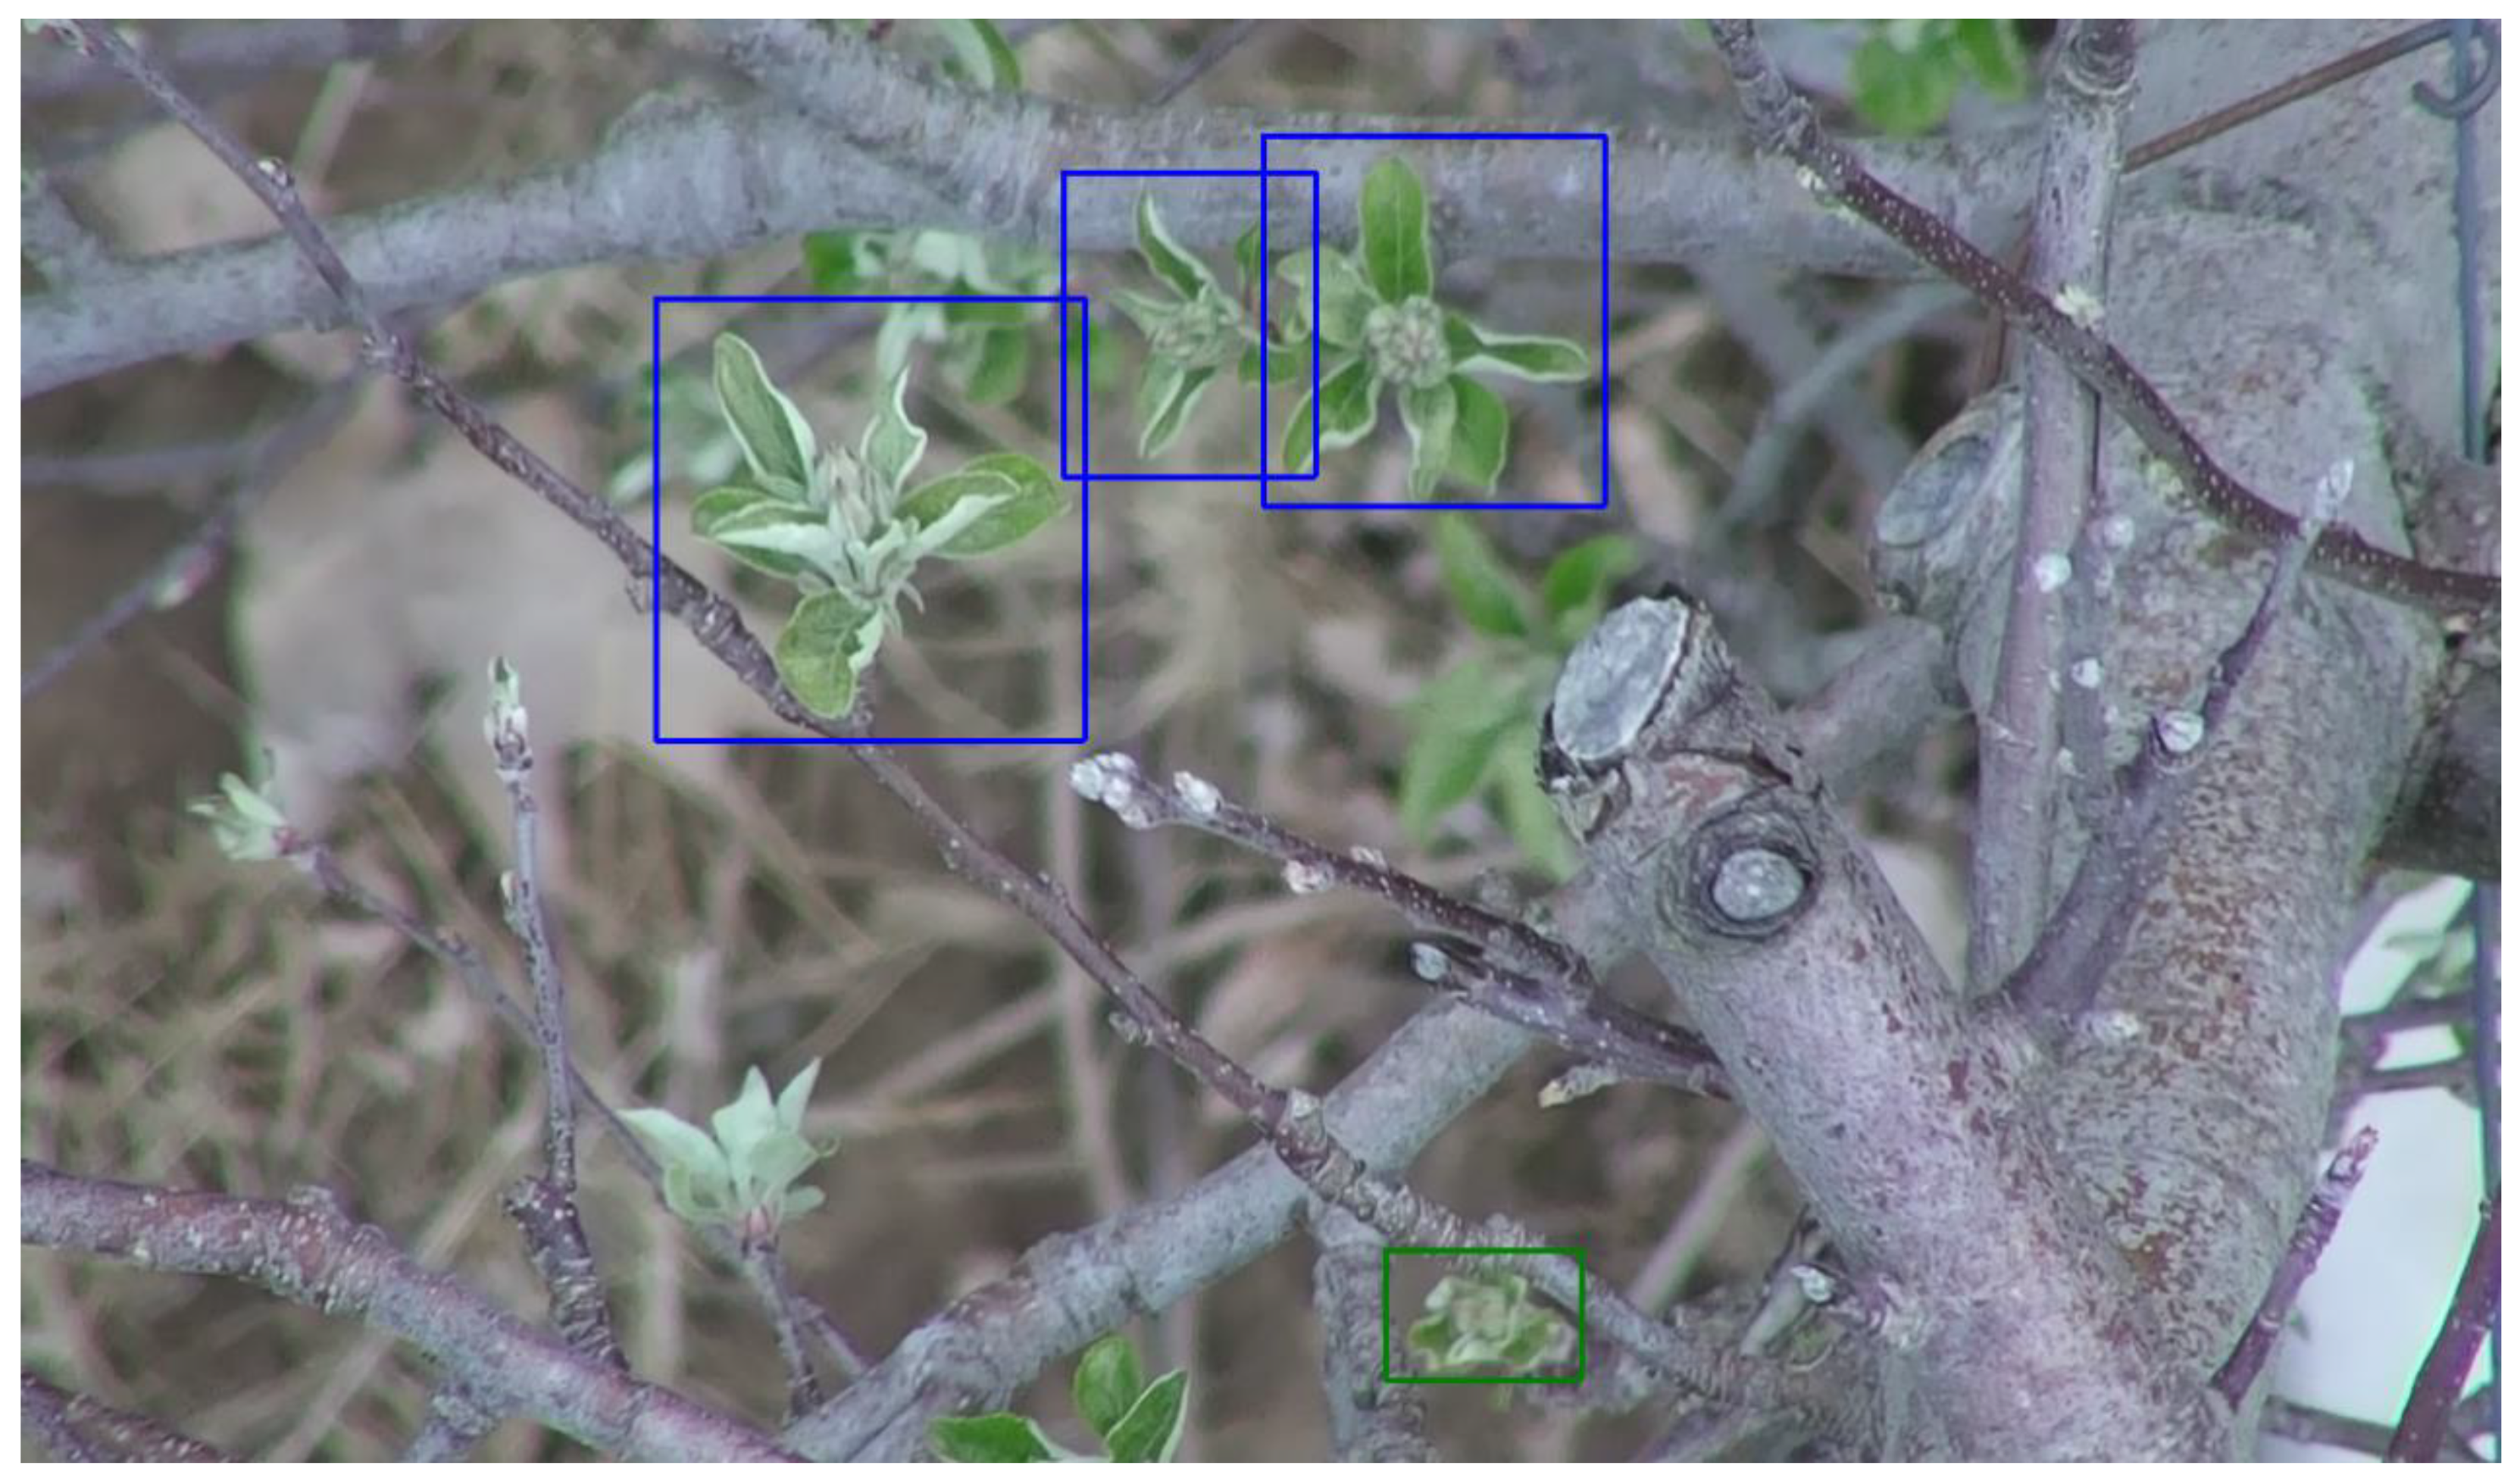
Accordingly, the number of row vectors in a text file indicates the number of bounding box annotations in the corresponding image. Using the image “041920_0041.jpg” as an example, the annotation file “041920_0041.txt” comprises:
- 2 0.342578 0.346720 0.172656 0.305221
- 2 0.569531 0.209505 0.137500 0.255689
- 2 0.471094 0.212182 0.101563 0.210174
- 1 0.589453 0.896252 0.078906 0.089692
In total, there are four bounding box annotations in the image, including three tight clusters and one half-inch green, as shown in Figure 3. Note that the apple buds facing away in the image were intentionally left unannotated according to the specified annotation guidelines, as their florets needed to be observed to confirm whether they were flower buds instead of vegetative buds.
4. Dataset Utilization
As a demonstration, this section provides a brief tutorial on developing apple flower bud classifiers with AriAplBud using the state-of-the-art object detection framework YOLOv8 [24] in Google Colab (Google LLC, Mountain View, CA, USA). Google Colab, at the time of writing, provides free access to GPU, which can significantly speed up the model training process. The tutorial below assumes a runtime of Python 3 environment and an available T4 GPU hardware accelerator. The Colab notebook containing relevant Python code is provided in Supplementary Materials.
4.1. Preparation
Download the entire dataset through the provided link as a ZIP file. Rename the ZIP file as “AriAplBud.zip” and upload it to Google Drive (Google LLC, Mountain View, CA, USA). The zip file should contain the nine subfolders from “041920” to “092520” where all the images are stored. Mount Google Drive to Google Colab so that Google Colab has access to the dataset and can save trained model weights to Google Drive permanently. As Google Colab can experience significant slowdowns when reading files from Google Drive, download the ZIP file from Google Drive to Google Colab and unzip the file in Google Colab.
Create a folder named “YOLOv8” in Google Drive and change the working directory to the folder. Create three TXT text files containing the image paths for training, validation, and test datasets. Adopting the 70–20–10 rule, the training dataset should consist of a randomly selected 70% of the positive samples from the first eight subfolders, combined with all the negative samples from the last subfolder. The validation dataset should consist of a randomly selected 20% of the positive samples. The test dataset should consist of the remaining 10% of the positive samples. Create two YAML configuration files for model training and testing, which should contain the paths to the three text files and the apple flower bud growth stage names.
4.2. Model Development
Ultralytics (Ultralytics Inc., Los Angeles, CA, USA) provides convenient YOLOv8 Python API for model training, evaluation, and prediction. Pretrained weights for five different YOLOv8 model sizes are also available, ranging from 3.2 to 68.2 million parameters based on the MS COCO dataset: YOLOv8n, YOLOv8s, YOLOv8m, YOLOv8l, and YOLOv8x. Load weights by specifying the desired YOLOv8 model version. Start model training by minimally specifying model training configuration file path. Evaluate model performance by minimally specifying model test configuration file path. Make predictions on an image using a trained model by minimally specifying the image path.
4.3. Results
A YOLOv8n model and a YOLOv8x model were developed using AriAplBud as a proof of concept of this tutorial. Batch sizes of 64 and 16 for YOLOv8n and YOLOv8x, respectively, and an epoch number of 300 were adopted during model training, keeping the rest model hyperparameters as default. Table 2 shows the performances of the two models for each apple flower bud growth stage based on average precision at 50% intersection over union (IoU) (AP50) and mean AP at 50% IoU (mAP50) [8].
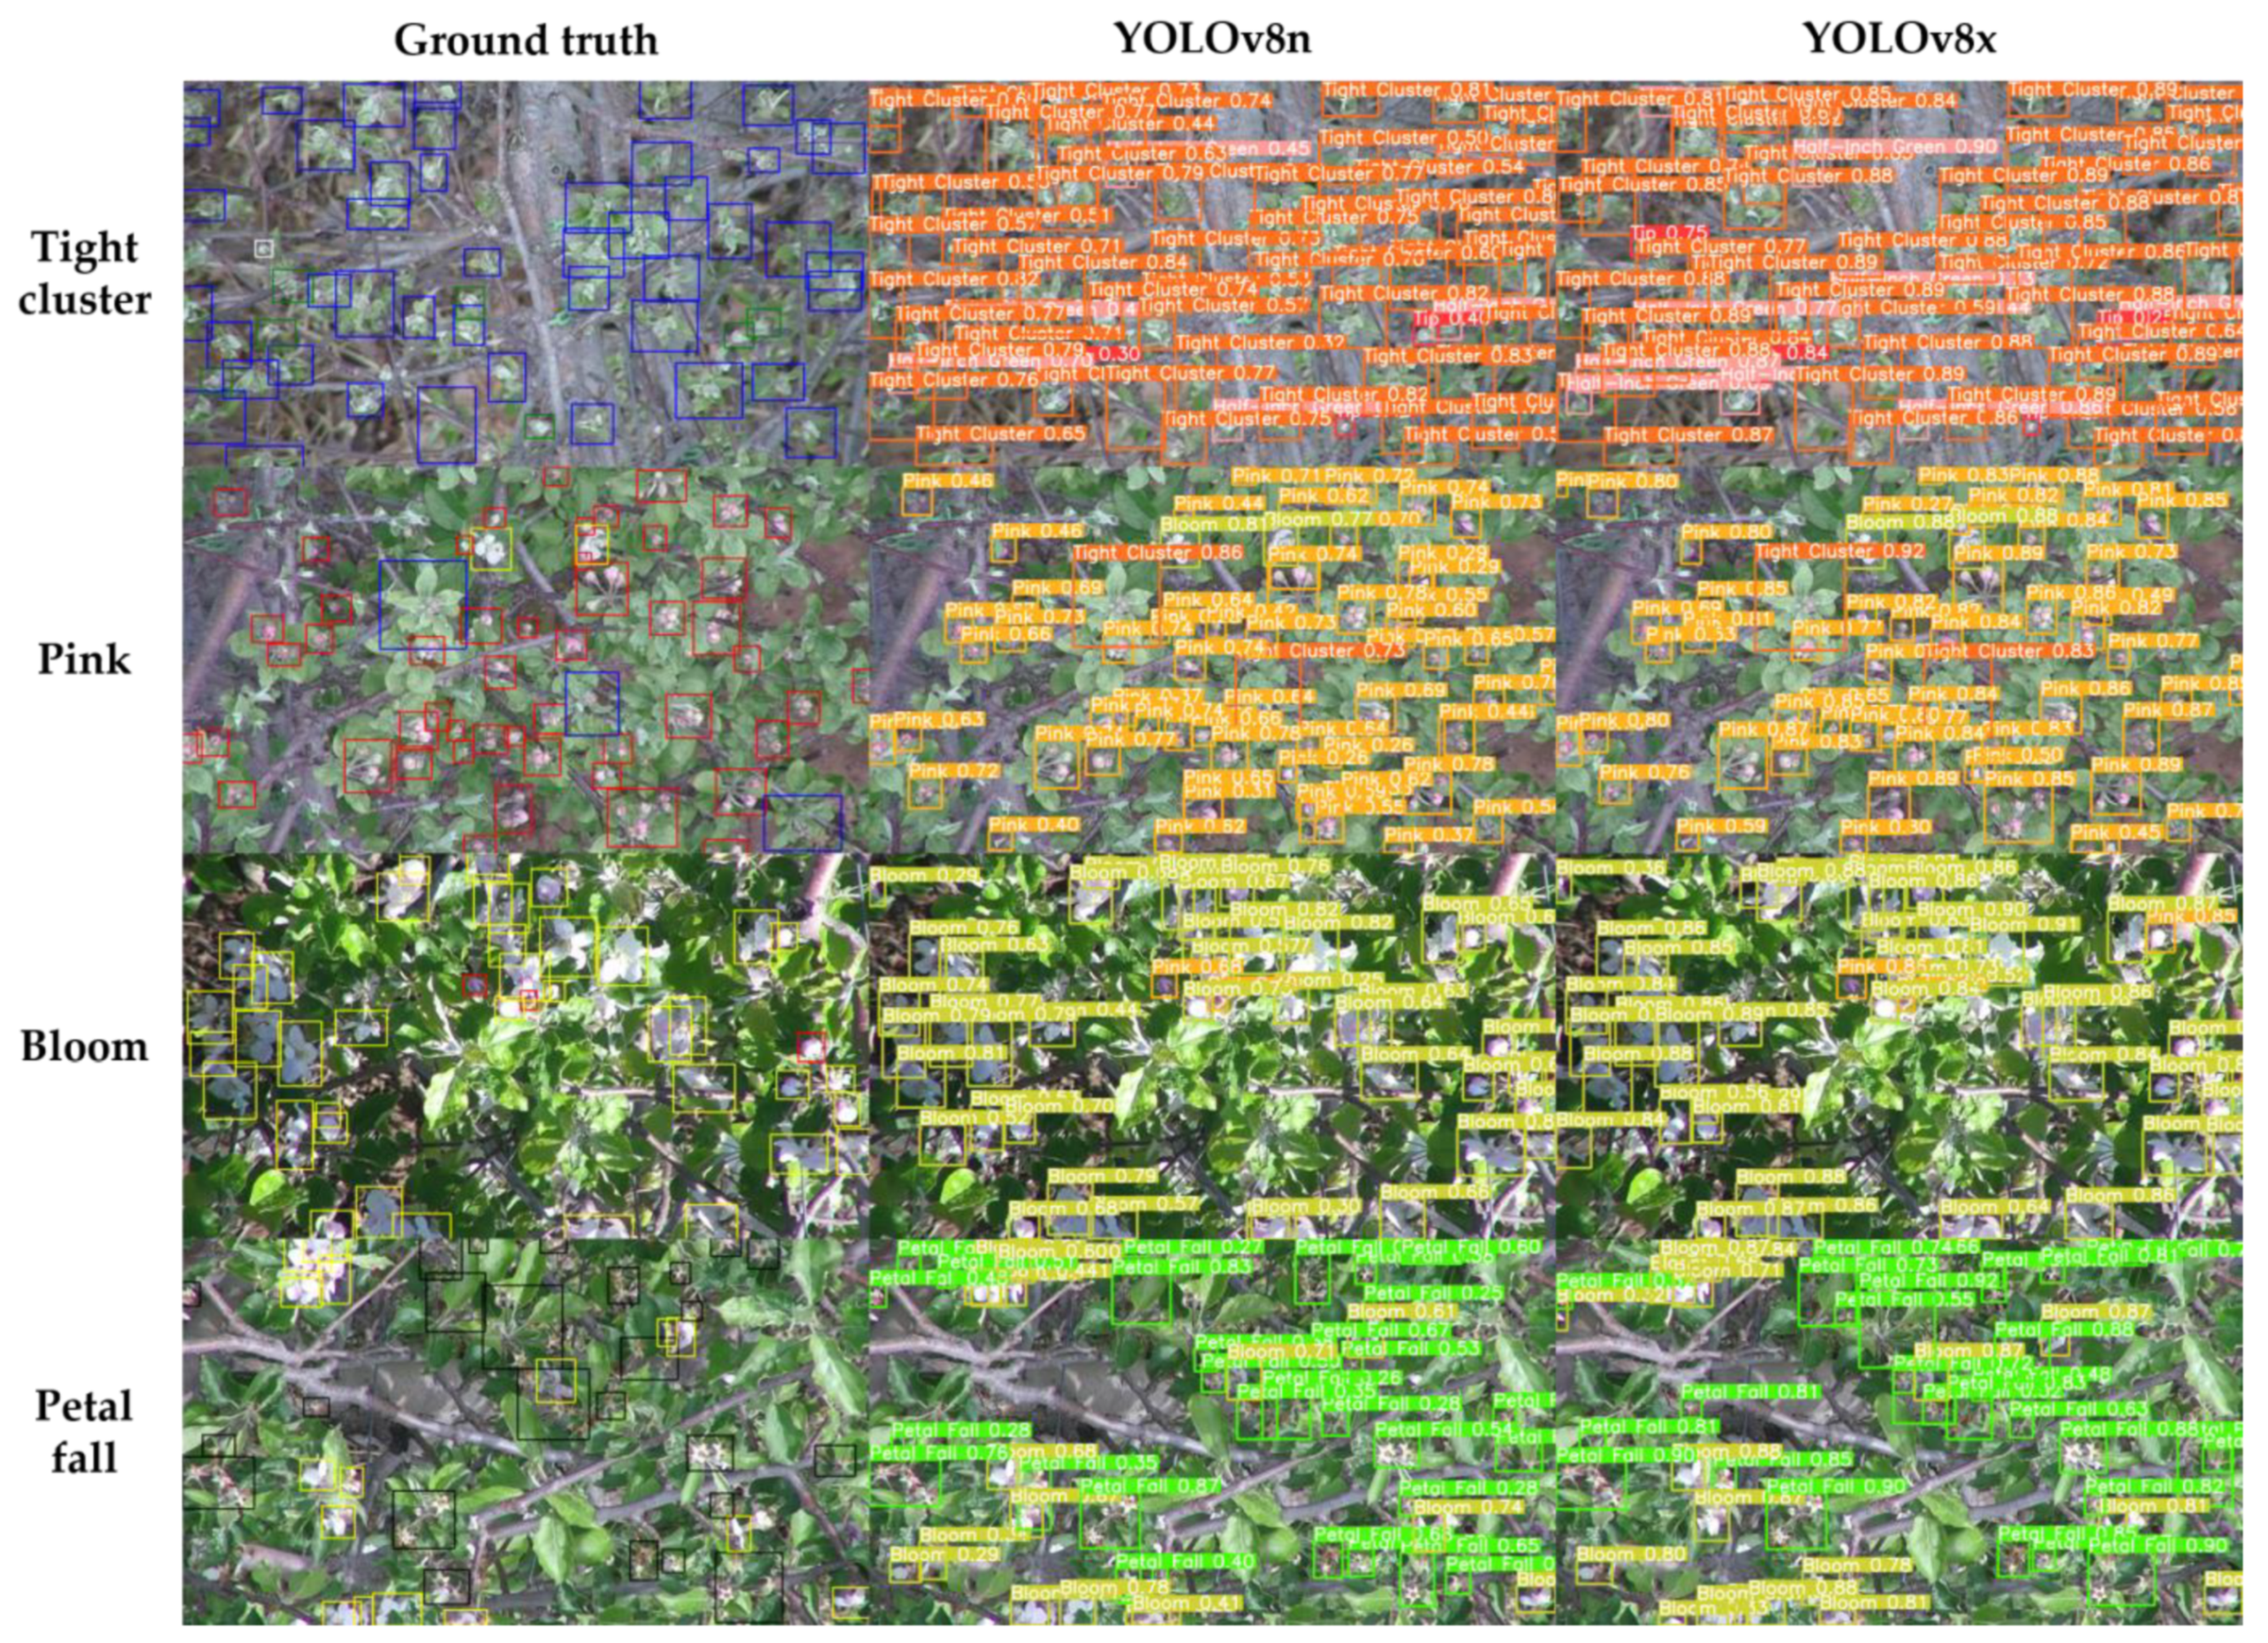
Despite being developed on the same training dataset and having approximately 20 times more parameters, YOLOv8x did not outperform YOLOv8n by a significant margin overall. YOLOv8x achieved AP improvements of 0.055 or 10% for tip, 0.075 or 14% for half-inch green, 0.011 or 1% for bloom, and 0.057 or 10% for petal fall, and a 0.029 or 4% mAP50 improvement over YOLOv8n. Meanwhile, YOLOv8x underperformed YOLOv8n for tight cluster and pink by 0.014 and 0.007 or 2% and 1% in terms of AP50, respectively. Similarly, this phenomenon was also observed in previous research, where an increased YOLOv4 network size detrimentally affected model performance on AriAplBud [15]. As noted in the current literature [25,26], shallow networks could exhibit better performance than deep networks, despite having fewer parameters. In general, larger models require longer training durations, bigger datasets, and more careful hyperparameter tuning to reach their optimal performance. The few classes of AriAplBud might not be sufficient for YOLOv8x to fully demonstrate its sophistication on complex image pattern recognition over the simpler YOLOv8n model. Nonetheless, although YOLOv8n and YOLOv8x attained comparable results according to AP50 and mAP50, YOLOv8x was able to make most apple flower bud detections with much higher confidence, suggesting a stronger model learning ability (Figure 4).
Comparing the results with those from a prior YOLOv7 study on AriAplBud [17], it is interesting to observe that YOLOv8 did not show apparent superiority over YOLOv7. Specifically, using YOLOv8x as an example, which has approximately 85% more parameters than YOLOv7 [21], YOLOv8x outperformed YOLOv7 for bloom and petal fall by 0.7% and 3%, but underperformed YOLOv7 for tight cluster and pink by 4% and 3%, in terms of AP50. Such a finding indicates the necessity of future research that exhaustively compares modern object detection models, developed with identical agricultural datasets such as AriAplBud and evaluated with identical hyperparameters such as confidence threshold and non-maximum suppression (NMS) threshold, to identify the best-performing object detectors for agriculture.
5. Dataset Characteristics
Being a large, multi-date, multi-growth stage, complex agricultural dataset created by a UAV, AriAplBud has some noteworthy characteristics that can be interpreted as limitations. This section aims to provide additional insights into AriAplBud to help guide further image annotation improvements or image selections for smaller but higher-quality subdatasets within AriAplBud in future studies.
5.1. Class Imbalance
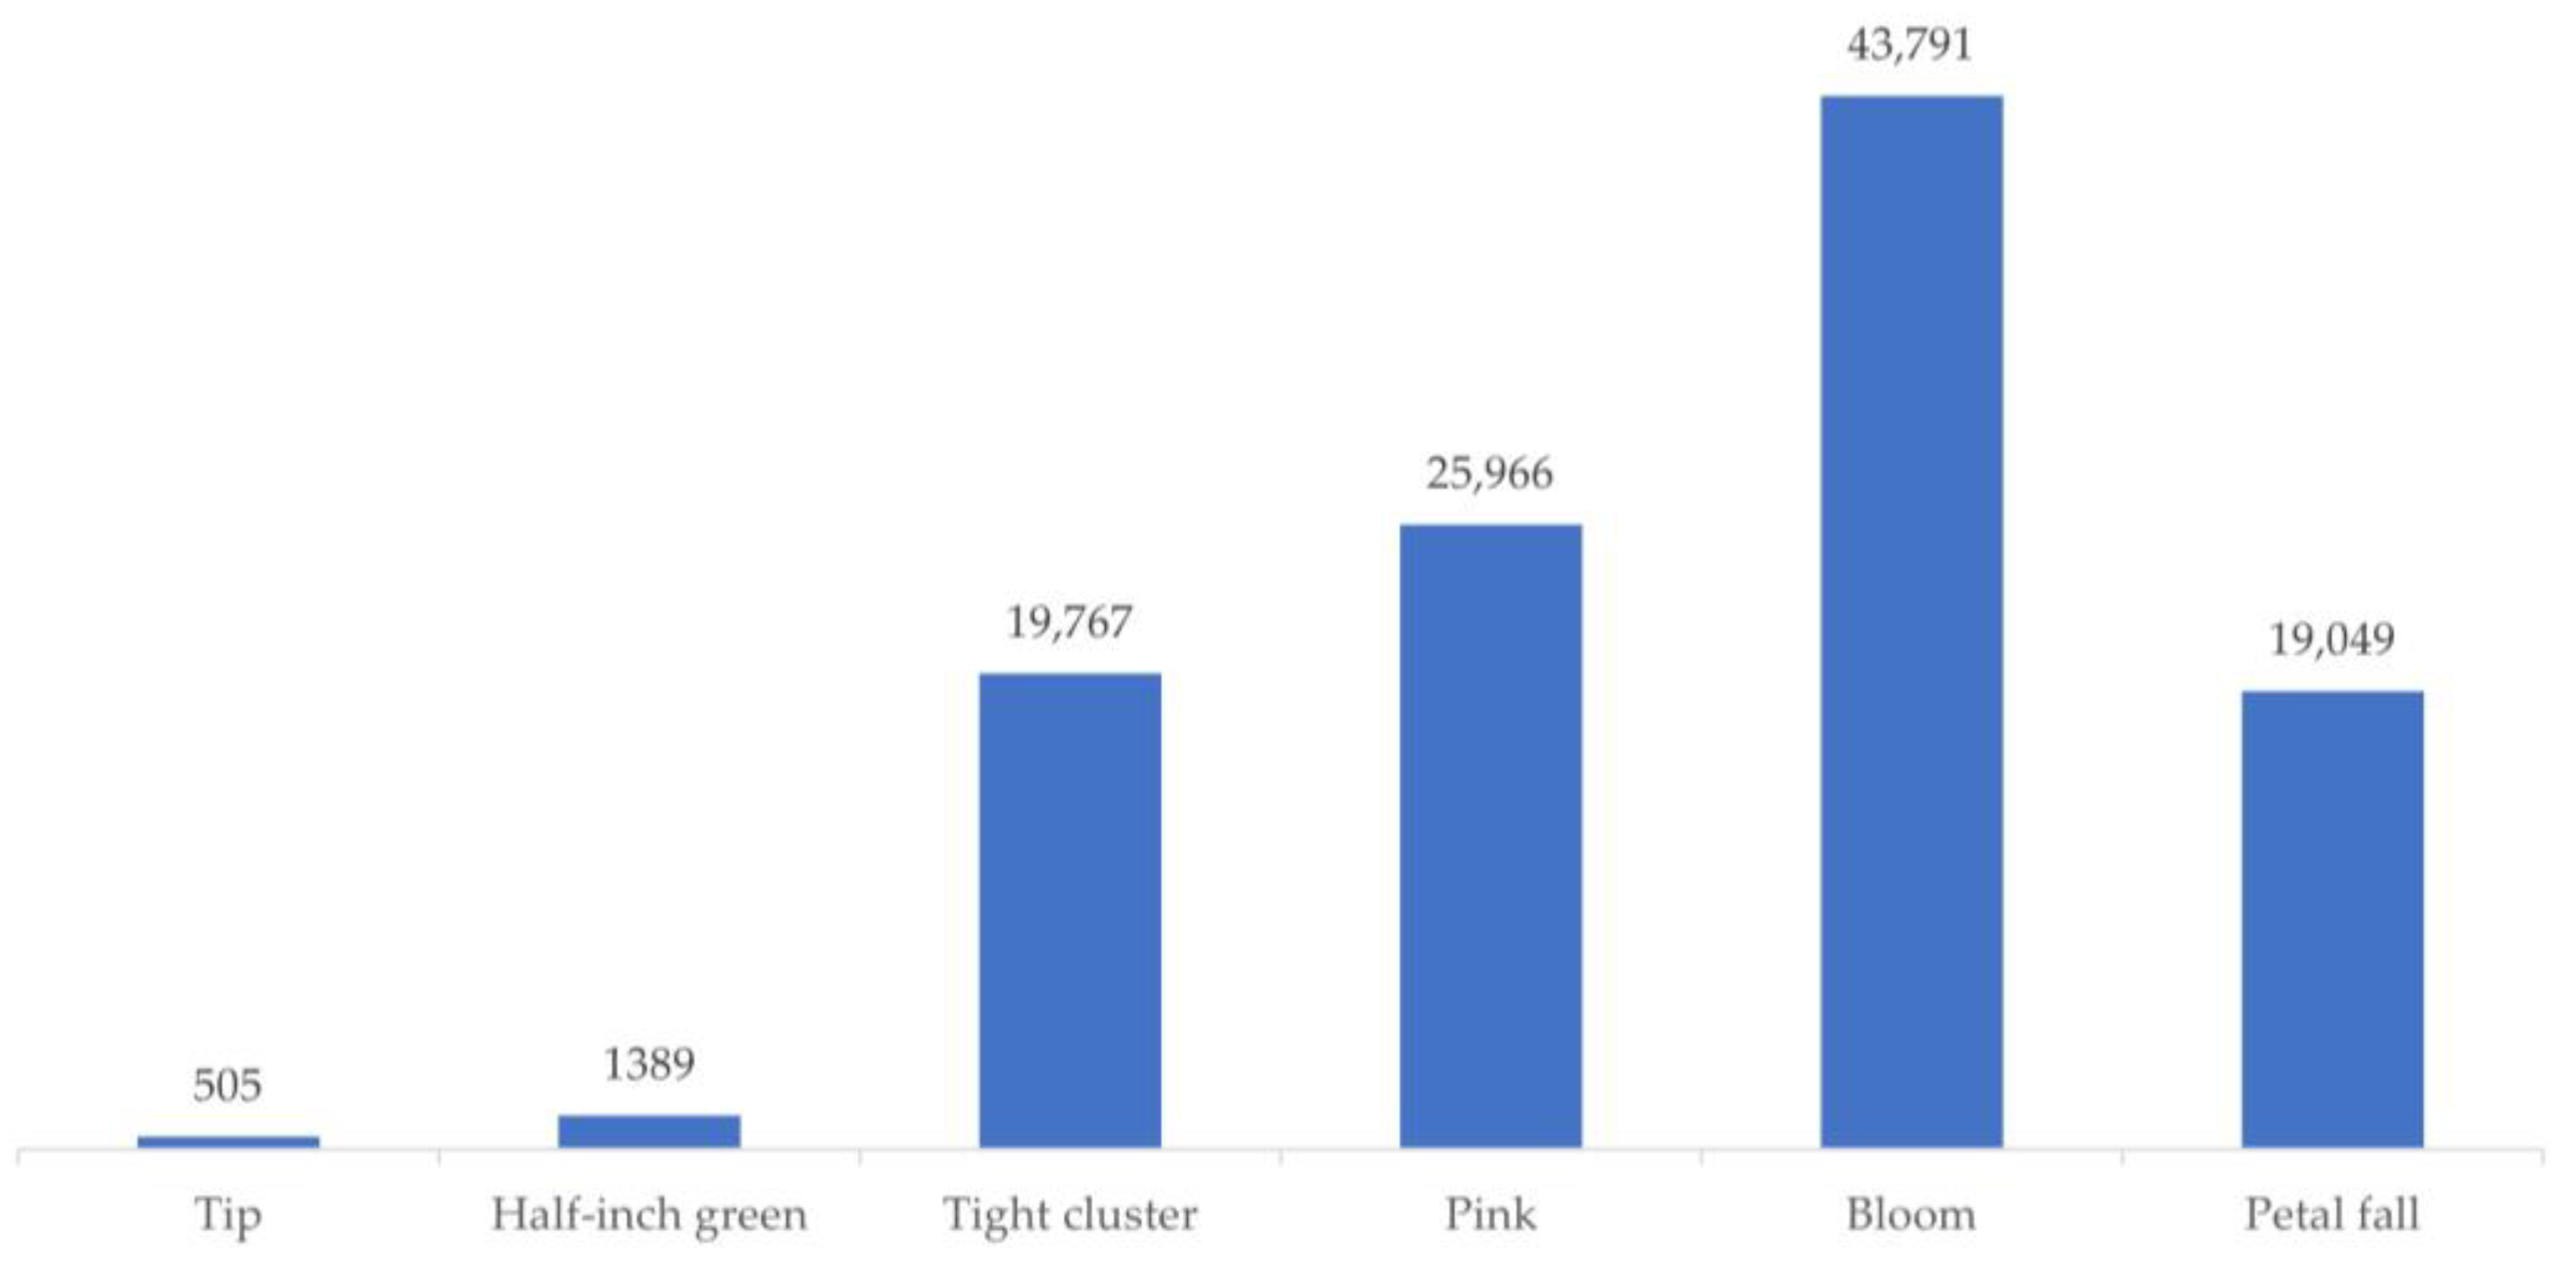
Due to the late first data collection date, AriAplBud does not capture many tip and half-inch green instances. On the other hand, as each apple flower bud has the potential of growing into five to eight flowers [27], AriAplBud contains the most amount of bloom instances (Figure 5). Relatively speaking, in AriAplBud, there are roughly 86 times more bloom instances than the tip instances, and 31 times more than the half-inch green instances. When using AriAplBud for object detector benchmarking, results of tight cluster, pink, bloom, and petal fall can reflect model performance when training instances are sufficient, while results of tip and half-inch green might reveal model’s learning ability from scarce training instances.
5.2. Annotation per Image
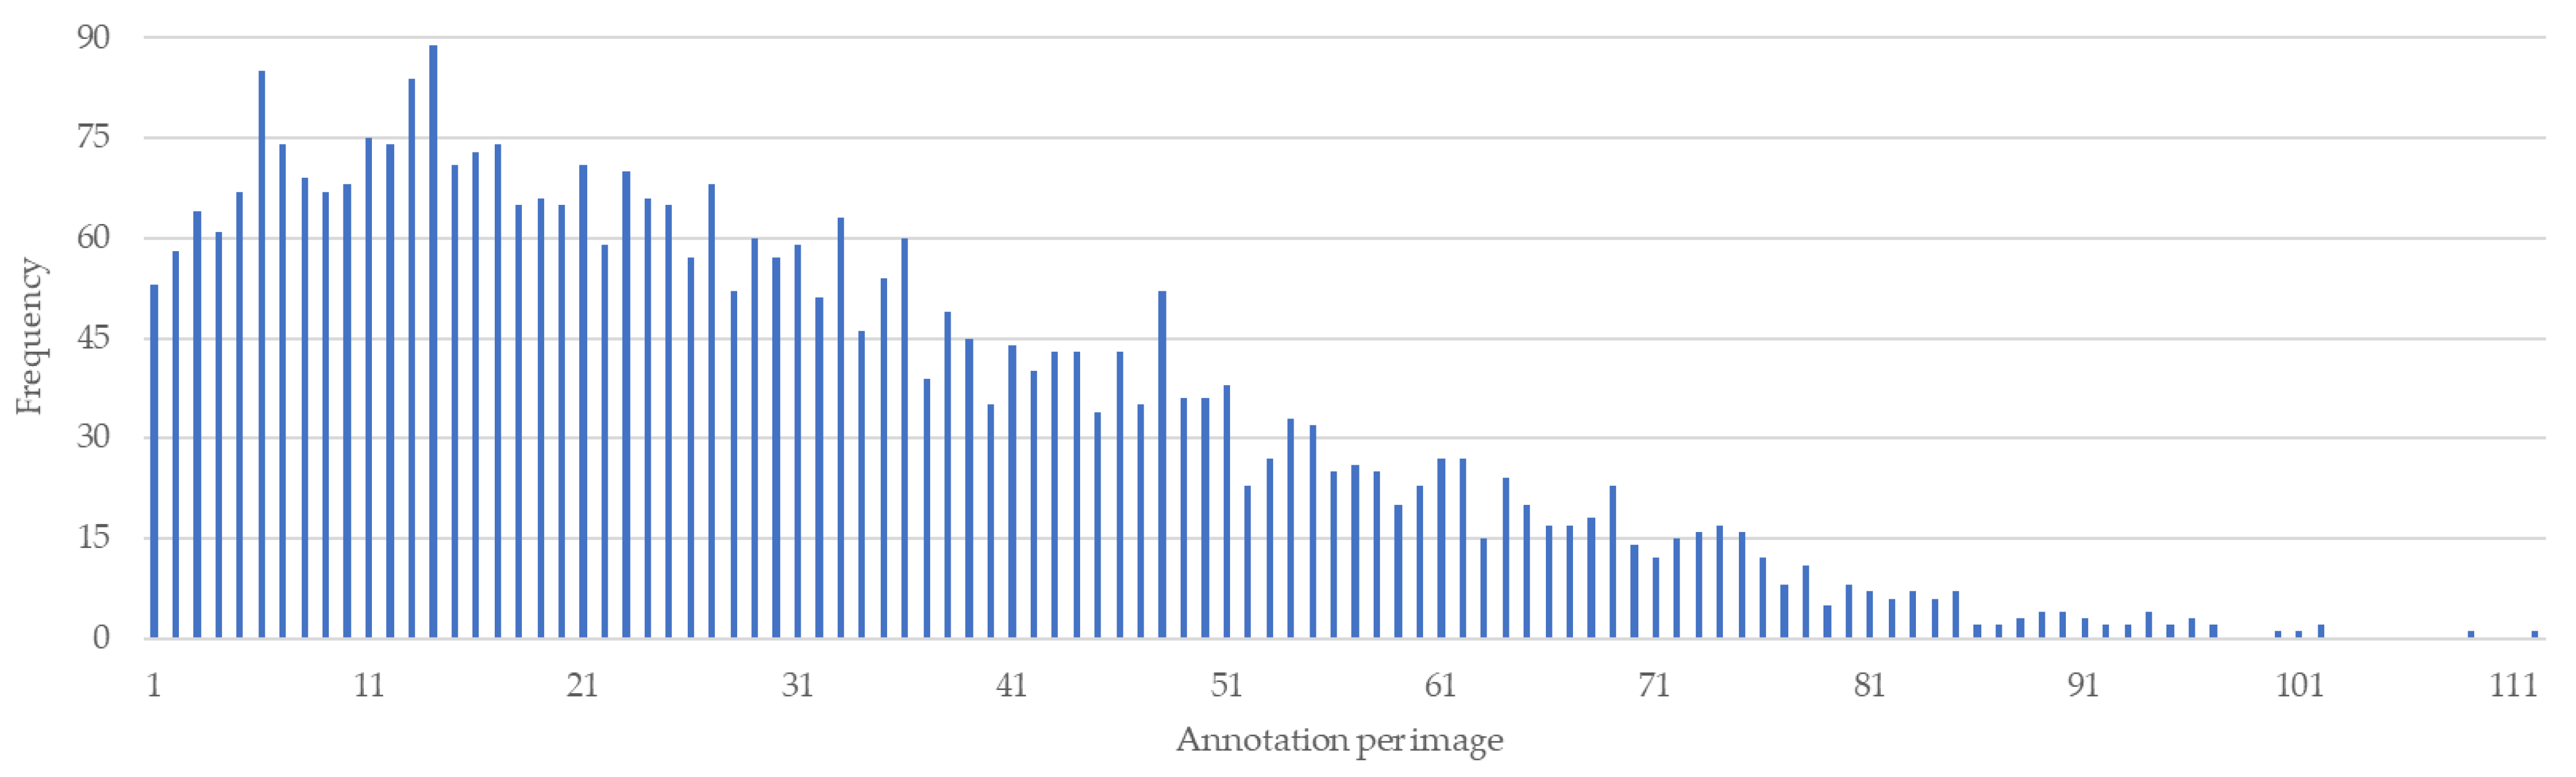
The positive samples in AriAplBud have a wide range of annotations per image. Figure 6 illustrates the bar chart depicting the distribution of annotation per image and their corresponding frequency. The distribution ranges from 1 to 112 annotations per image, and peaks at 14 annotations per image with an 89 frequency. Generally, annotation per image is negatively correlated with frequency, indicating there are more images with a lower number of annotations than those with a higher number of annotations in AriAplBud.
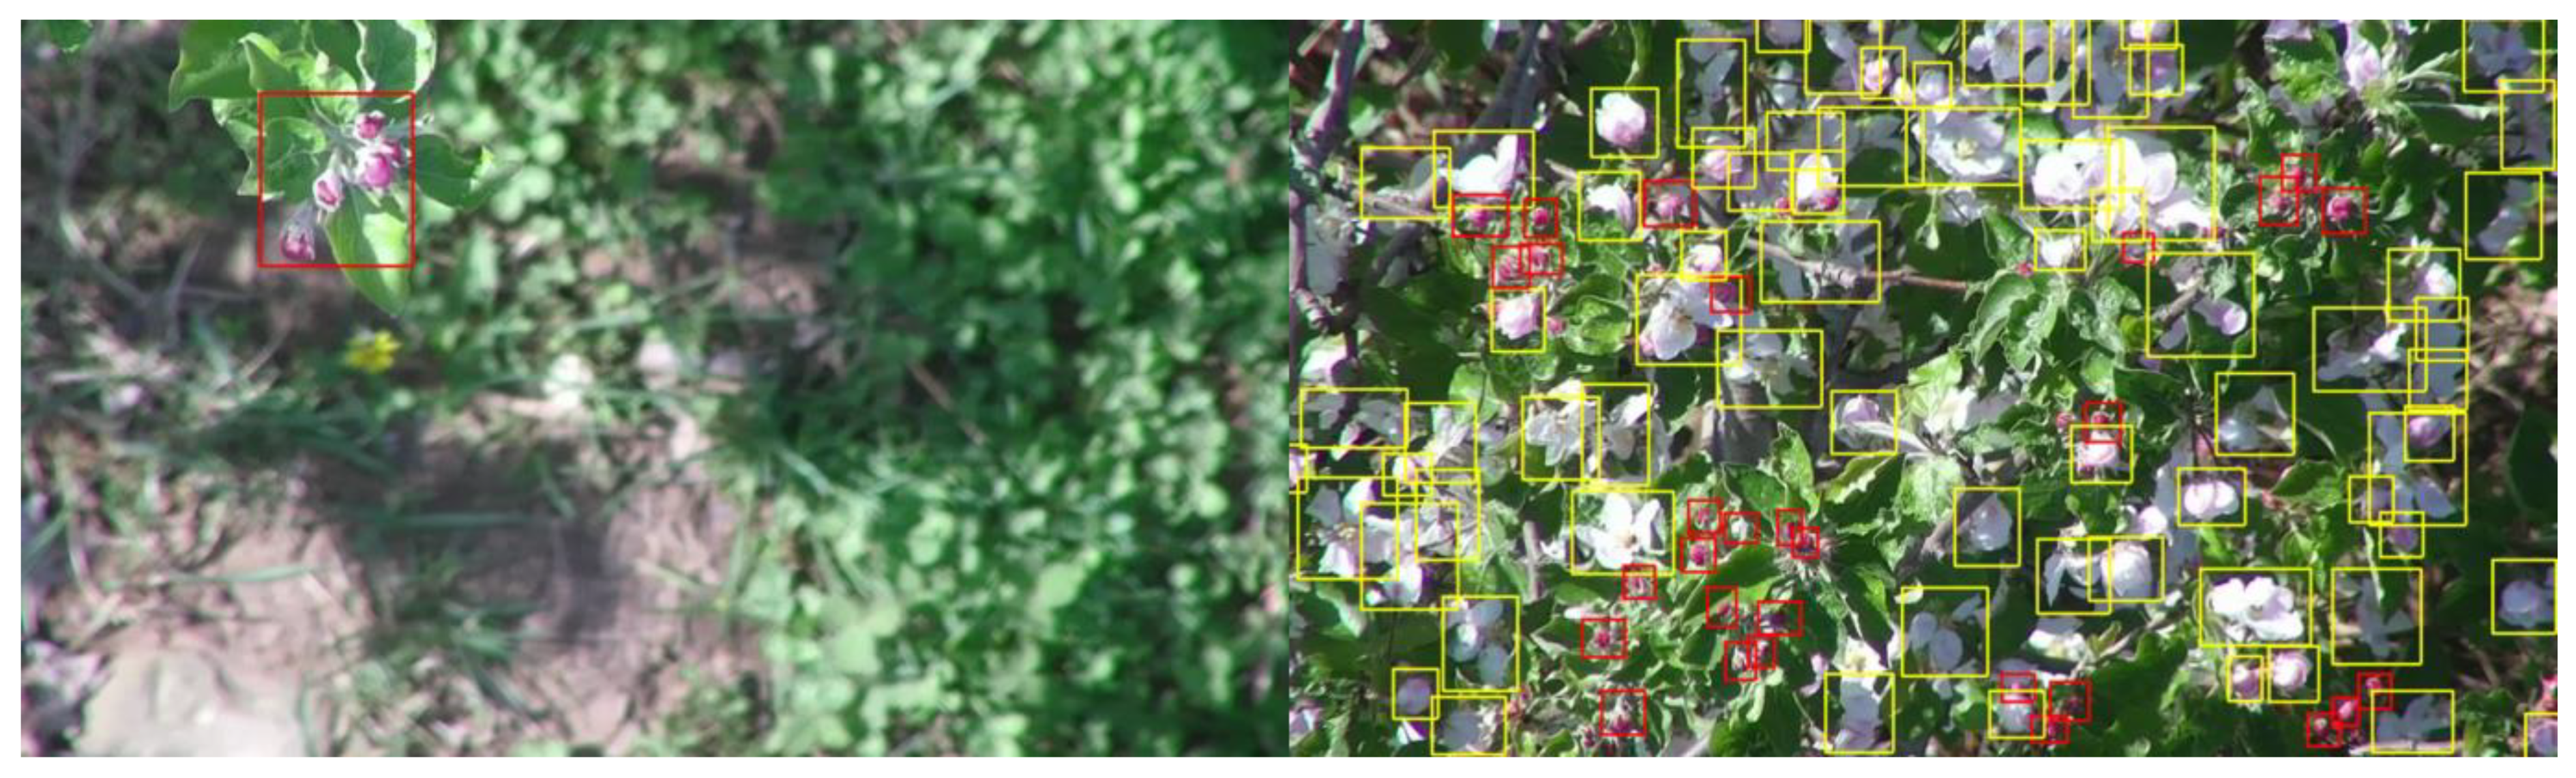
Unlike images with sparse object distributions, images with large annotation numbers are generally more difficult and time-consuming to annotate, and arguably more challenging for object detectors to perform complete and accurate object identifications on. In the case of AriAplBud, many annotations per image translates to a dense apple flower bud distribution, which comes with occluded flower buds and deformed flower shapes. While AriAplBud as a dataset can assist in benchmarking various object detection frameworks, case studies of high-difficulty images from AriAplBud might provide additional insights into the differences between object detector behaviors when faced with complex scenes (Figure 7).
5.3. Bounding Box Size
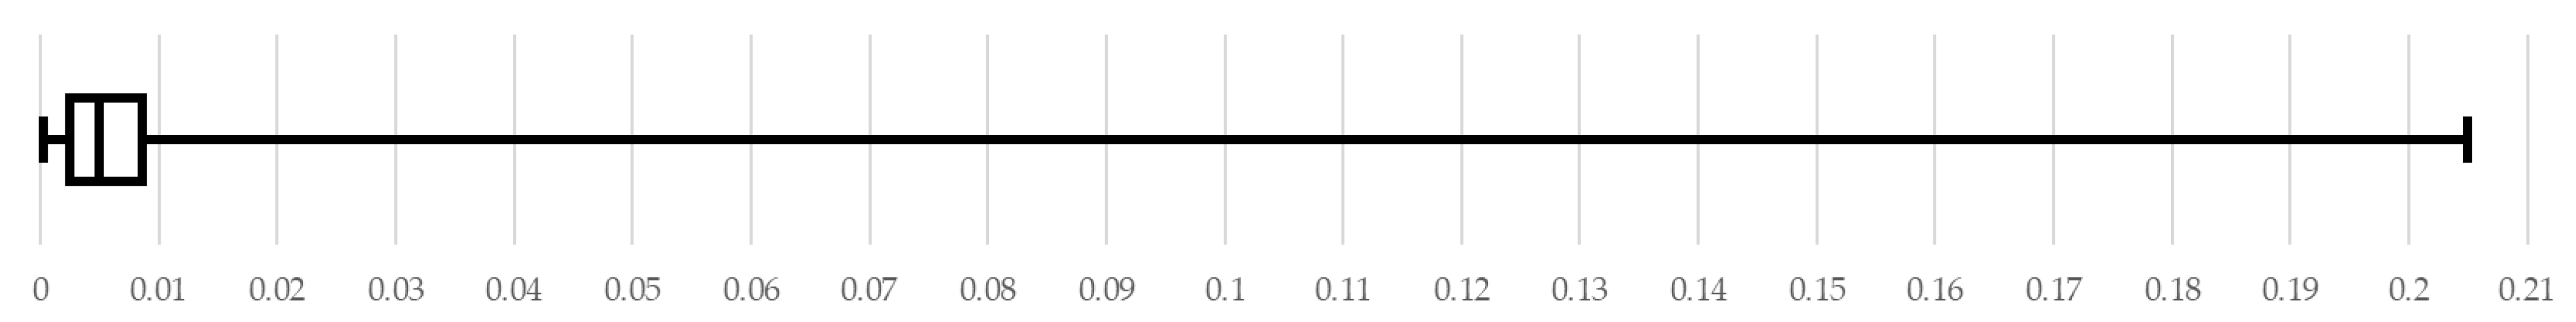
The bounding box annotation size varies substantially in different AriAplBud images, whose distribution among all 110,467 annotations can be found in Figure 8.
Regarding normalized bounding box area expressed in between 0 and 1, 97% of the annotations have a size smaller than 0.027, which is equivalent to 55,965 pixels at the image resolution of 1920 × 1080, and a tiny quantity of large bounding box annotations exists in AriAplBud (Figure 9). As small objects are known to pose challenges to object detectors, numerous studies in the current literature have investigated improving YOLO frameworks for dedicated small object detection tasks [28,29,30,31,32,33,34,35]. In that sense, the large number of small-sized annotations in AriAplBud, particularly when the images are resized to standard input resolutions such as 512 × 512 or 640 × 640 for CNNs, can help targetedly assess an algorithm’s effectiveness in detecting micro-scale objects.
5.4. Annotation Error
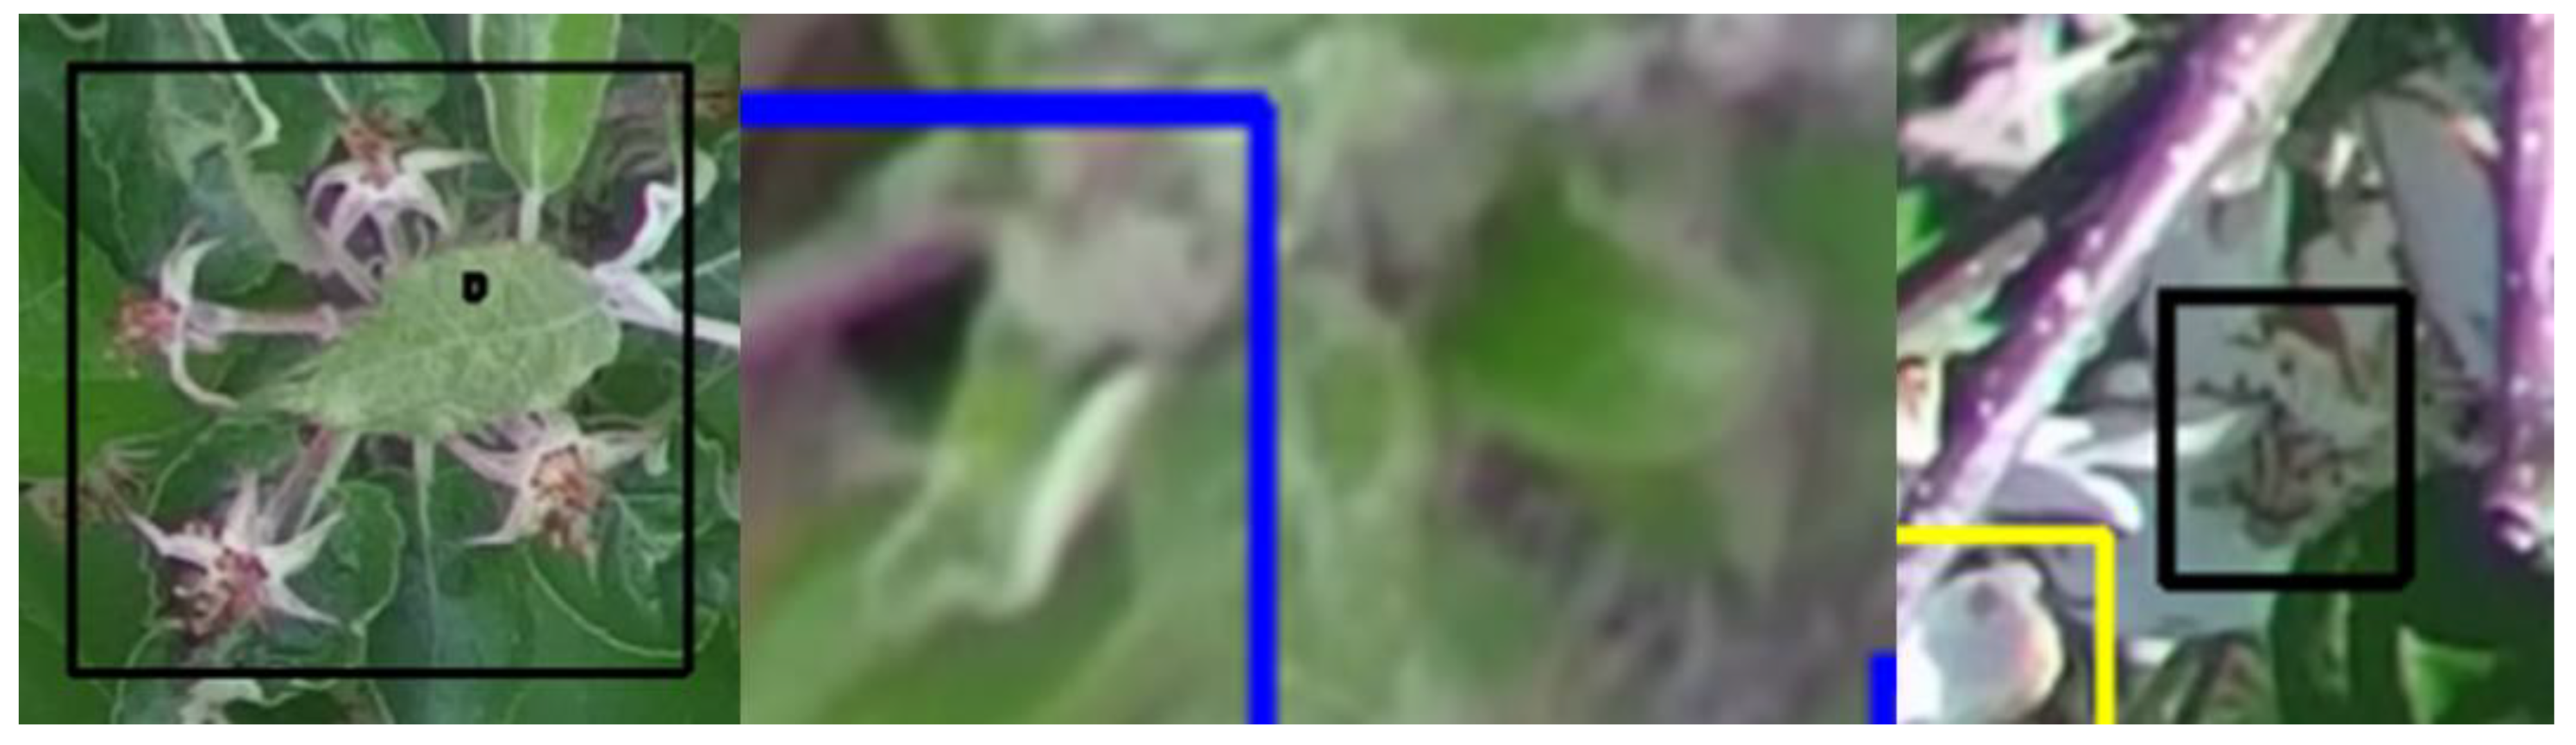
Three types of annotation errors exist in AriAplBud: unintentional annotation, incomplete annotation, and false annotation. When annotators accidentally draw minuscule bounding boxes on images but fail to notice and remove them, unintentional annotations are created. Although by a negligible amount, AriAplBud does contain unintentional annotations (Figure 10). Due to their dense spatial distribution, apple flower buds are often difficult to identify from a 2D camera’s point of view, as they can appear occluded, deformed, defocused, or inconspicuous. Hence, unannotated apple flower buds can be found in AriAplBud images with large numbers of annotations (Figure 10), even though all the image annotations have been double-checked by the author. As discussed in Section 2.3, since apple tree development throughout a growing season happens in a progressive manner, specific annotation guidelines were created for AriAplBud to assist with the image annotation process. However, subjective decisions still frequently arose when determining the growth stage of an apple flower bud. This occurred particularly for transitional scenarios such as a half-inch green slightly unfurling its leaves, a tight cluster displaying a hint of light pink, a pink shifting from pinkish to whitish hues, or a bloom shedding a few petals. Additionally, growth stages of blurred apple flower buds could be more difficult to identify, and apple vegetative buds could be mistaken as apple flower buds, especially before tight cluster stage. As such, false annotations are present in AriAplBud, and in a sense are inevitable for complex agricultural datasets. For AriAplBud to be an error-free agricultural benchmarking dataset, future community efforts on annotation-checking and repreparing the dataset are still in need.
5.5. Annotation Style Inconsistency
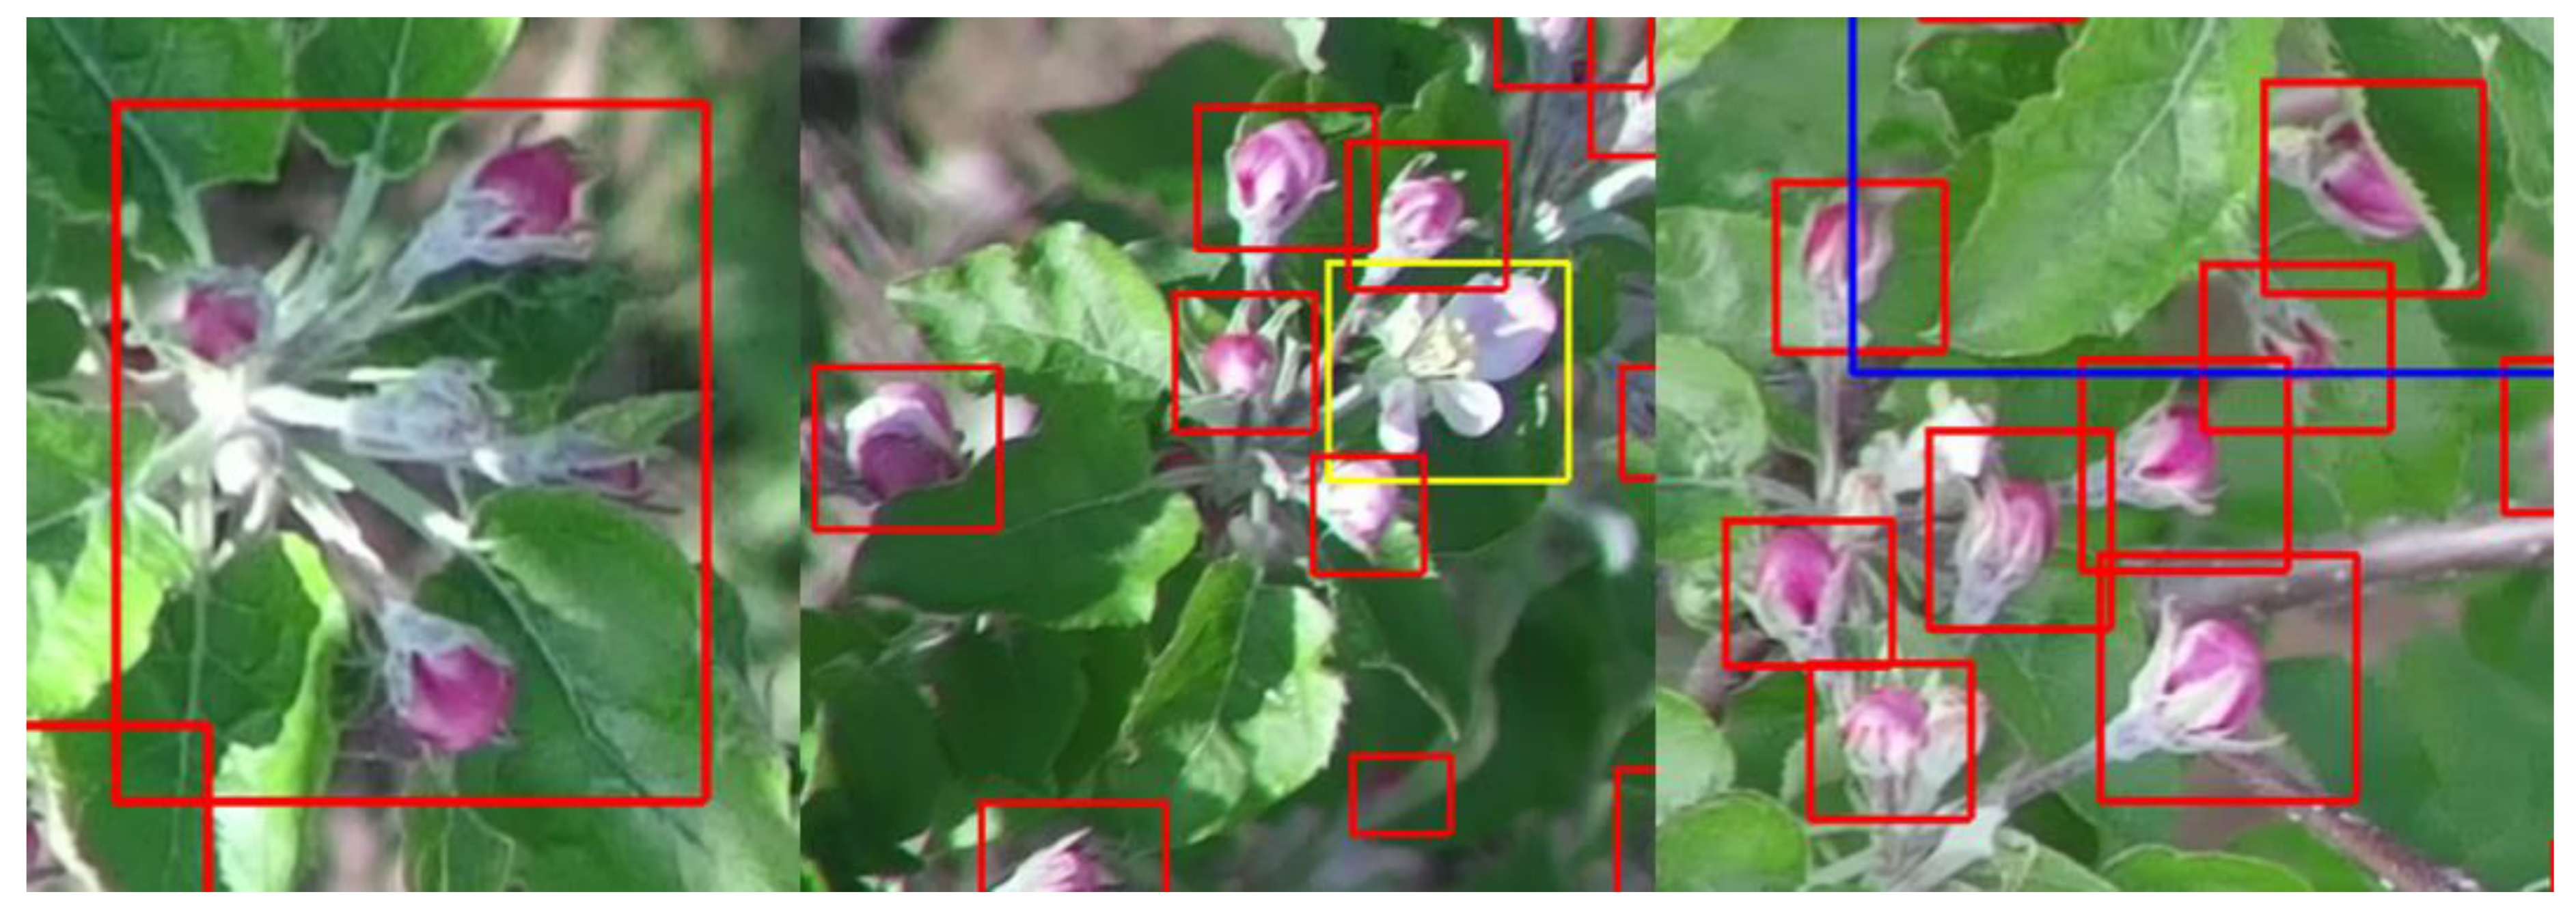
Among the six growth stages in AriAplBud, pink and petal fall are the two special cases where not all annotations have the same style. During tip, half-inch green, and tight cluster, each apple flower bud including its leaves was annotated by one bounding box. During bloom, each apple flower was annotated by one bounding box. During pink, in general, each apple flower bud was annotated by one bounding box, including all its florets and excluding its leaves (Figure 11). The inclusion of leaves during pink would not only involve time-consuming identifications of leaves belonging to the same apple flower bud, but also lead to substantially sized bounding boxes. However, for situations where only one floret of an apple flower bud has transitioned into bloom while the rest florets remain as pink, which was traditionally referred to as the first bloom or king bloom stage [22], the pink florets were annotated by individual bounding boxes rather than just one bounding box, preventing nested bloom bounding boxes inside pink bounding boxes (Figure 11). Additionally, pink florets belonging to the same apple flower bud could be spaced apart and difficult to identify, and were thus annotated individually to avoid unnecessarily large bounding boxes (Figure 11).
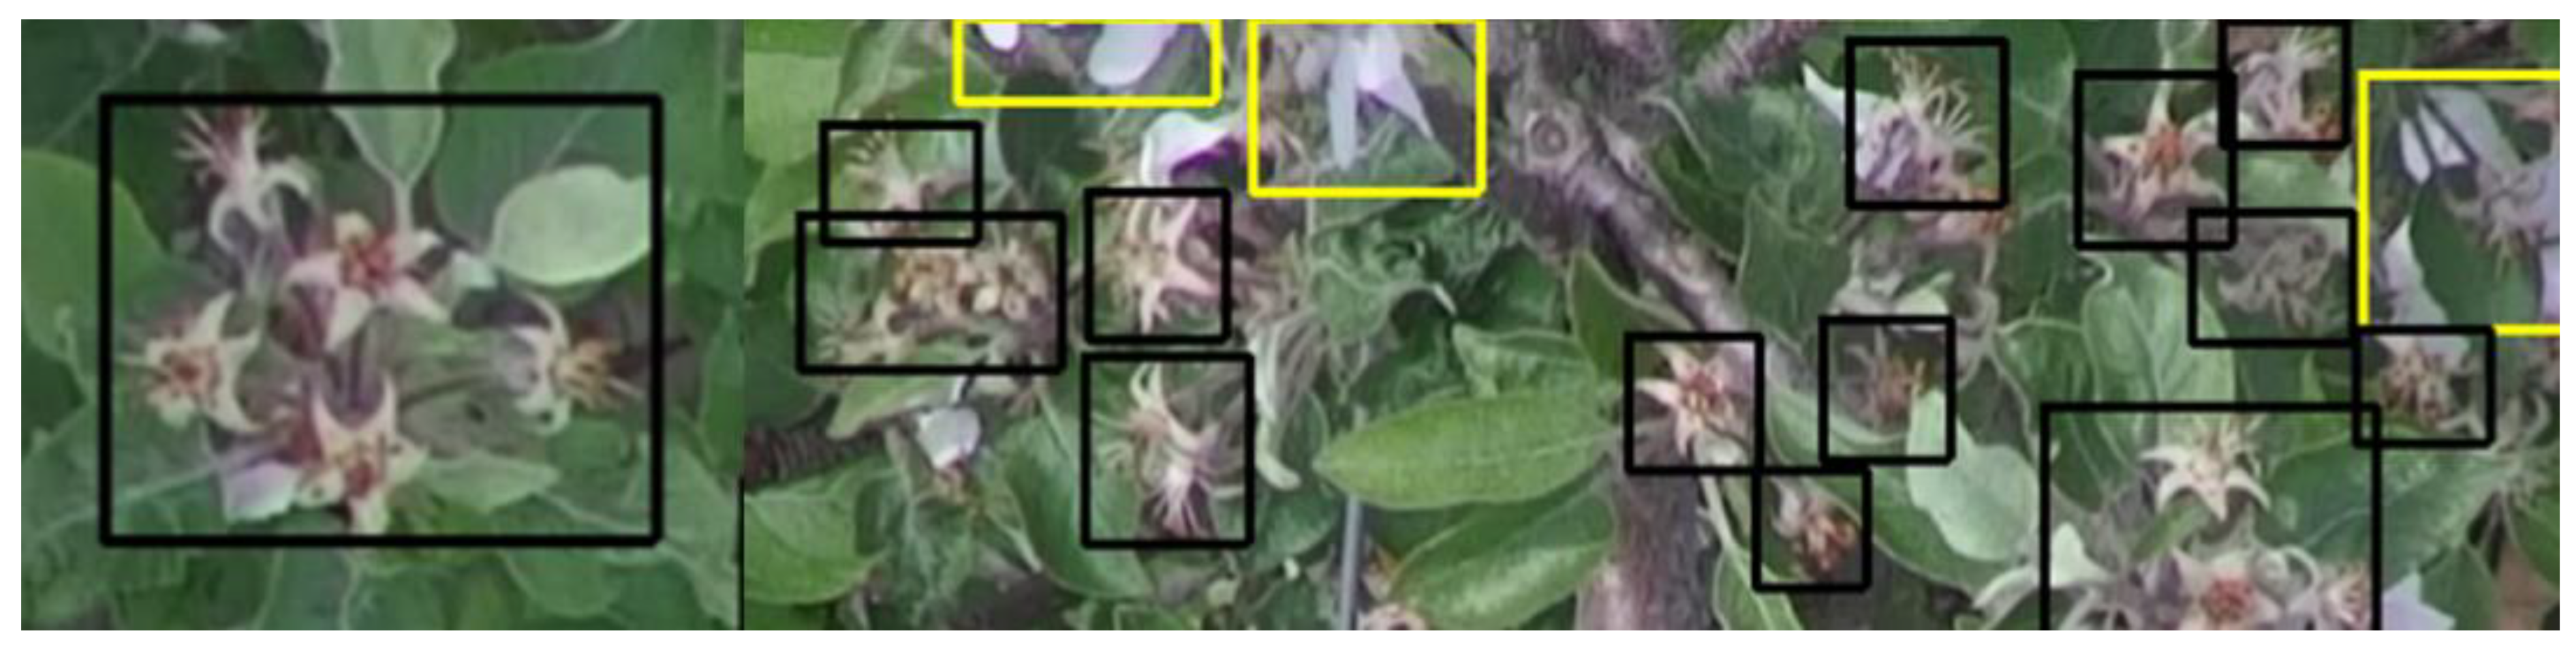
Likewise, during petal fall, in general, each apple flower bud was annotated by one bounding box, including all its flowers and excluding its leaves (Figure 12). However, flowers belonging to the same apple flower bud could be dispersed and challenging to recognize; hence, they were also annotated individually (Figure 12).
The annotation style inconsistency of AriAplBud undoubtedly increases the complexity of the dataset. As the decisions of annotating pinks and petal falls using one or multiple bounding boxes were often made subjectively, achieving accurate predictions akin to ground truth necessitates object detectors to comprehend not just the AriAplBud annotations, but also the annotators’ underlying thought processes when determining the most appropriate annotation style for each unique apple flower bud.
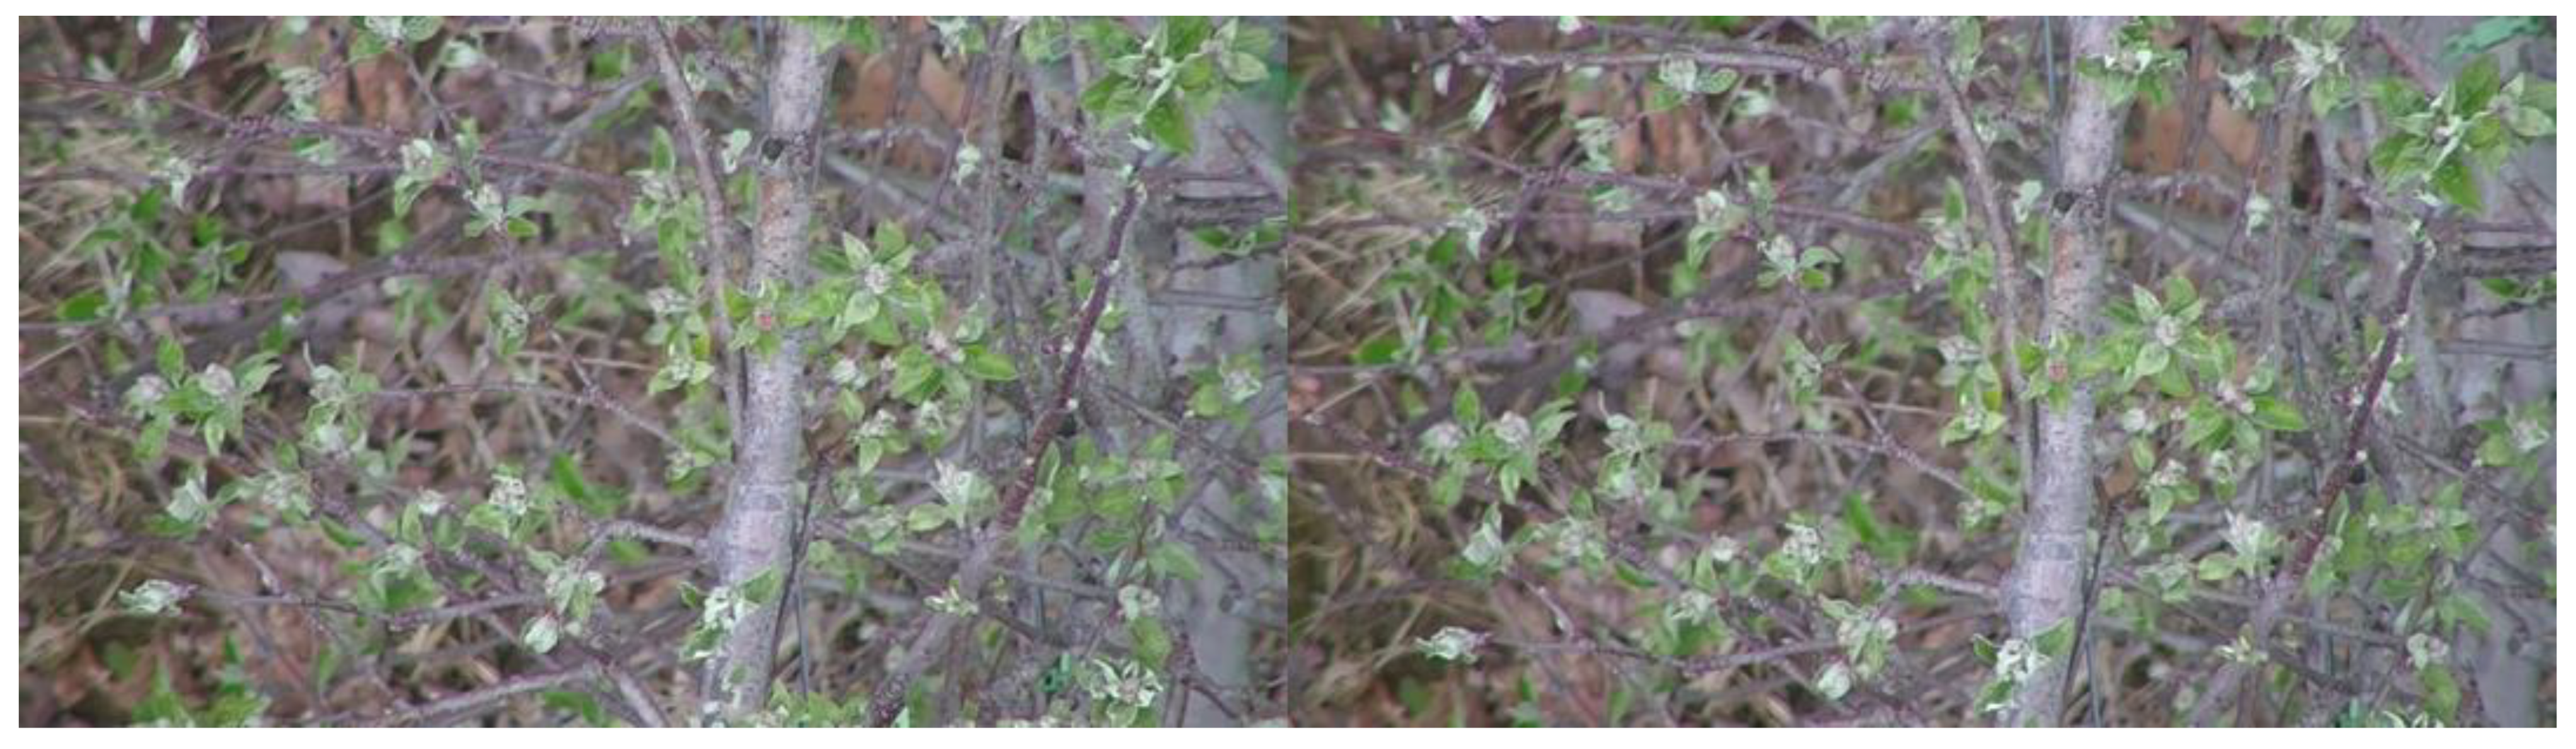
5.6. Image Similarity
Although AriAplBud does not contain identical images, it does feature a considerable quantity of similar-looking images (Figure 13). Such images were usually taken in quick succession with minor UAV positional changes. To efficiently capture high-quality close-up images of apple flower buds, all data collection flight missions were manually and meticulously controlled for minimal UAV flying speeds as well as periodic and frequent image saving. Theoretically, when images bearing resemblance are divided into both training and test datasets, it can lead to biased and inflated model metrics during final model evaluation, akin to the issue of data leakage [36]. Creating subdatasets, comprising dissimilar images from AriAplBud, can be a strategy to mitigate overestimations of model performance. Irrespective of the images contained within AriAplBud, the dataset remains a viable tool to rate various object detectors. However, it is important to note that the relative ranking of model accuracies based on any benchmark dataset is inherently tied to the characteristics of the dataset.
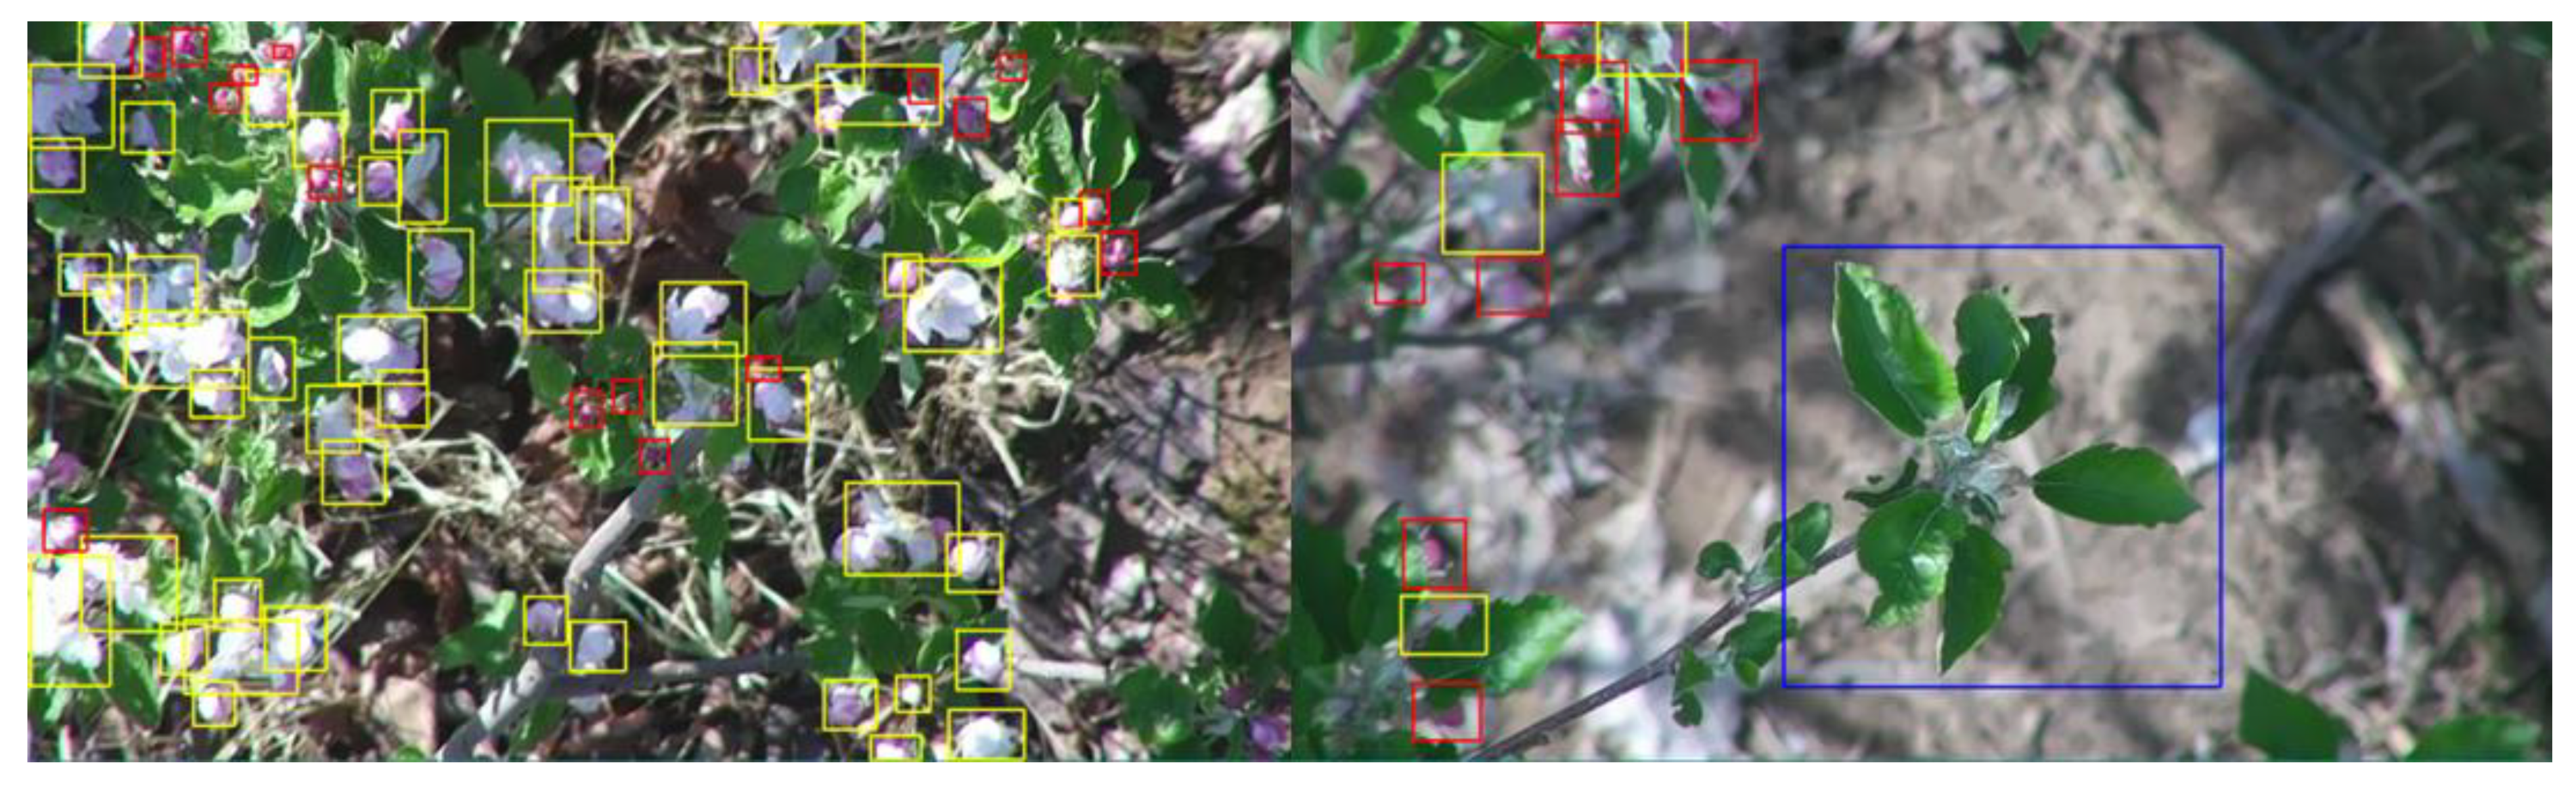
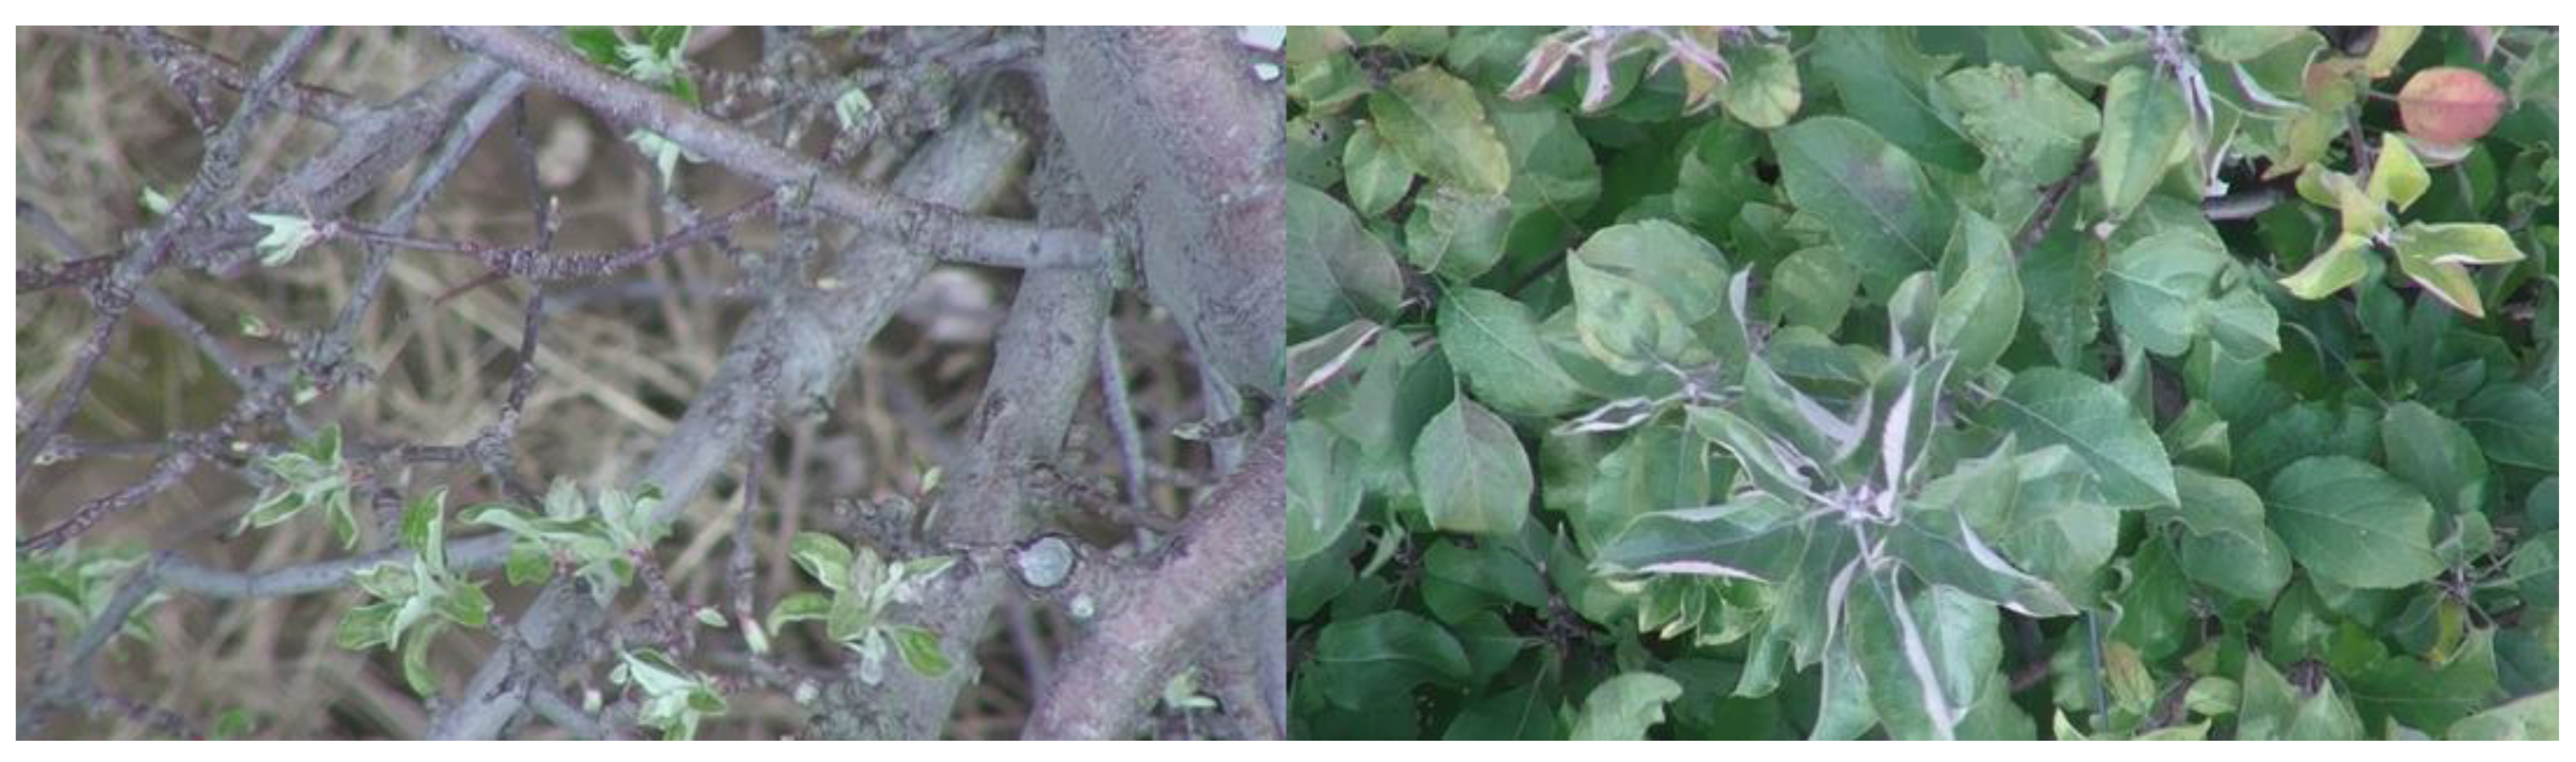
5.7. Positive and Negative Sample Dissimilarity
Given the typically crowded clustering of flower buds in apple tree canopies during the bud developmental stages, capturing negative samples on the first eight data collection dates was proven challenging when observing from the UAV’s top-view perspective. Hence, the positive and negative samples of AriAplBud were gathered at varying dates, leading to distinctive image appearances (Figure 14). As previous research has demonstrated that incorporating the negative samples from AriAplBud during training provided no tangible benefits to YOLOv4 model performance [18], the notable dissimilarities between the positive and negative samples might be the primary factor restricting the negative samples’ efficacy in aiding object detectors to comprehend apple flower bud characteristics.
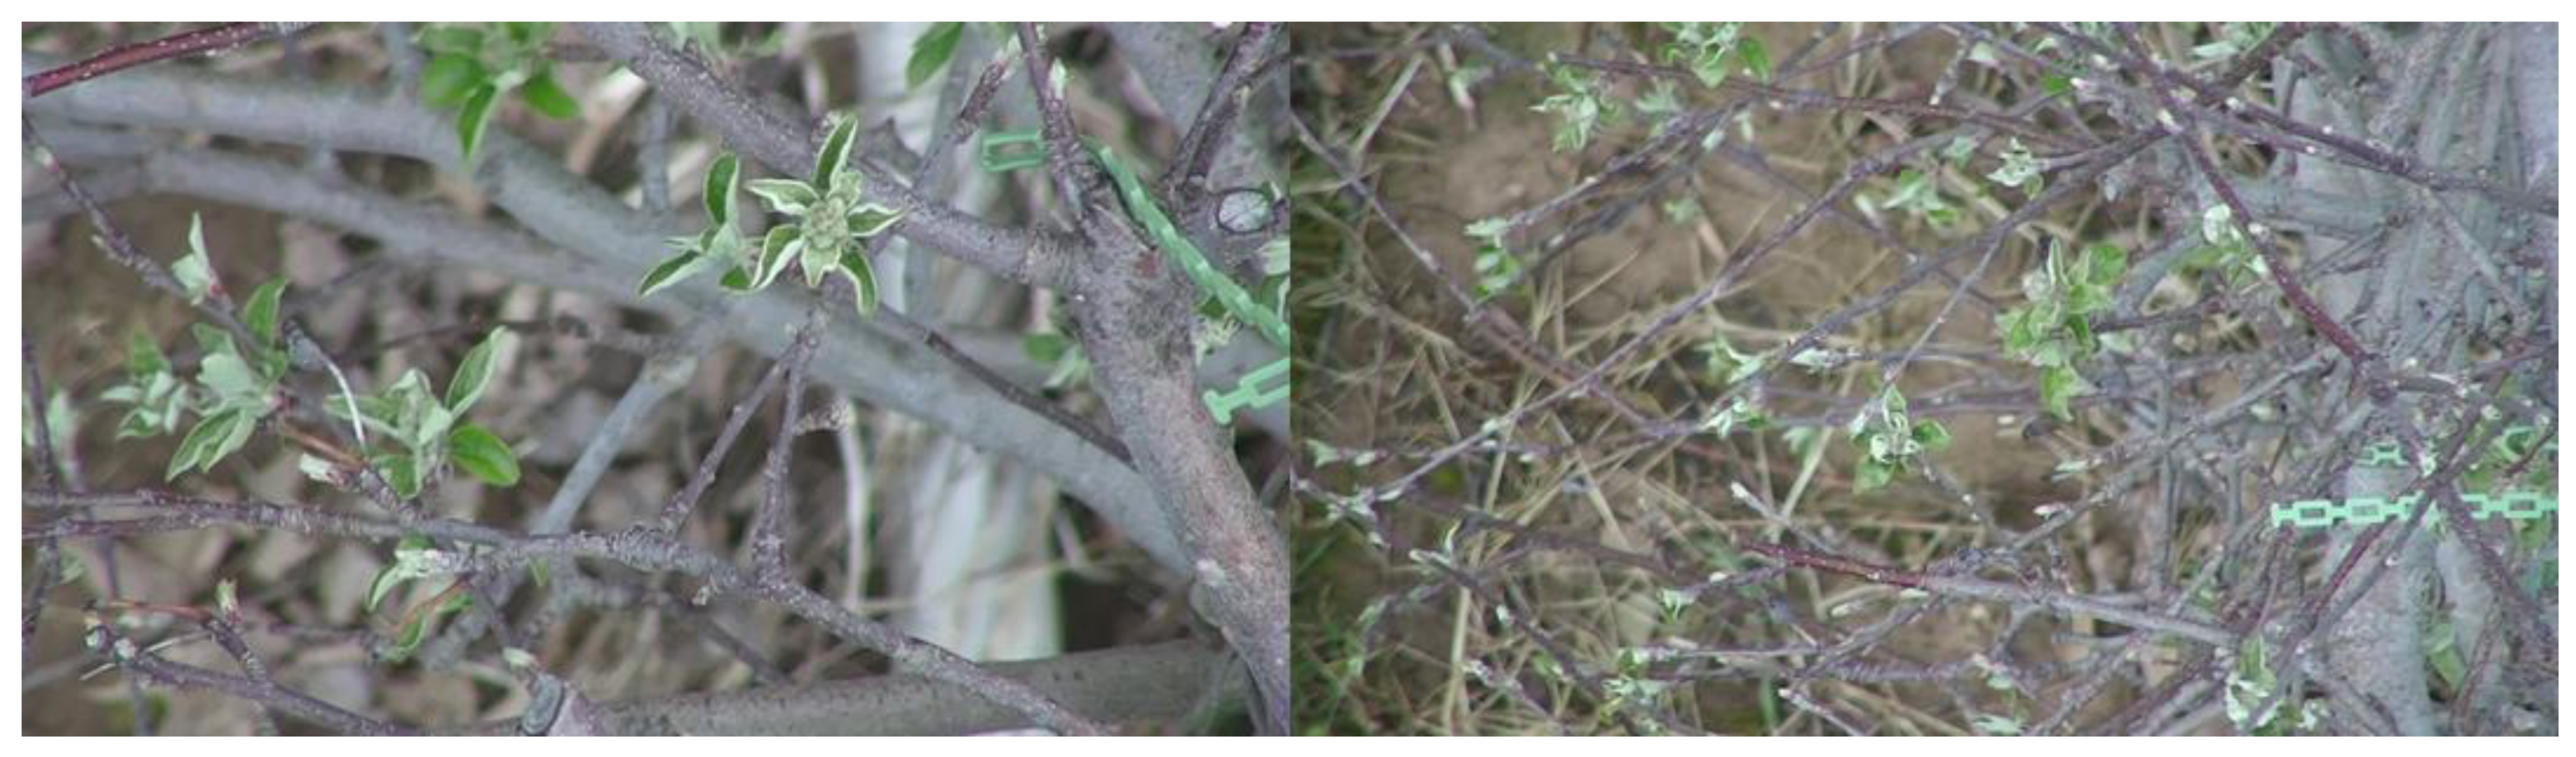
5.8. Flight Height Inconsistency
The initial UAV flight altitude for the first data collection session was set at 10 m AGL, but subsequently adjusted to 15 m AGL from the second data collection session onwards. The decision to modify the altitude stemmed from the observation that at 10 m, the UAV-induced turbulence was inadequately controlled during the second data collection session, causing movement in tree structures as they grew vegetatively, as well as compromised image quality. Notably, many apple flower buds captured on the first data collection date appear relatively larger compared with those gathered on subsequent dates (Figure 15).
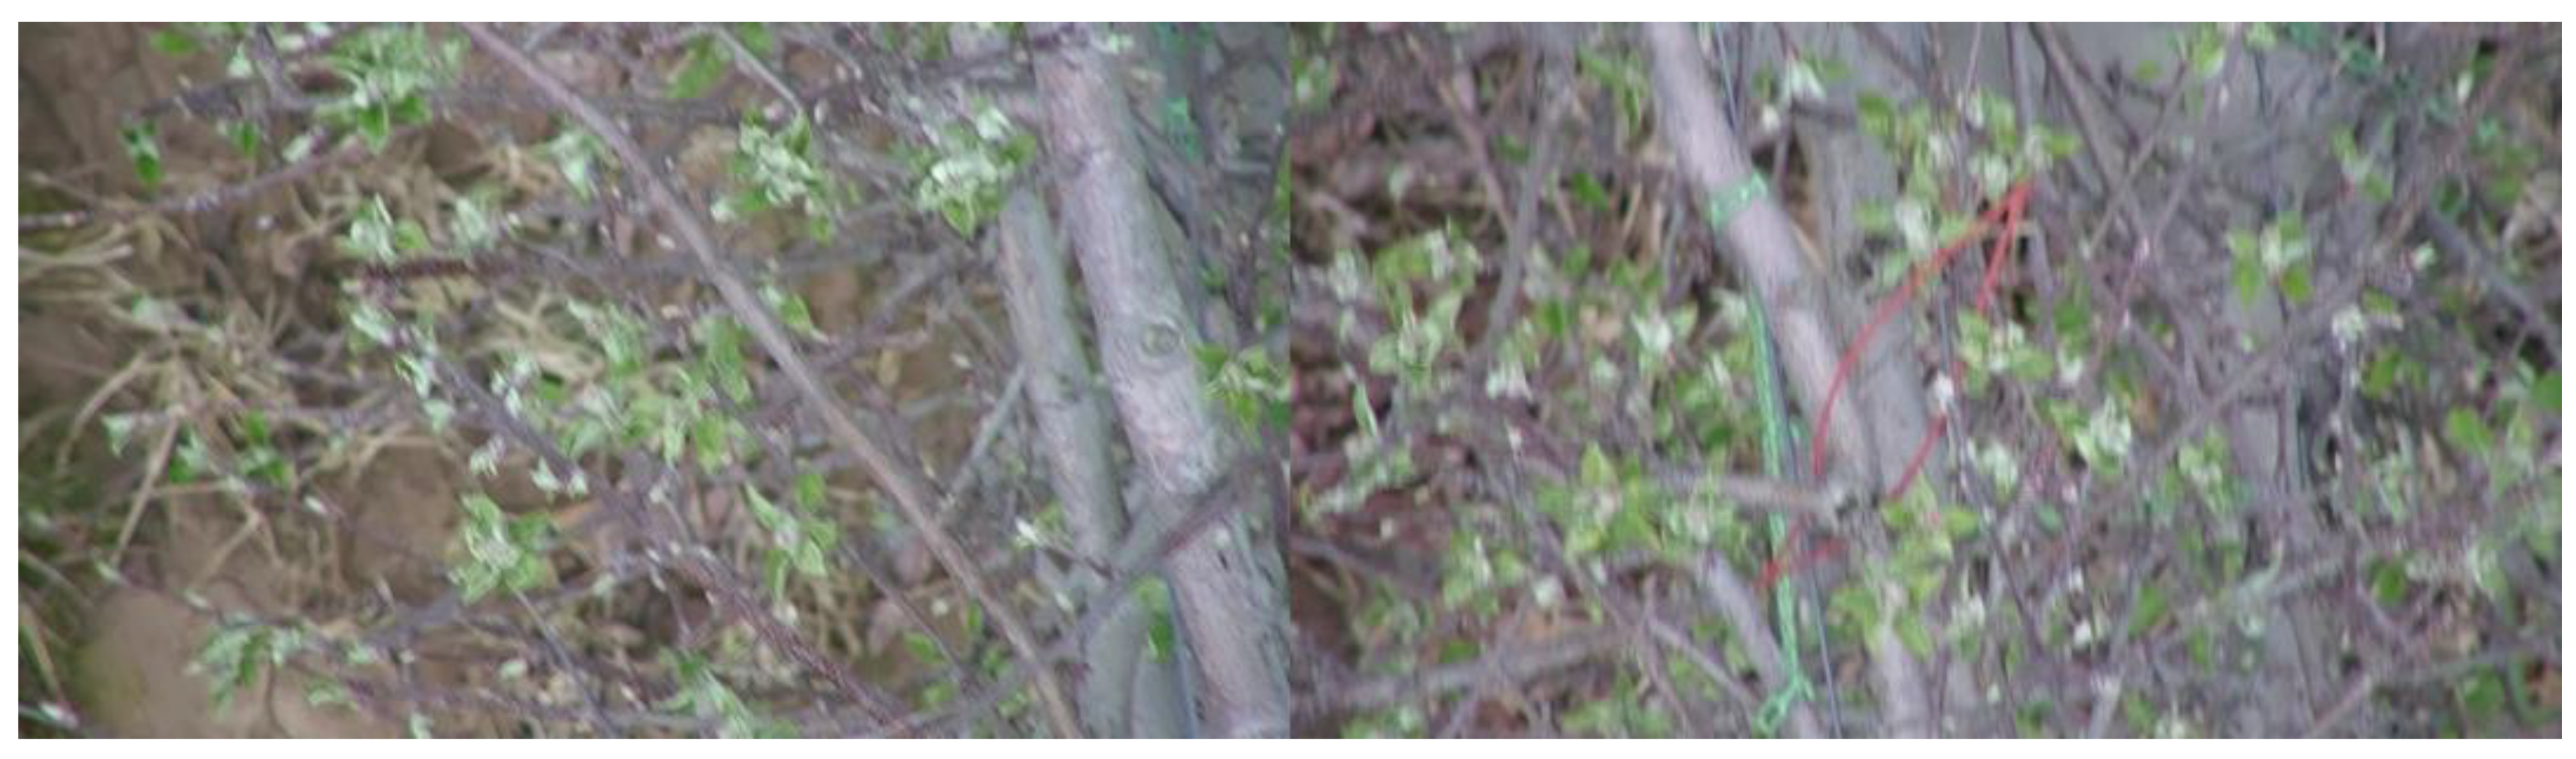
5.9. Blurred Image
AriAplBud comprises a collection of images exhibiting varying degrees of blurriness, resulting from the relative motions between the UAV and the apple trees during data collection (Figure 16). A blurred apple flower bud was annotated regardless, as long as the annotators were able to recognize its growth stage.
5.10. Artificial Object
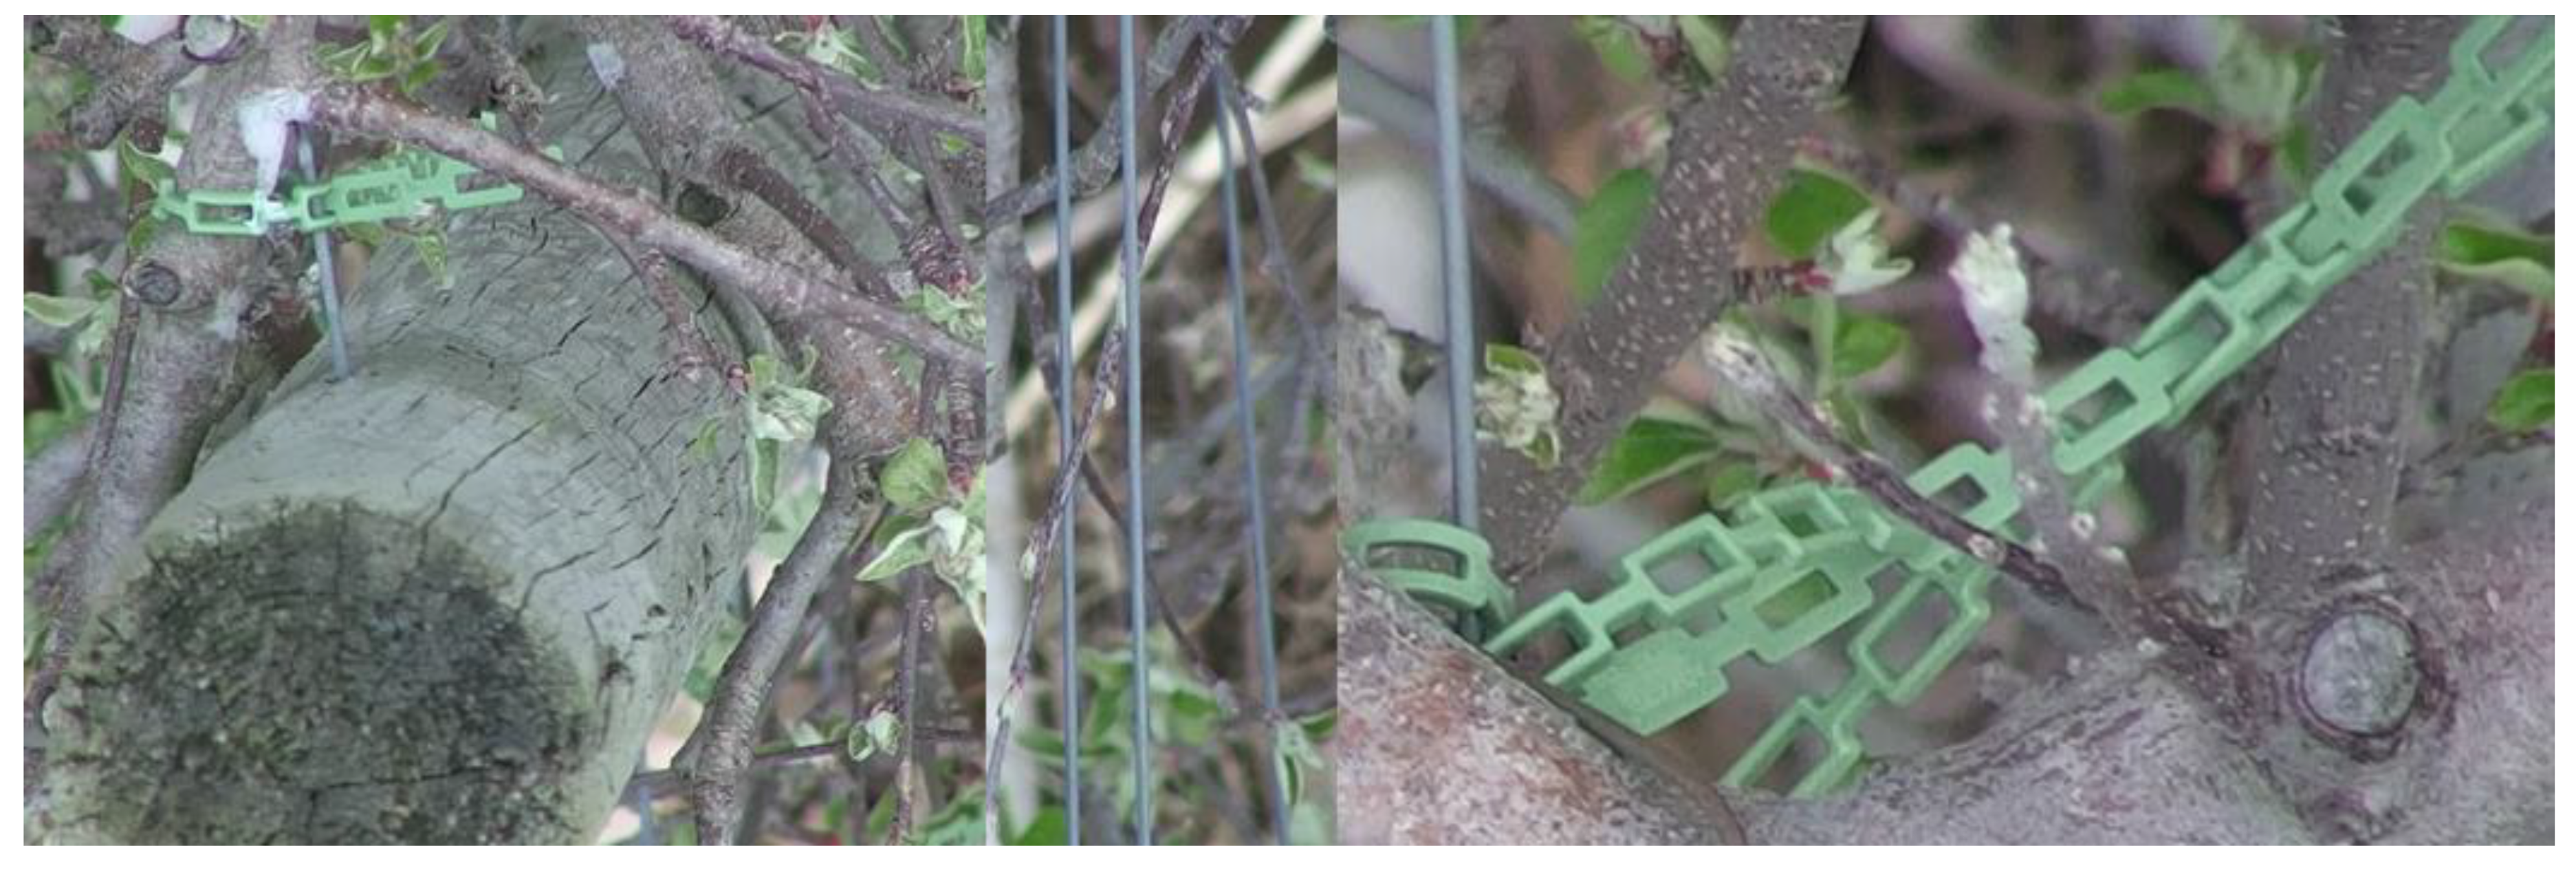
It is worth mentioning that AriAplBud often captures components of a trellis system used in the apple orchard to espalier the fruit trees, such as wooden posts, metal wires, and interlocking chain ties (Figure 17).
Supplementary Materials
The following supporting information can be downloaded at: https://www.mdpi.com/article/10.3390/data9020036/s1, Google Colab AriAplBud YOLOv8 Python tutorial.
Funding
This research received no external funding.
Institutional Review Board Statement
Not applicable.
Informed Consent Statement
Not applicable.
Data Availability Statement
AriAplBud is openly available in Open Science Framework (OSF).
Acknowledgments
The author would like to thank the image annotators, and the colleagues at the Department of Agricultural and Biological Engineering and the Department of Plant Science of Penn State for making AriAplBud possible.
Conflicts of Interest
The author declares no conflicts of interest.
References
- Zou, Z.; Chen, K.; Shi, Z.; Guo, Y.; Ye, J. Object Detection in 20 Years: A Survey. Proc. IEEE 2023, 111, 257–276. [Google Scholar] [CrossRef]
- Krizhevsky, A.; Sutskever, I.; Hinton, G.E. ImageNet Classification with Deep Convolutional Neural Networks. Commun. ACM 2017, 60, 84–90. [Google Scholar] [CrossRef]
- Dhillon, A.; Verma, G.K. Convolutional Neural Network: A Review of Models, Methodologies and Applications to Object Detection. Prog. Artif. Intell. 2020, 9, 85–112. [Google Scholar] [CrossRef]
- Ramachandran, A.; Sangaiah, A.K. A Review on Object Detection in Unmanned Aerial Vehicle Surveillance. Int. J. Cogn. Comput. Eng. 2021, 2, 215–228. [Google Scholar] [CrossRef]
- Wolf, S.A.; Wood, S.D. Precision Farming: Environmental Legitimation, Commodification of Information, and Industrial Coordination. Rural Sociol. 1997, 62, 180–206. [Google Scholar] [CrossRef]
- Deng, J.; Dong, W.; Socher, R.; Li, L.-J.; Li, K.; Li, F.-F. ImageNet: A Large-Scale Hierarchical Image Database. In Proceedings of the 2009 IEEE Conference on Computer Vision and Pattern Recognition, Miami, FL, USA, 20–25 June 2009; pp. 248–255. [Google Scholar] [CrossRef]
- Lin, T.-Y.; Maire, M.; Belongie, S.; Bourdev, L.; Girshick, R.; Hays, J.; Perona, P.; Ramanan, D.; Zitnick, C.L.; Dollár, P. Microsoft COCO: Common Objects in Context. In Proceedings of the 13th European Conference on Computer Vision (ECCV), Zurich, Switzerland, 6–12 September 2014; pp. 740–755. [Google Scholar]
- Everingham, M.; Van Gool, L.; Williams, C.K.I.; Winn, J.; Zisserman, A. The Pascal Visual Object Classes (VOC) Challenge. Int. J. Comput. Vis. 2010, 88, 303–338. [Google Scholar] [CrossRef]
- Zou, H.; Lu, H.; Li, Y.; Liu, L.; Cao, Z. Maize Tassels Detection: A Benchmark of the State of the Art. Plant Methods 2020, 16, 108. [Google Scholar] [CrossRef]
- Dang, F.; Chen, D.; Lu, Y.; Li, Z.; Zheng, Y. DeepCottonWeeds (DCW): A Novel Benchmark of YOLO Object Detectors for Weed Detection in Cotton Production Systems. In Proceedings of the 2022 ASABE Annual International Meeting, Houston, TX, USA, 17–20 July 2022; p. 2200214. [Google Scholar]
- Dang, F.; Chen, D.; Lu, Y.; Li, Z. YOLOWeeds: A Novel Benchmark of YOLO Object Detectors for Multi-Class Weed Detection in Cotton Production Systems. Comput. Electron. Agric. 2023, 205, 107655. [Google Scholar] [CrossRef]
- Hani, N.; Roy, P.; Isler, V. MinneApple: A Benchmark Dataset for Apple Detection and Segmentation. IEEE Robot. Autom. Lett. 2020, 5, 852–858. [Google Scholar] [CrossRef]
- Papagiannaki, K.; Lagouvardos, K.; Kotroni, V.; Papagiannakis, G. Agricultural Losses Related to Frost Events: Use of the 850 HPa Level Temperature as an Explanatory Variable of the Damage Cost. Nat. Hazards Earth Syst. Sci. 2014, 14, 2375–2386. [Google Scholar] [CrossRef]
- Snyder, R.L.; de Melo-Abreu, J.P. Frost Protection: Fundamentals, Practice, and Economics; Food and Agriculture Organization of the United Nations: Rome, Italy, 2005; Volume 1, ISBN 9251053286. [Google Scholar]
- Yuan, W.; Choi, D. UAV-Based Heating Requirement Determination for Frost Management in Apple Orchard. Remote Sens. 2021, 13, 273. [Google Scholar] [CrossRef]
- Ballard, J.K.; Proebsting, E.L. Frost and Frost Control in Washington Orchards; eb0634_1978; Washington State University Cooperative Extension: Pullman, WA, USA, 1978; Available online: https://content.libraries.wsu.edu/digital/collection/ext/id/17531 (accessed on 8 February 2024).
- Yuan, W. Accuracy Comparison of YOLOv7 and YOLOv4 Regarding Image Annotation Quality for Apple Flower Bud Classification. AgriEngineering 2023, 5, 413–424. [Google Scholar] [CrossRef]
- Yuan, W.; Choi, D.; Bolkas, D.; Heinemann, P.H.; He, L. Sensitivity Examination of YOLOv4 Regarding Test Image Distortion and Training Dataset Attribute for Apple Flower Bud Classification. Int. J. Remote Sens. 2022, 43, 3106–3130. [Google Scholar] [CrossRef]
- Yuan, W. Development of a UAV-Based Multi-Dimensional Mapping Framework for Precise Frost Management in Apple Orchards. Ph.D. Thesis, The Pennsylvania State University, University Park, PA, USA, 2022. [Google Scholar]
- Bochkovskiy, A.; Wang, C.-Y.; Liao, H.-Y.M. YOLOv4: Optimal Speed and Accuracy of Object Detection. arXiv 2020, arXiv:2004.10934. [Google Scholar]
- Wang, C.-Y.; Bochkovskiy, A.; Liao, H.-Y.M. YOLOv7: Trainable Bag-of-Freebies Sets New State-of-the-Art for Real-Time Object Detectors. arXiv 2022, arXiv:2207.02696. [Google Scholar]
- Ballard, J.K.; Proebsting, E.L.; Tukey, R.B. Apples: Critical Temperatures for Blossom Buds; 99900502315001842; Washington State University Extension: Pullman, WA, USA, 1971; Available online: https://rex.libraries.wsu.edu/esploro/outputs/report/Apples-critical-temperatures-for-blossom-buds/99900502315001842 (accessed on 8 February 2024).
- YOLO-Label. Available online: https://github.com/developer0hye/Yolo_Label (accessed on 8 February 2024).
- Jocher, G.; Chaurasia, A.; Qiu, J. YOLO by Ultralytics 2023. Available online: https://github.com/ultralytics/ultralytics (accessed on 8 February 2024).
- Li, Y.; Nie, J.; Chao, X. Do We Really Need Deep CNN for Plant Diseases Identification? Comput. Electron. Agric. 2020, 178, 105803. [Google Scholar] [CrossRef]
- Ba, L.J.; Caruana, R. Do Deep Nets Really Need to Be Deep? Adv. Neural Inf. Process. Syst. 2014, 3, 2654–2662. [Google Scholar]
- Crassweller, R. Home Orchards: Flowering Habits of Apples and Pears. Available online: https://extension.psu.edu/home-orchards-flowering-habits-of-apples-and-pears (accessed on 8 February 2024).
- Xianbao, C.; Guihua, Q.; Yu, J.; Zhaomin, Z. An Improved Small Object Detection Method Based on Yolo V3. Pattern Anal. Appl. 2021, 24, 1347–1355. [Google Scholar] [CrossRef]
- Benjumea, A.; Teeti, I.; Cuzzolin, F.; Bradley, A. YOLO-Z: Improving Small Object Detection in YOLOv5 for Autonomous Vehicles. arXiv 2021, arXiv:2112.11798. [Google Scholar]
- Wang, Z.Z.; Xie, K.; Zhang, X.Y.; Chen, H.Q.; Wen, C.; He, J.B. Small-Object Detection Based on YOLO and Dense Block via Image Super-Resolution. IEEE Access 2021, 9, 56416–56429. [Google Scholar] [CrossRef]
- Du, Z.; Yin, J.; Yang, J. Expanding Receptive Field YOLO for Small Object Detection. J. Phys. Conf. Ser. 2019, 1314, 012202. [Google Scholar] [CrossRef]
- He, X.; Cheng, R.; Zheng, Z.; Wang, Z. Small Object Detection in Traffic Scenes Based on Yolo-Mxanet. Sensors 2021, 21, 7422. [Google Scholar] [CrossRef] [PubMed]
- Qiu, Z.; Wang, S.; Zeng, Z.; Yu, D. Automatic Visual Defects Inspection of Wind Turbine Blades via YOLO-Based Small Object Detection Approach. J. Electron. Imaging 2019, 28, 043023. [Google Scholar] [CrossRef]
- Li, Y.; Li, S.; Du, H.; Chen, L.; Zhang, D.; Li, Y. YOLO-ACN: Focusing on Small Target and Occluded Object Detection. IEEE Access 2020, 8, 227288–227303. [Google Scholar] [CrossRef]
- Liu, M.; Wang, X.; Zhou, A.; Fu, X.; Ma, Y.; Piao, C. Uav-Yolo: Small Object Detection on Unmanned Aerial Vehicle Perspective. Sensors 2020, 20, 2238. [Google Scholar] [CrossRef]
- Kaufman, S.; Rosset, S.; Perlich, C.; Stitelman, O. Leakage in Data Mining: Formulation, Detection, and Avoidance. ACM Trans. Knowl. Discov. Data 2012, 6, 556–563. [Google Scholar] [CrossRef]
Figure 1.
Randomly selected AriAplBud sample images from different data collection dates.

Figure 2.
AriAplBud data collection apple orchard at the Russell E. Larson Agricultural Research Center.
Figure 2.
AriAplBud data collection apple orchard at the Russell E. Larson Agricultural Research Center.

Figure 3.
Apple flower bud annotations of the image “041920_0041.jpg” from AriAplBud.

Figure 4.
Apple flower bud detection result comparison between YOLOv8n and YOLOv8x using sample images at different growth stages from the AriAplBud test dataset.
Figure 4.
Apple flower bud detection result comparison between YOLOv8n and YOLOv8x using sample images at different growth stages from the AriAplBud test dataset.

Figure 5.
Annotation number comparison between all apple flower bud growth stages in AriAplBud.

Figure 6.
Bar chart showing annotation per image distribution of AriAplBud positive samples.

Figure 7.
Two sample images from AriAplBud, “050220_0450.jpg” and “050720_0085.jpg”, containing 1 and 112 annotations, respectively.
Figure 7.
Two sample images from AriAplBud, “050220_0450.jpg” and “050720_0085.jpg”, containing 1 and 112 annotations, respectively.

Figure 8.
Box plot of AriAplBud annotation size in terms of normalized bounding box area.

Figure 9.
Two sample images from AriAplBud, “050220_0435.jpg” and “050720_0128.jpg”, containing the smallest and largest bounding box annotations, respectively.
Figure 9.
Two sample images from AriAplBud, “050220_0435.jpg” and “050720_0128.jpg”, containing the smallest and largest bounding box annotations, respectively.

Figure 10.
Regions of three sample images from AriAplBud, “052120_0222.jpg”, “042320_0068.jpg”, and “051320_0017.jpg”, where an unintentional annotation inside a petal fall annotation, an unannotated tight cluster, and a falsely annotated bloom as petal fall can be observed.
Figure 10.
Regions of three sample images from AriAplBud, “052120_0222.jpg”, “042320_0068.jpg”, and “051320_0017.jpg”, where an unintentional annotation inside a petal fall annotation, an unannotated tight cluster, and a falsely annotated bloom as petal fall can be observed.

Figure 11.
Regions of three sample images from AriAplBud, “050220_0359.jpg”, “050220_0440.jpg”, and “050220_0406.jpg”, with different pink annotation styles.
Figure 11.
Regions of three sample images from AriAplBud, “050220_0359.jpg”, “050220_0440.jpg”, and “050220_0406.jpg”, with different pink annotation styles.

Figure 12.
Regions of two sample images from AriAplBud, “051620_0045.jpg” and “051620_0043.jpg”, with different petal fall annotation styles.
Figure 12.
Regions of two sample images from AriAplBud, “051620_0045.jpg” and “051620_0043.jpg”, with different petal fall annotation styles.

Figure 13.
Two sample images from AriAplBud, “042320_0076.jpg” and “042320_0077.jpg”, with very similar visual appearances.
Figure 13.
Two sample images from AriAplBud, “042320_0076.jpg” and “042320_0077.jpg”, with very similar visual appearances.

Figure 14.
Two distinct sample images from AriAplBud, “041920_0040.jpg” and “092520_0220.jpg”, captured with a five-month interval.
Figure 14.
Two distinct sample images from AriAplBud, “041920_0040.jpg” and “092520_0220.jpg”, captured with a five-month interval.

Figure 15.
Two sample images from AriAplBud, “041920_0051.jpg” and “042320_0008.jpg”, containing differently sized tight clusters due to UAV flight altitude variations.
Figure 15.
Two sample images from AriAplBud, “041920_0051.jpg” and “042320_0008.jpg”, containing differently sized tight clusters due to UAV flight altitude variations.

Figure 16.
Two blurred sample images from AriAplBud, “042320_0025.jpg” and “042320_0067.jpg”.

Figure 17.
Regions of three sample images from AriAplBud, “041920_0055.jpg”, “041920_0048.jpg”, and “041920_0019.jpg”, containing a wooden post, metal wires, and interlocking chain ties.
Figure 17.
Regions of three sample images from AriAplBud, “041920_0055.jpg”, “041920_0048.jpg”, and “041920_0019.jpg”, containing a wooden post, metal wires, and interlocking chain ties.


Table 1.
Annotated apple flower bud numbers in AriAplBud at different data collection dates.
| Date | 19 April 2020 | 23 April 2020 | 28 April 2020 | 2 May 2020 | 7 May 2020 | 13 May 2020 | 16 May 2020 | 21 May 2020 | 25 September 2020 | Total |
|---|---|---|---|---|---|---|---|---|---|---|
| Tip | 146 | 342 | 15 | 1 | 0 | 0 | 1 | 0 | 0 | 505 |
| Half-inch green | 460 | 845 | 84 | 0 | 0 | 0 | 0 | 0 | 0 | 1389 |
| Tight cluster | 2479 | 10,842 | 5931 | 514 | 1 | 0 | 0 | 0 | 0 | 19,767 |
| Pink | 64 | 691 | 5898 | 10,796 | 4966 | 2899 | 622 | 30 | 0 | 25,966 |
| Bloom | 0 | 0 | 2 | 643 | 19,905 | 13,074 | 7928 | 2239 | 0 | 43,791 |
| Petal fall | 0 | 0 | 0 | 0 | 7 | 4376 | 7754 | 6912 | 0 | 19,049 |
| Total | 3149 | 12,720 | 11,930 | 11,954 | 24,879 | 20,349 | 16,305 | 9181 | 0 | 110,467 |
Table 2.
Test dataset AP50s and mAP50s of YOLOv8n and YOLOv8x models developed using AriAplBud.
| Growth Stage | YOLOv8n AP50 | YOLOv8x AP50 |
|---|---|---|
| Tip | 0.524 | 0.579 |
| Half-inch green | 0.542 | 0.617 |
| Tight cluster | 0.886 | 0.872 |
| Pink | 0.772 | 0.765 |
| Bloom | 0.863 | 0.874 |
| Petal fall | 0.600 | 0.657 |
| mAP50 | 0.698 | 0.727 |
Disclaimer/Publisher’s Note: The statements, opinions and data contained in all publications are solely those of the individual author(s) and contributor(s) and not of MDPI and/or the editor(s). MDPI and/or the editor(s) disclaim responsibility for any injury to people or property resulting from any ideas, methods, instructions or products referred to in the content. |
© 2024 by the author. Licensee MDPI, Basel, Switzerland. This article is an open access article distributed under the terms and conditions of the Creative Commons Attribution (CC BY) license (https://creativecommons.org/licenses/by/4.0/).
Share and Cite
MDPI and ACS Style
Yuan, W. AriAplBud: An Aerial Multi-Growth Stage Apple Flower Bud Dataset for Agricultural Object Detection Benchmarking. Data 2024, 9, 36. https://doi.org/10.3390/data9020036
AMA Style
Yuan W. AriAplBud: An Aerial Multi-Growth Stage Apple Flower Bud Dataset for Agricultural Object Detection Benchmarking. Data. 2024; 9(2):36. https://doi.org/10.3390/data9020036
Chicago/Turabian StyleYuan, Wenan. 2024. "AriAplBud: An Aerial Multi-Growth Stage Apple Flower Bud Dataset for Agricultural Object Detection Benchmarking" Data 9, no. 2: 36. https://doi.org/10.3390/data9020036