
An Automated Big Data Quality Anomaly Correction Framework Using Predictive Analysis


Laboratory of Engineering Sciences, National School of Applied Sciences, Ibn Tofail University, Kenitra 14000, Morocco
*
Authors to whom correspondence should be addressed.
Data 2023, 8(12), 182; https://doi.org/10.3390/data8120182
Submission received: 14 September 2023
/
Revised: 23 November 2023
/
Accepted: 27 November 2023
/
Published: 1 December 2023
(This article belongs to the Section Information Systems and Data Management)
Abstract
:Big data has emerged as a fundamental component in various domains, enabling organizations to extract valuable insights and make informed decisions. However, ensuring data quality is crucial for effectively using big data. Thus, big data quality has been gaining more attention in recent years by researchers and practitioners due to its significant impact on decision-making processes. However, existing studies addressing data quality anomalies often have a limited scope, concentrating on specific aspects such as outliers or inconsistencies. Moreover, many approaches are context-specific, lacking a generic solution applicable across different domains. To the best of our knowledge, no existing framework currently automatically addresses quality anomalies comprehensively and generically, considering all aspects of data quality. To fill the gaps in the field, we propose a sophisticated framework that automatically corrects big data quality anomalies using an intelligent predictive model. The proposed framework comprehensively addresses the main aspects of data quality by considering six key quality dimensions: Accuracy, Completeness, Conformity, Uniqueness, Consistency, and Readability. Moreover, the framework is not correlated to a specific field and is designed to be applicable across various areas, offering a generic approach to address data quality anomalies. The proposed framework was implemented on two datasets and has achieved an accuracy of 98.22%. Moreover, the results have shown that the framework has allowed the data quality to be boosted to a great score, reaching 99%, with an improvement rate of up to 14.76% of the quality score.
1. Introduction
Nowadays, the ability to collect, process, and analyze massive volumes of data has opened up new opportunities for organizations to gain valuable insights and make informed decisions. Big data analytics has become a fundamental component of decision-making, enabling organizations to unveil hidden patterns, trends, and correlations that were previously inaccessible. This analytical capability allows businesses to understand customer preferences better, optimize operational processes, identify anomalies, mitigate risks, and make informed, data-driven strategic decisions. However, it is crucial to recognize that the actual value of big data lies in its quality. Thus, data quality plays a vital role in ensuring the accuracy and reliability of analysis. Poor data quality, errors, inconsistencies, and incompleteness can negatively affect decision-making processes. According to a recent survey [1] by Gartner, poor data quality costs organizations an average of $12.9 million annually. In addition to the immediate impact on revenue, over the long term, poor-quality data increases the complexity of data ecosystems and leads to poor decision-making. Therefore, data quality has gained increasing attention from researchers and practitioners in recent years due to its significant impact on organizations. Thus, numerous approaches and techniques have been proposed in the literature to address data quality issues [2,3,4]. However, many studies that have attempted to address data quality anomalies are focused on specific contexts and lack a general approach. These context-specific studies are limited in their applicability to different situations and industries. Also, studies that addressed data quality anomalies have often been limited to addressing only one specific aspect, such as outliers or duplications. This limited focus fails to capture the entirety of data quality anomalies that may exist, neglecting other critical issues that could impact the reliability and accuracy of big data. A recent survey [5] about big data quality has stated the need for a comprehensive context-aware approach that handles big data quality anomalies. Therefore, there is a pressing need for intelligent and sophisticated techniques to address data quality anomalies holistically, considering the multifaceted nature of big data and encompassing all relevant quality dimensions. Such an approach would provide a more comprehensive and effective solution to enhance data quality and enable organizations to derive accurate insights and make informed decisions based on reliable and trustworthy data. To address the gaps in the field, we propose a big data quality anomaly correction with three main contributions:
- The primary contribution of this research is the proposal of a novel framework for big data quality anomaly correction. This framework adopts a sophisticated methodology based on a predictive model, allowing it to effectively correct challenging and hidden quality anomalies that require applying intelligent techniques based on data insights generated using predictive capabilities;
- Another noteworthy contribution of this study is the comprehensive treatment of big data quality. This framework addresses six critical dimensions of data quality: Accuracy, Completeness, Conformity, Uniqueness, Consistency, and Readability;
- Furthermore, this research proposes a framework not restricted to a specific field or domain. It is designed to be applicable across various areas, offering a generic approach to address data quality anomalies.
By introducing this framework, we aim to provide a comprehensive solution for addressing big data quality anomalies, offering a more holistic approach to data quality management. The rest of this paper is organized as follows: The next section defines the critical dimensions of data quality and underscores its immense importance for big data. Section 3 reviews the most recent related works that have addressed data quality, highlights the gaps in the field, and outlines this research’s main objectives and contributions to address the raised gaps. Section 4 introduces the different steps of our proposed Big Data Quality Anomaly Correction and describes how it allows us to enhance big data quality. Section 5 presents how our proposed framework could be applied across different application domains to improve data quality. Section 6 offers the implementation of our proposed framework and discusses the obtained results. Finally, conclusions are made, and future word directions are highlighted.
2. The Big Importance of Data Quality for Big Data
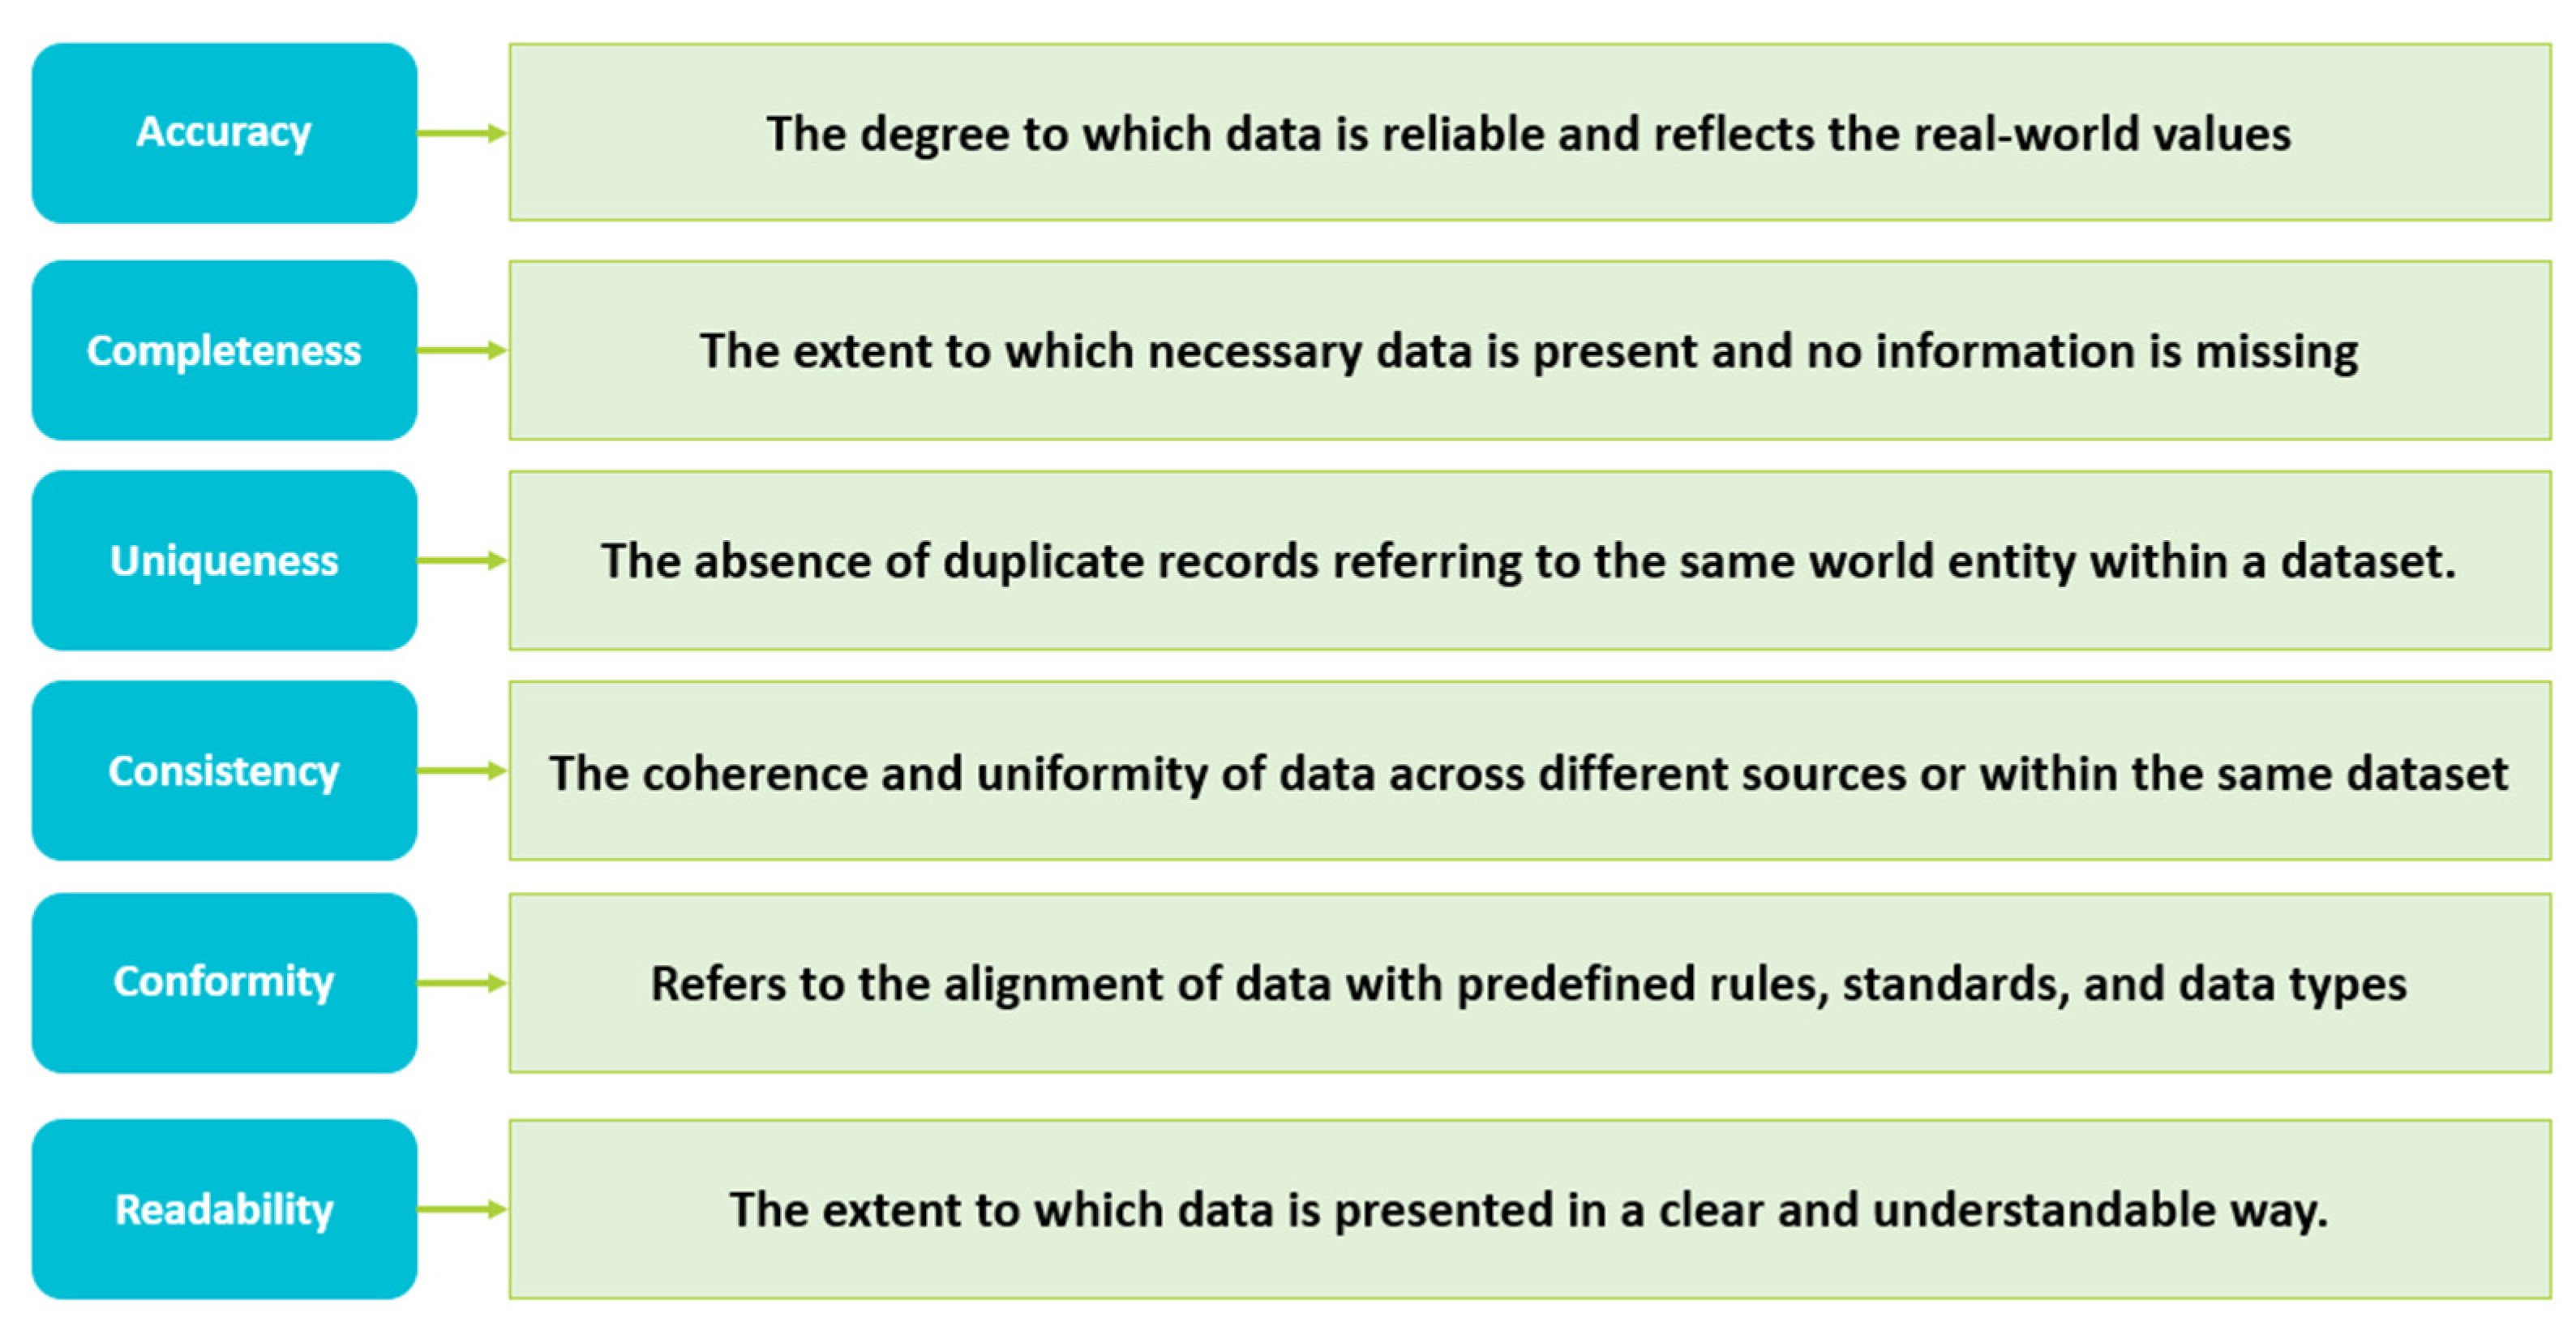
Data quality refers to the degree to which data meets the requirements and expectations of its intended use. Data quality could be defined in terms of its various aspects, such as data accuracy, data completeness, or data consistency, also known as data quality dimensions (DQDs). Figure 1 defines the six most common data quality dimensions:
It is worth noting that ensuring data quality is not just an added value but a requirement for successful big data initiatives. Indeed, data quality plays a critical role in the effectiveness and reliability of big data analytics, and organizations must prioritize it to derive meaningful and accurate insights. In the following, we shed light on the great importance of data quality for big data and highlight five key reasons why it is crucial for successful analytics:
- Accurate Decision-Making: Data quality ensures that the information used for decision-making is reliable and trustworthy. When dealing with large volumes of data, inaccuracies, inconsistencies, or errors can lead to erroneous analysis and, therefore, to incorrect decision-making. Recent research [6] by marketing analytics platform Adversity found that 63% of chief marketing officers (CMOs) make decisions based on data, but 41% of marketing data analysts are “struggling to trust their data”.
- Enhanced Customer Experience: Big data analytics provides an opportunity to gain valuable insights into customer behavior, preferences, and sentiment [7]. For example, an e-commerce company used customer data analytics to personalize product recommendations and marketing campaigns. However, when inaccurate or incomplete customer data were used, customers received irrelevant offers, leading to dissatisfaction and decreased engagement.
- Data Compliance: The relationship between data quality and compliance is closely connected. Indeed, regulations such as the General Data Protection Regulation (GDPR) impose that organizations rectify any inaccuracies or deficiencies in personal data. Thus, data quality standards have become imperative for businesses to ensure the precision of their information.
- Data Integration and Collaboration: In many organizations, data is generated and stored across multiple systems, departments, and sources. In such scenarios, data quality becomes crucial for successful integration and collaboration. For example, mismatches in data field names, missing or incomplete data, or incompatible data types can arise during integration, especially when data sources are inconsistent in data structure and format, leading to more biased data quality.
- Cost Efficiency: Big data initiatives often require significant investments in infrastructure, tools, and skilled personnel [8]. Poor data quality can result in wasted resources and increased costs. For example, inaccurate data may lead to unnecessary or incorrect analysis, which consumes time and effort. Poor data quality can lead to missed opportunities or flawed insights, resulting in inefficient resource allocation. A report [9] by IBM estimated that poor data quality costs the US economy approximately $3.1 trillion annually.
By prioritizing data quality, organizations can unlock the true potential of big data, gain a competitive advantage, and drive innovation and growth. Recognizing the significant importance of data quality, professionals and researchers have dedicated increased attention to this area. Extensive studies in the literature have been conducted to explore and understand the intricacies of data quality, which will be further examined in the next section.
3. Related Works
Big data quality anomalies are a popular and important subject that has not received sufficient attention in the existing literature. Despite numerous challenges in this area, there is a growing recognition of the significance of addressing big data quality issues in various domains. The complexity arises from the unique characteristics of big data and the wide range of quality anomalies that need to be addressed. As organizations increasingly realize the impact big data quality can have on their business operations, their interest in this topic continues growing, and many studies have been suggested. Numerous studies have addressed anomalies related to missing values, such as in [10], where the authors introduced a method known as “Full Subsequence Matching” for handling missing values within telemetry water level data. This technique entails recognizing a series of absent values and substituting them with constant values to form a contiguous sequence. Subsequently, it identifies the most comparable subsequence from historical data and adjusts it to fill the gaps in the missing segment based on similarity. Also, in [11], the authors introduced an innovative approach to address missing data through generative adversarial networks. This enhanced generative adversarial imputation network incorporates the Wasserstein distance and gradient penalty to manage missing values effectively. The data preprocessing stage is optimized by capitalizing on domain knowledge related to ships and utilizing isolation forests for anomaly detection. To address completeness anomalies, a new technique called Miss-GBRT was developed [12]. Miss-GBRT can impute missing values in wastewater quality data even when the training data are limited. The method involves two main steps. Pre-imputation is performed to ensure the completeness of training data. Then, the imputation stage, where Miss-GBRT uses a combination of shallow regression trees to estimate the missing values based on time-related residuals, incrementally filling in the missing data. To address missing data in marine systems’ sensor data, the authors in [13] analyze the use of variational autoencoders for assigning missing values. A comparative study includes widely used imputation techniques such as mean imputation, Forward Fill, Backward Fill, and KNN. There have also been some studies that have addressed anomalies related to other quality aspects, such as in [14], where the authors propose an intelligent method based on historical data mining to address the identification and correction of outliers from multi-data sources. Firstly, a neural tangent kernel K-means (NTKKM) clustering approach is introduced for the intelligent identification of outliers in single-source data. Then, an order-sensitive missing value imputation framework for multi-source data (OMSMVI) is presented. Finally, a neighborhood-based imputation (NI) algorithm is proposed, which utilizes the traditional K-nearest neighbors (KNN) approach to select neighboring nodes for accurate outlier correction flexibly. Also, in [15], autonomous systems were designed to optimize an objective function, extending beyond traditional condition-based maintenance approaches that detect faults or failures in non-optimizing systems. Anomaly detection and correction in these optimizing autonomous systems, described by differential equations, are addressed using inverse reinforcement learning (RL). The proposed approach involves training, detection, and correction phases, where the objective function and intention are inferred, and anomalies are identified and corrected. To detect quality anomalies, the authors in [16] have developed an anomaly detection method for time series data based on a multi-granularity neighbor residual network (MGNRN). For this, they constructed a neighbor input vector with a sliding time window for each data sample and defined a neighbor-based input matrix by considering multi-granularity neighborhood features. Then, they computed the linear and non-linear neighbor features. Finally, they predicted the abnormal probability of the sample by combining the linear neighborhood residual with the non-linear residual. The proposed model was experimented with and has shown great performance in terms of accuracy. Likewise, the authors in [17] have suggested an automated anomaly detection approach. The approach uses models’ comparison, consensus learning, and a combination of rules of thumb with iterative hyper-parameter tuning to enhance data quality and management. The involvement of a domain expert as a human in the loop ensures the evaluation and validation of the unsupervised model’s output. An experiment conducted as part of a case study validates the effectiveness of the proposed approach. All the studies cited above have contributed to the ongoing discussion of anomaly correction. However, these studies were not designed to work for big data. Indeed, the emergence of big data has brought new challenges to anomaly correction regarding scalability, variety, and complexity. Thus, new approaches were suggested in the literature to address anomalies in the big data context, such as in [18], where the authors explore anomalies in the banking sector caused by big data technologies, specifically addressing credit card discrepancies and utilizing a toolkit for assessing incongruities in a Wireless Application Protocol (WAP) instrument. Likewise, in [19], a model is proposed to effectively cleanse drinking-water-quality for big data. Firstly, data that deviate from the normal distribution are identified as outliers and removed. The optimal control theory of non-linear partial differential equations is then integrated into the cart decision tree with a specified depth, which serves as a weak classifier. Using the suggested model, missing values in the data stream are predicted. Also, in [20], a data quality model comprising a canonical data model, four adequacy levels, and Benford’s law is proposed to assess the quality of COVID-19 data reported by the World Health Organization (WHO) in the six Central African Economic and Monitory Community (CEMAC) region countries. The model provides insights into the sufficiency and dependability of big dataset inspection. The findings and suggested solutions highlight the importance of improving data quality. They call for further research to enhance the model’s core concepts, integrate it with other data processing technologies, and expand its application scope. The authors in [21] have proposed a data outliers identification model designed explicitly for power big data to address outliers in big data. The model uses data augmentation technology to group and map power data into different feature spaces. Tri-training, a machine learning technique, is then employed to detect abnormal data across these feature spaces. To detect erroneous measurements in the vast amount of real-time big data streams generated by sensors, the authors implement [22] an effective data cleaning process to eliminate traffic sensor faults. They also introduce a traffic model that benefits from detecting anomalous data traffic sensors capture. Similarly, in [23], the authors suggested a novel architecture to address anomalies in big data in a power grid. In the proposed system, the context of the subsystem is first analyzed to fulfill the system’s overall functional process. Specific application scenarios are then examined to list and describe the operational requirements of the data cleaning subsystem. Furthermore, the functional requirements of the power grid big data cleaning subsystem are analyzed from a software engineering perspective. For the same purpose, the authors in [24] have investigated anomalies in the banking sector associated with big data, particularly anomalies in credit cards. This study focuses on inconsistencies in credit card data and proposes a methodology to address them by identifying invalid data numbers. Also, adequate steps were presented for their removal. Other recent and pertinent approaches to data anomaly correction were suggested in [25,26,27]. As explored and reviewed, all these approaches have significantly contributed to the state of the art of quality anomaly correction. However, despite their contributions, specific gaps and limitations remain in the current state of the art. Based on the above exploration of the state of the art, we have identified the following main points:
- As stated by the most recent surveys and reviews about big data quality [5,28], comprehensive studies still need to address big data quality anomalies. The existing literature lacks sufficient coverage in this area, highlighting the need for further research and analysis to fill this gap adequately;
- Studies focusing on anomaly correction in data quality have often been limited to addressing only one specific aspect, such as outliers or duplications. This limited focus fails to capture the entirety of data quality anomalies that may exist, neglecting other critical issues that could impact the reliability and accuracy of big data;
- Many studies that have attempted to tackle data quality anomalies are context-focused and lack a generic approach. While context-specific studies are valuable for understanding the intricacies of data quality in specific domains, it is equally essential to develop generic methodologies that can be applied across various industries and sectors;
- There is a pressing need for intelligent and sophisticated methods to correct data quality anomalies that encompass correlations or patterns beyond the scope of conventional techniques, thus requiring a more advanced approach.
Research Objectives:
Based on the exploration of the state of the art, we aim through this paper to enhance the quality of big datasets and address the gaps identified above by suggesting a novel big data framework that corrects the quality anomalies and replaces them with more accurate values. The main contributions of our proposed framework include the following:
- Introduction of a novel framework for correcting quality anomalies in big data. This framework employs an intelligent and advanced methodology based on predictive modeling that allows automated correction of quality anomalies by predicting and substituting accurate values;
- Comprehensive treatment of big data quality, addressing six critical dimensions of data quality: Accuracy, Completeness, Conformity, Uniqueness, Consistency, and Readability;
- The versatility of our research framework is not limited to any specific domain or industry. It offers a generic approach to tackling data quality anomalies, making it applicable across various domains and fields.
In summary, our research aims to enhance big data quality by proposing a novel framework that corrects quality anomalies by replacing them with more accurate values, which are generated using a predictive model. Notably, our framework addresses anomalies related to a wide range of data quality dimensions, encompassing six key dimensions. Moreover, the framework is designed to be applicable across diverse domains without any correlation to a specific field. The following section presents our proposed big data quality anomaly correction framework and its different steps.
4. Big Data Quality Booster Framework through Predictive Analysis
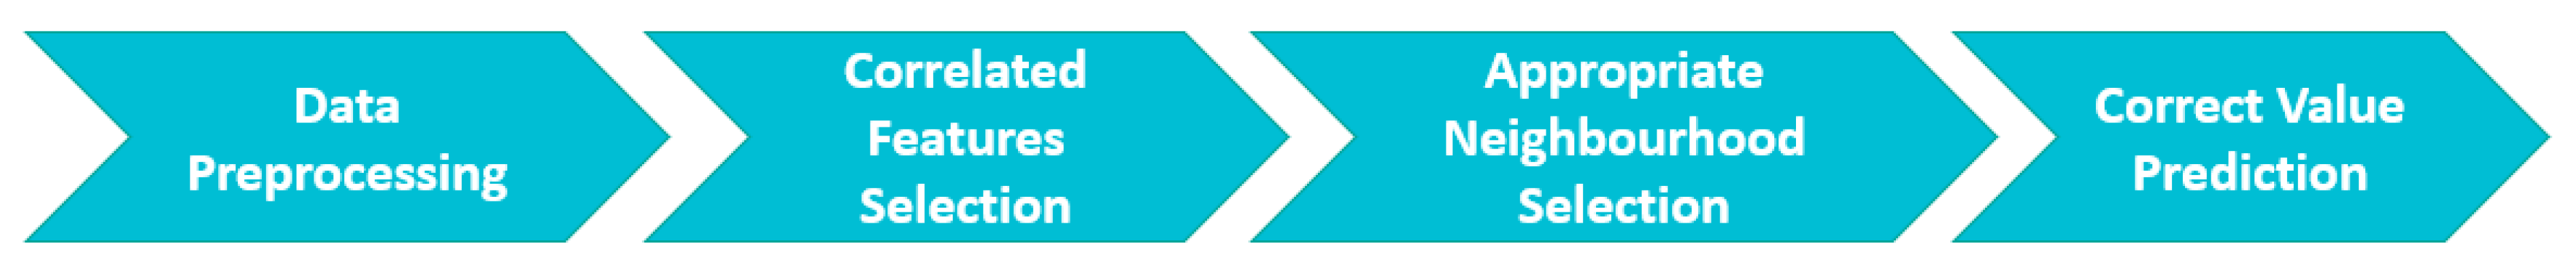
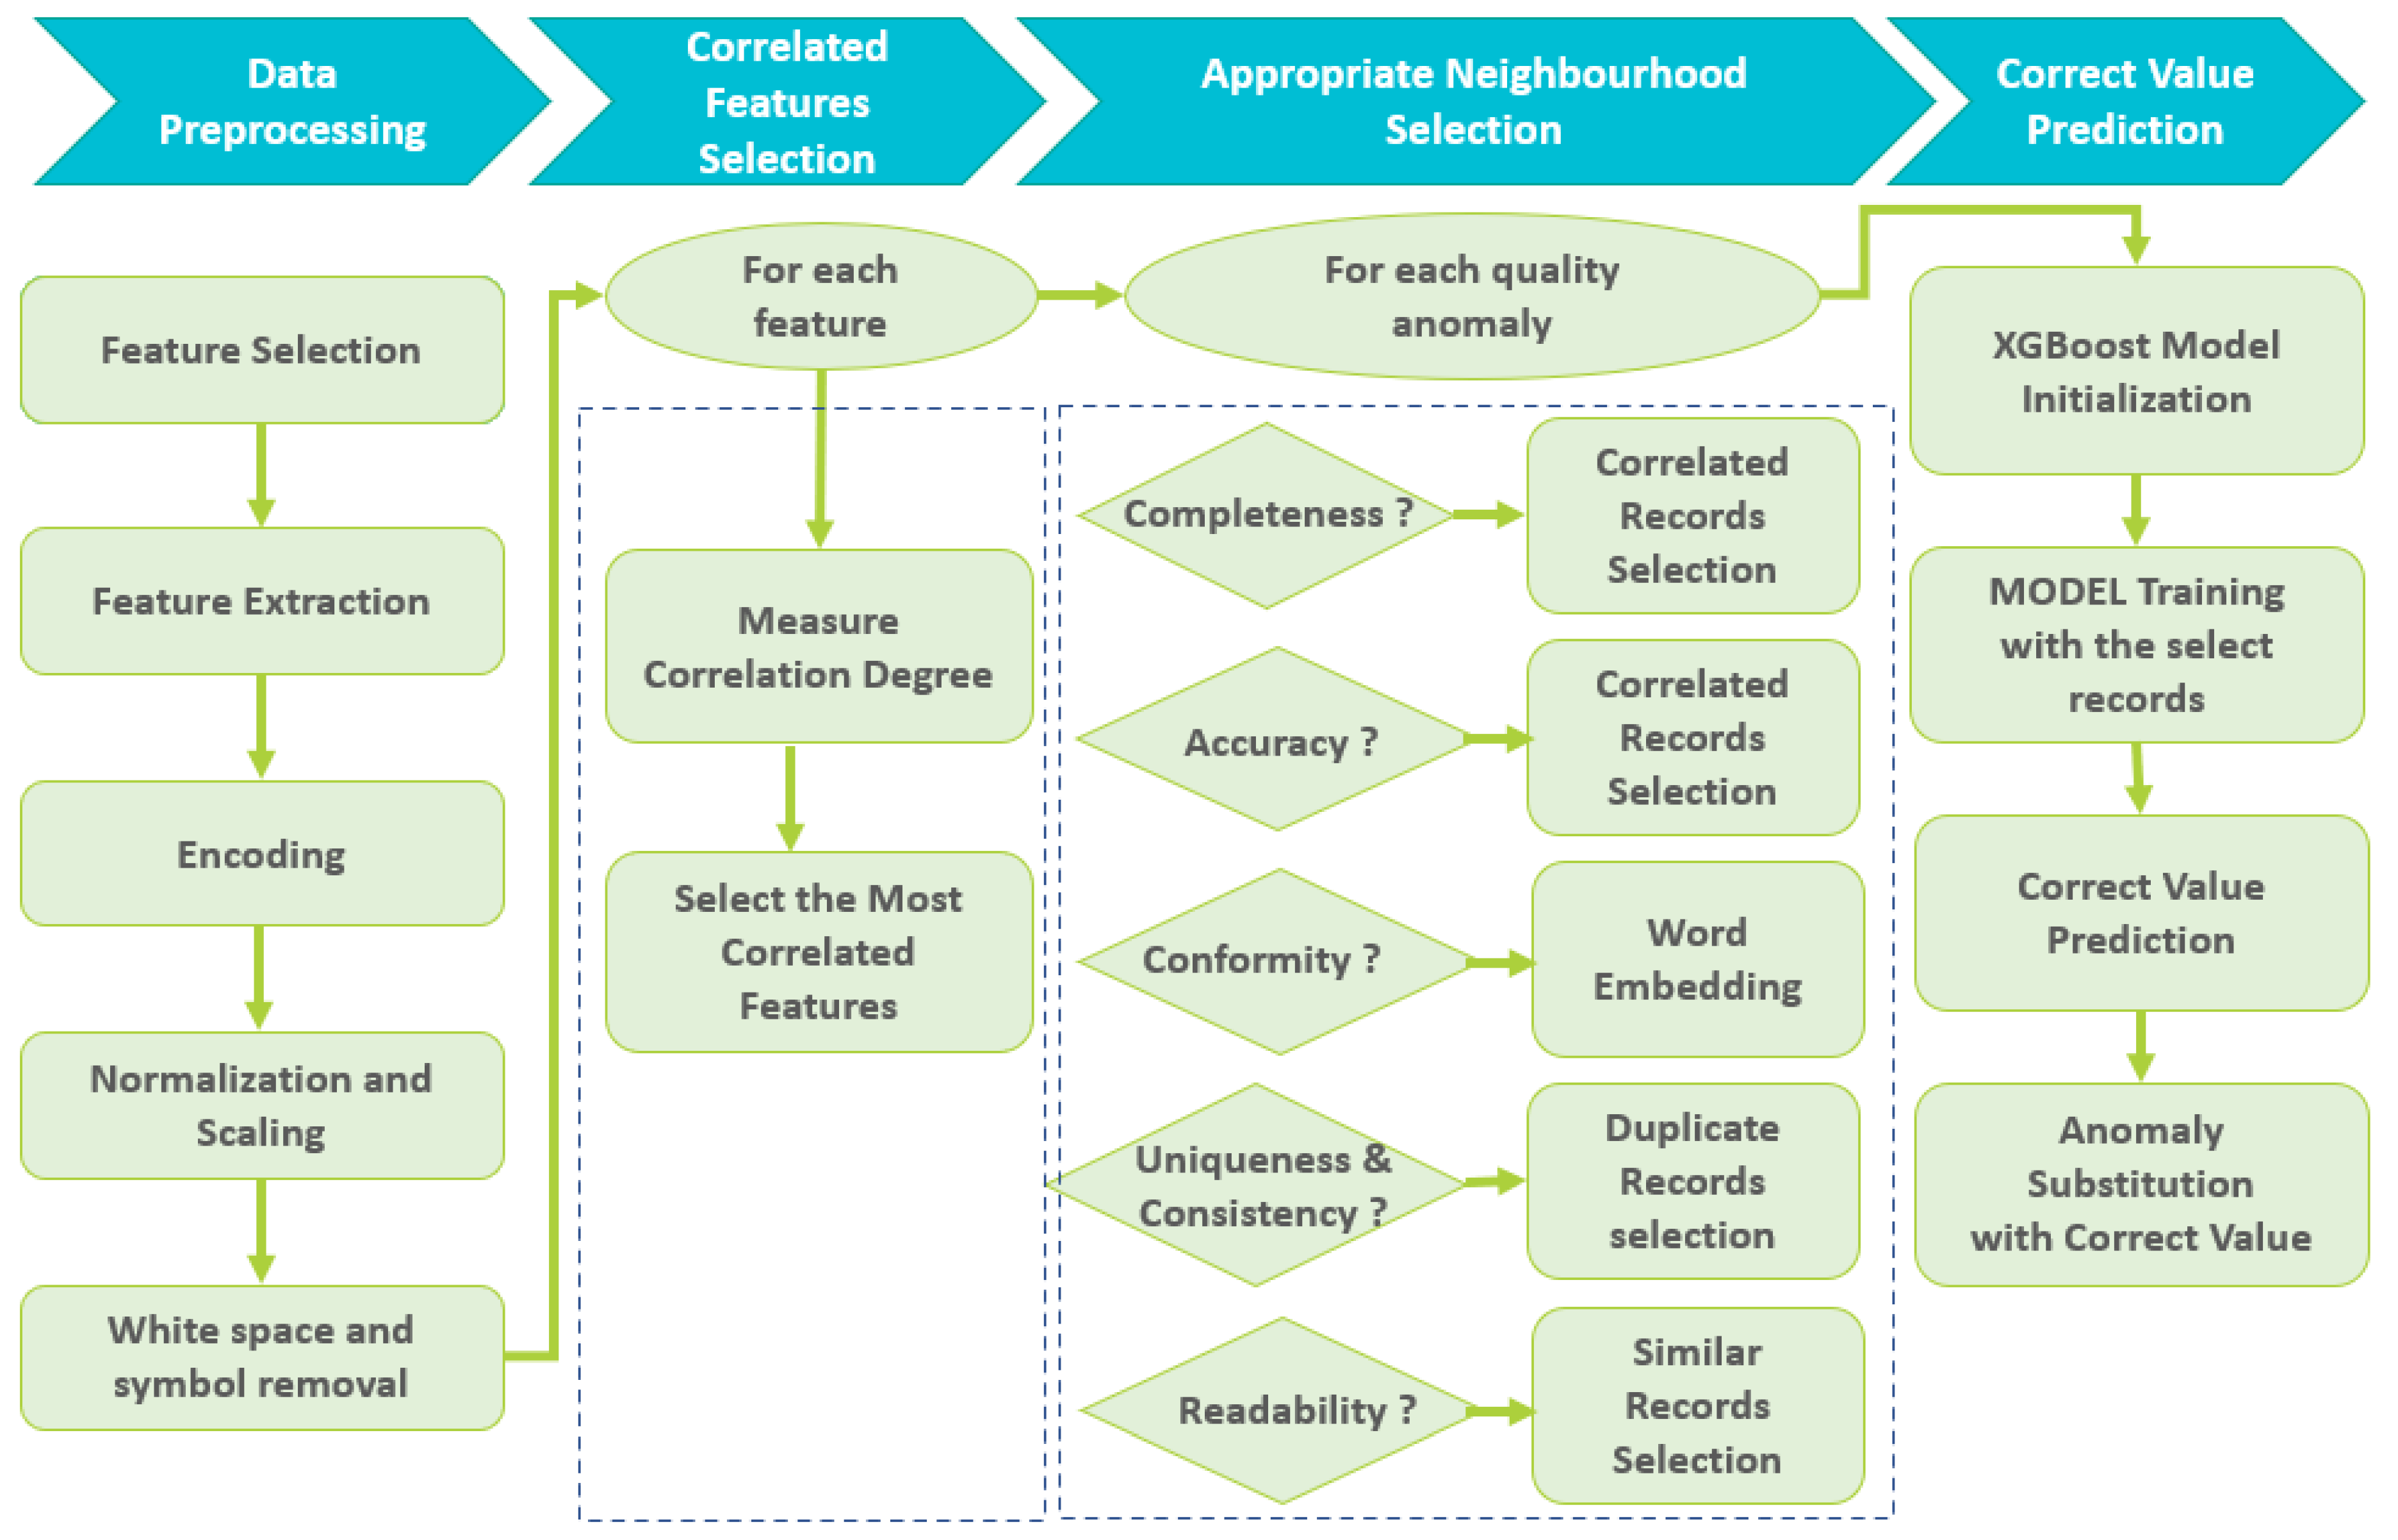
In the realm of big data analysis and decision-making, the reliability and accuracy of datasets are crucial. However, anomalies, errors, or missing values often raise significant challenges to data quality. We have developed a novel Big Data Quality Anomaly Correction Framework to address this issue. The primary objective of our framework is to enhance the overall quality of big datasets by addressing data quality anomalies. Given that our framework is generic and applicable across various data contexts, we acknowledge that predicting exact corrections for every quality anomaly in a generic way without any field correlation is unrealistic. Indeed, factors like the inherent variability of data types, contextual dependencies, and data uncertainties and complexity make it extremely challenging to achieve absolute precision in predicting values for all data use cases. Instead, we aim through this framework to provide an improved and more accurate version of big datasets by addressing data quality anomalies and replacing them with an enhanced and reliable data value that aligns more closely with the actual values. As illustrated in Figure 2, the proposed framework consists of four main phases:
4.1. Data Preprocessing
An initial preprocessing phase is highly required in big data, characterized by its typically unstructured nature and inherent inconsistency. This phase allows for preparing the data and transforming it into an appropriate format for the subsequent framework stages to ensure an accurate anomaly correction. In the following, we outline the fundamental preprocessing techniques deemed indispensable for the remainder of the anomaly correction framework (Figure 3). Nevertheless, additional preprocessing methods may be incorporated as per the contextual requirements of the dataset use case.
Feature Selection: Feature selection identifies and selects the most relevant features from a dataset. It helps reduce the data’s dimensionality and eliminate irrelevant or redundant features. Indeed, as predictive models rely mainly on the available data to make predictions, it is vital to clean the dataset from non-relevant information that may bias the model’s accuracy and keep only pertinent features.
Feature Extraction: Sometimes, the selected features might not be enough to make accurate predictions. Important information essential for prediction could be hidden within the data values themselves. This is where feature extraction comes into play. Feature extraction transforms the raw data into derived features that capture the essential information. It aims to reduce the dimensionality of the data while preserving the critical characteristics. Using feature extraction techniques, we can uncover additional valuable features that enhance the predictive power of our models.
Encoding: refers to converting categorical or textual data into numerical representations that predictive models can process. Encoding is essential because many predictive models require numerical inputs for processing and analysis. However, real-world data often includes categorical or textual variables that these models cannot directly use. Thus, encoding techniques can convert non-numerical data into numerical representations, making them compatible with predictive models.
Normalization and Scaling: When the data from different sources is not on a consistent scale, it becomes challenging to compare and integrate the information effectively. Inconsistencies in scales can skew the analysis and may result in misleading interpretations or biased outcomes. To overcome this, we use Normalization, which consists of scaling numeric features to a standard range. Normalization is essential because it improves the convergence of predictive models, prevents features with larger magnitudes from dominating, and ensures fairness in comparing different features.
White space and symbol removal: This process involves cleaning the data by eliminating unnecessary white spaces, punctuation marks, or special symbols that do not contribute to the analysis. This step is particularly relevant when dealing with unstructured text data. It helps improve data consistency, reduce noise, and enhance subsequent analysis accuracy.
4.2. Correlated Features Selection
After the initial preprocessing phase, the next crucial step involves selecting correlated features specific to each detected quality anomaly in the dataset. The imputed elements significantly impact the predictive model, which is critical to its performance and effectiveness. For this, only features correlated with the detected anomaly should be considered by the predictive model. By considering only the correlated features, we avoid introducing unnecessary noise or irrelevant information into the model so it can effectively learn the patterns and relationships specific to the detected anomaly, leading to more precise predictions and improved anomaly correction. For example, if an abnormality is detected in a sales dataset related to “product price”, it would be sensible to prioritize correlated features like “product category”, “time of sale”, or “customer segment”. These features will likely directly impact the product price and provide valuable context for understanding and addressing the anomaly. Correlated feature selection can be done manually through human intervention, leveraging domain knowledge and expertise, or automatically using various techniques, such as statistical measures or machine learning algorithms.
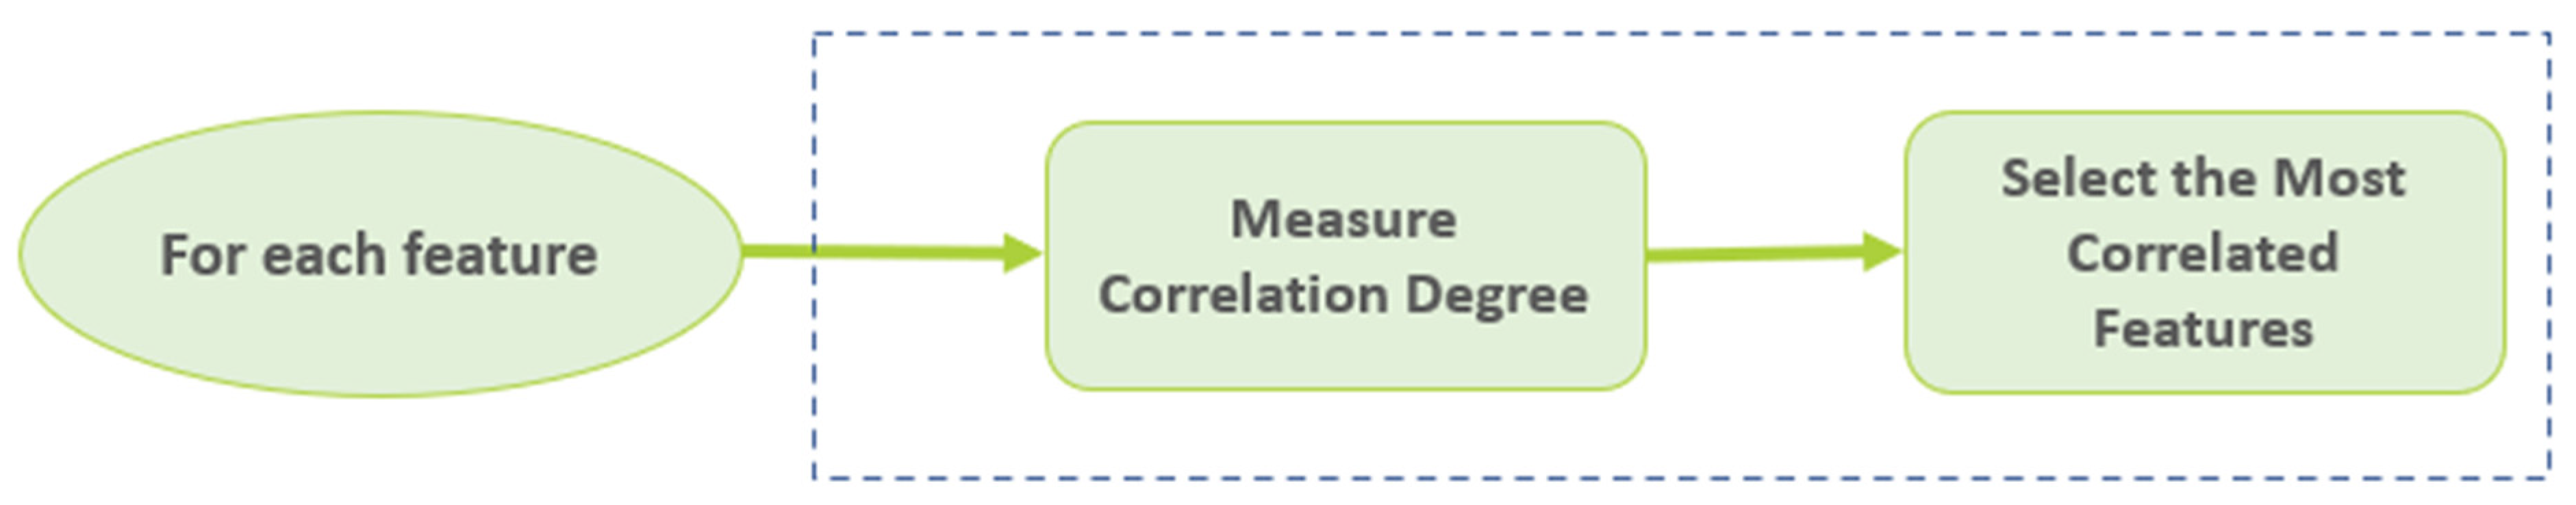
In this framework, the correlated features are selected iteratively for each detected quality anomaly using a hybrid approach combining manual and automatic correlation selection strengths. This approach involves leveraging automated techniques to identify correlated features, followed by human supervision to refine and validate the selections. First, the correlated features are captured based on a data-driven approach that consists of a statistical measure of the correlation coefficients that can quantitatively assess the relationships between components and identify the ones that reveal a significant correlation with the detected anomaly. Correlation coefficients provide a numerical value that indicates the strength and nature of the correlation between the variables, ranging from −1 to +1. Then, domain experts can review and adjust the automatically selected features based on their contextual knowledge, ensuring the inclusion of domain-specific insights that may not be captured by automated methods alone. This hybrid approach combines the advantages of both human expertise and data-driven analysis, leading to more accurate and robust feature selection. Figure 4 shows the steps of selecting correlated features.
In some scenarios, the correlation coefficients of the dataset features may be close, indicating that all features are slightly correlated with the detected anomaly. Even though the individual correlations may be weak, collectively, these features may provide valuable insights when analyzed together. In such a scenario, we recommend including and considering all the dataset features in the subsequent phases of the framework and attributing them to the predictive model.
4.3. Appropriate Neighborhood Selection
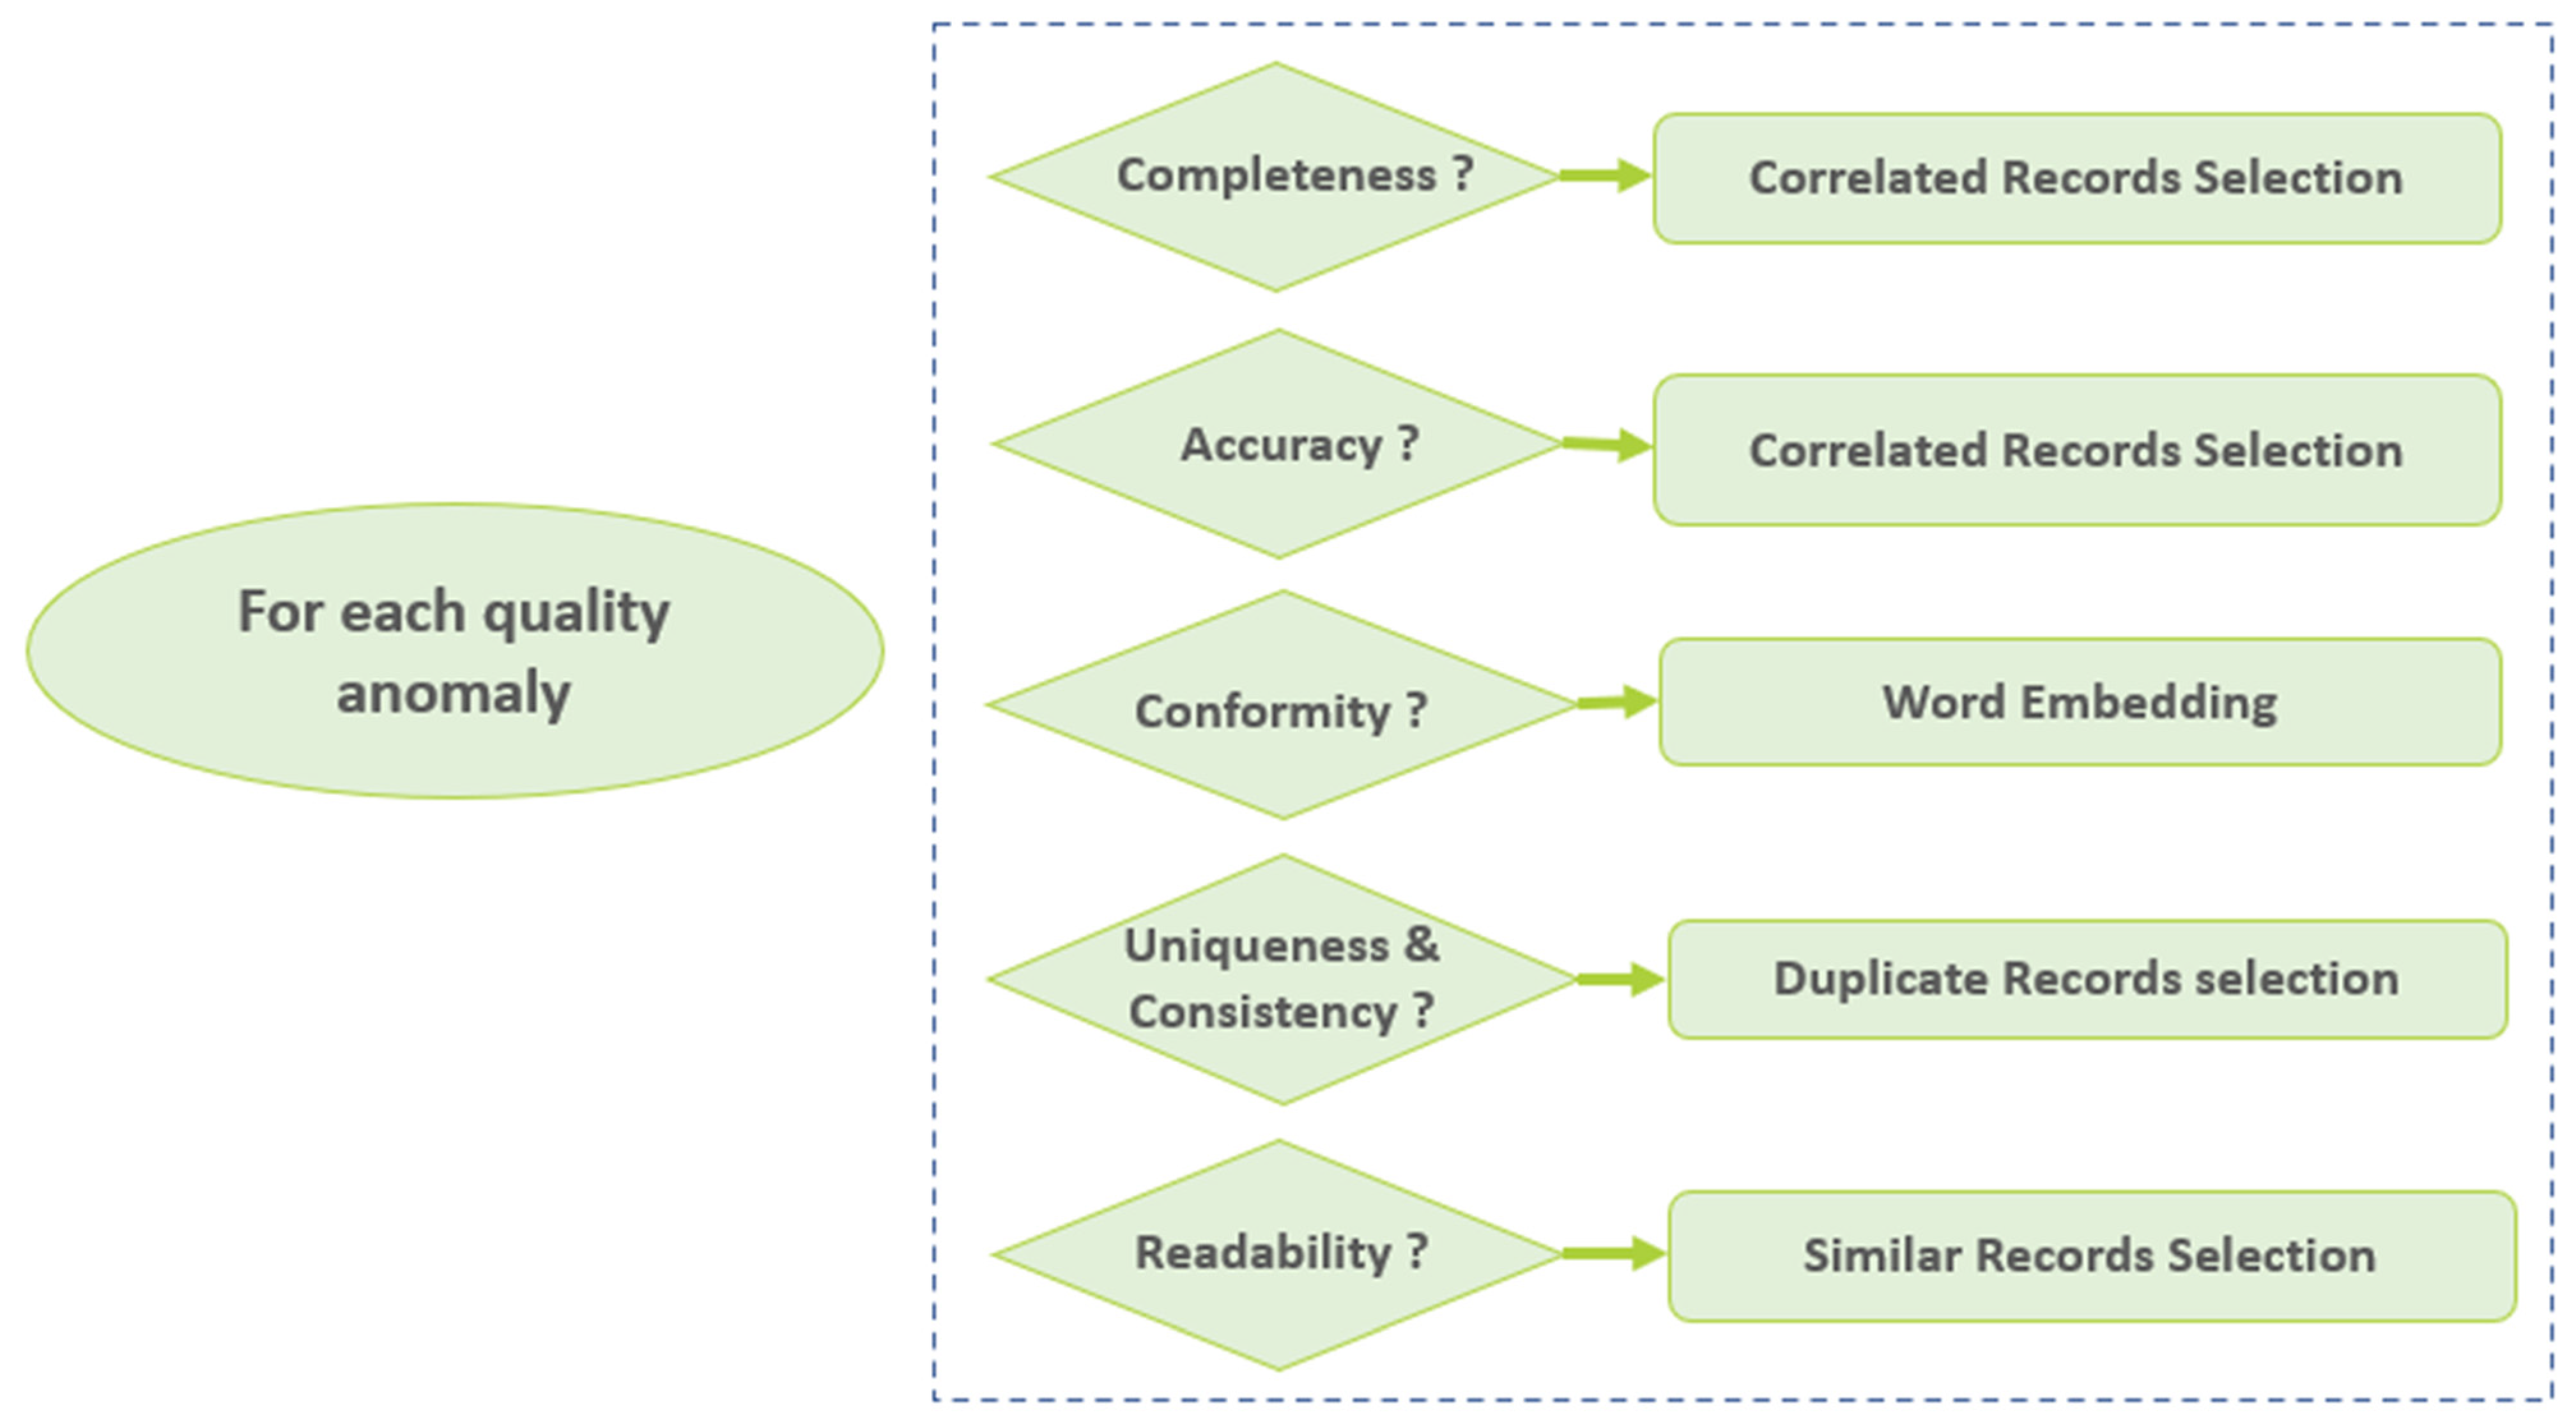
After selecting the correlated features related to the anomaly, another crucial step is filtering the records to include only the closest ones to the anomaly. This phase focuses on identifying the neighborhood of the anomaly, which refers to the subset of data points or records that will be attributed to the predictive stage for more precise anomaly correction. The selection of this neighborhood varies depending on the quality dimension the anomaly addresses. In the following, we outline how the neighborhood is chosen for each of the six big data quality dimensions addressed in this framework, as shown in Figure 5.
4.3.1. Completeness
Completeness, as a quality dimension, refers to the degree to which a dataset is complete and contains all the expected or required information [29]. Completeness is crucial because missing data can lead to biased or incomplete results, affecting the reliability and validity of data analysis. Neighborhood selection involves including records similar to the missing or incomplete data points when addressing completeness-related anomalies by considering other complete data values related to the selected correlated features. The proposed framework is designed to handle missing values in both categorical and continuous data. For example, let us consider a dataset related to customer information where some customer records have missing values for their purchase history. In this case, the neighborhood selection aims to identify records with similar customer attributes, such as age, gender, and location, with complete purchase history information. By including these records in the neighborhood, the framework will use their purchase patterns and behavior to impute missing values for customers with incomplete purchase histories. Our proposed framework addresses missing values in categorical and continuous data. The framework predicts the most appropriate value for categorical features based on the available complete data. Since the missing values in categorical features belong to a limited set of possible options, the framework can predict accurate and exact values for the missing categorical values.
On the other hand, predicting exact values for missing data in continuous features is more challenging. In such cases, the framework adopts a different approach. It leverages feature extraction techniques to extract relevant features from the dataset, providing additional insights about the missing data. This enables the framework to estimate a potential range of values for the missing data, offering a valuable approximation that helps fill the gaps in the dataset. For instance, consider the prediction of a person’s ID number. The framework uses the available features such as the person’s date of birth, city, and province. The framework can generate a range of possible values within which the missing ID number may fall by analyzing the relationship between these features and the ID number. This approximation, such as transitioning from null values to a value like “AB1234XX”, provides a practical solution for completing the dataset and addressing completeness-related anomalies.
4.3.2. Accuracy
Accuracy is a quality dimension that refers to the reliability and trustworthiness of the dataset [30]. The accuracy is measured by assessing the degree to which the data values align with the expected or known values. It involves identifying and rectifying any data outliers or errors that may adversely impact the overall integrity of the dataset. Maintaining accuracy in the dataset is crucial for making informed decisions, performing reliable analyses, and obtaining trustworthy results. When an inaccurate value, such as an outlier, is identified, the framework treats it as missing. Indeed, the wrong values cannot be used to predict the correct values, so they are just cleared and addressed as if they were missing data. As for missing data, the framework leverages the available data and analyzes the relationships among variables within the dataset to rectify inaccurate values. By examining the patterns and dependencies among the features, the framework learns how the features are interconnected and then uses the gained knowledge to predict a more accurate value for the outlier.
4.3.3. Uniqueness and Consistency
Uniqueness is a quality dimension that addresses duplicated data referring to the same real-world entity within a dataset [31]. Duplicated data can arise for various reasons, such as data entry errors, merging of datasets, or system glitches. Consistency, on the other hand, is a quality dimension that addresses information inconsistencies among the duplicated data. Inconsistencies can occur when different versions of the same data record contain conflicting or contradictory information. For example, if a customer’s address is repeated with slight variations, such as different spellings or abbreviations, it introduces inconsistencies that can impact data analysis and decision-making processes. In this process, the framework introduces a unique and empty row that serves as a placeholder for the merged record. By leveraging the collective information from all instances of the duplicated data, the framework predicts accurate values for each feature within the introduced empty record. This prediction considers the data from all repeated cases, allowing for a comprehensive analysis of the available information. Through this approach, the framework resolves the duplication issue and addresses any inconsistencies among the duplicated instances.
4.3.4. Conformity
Conformity is a quality dimension of consistency and adherence to predefined data formats, standards, or specifications within a dataset [32]. It ensures that the data conforms to the expected structure, rules, and constraints defined for its respective data types. Conformity issues often arise in big data environments due to data variety as big data encompasses diverse data sources and types, including unstructured or semi-structured data, which often lack a standardized format. Addressing big data conformity is crucial as it ensures interoperability and effective data integration, enabling improved decision-making based on homogenous and well-structured big data. Our framework incorporates a semantic-based approach to manage non-conforming data that deviates from the expected data types. Using word embedding techniques, the framework identifies the most closely related values regarding semantics. These selected rows presenting similar semantic characteristics are then imputed into the predictive model. Leveraging the power of machine learning and statistical analysis, the model can accurately correct the non-conforming values based on the patterns and relationships within the selected data subset. For instance, let us consider a conformity anomaly within a categorical feature where the expected values are “1st class” or “2nd class”. Suppose we encounter a non-conforming value of “1” within this feature. By applying word embedding techniques, the framework can identify rows that exhibit similar semantic characteristics to the non-conforming value. In this case, the framework would select rows that contain the value “1st class” for the definite feature. These selected rows, which share a semantic similarity with the correct value, are then used for imputation in the predictive model. As a result, the non-conforming value of “1” is transformed into the valid value of “1st class”. This semantic-based methodology ensures that data non-conformities are effectively addressed, leading to accurate corrections.
4.3.5. Readability
Readability is a quality dimension that pertains to the clarity and understandability of textual data within a dataset [33]. It focuses on ensuring the text is free from misspelled words or typographical errors that can hinder comprehension or lead to misinterpretation. The framework employs a method that selects the most similar correct values to the erroneous data entry to correct non-readable data values. Using string matching algorithms and Cosine similarity measures, the framework identifies the closest matching values within the dataset. These selected values are then used to correct the misspelled and erroneous entries using the predictive model embedded within the framework. For instance, consider a city feature where an incorrect “Moreal” entry is present. The framework applies string-matching algorithms to find the closest matching values within the dataset. In this case, the algorithm identifies “Montreal” as a close match to the erroneous entry. By selecting rows that contain the correct value, “Montreal”, the framework can impute these values and correct the incorrect entry.
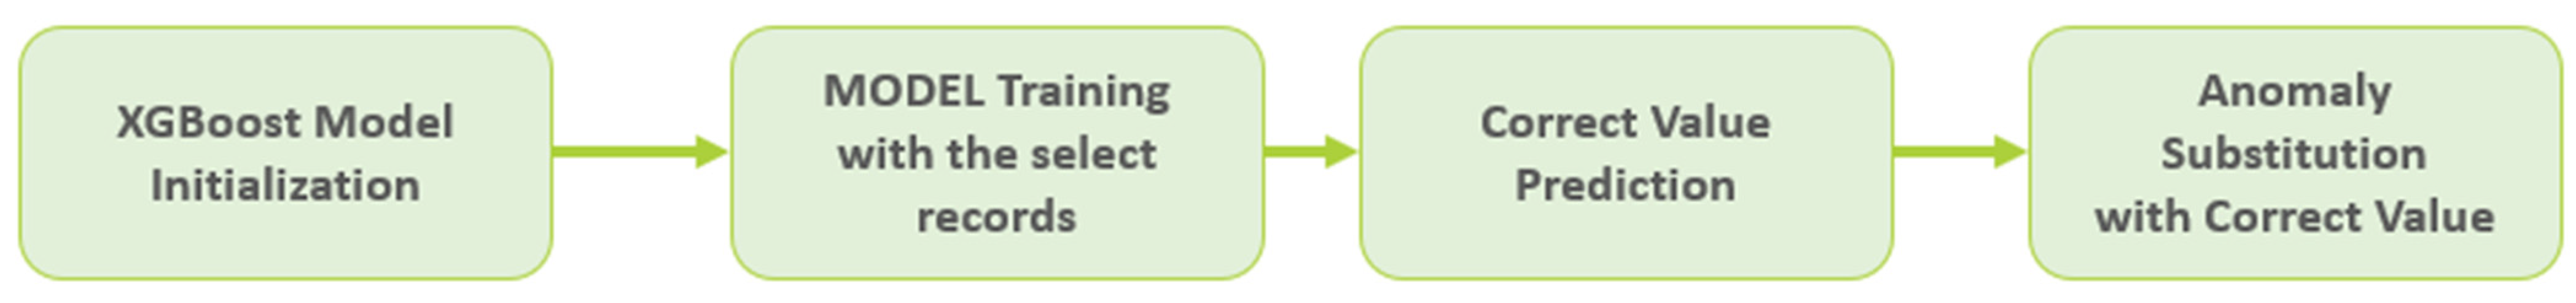
4.4. Correct Value Prediction
After identifying and selecting the relevant records for the detected anomaly, the subsequent step in the framework involves imputing these selected records into the predictive model for accurate value prediction. In the proposed framework, we employ the XGBoost predictive model. XGBoost is a robust and widely used machine learning algorithm known for its effectiveness in handling structured and unstructured data. It is an ensemble learning algorithm that corrects the detected quality anomaly by iteratively building decision trees. It uses a gradient-boosting framework to make accurate predictions by combining multiple weak models into a robust ensemble model. One of the key advantages of using the XGBoost model in this framework is its exceptional predictive performance. It is widely recognized for achieving high accuracy in regression and classification tasks. This makes it reliable for accurately predicting the correct values for the selected records.
Moreover, XGBoost is well-suited for handling large-scale datasets, making it appropriate for big data scenarios. It uses parallel computing techniques to process vast amounts of data and is compatible with distributed computing frameworks such as Apache Hadoop and Apache Spark. Another reason XGBoost is well-suited for big data scenarios is its robustness against noisy data and outliers. Indeed, XGBoost employs regularization techniques that help reduce the impact of noise and outliers on the model’s performance. Thus, the XGBoost model is well-suited for anomaly correction tasks as it can handle complex relationships and patterns within the data.
By feeding the selected records into the XGBoost model, the framework employs the model’s ability to learn from the existing data and enhance big data quality. The imputed values provided by the XGBoost model serve as a correction for the anomalies and contribute to improving the overall data quality. The model analyzes the input features and uses the patterns and relationships within the dataset to predict the correct values for the detected anomalies. It starts by preparing the imputed correlated features and closest records selected from the previous stages. Then, it trains an initial decision tree and calculates the errors. The algorithm constructs subsequent trees, learns from the mistakes of previous ones, and updates predictions by summing up the outputs of all trees, giving more weight to accurate ones. This iterative process continues until it reaches a level of improvement. Finally, the corrected value for the anomaly is obtained by combining the predictions from all trees. Figure 6 shows the steps of predicting correct values using the XGBoost model.
Through this iterative tree building and prediction updates, XGBoost learns from the imputed features and records to accurately predict the correct value for the anomaly. This framework is applied to all detected quality anomalies, ensuring that the valid values are predicted based on the imputed features and records specific to that anomaly. Thus, by leveraging the power of XGBoost and the information from the selected close records, our framework effectively corrects data quality anomalies, enhancing overall data accuracy and reliability. Figure 7 shows the global pipeline of the suggested big data quality anomaly correction framework. Algorithm 1 presents the pseudo-code of our proposed framework.
| Algorithm 1: Anomaly correction using XGBoost model |
| Input: D: Preprocessed Dataset D with previously detected quality anomalies |
| Output: D: Dataset D with corrected anomalies |
| 1: D’ = D |
| 2: XGBoost = H2OXGBoostEstimator (booster = ‘dart’, normalize_type = “tree”, seed = 1234) |
| 3: for each F in D.columns: |
| 4: for each F’ in D.columns: |
| 5: if( correlation(F,F’) < corr_tresh) |
| 6: D’.drop(F’) |
| 7: end |
| 8: for each row in D’: |
| 9: value = row[column F] |
| 10: switch (value): |
| 11: case is_completeness_anomaly: |
| 12: training_dataset = D’.drop(row) |
| 13: case is_accuracy_anomaly: |
| 14: set value = null |
| 15: training_dataset = D’.drop(row) |
| 16: case is_readability_anomaly: |
| 17: sim_scores = calculate_similarity(D’[value_index], D’.rows) |
| 18: similar_idxs = indices where sim_scores > we_tresh |
| 19: training_dataset = select rows[similar_idxs] from D’ |
| 20: case is_conformity_anomaly: |
| 21: f_we = transform_to_word_embedding(D’[column F]) |
| 22: sim_scores = calculate_similarity(f_we [value_index], f_we.rows) |
| 23: similar_idxs = indices where sim_scores > sim_tresh |
| 24: training_dataset = select rows[similar_idxs] from D’ |
| 25: case is_consistency_anomaly: |
| 26: training_dataset = duplicaterows(row) |
| 27: else: |
| 28: break |
| 29: XGBoost.train(training_dataset) |
| 30: correct_value = XGBoost.predict(value) |
| 31: D.F[index_value] = correct_value |
| 32: end |
5. Possible Scenarios
Data quality anomaly correction is a critical process that can be applied across various domains and use cases to enhance the accuracy, reliability, and usability of datasets. In the following, we present the most pertinent areas where our proposed framework could be employed to improve data quality:
Personal Information: The proposed framework can be used to enhance the quality of confidential information where poor quality data can arise due to human errors during data entry, incomplete or missing data, inconsistencies in data formats or types, and misspellings. These quality anomalies can lead to incorrect or unreliable information, affecting crucial operations such as customer profiling, targeted marketing, and personalized services. The proposed framework can address these issues by identifying correlated features, selecting close records, and leveraging machine learning models like XGBoost to impute missing values, correct inconsistencies, and rectify data entry errors. For example, suppose missing values exist in the date of birth field. In that case, the framework can utilize correlated features like name, address, and age to predict the accurate date of birth values and improve the overall data quality.
Cybersecurity: Another highly pertinent domain where data quality correction is of significant importance is the field of cybersecurity. With the increasing reliance on digital systems and the growing threat landscape, ensuring the accuracy and integrity of cybersecurity data is crucial for effective threat detection, incident response, and risk management [34]. In cybersecurity, poor data quality can occur due to various factors, including incomplete or missing log entries, incorrect timestamps, inconsistent data formats, and false positives/negatives in intrusion detection systems. The proposed framework can play a crucial role in addressing data quality issues in cybersecurity datasets. For example, suppose there are missing log entries for a specific period. In that case, the framework can leverage the correlation between log sources and their timestamps to accurately predict and impute the missing data. The framework can also correct inconsistent formatting, such as different date formats or varying IP address representations, ensuring standardized and reliable data for cybersecurity analysis.
Healthcare: In healthcare information systems, poor data quality can arise from incorrect patient records, missing or inconsistent medical diagnoses, and discrepancies in treatment information. These anomalies can severely affect patient care, medical research, and decision-making processes. The proposed framework can tackle these issues by selecting correlated features such as patient identifiers, medical diagnoses, and treatment records. By leveraging the predictive capabilities of the XGBoost model, the framework can impute missing information, correct inconsistent diagnoses, and identify erroneous treatment records, leading to improved data quality and better healthcare outcomes.
Transportation: In transportation networks, data quality anomalies can stem from inaccurate location data, inconsistent timestamps, missing route information, or erroneous vehicle identification numbers. These anomalies can hinder route planning, delay estimation, and traffic management efforts. The framework can address these issues by selecting correlated features such as location coordinates, timestamps, and vehicle attributes. By imputing missing or inconsistent data and predicting accurate values using the XGBoost model, the framework can enhance the quality and reliability of transportation datasets, enabling more precise route planning, efficient traffic management, and reliable delay estimation.
Banking: In financial institutions, poor data quality can manifest in inconsistent transaction records, incorrect customer information, missing account details, or discrepancies in financial statements. These anomalies can lead to financial losses, compliance issues, and inaccurate decision-making. The framework can address these issues by identifying correlated features such as transaction types, customer identifiers, and account details. By imputing missing or inconsistent data and applying anomaly detection techniques, the framework can identify and correct errors in transaction records, reconcile account information, and ensure the accuracy and integrity of financial datasets.
The proposed data quality anomaly correction framework can be applied to various use cases, including personal information management, e-commerce, healthcare, transportation, and financial institutions. By addressing specific quality anomalies within each use case, such as missing data, inconsistencies, duplication, and errors, the framework enhances the quality and reliability of the datasets so they can be used effectively.
6. Implementation
6.1. Datasets Description
Among the various potential use cases presented in the previous section for the proposed framework, we have specifically chosen the domain of personal information. This extensive use case includes a variety of sub-use cases, including datasets related to customers’ data, passengers’ data, or users’ data on various platforms. This use case is selected because of its wide prevalence and relevance in the practical real-world and data-driven era. Indeed, human information datasets are extensively used in numerous industries and domains, from e-commerce and healthcare to transportation and social media platforms. Moreover, these datasets contain various quality anomalies due to multiple factors, such as human errors during data entry, system inconsistencies, or evolving data formats. Thus, ensuring the accuracy and quality of such datasets is crucial for maintaining data integrity and making informed decisions.
6.1.1. Dataset 1
The first dataset used in this study is a synthetic dataset created using a Python script [35]. It consists of over 2 million records and simulates personal information, including columns such as Name, Address, Gender, Age, Salary, and more. The unavailability of prelabeled big datasets with known quality anomalies primarily drove the decision to employ a synthetic dataset. Indeed, it is essential to have a dataset with preexisting abnormalities to assess the suggested framework’s performance accurately. However, manually labeling a large dataset with over 1 million records can be laborious and time-consuming.
Consequently, we opted to generate a synthetic dataset with pre-known anomalies to facilitate the evaluation of our framework’s accuracy. We selected the scenario of personal information in the first dataset as it represents a common, widely recognized context with inherent data quality anomalies. Our attribute selection was meticulous, aimed at replicating real-world personal information datasets by including the most common attributes. To address various quality metrics, anomalies were intentionally introduced into the dataset. These anomalies encompass changes in data distribution with outlier values to evaluate the accuracy metric, modifications to existing data values, and presenting missing or incorrect data to assess Completeness, Conformity, and Readability metrics.
Additionally, approximately 10,000 random rows were slightly modified and added as duplicates to evaluate uniqueness and consistency metrics. By introducing challenging and confusing data anomalies, we can thoroughly assess the framework’s ability to handle diverse and complex scenarios. Thus, using a synthetic dataset enables us to determine the effectiveness and limitations of our framework more comprehensively.
6.1.2. Dataset 2
The second dataset is the Titanic [36], a well-known data analysis and machine learning dataset. It consists of information about passengers on the Titanic, including their demographic data, such as age, gender, class, and survival status. The dataset contains 1309 rows, each representing a passenger, and several columns containing different attributes. Despite being a relatively small dataset, the Titanic dataset was selected to assess the performance of the suggested framework in handling real-world data quality anomalies. The Titanic dataset is particularly relevant due to quality anomalies in the context of quality anomaly correction. These anomalies include missing values, inaccurate entries, duplicate records, inconsistencies, and other data quality issues. To further enhance the evaluation of the framework and test its capabilities, the Titanic dataset was deliberately augmented with additional quality anomalies. These different anomalies were introduced to challenge all aspects of data quality, including Completeness, Consistency, Uniqueness, Conformity, Readability, and Accuracy. Table 1 presents the characteristics of the two datasets used for our experiments. In the next section, we offer the tools and techniques used in our implementation.
6.2. Implementation Details
6.2.1. Implementation Architecture
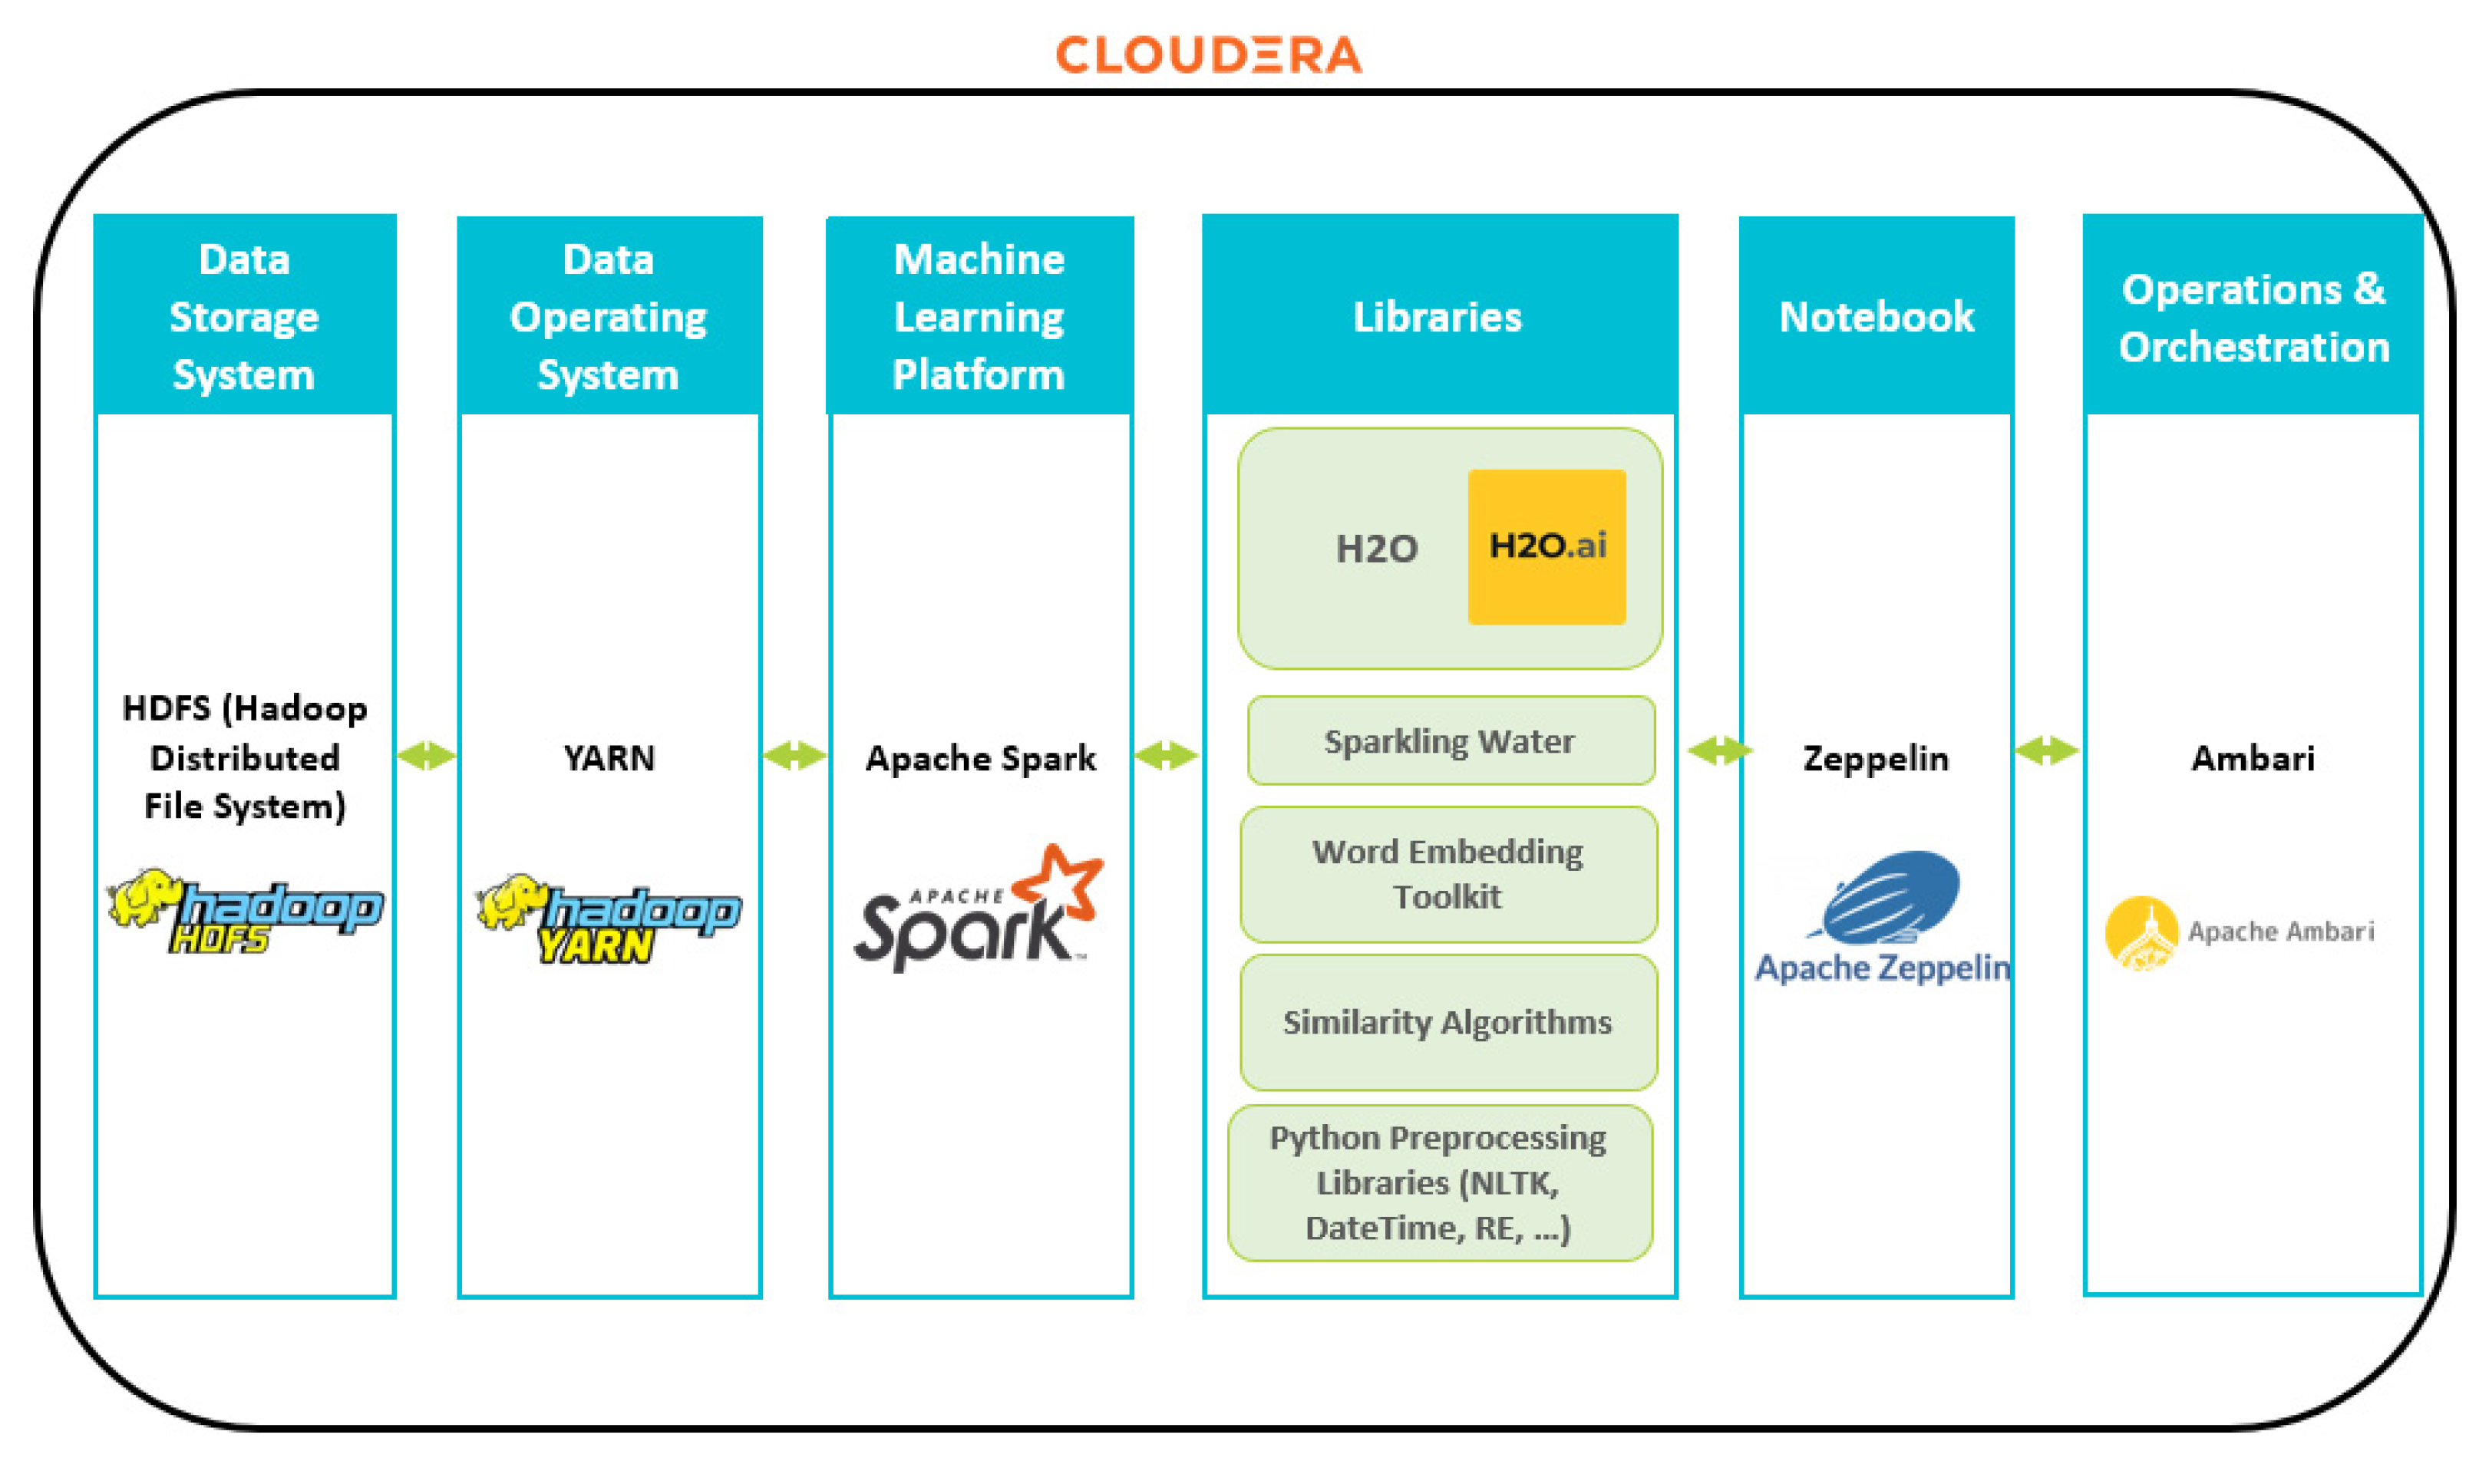
To implement the framework, we used the following tools, as shown in Figure 8.
Cloudera Data Platform (CDP) [37]: A robust platform for processing and analyzing large-scale datasets in big data. This platform offers a range of tools and technologies that enable scalable and secure data processing. It leverages critical components such as Hadoop, Spark, HBase, and Kafka, ensuring improved performance and compatibility with various big data tools.
Hadoop Distributed File System (HDFS): The data storage aspect was managed using the Hadoop Distributed File System, which provides scalable storage for big data. HDFS is designed for horizontal scalability and fault tolerance, enabling easy expansion by adding more nodes to the cluster and ensuring data replication across multiple nodes for increased resilience.
Apache Spark: Spark is a robust framework designed for efficient big data processing, surpassing the performance of traditional MapReduce processing in Hadoop. We employed Spark’s Python API, called Pyspark, for data processing. This implementation utilized Spark with the Hadoop YARN cluster, enabling scalable and parallel data processing. This combination allowed us to leverage Hadoop’s scalability and fault tolerance capabilities.
6.2.2. Implementation Tools and Libraries
In data preprocessing, a combination of Python string functions and specialized libraries such as NLTK (Natural Language Toolkit), DateTime, and RE (Regular Expressions) was employed. These libraries offer tools tailored for text manipulation, date-time handling, and pattern matching. Special symbols were systematically removed from text values using Python’s string functions to ensure consistent data representation. Moreover, specific placeholders commonly encountered in datasets, like ‘N/A’, ‘NA’, ‘NULL’, and ‘NaN’, were systematically cleared, making them recognized as missing values. Furthermore, all textual data were lowercase to represent data values consistently.
The XGBoost model was implemented using the Sparkling Water library. Sparkling Water integrates Apache Spark with H2O [38], an open-source machine-learning platform known for its fast and scalable algorithms. The XGBoost model for the Titanic dataset was built and trained using the H2OXGBoostEstimator with specific parameter settings. The booster parameter was set to ‘dart’, which indicates using the Dart boosting algorithm. This algorithm incorporates dropout regularization, which helps prevent overfitting and improves the model’s generalization.
Additionally, the normalize_type parameter was set to “tree”. This parameter specifies the normalization type used during tree construction in XGBoost. This normalization technique helps balance the influence of individual trees and maintain stability during the learning process. The seed parameter was set to ‘1234’, a random seed value used for reproducibility.
To prepare the dataset for addressing conformity anomalies, we used the word embedding Word2Vec capabilities of the H2O library [39], which allows computing and applying word embeddings to the dataset in a scalable and distributed way. Word embedding techniques enable the framework to capture the semantic relationships between data values and identify closely related values. To address readability anomalies, we employed various measures from the Python library, including Levenshtein distance, cosine similarity, and Jaccard similarity. These measures compare the similarity between text values and identify the most closely matching values.
6.2.3. Execution Process
After preprocessing the dataset to handle data quality anomalies, the proposed framework is applied by following a series of steps. Firstly, the relevant features correlated to the specific quality anomaly being addressed are selected. Then, the rows that do not exhibit any quality anomaly in the set feature are chosen. Next, a filtering process is applied to retain only the closest records based on the nature of the addressed quality dimension. The selected rows are then used as the training dataset for the XGBoost model. The XGBoost model is initialized with the abovementioned settings, such as the booster type and normalization technique. The training phase involves optimizing the model’s parameters and leveraging the powerful predictive capabilities of XGBoost to learn patterns and relationships within the dataset. Once the training phase is completed, the model is applied to the entire dataset, including the rows with quality anomalies. Using the imputed data and features, the XGBoost model employs its predictive capabilities to correct the detected quality anomalies or provide approximate values, depending on the quality anomaly being addressed. This approach ensures that the data quality issues are effectively fixed or compensated for, leading to improved accuracy and reliability of the dataset. Figure 4 shows the global architecture used in the implementation.
6.3. Results
To evaluate the performance of the proposed framework, we have measured the accuracy metric for each addressed quality dimension. The accuracy metric measures the proportion of correct anomaly corrections compared to all managed values. It indicates the framework’s ability to correct quality anomalies in the dataset. We also measured the error rate, which represents the proportion of incorrect corrections about all addressed values, to identify areas that require further improvement or fine-tuning in the framework.
We employed different approaches depending on the dataset used to classify and determine the accuracy of anomaly corrections. For the first synthetic dataset with pre-labeled anomalies, we compared the corrected values to the known correct values in the dataset. Since the valid values were already available, we could directly assess the accuracy of the anomaly corrections by comparing the corrected values and the actual values. We manually labeled the dataset for the second dataset, which lacked pre-labeled data, by carefully inspecting the values. This manual labeling process was feasible due to the relatively small size of the dataset. We examined each value and determined whether it was an anomaly based on our domain knowledge and understanding of the dataset.
Additionally, we considered any additional anomalies that were intentionally included in the dataset during the evaluation process. This manual labeling allowed us to establish a reliable reference for evaluating the accuracy of the anomaly correction framework for real datasets. Table 2 shows the accuracy and error rate measurements obtained for each quality dimension for both datasets.
Moreover, we calculated the quality score for each dimension before and after implementing the anomaly correction framework. This allowed us to evaluate the extent of improvement achieved for each specific measurement and the overall quality of the dataset. To assess the dataset’s quality, we employed metrics that were defined in a recent study on big data quality metrics [33]. These metrics provided a standardized and comprehensive way to measure the various aspects of data quality and assess the effectiveness of our anomaly correction framework in enhancing the dataset’s overall quality. Table 3 shows the measured quality metrics before and after applying the anomaly correction framework, the achieved improvement for each quality dimension, and the global quality score for both datasets.
6.4. Discussion
Based on the above-obtained results, the framework has achieved good performance for correction quality anomalies for both datasets, with an average accuracy of 92.71% for the first dataset and 89.45% for the second dataset. The proposed framework has achieved a lower accuracy score for the second dataset than the first one because real-world datasets often have more significant variability, noise, and inconsistencies and contain more complex and diverse quality anomalies. With the minor difference in the achieved accuracy scores for both datasets, the framework has maintained relatively consistent performance, affirming its effectiveness for real-world scenarios. The accuracy score was higher for the uniqueness, consistency, and readability dimensions than the others. Indeed, conformity and accuracy anomalies are the most challenging to correct. They often require understanding and capturing more complex relationships between different data elements, which are not always available in the training datasets. Despite these challenges, the framework has still demonstrated its effectiveness by achieving a good accuracy score of not less than 81%, indicating its ability to capture and correct a significant portion of the anomalies in the dataset. For the second dataset, the framework could complete missing values in most features, such as class and gender. The framework could set an approximation range for continuous features’ missing values. For instance, the missing values in the “age” feature were approximated by assigning them to an age group.
Similarly, the framework estimated missing values in the “cabin number” and “fare” features by assigning them to respective ranges. Using word embedding techniques, the framework successfully corrected non-conforming values. For instance, in the “class” feature, the value “1” was corrected to “1st class” based on its semantic similarity to the correct value. Also, in the “gender” feature, the non-conform value “M” was replaced by “Male”, ensuring the conformity of the gender values. Overall, the framework corrected a significant portion of conformity anomalies with an accuracy rate of 84.36%. The framework also corrected most misspelled values with an accuracy rate of 96.51% using similarity measures. The model has also achieved a good accuracy score of 90.76% when addressing the Uniqueness and Consistency dimensions. Most of the duplicates were consolidated and merged correctly. To assess the real impact of the proposed framework on the dataset quality, we have measured the addressed quality dimensions before and after applying the anomaly correction framework to the dataset. The results obtained from using the framework demonstrate a significant enhancement in data quality, with an improvement rate of 18.98%. The corrections made by the framework have boosted the dataset’s global quality score to 98.5%, with a vital quality improvement rate of 11.71%. For the first dataset, the framework achieved a better result in quality improvement. The framework addressed most of the quality anomalies and boosted all the quality dimensions to a score exceeding 99%. The improvement rate in the first dataset was comparatively lower than in the second dataset. This disparity can be attributed to the initial quality of the first dataset, which was relatively higher. The first dataset’s larger size, exceeding 2 million records, contributed to a relatively lower proportion of anomalies than the second dataset. Nonetheless, the framework successfully addressed the majority of quality anomalies, resulting in a substantial enhancement in the dataset’s overall quality with an improvement rate of 3.23%.
It is worth noting that our suggested framework has a distinct and unique focus on data quality anomalies. Indeed, it addresses many data quality dimensions and does not focus on a specific dimension, making it inappropriate to compare its performance to existing frameworks with different scopes and objectives. However, the framework outperforms existing approaches in scope as it effectively addresses a wide range of data quality anomalies, encompassing six key data quality dimensions and genericity without any field correlation, making it a unique contribution. Moreover, the framework has achieved promising accuracy and improvement rate results, further validating its effectiveness in correcting data quality anomalies. Furthermore, the framework has demonstrated excellent scalability with reasonable execution times on both datasets while maintaining a linear O(n) complexity. This scalability results from the designed architecture incorporating distributed storage and computing capabilities. Also, using technologies such as the Hadoop Distributed File System for distributed storage and processing, along with libraries like H2O for machine learning models, further contributes to the framework’s scalability. The framework has shown excellent accuracy and achieved significant data quality improvement rates when applied to real-world and large-scale datasets. However, it is essential to acknowledge the limitations discussed earlier, which should be considered for future work to enhance the framework’s performance further. In summary, employing our proposed framework across both datasets has led to the following significant outcomes:
- The enhancement of the quality score of both datasets with an improvement rate of 3.23% for the first dataset and 11.71% for the second dataset;
- The predictive model made an accurate correction with an accuracy score of 92.71% for the first dataset and 89.45% for the second dataset;
- The great scalability of the framework is based on a distributed storage and computing platform appropriate for big datasets.
6.5. Limitations
The framework recorded an average error rate of 7.26% for the first dataset and 10.52% for the second dataset and was unable to correct accurately some data values for the following reasons:
- The framework encountered challenges correcting anomalies like non-conform cabin numbers or names when dealing with non-conform anomalies. These anomalies posed difficulty due to the absence of a semantic relationship that could be used by word embedding techniques;
- The framework rectifies inconsistent data values by referencing the most prevalent value among duplicated instances. While this approach proves accurate in most scenarios, it is essential to acknowledge that the precise value might occasionally be less frequent than the incorrect value;
- It was observed that the uncorrected readability anomalies represented singular instances lacking comparable records that could serve as reference points for correction. This issue applies to all quality dimensions. Indeed, as the predictive model uses existing data as a training dataset, the predicted value may be inaccurate if insufficient records are selected for model training;
- As mentioned, the framework could not predict exact values for continuous features but could set an approximation range for missing or inaccurate values. For instance, the missing values in constant features such as “age”, “fare”, and “cabin number” were approximated by assigning them to a range group;
- The framework is designed to work in batch mode and could not address real-time quality anomalies of live stream data.
7. Conclusions and Future Work
In conclusion, increasing reliance on big data for decision-making has heightened the importance of data quality. However, existing studies in the field often have limited scopes and lack comprehensive solutions applicable across different domains. This research paper addresses these gaps by proposing a sophisticated framework that automatically corrects big data quality anomalies using an intelligent predictive model. The framework encompasses six key quality dimensions and is designed to be applicable in various fields, offering a generic approach to address data quality issues. Implementation of the framework on two datasets demonstrated its effectiveness, achieving a high accuracy of up to 98.22%. Additionally, the results showcased significant improvement in data quality, with a boost in quality scores of up to 99% and an impressive improvement rate of up to 14.76%. This research contributes to the field by providing a comprehensive and adaptable solution for addressing data quality anomalies in the context of big data.
As part of our future work, we have identified an essential enhancement for the current anomaly correction framework. We plan to incorporate real-time data quality monitoring into the framework to address the growing need for real-time data processing. This includes exploring techniques and methodologies to monitor data quality in real-time and provide timely anomaly correction. By incorporating real-time data quality monitoring, organizations can detect and address data quality issues as they occur, enabling them to make timely and accurate decisions based on reliable data.
Author Contributions
W.E.: Conceptualization, Methodology, Formal analysis, Writing—Original Draft, Writing—Review and Editing; S.E.M.: Conceptualization, Methodology, Formal analysis, Writing—Review and Editing; Y.G.: Conceptualization, Methodology, Formal analysis, Writing—Review and Editing. All authors have read and agreed to the published version of the manuscript.
Funding
This research received no external funding.
Institutional Review Board Statement
Not applicable.
Informed Consent Statement
Not applicable.
Data Availability Statement
Data is contained within the article.
Conflicts of Interest
The authors declare that they have no known competing financial interest or personal relationship that could have appeared to influence the work reported in this paper.
References
- Actions to Improve Your Data Quality, Gartner. Available online: https://www.gartner.com/smarterwithgartner/how-to-improve-your-data-quality (accessed on 8 July 2023).
- Ge, M.; Dohnal, V. Quality Management in Big Data. Informatics 2018, 5, 19. [Google Scholar] [CrossRef]
- Liu, C.; Peng, G.; Kong, Y.; Li, S.; Chen, S. Data Quality Affecting Big Data Analytics in Smart Factories: Research Themes, Issues and Methods. Symmetry 2021, 13, 1440. [Google Scholar] [CrossRef]
- Big Data Analytics: A Comparison of Tools and Applications|SpringerLink. Available online: https://link.springer.com/chapter/10.1007/978-3-319-74500-8_54 (accessed on 9 November 2023).
- Fadlallah, H.; Kilany, R.; Dhayne, H.; el Haddad, R.; Haque, R.; Taher, Y.; Jaber, A. Context-aware big data quality assessment: A scoping review. J. Data Inf. Qual. 2023, 15, 1–33. [Google Scholar] [CrossRef]
- Marketing Analytics State of Play 2022: Challenges and Aspirations. Available online: https://www.adverity.com/marketing-analytics-state-of-play-2022-data-capabilities-aspirations (accessed on 8 July 2023).
- Gandomi, A.H.; Chen, F.; Abualigah, L. Machine Learning Technologies for Big Data Analytics. Electronics 2022, 11, 421. [Google Scholar] [CrossRef]
- Ali, S.; Poulova, P.; Yasmin, F.; Danish, M.; Akhtar, W.; Javed, H.M.U. How Big Data Analytics Boosts Organizational Performance: The Mediating Role of the Sustainable Product Development. J. Open Innov. Technol. Mark. Complex. 2020, 6, 190. [Google Scholar] [CrossRef]
- Bansal, M. Council Post: Flying Blind: How Bad Data Undermines Business. Forbes. Available online: https://www.forbes.com/sites/forbestechcouncil/2021/10/14/flying-blind-how-bad-data-undermines-business/ (accessed on 9 November 2023).
- Khampuengson, T.; Wang, W. Novel Methods for Imputing Missing Values in Water Level Monitoring Data. Water Resour. Manag. 2023, 37, 851–878. [Google Scholar] [CrossRef]
- Gao, J.; Cai, Z.; Sun, W.; Jiao, Y. A Novel Method for Imputing Missing Values in Ship Static Data Based on Generative Adversarial Networks. J. Mar. Sci. Eng. 2023, 11, 806. [Google Scholar] [CrossRef]
- Zhang, W.; Li, R.; Zhao, J.; Wang, J.; Meng, X.; Li, Q. Miss-gradient boosting regression tree: A novel approach to imputing water treatment data. Appl. Intell. 2023, 53, 22917–22937. [Google Scholar] [CrossRef]
- Velasco-Gallego, C.; Lazakis, I. Analysis of Variational Autoencoders for Imputing Missing Values from Sensor Data of Marine Systems. J. Ship Res. 2022, 66, 193–203. [Google Scholar] [CrossRef]
- Chen, G.; Zhu, Z.; Yang, L.; Huang, W.; Zhang, Y.; Lin, G.; Zhang, S. Intelligent Identification and Order-Sensitive Correction Method of Outliers from Multi-Data Source Based on Historical Data Mining. Electronics 2022, 11, 2819. [Google Scholar] [CrossRef]
- Lian, B.; Kartal, Y.; Lewis, F.L.; Mikulski, D.G.; Hudas, G.R.; Wan, Y.; Davoudi, A. Anomaly Detection and Correction of Optimizing Autonomous Systems With Inverse Reinforcement Learning. IEEE Trans. Cybern. 2022, 53, 4555–4566. [Google Scholar] [CrossRef] [PubMed]
- Xie, H.; Hao, C.; Li, J.; Li, M.; Luo, P.; Zhu, J. Anomaly Detection For Time Series Data Based on Multi-granularity Neighbor Residual Network. Int. J. Cogn. Comput. Eng. 2022, 3, 180–187. [Google Scholar] [CrossRef]
- Poon, L.; Farshidi, S.; Li, N.; Zhao, Z. Unsupervised Anomaly Detection in Data Quality Control. In Proceedings of the 2021 IEEE International Conference on Big Data (Big Data), Orlando, FL, USA, 15 December 2021; pp. 2327–2336. [Google Scholar] [CrossRef]
- Keskar, V.V.; Yadav, J.; Kumar, A. Enhancing Data Quality by Detecting and Repairing Inconsistencies in Big Data. In Proceedings of Second International Conference in Mechanical and Energy Technology; Yadav, S., Haleem, A., Arora, P.K., Kuma, H., Eds.; In Smart Innovation, Systems and Technologies; Springer Nature: Singapore, 2023; pp. 185–197. [Google Scholar]
- Gai, R.-L.; Zhang, H.; Thanh, D.N.H. A Big Data Cleaning Method for Drinking-Water Streaming Data. Braz. Arch. Biol. Technol. 2023, 66, e23220365. [Google Scholar] [CrossRef]
- Ngueilbaye, A.; Huang, J.Z.; Khan, M.; Wang, H. Data quality model for assessing public COVID-19 big datasets. J. Supercomput. 2023, 79, 19574–19606. [Google Scholar] [CrossRef]
- Zheng, H.; Tian, B.; Liu, X.; Zhang, W.; Liu, S.; Wang, C. Data Quality Identification Model for Power Big Data. In Data Science; Wang, Y., Zhu, G., Han, Q., Zhang, L., Song, X., Lu, Z., Eds.; In Communications in Computer and Information Science; Springer Nature: Singapore, 2022; pp. 20–29. [Google Scholar]
- Bachechi, C.; Rollo, F.; Po, L. Real-Time Data Cleaning in Traffic Sensor Networks. In Proceedings of the 2020 IEEE/ACS 17th International Conference on Computer Systems and Applications (AICCSA), Antalya, Turkey, 2–5 November 2020; pp. 1–8. [Google Scholar]
- Li, J.; Wang, J.; Zhu, G.; Yu, X.; Du, S.; Abdel, S. Investigation on Data Cleaning and Analysis Technology for Power Industry Big Data. In Proceedings of the 4th International Conference on Big Data Analytics for Cyber-Physical System in Smart City; Atiquzzaman, M., Yen, N.Y., Xu, Z., Eds.; Springer Nature: Singapore, 2023; Volume 2, pp. 655–663. [Google Scholar]
- Keskar, V.; Yadav, J.; Kumar, A. Perspective of anomaly detection in big data for data quality improvement. Mater. Today Proc. 2021, 51, 532–537. [Google Scholar] [CrossRef]
- Wang, R.; Feng, J.; Zhang, W.; Liu, B.; Wang, T.; Zhang, C.; Xu, S.; Zhang, L.; Zuo, G.; Lv, Y.; et al. Detection and Correction of Abnormal IoT Data from Tea Plantations Based on Deep Learning. Agriculture 2023, 13, 480. [Google Scholar] [CrossRef]
- Yi, L.; Ding, Y.; Hou, J.; Yue, Z.; Zhao, H. Structural health monitoring data cleaning based on Bayesian robust tensor learning. Struct. Health Monit. 2022, 22, 2169–2192. [Google Scholar] [CrossRef]
- Goyle, K.; Xie, Q.; Goyle, V. DataAssist: A Machine Learning Approach to Data Cleaning and Preparation. arXiv 2023, arXiv:2307.07119. [Google Scholar] [CrossRef]
- Data Quality for Big Data and Machine Learning|Frontiers Research Topic. Available online: https://www.frontiersin.org/research-topics/35131/data-quality-for-big-data-and-machine-learning (accessed on 8 July 2023).
- Elouataoui, W.; El Alaoui, I.; Gahi, Y. Metadata Quality in the Era of Big Data and Unstructured Content. In Proceedings of the International Conference on Information, Communication & Cybersecurity, Khouribga, Morocco, 10–11 November 2021; pp. 110–121. [Google Scholar]
- Mylavarapu, G.; Thomas, J.P.; Viswanathan, K.A. An Automated Big Data Accuracy Assessment Tool. In Proceedings of the 2019 IEEE 4th International Conference on Big Data Analytics (ICBDA), Suzhou, China, 15–18 March 2019; pp. 193–197. [Google Scholar]
- Elouataoui, W.; El Alaoui, I.; El Mendili, S.; Gahi, Y. An End-to-End Big Data Deduplication Framework based on Online Continuous Learning. Int. J. Adv. Comput. Sci. Appl. 2022, 13, 281–291. [Google Scholar] [CrossRef]
- Elouataoui, W.; Alaoui, I.E.; Gahi, Y. Data Quality in the Era of Big Data: A Global Review. In Big Data Intelligence for Smart Applications; Baddi, Y., Gahi, Y., Maleh, Y., Alazab, M., Tawalbeh, L., Eds.; Studies in Computational Intelligence; Springer: Cham, Switzerland, 2022; Volume 994. [Google Scholar] [CrossRef]
- Elouataoui, W.; El Alaoui, I.; El Mendili, S.; Gahi, Y. An Advanced Big Data Quality Framework Based on Weighted Metrics. Big Data Cogn. Comput. 2022, 6, 153. [Google Scholar] [CrossRef]
- Gahi, Y.; El Alaoui, I. A Secure Multi-User Database-as-a-Service Approach for Cloud Computing Privacy. Procedia Comput. Sci. 2019, 160, 811–818. [Google Scholar] [CrossRef]
- Synthetic Big Dataset for Anomaly Detection. Available online: https://www.kaggle.com/datasets/elouataouiwidad/synthetic-bigdataset-anomalydetection (accessed on 8 July 2023).
- Mitchell, R.; Frank, E. Accelerating the XGBoost algorithm using GPU computing. PeerJ 2017, 3, e127. [Google Scholar] [CrossRef]
- Cloudera, I.A. Rights Reserved Terms, C.|P. Statement, D.P.|U./D. N. S. M. P. I. A. Hadoop, Associated Open Source Project Names are Trademarks of the A. S. F. F. a Complete List of Trademarks, and C. Here, ‘Cloudera Data Platform (CDP)’, Cloudera. Available online: https://www.cloudera.com/products/cloudera-data-platform.html (accessed on 8 July 2023).
- H2O Open Source|H2O.Ai. Available online: https://h2o.ai/platform/ai-cloud/make/h2o/ (accessed on 8 July 2023).
- Word2vec—H2O 3.42.0.1 Documentation. Available online: https://docs.h2o.ai/h2o/latest-stable/h2o-docs/data-science/word2vec.html (accessed on 8 July 2023).
Figure 1.
Data quality dimensions.

Figure 2.
The big data quality anomaly correction framework.

Figure 3.
Data preprocessing steps.

Figure 4.
Correlated features selection.

Figure 5.
Appropriate neighborhood selection.

Figure 6.
Correct value prediction steps.

Figure 7.
The global pipeline of the big data quality anomaly correction framework.

Figure 8.
Implementation architecture.


Table 1.
Description of datasets.
| Dataset | Number of Records | Number of Columns |
|---|---|---|
| Dataset 1 | 2 M | 9 |
| Dataset 2 | 1309 | 14 |
Table 2.
The accuracy and error rate for both datasets.
| First Dataset | Second Dataset | |||
|---|---|---|---|---|
| Accuracy | Error Rate | Accuracy | Error Rate | |
| Completeness | 96.08% | 3.9% | 94.55% | 5.4% |
| Accuracy | 86.78% | 13.22% | 81.10% | 18.89% |
| Conformity | 87.9% | 12.1% | 84.36% | 15.63% |
| Uniqueness and Consistency | 94.6% | 5.4% | 90.76% | 9.23% |
| Readability | 98.22% | 1.7% | 96.51% | 3.48% |
| Average | 92.71% | 7.26% | 89.45% | 10.52% |
Table 3.
The quality improvement rate for both datasets.
| First Dataset | Second Dataset | |||||
|---|---|---|---|---|---|---|
| Previous Metric | New Metric | Improvement Rate | Previous Metric | New Metric | Improvement Rate | |
| Completeness | 93.33% | 99.73% | 6.4% | 85.46% | 99.20% | 13.74% |
| Accuracy | 95.00% | 99.33% | 4.33% | 84.12% | 97.00% | 12.88% |
| Conformity | 97.22% | 99.66% | 2.44% | 82.50% | 97.26% | 14.76% |
| Uniqueness and Consistency | 99.95% | 99.99% | 0.04% | 95.03% | 99.54% | 4.51% |
| Readability | 97.00% | 99.94% | 2.94% | 86.86% | 99.54% | 12.68% |
| Global Quality Score | 96.5% | 99.73% | 3.23% | 86.79% | 98.5% | 11.71% |
Disclaimer/Publisher’s Note: The statements, opinions and data contained in all publications are solely those of the individual author(s) and contributor(s) and not of MDPI and/or the editor(s). MDPI and/or the editor(s) disclaim responsibility for any injury to people or property resulting from any ideas, methods, instructions or products referred to in the content. |
© 2023 by the authors. Licensee MDPI, Basel, Switzerland. This article is an open access article distributed under the terms and conditions of the Creative Commons Attribution (CC BY) license (https://creativecommons.org/licenses/by/4.0/).
Share and Cite
MDPI and ACS Style
Elouataoui, W.; El Mendili, S.; Gahi, Y. An Automated Big Data Quality Anomaly Correction Framework Using Predictive Analysis. Data 2023, 8, 182. https://doi.org/10.3390/data8120182
AMA Style
Elouataoui W, El Mendili S, Gahi Y. An Automated Big Data Quality Anomaly Correction Framework Using Predictive Analysis. Data. 2023; 8(12):182. https://doi.org/10.3390/data8120182
Chicago/Turabian StyleElouataoui, Widad, Saida El Mendili, and Youssef Gahi. 2023. "An Automated Big Data Quality Anomaly Correction Framework Using Predictive Analysis" Data 8, no. 12: 182. https://doi.org/10.3390/data8120182