1. Introduction
The global energy landscape is undergoing a significant transformation, given the various interests in achieving goals aligned with sustainable development objectives (SDGs), such as those presented by the United Nations [
1]. In particular, SDG 7 aims to ensure access to affordable, reliable, sustainable, and modern energy for all by 2030. Various entities have emphasized that renewable energy plays a crucial role in achieving this goal, as it can help to reduce energy poverty, increase access to energy, and promote sustainable economic growth [
2,
3,
4,
5]. This shift toward cleaner energy sources presents opportunities and challenges, especially regarding flexibility and diversification of energy matrixes [
6]. Colombia has directed its energy transformation process focusing on strategies for the development and growth of non-conventional renewable resources to obtain a safe, reliable, and efficient energy transition to achieve carbon neutrality and consolidate climate-resilient territories. The installed capacity of electric power generation from water, wind, sun, and biomass resources for Colombia reached 18,725 MW by 2022, representing an advance of 17.67% in terms of the goal established for 2030, which represents a challenge for the next seven years [
2,
7].
However, the massive deployment of these technologies requires a thorough understanding of the context in which they are developed, including an approach that considers the impact of the proposed solutions for multiple stakeholders. Under this approach, a multi-criteria decision analysis (MCDA) is proposed as a structured methodological evaluation tool. It supports expert assessment against assumptions of renewable generation resource penetration alternatives and their impact on environmental, economic, technical, and social development criteria, thus, supporting the complex decision-making process [
8].
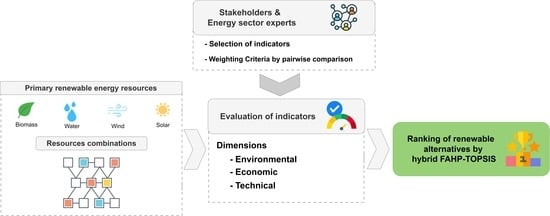
The proposed framework constitutes a systematic and flexible analysis tool for classifying renewable energy penetration alternatives, encompassing four stages of analysis: an evaluation of the theoretical resource potential, support for indicator selection, the construction of resource alternatives, and finally, to aid decision-making, it employs a hybrid MCDA technique involving FAHP and TOPSIS.
FAHP is used to compare evaluation dimensions (technical, economic, and environmental) criteria, given the relationship with the penetration of renewable primary energy resources for electricity generation. On the other hand, TOPSIS is used in ranking the various alternatives regarding a set of indicators and according to the evaluations for penetration levels of available resources.
In addition, the framework proposes an alternative construction that moves away from the recurrent analysis of comparing renewable generation technologies, extending it under assumptions of simultaneous resource penetration levels. By exploring different combinations of these resources and adjusting their participation percentages, the study seeks to identify the most promising and sustainable configurations for energy generation. Each alternative represents a unique blend of renewable resources, allowing for a comprehensive analysis of how they can work together to meet the energy generation targets.
The FAHP-TOPSIS hybrid analysis method is applied to a case study in Valle del Cauca, Colombia. The analysis considers available resources and their potential impact, providing a wide range of alternatives for decision support and maximizing stakeholder benefits.
The document is structured as follows:
Section 2 includes a brief review of the state of the art for evaluation frameworks and models in decision-making applied to the renewable resources context.
Section 3 addresses the proposed analysis framework and expands on the methods involved.
Section 4 describes the case study, presents the application of the analysis framework, and discusses the results;
Section 5 presents final observations and future works.
2. Literature Review
The development of renewable generation technologies has matured in the last decade thanks to policy momentum, its contribution to reducing carbon footprint, higher fossil fuel prices, and energy security concerns, capturing the broad spectrum of the global energy transition and driving its adoption and integration in many countries. Based on a literature review, several approaches have been found regarding the evaluation of renewable generation resources using MCDA. Among them, integration with problem-structuring-methods [
9,
10], among which SWOT (Strengths, Weaknesses, Opportunities, and Threats) and Scenario Planning (SP), stand out as effective means for trained facilitators to support decision-making groups facing challenges. SWOT, in particular, serves as the basis for analyzing renewable generation projects [
11] and is further adapted through other methodologies such as PESTLE (Political, Economic/Financial, Social, Technological, Legal, and Environmental), allowing for flexible grouping of criteria for evaluation within these six dimensions [
12,
13,
14]. Concerning MCDA methods specific to this context, the following are some reference works that guided the construction of this proposal.
A sustainability evaluation process for electricity generation through energy development scenarios was found [
15]. This work considers the participation of traditional and non-conventional energy resources within the Mexican energy mix. Furthermore, it presents environmental, economic, and social evaluations, emphasizing the integral assessment of the life cycle of generation technologies. Its results show the evaluation by dimensions, and the classification results are based on the Multi-Attribute Value Theory (MAVT) method, assuming equal preferences within the selected criteria. The work of [
16] presents an evaluation methodology as a pre-feasibility study in generation projects for the Niger territory. The study conducted an extensive collection of evaluation processes, consolidating information for 40 indicators, on which 8 generation resources were analyzed. AHP is used as a method for weighting criteria by comparing importance. The authors of [
17] establish a ranking of technologies through the sustainability index in the following dimensions: technical, economic, environmental, and social. The weights between dimensions were obtained using AHP, and a ranking by dimension was determined using the weighted sum model (WSM) method. This work validates the analysis using the Monte Carlo test and finds the probability of the position of each technology within the classification. Maxim [
18] presents the classification of different generation resources (centralized, conventional distributed, and renewable) according to their compatibility with the sustainable development of the electricity sector industry. The study was based on ten economic, technical, social-political, and environmental indicators. The results include the ranking by technology based on an evaluation with WSM. The work of [
19] applies the Fuzzy Analytical Hierarchy Process (FAHP) treatment to compare pairs of criteria to evaluate the renewable resource potential. An importance scale in fuzzy triangular numerical representation was used to assess the expert criteria, allowing uncertainty management in evaluating and extracting criteria weights. The FAHP results reveal that hydropower and biomass have the highest potential among the available renewable energy sources. In one paper [
20], a multi-criteria analysis is presented under a social, economic, environmental, and technical evaluation model called SEETA. The study integrates four multi-criteria evaluation techniques in weighting criteria with fuzzy analysis (to address methodological limitations and challenges of the decision environment) and a subsequent ranking as an evaluation result. A study case was conducted with data from 14 established hydropower plant projects. Results reveal that the ranking methods are congruent with each other for the valuation of projects in terms of winners against the criteria studied. The methodology presented in [
21] includes the ranking of seven power generation technologies for Turkey. The scores are calculated through twelve environmental, economic, technical, and social indicators. WSM was used in the methodology under the established values of indicators and respective weights of the criteria. It is concluded that reservoir hydropower generation presents the best overall performance for the sensitivity cases (scenarios) analyzed. For the case study presented in [
22], a diversified energy mix model was developed for Tunisia, based on which a set of economic, environmental, socioeconomic, and security of supply indicators was evaluated. In this work, an electrical model is established to calculate the optimal dispatch to obtain the lowest operating cost of the system integrating multiple generation resources. In the evaluation stage, the Technique for Order of Preference by Similarity to Ideal Solution (TOPSIS) method was used to establish the ranking according to the evaluation criteria in each operating scenario.
The literature review shows how several authors present multi-criteria analysis methods as an adequate tool to address problems of penetration analysis of renewable energy sources on processes that involve a wide range of alternatives under the evaluation of criteria and perspectives of the stakeholders.
Table 1 highlights the renewable generation resources used in each of the studies, as well as the differential points concerning the method used in the multi-criteria analysis and the inclusion of an analysis of alternatives that combine more than one resource simultaneously. Under these elements, it is highlighted that, unlike most approaches to compare resources as independent alternatives and confront each other, the proposed framework allows expanding the exploration of mixed alternatives that collect the benefits on which the various renewable resources of interest stand out. Additionally, emphasis is placed on the hybrid MCDA proposal that integrates fuzzy analysis to manage the uncertainty and subjectivity of the stakeholders’ criteria. This proposal allows a more accurate and effective representation of the information, leading to better results supporting decision-making for future integration of renewable resource alternatives as an element of transformation for the energy sector.
This work proposes the application of an analysis framework that integrates four stages:
Evaluation of theoretical pre-feasibility represented by the primary renewable resource: by conducting this assessment, decision makers gain insights into the possibilities and limitations of utilizing each primary renewable resource;
Construction of alternatives based on mix participation percentages of the selected renewable resources: each alternative represents a unique blend of renewable resources, allowing for a comprehensive analysis of how they can work together to meet the energy generation targets;
Evaluation of indicators in each of the alternatives: these indicators are chosen based on their relevance and significance to the specific context of the renewable energy project, providing specificity to the analysis;
Application of a FAHP-TOPSIS hybrid multi-criteria analysis method: this method enables a systematic, transparent, and objective decision-making process that can be aligned with development goals, and political and governmental decisions.
3. Materials and Methods
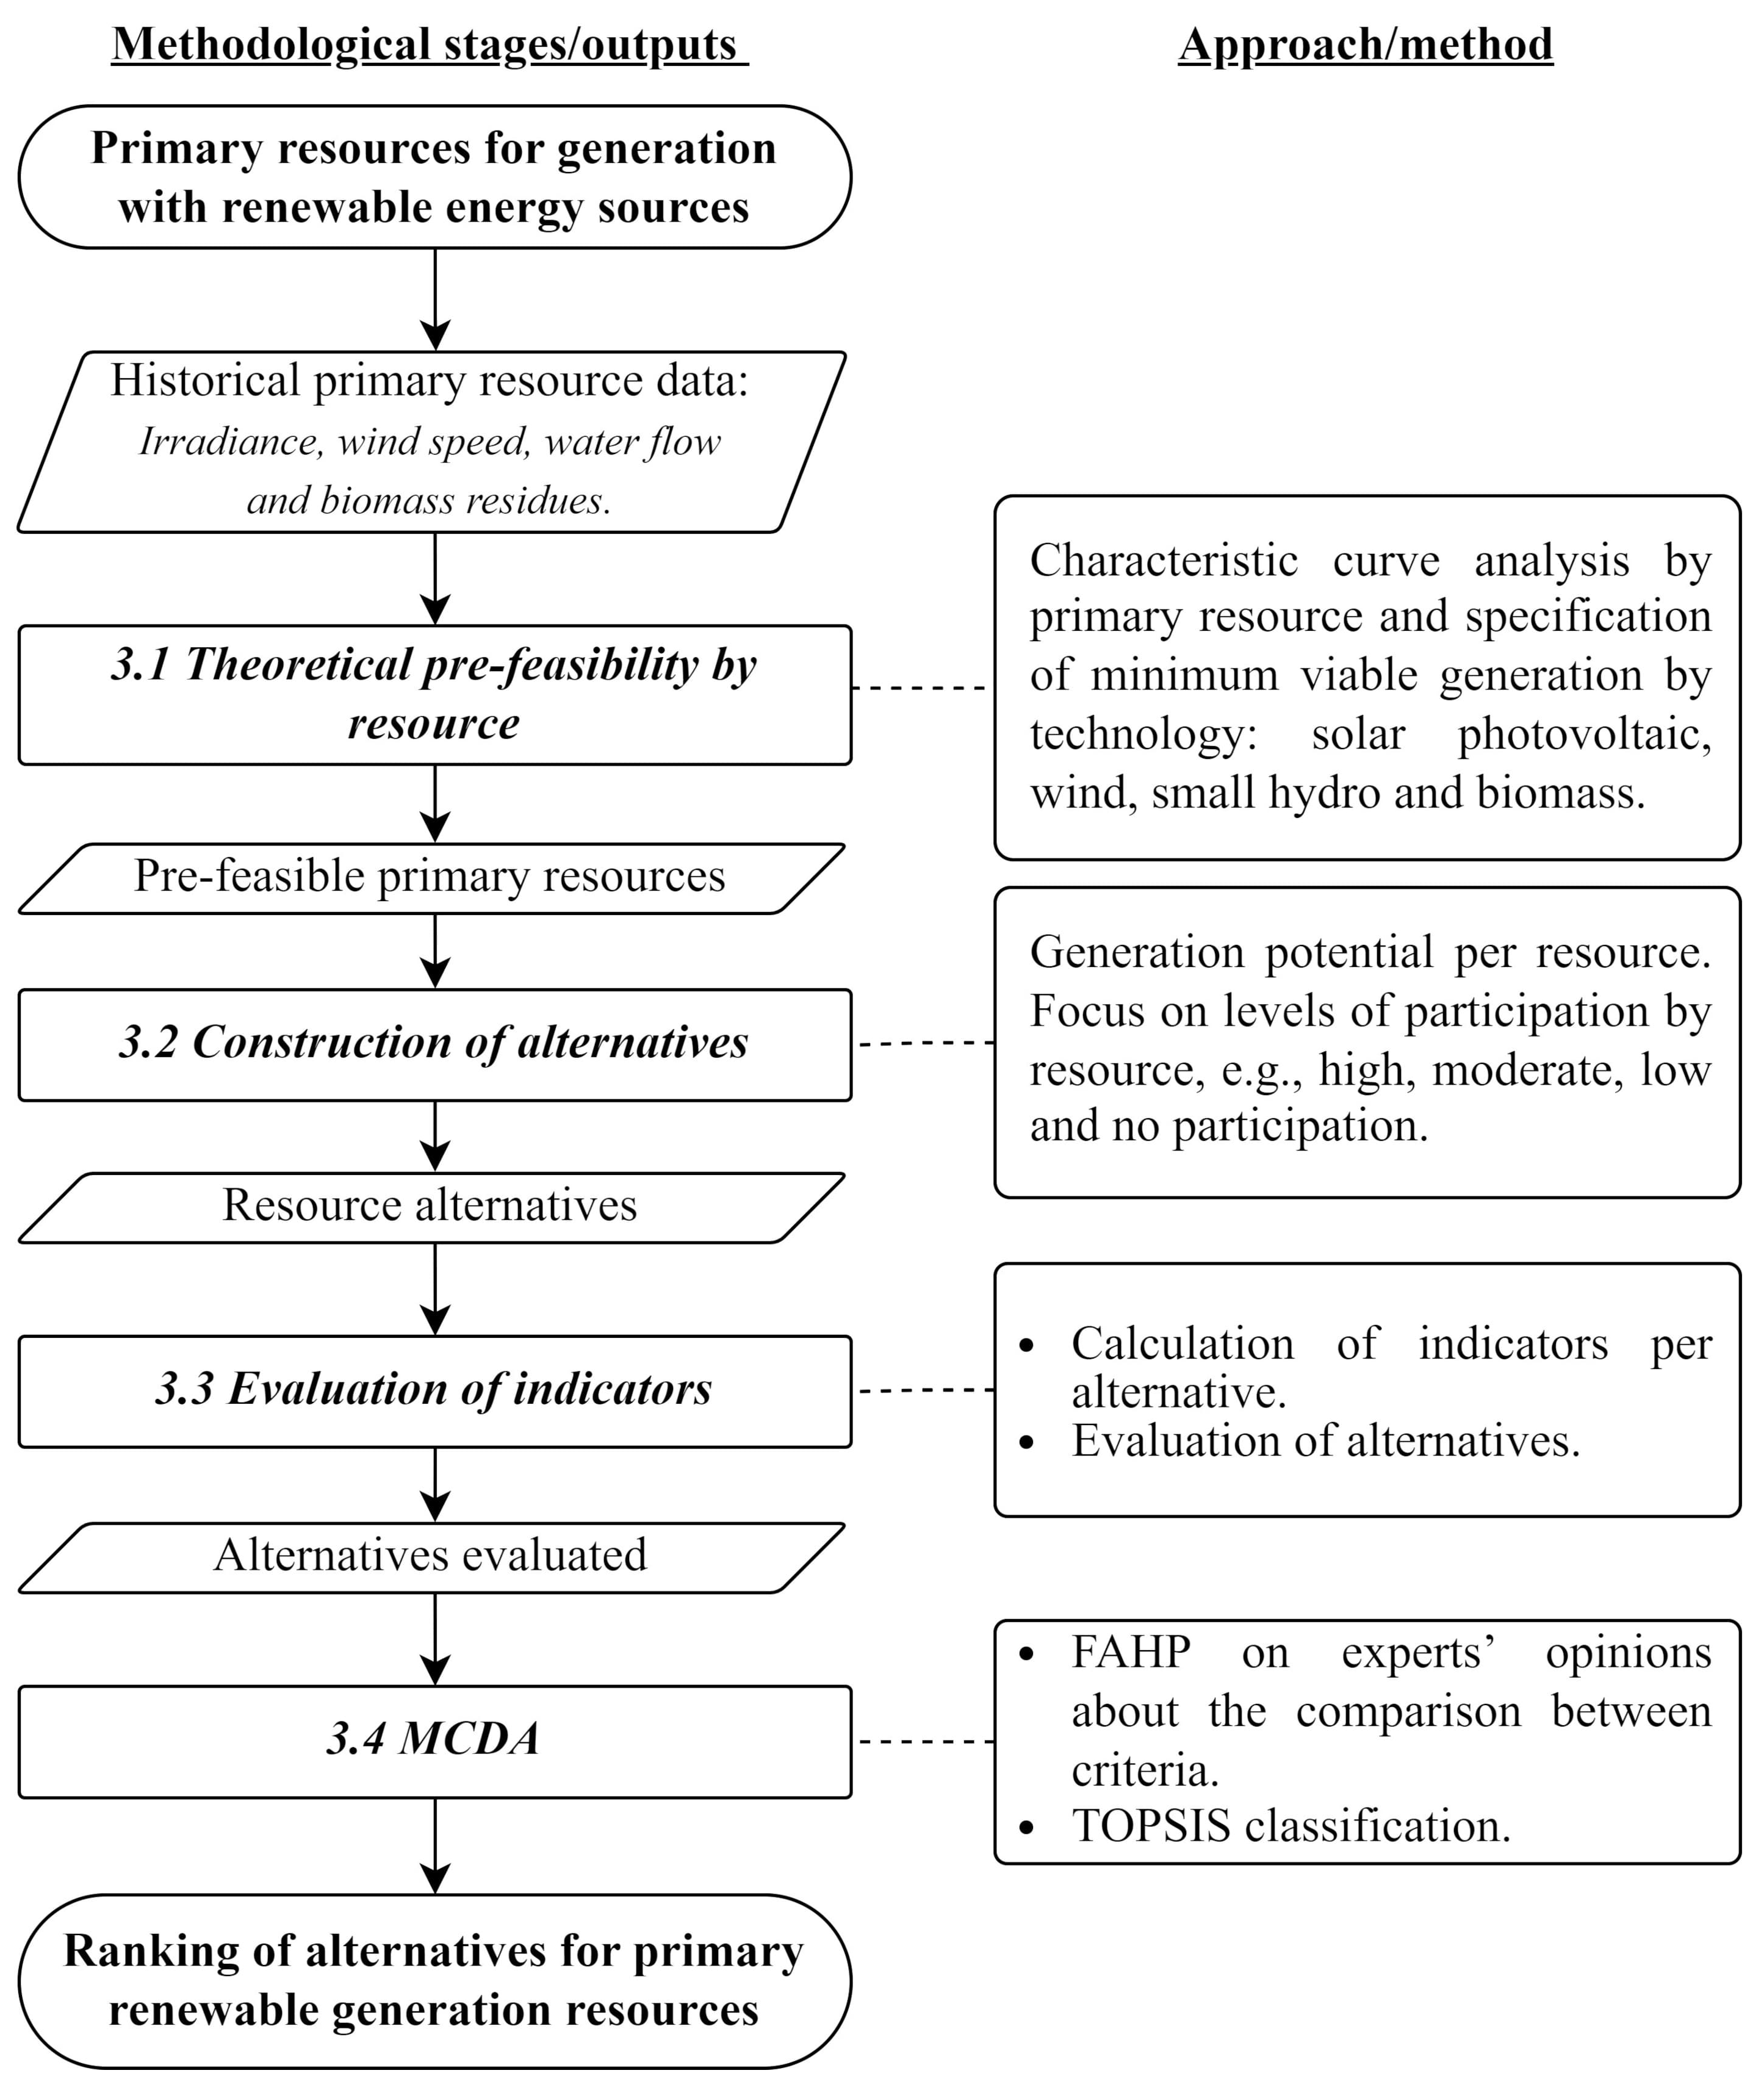
The proposed framework offers a systematic strategy for identifying the best generation alternatives using renewable energy sources based on the interests of a group of experts and under a sustainable approach with environmental, economic, and technical criteria. As a result, the framework’s application provides a list of evaluated alternatives, which, according to the multi-criteria analysis structure, is presented as input to support the final decision-making process.
Figure 1 shows the four main stages that constitute the analysis framework:
Section 3.1 theoretical pre-feasibility evaluation by resource;
Section 3.2 construction of alternatives based on participation percentages;
Section 3.3 evaluation of indicators for each of the alternatives;
Section 3.4 MCDA—multi-criteria analysis composed of a hybrid FAHP-TOPSIS method to calculate weights by criteria and to rank the alternatives. Similarly, the input elements and the expected result are presented for each stage. The following sections provide a detailed explanation of the treatment developed for each stage. The framework for resource assessment is supported by data analysis, from which it is necessary to emphasize that the availability and quality of data are essential in constructing a satisfactory study at each stage.
3.1. Theoretical Pre-Feasibility by Resource
Based on the technical characteristics of the area of interest, the evaluation of potential takes into account the information available for primary resources by type of generation technology: Irradiance for solar photovoltaic generation; wind speed for wind generation; water flow for SHP generation; tons of biomass for biogas generation. This variable set is analyzed using an annual characteristic curve constructed from monthly average values.
In this stage, each resource is evaluated based on the feasibility limit obtained from technical sources, discarding generation technologies that are not technically viable. For solar resources, a minimum daily incidence between 4 and 5 kW/m
is estimated for received irradiance [
23]. As for wind resources, some studies propose speeds around 3 and 4 m/s for effective energy generation and 5 m/s for larger wind turbines [
23,
24]. For water resources, a specific analysis of the hydrographic basin allows for determining design flows for the exploitation of the resource in electricity generation, preserving the stability of the habitat and its biodiversity [
25]. Finally, for the biomass resource, the viability limit is established as “overcome” by the availability of the resource itself, i.e., if known sources of usable waste-generating biomass are available for exploitation through biogas generation [
26].
According to the viability analysis, the calculation of generation potential is obtained through the equations presented in
Table 2 for those theoretically exploitable resources.
3.2. Construction of Alternatives
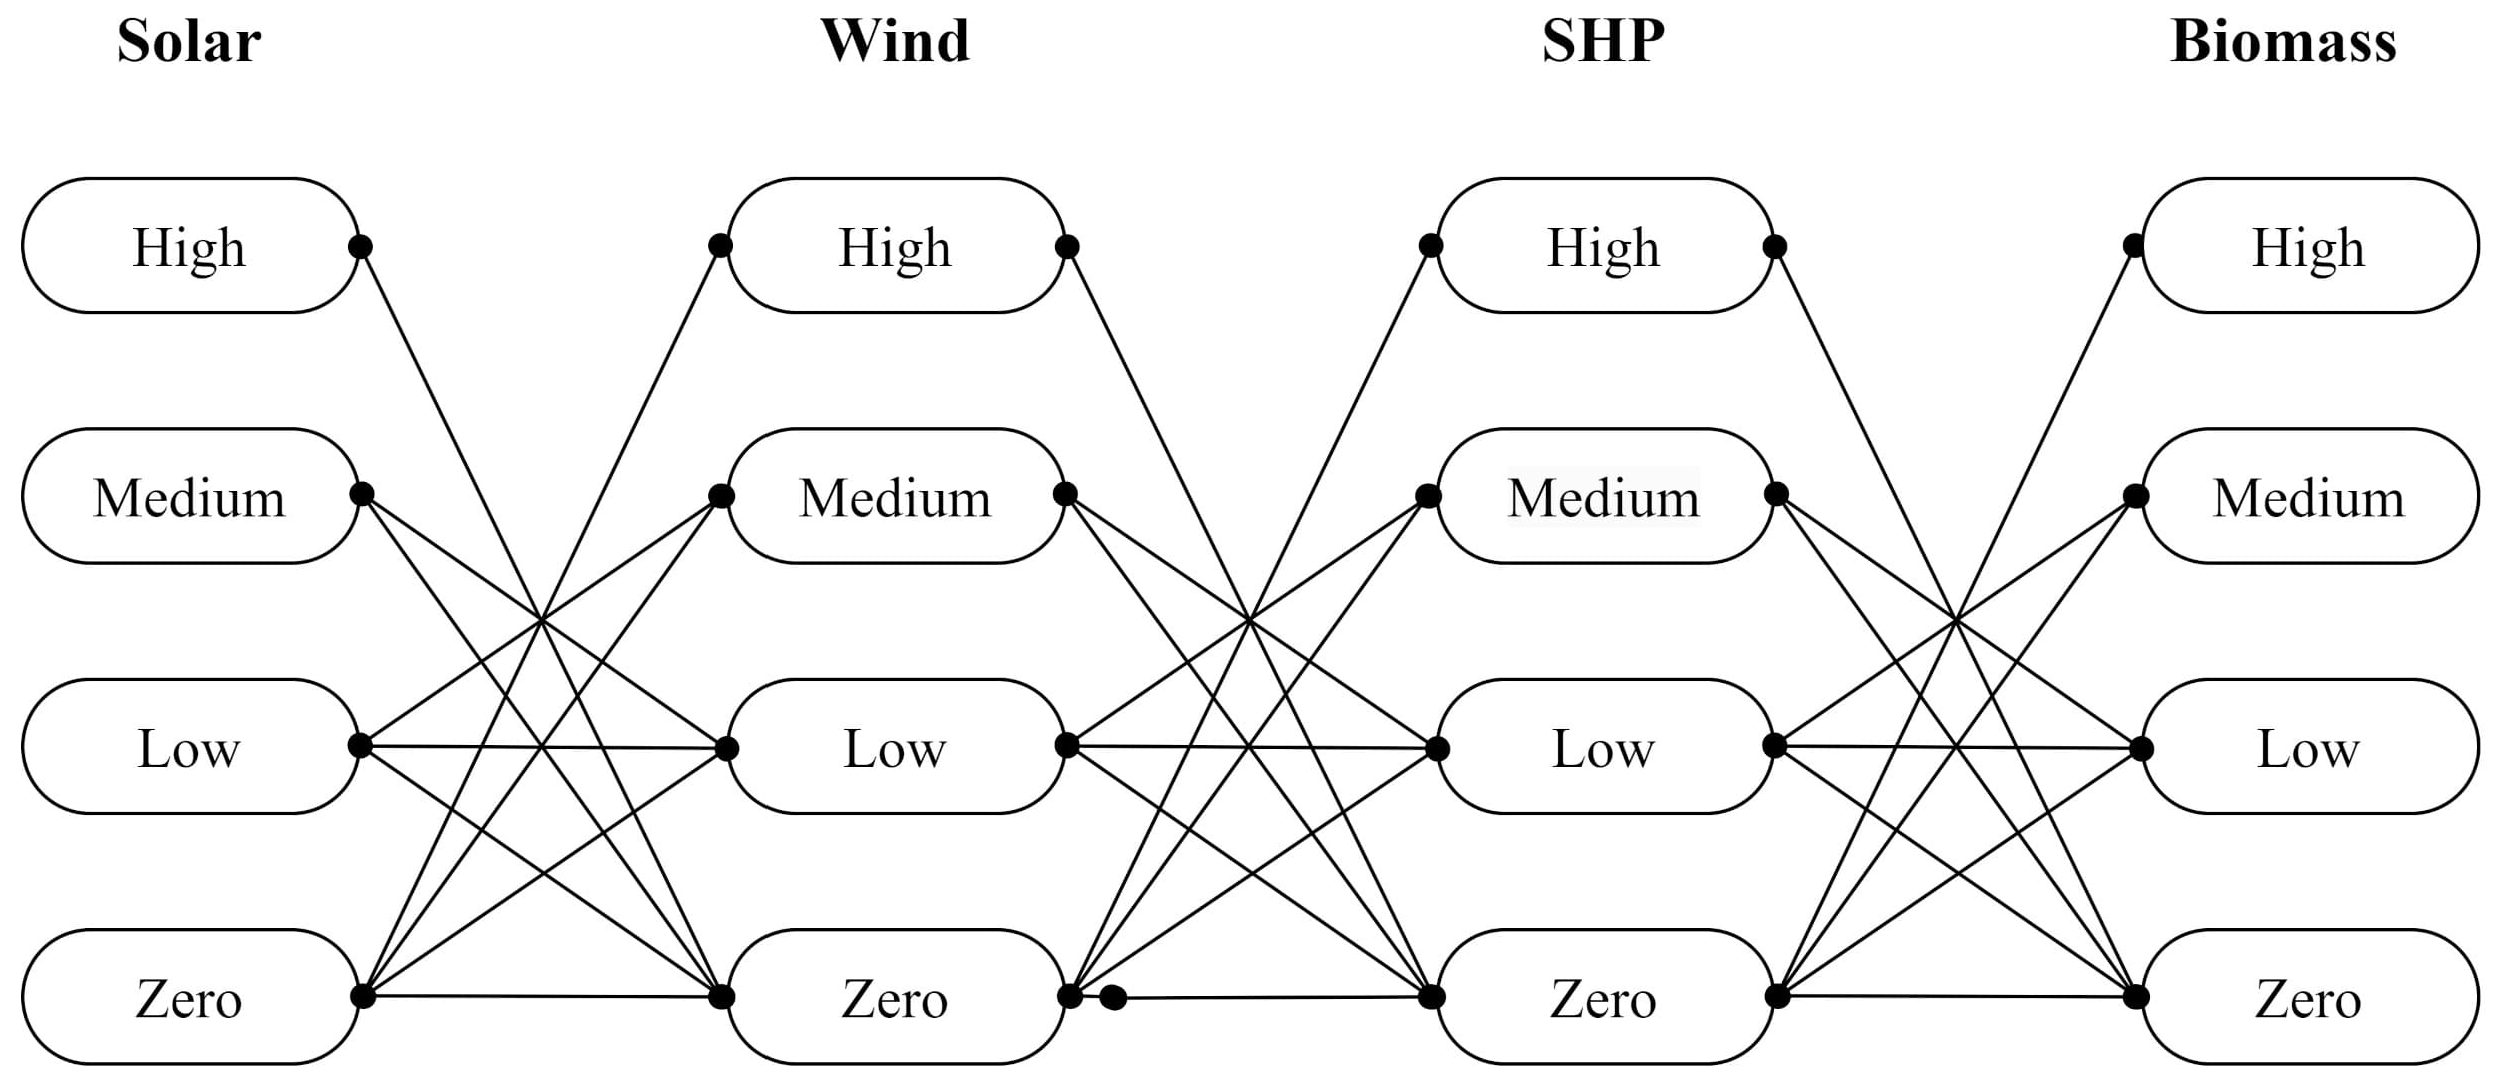
In this stage, possible alternatives are defined based on penetration levels by renewable generation resources. The search area to form alternatives covers 100% of the renewable generation target through combinations of the four generation resources explored: solar photovoltaic, wind turbine, SHP, and biogas from biomass. Thus, the alternatives are generated through all possible combinations that allow the resources to be simultaneously associated. This idea of forming alternatives seeks to represent variations directly related to the resource’s penetration levels, being as flexible as desired, and approaching the alternative that allows the best use of the available resources.
The number of levels used in the combination of resources can be as extensive as desired, allowing the expected penetration percentages of each resource to have the required level of granularity. This approach ensures that the sum of the participation of the four resources in the alternative constitutes 100% of the generation. For example,
Figure 2 illustrates the links to form alternatives, considering four levels of penetration per resource: zero, low, medium, and high.
The formal representation of the alternatives is given by Equation (
1).
The matrix () is formed by the determined participation percentages for constructing alternatives and the binary variable (), which determines the availability of the resource—1 for technically feasible resources, 0 for non-feasible resources—under the pre-feasibility evaluation presented in the first stage of the analysis framework.
As a representation of the generation capacity established by the alternative, Equation (
2) includes the alternatives in terms of the generation components (
), (
), (
), (
) for the solar, wind, SHP, and biomass generation resources, respectively.
generation components (
) are interpreted as the specification of installed capacity used by each technology to achieve the desired value of renewable resources.
3.3. Evaluation of Indicators
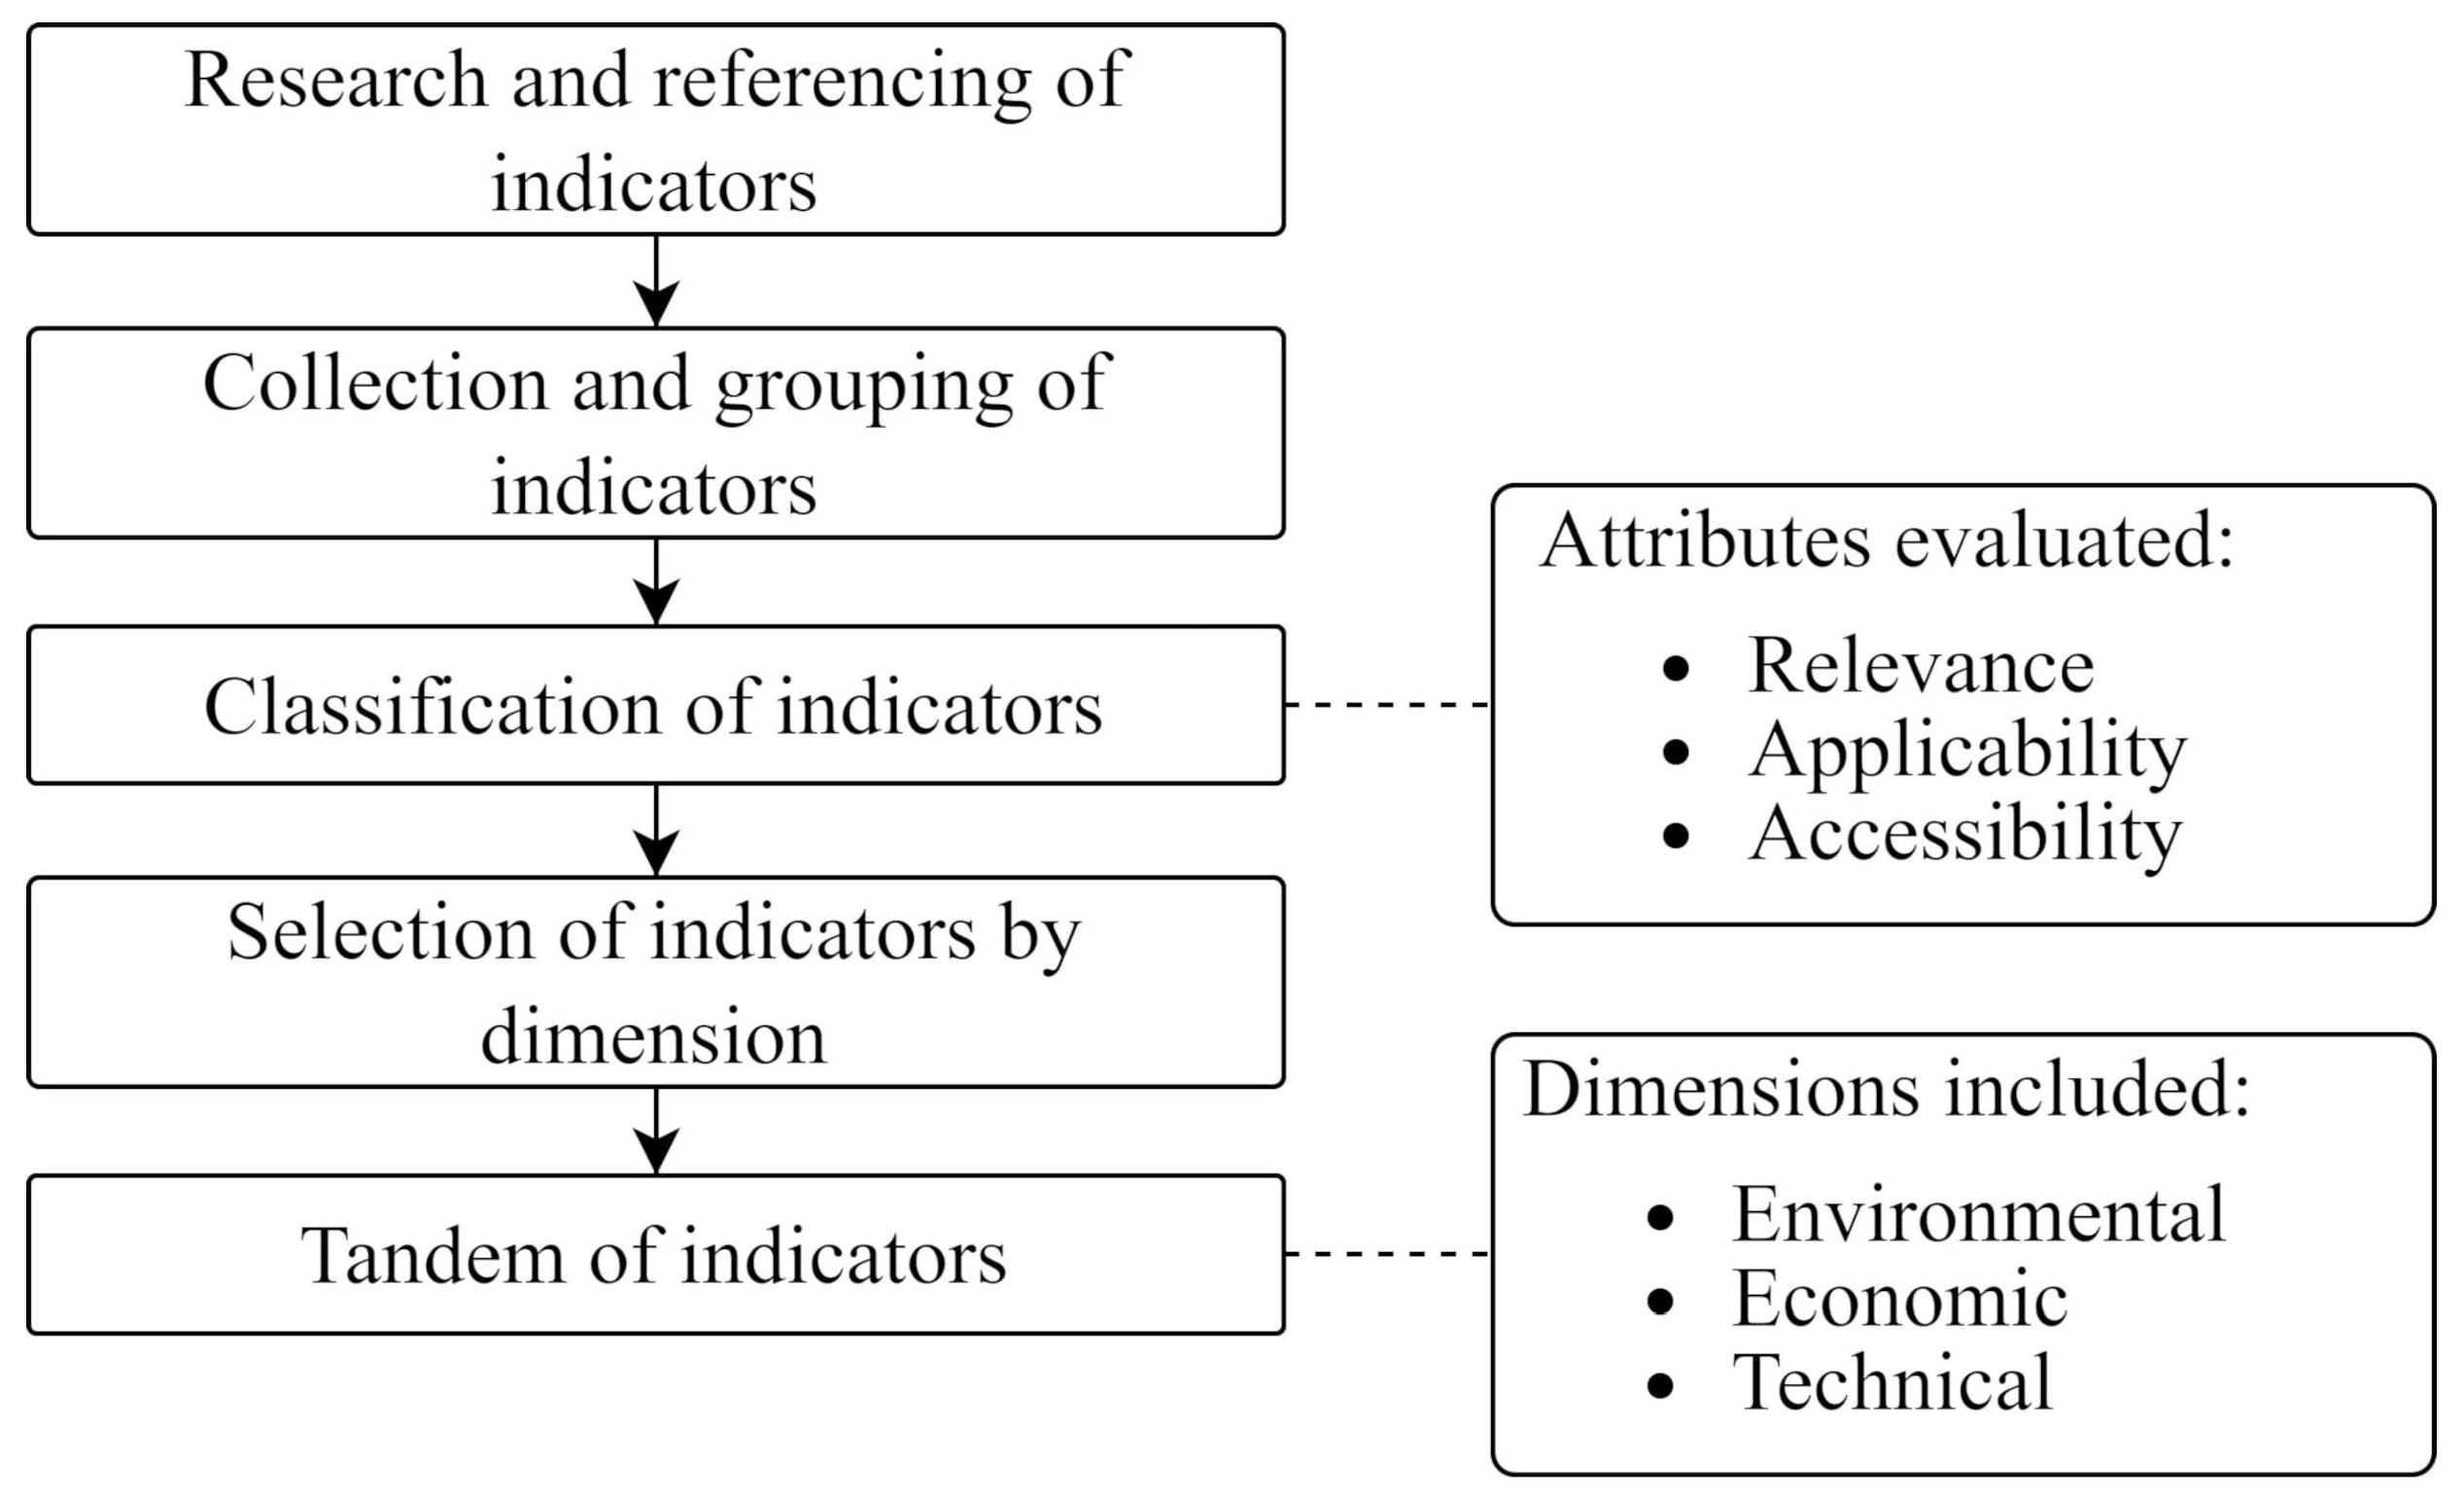
Evaluating alternatives through performance indicators is fundamental in assisting decision-making, providing critical information for the analysis, and achieving strategic objectives. An adequate selection of indicators should generally address the needs and objectives of all stakeholders. From this perspective and considering the extensive list of indicators used within the electricity industry,
Figure 3 presents a guideline method for selecting indicators by evaluating proposals for renewable resource integration. The idea of using a method in selecting indicators is to provide support in the construction of use cases and additionally provide flexibility according to the requirements and limitations of the study areas, addressing the interests of the stakeholders.
Academic, regulatory, and sectoral reports were consulted to select the indicators as part of the literature review. From which the description and formulation of indicators applied to the electricity-energy sector were collected, meeting the following criteria: the presented study includes at least one sustainability dimension of interest for the evaluation of indicators (environmental, economic, and/or technical dimensions); the indicators’ proposed application is developed on at least one of the renewable generation technologies of interest for this research (solar photovoltaic, wind, SHP, and biomass).
A weighted sum methodology was adopted to classify indicators based on what is presented in [
35]. This classification method allows a quantitative evaluation of each indicator, considering the degree of compliance with a set of attributes. Thus, contributing to selecting indicators that best suit the case study and the needs of the stakeholders. The following attributes were considered in the process of selecting the indicators:
Relevance: An indicator with higher appearances in the Background review represents a well-defined and validated indicator for the sector;
Applicability: An indicator representing an easy integration of the alternative into an evaluation scenario structure based on renewable resource penetration levels;
Accessibility: An indicator supported by easily accessible, up-to-date variables and solid support for data reliability.
The following assumption is used for assigning the value to each of the attributes: If it is considered that the indicator does not meet the criterion presented in the attribute, a value of 0 is assigned to it; if it partially meets the criterion presented in the attribute, a value of
is assigned to it; if it satisfactorily meets the criterion presented in the attribute, a value of
is assigned to it [
35].
The assignment of a value in the classification of the indicator falls on the criterion of the researchers leading the case study, as shown in the following expression:
where (
) is the classification value of indicator (
n), (
) is the value of attribute (
i) for indicator (
n) and (
) is the weight assigned to attribute (
). The selection method allows for adaptation to indicators of various evaluation dimensions, beyond those addressed in this study, and that, if the case arises, are considered of interest by stakeholders.
As the evaluation objective, three indicators were selected for each addressed dimension (environmental, economic, and technical). Through the indicator selection method, these indicators were classified based on a weight assigned by the researchers, considering equal importance among attributes. Accordingly,
Table 3 includes the result of the indicator selection, with nine indicators grouped by dimension that will be used in evaluating alternatives.
3.4. Hybrid FAHP-TOPSIS Multi-Criteria Analysis Method
Multi-criteria decision analysis (MCDA) is a set of techniques for evaluating alternatives in decision-making involving multiple criteria and expert opinions [
39]. This work uses this analysis tool to determine the ranking of alternatives based on the completion of criteria by experts and the fulfillment of a series of environmental, economic, and technical factors to evaluate alternatives for renewable energy generation resources.
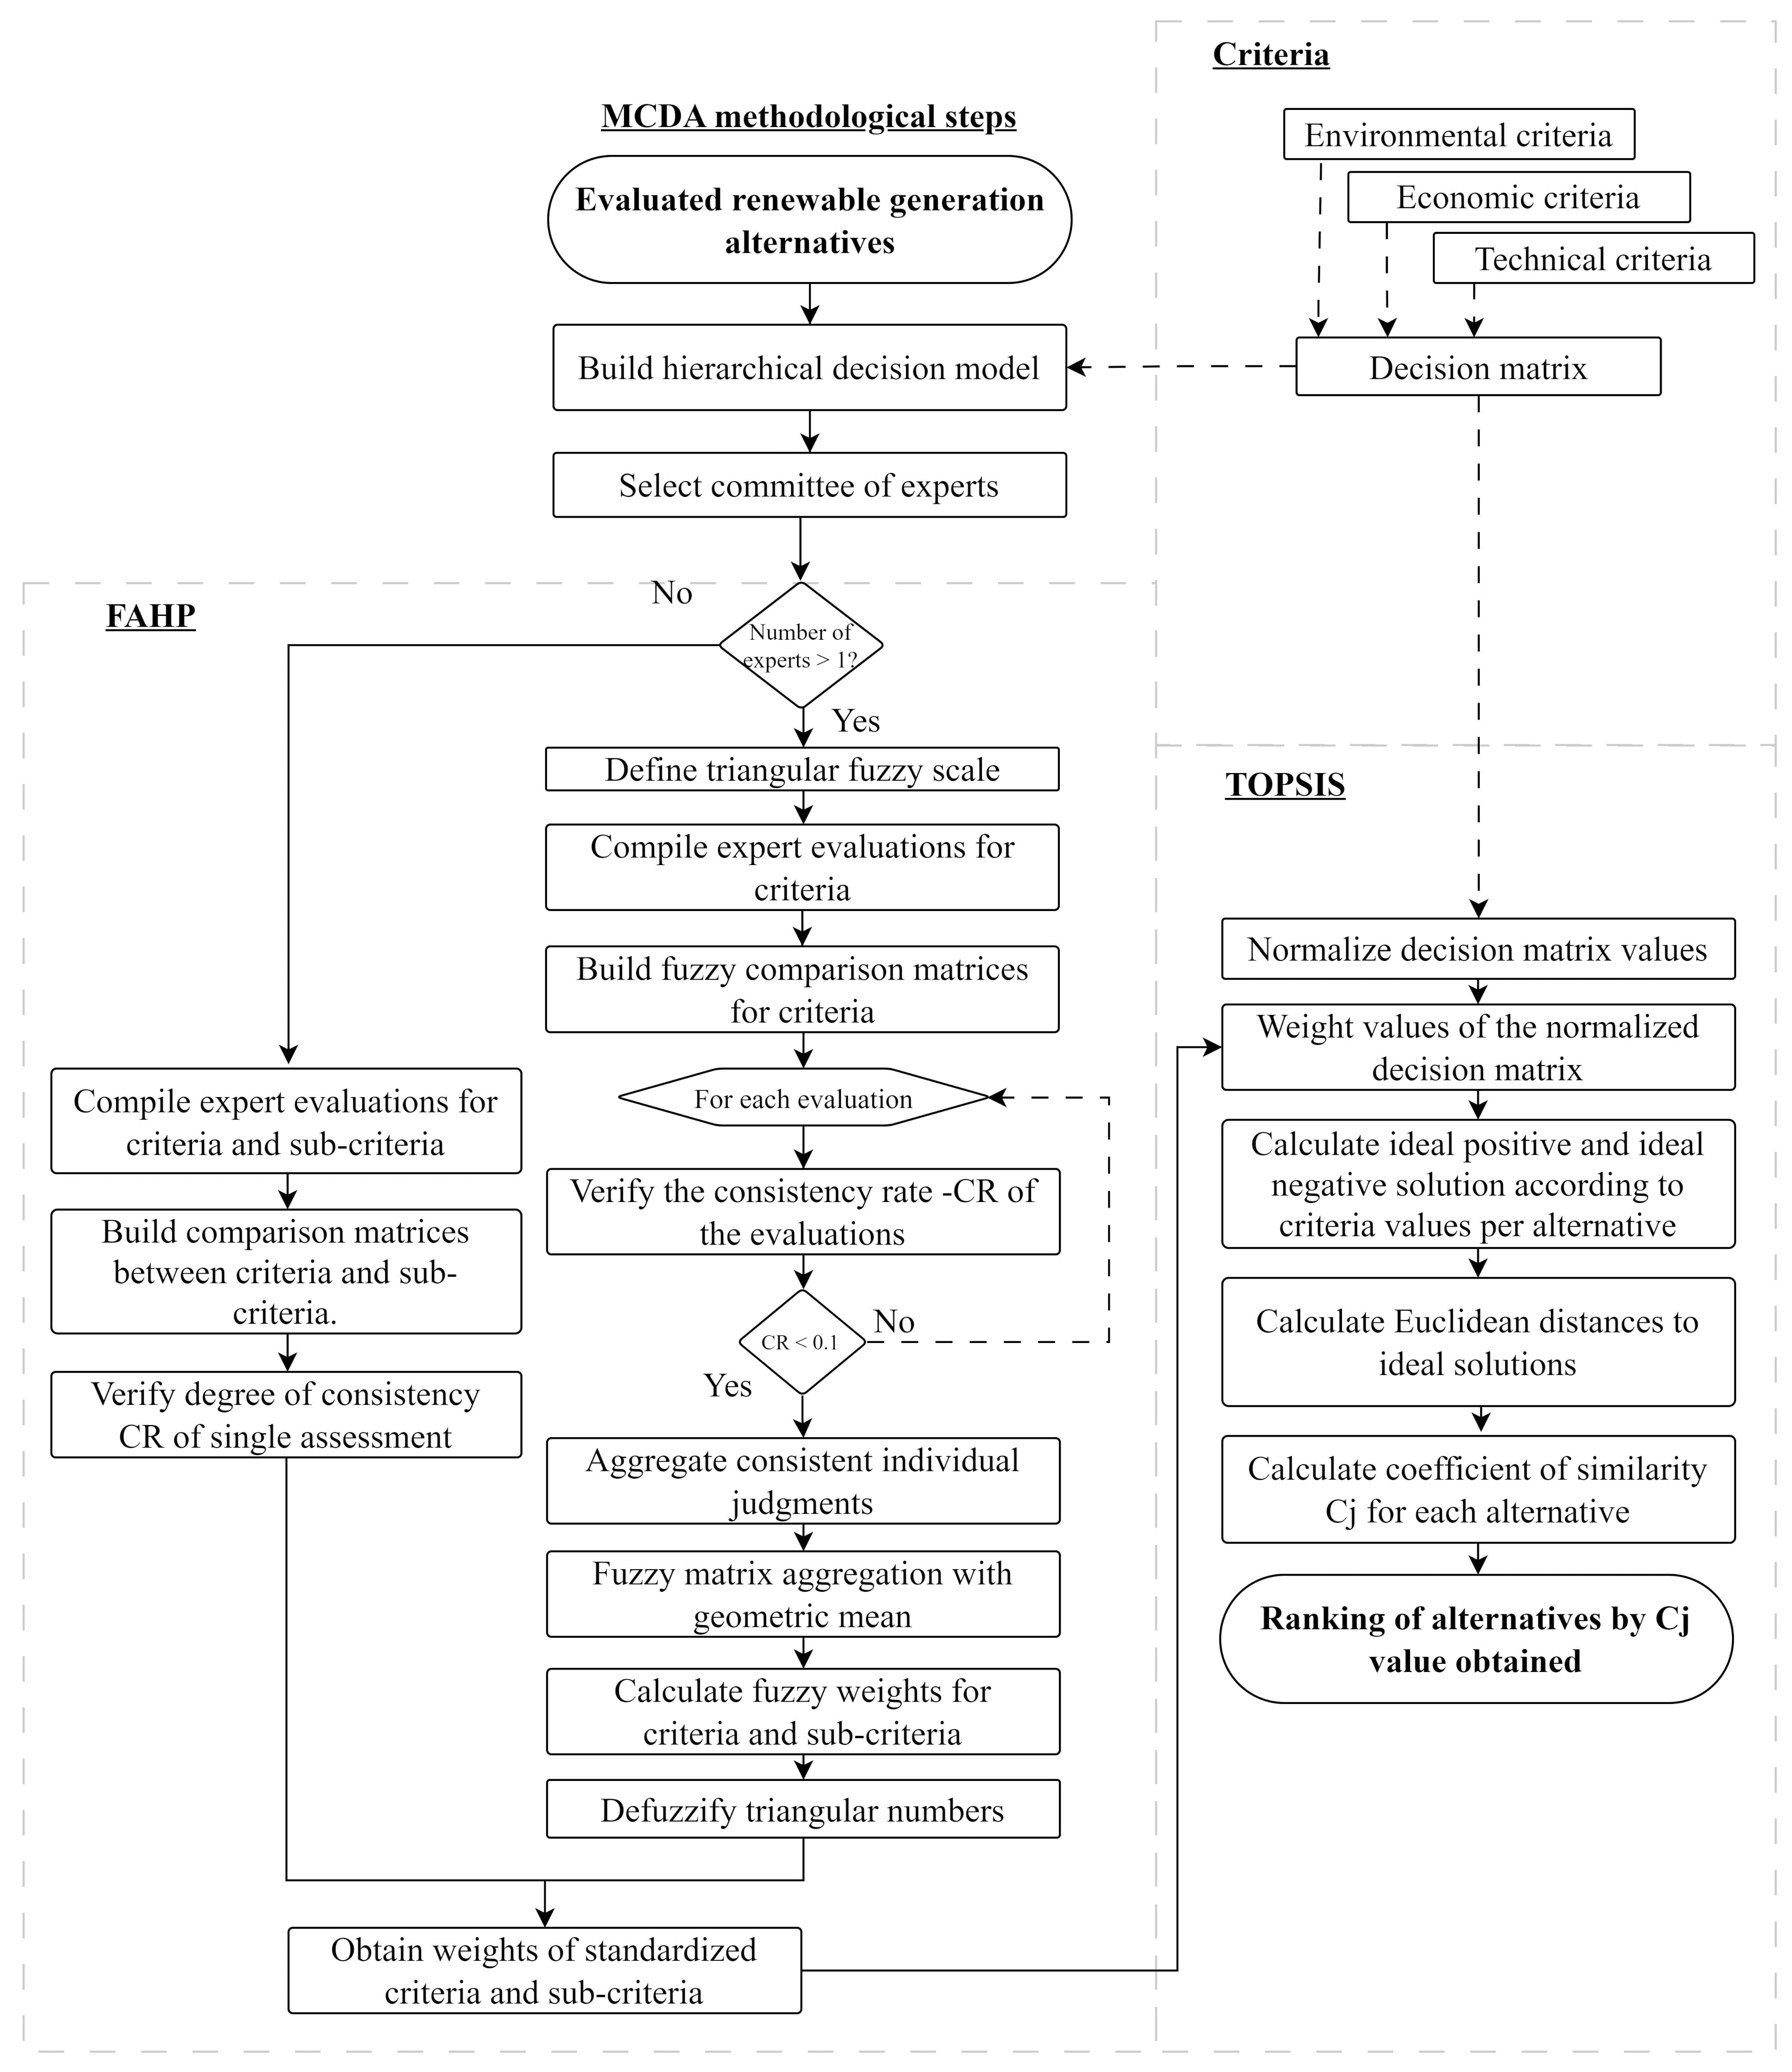
Figure 4 shows the steps developed in evaluating alternatives for the penetration of renewable resources. The proposal is based on a hybrid approach in which the first step takes elements of FAHP [
40], providing flexibility in the structure to determine weights through expert assessments and ensuring coherence for each criteria evaluation for making informed and transparent decisions [
8]. In the second stage, the TOPSIS method is used to classify the evaluated alternatives by calculating the distances between each alternative and the ideal solutions, allowing a classification of alternatives based on their overall performance [
41,
42].
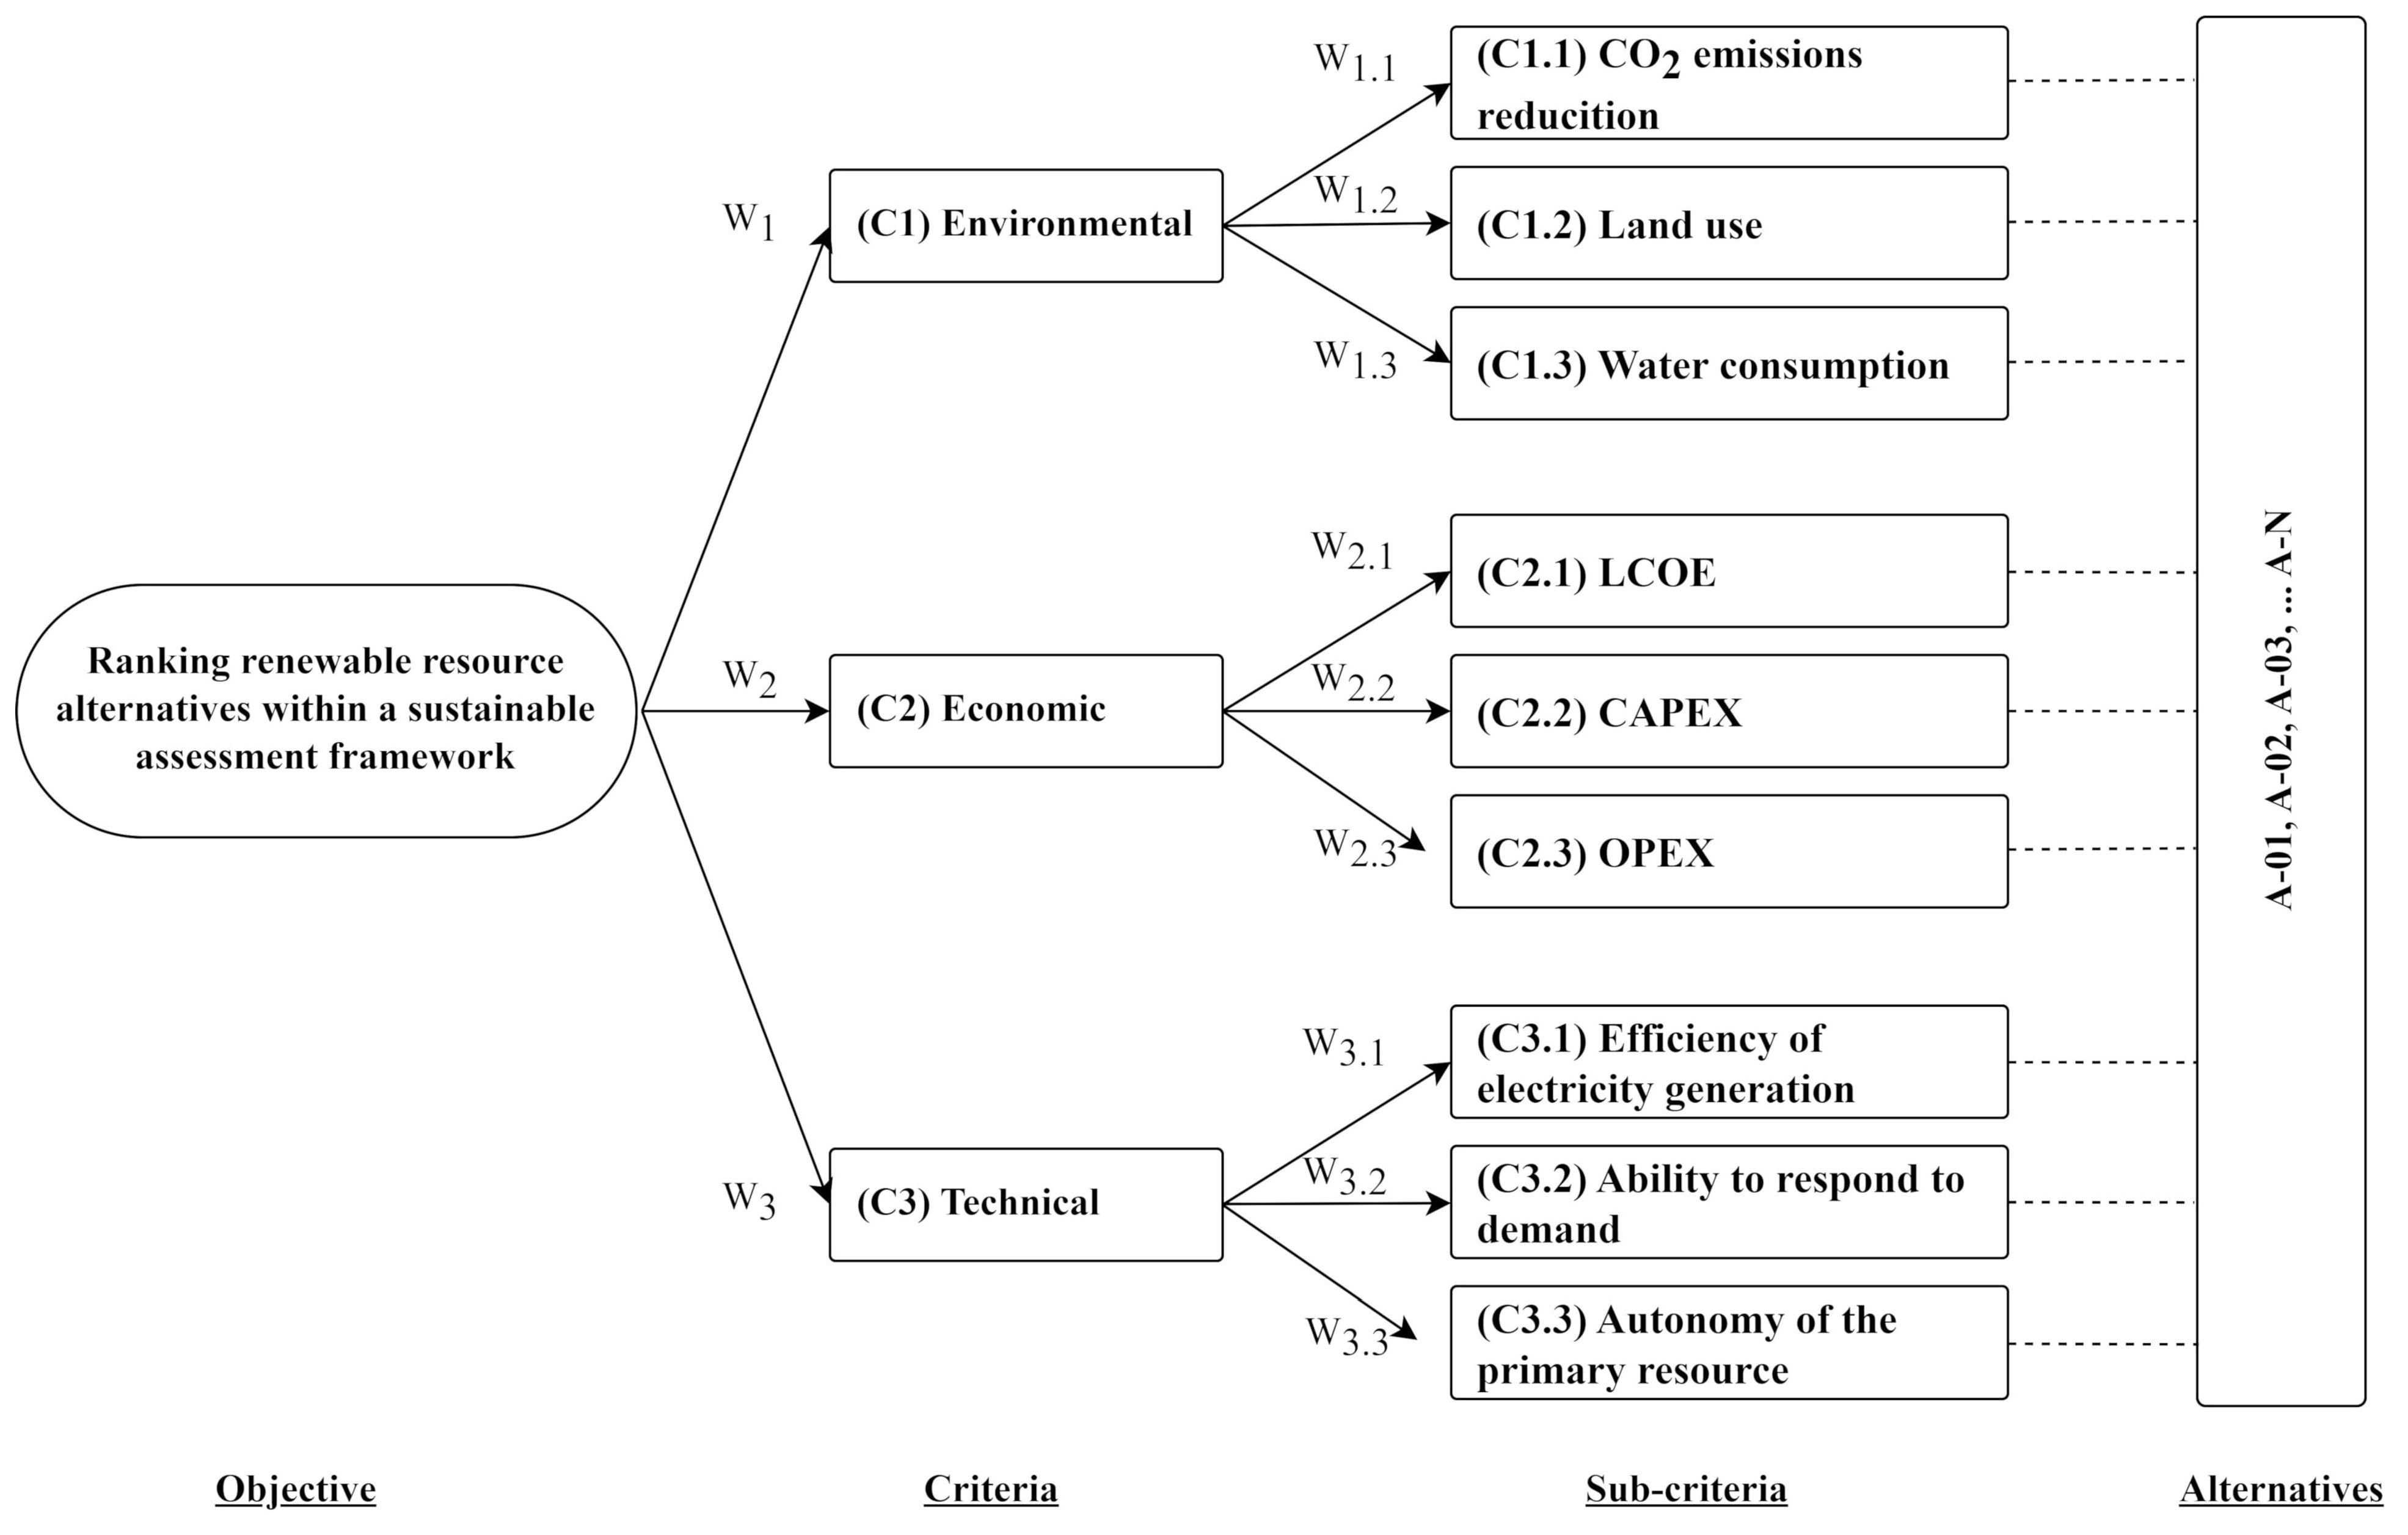
The hierarchical model presented in
Figure 5 relates the criteria and sub-criteria through the aggregated weighting factors. These weights are obtained from expert evaluations through FAHP using pairwise comparison with the Saaty scale and fuzzy representation for the method in question [
39].
An essential aspect of AHP is consistency analysis, which ensures that decision makers’ evaluations are aggregated in the weight calculation only if they meet the required level of consistency in pairwise comparisons. After weight calculation, the TOPSIS method is applied. Here, the matrix of evaluated alternatives
is subjected to a column-wise vector normalization process (corresponding to each sub-criterion). The weighted decision matrix (
) is calculated as
where (
) is the vector of weights for the criteria and (
) is the normalized matrix of alternatives. The next step is determining the positive and negative ideal solutions using Equations (
5) and (
6), respectively, [
43].
where (
) and (
) are the positive and negative ideal solutions of criterion
, respectively. The distances between each alternative and both ideal solutions are calculated using Euclidean distance described in Equations (
7) and (
8).
Once the distances
and
are calculated, the similarity coefficient is obtained using Equation (
9).
All alternatives are ranked using the coefficient of similarity (), which allows the decision makers to select the most suitable alternative according to the importance and values of the criteria.
4. Results
This section presents the application of the proposed analytical framework for a particular case study, on which each of the stages described in
Section 3 are developed.
4.1. Case Study
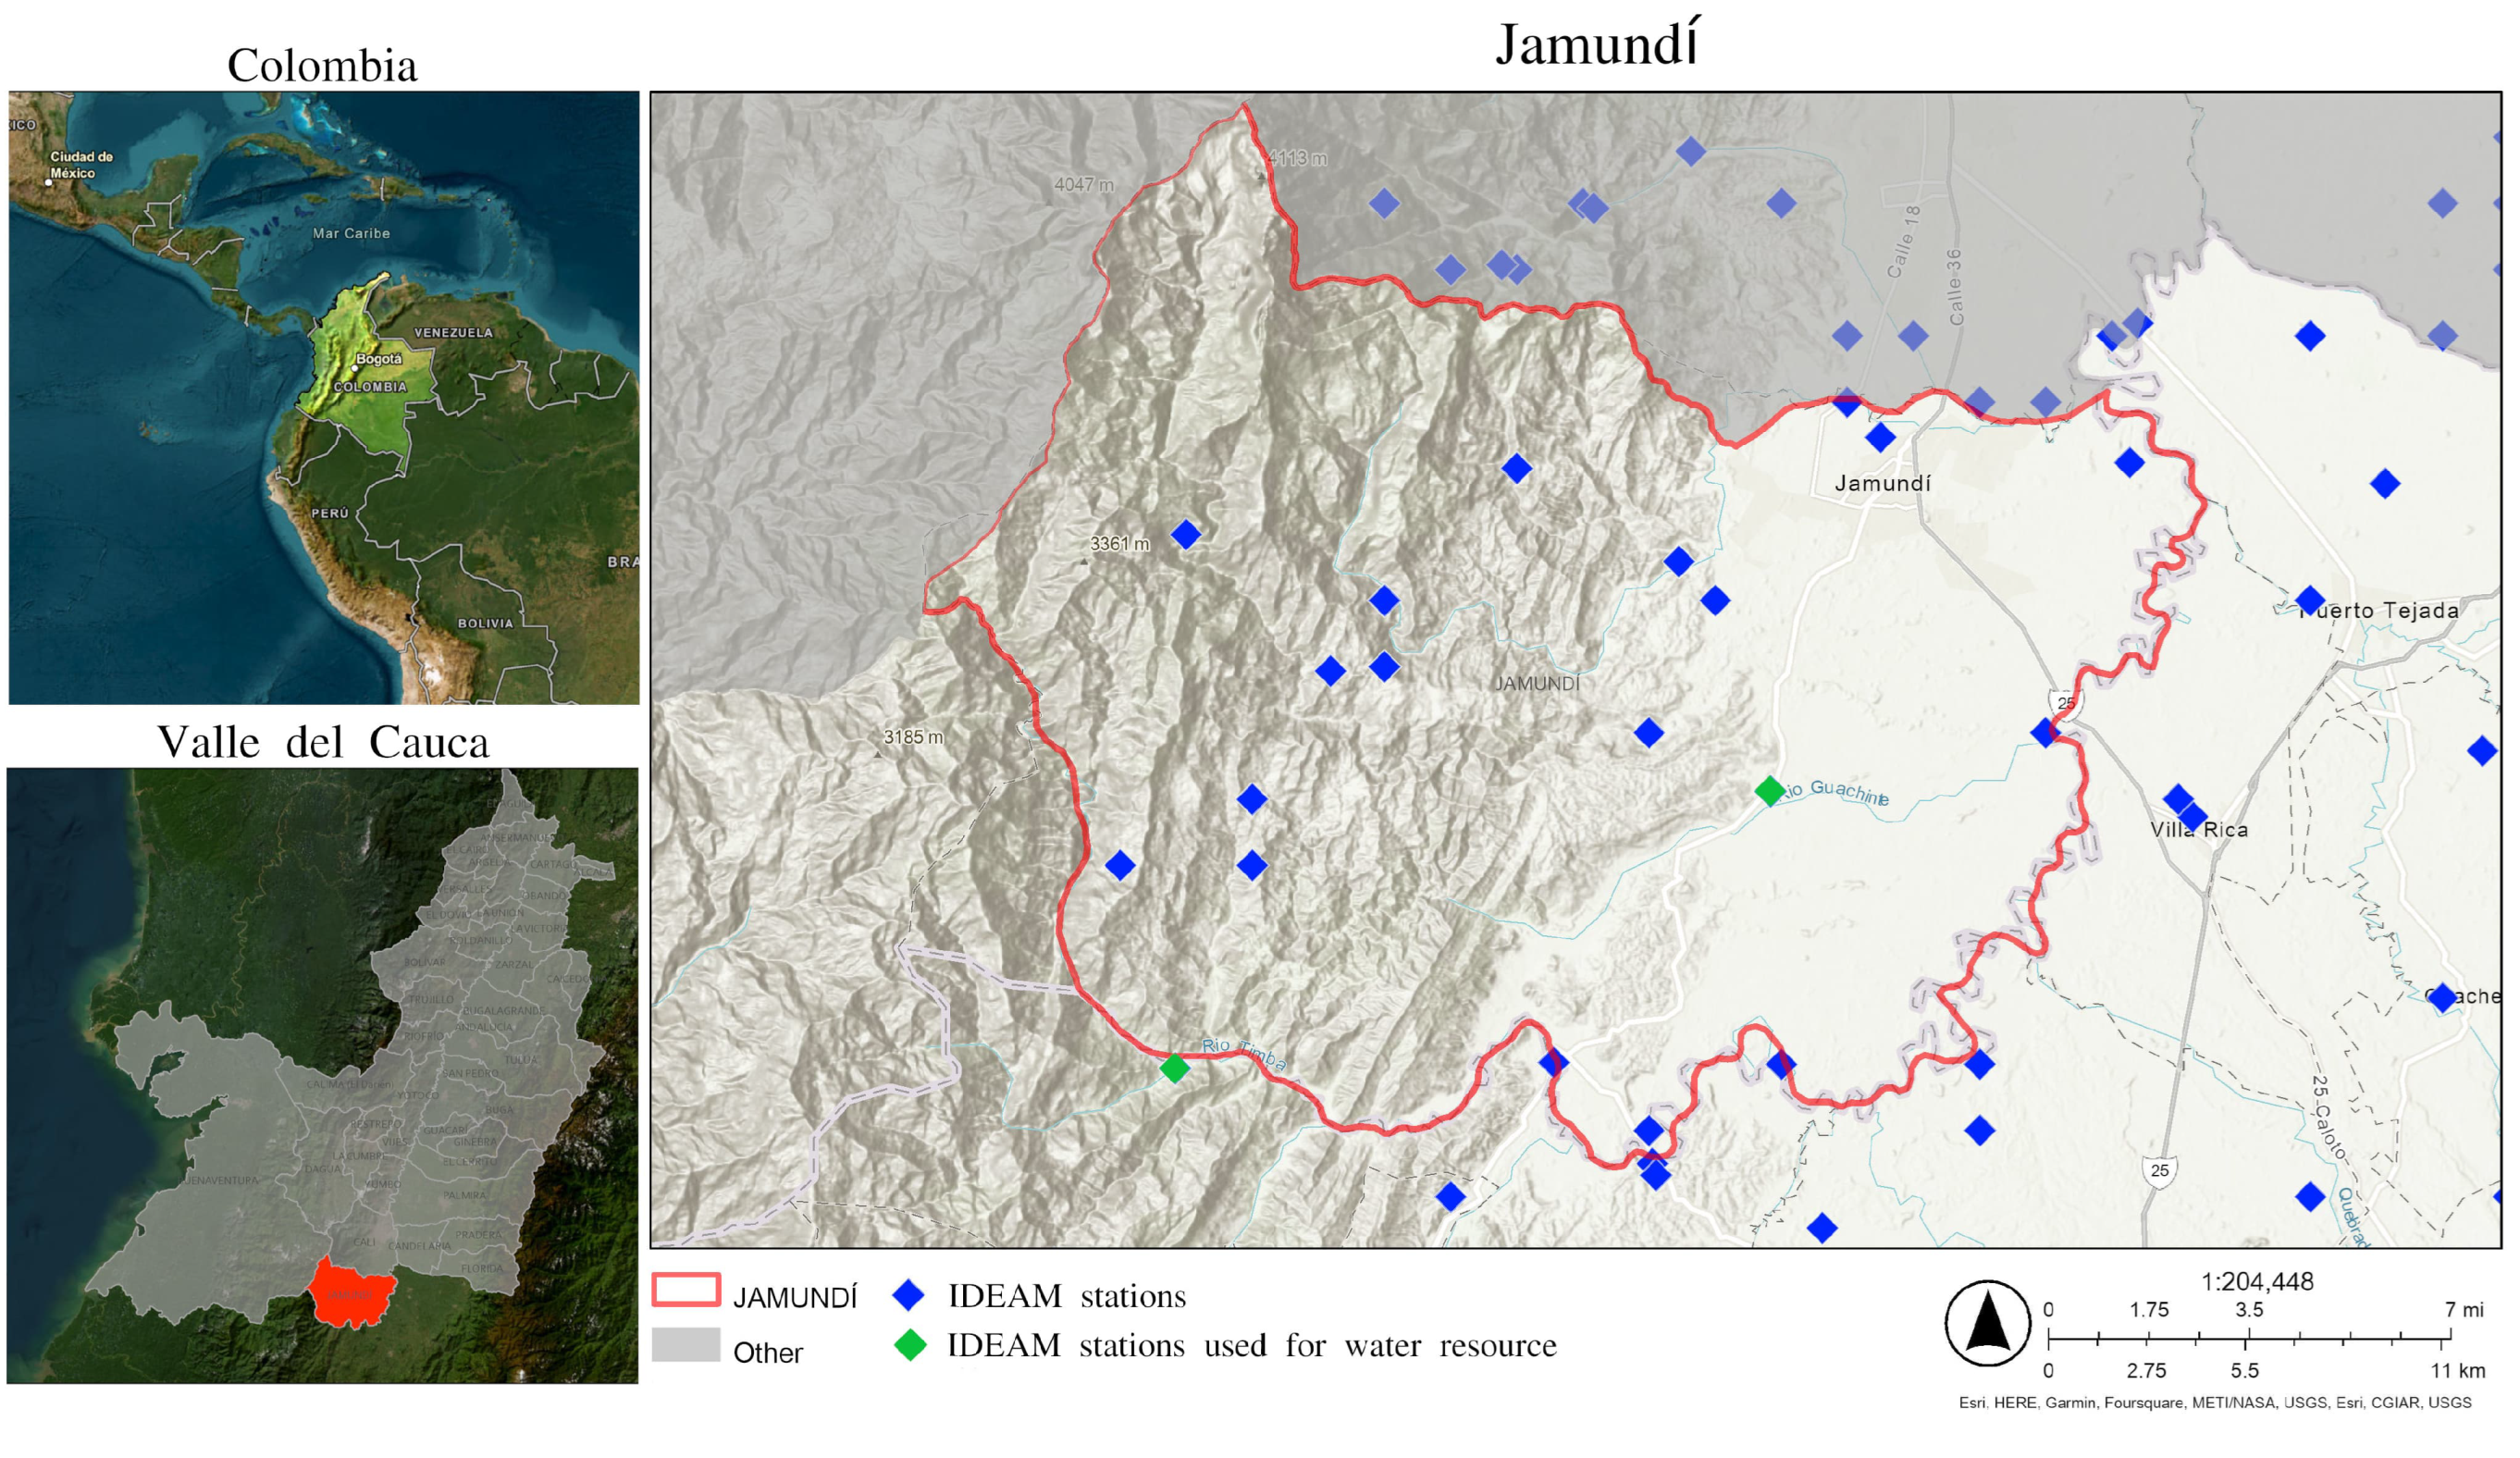
Jamundí is one of the 42 Colombian municipalities that make up the department of Valle del Cauca. It is located in the department’s southern region, between the Western Ranges and the western bank of the Cauca River. It has an average elevation of 975 m above sea level.
Historical data for the municipality of Jamundí was taken from the PowerNASA forecasting tool [
44] for incident irradiance on an inclined plane and wind speed at 10 m above ground level. As input for the water resource, monthly mean flow data of the Timba tributary (as presented in
Figure 6) in the Valle del Cauca water basin were used. These data were reported by the Institute of Hydrology, Meteorology, and Environmental Studies—IDEAM [
45].
4.2. Theoretical Pre-Feseability by Resource
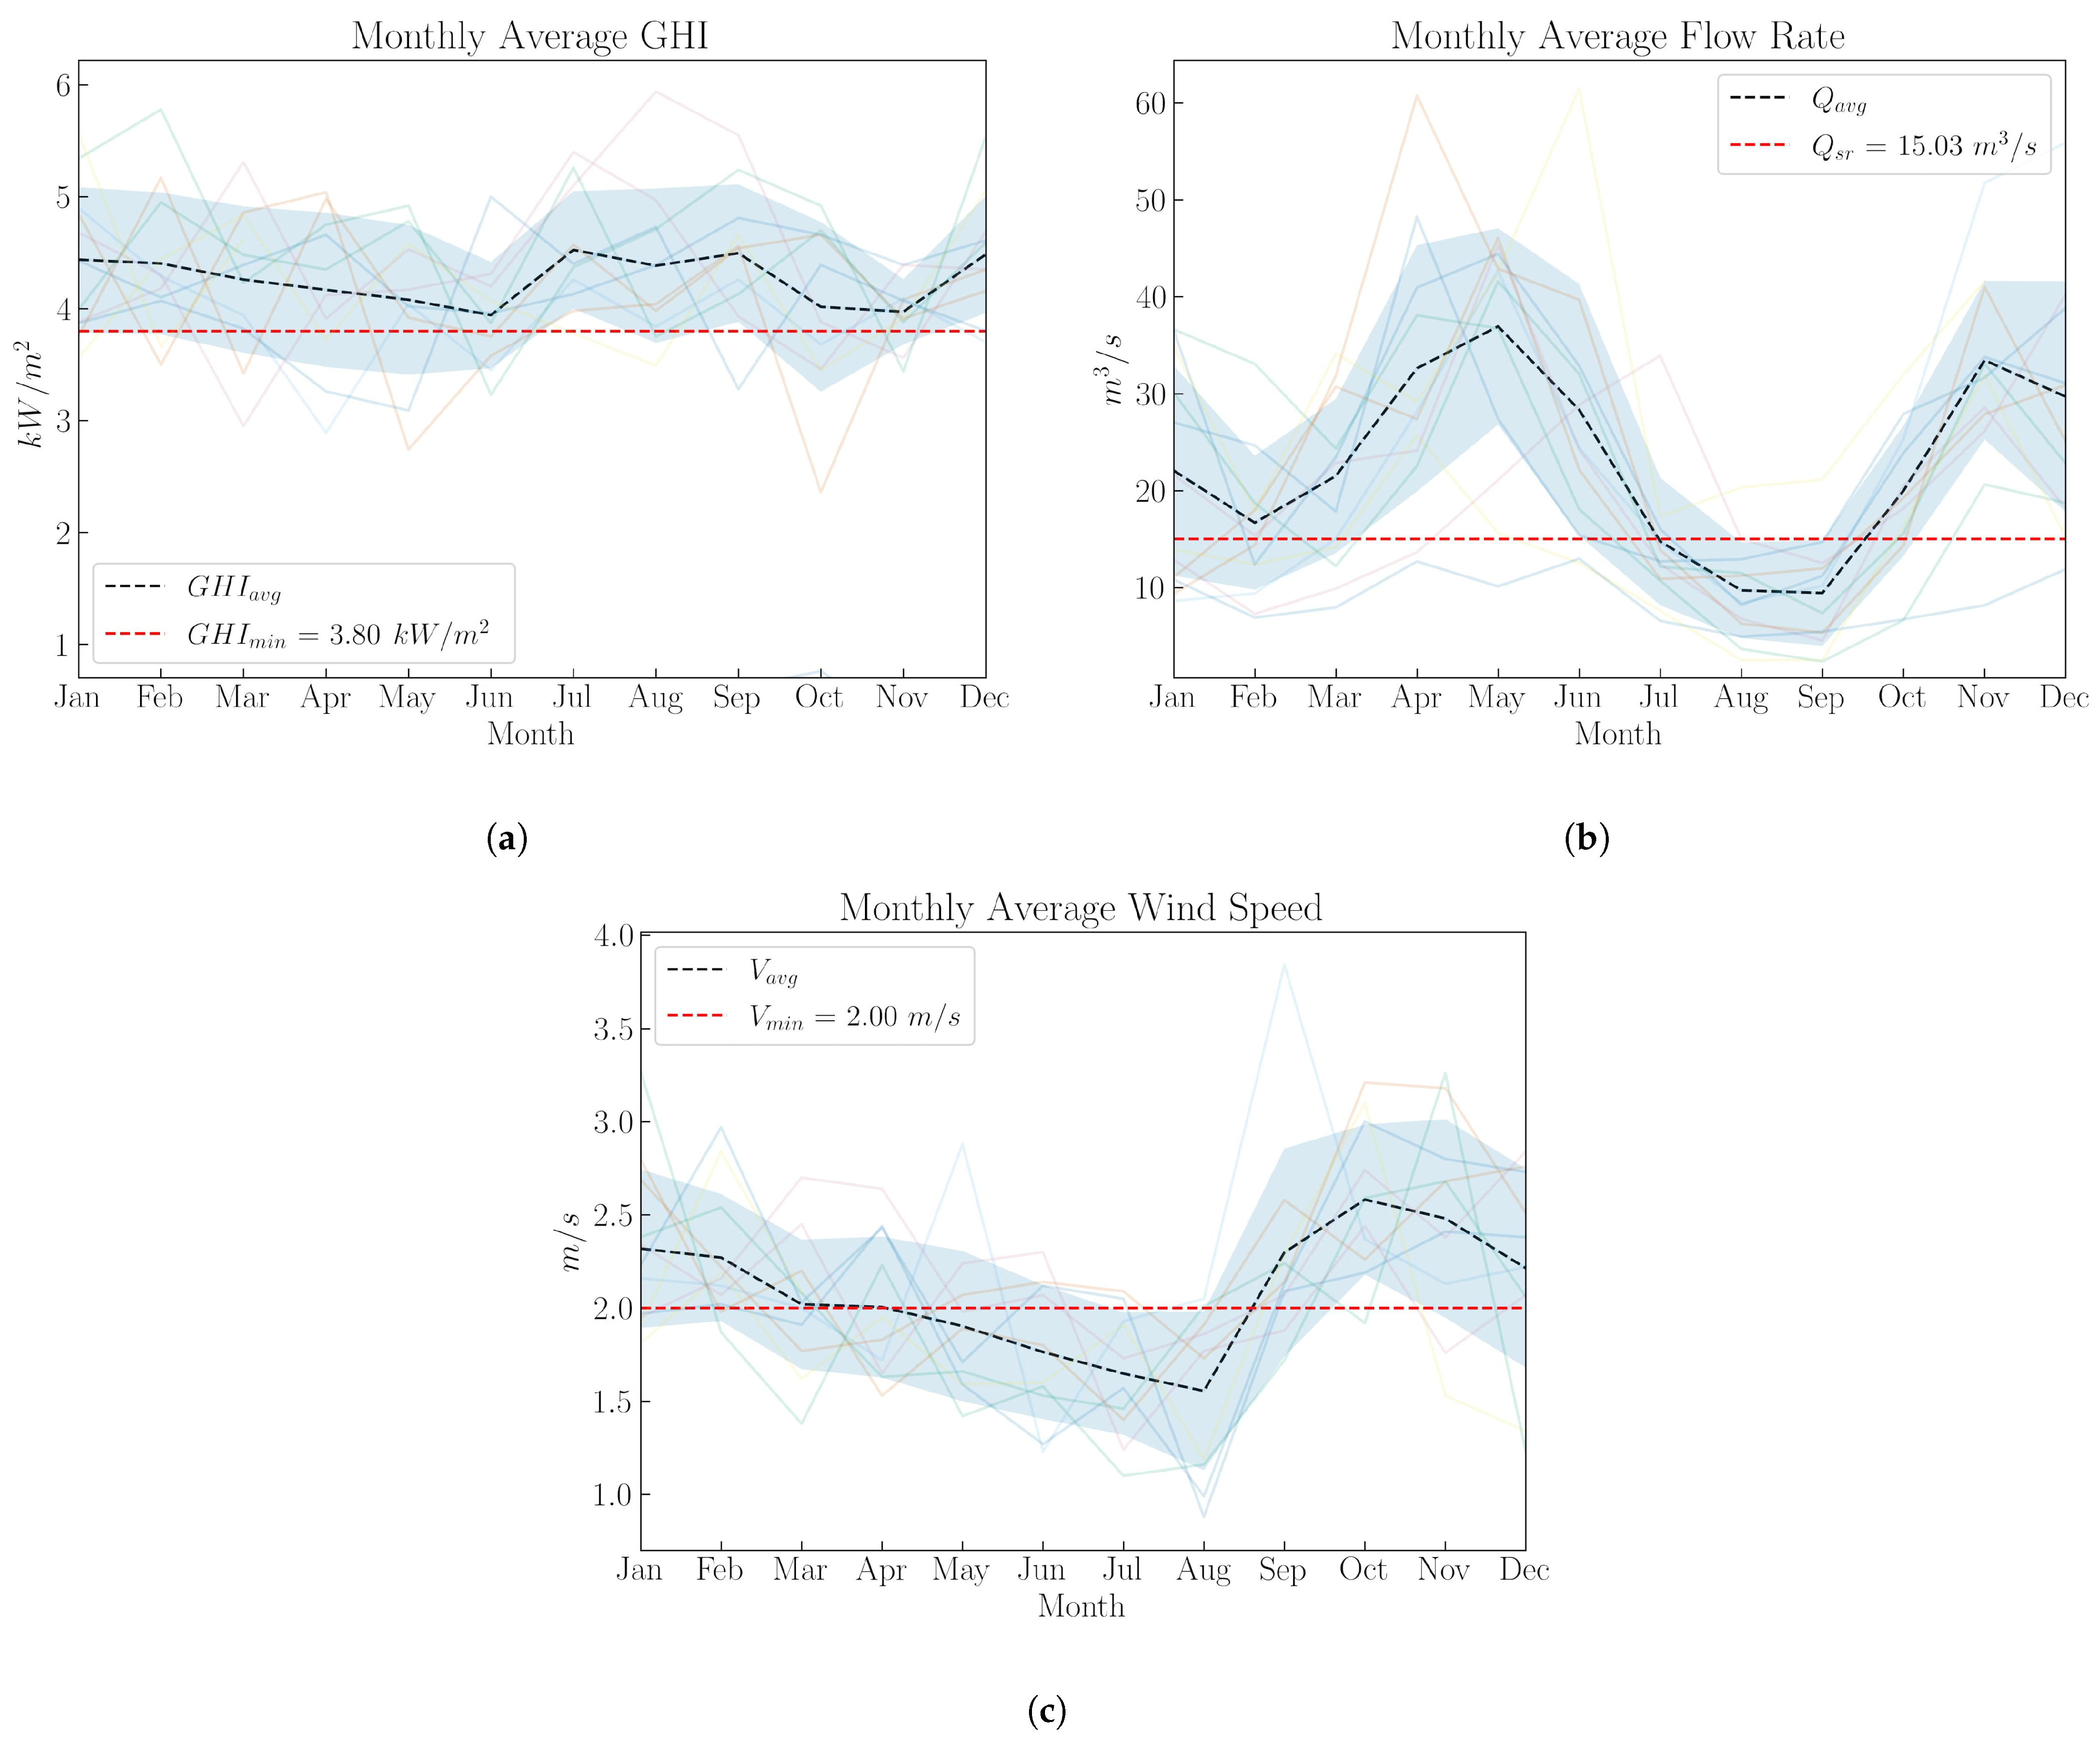
Historical irradiance, wind speed, and water flow data range from January 2011 to December 2021, with a daily frequency.
Figure 7 shows the average monthly behavior for each variable of the pre-feasibility analysis by resource, along with the dispersion in the measurements for the data window explored.
Biomass resource data were obtained from annual reports from the Colombian Agricultural Institute ICA [
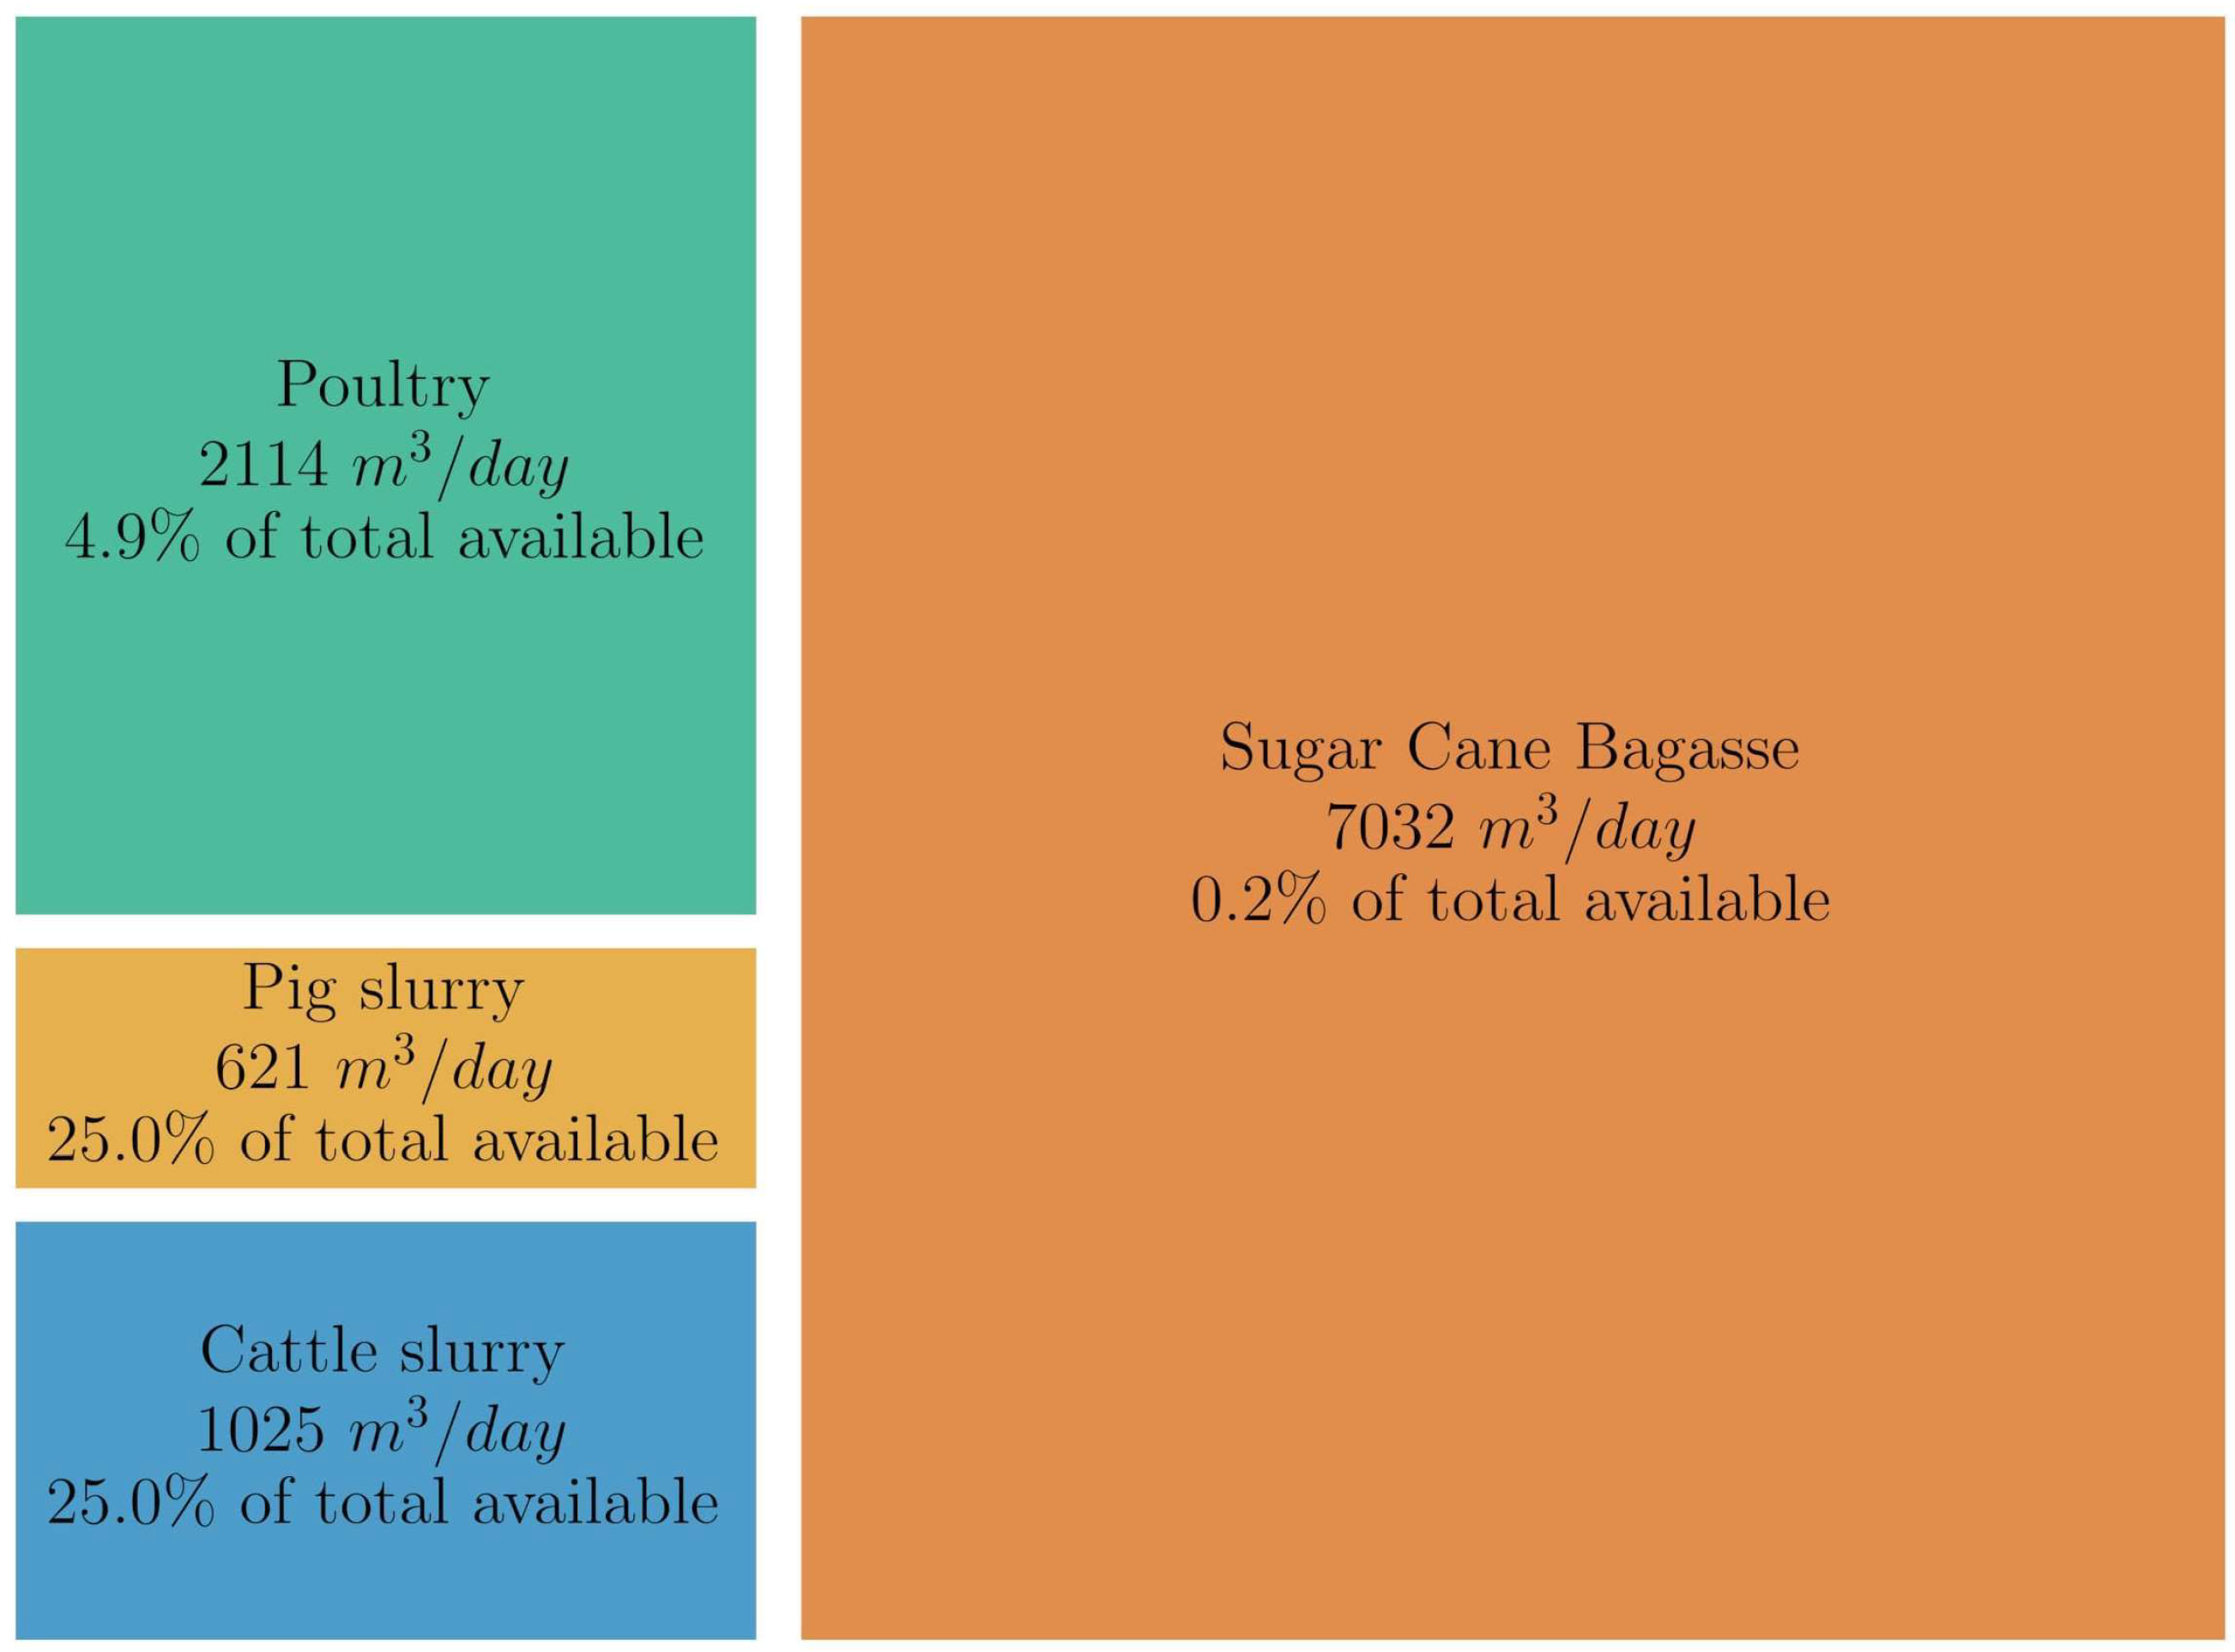
47] based on agricultural population (2022) and residual biomass figures for sugarcane cultivation (2018). Jamundí has a vast deployment of permanent sugarcane crops, reaching a cultivated area of 9207 ha and a daily average production of 14 tons of agricultural residual bagasse, considered in the resource availability analysis. Additionally, livestock resources are taken from data on the number of individuals associated with technical farms in this region.
Figure 8 includes the participation ratio in biogas generation from the available biomass resource, relative to the contribution of sugarcane bagasse and excrement from poultry, cattle, and pigs.
Subsequently, results shown in
Table 4 were obtained by evaluating the characteristic curve by resource and carrying out the feasibility study with the monthly average behavior per resource.
The theoretical pre-feasibility analysis found that the solar resource has minimum viability in exploring alternatives and, simultaneously, allows determining the exploitation regimes for the water and biomass resources. For SHP generation, the time series included a variability of 52.96% of the flow rate, leading to the selection of a conservative design flow of 2.3 m/s. The available biomass resource in Jamundí is analyzed based on a daily potential of of biogas according to waste availability. This represents approximately 0.03% utilization rate based on the reported net waste availability. On the other hand, the available wind resource is 42% lower than the recommended minimum. However, it was decided to include the resource to broaden the dynamics of alternative evaluation, developing a subsequent interpretation of the classification results.
4.3. Construction of Alternatives
The construction of alternatives to be evaluated is established based on participation percentages of 0%, 25%, 50%, and 100% of generation capacity per resource. According to the proposed configuration, the target capacity for renewable resources is set at 1000 kW. According to the proposed configuration, the target capacity for renewable resources is set at 1000 kW. This target capacity is taken from the maximum value of a small-scale self-generator, within the Colombian regulatory context, which is the basis of analysis for this case study. 23 alternatives involving solar, wind, water, and biomass generation resources are established, as presented in
Table 5.
Table 6 shows the weights per criterion and sub-criterion obtained through the opinions from a group of experts from the electricity sector, who participated in the assessment of importance between dimension and indicators. The weights were calculated for this case study using the pairwise comparison process under the established analysis framework.
In a preliminary analysis, according to the expert’s preference, it is found that the environmental and technical criteria share 85% of the importance. In turn, the indicators of emissions reduction and primary resource autonomy are the most important, with participation above 20% of the absolute weight each. For each of the alternatives, the set of indicators is evaluated considering the generation capacity associated with each resource, thus establishing the valuations for each criterion and per alternative that are input to the multi-criteria evaluation stage. The data for evaluating indicators are shown in
Table 7, values per resource are taken from the references included in
Table 3.
4.4. Hybrid FAHP-TOPSIS Multi-Criteria Analysis Method
The development of the analysis framework continues with the evaluation of alternatives.
Table 8 includes the normalized numerical representation for each criterion. Likewise, the color scale in the table shows the overall performance of the alternative for each sub-criterion, showing a transition from the positive ideal solution (green) to the negative ideal solution (red) according to the type of criterion (benefit or cost).
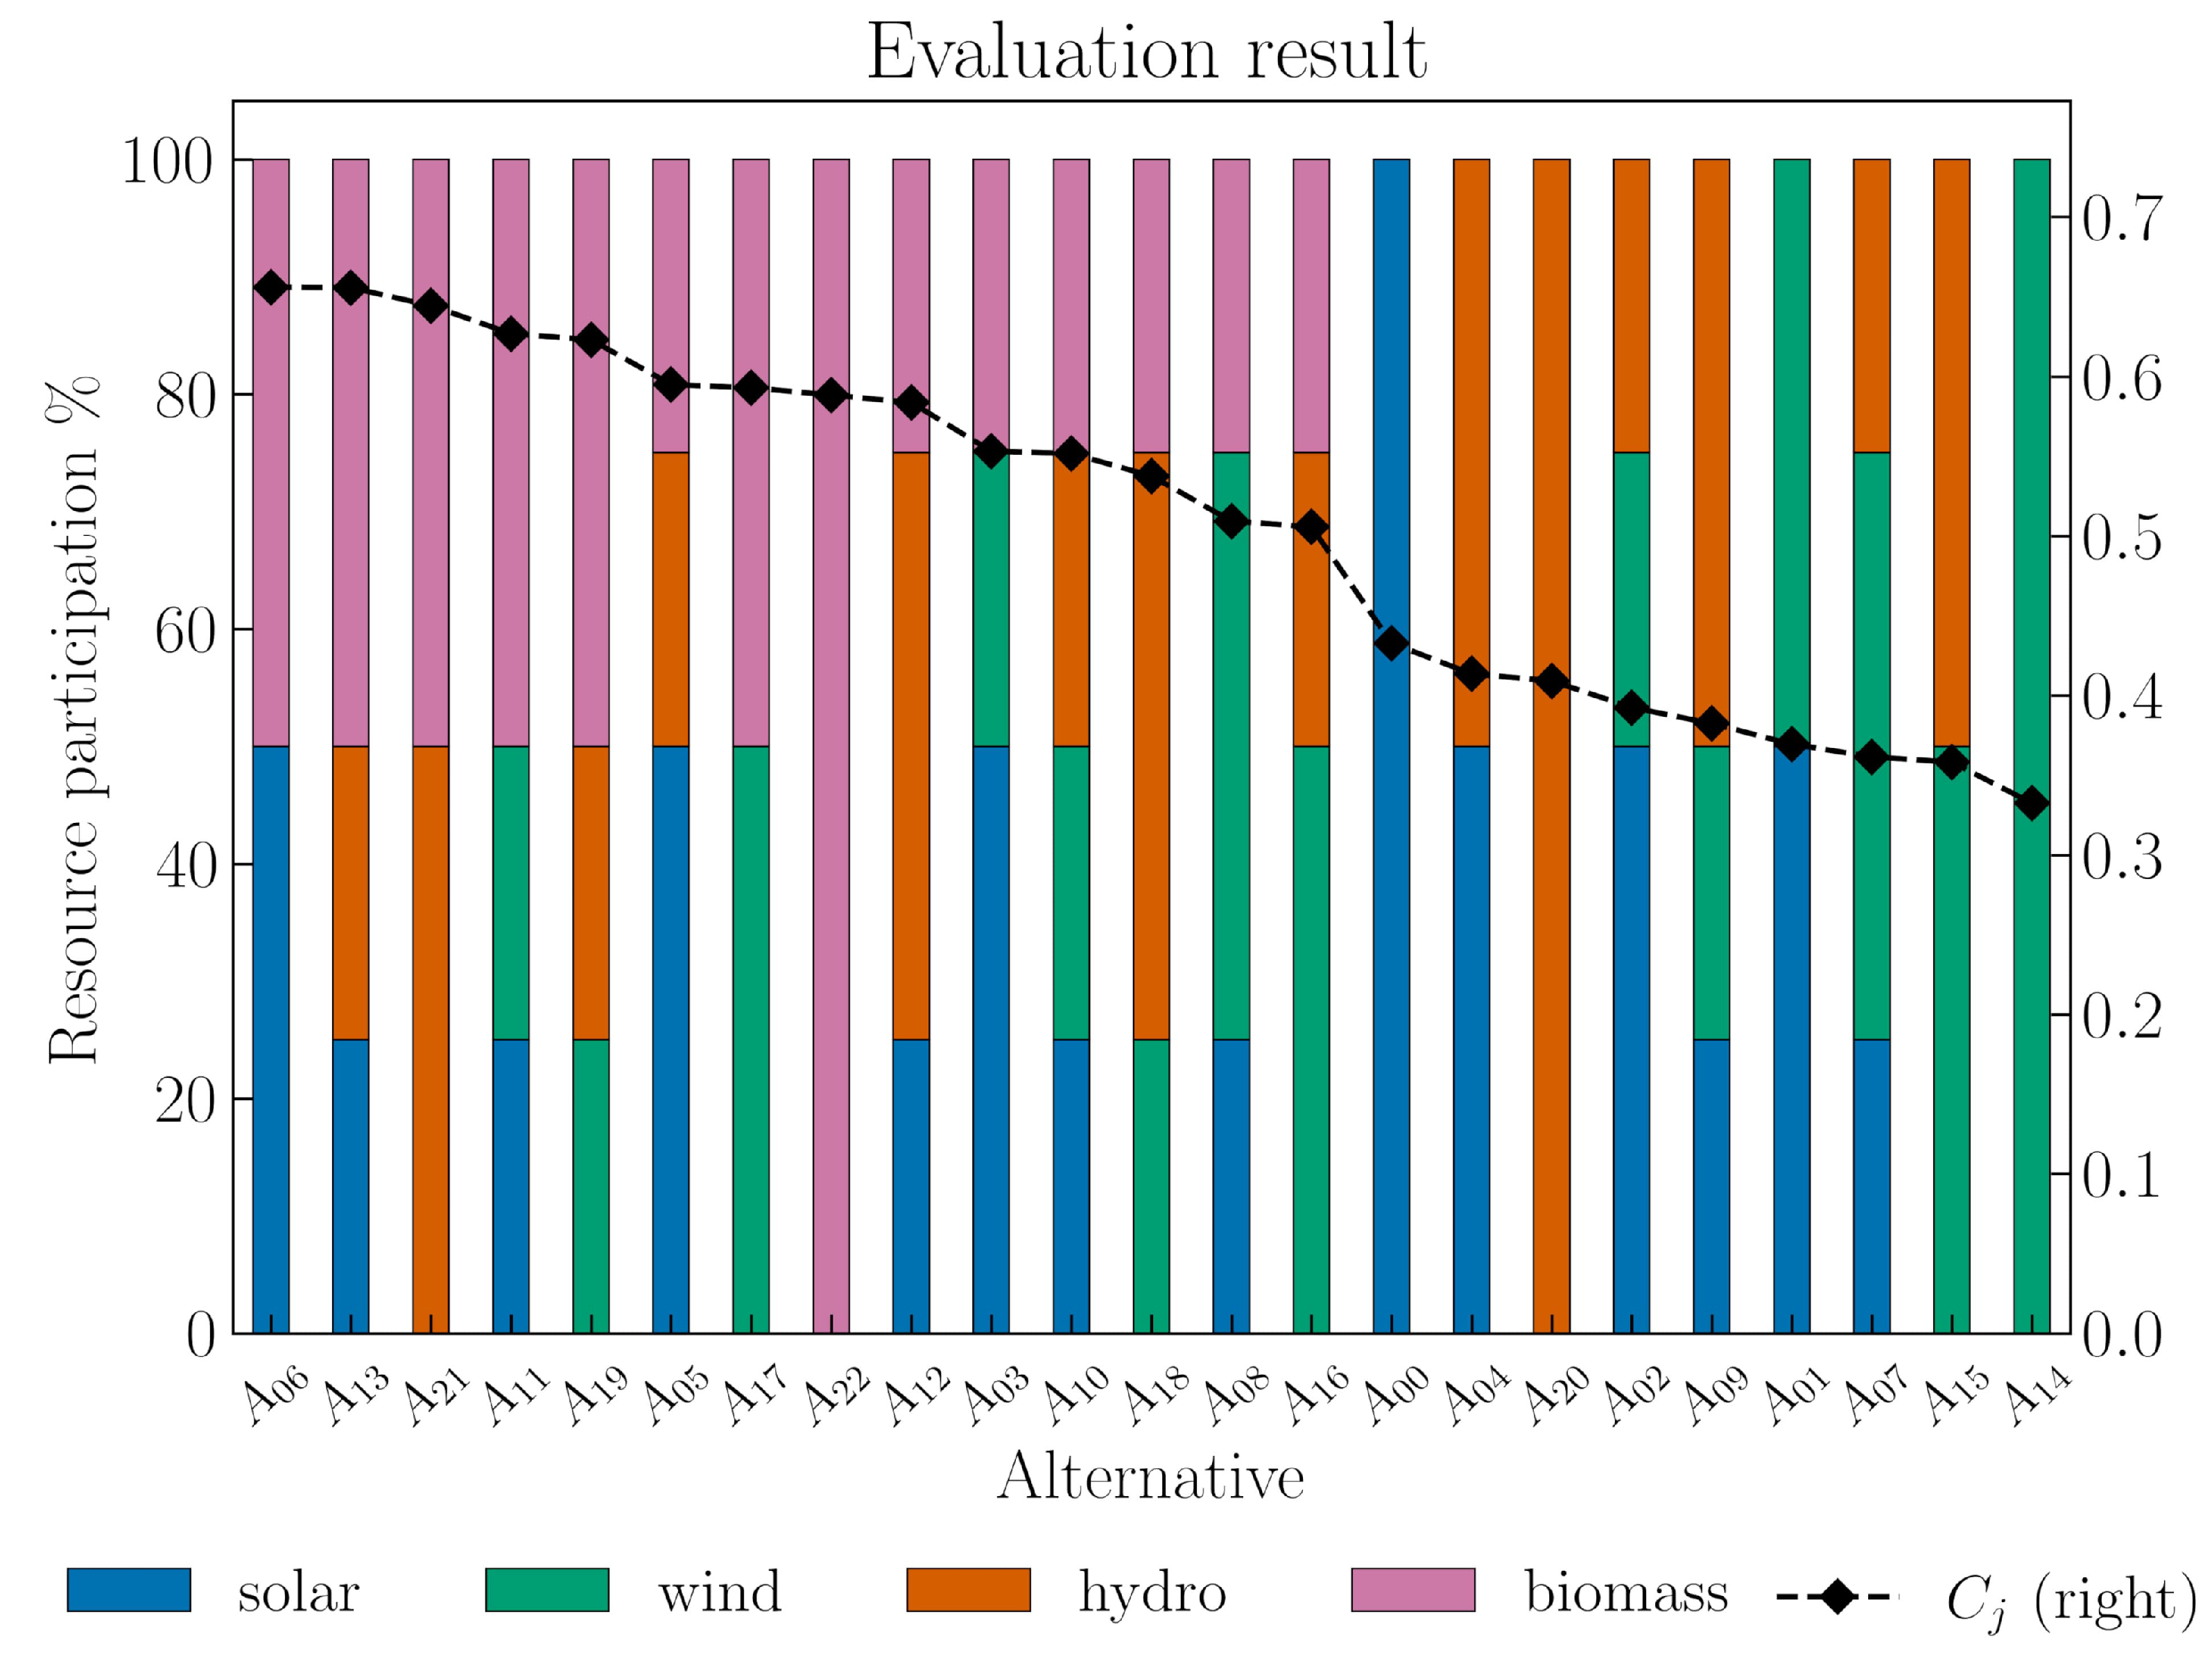
Figure 9 shows the descending order of alternatives according to the TOPSIS similarity coefficient, and the percentage of participation by resource in each alternative. According to the five best-ranked alternatives, a biomass share of 50% of the target generation capacity can be seen. Furthermore, the association between biomass, solar, and hydropower resources is the most recurrent within the top, with the alternative comprising 50% solar and 50% biomass obtaining a slight advantage. On the other hand, the worst-ranked alternative corresponds to 100% participation of wind, and according to the pre-feasibility evaluation, the poor performance of primary resource positioned it as the worst among the other alternatives.
The results of the case study obtained at each stage of the analysis framework highlight the potential of biomass compared to other primary resources for renewable energy generation. This alternative ranks eighth in the classification when not integrated with another resource (100% biomass), seven places above solar in the 15th position. Additionally, biomass accounted for 50% of the best-classified alternatives. It contributed to configurations with the best performance in terms of environmental and technical criteria, which are the most important according to experts’ opinions.
In Jamundí, the substantial availability of bagasse resulting from sugarcane monoculture represents an opportunity for electricity generation. With the sugarcane and panela industry producing approximately 14,000 tons of bagasse daily in this region, there is a chance to delve into this renewable energy generation avenue.
The still incipient development of biomass utilization models in the Colombian electricity sector should be approached with special attention. Recognizing that its practical implementation still requires overcoming the learning curve and technological adoption that enables its effective utilization, including transformation, storage, and final use processes. Especially in Valle del Cauca (including Jamundí), a significant portion of the knowledge regarding biomass resource utilization comes from the industrial productive sector, such as sugar mills, and their self-generation processes. Adapting processes already explored by the industrial sector and integrating them into a planning analysis for biomass exploitation will enable the expansion of resource potential utilization, offering the benefits outlined in accordance with the technical, economic, and environmental evaluation provided by the proposed framework.
The analysis of the wind resource initially showed poor performance regarding the adoption of this generation technology. However, conducting a more thorough review of the resource and including generation technologies that can operate within the available 2 m/s ranges in this area is not ruled out and would lead to a new analysis.
5. Conclusions
The proposed framework establishes a general model that can be adapted to various case study analyses. However, specific resources and criteria may be omitted or added based on the requirements and limitations of each pre-feasibility study. In each scenario, the identified alternatives should be presented to a group of experts and decision makers for them to choose the most suitable option according to their preferences and needs. This process, aligned with a practical development plan, may be the key to taking better advantage of the available resources. Moreover, as a differentiating element, the exploration of mixed resource alternatives is highlighted, incorporating the elements that stand out from each analyzed resource and presenting them as integrating alternatives.
The FAHP-TOPSIS method helps to evaluate renewable energy generation alternatives, allowing us to classify alternatives under compromise criteria and enabling decision makers to consider a wide range of factors and weigh them transparently and systematically.
In addition, including a prior stage of indicator selection allows the analysis method to be adapted to the requirements of each case study. Moreover, it supports stakeholders in constructing a suitable set of indicators based on relevance, applicability, and accessibility. Thus, generating flexibility in the application as an analysis tool.
Starting from a comprehensive analysis of national policies for the integration of renewable resources, it is precisely the contribution of this type of research that brings these national objectives of utilization and pre-feasibility analysis to a local perspective, substantiating the benefits and analysis with the potential of renewable resources.
In the context of the case study application, the framework serves as a systematic and flexible analysis tool for classifying renewable energy penetration alternatives. From a technical approach, the feasibility analysis provided in the first stage of the framework ensures the exploration of renewable generation technologies based on the characteristics of the resources available in the environment.
The framework shows that multi-criteria analysis methods are appropriate tools for addressing pre-feasibility analysis problems in renewable resource penetration from a sustainable standpoint and supporting decision-making in the energy sector according to stakeholders’ interests and needs. This framework guides future development in integrating generation technologies through a pre-feasibility analysis that allows obtaining the possible performance results based on the exploitation of clean resources and the transformation of the energy sector.
As future work and to improve the methodology, we are exploring the possibility of expanding the analysis through formal problem structuring models and the integration of social criteria, and risks to provide a comprehensive spectrum within the already evaluated sustainability for the development of renewable resources for generation.
Additionally, expanding the sources of information for quantifying indicators would allow decision makers to associate logistics, implementation, and operation processes in the exploitation of a renewable resource, providing a closer approximation of real benefits and accuracy in the classification of alternatives.
Regarding the analysis of theoretical pre-feasibility, we are considering examining the integration of new generation potential estimation models, as well as variables of interest such as precipitation, temperature, or electricity demand to enable a closer approximation to the actual potential obtained in potential development plans with these generation resources.
Author Contributions
Conceptualization, M.B.-Z., F.Z.-C. and E.C.-B.; methodology, M.B.-Z. and F.Z.-C.; software, M.B.-Z.; validation, M.B.-Z., F.Z.-C. and E.C.-B.; formal analysis, M.B.-Z. and F.Z.-C.; investigation, M.B.-Z. and F.Z.-C.; resources, M.B.-Z. and F.Z.-C.; data curation, M.B.-Z.; writing—original draft preparation, M.B.-Z.; writing—review and editing, M.B.-Z. and F.Z.-C.; visualization, M.B.-Z. and F.Z.-C.; supervision, F.Z.-C. and E.C.-B.; project administration, F.Z.-C. and E.C.-B.; funding acquisition, E.C.-B. All authors have read and agreed to the published version of the manuscript.
Funding
The authors gratefully acknowledge the financial support provided by the Colombia Scientific Program within the framework called Ecosistema Científico (Contract No. FP44842-218-2018).
Institutional Review Board Statement
Not applicable.
Informed Consent Statement
Not applicable.
Data Availability Statement
The data that support the findings of this study are available in Mendeley Data at
https://doi.org/10.17632/yfw8786fgz.1 (accessed on 11 July 2023). These data were derived from the following resources available in the public domain: ICA [
47], IDEAM [
45], and Nasa [
44]. Derived data supporting the findings of this study are available from the corresponding author M. Barrera-Zapata on request.
Acknowledgments
The authors would like to thank the Ministry of Science, Technology, and Innovation for providing research training to M. Barrera, with the funding of the project “Strategy for the management and use of energy efficiency indicators in the processes of generation, distribution and final use of energy in Colombia”, associated with the “Program for the efficient integration of electric energy from renewable sources to promote the country’s economic growth—INTEGRA2023” with code 111085271060 and contract 80740-774-2020. The authors gratefully acknowledge the financial support provided by the Colombia Scientific Program within the framework of the calls for proposals Ecosistema Científico (Contract No. FP44842- 218-2018), which provided research and training to F. Zuñiga.
Conflicts of Interest
The authors declare no conflict of interest.
References
- UN Development Programme. Goal 7: Affordable and Clean Energy Sustainable Development Goals; United Nations Development Programme: New York, NY, USA, 2015. [Google Scholar]
- Ministerio de minas y energía; UPME. Plan Energético Nacional 2020–2050; UPME: Bogotá, Colombia, 2020.
- International Energy Agency. World Energy Outlook 2022; International Energy Agency: Paris, France, 2022; p. 524. ISBN 0872625710. Available online: https://www.iea.org/reports/world-energy-outlook-2022/executive-summary (accessed on 28 April 2023).
- IRENA; CPI. Global Landscape of Renewable Energy Finance; International Renewable Energy Agency: Abu Dhabi, United Arab Emirates, 2023.
- IRENA. World Energy Transitions Outlook 2023: 1.5 °C Pathway; International Renewable Energy Agency: Abu Dhabi, United Arab Emirates, 2023.
- Strielkowski, W.; Civín, L.; Tarkhanova, E.; Tvaronavičienė, M.; Petrenko, Y. Renewable Energy in the Sustainable Development of Electrical Power Sector: A Review. Energies 2021, 14, 8240. [Google Scholar] [CrossRef]
- Cozma, A.; Moceleano Cuellar, L.M.; Botero Sánchez, V. Informe Anual de Avance en la Implementación de los ODS en Colombia; Technical Report; Departamento Nacional de Desarrollo: Bogotá, Colombia, 2022.
- Ilbahar, E.; Cebi, S.; Kahraman, C. A state-of-the-art review on multi-attribute renewable energy decision making. Energy Strategy Rev. 2019, 25, 18–33. [Google Scholar] [CrossRef]
- Marttunen, M.; Lienert, J.; Belton, V. Structuring problems for Multi-Criteria Decision Analysis in practice: A literature review of method combinations. Eur. J. Oper. Res. 2017, 263, 1–17. [Google Scholar] [CrossRef]
- García-Lillo, F.; Sánchez-García, E.; Marco-Lajara, B.; Seva-Larrosa, P. Renewable Energies and Sustainable Development: A Bibliometric Overview. Energies 2023, 16, 1211. [Google Scholar] [CrossRef]
- Qaiser, I. A comparison of renewable and sustainable energy sector of the South Asian countries: An application of SWOT methodology. Renew. Energy 2022, 181, 417–425. [Google Scholar] [CrossRef]
- Agyekum, E.B.; Amjad, F.; Mohsin, M.; Ansah, M.N.S. A bird’s eye view of Ghana’s renewable energy sector environment: A Multi-Criteria Decision-Making approach. Util. Policy 2021, 70, 101219. [Google Scholar] [CrossRef]
- Iacovidou, E.; Zorpas, A.A. Exploratory research on the adoption of composting for the management of biowaste in the Mediterranean island of Cyprus. Clean. Circ. Bioecon. 2022, 1, 100007. [Google Scholar] [CrossRef]
- Mostafaeipour, A.; Sadeghi Sedeh, A.; Chowdhury, S.; Techato, K. Ranking Potential Renewable Energy Systems to Power On-Farm Fertilizer Production. Sustainability 2020, 12, 7850. [Google Scholar] [CrossRef]
- Santoyo-Castelazo, E.; Azapagic, A. Sustainability assessment of energy systems: Integrating environmental, economic and social aspects. J. Clean. Prod. 2014, 80, 119–138. [Google Scholar] [CrossRef]
- Bhandari, R.; Arce, B.E.; Sessa, V.; Adamou, R. Sustainability Assessment of Electricity Generation in Niger Using a Weighted Multi-Criteria Decision Approach. Sustainability 2021, 13, 385. [Google Scholar] [CrossRef]
- Shaaban, M.; Scheffran, J.; Böhner, J.; Elsobki, M. Sustainability Assessment of Electricity Generation Technologies in Egypt Using Multi-Criteria Decision Analysis. Energies 2018, 11, 1117. [Google Scholar] [CrossRef]
- Maxim, A. Sustainability assessment of electricity generation technologies using weighted multi-criteria decision analysis. Energy Policy 2014, 65, 284–297. [Google Scholar] [CrossRef]
- Pavlović, B.; Ivezić, D.; Živković, M. A multi-criteria approach for assessing the potential of renewable energy sources for electricity generation: Case Serbia. Energy Rep. 2021, 7, 8624–8632. [Google Scholar] [CrossRef]
- Singh, S.; Upadhyay, S.P.; Powar, S. Developing an integrated social, economic, environmental, and technical analysis model for sustainable development using hybrid multi-criteria decision making methods. Appl. Energy 2022, 308, 118235. [Google Scholar] [CrossRef]
- Yilan, G.; Kadirgan, M.N.; Çiftçioğlu, G.A. Analysis of electricity generation options for sustainable energy decision making: The case of Turkey. Renew. Energy 2020, 146, 519–529. [Google Scholar] [CrossRef]
- Brand, B.; Missaoui, R. Multi-criteria analysis of electricity generation mix scenarios in Tunisia. Renew. Sustain. Energy Rev. 2014, 39, 251–261. [Google Scholar] [CrossRef]
- García Orrego, S. Análisis Espacial Multicriterio para la Ubicación de Parques Eólicos y Granjas Solares en Colombia. Master’s Thesis, Universidad Nacional de Colombia, Bogotá, Colombia, 2021. [Google Scholar]
- Ministerio de Industria Energía y Turismo. Evaluación del potencial de las fuentes de energía renovables. In Informe de Sostenibilidad Ambiental del Plan de Energías Renovables 2011–2020; Technical Report; Ministerio de Industria Energía y Turismo: Madrid, Spain, 2011. [Google Scholar]
- Pacheco Garzón, N.H.; Torres Quintero, J.E. Prefactibilidad de una pequeña central hidroeléctrica en el Embalse del Sisga, Cundinamarca, Colombia. Rev. Mutis 2021, 11, 84–95. [Google Scholar] [CrossRef]
- Varnero Moreno, M.T. Manual del Biogás, 1st ed.; Project CHI/00/G32; Food and Agriculture Organization of the United Nations (FAO): Santiago, Chile, 2011; ISSN 08628408. [Google Scholar]
- Qazi, S. Solar Thermal Electricity and Solar Insolation. In Standalone Photovoltaic (PV) Systems for Disaster Relief and Remote Areas; Elsevier: Amsterdam, The Netherlands, 2017; pp. 203–237. [Google Scholar] [CrossRef]
- Messenger, R.A.; Abtahi, A. Photovoltaic Systems Engineering, 4th ed.; CRC Press, Taylor & Francis Group: Boca Raton, FL, USA; London, UK; New York, NY, USA, 2017. [Google Scholar] [CrossRef]
- Ministerio de minas y energia; UPME; Pontificia Universidad Javeriana. Atlas del Potencial Hidroenergético de Colombia 2015, 1st ed.; UPME: Bogotá, Colombia, 2015.
- IDEAM. Guía Metodológica Estimación Caudal Ambiental; Subdirección de hidrología; Ministerio de Ambiente y Desarrollo Sostenible: Bogotá, Colombia, 2017.
- Ministerio de minas y Energia; UPME. Modelos matemáticos para evaluar el potencial energético de la biomasa residual. In Atlas de Potencial Energético de la Biomasa Residual en Colombia, 1st ed.; Ediciones Universidad Industrial de Santander: Bucaramanga, Colombia, 2010; pp. 150–154. [Google Scholar]
- Scarlat, N.; Dallemand, J.F.; Fahl, F. Biogas: Developments and perspectives in Europe. Renew. Energy 2018, 129, 457–472. [Google Scholar] [CrossRef]
- Thakur, N.; Salama, E.S.; Sharma, M.; Sharma, P.; Sharma, D.; Li, X. Efficient utilization and management of seaweed biomass for biogas production. Mater. Today Sustain. 2022, 18, 100120. [Google Scholar] [CrossRef]
- Yaqoob, H.; Teoh, Y.H.; Ud Din, Z.; Sabah, N.U.; Jamil, M.A.; Mujtaba, M.; Abid, A. The potential of sustainable biogas production from biomass waste for power generation in Pakistan. J. Clean. Prod. 2021, 307, 127250. [Google Scholar] [CrossRef]
- Rovere, E.L.L.; Soares, J.B.; Oliveira, L.B.; Lauria, T. Sustainable expansion of electricity sector: Sustainability indicators as an instrument to support decision making. Renew. Sustain. Energy Rev. 2010, 14, 422–429. [Google Scholar] [CrossRef]
- Pramangioulis, D.; Atsonios, K.; Nikolopoulos, N.; Rakopoulos, D.; Grammelis, P.; Kakaras, E. A methodology for determination and definition of key performance indicators for smart grids development in island energy systems. Energies 2019, 12, 242. [Google Scholar] [CrossRef]
- UPME. Integración de las Energías Renovables no Convencionales en Colombia; Unidad de Planeación Minero Energética: Bogotá, Colombia, 2015.
- Pérez-Denicia, E.; Fernández-Luqueño, F.; Vilariño-Ayala, D. Suitability assessment for electricity generation through renewable sources: Towards sustainable energy production. CT F Cienc. Tecnol. Futuro 2021, 11, 109–122. [Google Scholar] [CrossRef]
- Ogrodnik, K. Multi-Criteria Analysis of Design Solutions in Architecture and Engineering: Review of Applications and a Case Study. Buildings 2019, 9, 244. [Google Scholar] [CrossRef]
- Saaty, T.L. Relative measurement and its generalization in decision making why pairwise comparisons are central in mathematics for the measurement of intangible factors the analytic hierarchy/network process. Rev. Real Acad. Cienc. Exactas Fis. Nat. Ser. A Mat. 2008, 102, 251–318. [Google Scholar] [CrossRef]
- Solangi, Y.A.; Tan, Q.; Mirjat, N.H.; Ali, S. Evaluating the strategies for sustainable energy planning in Pakistan: An integrated SWOT-AHP and Fuzzy-TOPSIS approach. J. Clean. Prod. 2019, 236, 117655. [Google Scholar] [CrossRef]
- Hwang, C.L.; Yoon, K. Methods for Multiple Attribute Decision Making. In Multiple Attribute Decision Making; Beckmann, M., Künzi, H.P., Eds.; Springer: Berlin/Heidelberg, Germany, 1981; Volume 186, pp. 58–191. [Google Scholar] [CrossRef]
- Şengül, X.; Eren, M.; Eslamian Shiraz, S.; Gezder, V.; Şengül, A.B. Fuzzy TOPSIS method for ranking renewable energy supply systems in Turkey. Renew. Energy 2015, 75, 617–625. [Google Scholar] [CrossRef]
- NASA. NASA Power|Prediction of Worldwide Energy Resources; The POWER ProjecT; NASA: Washington, DC, USA, 2020.
- IDEAM. Sistema de Información Para la Gestión de Datos de Hidrología y Meteorología—DHIME; IDEAM: Bogotá, Colombia, 2020.
- Esri; IGAC, I.g.A.C. Mapa Valle del Cauca. [Web Map]. Scale Not Given. 2021. Available online: https://www.arcgis.com/apps/mapviewer/index.html?layers=e4ccda1301ca4cc78990be657ae83825 (accessed on 13 May 2023).
- Instituto Colombiano Agropecuario. Censo Pecuarios Nacional; Instituto Colombiano Agropecuario: Bogotá, Colombia, 2020; Volume 785, p. 65.
| Disclaimer/Publisher’s Note: The statements, opinions and data contained in all publications are solely those of the individual author(s) and contributor(s) and not of MDPI and/or the editor(s). MDPI and/or the editor(s) disclaim responsibility for any injury to people or property resulting from any ideas, methods, instructions or products referred to in the content. |
© 2023 by the authors. Licensee MDPI, Basel, Switzerland. This article is an open access article distributed under the terms and conditions of the Creative Commons Attribution (CC BY) license (https://creativecommons.org/licenses/by/4.0/).


