
Dataset of Fluorescence EEM and UV Spectroscopy Data of Olive Oils during Ageing

1
Institute of Applied Mathematics and Physics, Zurich University of Applied Sciences, 8401 Winterthur, Switzerland
2
Artificial Intelligence Research and Development, TOELT LLC, 8600 Dübendorf, Switzerland
*
Author to whom correspondence should be addressed.
Data 2023, 8(5), 81; https://doi.org/10.3390/data8050081
Submission received: 14 March 2023
/
Revised: 21 April 2023
/
Accepted: 26 April 2023
/
Published: 29 April 2023
Abstract
:The dataset presented in this study encompasses fluorescence excitation–emission matrices (EEMs) and UV-spectroscopy data of 24 extra virgin olive oils (EVOOs) commercially available at supermarkets in Switzerland. To investigate the effect of thermal degradation, the samples were exposed to accelerated ageing at 60 C up to 53 days. EEMs and UV absorption parameters were measured in 10 ageing steps. The dataset can be used, for example, to predict one or multiple chemical parameters or to classify samples based on their quality from fluorescence spectra.
Dataset: https://doi.org/10.17632/g6y69g8gwm.1.
Dataset License: CC BY 4.0.
1. Summary
This dataset contains total fluorescence spectroscopy data (excitation–emission matrices EEMs) and UV spectroscopy absorption data of 24 commercial extra virgin olive oils (EVOO), fresh and at different stages of ageing. To investigate the effect of long-time storage, the samples were exposed to accelerated ageing at 60 C. The effect of thermal degradation was investigated at ten different times, from fresh to 53 days of thermal treatment. At 10 different ageing steps, the fluorescence emission and the UV absorption were measured to monitor the evolution of spectral properties, which can then be related to the chemical properties of the samples [1,2,3,4,5]. The structure of the data provided is described in Section 2. The sample preparation and ageing methods are described in Section 3.1 and Section 3.2, respectively.
2. Data Description
This dataset contains 240 UV-spectroscopy absorption measurements at four wavelengths and 720 total fluorescence spectroscopy excitation–emission matrices (EEMs) of different commercial extra virgin olive oils (EVOOs), fresh and at nine different stages of ageing. The data are provided raw; for data combined in a data frame for easier analysis in Python, please contact the authors. Data are organised into 10 folders, one for each of the 10 ageing steps, labelled “Ageing Step x”, with x going from 0 to 9. Each “Ageing step” folder contains two sub-folders labelled “Fluorescence” and “Absorptions” containing the respective data [6].
2.1. Fluorescence Spectroscopy Data
The raw fluorescence spectroscopy EEM data are CSV files containing the fluorescence intensity at different excitation and emission wavelengths. Each EEM contains fluorescence data for 35 excitation wavelengths (from 300 nm to 640 nm in steps of 10 nm) and 251 emission wavelengths (from 300 nm to 800 nm in steps of 2 nm). Fluorescence intensities range from 0 to 1000 counts. Negative values are due to noise in the measurement and do not have physical meaning. The intensity appearing in the data at an emission wavelength identical to the excitation wavelength is caused by Rayleigh scattering. These intensities were not removed from the raw data.
Each file contains the measurement of four samples (four EEMs). The filename contains the measurement datum (yyyymmdd, with yyyy the year in the four-digit format as 2021, mm the month in format 01–12 and dd the day in format 01–31), the measurement time (hhmm, with hh the hours in 24-h format and mm the minutes in numerical format), the ageing step (ASx, with x an integer ranging from 0 to 9) and four identifiers for the samples that are composed of 2 alphanumeric characters, one indicating the oil ID and the second indicating the sample (0, 1 or 2). The labels used for the oils are described in Table 1 and Section 3.1. For example, the file 20210519_0750_AS1_C2A1V2X0 was acquired on the 19th of May 2021 at 7:50 AM, and contains the fluorescence data at the ageing step 1 of the four samples C2, A1, V2, X0.
The files are structured as follows: line 1 contains the header for the description of the column (for example, “C2_EX_300.00” indicates that the column contains the fluorescence of sample C2 excited at 300 nm); line 2 indicates what the data of the column are (either “Wavelength (nm)” for the emission wavelength or “Intensity (a.u.)” for the fluorescence emission); line 254 is empty. All the lines after 254 contain the log of the measurement automatically produced by the instrument and can be disregarded.
2.2. UV Spectroscopy Data
The raw UV spectroscopy data are CSV files containing the acquisition details and the UV absorption values at four wavelengths: 232 nm, 264 nm, 268 nm, and 272 nm. The selected wavelengths are used for the quality assessment of olive oil according to EU regulations [7,8]. The absorption at 232 nm and 268 nm corresponds to the parameters and , respectively. The absorption values at 264 nm and 272 nm are used to determine the parameter according to the formula
Each file contains the absorbance measurement at the four wavelengths for six samples. The filename contains the measurement datum (yyyymmdd, with yyyy the year in the four-digit format as 2021, mm the month in format 01-12, and dd the day in format 01-31), the measurement time (hhmm, with hh the hours in 24-hour format and mm the minutes in numerical format), the ageing step (ASx, with x an integer ranging from 0 to 9) and six identifiers for the samples that are composed of two alphanumeric characters, one indicating the oil ID and the second indicating the sample (0, 1 or 2). The label used for the oils are described in Table 1 and Section 3.1. For example, the file 20210519_0940_AS1_W2C2S1A1V2U2 was acquired on the 19th of May 2021 at 9:40, and contains the UV spectroscopy data at the ageing step 1 of the samples W2, C2, S1, A1, V2, U2.
The files are structured as follows: lines 1 through 31 contain general information about the measurement, such as, for example, the instrument settings; line 32 describes the column names; lines 34 through 39 contain the absorbance of the six samples at wavelengths 232 nm, 264 nm, 260 nm, and 272 nm.
3. Materials and Methods
3.1. Olive Oil Samples
In this study, a total of 720 samples were prepared and measured. The samples were prepared from 24 different EVOO commercially available at Migros (Zürich, Switzerland) and Coop (Basel, Switzerland) supermarkets. The oils were chosen to be as variable as possible in both price and origin of production. The oils were labelled with a letter, “A” to “X”. Extra virgin olive oils and their characteristics are reported in Table 1.
For each of the 24 EVOOs, a total of 30 identical samples were prepared by pipetting the oil from the bottle into 4 mL vials. All samples were prepared at the same time, immediately after opening the new bottle. The vials were filled to the top to minimise the amount of oxygen in the vials and hermetically closed. The reason for preparing 30 samples of each oil was to have 3 identical samples for each of the 10 ageing steps to be measured. The overview of the sample preparation is shown in Table 2.
To avoid errors during measurements, each sample was labelled with an adhesive label on the vials. The ID of the sample is a combination of the letter labelling the oil (see Table 1), differentiating the three identical samples (0, 1 or 2), and the step at which it should be aged (AS0 to AS9). For example, B1AS7 is the second sample of oil B aged till step 7 (36 days, see Table 3).
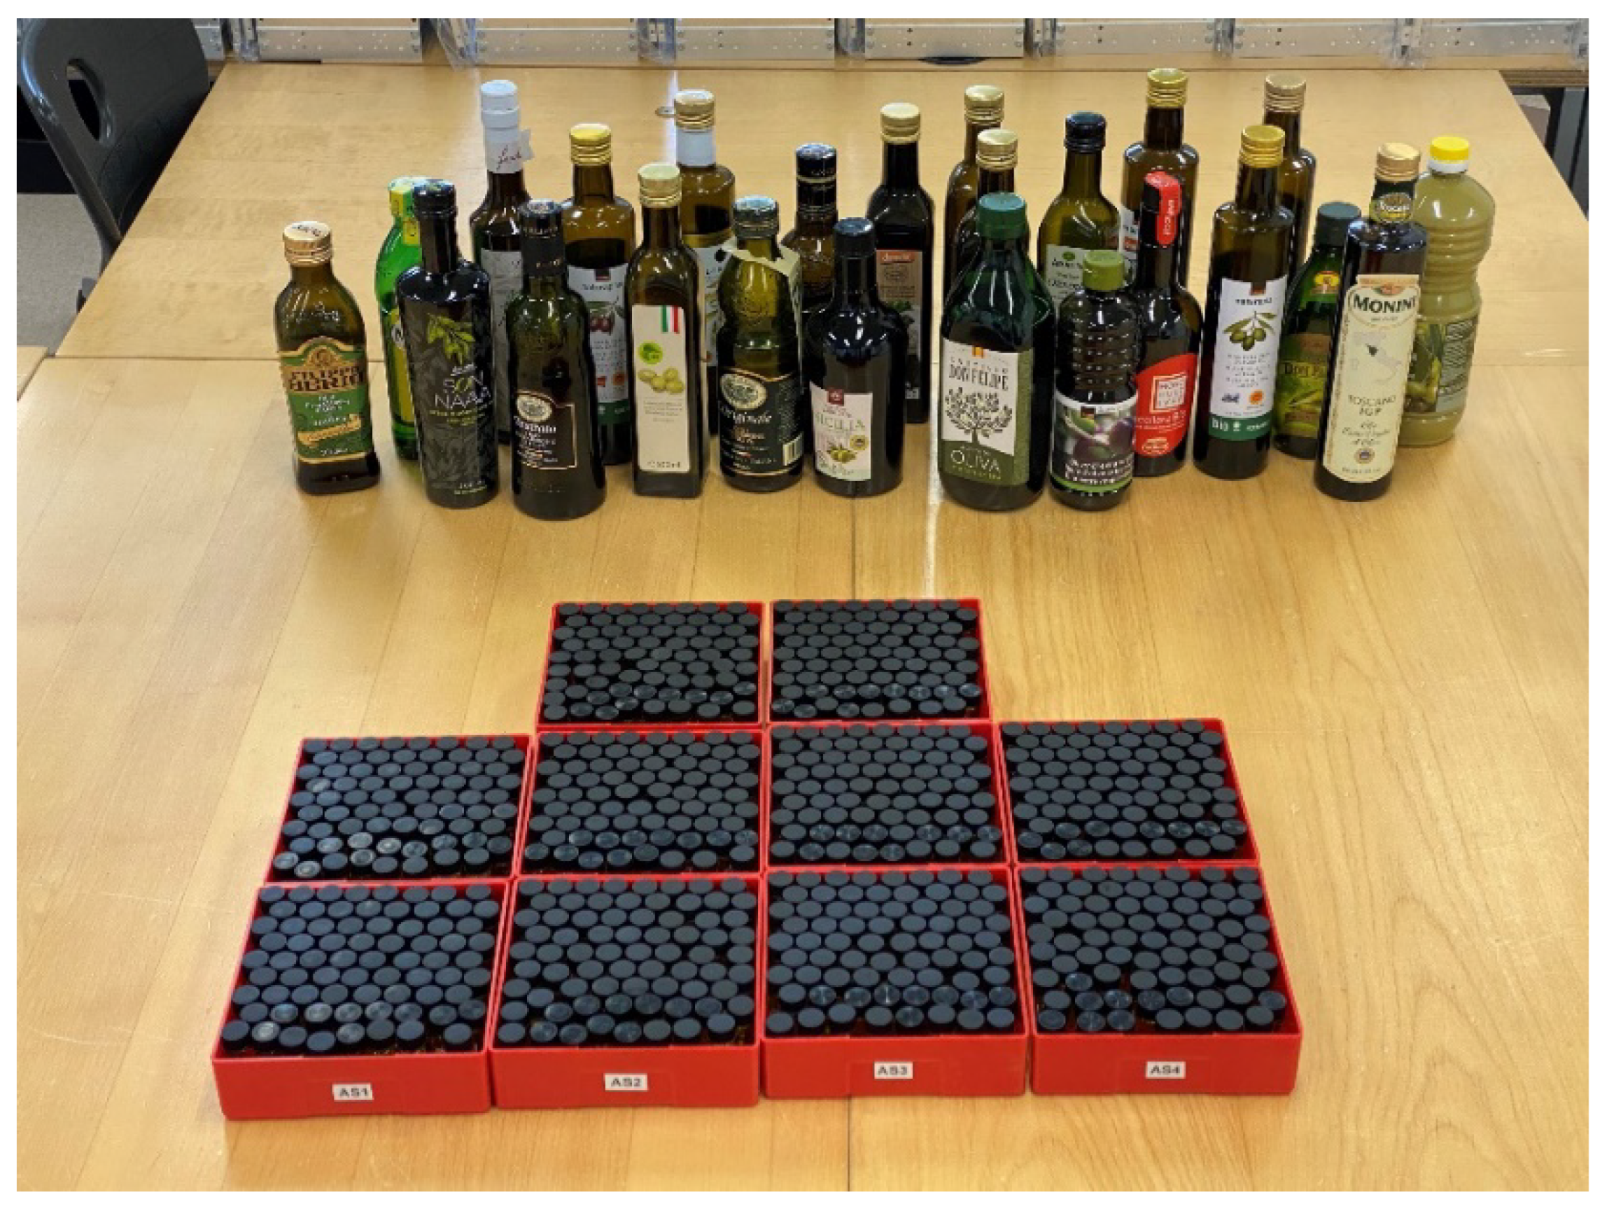
The 720 samples were divided into 10 batches of 72 samples, each batch corresponding to an ageing step, as shown in Figure 1. All samples were placed in the oven at the same time (except for the samples for the fresh oil measurements). At each ageing step a batch of 72 samples was removed and measured. This allowed identical ageing conditions for all samples.
3.2. Ageing
The 720 sealed samples were placed in the oven at the same time, except those corresponding to fresh samples (AS0). At each ageing step, 72 samples (3 identical samples × 24 oils) were taken out of the oven and measured after thermalization. The ageing was performed at 60 C and in darkness. This temperature corresponds to accelerated ageing conditions [9]. The list of ageing steps and the corresponding ageing time are reported in Table 3.
3.3. Fluorescence Spectroscopy: Apparatus and Procedure
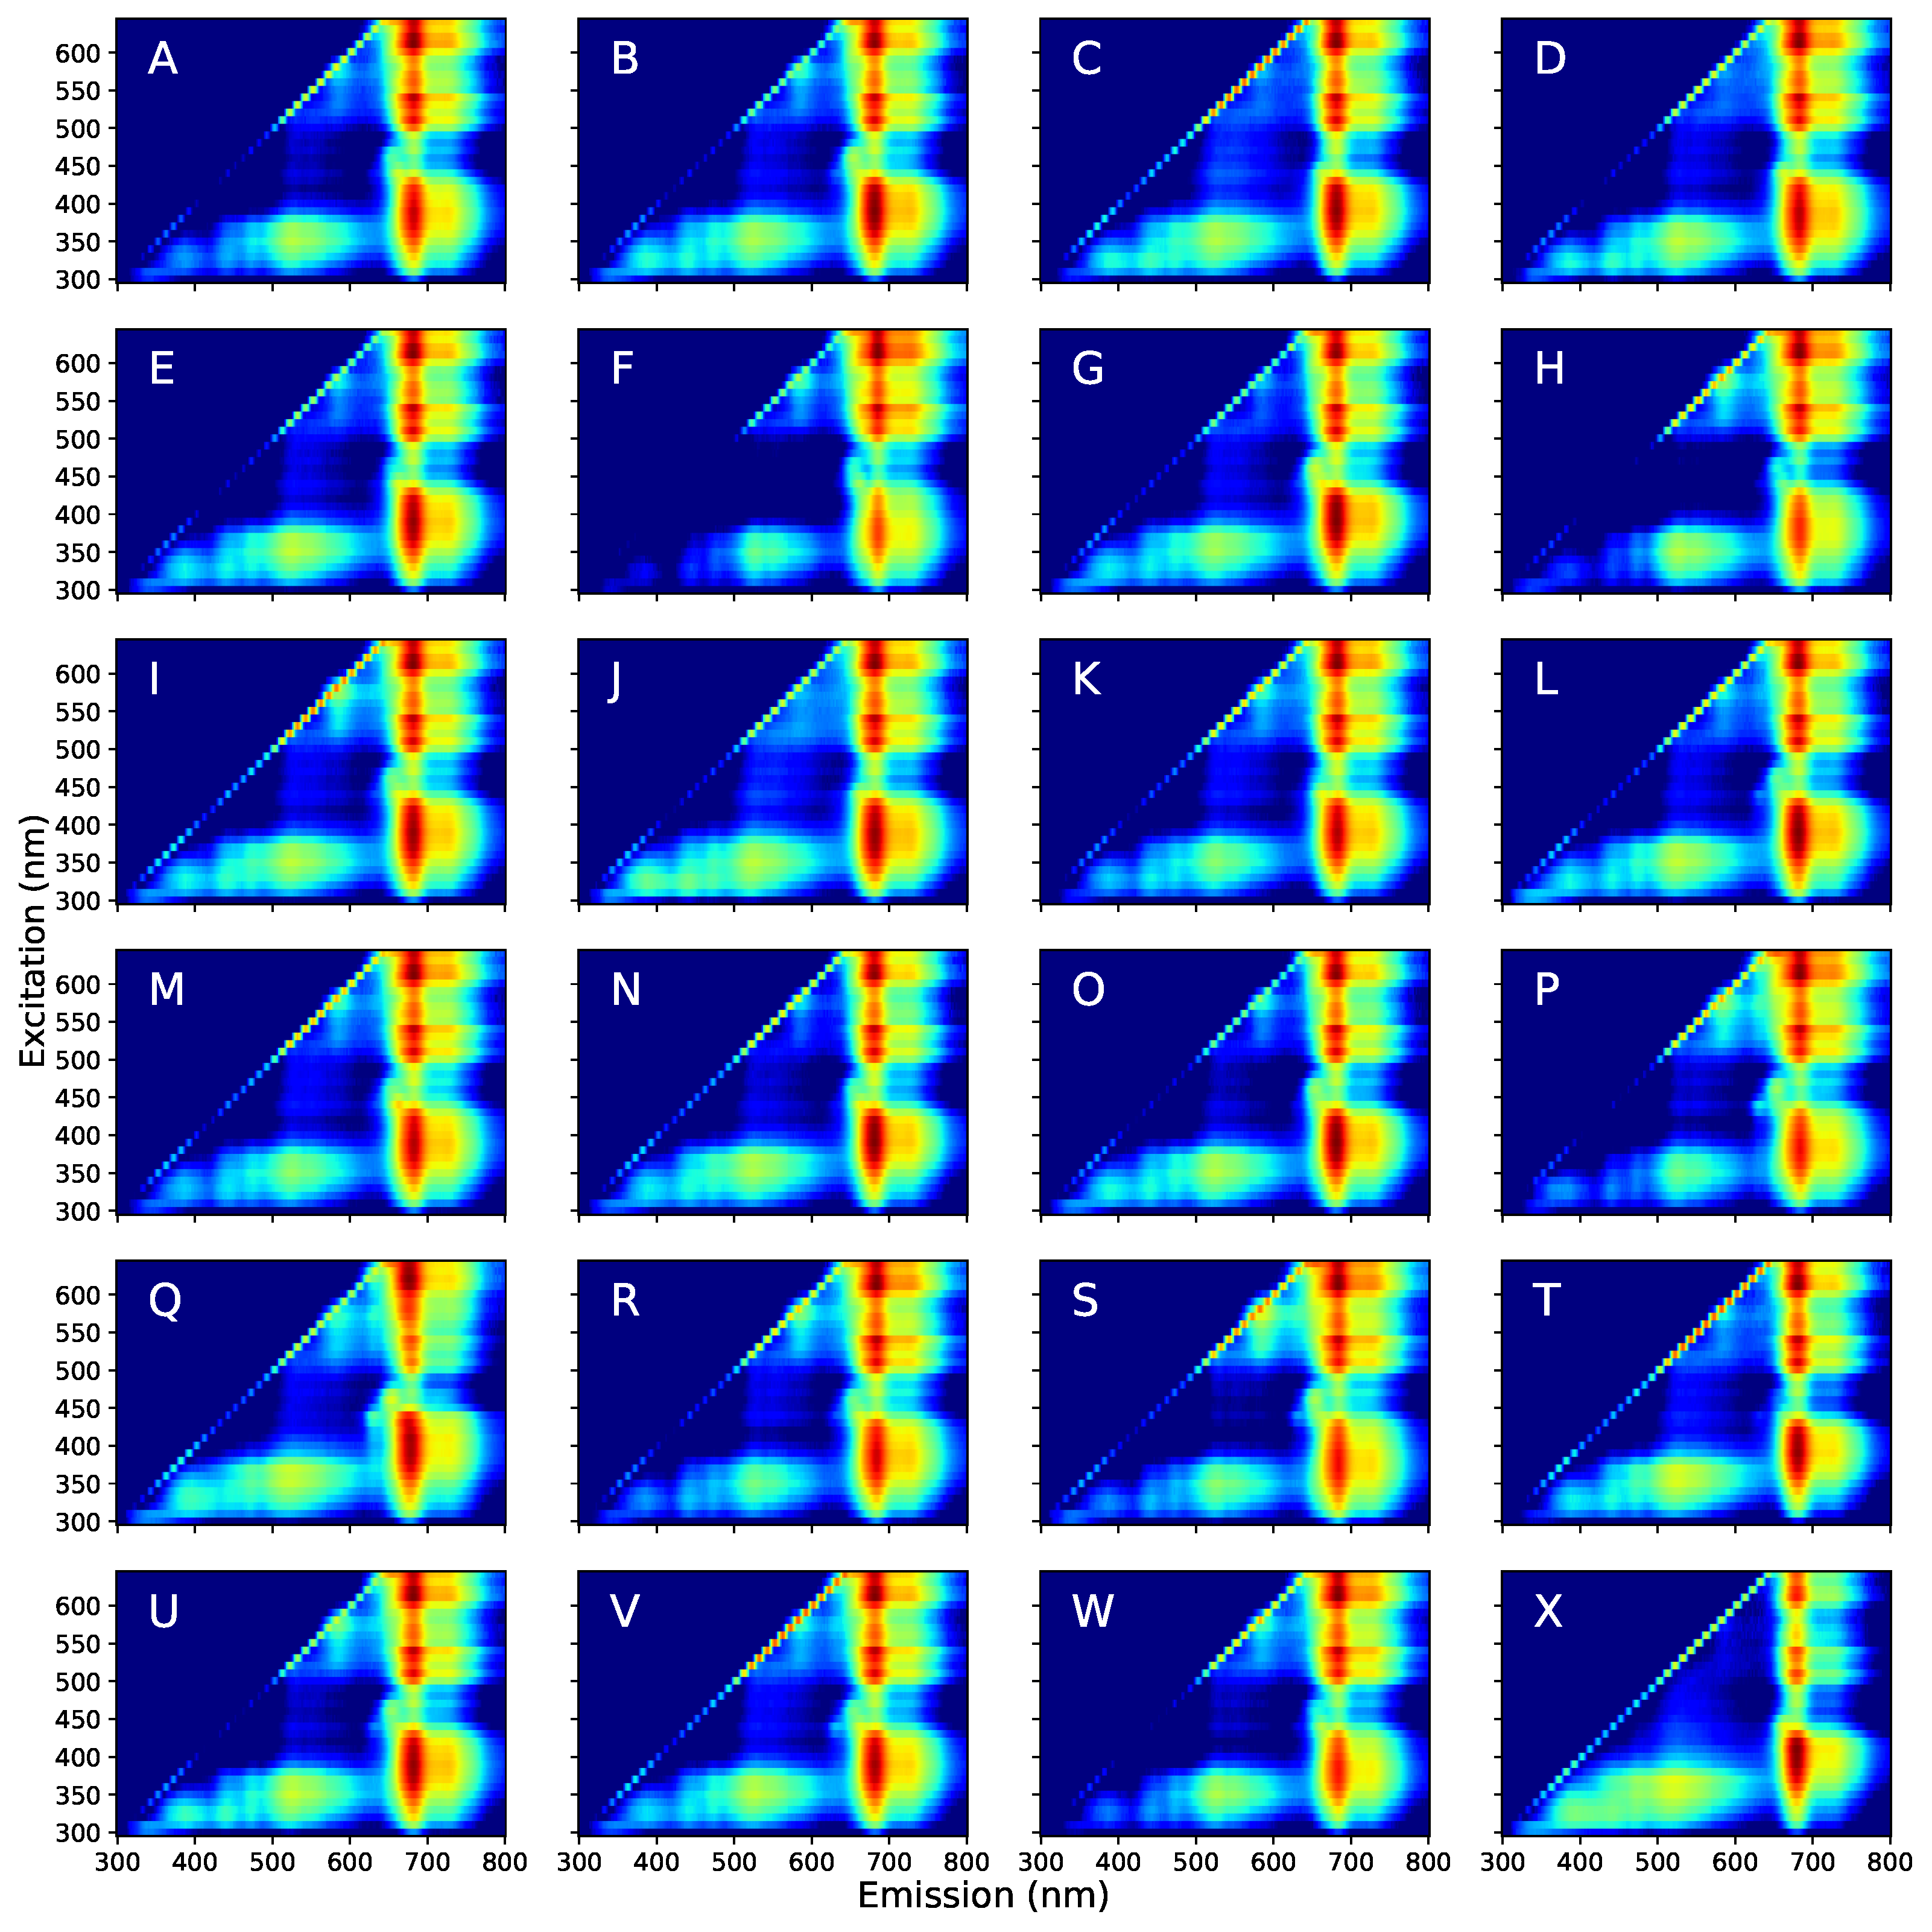
Fluorescence spectroscopy measurements consist of excitation–emission matrices (EEMs). Each EEM shows the fluorescence intensity for different excitation and emission wavelengths. Measurements were made with a Cary Eclipse Fluorescence Spectrophotometer with a built-in xenon lamp as an excitation source and an R928 photomultiplier tube as a detector (Agilent, Santa Clara, CA, USA). The samples were placed undiluted in plastic cuvettes and 4 samples were measured at the same time, always at a temperature of 22 C using a thermalised sample holder. The plastic cuvettes are specified for fluorescence measurement from 340 nm. To test the influence of the cuvettes on the signal the same sample was measured in quartz and a plastic cuvette over the entire range. The only difference in the fluorescence spectra was a wavelength-independent reduction in the fluorescence signal over the entire range. No additional peaks were observed. The maximum reduction was 15% for an excitation wavelength of 300 nm and disappeared for excitations starting from 340 nm. The observations are consistent with the absorption of the UV excitation light from the plastic cuvette. Since the goal of the study was the spectral changes due to ageing, a uniform reduction in the intensity for excitations between 300 and 330 nm on all measurements was considered due to overweight contamination errors that may arise in the cleaning of 720 cuvettes. The excitation ranged from 300 to 640 nm in 10 nm steps. The emission ranged from 300 nm to 800 nm in steps of 2 nm. The acquisition parameters were 5 nm slit bandwidth and 0.1 s averaging time. The emission intensity was automatically corrected for changes in the power of the excitation using a second built-in reference R928 photomultiplier. The excitation and emission filters were automatically selected by the spectrophotometer. The EEM for all the 24 oils before thermal ageing (ageing step 0) is shown in Figure 2. Although all 24 are labelled EVOO, a certain variability in the emission properties is clearly visible. Note that since the samples are undiluted, the inner filter effect [10] is expected to be present. The straight lines in the EEMs are the contribution of first-order Rayleigh scattering, which was not removed from the raw data.
3.4. UV-Spectroscopy: Apparatus and Procedure
For UV spectroscopy measurements, the samples were diluted in isooctane and prepared according to EU regulations [7,8]. The samples were placed in closed quartz cuvettes and 6 samples at a time were measured. The measurements were performed with a Cary 300 UV-Vis Spectrophotometer (Agilent, Santa Clara, California, USA) at a temperature of 22 C using a thermalised sample holder. The extinction coefficients were measured at 4 wavelengths: 232 nm, 264 nm, 268 nm, and 272 nm. The acquisition parameters were 2 nm slit bandwidth and 0.5 s averaging time. Due to the reproducibility of the measurements, only one of each three identical samples was measured. For example, for the oil A at the ageing step 0, only sample A0 was measured.
Author Contributions
Conceptualization and methodology: F.V.; data curation and investigation: S.F. and M.B.; Writing: F.V.; resources: F.V. All authors have read and agreed to the published version of the manuscript.
Funding
This research was supported by the Hasler Foundation project “ARES: AI for fluoREscence Spectroscopy in oil”.
Institutional Review Board Statement
Not applicable.
Informed Consent Statement
Not applicable.
Data Availability Statement
The data presented in this study are openly available in Mendeley data at https://doi.org/10.17632/g6y69g8gwm.1 [6], accessed on 13 March 2023.
Conflicts of Interest
The authors declare no conflict of interest and no known competing financial interests or personal relationships that could have appeared to influence the work reported in this paper.
Abbreviations
The following abbreviations are used in this manuscript:
| EEM | Excitation–Emission Matrix |
| EVOO | Extra Vigrin Olive Oil |
| UV | Ultraviolet |
| EU | European |
References
- Kongbonga, Y.G.M.; Ghalila, H.; Onana, M.B.; Majdi, Y.; Lakhdar, Z.B.; Mezlini, H.; Sevestre-Ghalila, S. Characterization of vegetable oils by fluorescence spectroscopy. Food Nutr. Sci. 2011, 2, 692–699. [Google Scholar] [CrossRef]
- Guzmán, E.; Baeten, V.; Pierna, J.A.F.; García-Mesa, J.A. Evaluation of the overall quality of olive oil using fluorescence spectroscopy. Food Chem. 2015, 173, 927–934. [Google Scholar] [CrossRef] [PubMed]
- Squeo, G.; Caponio, F.; Paradiso, V.M.; Summo, C.; Pasqualone, A.; Khmelinskii, I.; Sikorska, E. Evaluation of total phenolic content in virgin olive oil using fluorescence excitation–emission spectroscopy coupled with chemometrics. J. Sci. Food Agric. 2019, 99, 2513–2520. [Google Scholar] [CrossRef] [PubMed]
- Jiménez-Carvelo, A.M.; Lozano, V.A.; Olivieri, A.C. Comparative chemometric analysis of fluorescence and near infrared spectroscopies for authenticity confirmation and geographical origin of Argentinean extra virgin olive oils. Food Control 2019, 96, 22–28. [Google Scholar] [CrossRef]
- Venturini, F.; Sperti, M.; Michelucci, U.; Gucciardi, A.; Martos, V.M.; Deriu, M.A. Extraction of physicochemical properties from the fluorescence spectrum with 1D convolutional neural networks: Application to olive oil. J. Food Eng. 2023, 336, 111198. [Google Scholar] [CrossRef]
- Venturini, F.; Fluri, S.; Baumgartner, M. Dataset of Fluorescence EEM and UV Spectroscopy Data of Olive Oils during Ageing. Mendeley Data. Available online: https://data.mendeley.com/datasets/g6y69g8gwm/1 (accessed on 13 March 2023).
- Commission Regulation (EEC) No. 2568/91 of 11 July 1991 on the characteristics of olive oil and olive-residue oil and on the relevant methods of analysis Official Journal L 248, 5 September 1991. Off. J. 1991, L 248, 1–83.
- Commission Implementing Regulation No 1348/2013 of December 17 2013. Off. J. Eur. Union 2013, 338, 31–67.
- Mancebo-Campos, V.; Fregapane, G.; Desamparados Salvador, M. Kinetic study for the development of an accelerated oxidative stability test to estimate virgin olive oil potential shelf life. Eur. J. Lipid Sci. Technol. 2008, 110, 969–976. [Google Scholar] [CrossRef]
- Skoog, D.A.; Holler, F.J.; Crouch, S.R. Principles of Instrumental Analysis; Cengage Learning: Boston, MA, USA, 2017. [Google Scholar]
Figure 1.
The 720 samples prepared for ageing, divided into 10 batches, and the corresponding bottle.
Figure 1.
The 720 samples prepared for ageing, divided into 10 batches, and the corresponding bottle.

Figure 2.
Excitation–emission matrices (EEMs) of the 24 EVOO at ageing step 0 (fresh oils). The data are shown in logarithmic scale to make differences more visible. The letters A to X indicate the oil type (see Table 1).
Figure 2.
Excitation–emission matrices (EEMs) of the 24 EVOO at ageing step 0 (fresh oils). The data are shown in logarithmic scale to make differences more visible. The letters A to X indicate the oil type (see Table 1).


Table 1.
List of the commercial extra virgin olive oils analysed in this study and their properties. IT: Italy, ES: Spain, GR: Greece, PT: Portugal, EU: European not specified.
Table 1.
List of the commercial extra virgin olive oils analysed in this study and their properties. IT: Italy, ES: Spain, GR: Greece, PT: Portugal, EU: European not specified.
| Oil ID | Sample Description | Lot Nr | Exp Date | Origin | Price CHF/L |
|---|---|---|---|---|---|
| A | Coop Naturaplan Italienisches Olivenöl (BIO) | L-09/DOP/21-03 Q/03/078152/20-21 | Feb-22 | IT | 19.9 |
| B | Hacuinda Don Paolo | L-234MVEB | 25/02/2022 | ES | 10.6 |
| C | Monini, Monocultivar Nocellara Bio | L 27GK | 27/01/2022 | IT | 31.0 |
| D | Monini, Toscano IGP | L 07NK 03 2020/2021 2391 | 07/11/2021 | IT, Tuscany | 27.6 |
| E | Monini, Classico | L 04CR | 31/01/2022 | IT | 15.6 |
| F | Oliva, Favola | 34621 | 14/06/2022 | IT | 31.4 |
| G | Migros, M Classics | L-333MVE | 01/03/2022 | ES | 7.4 |
| H | Alexis, Manaki | 170321 1619 | Jan-22 | GR | 14.0 |
| I | Migros, Bio Italienische Olivenöl | Q9333 | Jan-22 | IT | 17.8 |
| J | Alnatura, Natives Olivenöl extra | 66080350 ESA | 15/12/2021 | ES | 13.6 |
| K | Migros, Bio Griechisches Olivenöl | 220321 1413 | Jan-22 | GR | 15.0 |
| L | Demeter, Spanisches Olivenöl | P722 | Mar-22 | ES | 19.2 |
| M | Filippo Berio, Il Classico | LE358R 01 | Feb-22 | EU | 15.9 |
| N | Demeter, Bio Coop Naturaplan, Portugisisches Olivenöl | B120221048 | Jun-22 | PT | 23.9 |
| O | Castillo, Don Felpe | L1011 E-0031 | 11/01/2022 | ES | 10.0 |
| P | Coop, Naturaplan Bio Griechisches Olivenöl | RPBK-6 2020 ME 102943/20 | Jan-22 | GR | 19.9 |
| Q | Demeter, Son Naava | 02/2020 | Jun-22 | Mallorca, ES | 35.9 |
| R | Iliada, Kalamata PDO | L-210115 KA-160580/21 | Jul-22 | GR | 17.0 |
| S | Sapori d’Italia, Sicilia | L86 L061K-2 N: 44381 | Apr-22 | Sicily, IT | 29.9 |
| T | San Giuliano, Sardegna DOP | 0034q/DFF | 31/12/2021 | Sardinia, IT | 29.9 |
| U | Coop, Naturaplan Bio Spanisches Olivenöl | 0100100421-03 | Mar-22 | ES | 19.9 |
| V | San Giuliano, Fruttato | L0036q/F DR | 31/12/2021 | IT | 25.9 |
| W | San Giuliano, L’Originale | L0042q/E E2 | 30/06/2022 | IT | 18.0 |
| X | Coop, Qualité-Prix | 1336456 | 28/11/2021 | IT, ES, GR | 7.4 |
Table 2.
Overview of the sample preparation.
| Sample Characteristics | |
|---|---|
| Extra virgin olive oils | 24 |
| Identical samples per ageing step | 3 |
| Ageing steps | 10 |
| Total number of samples | 720 |
Table 3.
List of the steps and corresponding ageing time.
| Ageing Step # | Days at 60 C |
|---|---|
| 0 | fresh |
| 1 | 2 |
| 2 | 4 |
| 3 | 7 |
| 4 | 9 |
| 5 | 18 |
| 6 | 27 |
| 7 | 36 |
| 8 | 45 |
| 9 | 53 |
Disclaimer/Publisher’s Note: The statements, opinions and data contained in all publications are solely those of the individual author(s) and contributor(s) and not of MDPI and/or the editor(s). MDPI and/or the editor(s) disclaim responsibility for any injury to people or property resulting from any ideas, methods, instructions or products referred to in the content. |
© 2023 by the authors. Licensee MDPI, Basel, Switzerland. This article is an open access article distributed under the terms and conditions of the Creative Commons Attribution (CC BY) license (https://creativecommons.org/licenses/by/4.0/).
Share and Cite
MDPI and ACS Style
Venturini, F.; Fluri, S.; Baumgartner, M. Dataset of Fluorescence EEM and UV Spectroscopy Data of Olive Oils during Ageing. Data 2023, 8, 81. https://doi.org/10.3390/data8050081
AMA Style
Venturini F, Fluri S, Baumgartner M. Dataset of Fluorescence EEM and UV Spectroscopy Data of Olive Oils during Ageing. Data. 2023; 8(5):81. https://doi.org/10.3390/data8050081
Chicago/Turabian StyleVenturini, Francesca, Silvan Fluri, and Michael Baumgartner. 2023. "Dataset of Fluorescence EEM and UV Spectroscopy Data of Olive Oils during Ageing" Data 8, no. 5: 81. https://doi.org/10.3390/data8050081