
Remote Sensing Data Preparation for Recognition and Classification of Building Roofs
by
 , ,
, ,
Emil Hristov
1,* ,
,
Dessislava Petrova-Antonova
1,2,* ,
,
Aleksandar Petrov
1, 
Milena Borukova
1 and
Evgeny Shirinyan
1 1
GATE Institute, Sofia University “St. Kliment Ohridski”, 1504 Sofia, Bulgaria
2
Faculty of Mathematics and Informatics, Sofia University “St. Kliment Ohridski”, 1164 Sofia, Bulgaria
*
Authors to whom correspondence should be addressed.
Data 2023, 8(5), 80; https://doi.org/10.3390/data8050080
Submission received: 30 March 2023
/
Revised: 26 April 2023
/
Accepted: 27 April 2023
/
Published: 28 April 2023
(This article belongs to the Section Spatial Data Science and Digital Earth)
Abstract
:Buildings are among the most significant urban infrastructure that directly affects citizens’ livelihood. Knowledge about their rooftops is essential not only for implementing different Levels of Detail (LoD) in 3D city models but also for performing urban analyses related to usage potential (solar, green, social), construction assessment, maintenance, etc. At the same time, the more detailed information we have about the urban environment, the more adequate urban digital twins we can create. This paper proposes an approach for dataset preparation using an orthophoto with a resolution of 10 cm. The goal is to obtain roof images into separate GeoTIFFs categorised by type (flat, pitched, complex) in a way suitable for feeding rooftop classification models. Although the dataset is initially elaborated for rooftop classification, it can be applied to developing other deep-learning models related to roof recognition, segmentation, and usage potential estimation. The dataset consists of 3617 roofs covering the Lozenets district of Sofia, Bulgaria. During its preparation, the local-specific context is considered.
1. Introduction
Nowadays, the digital twin is a dominating technology in the smart city landscape. It represents its physical counterpart in the real world via data (static, dynamic and real-time), models, analyses and simulations, context awareness, interaction, and connectivity. The digital twin enables deep insights into the city operations and prediction of the future behaviour of the city in a way that is actionable for the stakeholders and citizens. It allows for better-informed and transparent decisions with the help of data from across the urban space. The digital twin collects a variety of heterogeneous datasets from different sources, including those related to buildings, infrastructure, vegetation, terrain and other elements, and also links additional data from urban dynamics, such as urban traffic, air pollution, and pedestrian movement, onto them [1]. It becomes a data hub that can be used beyond creating 3D information models, e.g., lifecycle management of single urban objects and assets, simulation of what-if scenarios, and real-time monitoring and analysis at different city scales [2].
A key challenge currently standing in the way of the wide adoption of digital twins is data availability and accessibility. Publicly available data remain an obstacle towards the uptake and application of digital twins on a large scale that is applied to broad urban use cases [3]. For example, in many countries, including Bulgaria, data that is crucial for building 3D city models, such as cadastral, orthophoto, or LiDAR, is either not acquired or is owned by private companies. Many local governments around the world are still beginning their digital transformation journey. On the other hand, countries such as the Netherlands [4], Finland [5], and Estonia [6] are offered completely free, publicly available LiDAR data for the entire country. This contributes significantly to the research of various aspects of the development of city digital twins.
Remote sensing plays a vital role in urban data collection, including satellite imagery, unmanned aerial vehicle (UAV) images, and light detection and ranging (LiDAR) data. The multi-resolution remote sensing data and deep learning models jointly bridge the gap in urban feature extraction and change detection. The new generations of high-resolution satellite constellations successfully incorporate a high level of detail and broad coverage [3]. In addition, integrating remote sensing and GIS provides a strong instrument for urban planning assessment and environment simulation [7]. However, regardless of the collection technique, any dataset needs to be preprocessed to properly feed the Artificial Intelligence (AI) models.
The 3D city models are an integral part of the digital twins. Level of Detail (LoD) is a paradigm in 3D city modelling that defines the degree of abstraction of real-world objects. It is designated to optimise the granularity of object geometries according to the user’s needs and computational and economic aspects [8]. Modelling the rooftops is essential, not only for better visual perception, but also because of the potential of the roof surfaces to address various city problems. This includes solar [8], green roofs [9], social space [10], or a combination of them. Developing such potentials could have a huge positive impact on the city environment. However, complex analyses need to be performed to assess the effect and the level of necessity. For example, solar irradiation is assessed based on the rooftop’s direction, tilt, and area. In this case, a detailed rooftop structure is required to evaluate the useful space for photovoltaic placement, while the detailed facade structure is unnecessary. At the same time, openings on the roofs, such as windows, should be considered since they reduce the roof area on which solar panels can be placed. Thus, the windows and other openings should be distinguished based on their location on the building surface [8].
As mentioned, AI, and deep learning models in particular, play a significant role in rooftop analysis as a part of 3D city modelling. However, the precision of such analytical models depends on their learning from the training data [11]. The classification and feature extraction algorithms are fast, cost-effective, and can produce a result with high precision. On the other hand, they require a significant amount of representative, properly labelled data to build accurate models [12].
The data preparation approach presented in this study aims to provide a reliable and accurate image dataset suitable for the recognition and classification of rooftops and further photogrammetric reconstruction. It will provide input for deep learning models to extract roof geometry and other features using only orthophoto or satellite images. The quality and availability of cadastre data can vary greatly depending on the update frequency and LoD. In some cities, the cadastre contains attribute information for the roof type of the buildings, but this is different in the Bulgarian context. The cadastre data of Sofia city cannot be used to obtain roof categories due to limited support of building features and usage restrictions. Thus, the proposed dataset will provide opportunities to enrich the 3D city model of Sofia city and achieve a higher LoD [13].
The dataset is elaborated based on an orthophoto with a resolution of 10 cm. It consists of 3617 GeoTIFFs, which fall into three main classes: flat, pitched, and complex. The dataset has been successfully applied to develop a deep-learning model for rooftop classification.
The rest of the paper is organised as follows. Section 2 presents the local context and related work. Section 3 describes the study area and acquisition of the input dataset. Section 4 presents the methods used for dataset preparation. Section 5 shows the results and discusses the challenges and lessons learned. Section 6 concludes the paper and gives directions for future work.
2. Background and Related Work
Remote sensing methods have gained popularity for rooftop analysis in various applications, including assessing solar potential, identifying roof structures, and analysing rooftop vegetation, damage, and rainwater potential. However, datasets used for these studies vary significantly depending on the local context related to roof materials, colours, conditions, structures, noise, and abstract geometries. Additionally, the global diversity of roof types is vast and dependent on local context, culture, and climate.
According to CityGML standard, roofs can be classified into various types: flat, mono-pitch, skip pent, gabled, hipped, half-hipped, mansard, pavilion, cone, copula, shed, arch, pyramidal broach, and combinations of roof forms [14]. Pitched roofs, such as gable and hip, are the most common types of roofs found in datasets and research studies.
Historically, roofs have been pitched in Bulgaria, with hip or gable roofs being the most common types. However, with the construction of high-rise buildings, flat roofs have become more prevalent. The so-called complex roofs are a distinctive feature of Bulgarian architecture and are broadly categorised as flat, pitched, and mixed. Therefore, classifying, recognising, and differentiating pitched, complex, or flat roofs is essential for future research to expand the variety of classifications and categorisations.
While several research papers have focused on roof detection, segmentation, and annotation, publicly accessible datasets with diverse typologies of rooftops are scarce. We found and explored four roof datasets, each with unique characteristics and applications, focusing on better understanding the types of roof samples included.
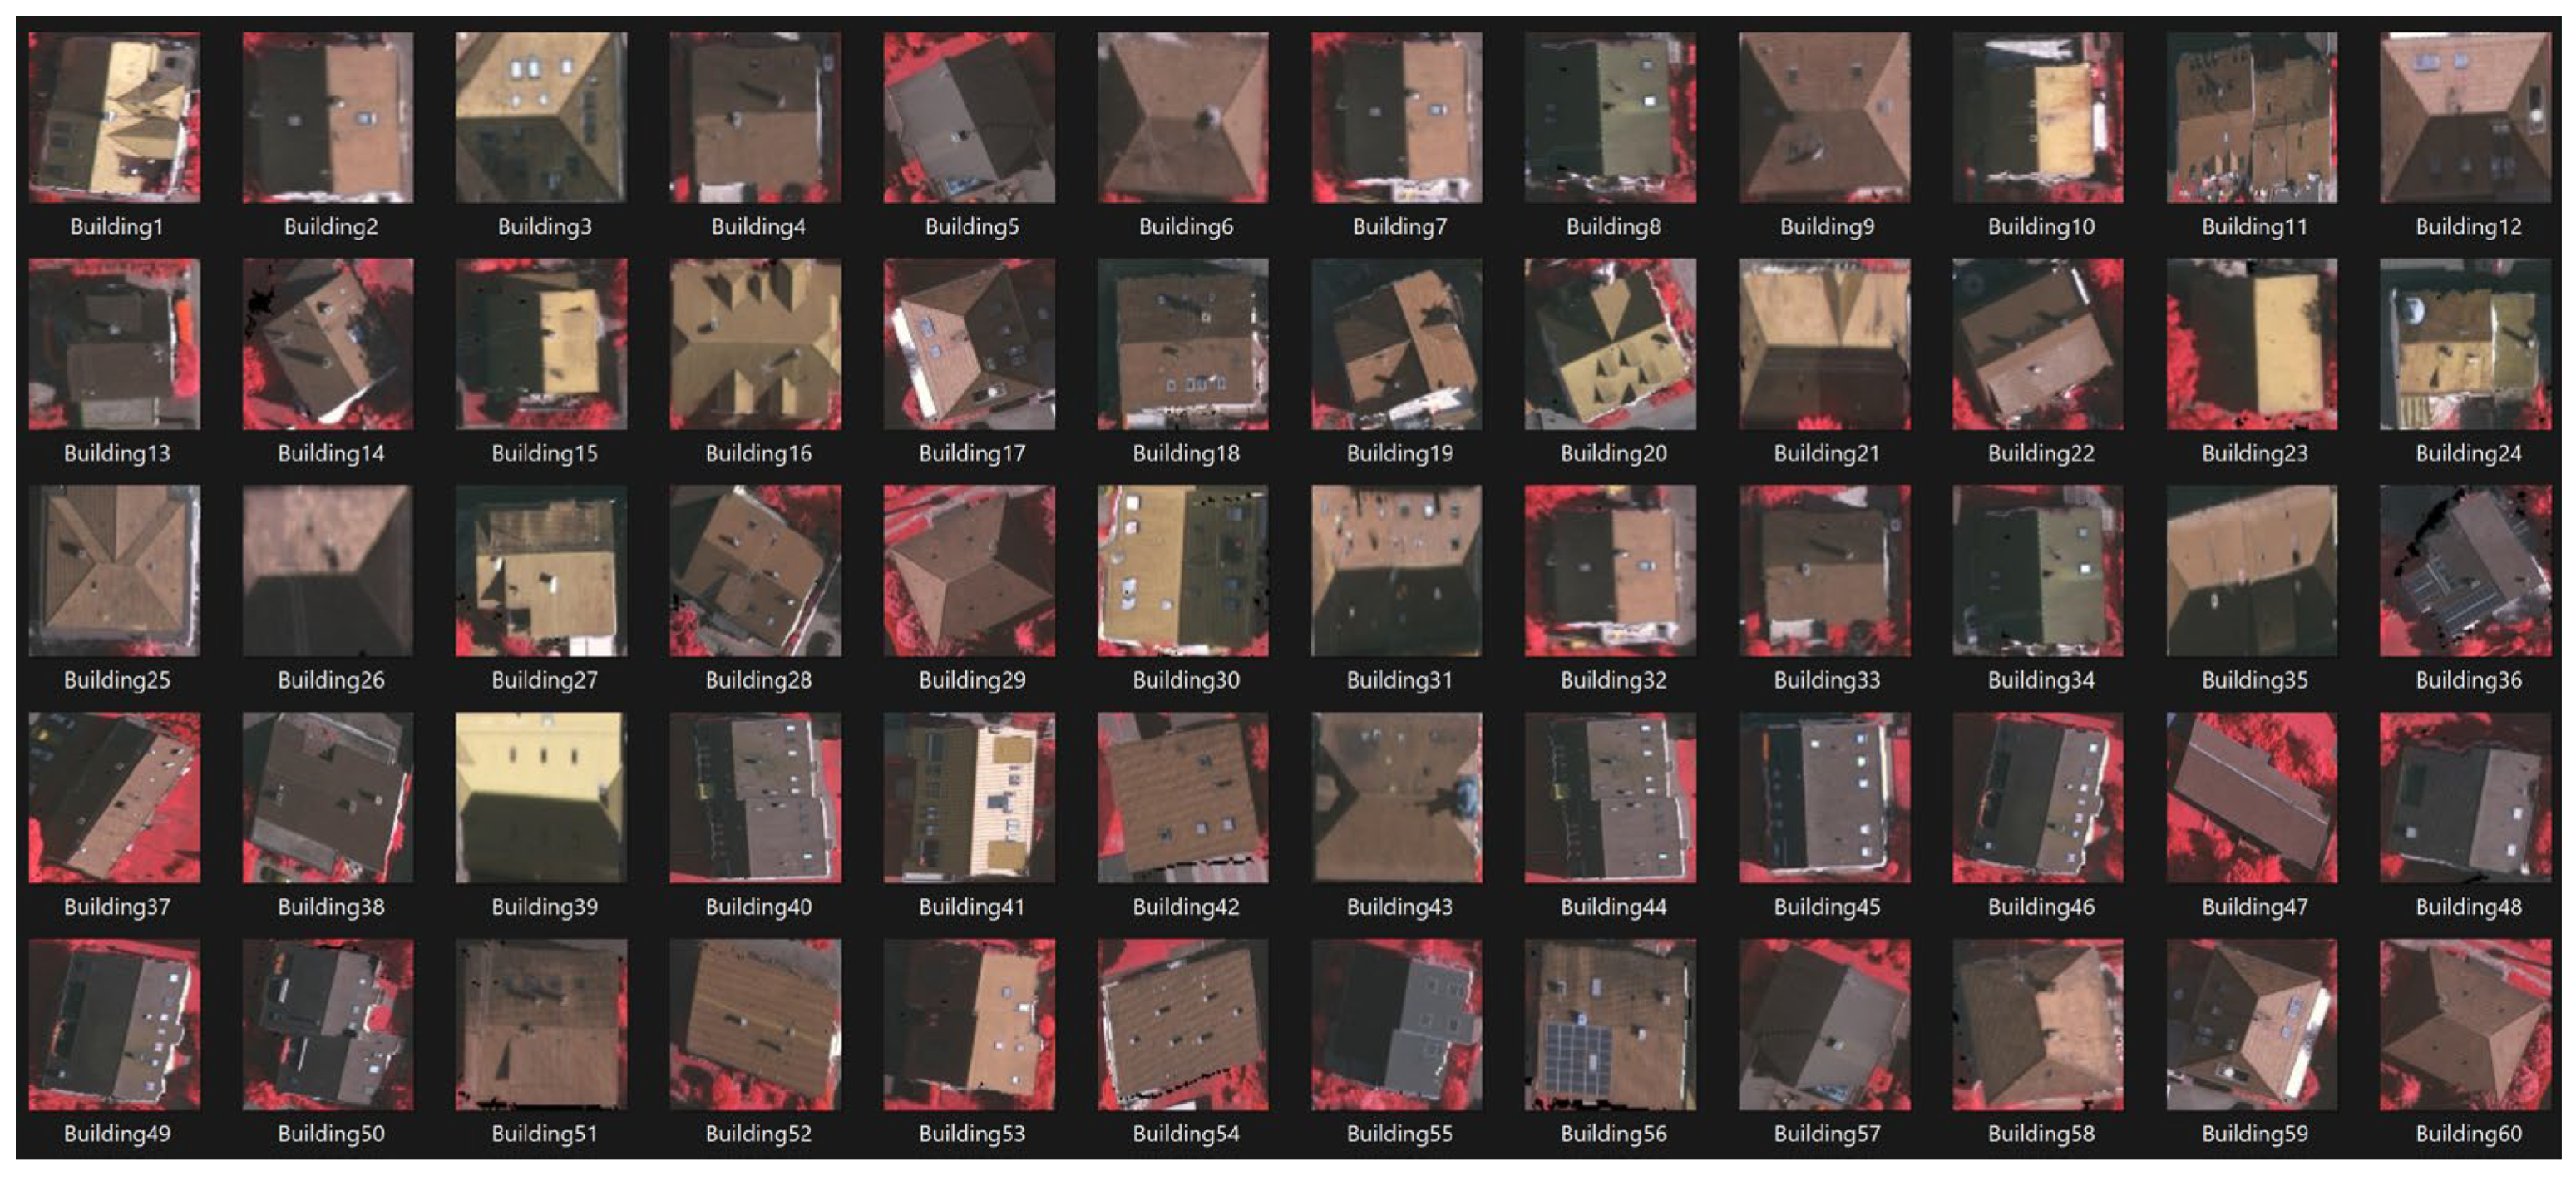
The first dataset is generated using aerial images downloaded via the Google Maps API, with the main goal of analysing the photovoltaic potential of roofs while also assessing their superstructure annotations [15,16]. The dataset contains around 1880 samples, with over 90% of the roofs being pitched low-rise buildings. The roofs come in various colours, from grey to brownish and orange (see Figure 1).
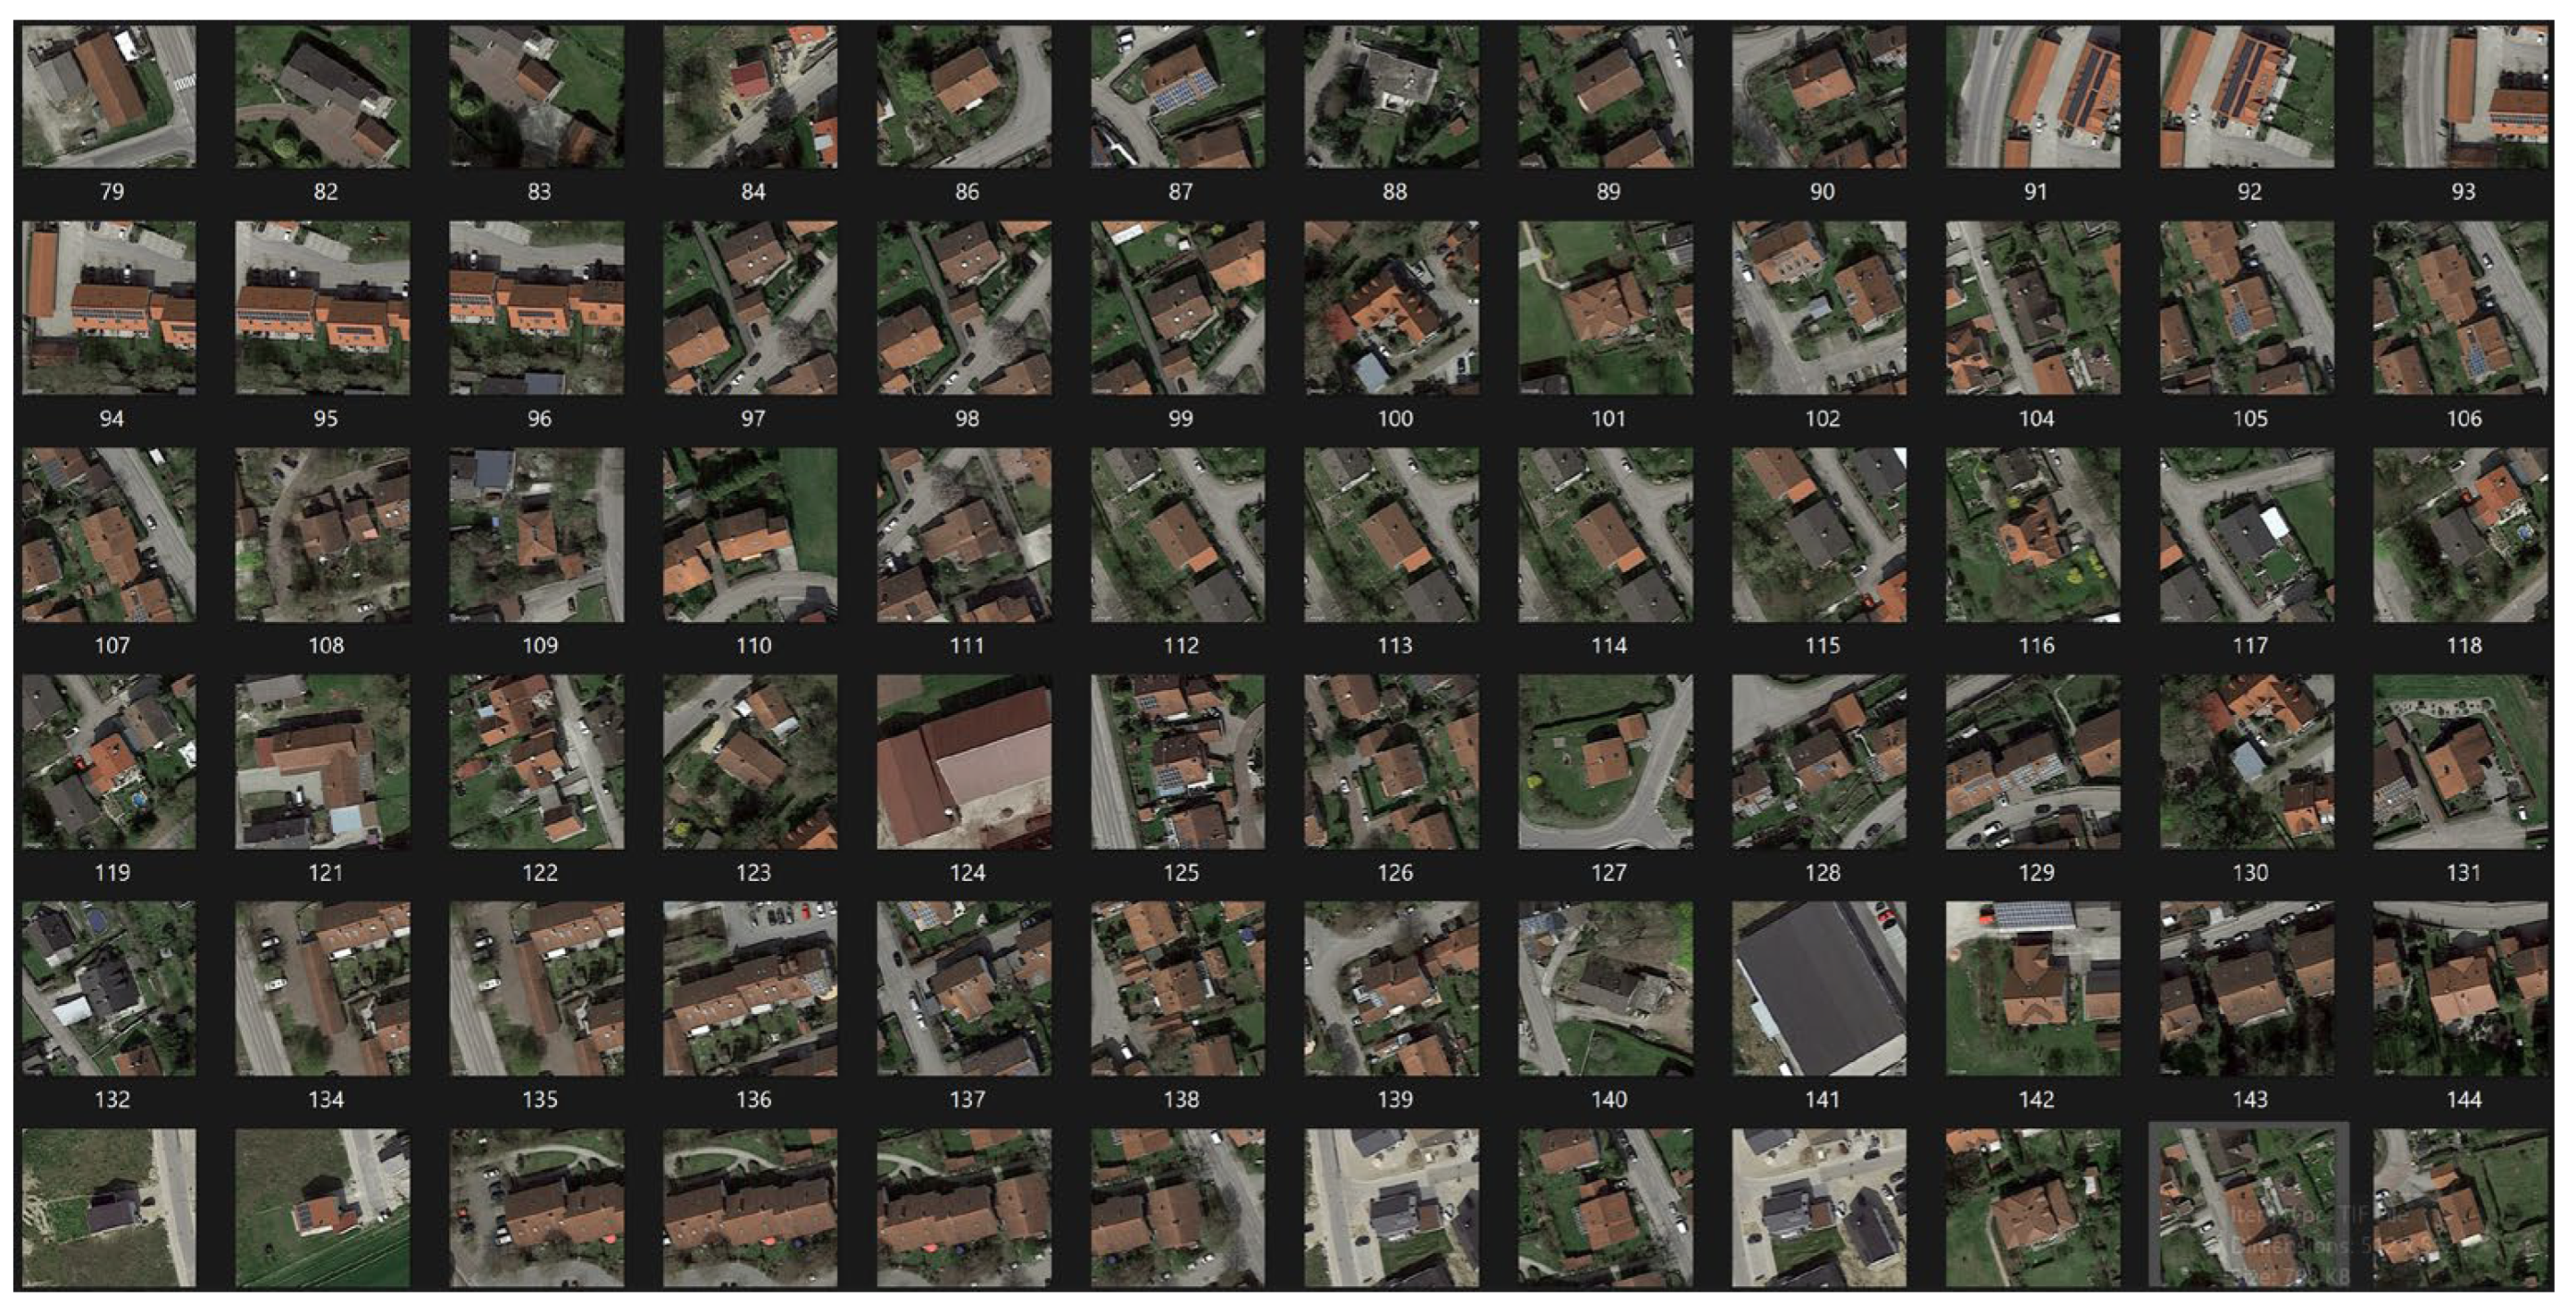
The second dataset analyses urban objects, including trees, roads, and buildings, and classifies roof types into gable, hip, and flat categories [17,18]. Initially, the dataset consisted of 200 samples. After data augmentation, 4800 samples for the corresponding roof types were generated and added. Using data augmentation techniques, the initial dataset was increased to provide a significant amount of training data for a CNN model. The dataset includes both pitched and flat roofs, with the flat roofs being simple and clear, while the pitched roofs represent roofs in good condition with homogeneous colours and textures (see Figure 2).
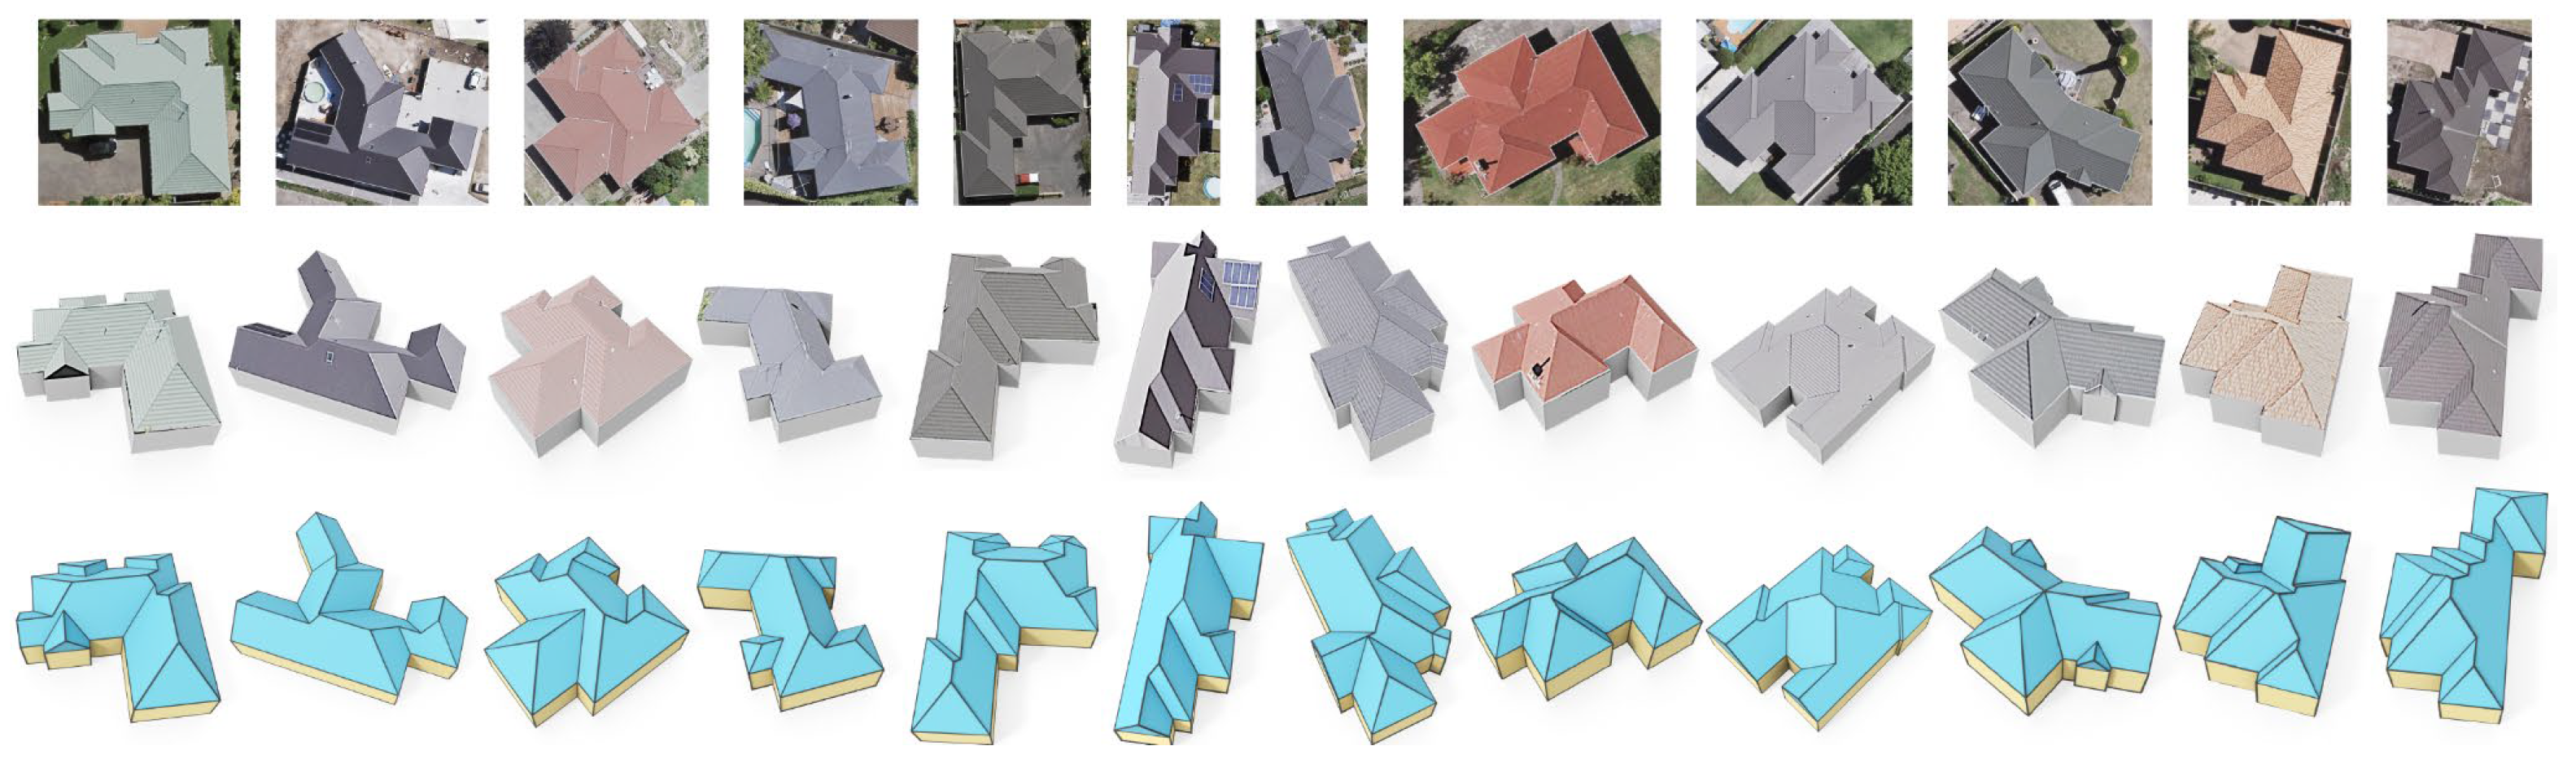
The third dataset focuses on constructing 3D polygon roof meshes using a graph structure to encode roof typology. The dataset includes 2539 aerial images containing planar roofs, with all roofs pitched [19,20]. The dataset consists of so-called complex pitched roofs with many edges and ridges, which are still a regular type. The roofs are clear, well-maintained, and homogeneous (see Figure 3). This dataset has two main applications: an interactive roof editing framework that can be used for roof design or reconstruction using aerial images and a generative model that can generate new roof meshes from scratch.
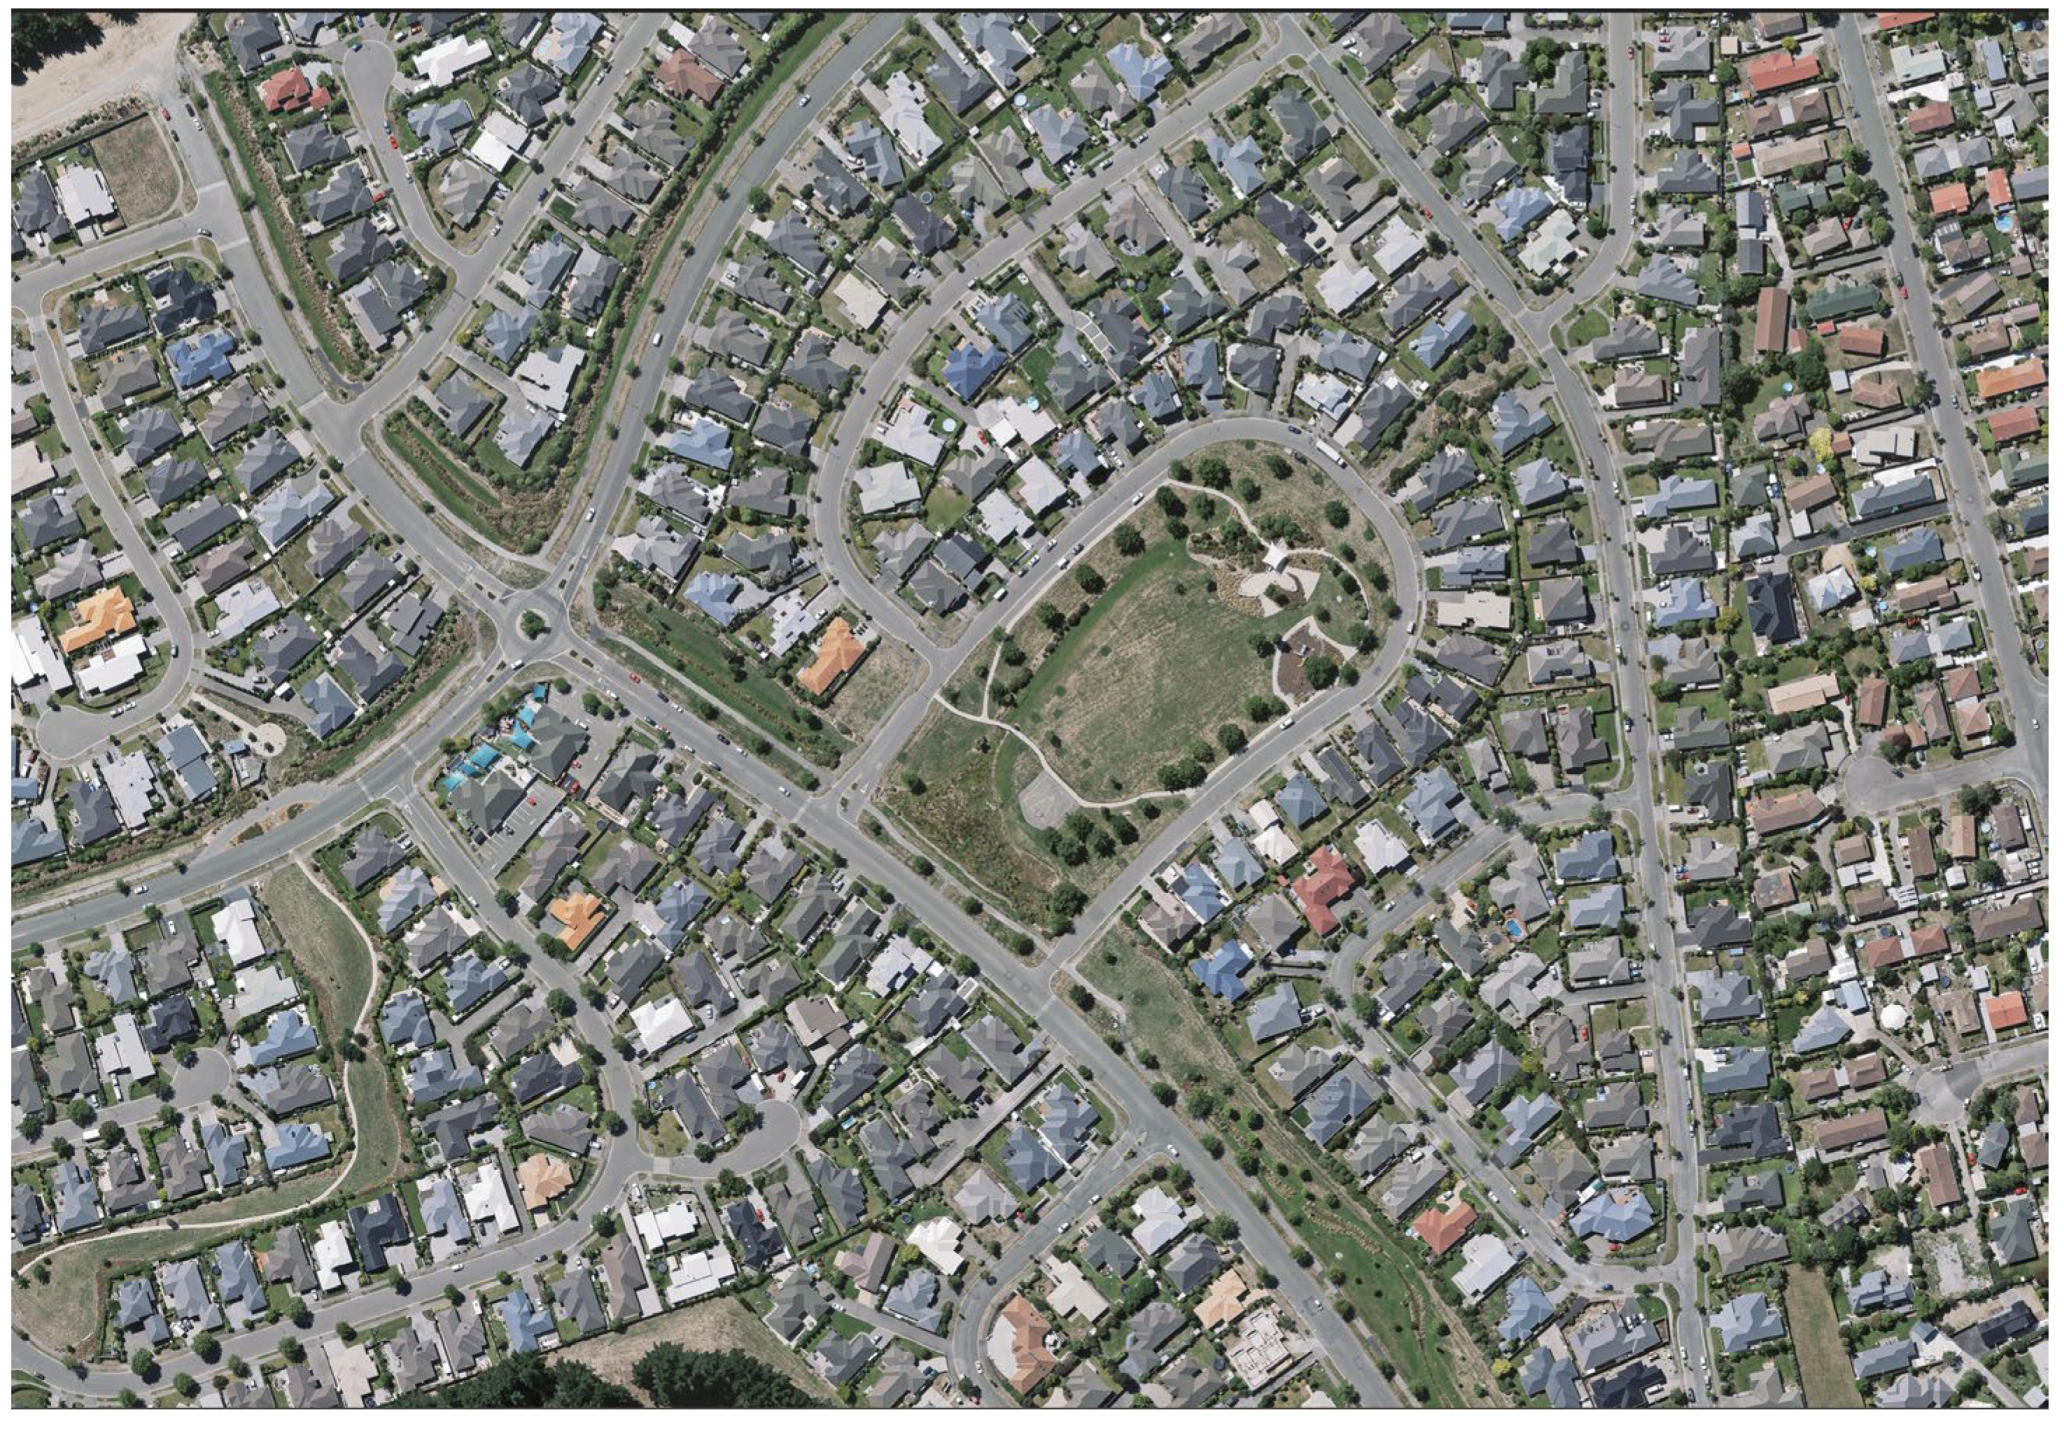
Finally, there are some large satellite datasets with thousands and millions of samples that consist of tiles of a specific area containing everything from fields, buildings, roads, forests, water bodies, etc. The resolution is usually high, the area is large, and some integrated categories exist. However, these datasets do not consist of roof samples as separate images. One example is the Aerial Imagery for Roof Segmentations (AIRS) dataset, which contains over 220,000 buildings with a resolution of 7.5 cm [21,22]. It is used for roof segmentation using various deep-learning methods for semantic segmentation. Although there are hundreds of thousands of buildings, most are of the same type as the reference from the third dataset: suburban family houses with pitched roofs (see Figure 4). The dataset includes some areas in the business centre or industrial logistic zones with mainly flat roofs, as most have easily recognisable contours and shapes.
Furthermore, many annotators have been used to scan and improve building outlines to provide reliable ground truths for roof segmentation and experimentation. Researchers further refine the false annotations and misalignments. An example of a similar large dataset is the Functional Map of the World, considered the largest satellite dataset, consisting of more than one million images worldwide. The dataset provides bounding box annotations for 63 categories, including a “false detection” category. It also provides publicly available data, code, and pre-trained models.
While the methods used in our study have been previously reported in the literature, we apply them to a more complex problem-solving scenario. The complexity of the roofs in Bulgaria, particularly in Sofia, contrasts with those in many other countries and cities. This complexity arises from several factors. Firstly, most of the building stock in Bulgaria is quite old and often left unmaintained for several years, impacting the condition of roofs. Secondly, a lack of regulations or systematic approaches to renovation results in frequent personal interventions that only cover part of a building’s roof, leading to non-homogeneous surfaces in terms of geometry, material, condition, colour, and texture. Additionally, the lack of specific regulations and planning laws for building reconstruction and intervention led to installing various rooftop objects, resulting in a noisy roof landscape. In addition, the absence of an overall vision for the development of Sofia city affects the architecture and shape of new buildings constructed after the 1990s. The result is a complex and irregular mixture of gable, hip, flat roofs, terraces, and roofs on several levels.
Therefore, the primary contribution of our study is not related to the novelty of the methods applied but rather to elaborating a dataset of more complex and diverse rooftops. This dataset provides an opportunity to test, train, categorise, and classify more complex roofs that can be used to improve the existing deep learning/AI models for building roof detection, classification, and feature extraction. Thus, our dataset tackles new challenges and contributes to the existing research.
3. Input Data
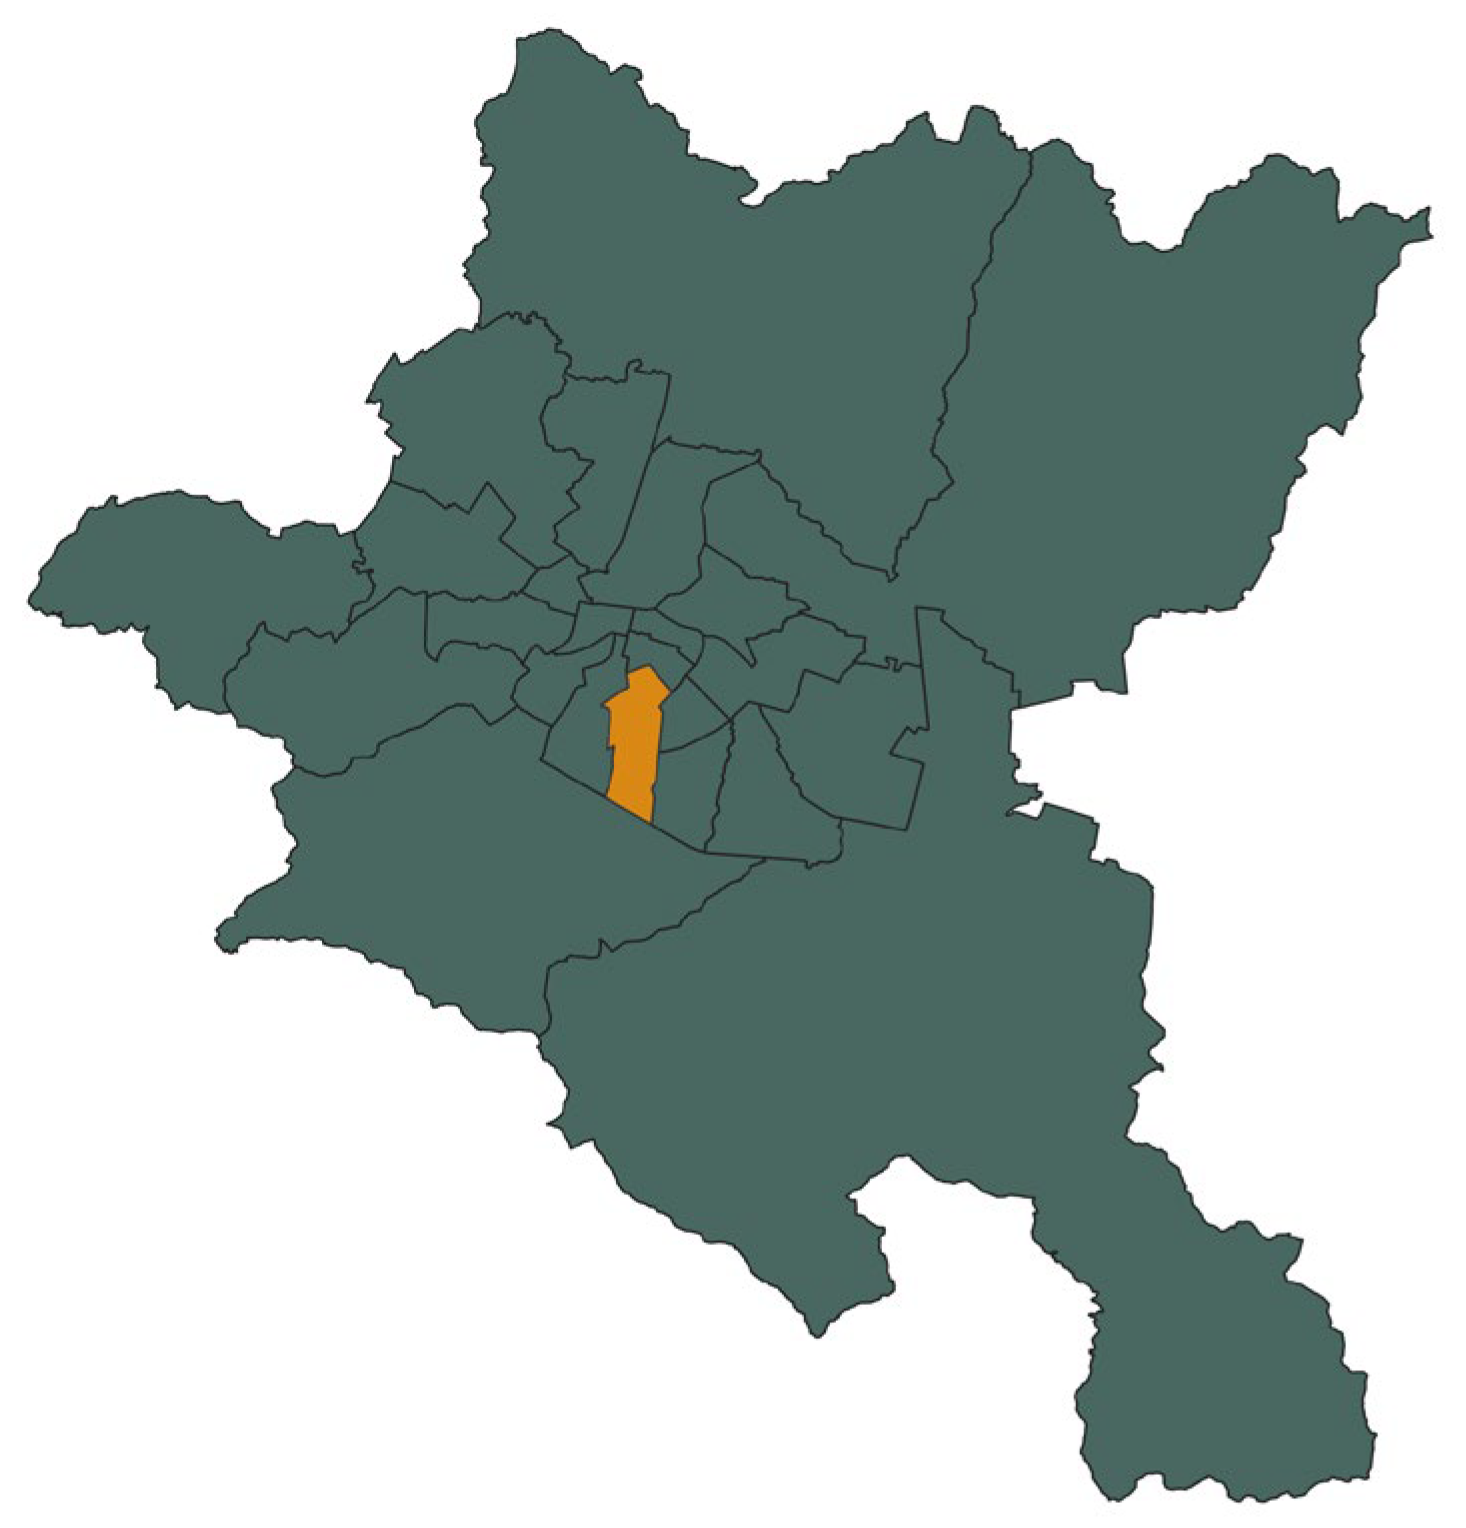
The study area covers the Lozenets district (9.2 sq. km) of Sofia Municipality (see Figure 5). The city has around 1.25 mil inhabitants [23], and around 50,000 citizens live in the Lozenets district [24].
The district is an interesting case from a spatial and urban point of view since it spreads from the old city centre to the skirts of Vitosha mountain, where the new neighbourhoods have been developed. It combines various typologies of buildings from the beginning of the 20th century through the socialist era with high-rise monolith residential buildings and new, modern buildings with reinforced modern construction design that is expressed in complex and diverse forms.
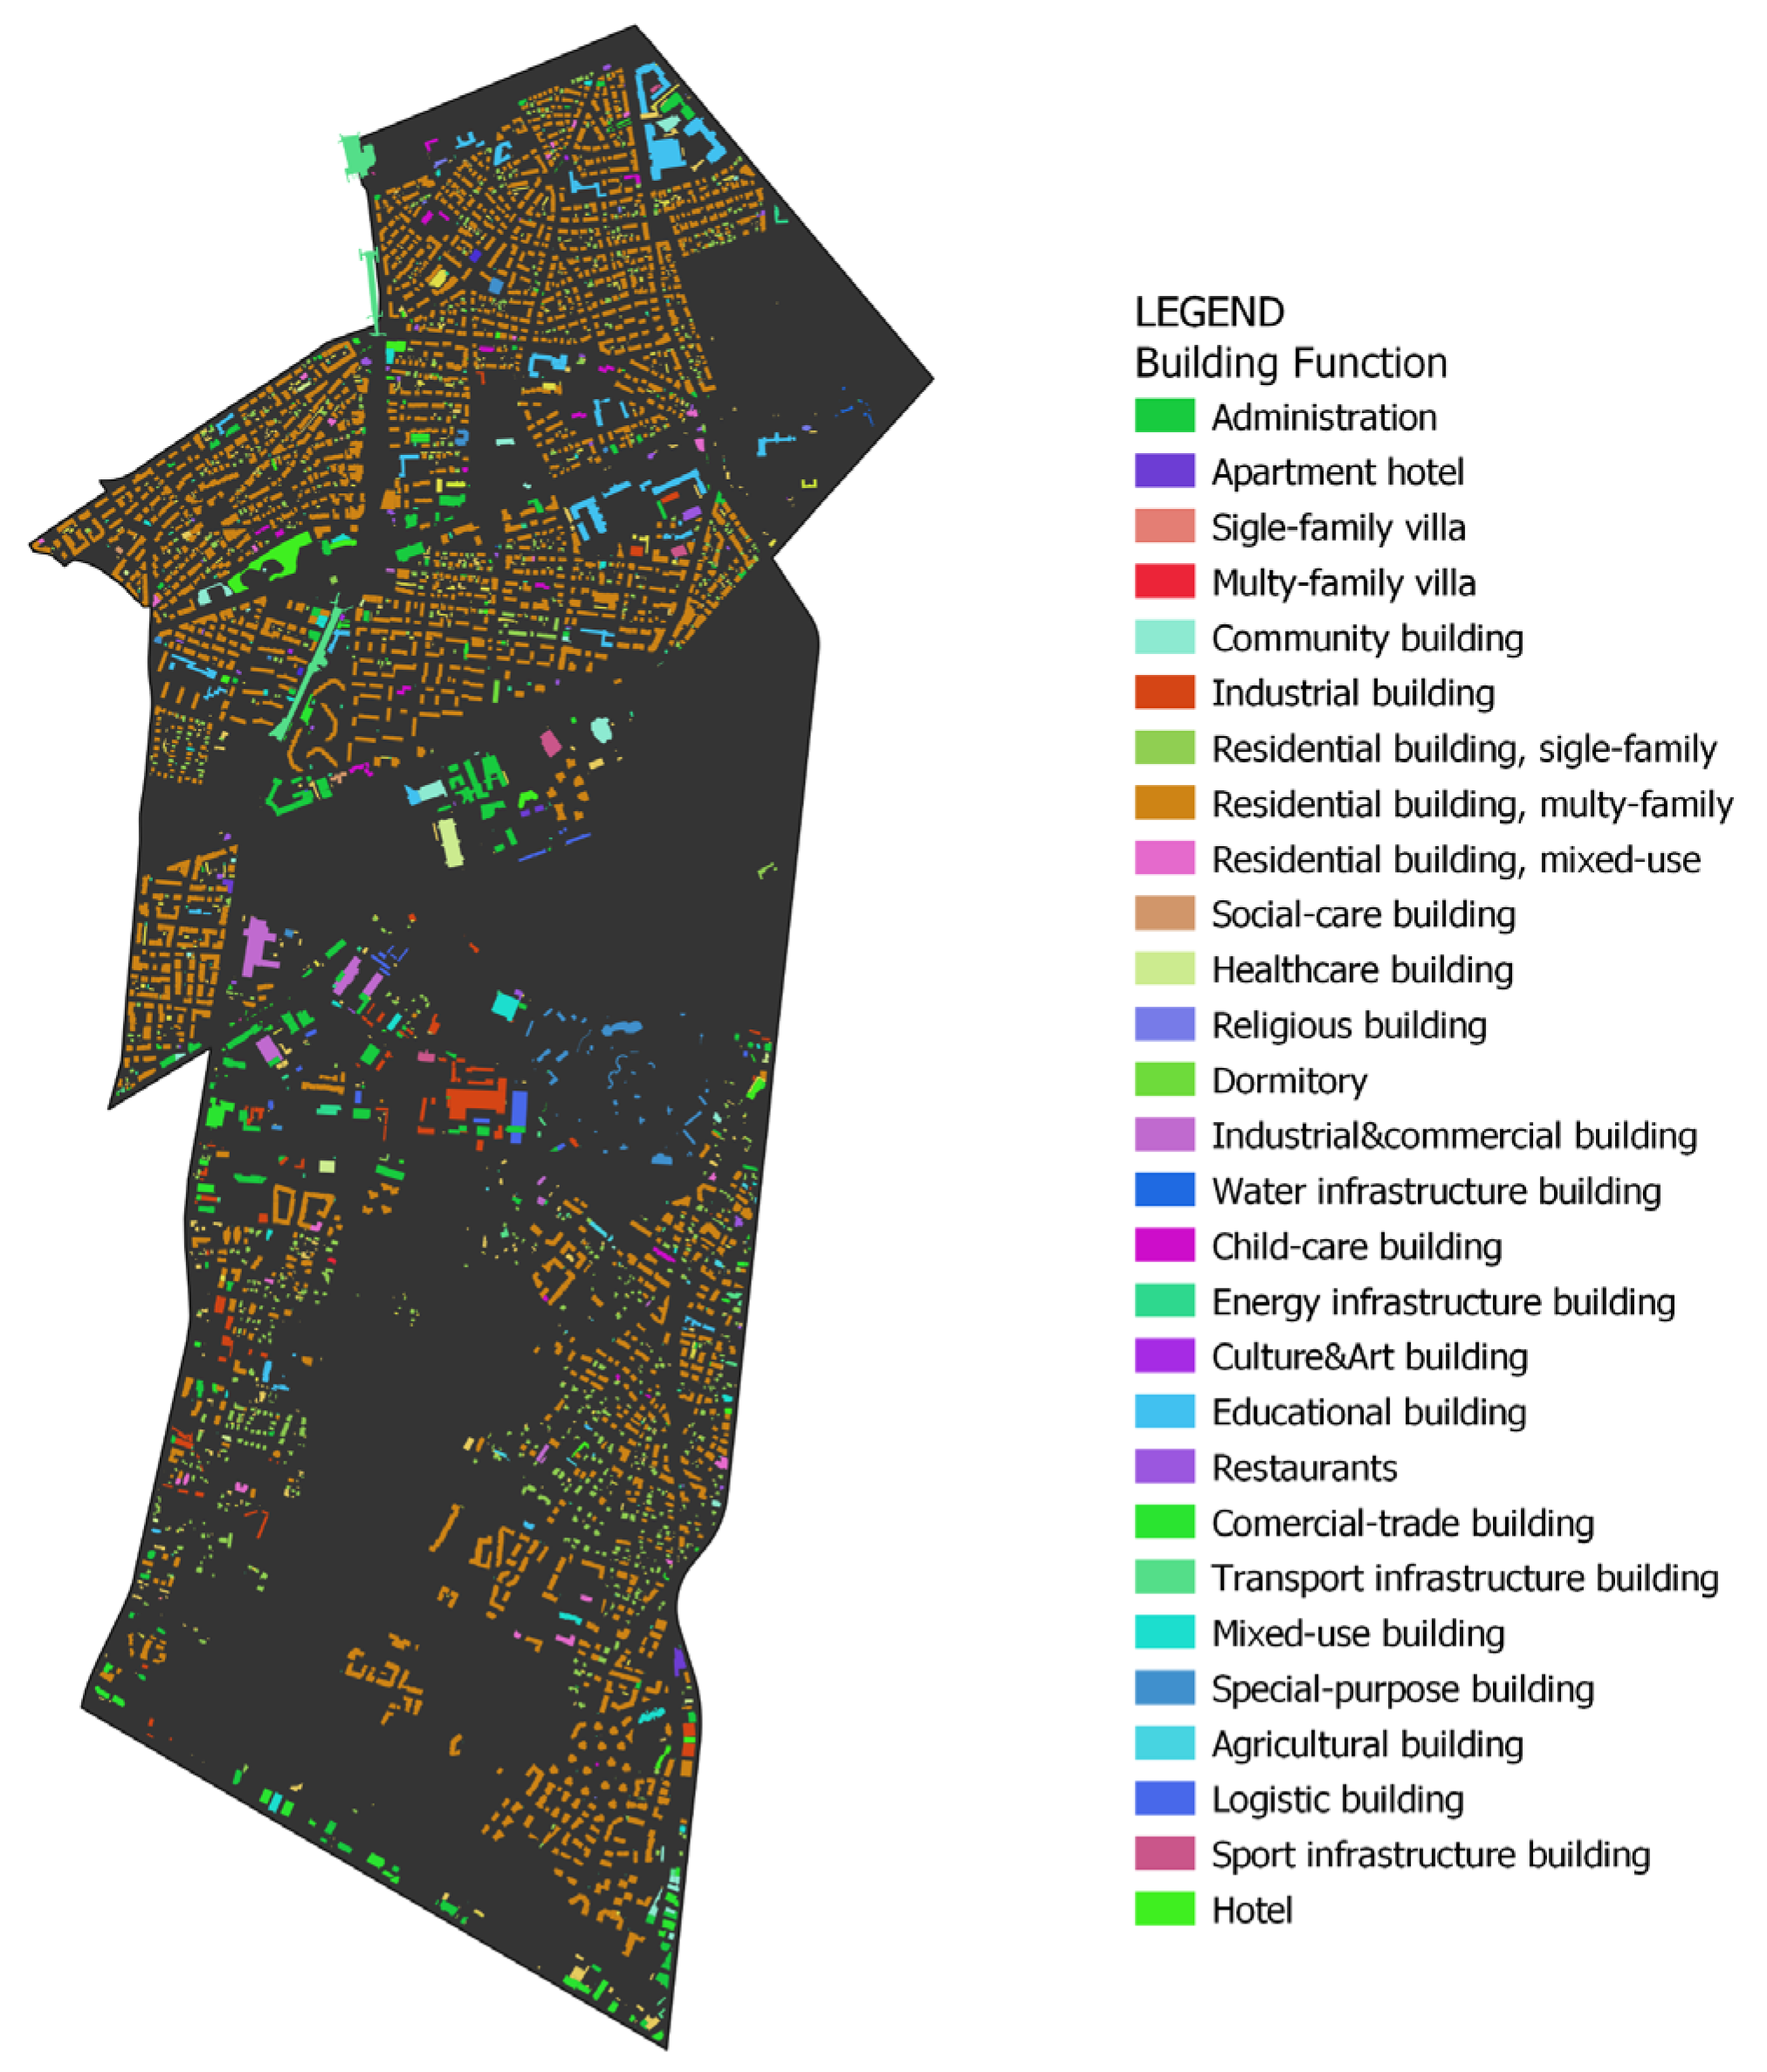
Furthermore, the district is quite multifunctional, accommodating several primary schools as well as high schools, universities’ buildings, kindergartens, old and new business buildings, big and small hotels, and one of the largest shopping centres in Sofia (see Figure 6). This variety of building typologies and functions reflects upon the buildings’ construction and their rooftops’ structure. This impacts the approach for data preparation and further roof classification, making it much more complicated.
One can say the old buildings dated before the 1960s–1970s are mostly low or medium-rise with gable or hipped roofs. The new buildings from the 1980s–1990s are mostly high-rise with flat roofs, and the new buildings of the 21st century have a complex character with a mix of many different elements, roof structures, and levels.
The orthophoto used for preparing the dataset is provided in TIFF format. It was obtained in 2020 through aerial photography with an ultra-wide range digital camera (UltraCam Eagle Mark 3, Vexcel, Denver, CO, USA). The orthophoto has the following characteristics:
- Height of flight above the terrain: 2850–3200 m;
- Longitudinal overlap: 60%;
- Transverse overlap: 30%;
- Aerial imaged area—1961 sq. km, of which 1342 sq. km is the territory of the Metropolitan Municipality Sofia. For this project, the study area of the Lozenets district is 9.2 sq. km;
- Resolution: 10 cm/pix for the urban area;
- Bands: RGB;
- Number of tiles (georeferenced JPG files): 39.
4. Methods
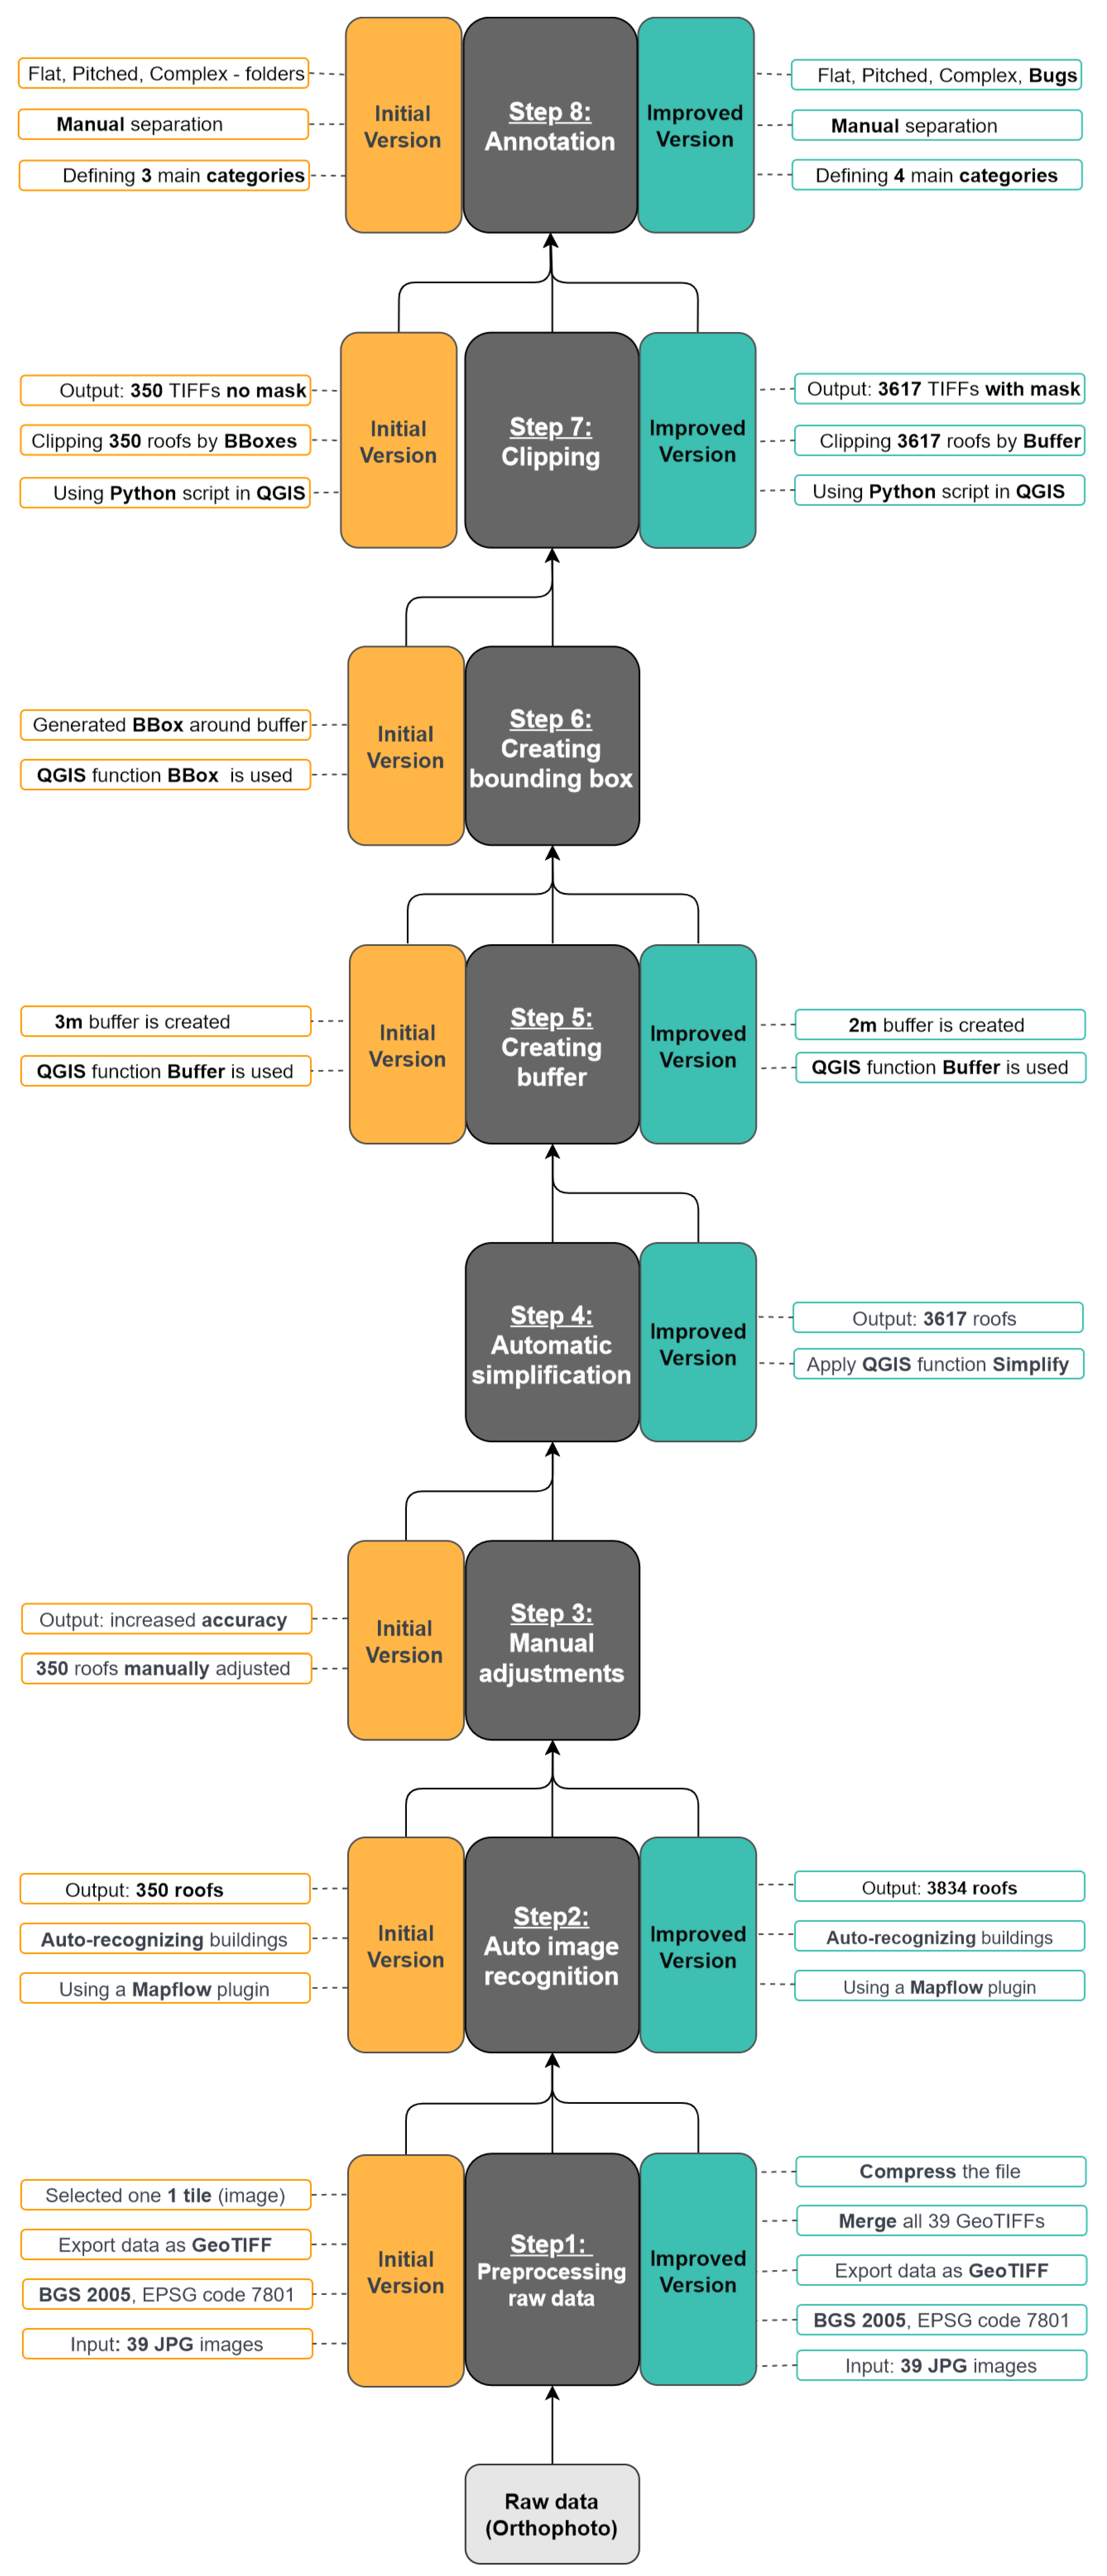
Two versions of the proposed approach are chronologically applied to the preparation of two separate datasets that differ quantitatively and qualitatively. The initial version involved testing a small area and experimenting with various parameters, while the improved version was developed using the knowledge and results gained from the initial version to optimize and modify the approach for a larger area. Therefore, the two versions are not directly comparable, but instead are complementary, and follow a common sequence of steps. Thus, different challenges have been met, lessons learned, and knowledge gained. The entire process could be split into eight steps using different tools (see Table 1). Some steps are common for both versions of the approach but may have different parameters.
Figure 7 shows a sequence diagram of the approach, including tools and operations applied and the outputs obtained for both versions.
4.1. Step 1: Preprocessing Input Data
The input data includes 39 separate tiles (full and partial):
- 11 full tiles (size 8001 × 5001 px);
- 28 partial tiles (only part of the content in the tile is a raster image belonging to the study area).
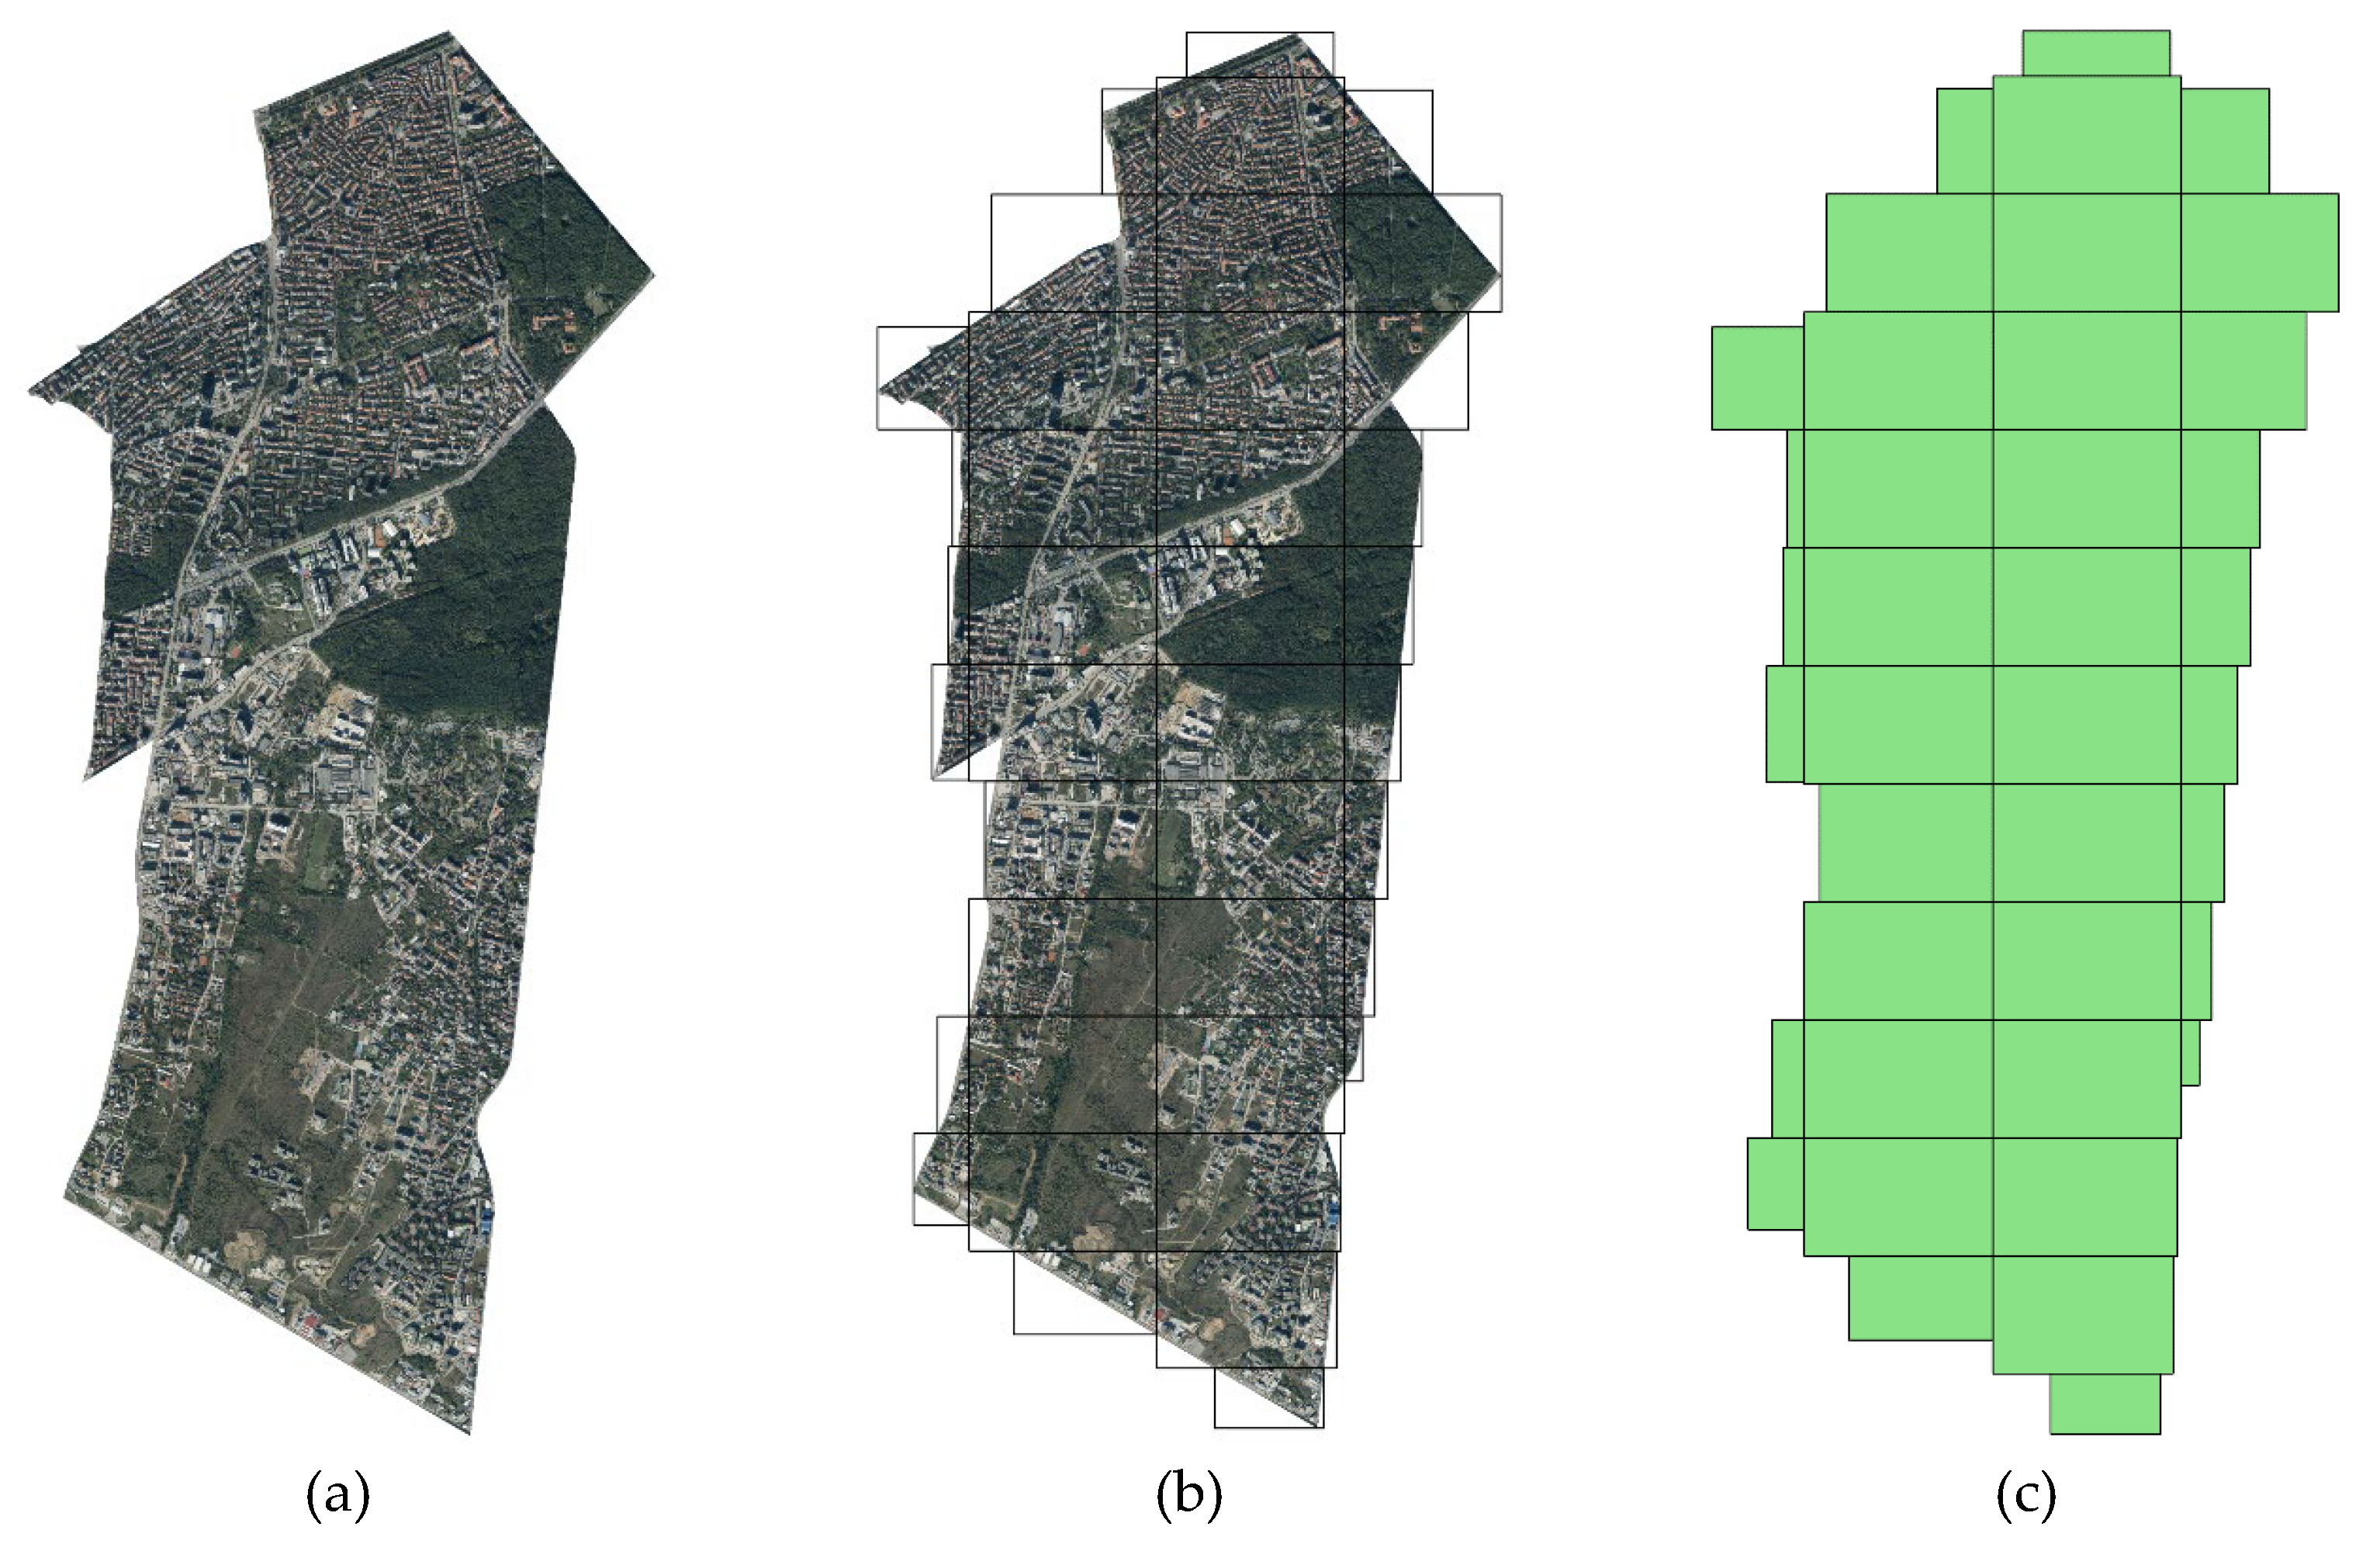
Each tile is stored as a separate image in JPG format. Figure 8 presents the orthophoto clipped by the boundary of the Lozenets district (Figure 8a), the distribution of the full and partial tiles (Figure 8b), and the entire tile-grid (Figure 8c).
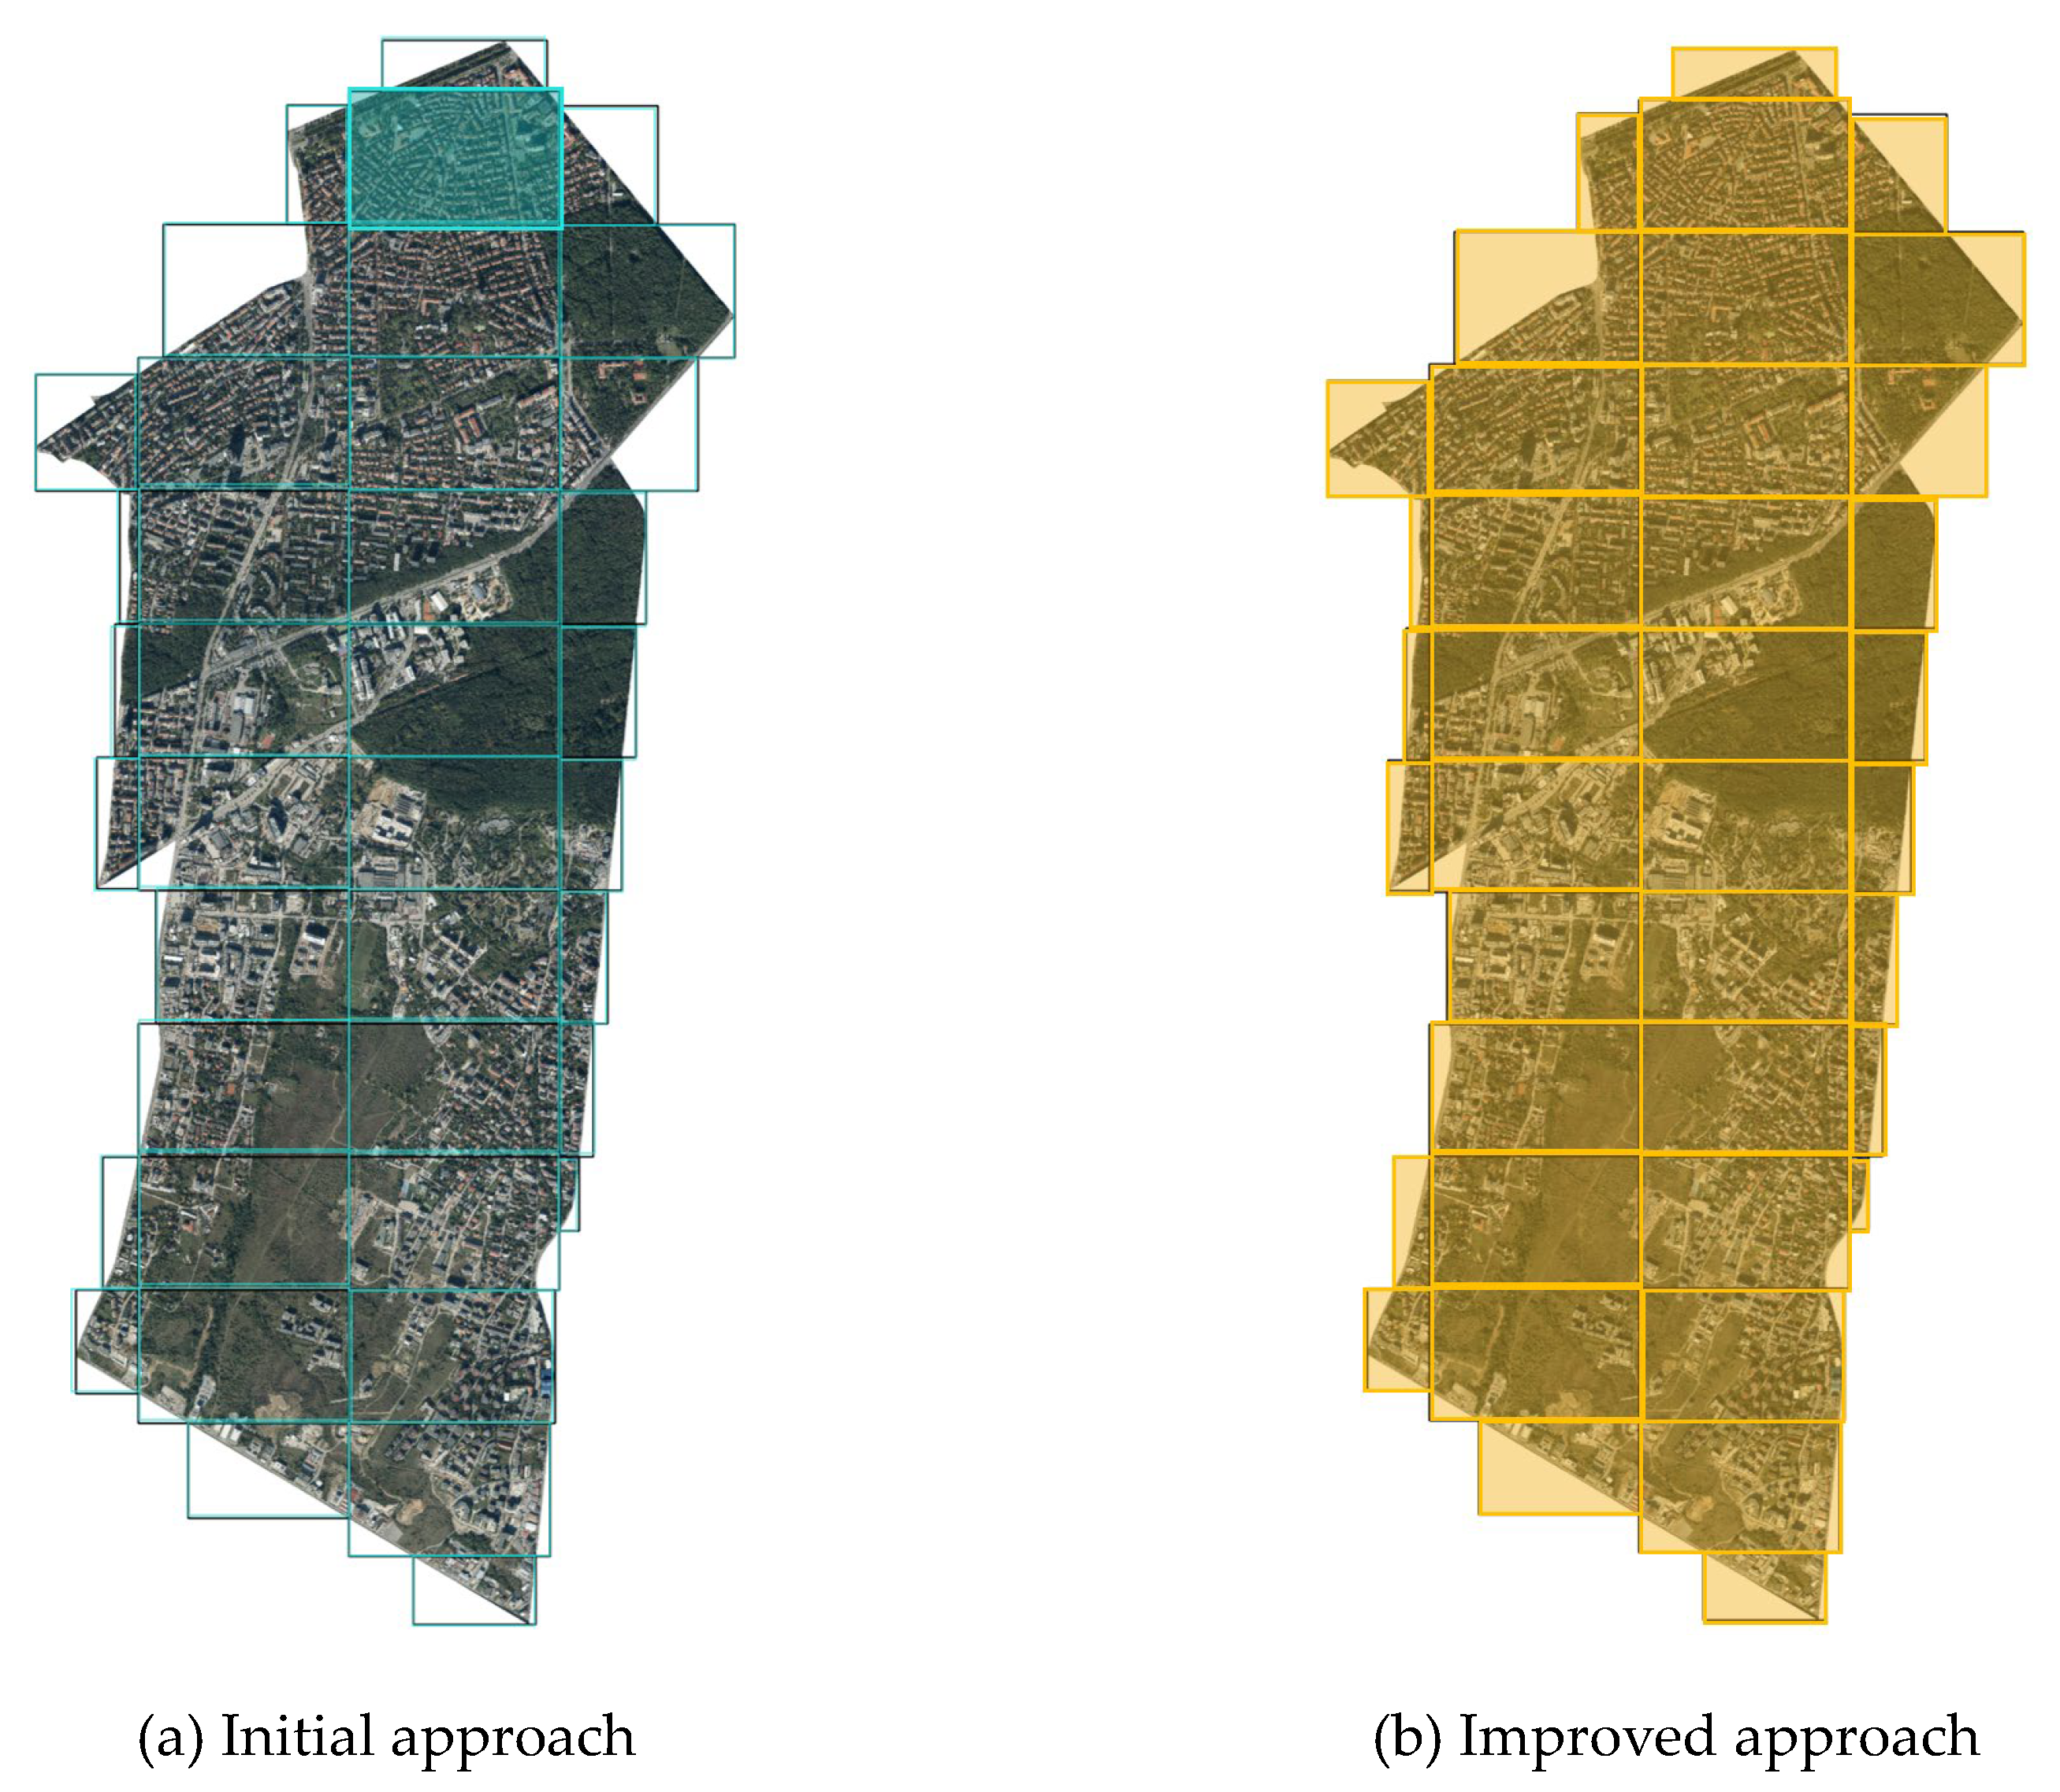
For the implementation of the first initial version, only one tile (image) was selected (see Figure 9a), while the improved version considers the entire Lozenets district so that all tiles were used (see Figure 9b). In both versions, the dataset (all 39 georeferenced JPG images) was first set to the appropriate projection and coordinate system, which is BGS 2005 (EPSG code 7801) for the region of Bulgaria, and afterwards exported in GeoTIFF format. In the improved version, where all 39 tiles are used, a merge process was performed to operate with only one GeoTIFF file. However, due to the quite large size of the exported file (5.88 GB), compression was performed without the quality being affected.
4.2. Step 2: Automatic Image Recognition
The input dataset is a single raster image. That is why methods and tools for recognising buildings and roofs from an orthophoto were researched, rather than relying on the building’s footprints from the cadastre or OpenStreetMap.
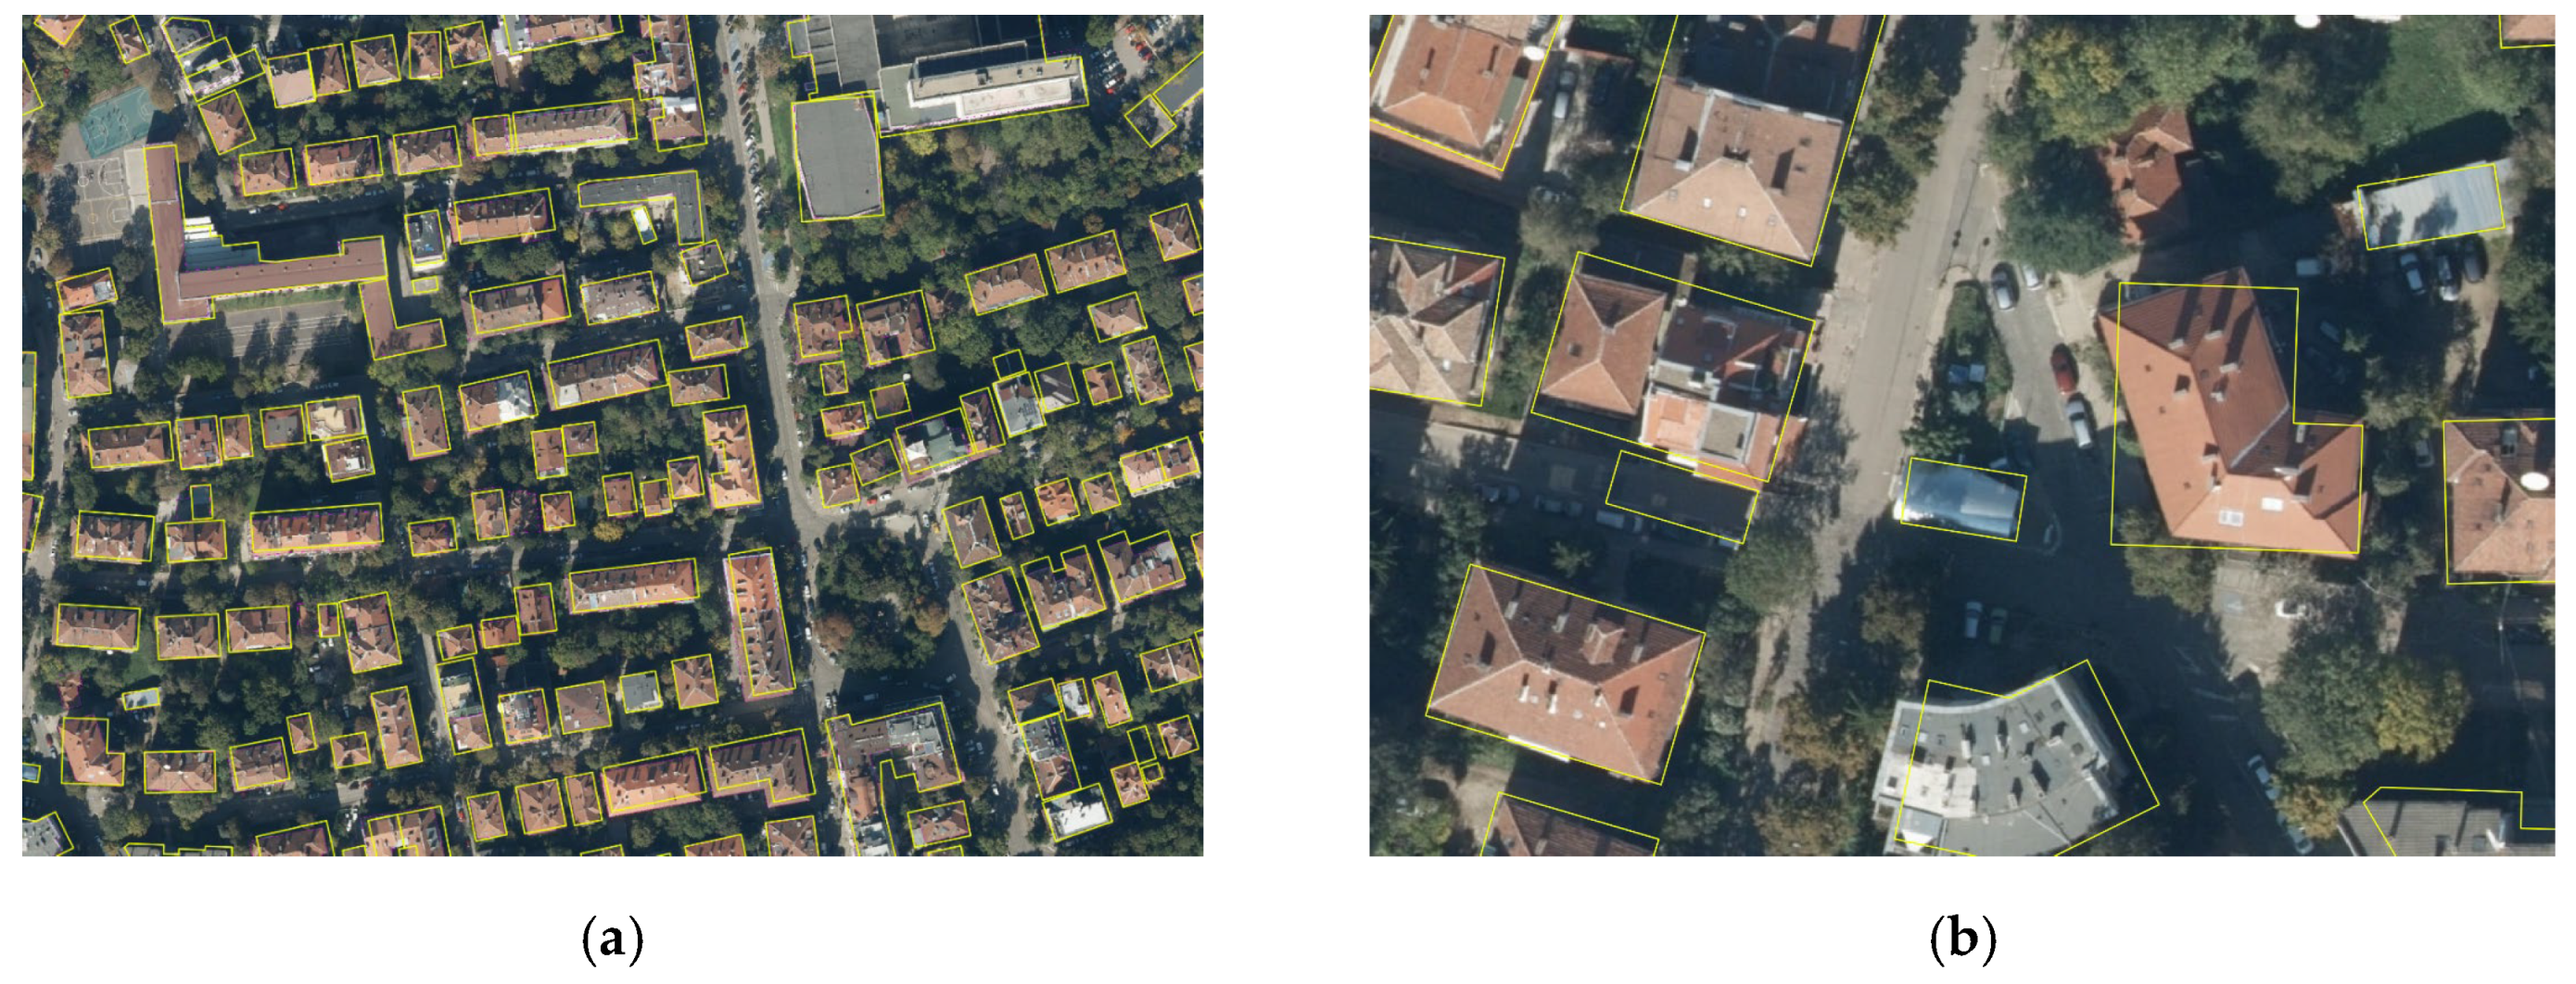
For this step, a plugin in QGIS named Mapflow was used [25]. The tool automatically generates vector roof outlines (polygons). The output seems quite accurate at first glance (Figure 10a). However, some errors are identified, varying from a very small difference in the outline to completely wrong-outlined objects, merged buildings, or rotated outlines (Figure 10b).
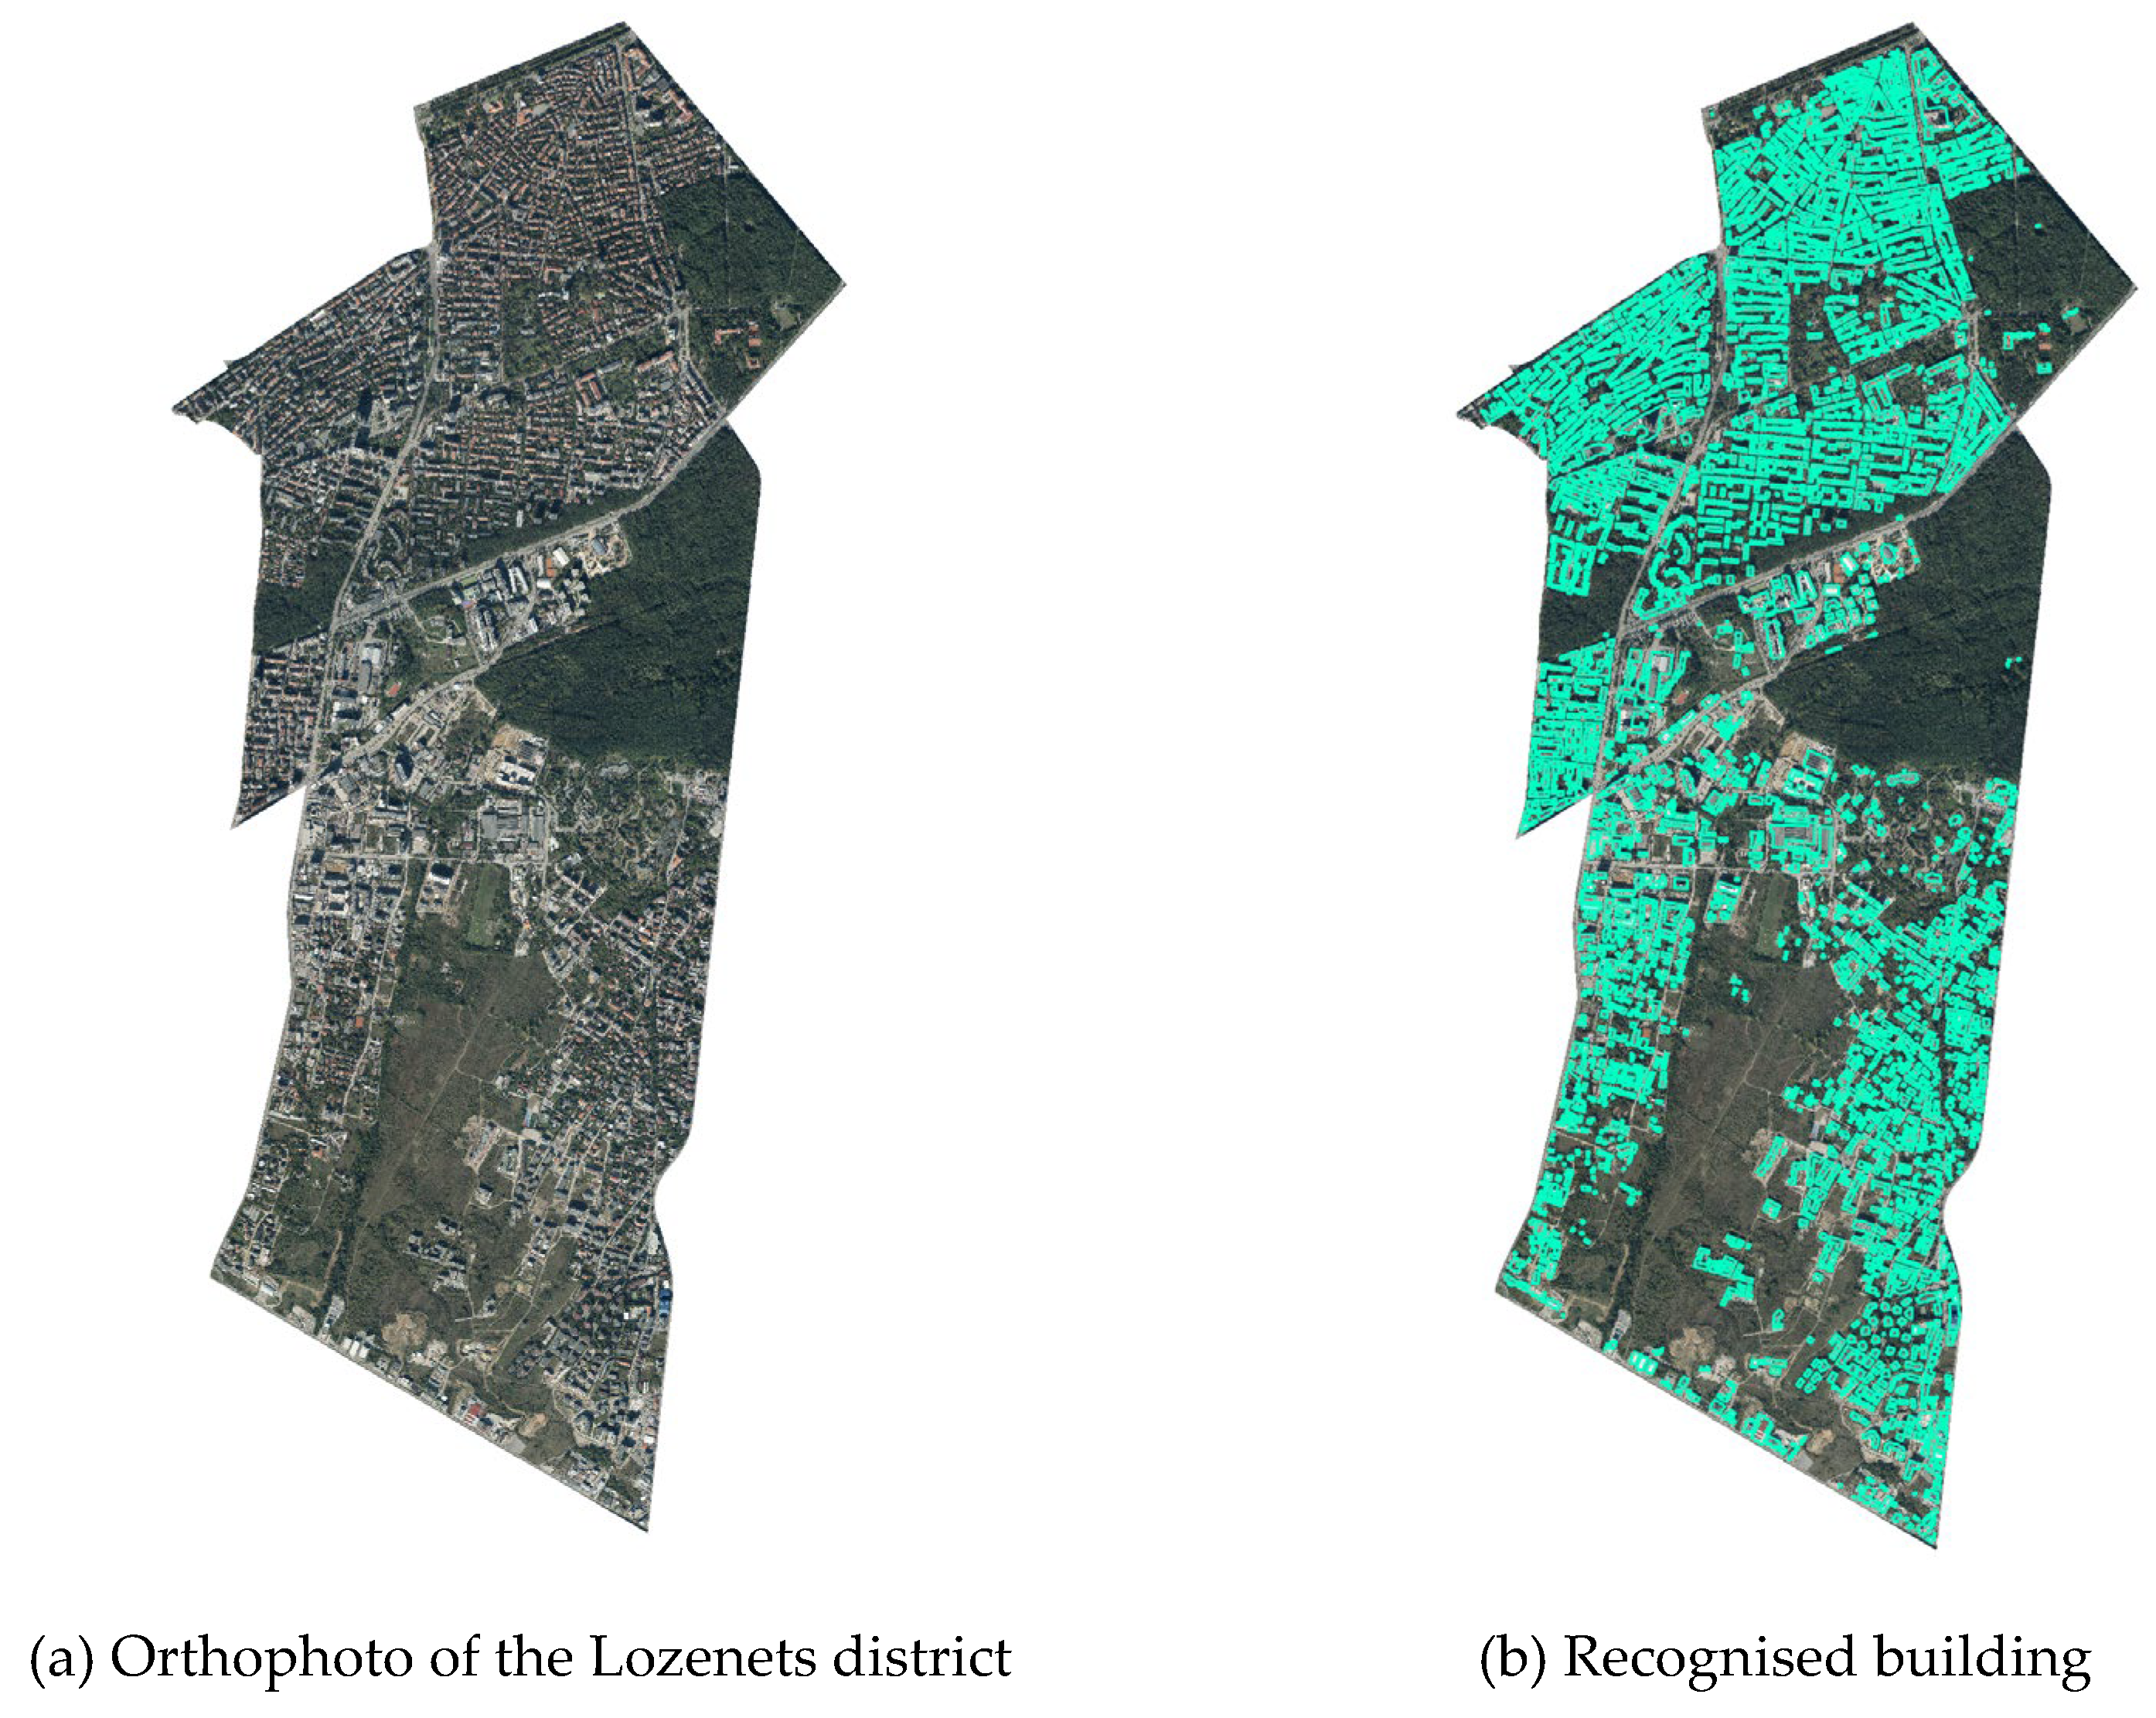
As a result, from this step, 350 polygons (vector roof samples) have been generated from the initial version of the approach and 3834—from the second one. Figure 8 shows the distribution of the buildings in the Lozenets district (Figure 11a) and all 3824 buildings recognised by Mapflow (Figure 11b).
4.3. Step 3: Manual Adjustments
Since Mapflow did not produce completely accurate results, a manual adjustment in QGIS environment was performed to create a high-quality dataset.
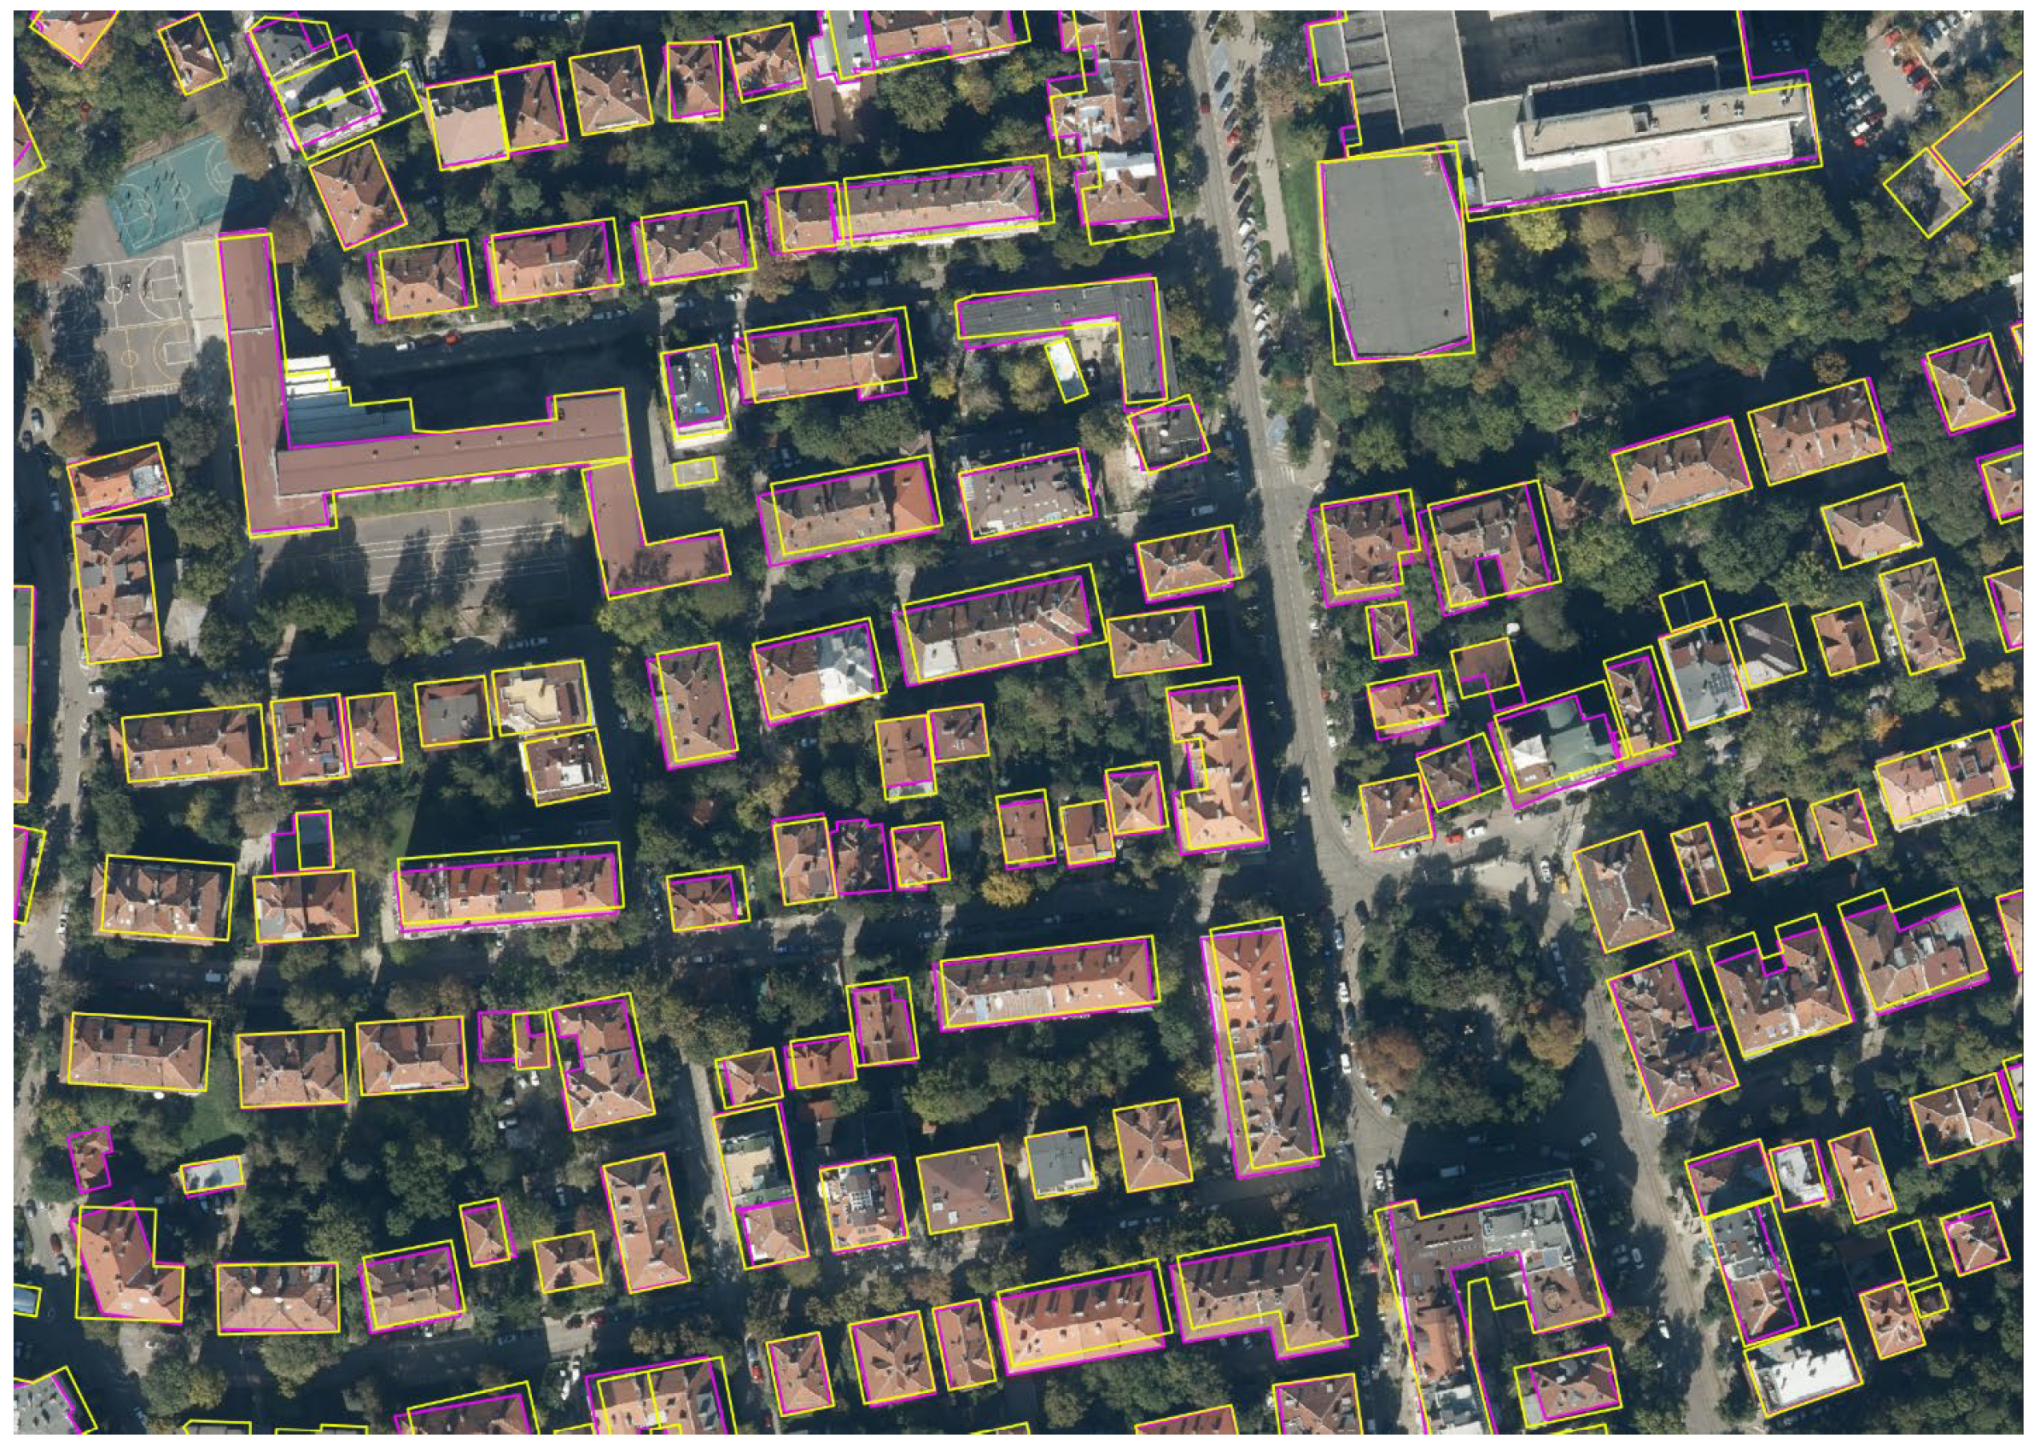
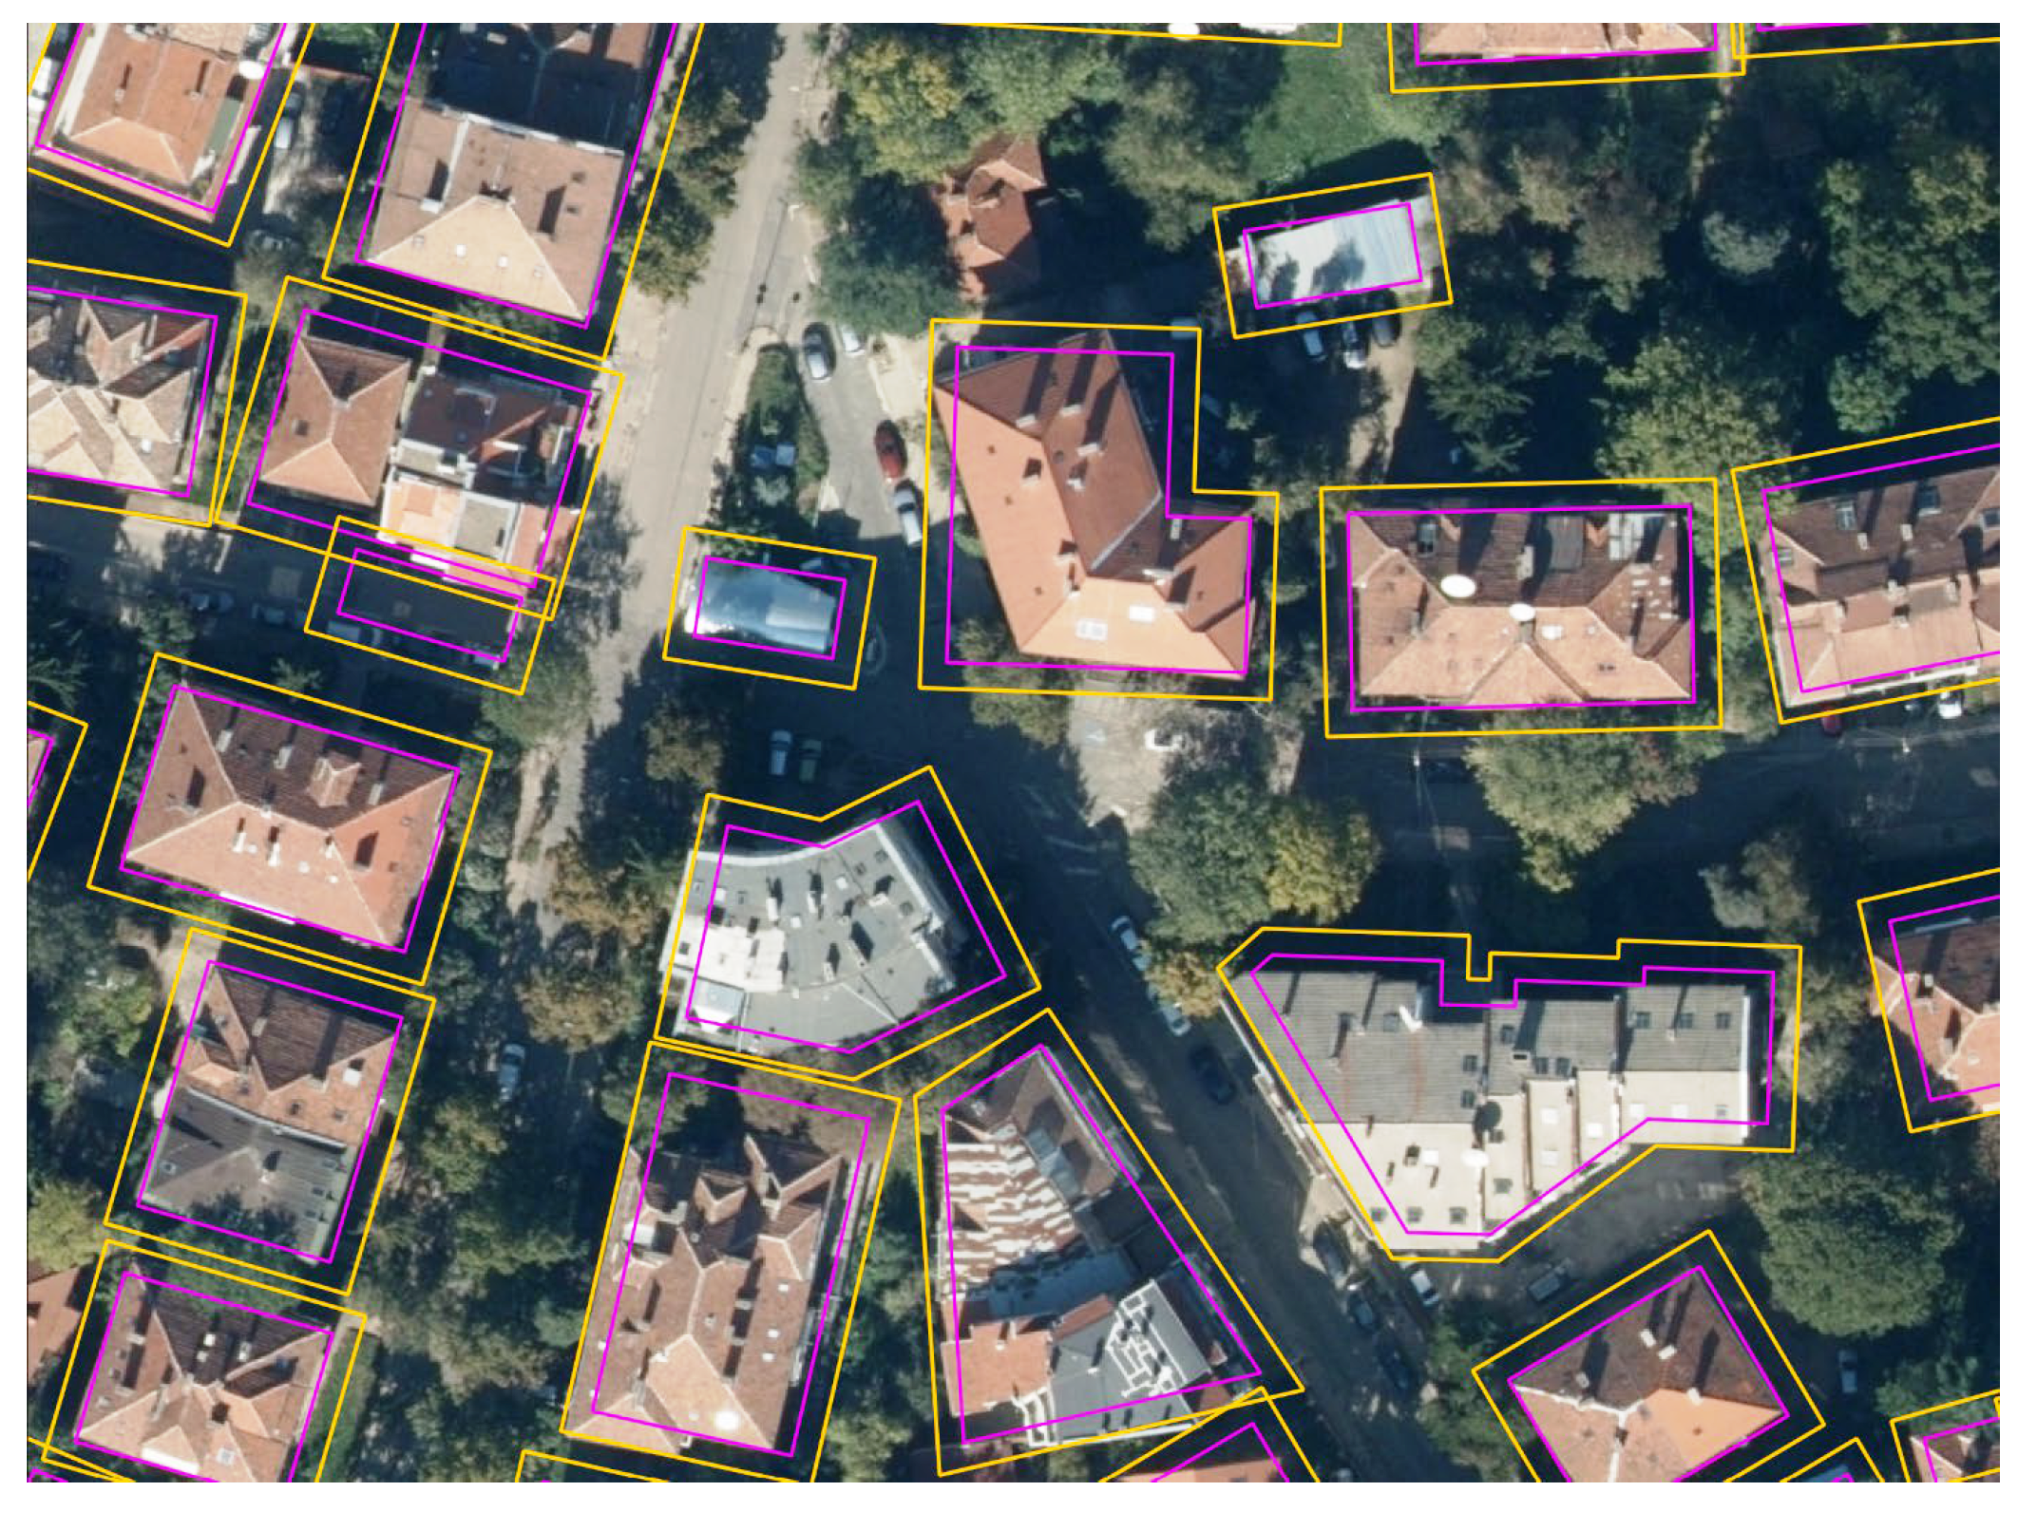
This step was not been implemented in the improved version of the approach due to the much larger number of rooftops. However, it was applied in the initial version, where all 350 polygons were manually adjusted to the original roof outlines based on the expert assessment. The accuracy of the roof’s outlines of the first dataset was significantly increased, close to 100%. The yellow outlines are automatically generated, and the purple ones are manually corrected (see Figure 12).
4.4. Step 4: Automatic Simplification
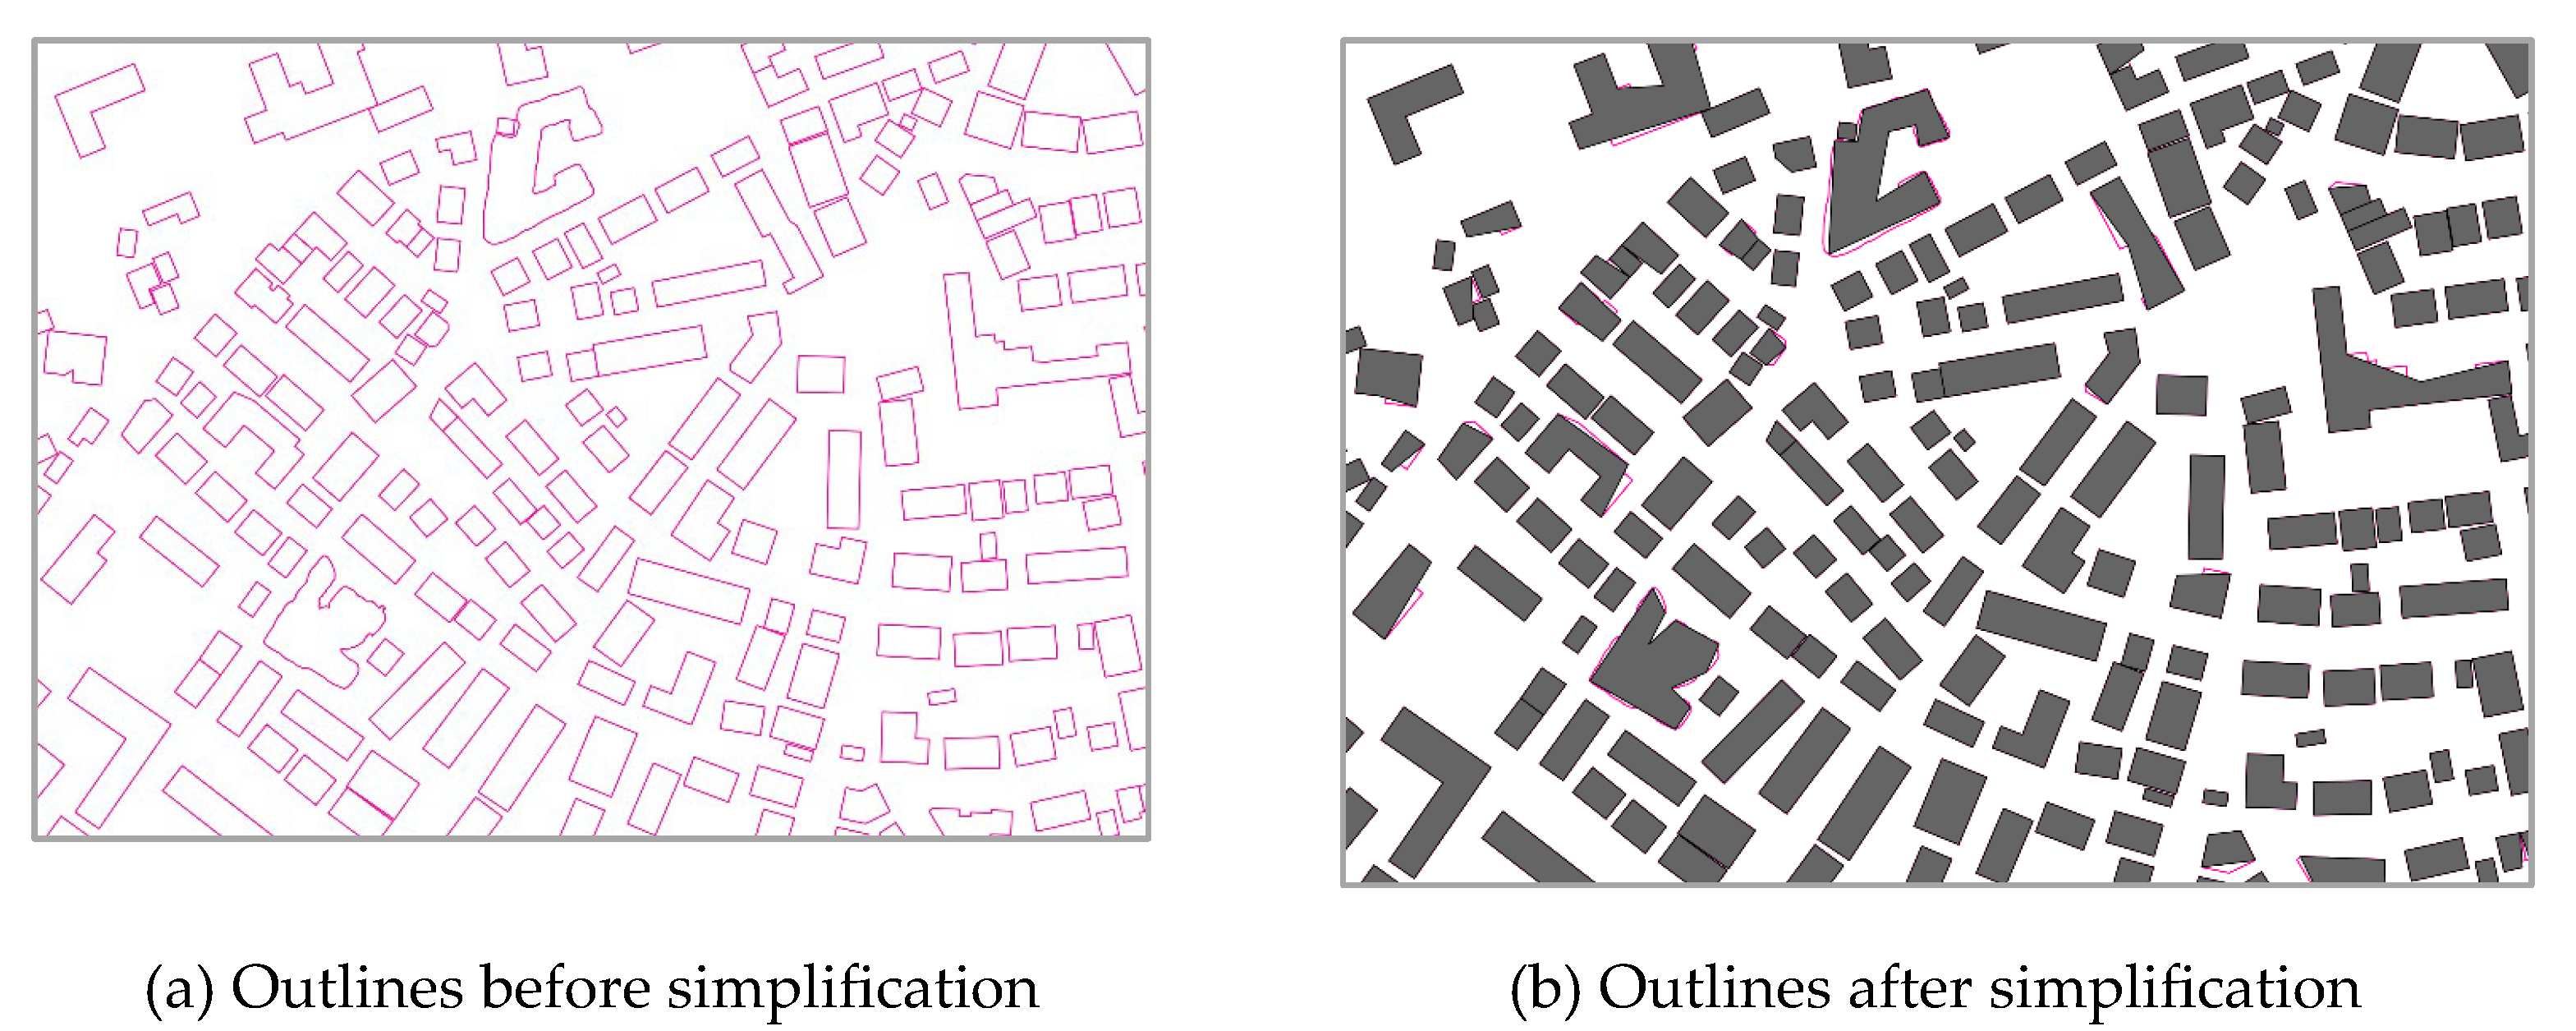
This step was implemented to improve the approach since manual adjustments are inappropriate when there are many samples. Some curly lines are improved, and some more angled shapes are generalised (see Figure 10), but the number of rooftops has also been reduced from 3834 to 3617 due to some merging. However, this operation does not significantly affect the accuracy of the final dataset. Figure 13a shows the generated buildings before simplification in magenta, while Figure 13b presents the new outlines of the buildings after simplification in dark grey. The initial outlines are retained for comparison.
4.5. Step 5: Creating a Buffer
In both versions of the approach, a buffer around the roof outlines is automatically generated using a function called Buffer in QGIS. The goal is to minimise the error when recognising the roofs, guaranteeing that the entire roof will always be captured during clipping. The initial version used a 3 m buffer. During the improvement, it was estimated that a 2 m buffer would be sufficient even though the outlines were not corrected manually (see Figure 14). Note, the larger buffers cover larger areas, yet the risk of clipping through the roof is lower. On the other hand, capturing a much larger area around the roof can lead to the inclusion of additional urban objects that are not part of the roof outline or belong to the roofs of other buildings.
4.6. Step 6: Creating a Bounding Box
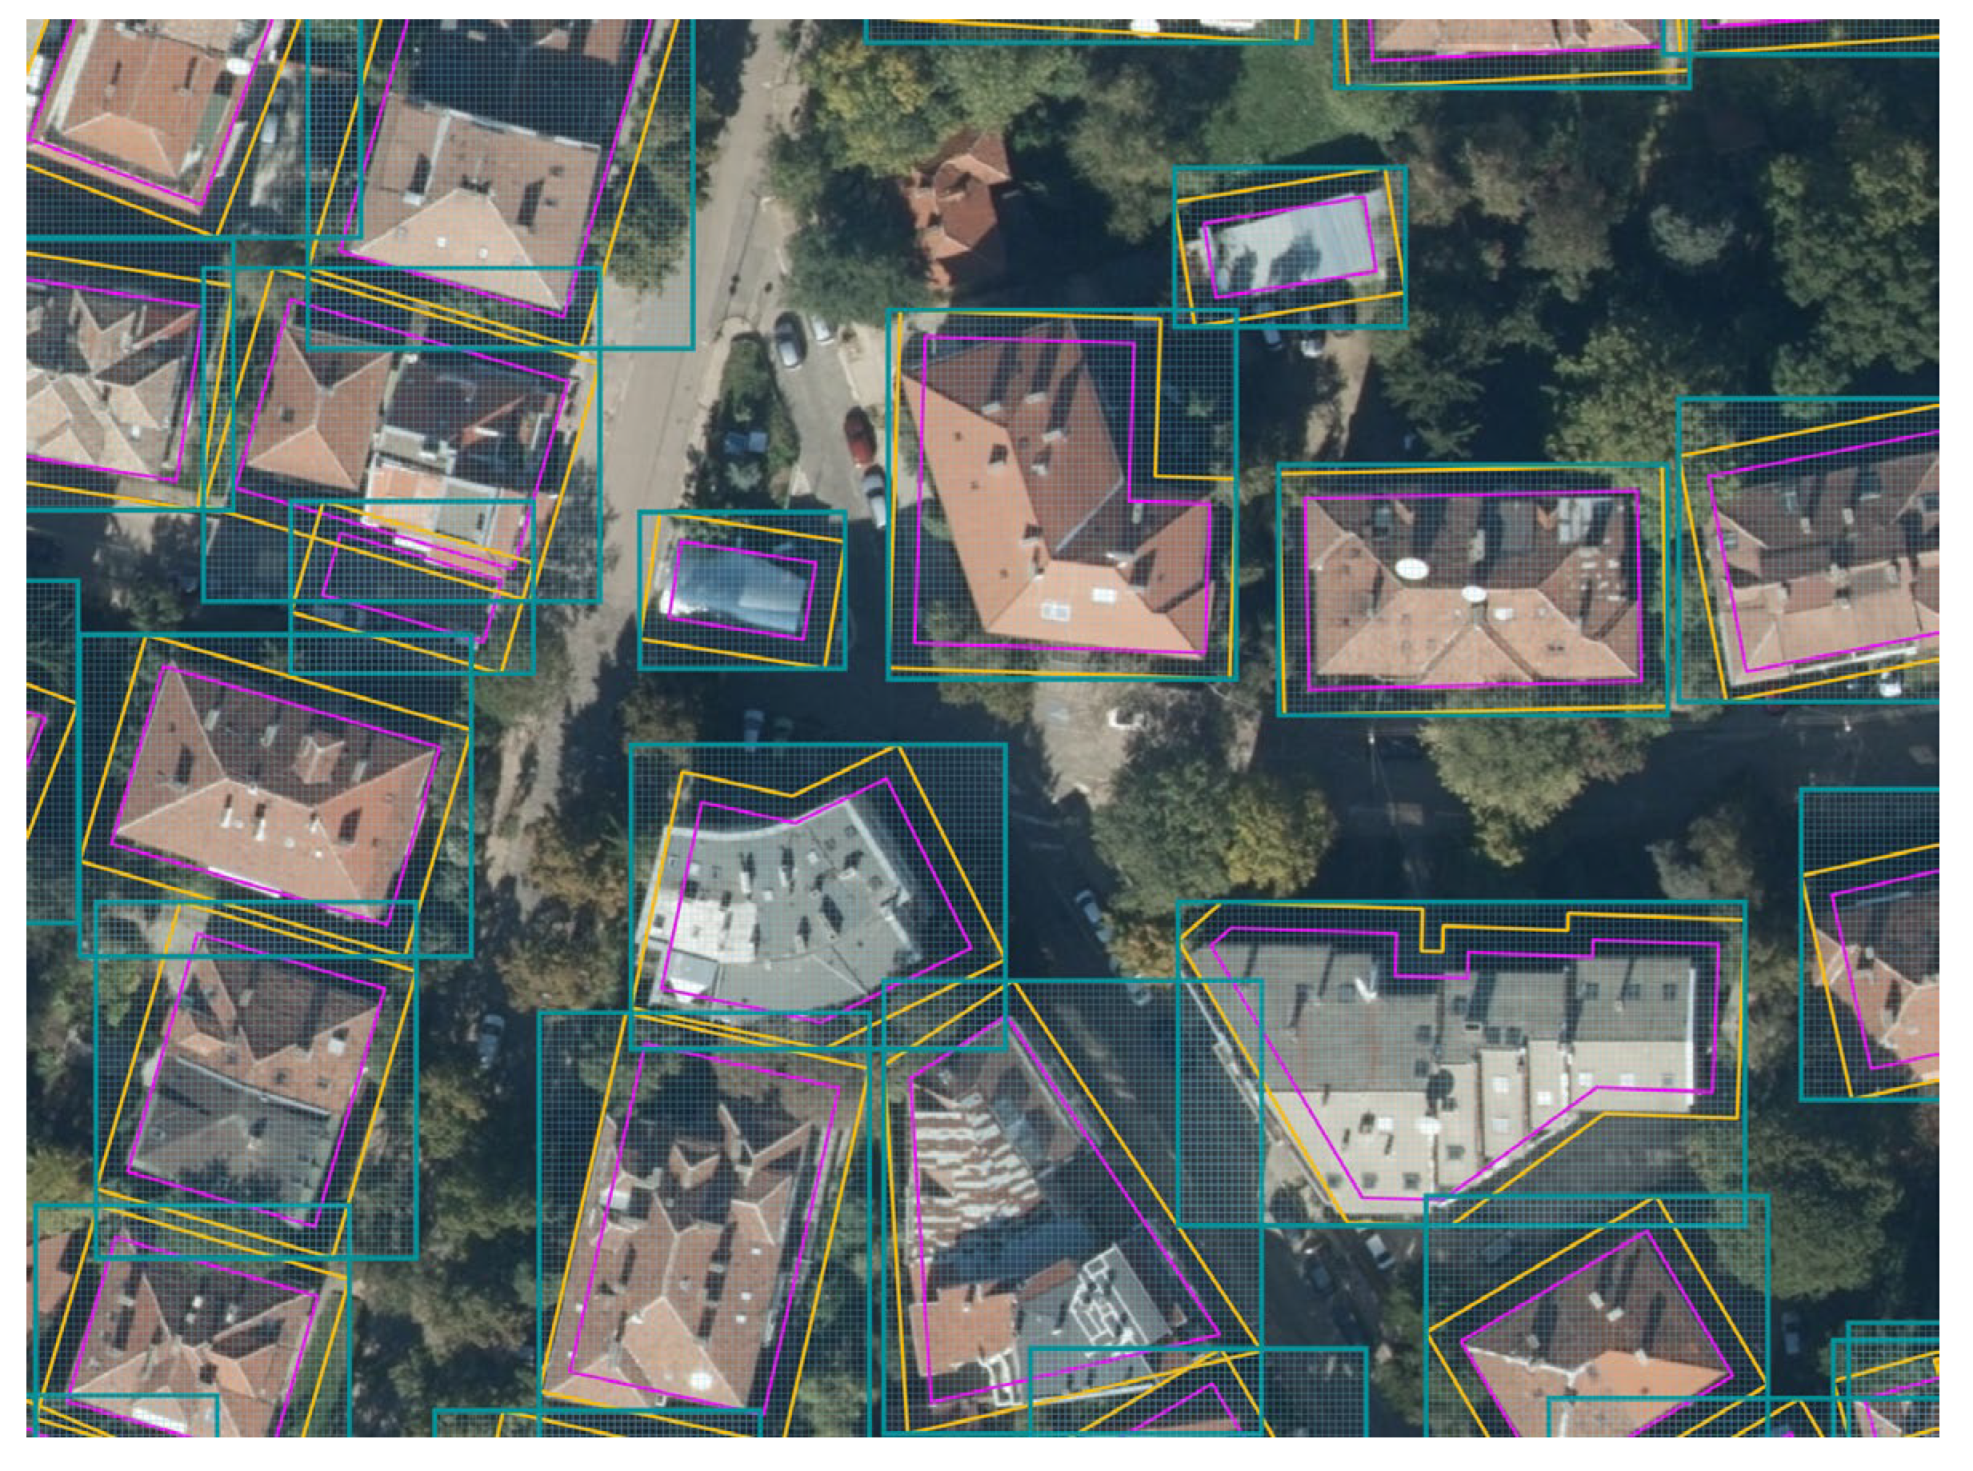
Initially, a bounding box around the buffer polygon was created and used as a clipping outline. The QGIS function “Bounding boxes” was applied. The bounding boxes are a well-known image annotation type, which, in this case, could also fix the errors from the automatically generated outlines. However, similarly to the larger buffer polygon, the bounding box creates an output image which is beyond the roof outline of the particular building and includes additional urban objects such as parts of trees, streets, other objects, and even parts of neighbouring building’s roofs (see Figure 15).
Possibilities for the enhancement of the approach were identified. For example, step 6, creating a bounding box, is omitted since it was considered that only an even smaller buffer outline would work very well in the next clipping and annotation steps. The bounding box operation was discovered to be not that important since it captures a much bigger area around the building and therefore creates a separate roof image with much more noisy data.
4.7. Step 7: Clipping
All roofs have been clipped and exported as separate GeoTiff images. The clipping has been performed by Python script run in QGIS python console. Initially, the clipping was made based on the bounding boxes with a 3 m buffer, generating 350 GeoTIFF files (Figure 16). In this dataset, an image has been clipped by the green bounding box from Figure 15. The improved version of the approach performs clipping based on a 2 m buffer of the roof outline without a bounding box, generating 3617 GeoTIFF files. In this case, an image has been clipped by the orange outlines of the buffer from Figure 11. Afterwards, the images are exported in rectangular frames (virtual bounding boxes), where the space between the buffer and the frame (bounding box) is filled with black pixels as a mask (Figure 17).
4.8. Step 8: Annotation
The annotation process has been performed completely manually in both versions of the approach.
Our main objective is to create a dataset considering the local context that can be used for the training of deep learning/AI models that enable the enrichment of the cadastre data. However, the classification of roof types for the initial samples must be performed manually. Once the images are cropped and classified manually, the vector information can be augmented with additional attributes for roof type. This will allow for more accurate and automated classification in the future.
Initially, three main roof categories are chosen, namely flat, pitched, and complex. A fourth category called “bugs” is introduced in the final dataset. This is because the manual adjustment during the initial implementation of the approach created a more qualitative dataset without errors. Furthermore, the study area covered is part of the old centre with dense building development. It has mainly old buildings with simple pitched roofs, and a few new buildings with complex rooftops.
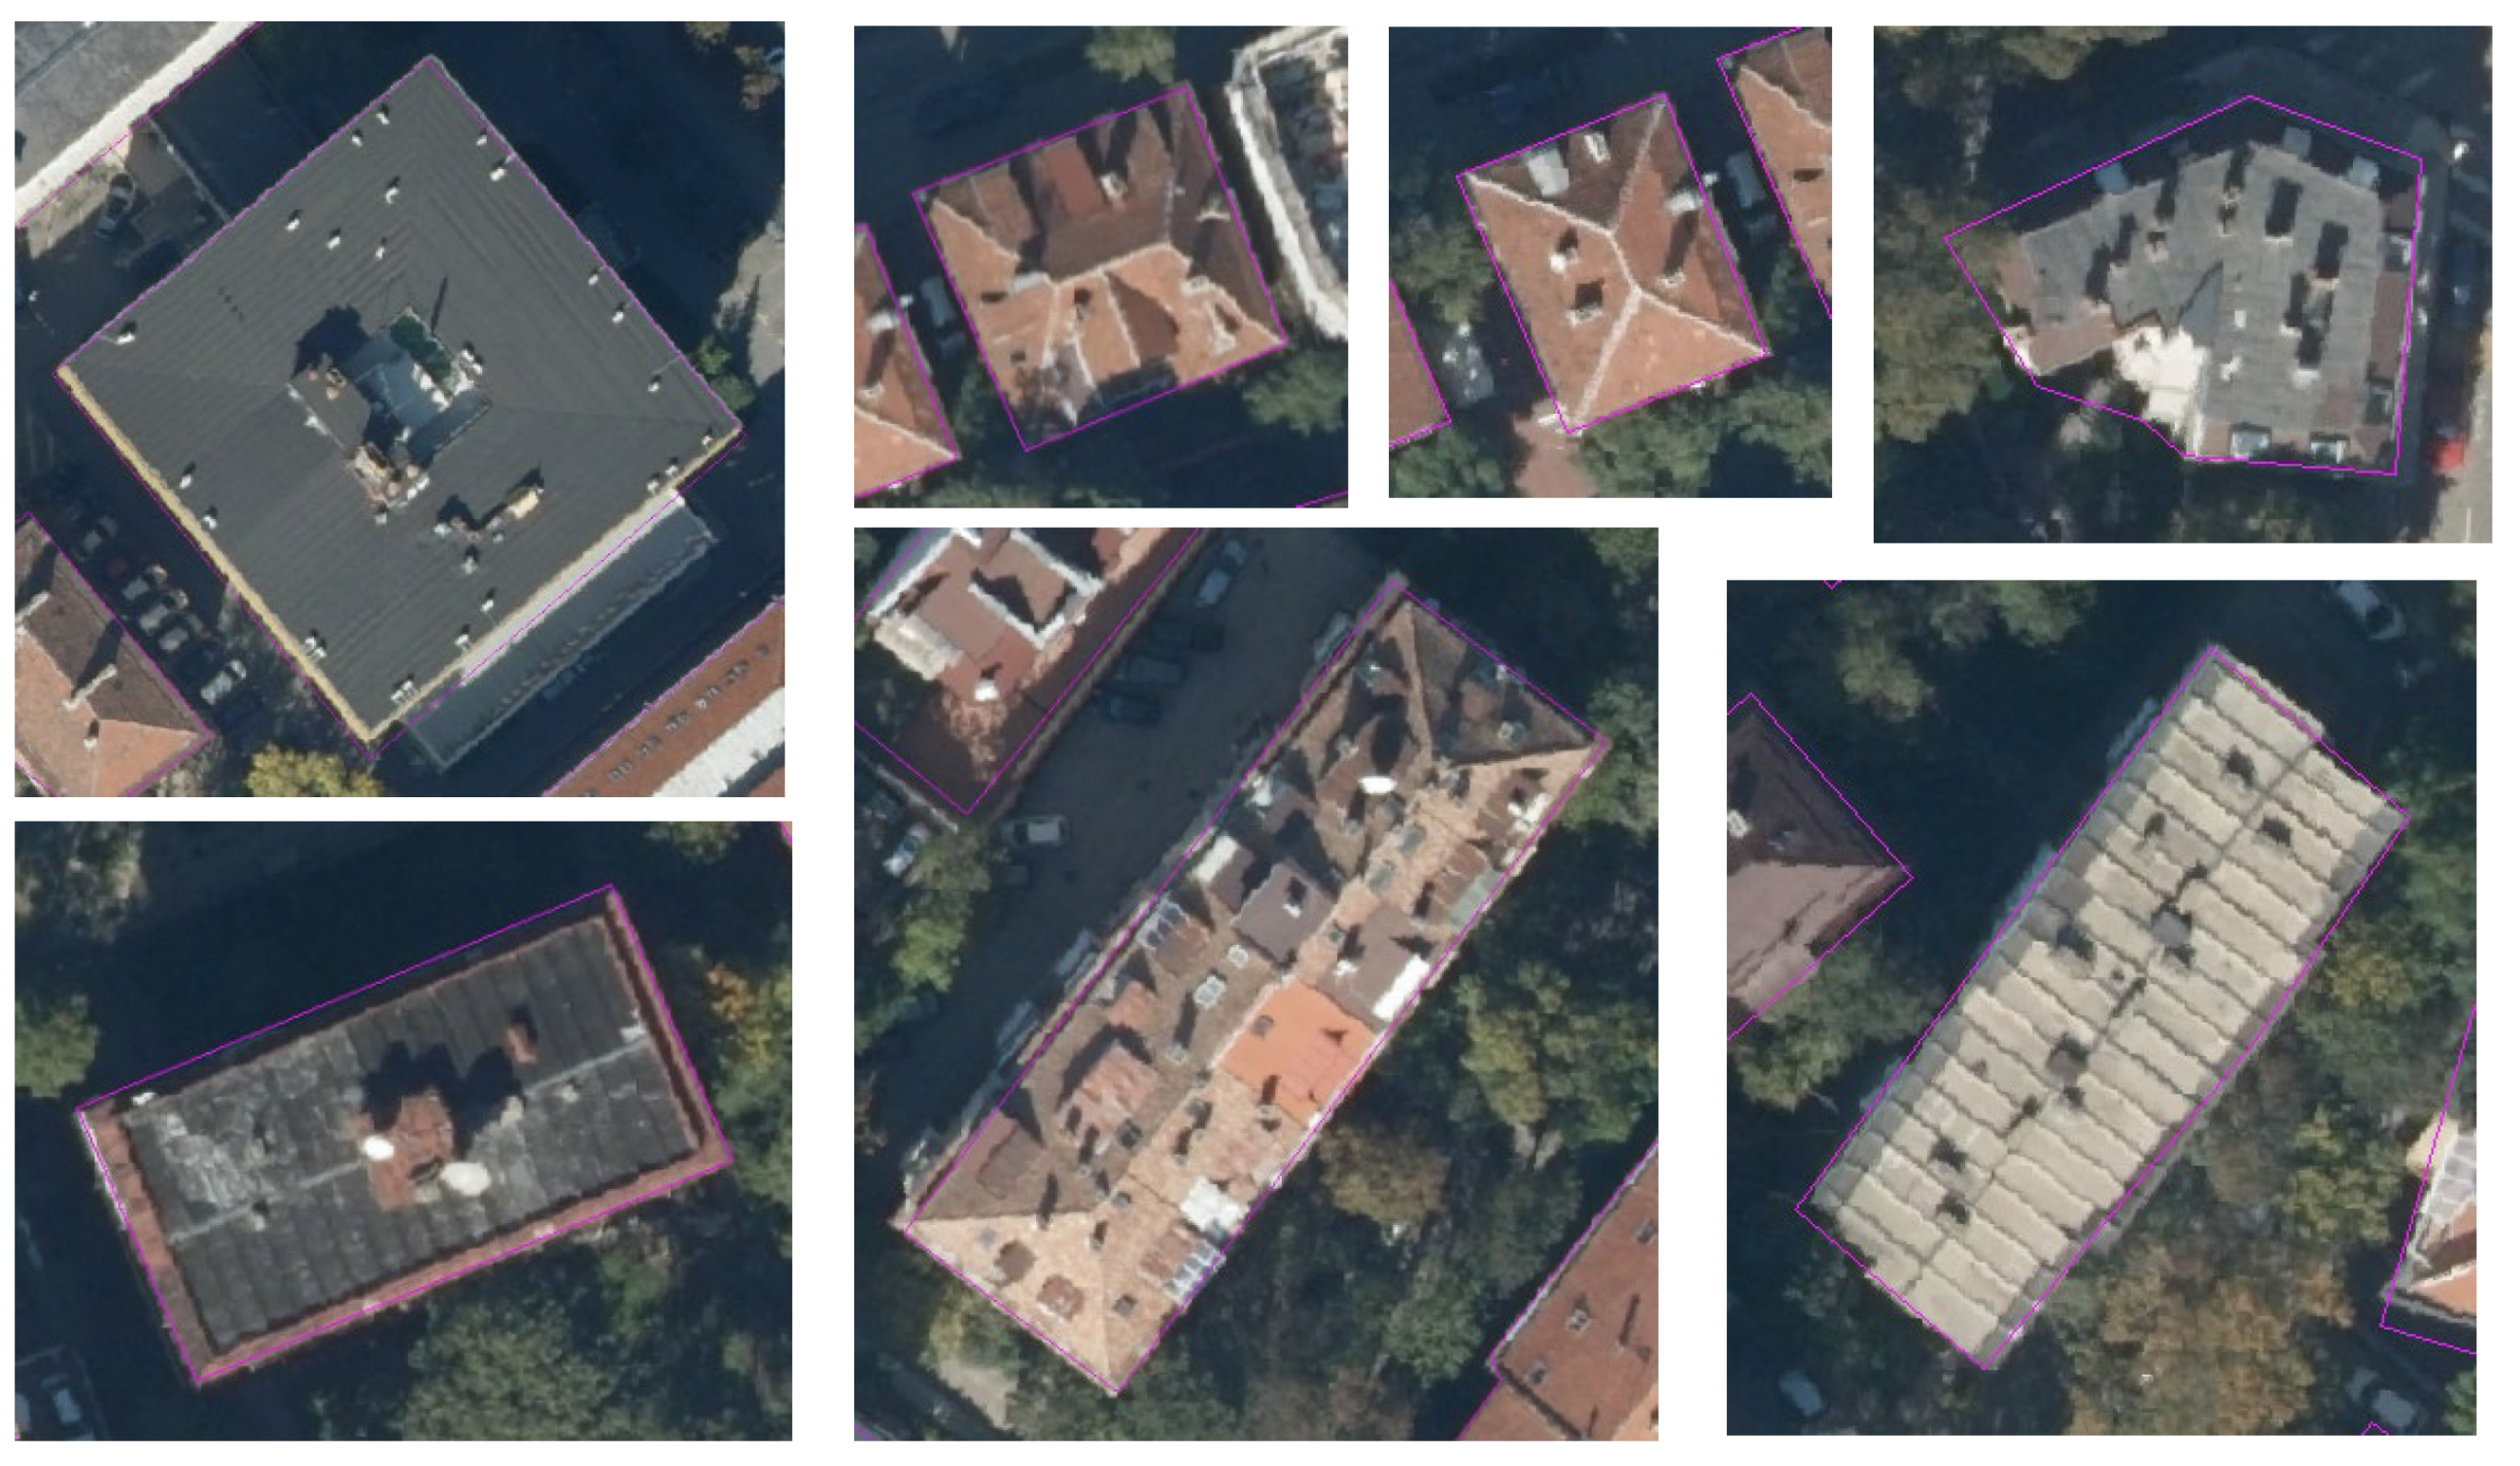
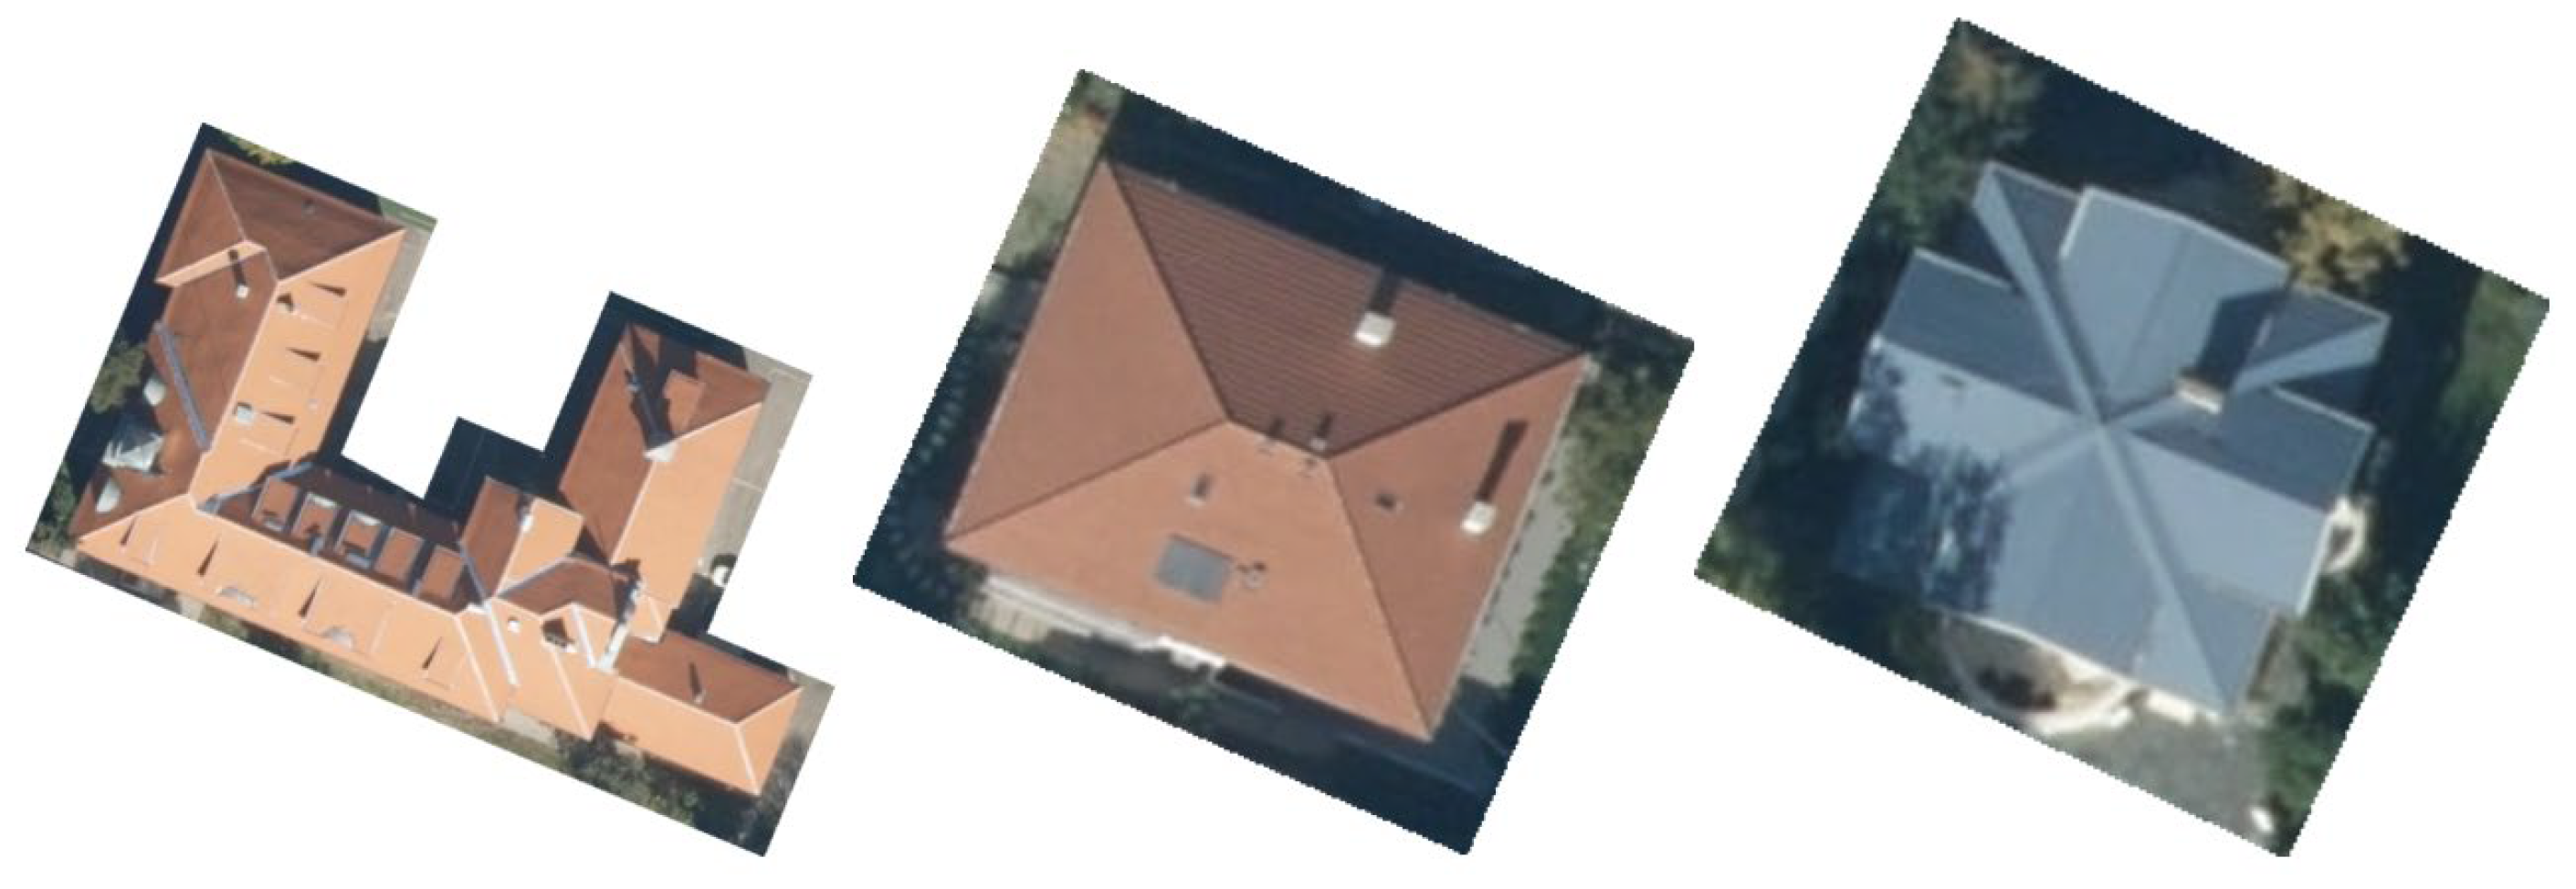
The pitched roofs category includes all sloped roofs, such as hip and gable types, and their variations. The roofs fall in this category regardless of how many planes they consist of as long as they are sloped. Figure 18 shows examples of pitched roofs obtained from the improved version of the approach.
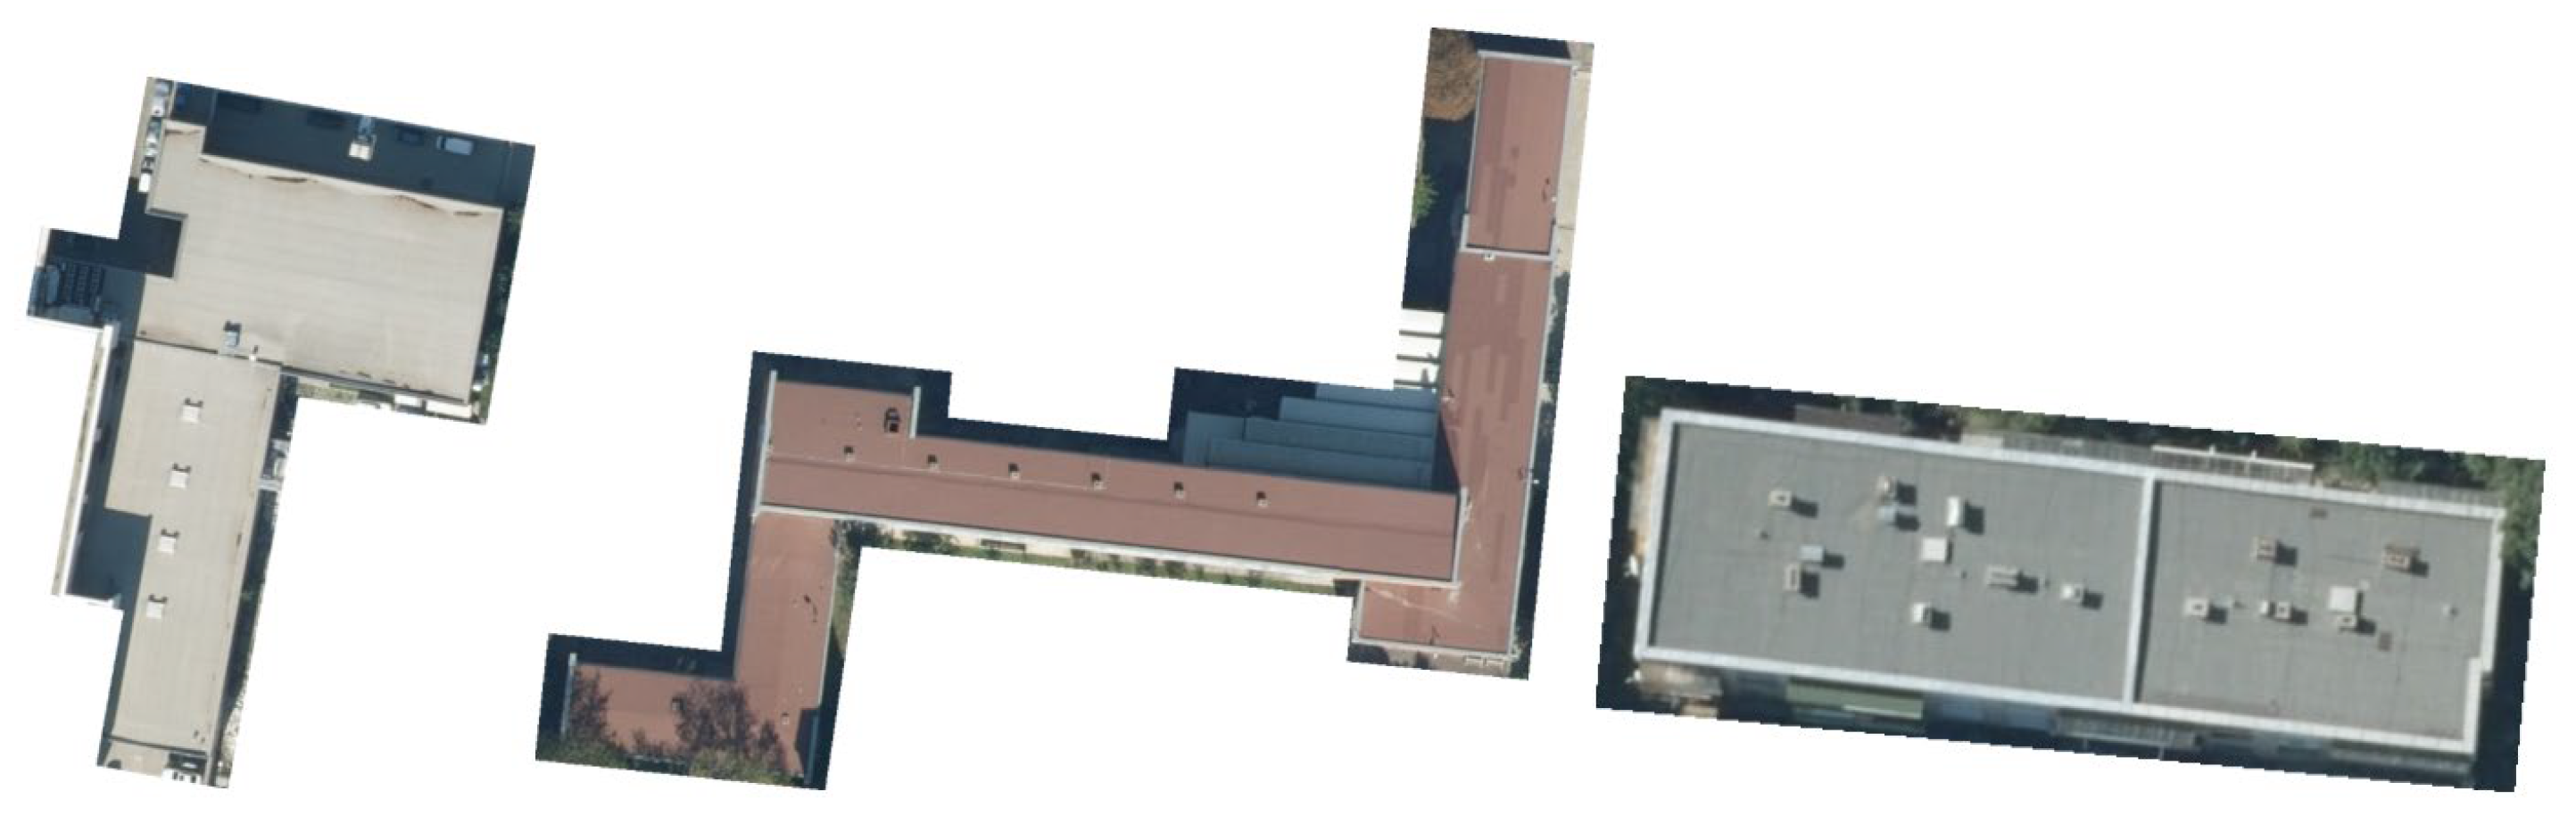
The flat roofs category includes all flat roofs or some with an exceedingly small slope. However, buildings with flat roofs on several levels are included in this category (Figure 19). This is a case where overlapping with the complex roof category could appear.
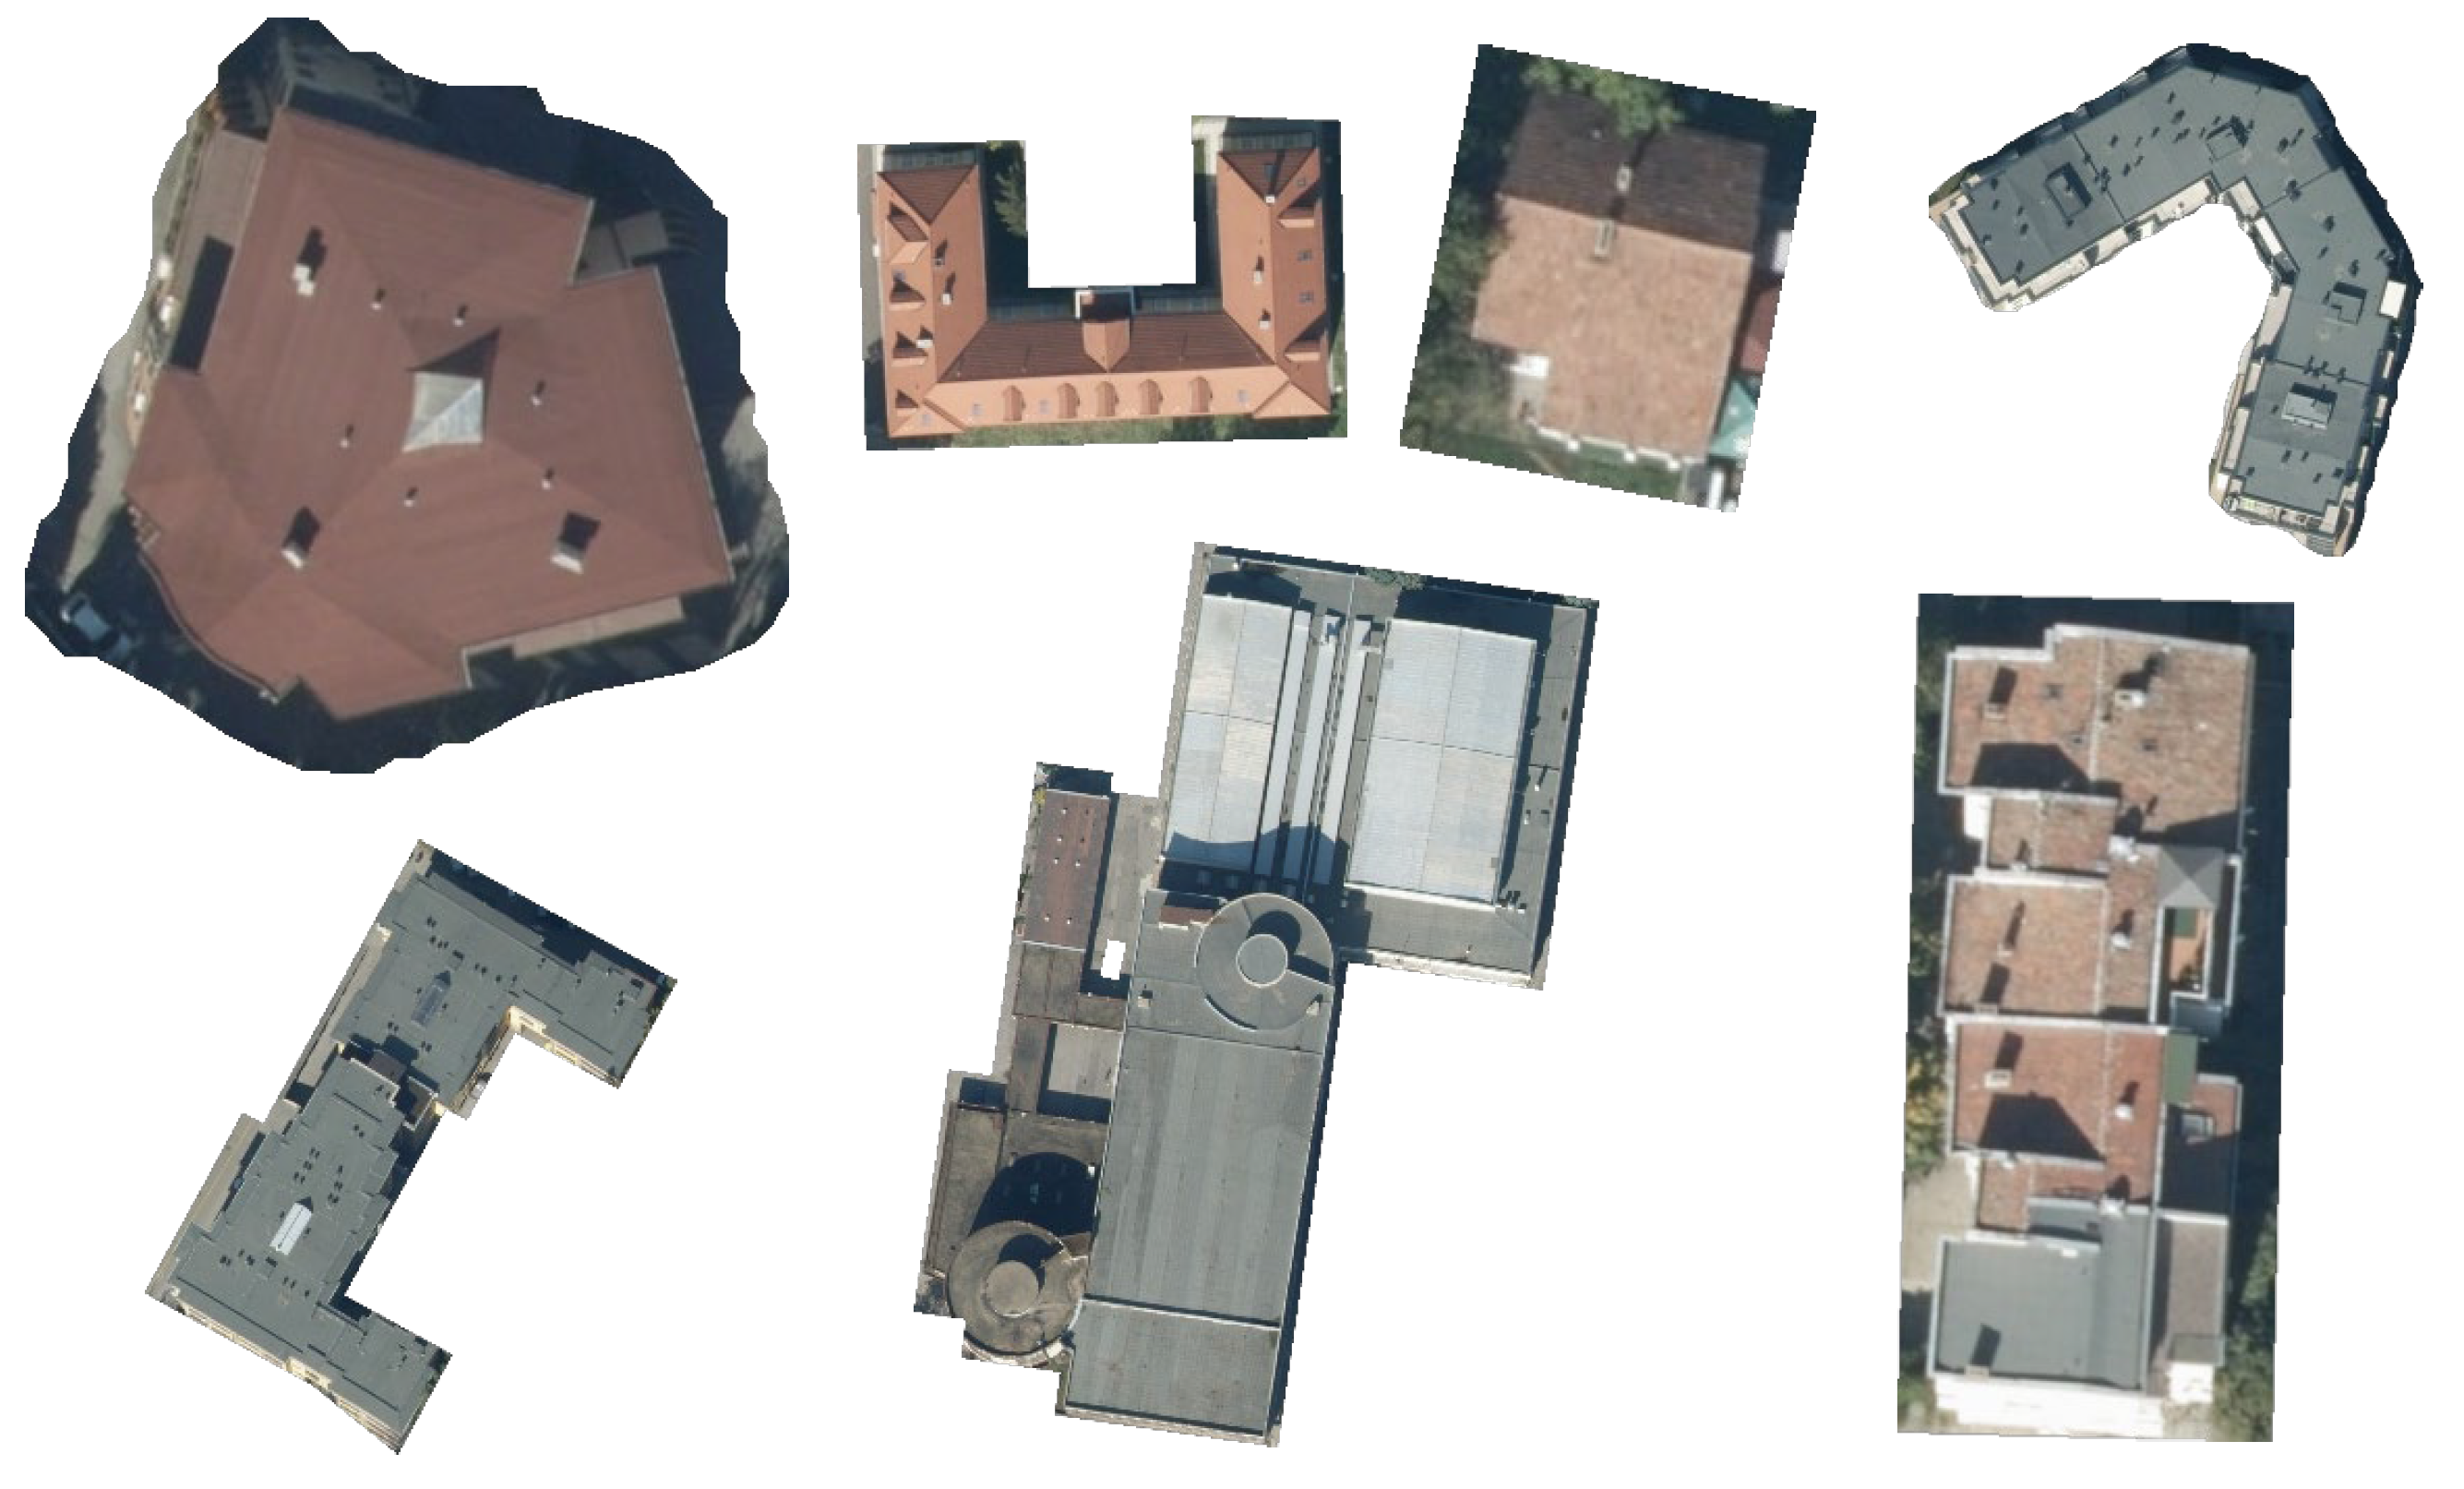
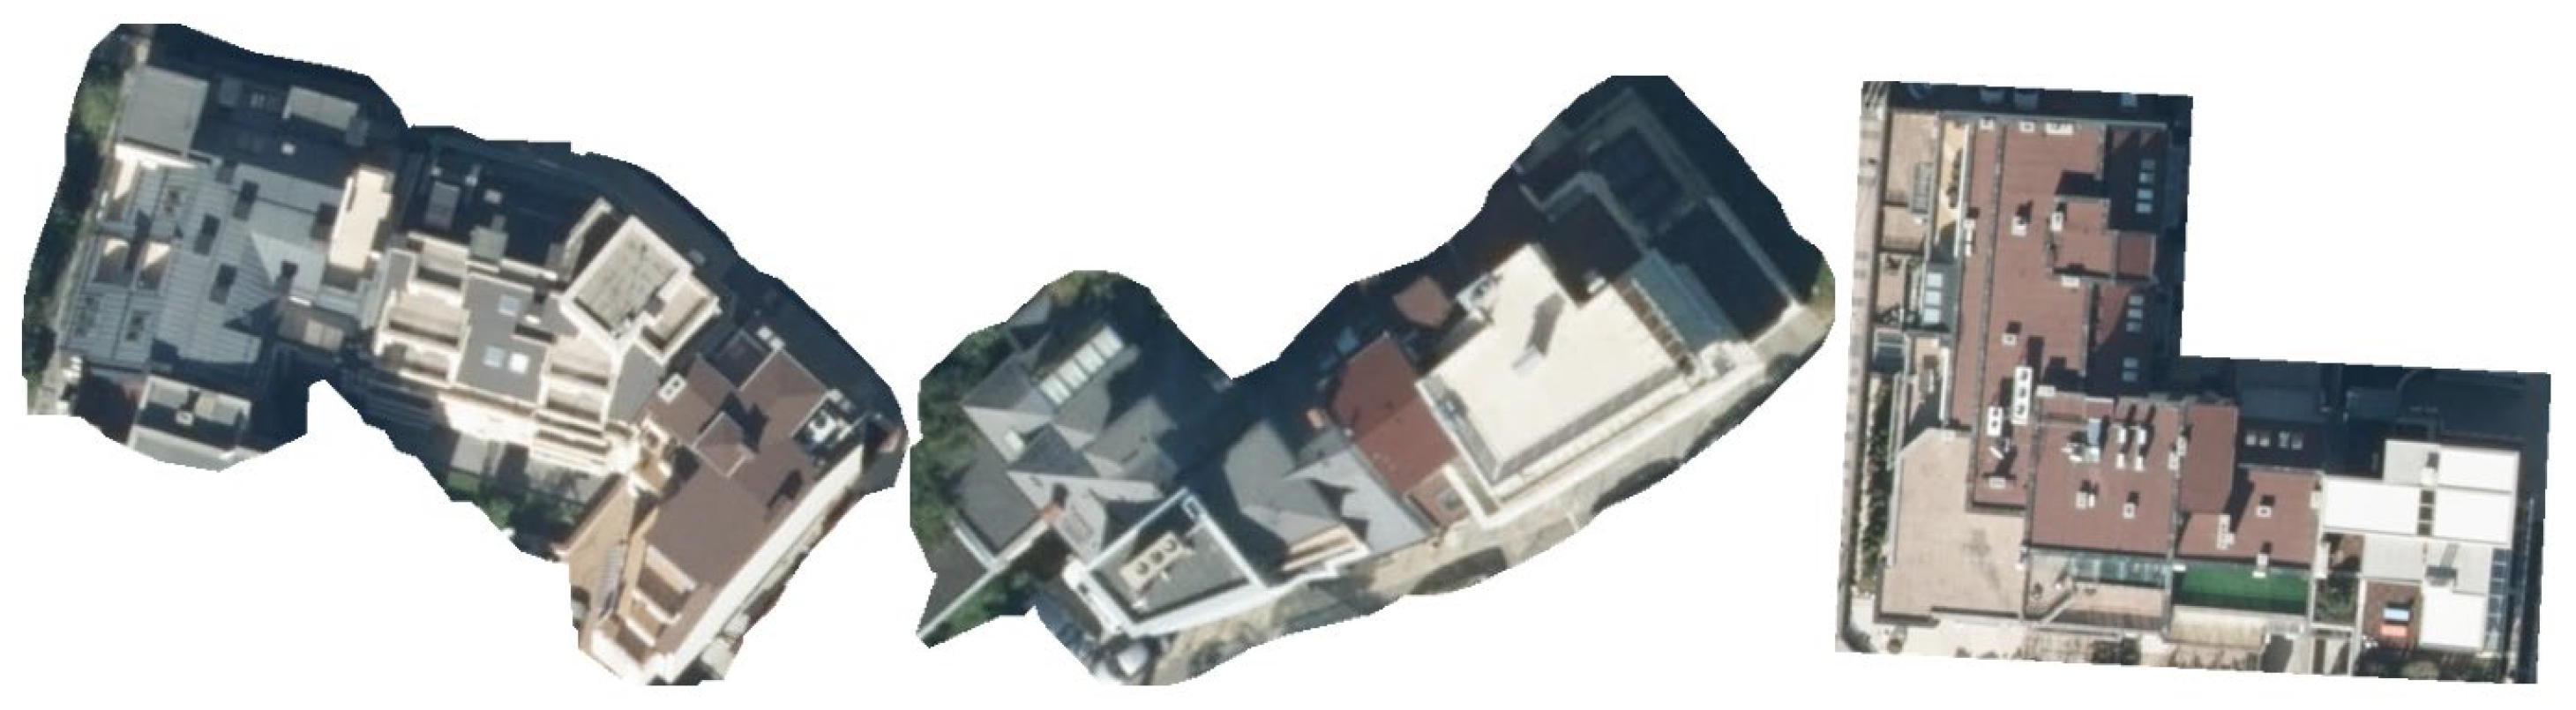
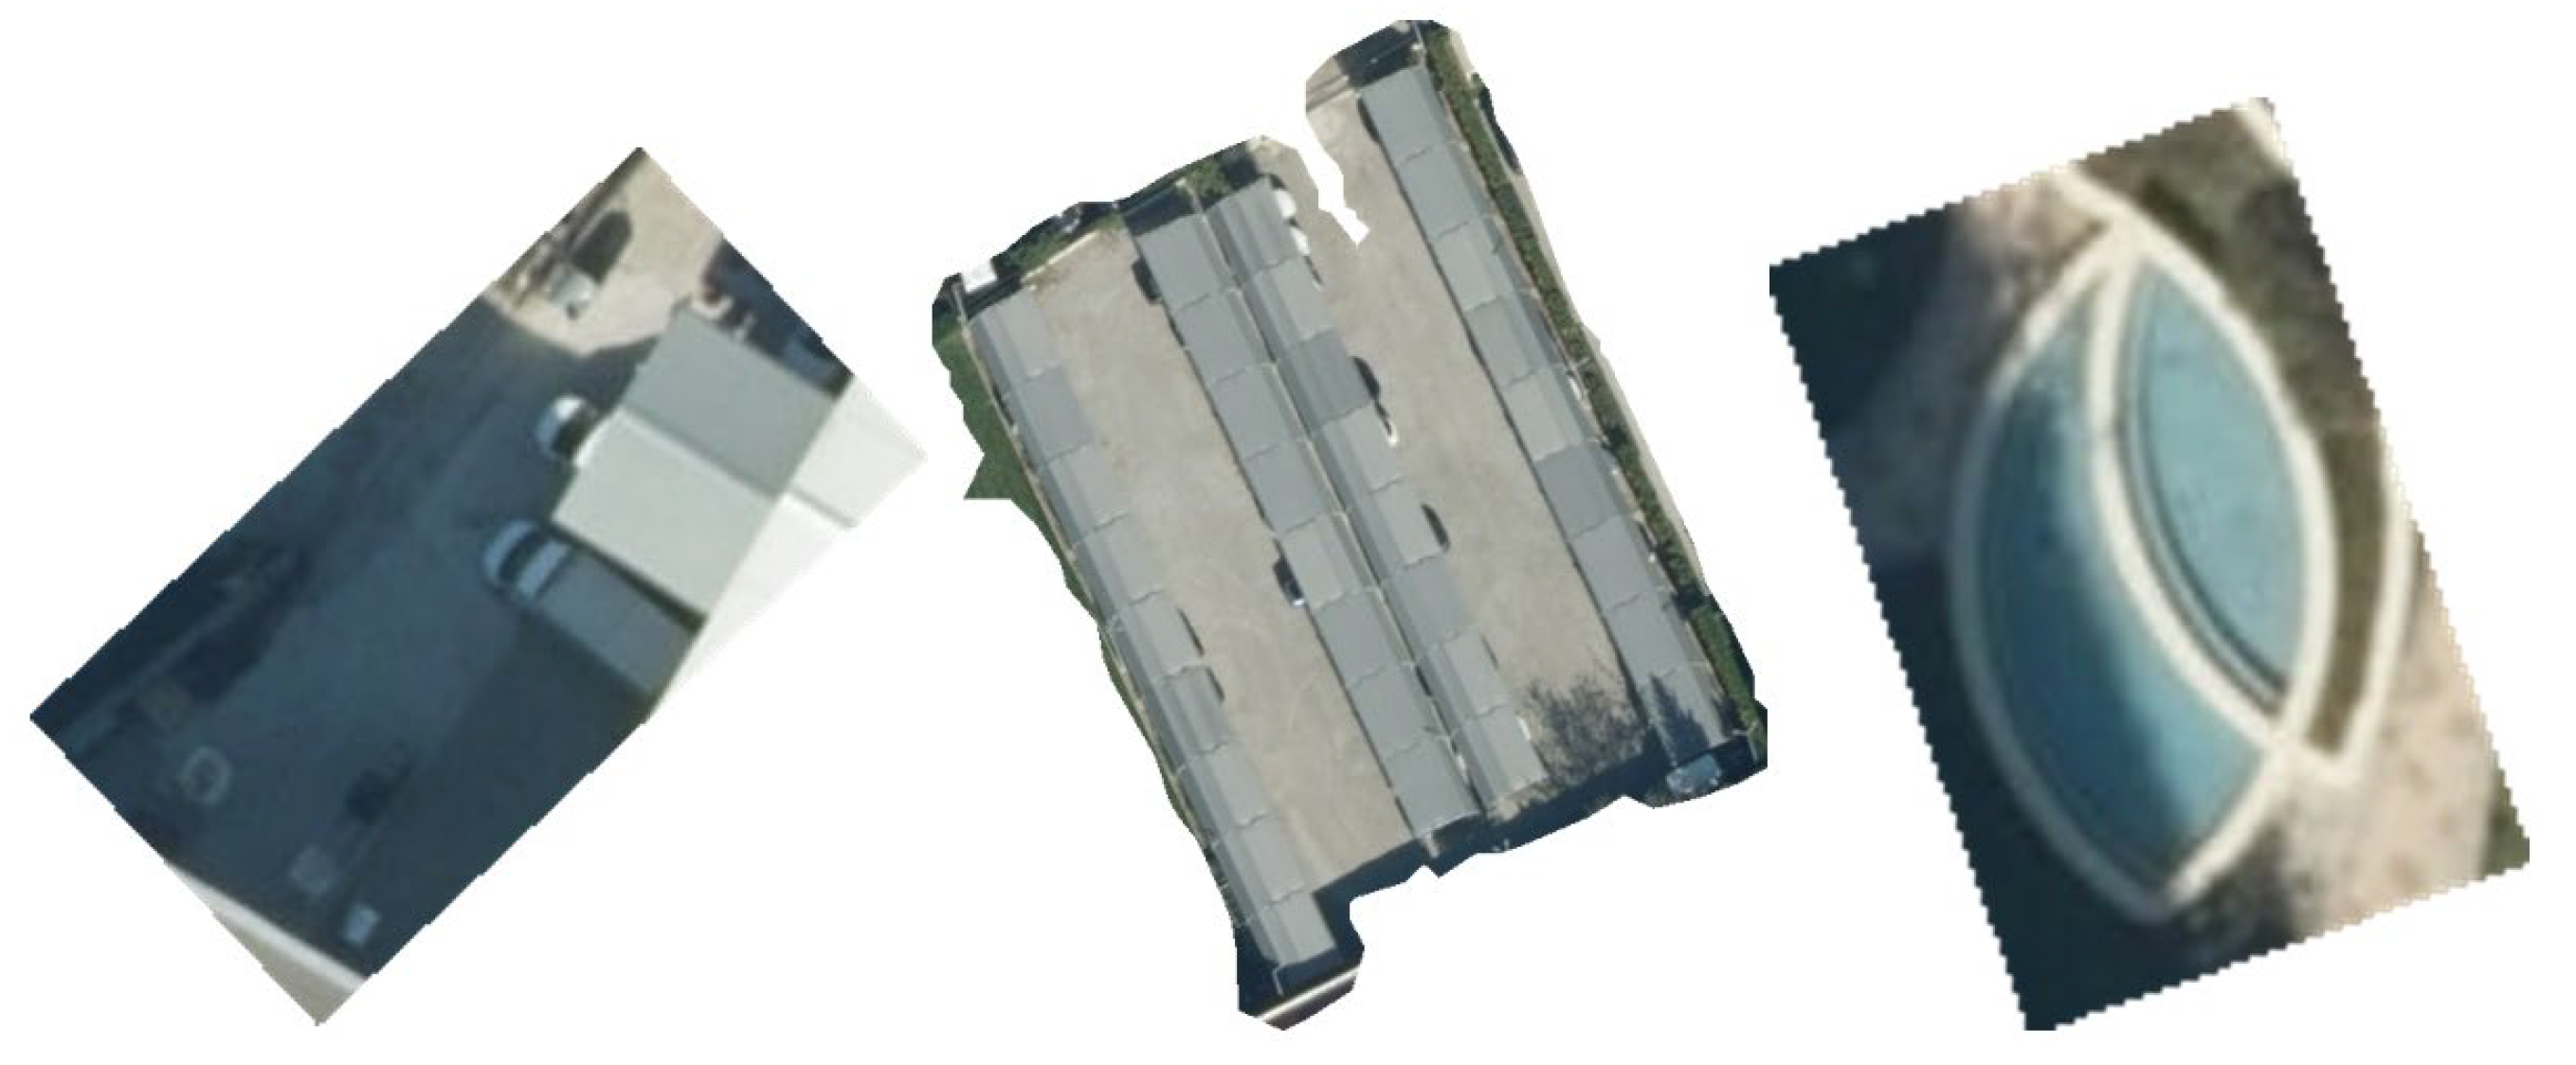
The complex roofs category includes all roofs which combine pitched and flat geometry. Other criteria to put a roof in this category come from roofs with various levels and terraces, roofs with complex shapes with many slops, roofs with an oval or sphere form, etc. A complex roof is also considered when several buildings with different types of roofs and various shapes share walls and look like a single roof area/building. (Figure 20).
The bugs category includes all images which do not represent buildings, such as construction sites, unclear images, very small parts of roofs, or shapes that are simply impossible to recognise with the human eye (Figure 21).
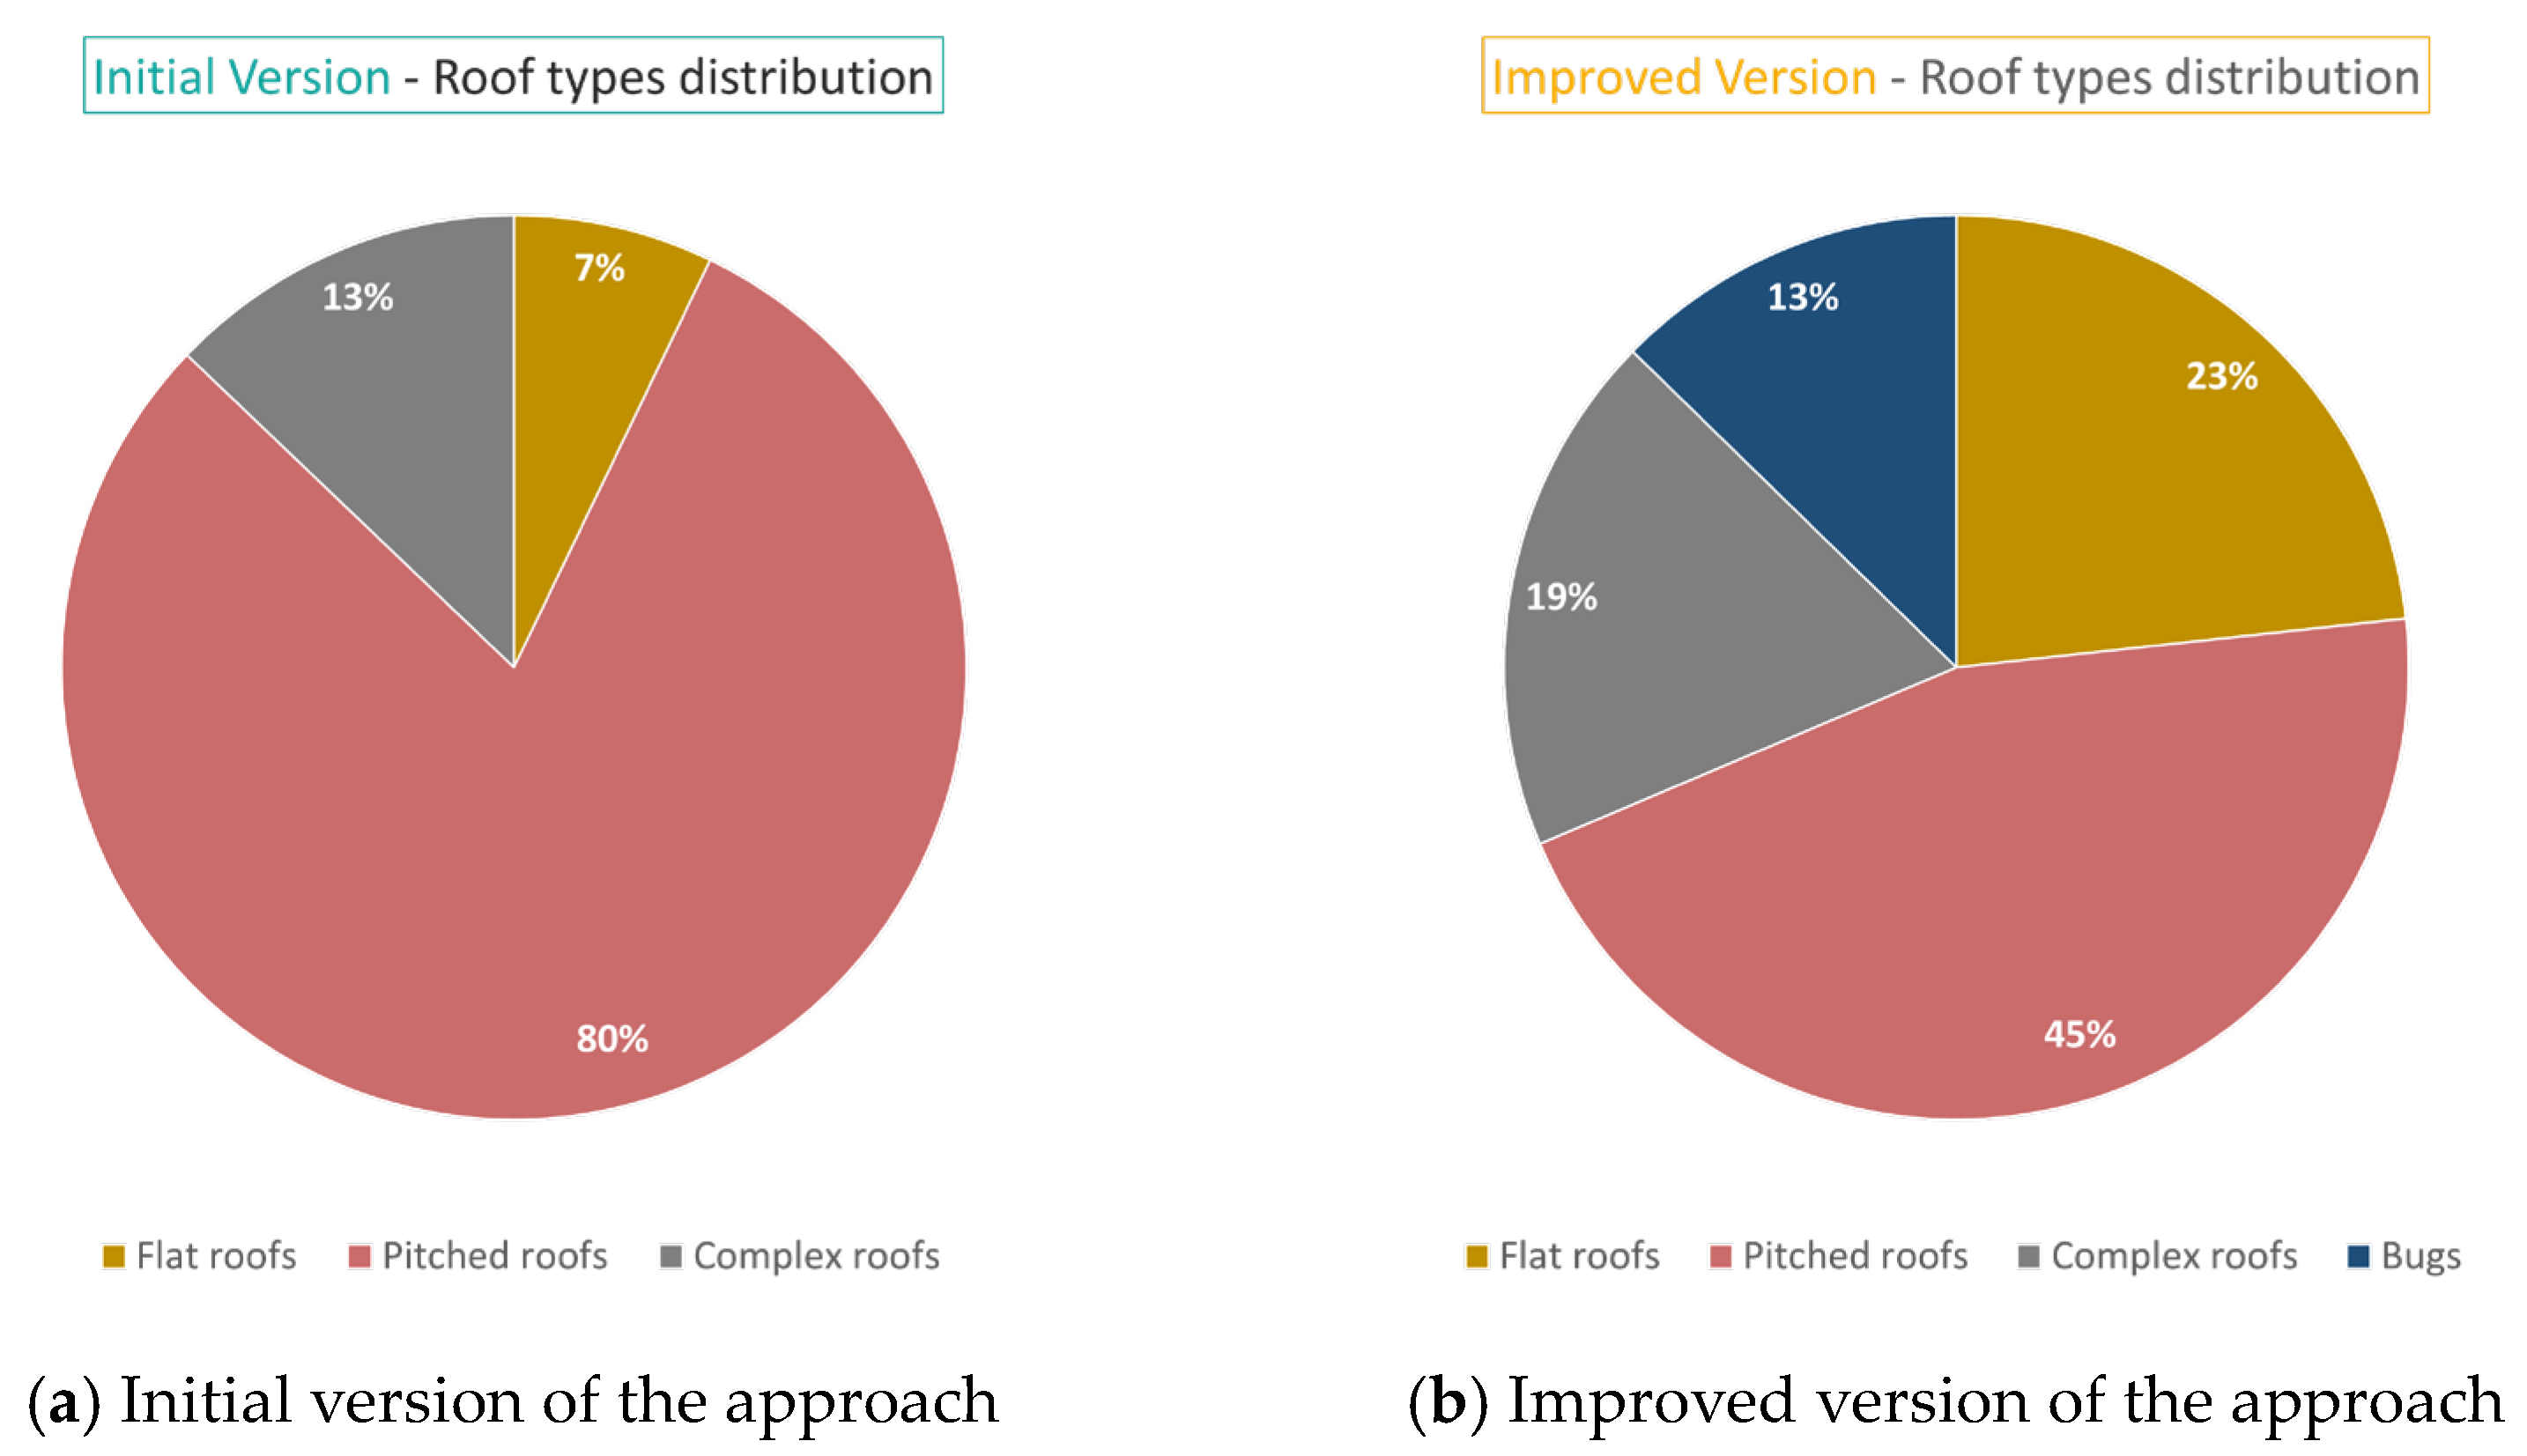
Table 2 and Figure 22 show the distribution of the roof types by number and percentage, respectively, for both versions. Although the dataset initially consisted of only 350 samples, we observed a serious disbalance between the different roof categories, obtaining very few flat roofs: 25 (7%). This was mainly because the study area was part of the old centre, where the buildings have mainly gable or hip roofs. On the other hand, the improved version produced 3617 samples, provides a balance between the different roof categories, and increased the samples with flat roofs to 842 (23%).
5. Results and Discussion
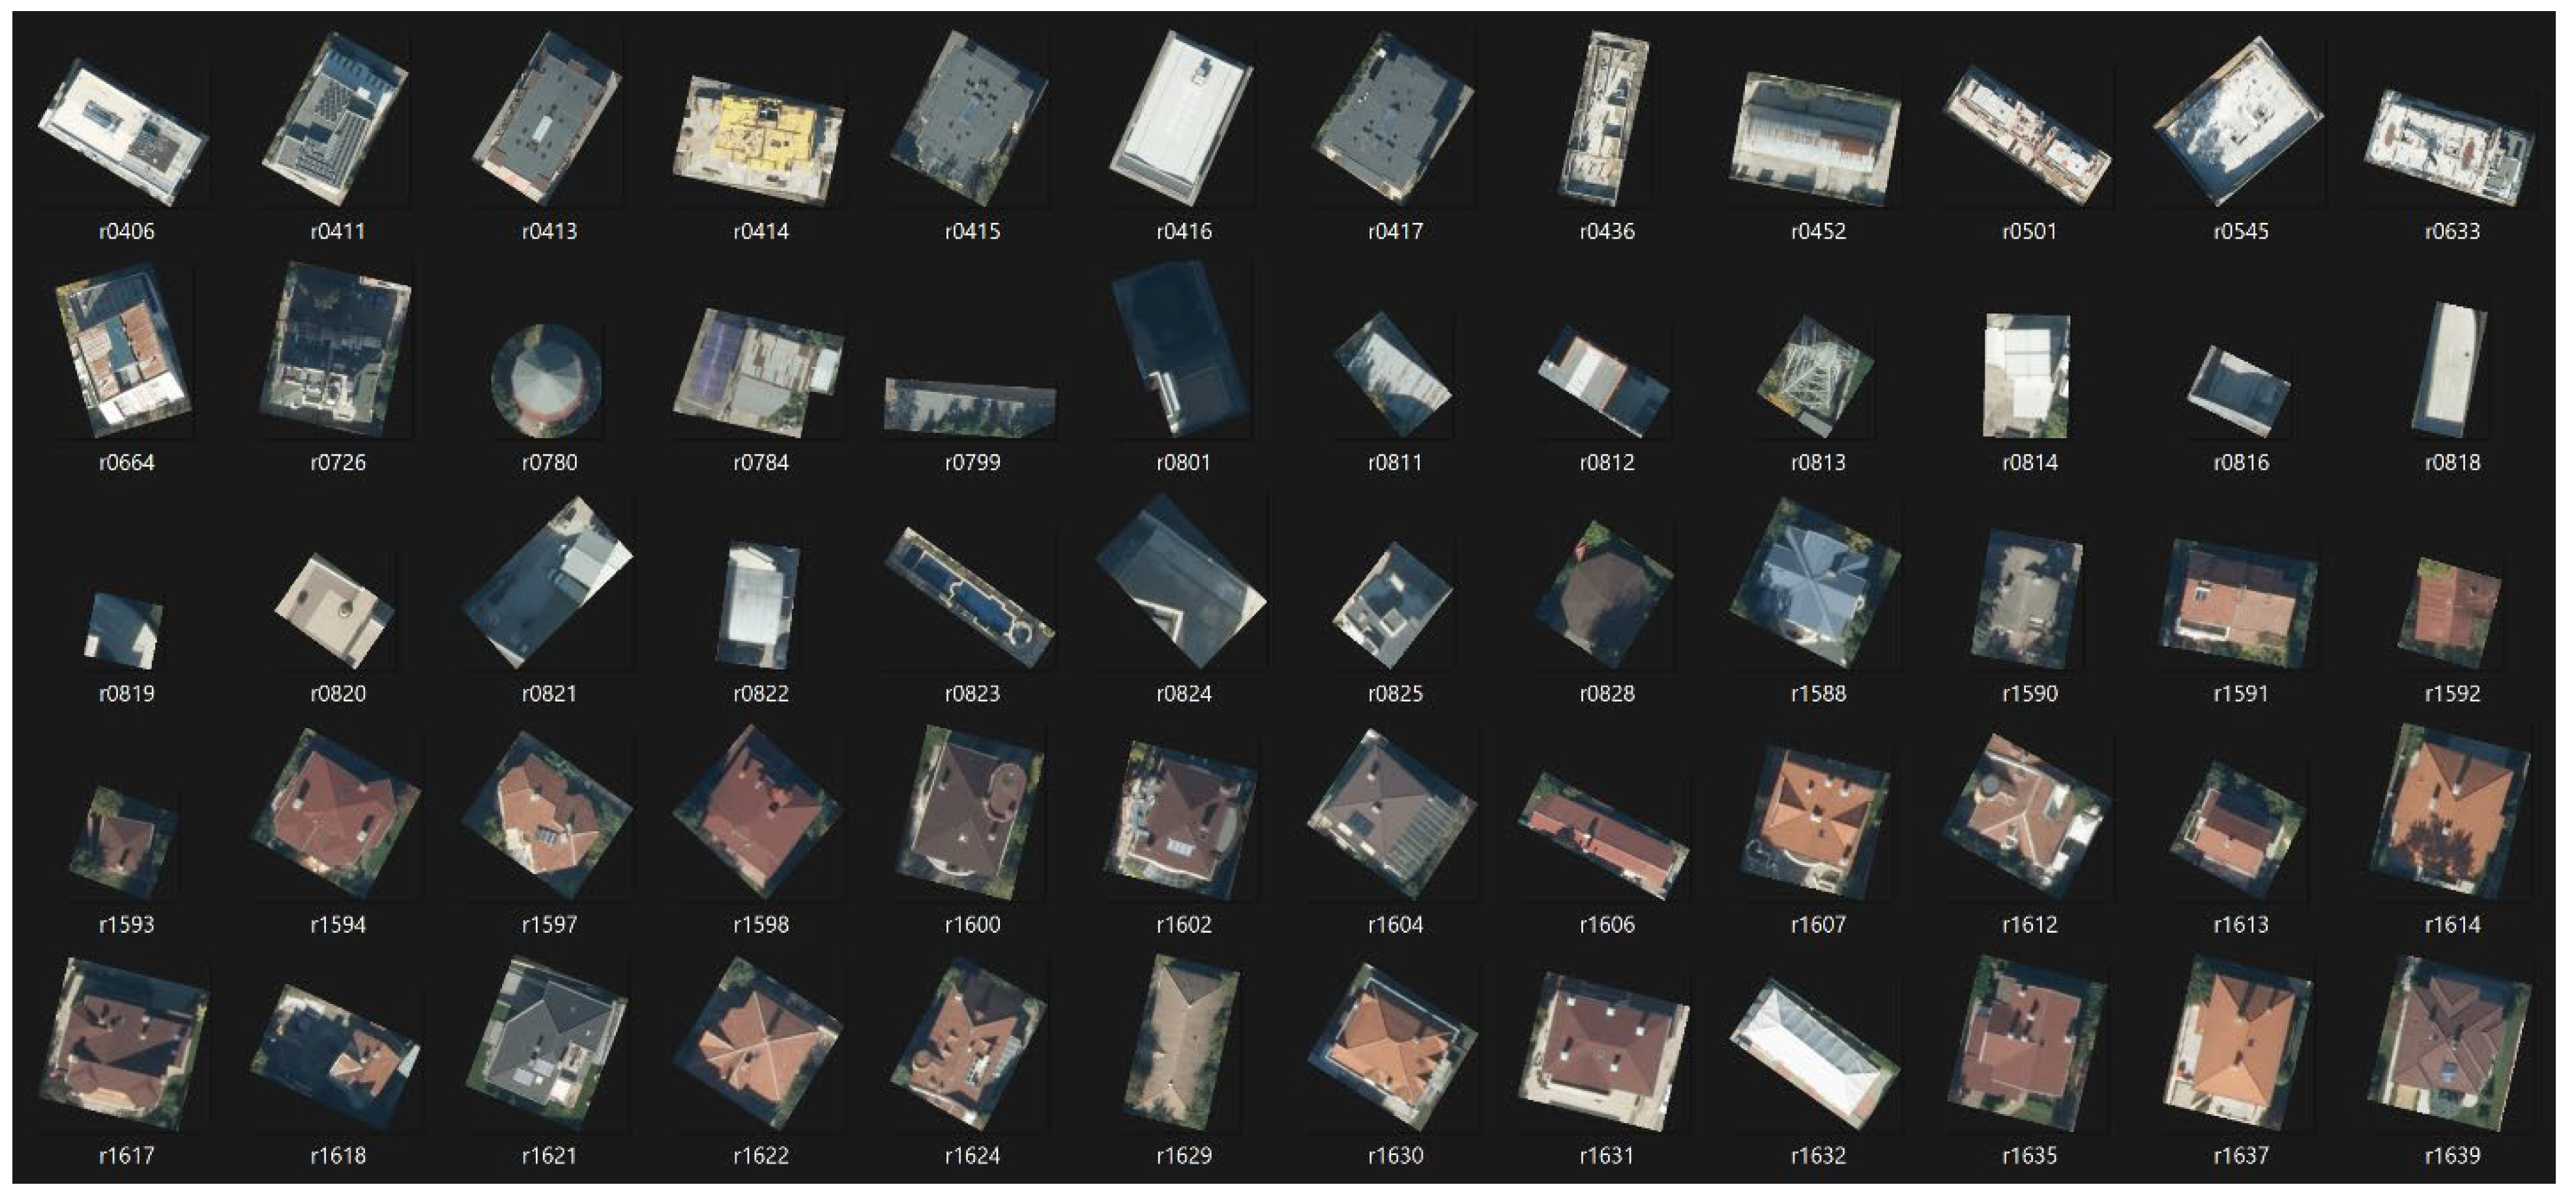
As was mentioned earlier, lessons learned from the initial implementation of the approach were applied to its improvement. As a result, a more precise dataset was obtained. The final dataset consists of 3617 GeoTIFF images, clipped by a buffer of 2 m around the roof outline with a mask around it, stored in four different folders by roof type. Figure 23 shows a representative sample, including 60 roof images. One may not consider using this particular roof type categorisation, where the roof images are distributed in completely different categories or not at all, for various purposes. In addition to the classification, however, the dataset can be used for extracting planar roof structures, roof segmentation, roof elements etc.
Similar implementation steps have been applied during both implementations and have been used to feed a deep-learning model for rooftop classification. The experiments with the first dataset show that it is better to perform clipping only based on a buffer than creating a bounding box. The simplification step applied during the improvements was found to not be essential, as for the purpose of the classification model, the buffer was sufficient to minimise the possible errors.
Regarding the recognition of the roofs and the clipping, it is sufficient to create a buffer of a minimum of 2 m or an optimal 3 m and perform clipping based on its outline. Furthermore, the initial version of the approach showed that, from a quality and testing perspective, 350 roof samples is acceptable, but in terms of quantity and reasonable distribution of the various types of roofs, they are insufficient. We enhanced the approach by including steps that do not require manual work (other than annotation). Thus, more roof samples are provided, and a much better distribution of the roof types is achieved, leading to satisfactory accuracy in the final dataset.
One of the biggest challenges has been the definition of criteria and rules that are sufficient to distinguish the different types of roofs. Due to the rich variety of roof types and the presence of subjectivity, overlapping between different categories appears often. This affects the accuracy of the classification model itself. Therefore, more clear differential rules need to be created. For roof classification, it is important to consider the specific context of the country/city and to create categories and rules that are as strong as possible. This includes defining new categories, splitting some categories, or slightly changing the existing categories. A possible solution is to rely on roof categories defined by existing standards, such as CityGML. However, the specific context characteristics are still an issue that should be strongly considered.
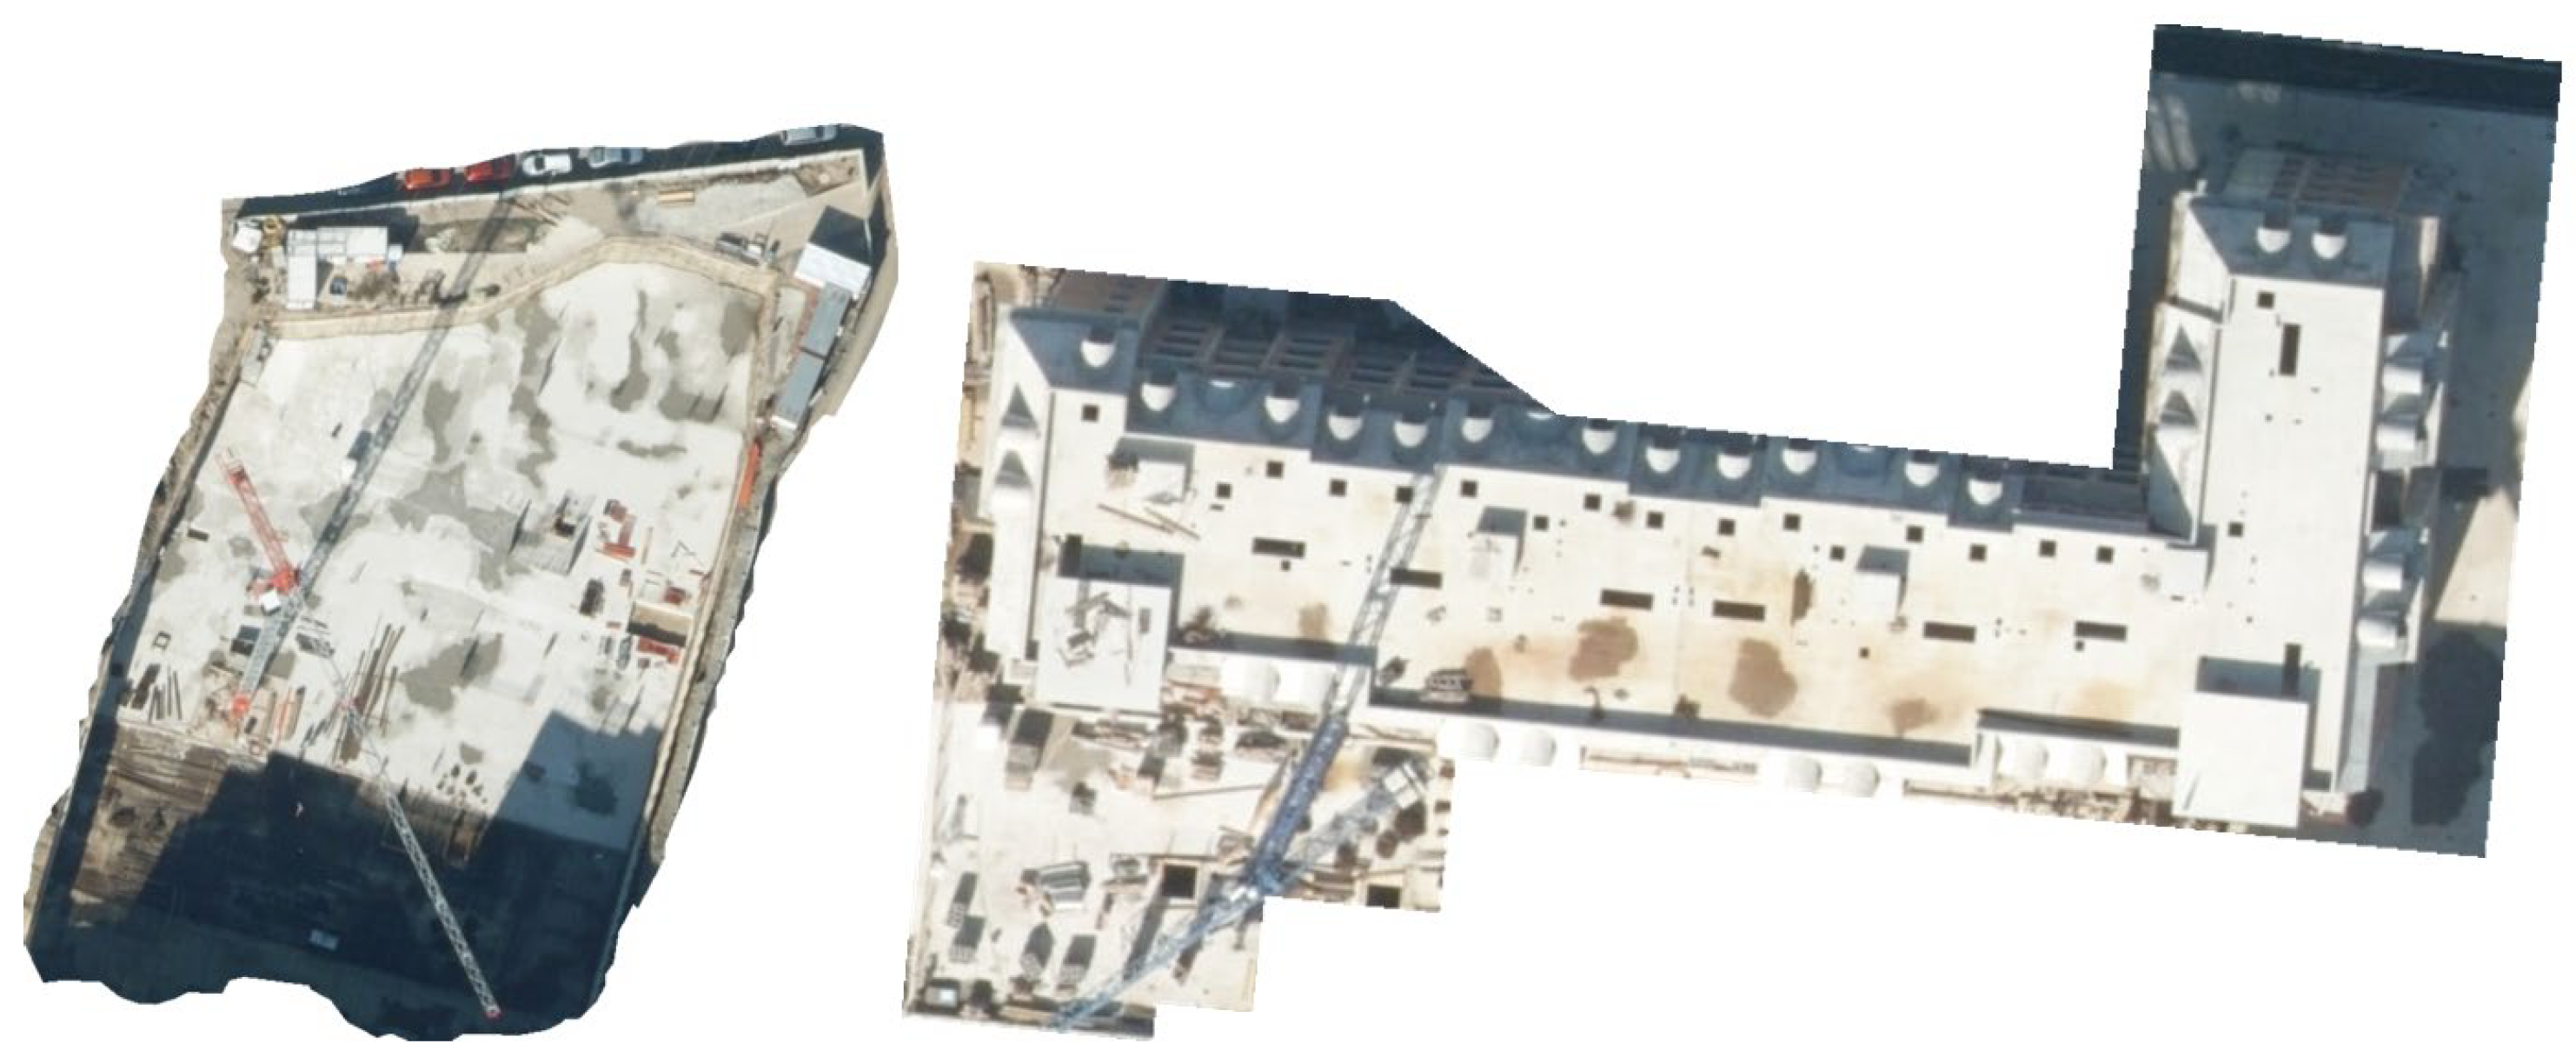
The bugs category has the potential for additional useful applications. For example, we found that many of the images in this category correspond to construction sites (see Figure 24). They can be arranged in a separate category focusing on recognising construction sites.
6. Conclusions
This paper demonstrates the process of elaborating a dataset for roof classification and segmentation using as a raster image an input. Tools and technics for automatic recognition of buildings as well as geometric operations such as buffering, bounding boxing, and clipping, have been applied to elaborate a roof dataset with more than 3,000 unique roofs (GeoTIFFs). A manual annotation has been performed, separating all roof images into three main roof categories (flat, pitched, and complex) plus an additional bugs category.
Other applications of the dataset are as follows:
- roof recognition model, distinguishing roofs from other urban objects such as streets, trees, cars, etc.;
- roof segmentation model;
- recognition and classification of roof elements (chimneys, skylights, dormer, terrace, antennas, solar panels, etc.);
- recognition and classification of roof materials (tiles, metal, asphalt, wood, vinyl, concrete, etc.);
- roof solar potential analysis (the characteristics of the roof in relation to the requirements for installation of solar panels).
Currently, we are working on implementing a deep learning model based on a convolutional neural network for rooftop classification using the proposed dataset. The future work also considers preparing datasets using another type of input data, such as point clouds obtained from laser scanning. Furthermore, the development of more precise rules for categorising roofs is planned. Mapping the roof categories to the CityGML standard could be an additional improvement.
Author Contributions
Conceptualization, E.H. and D.P.-A.; methodology, E.H.; software, A.P. and E.S.; validation, E.H., A.P. and M.B.; investigation, E.H. and E.S.; data curation, M.B.; writing—original draft preparation, E.H.; writing—review and editing, D.P.-A.; visualization, E.H.; supervision, D.P.-A.; project administration, D.P.-A.; funding acquisition, D.P.-A. All authors have read and agreed to the published version of the manuscript.
Funding
This research has been supported by the GATE project, funded by the Horizon 2020 WIDESPREAD-2018-2020 TEAMING Phase 2 programme under grant agreement no. 857155; by Operational Programme Science and Education for Smart Growth under Grant Agreement no. BG05M2OP001-1.003-0002-C01.
Institutional Review Board Statement
Not applicable.
Informed Consent Statement
Not applicable.
Data Availability Statement
The dataset presented in this study are openly available in Zenodo at 10.5281/zenodo.7633595.
Acknowledgments
We want to thank Geographic Information System—Sofia Ltd., Sofia, Bulgaria for the provided orthophoto of the Lozenets district.
Conflicts of Interest
The authors declare no conflict of interest.
References
- Lehtola, V.V.; Koeva, M.; Elberink, S.O.; Raposo, P.; Virtanen, J.-P.; Vahdatikhaki, F.; Borsci, S. Digital twin of a city: Review of technology serving city needs. Int. J. Appl. Earth Obs. Geoinf. 2022, 114, 102915. [Google Scholar] [CrossRef]
- Nguyen, S.; Kolbe, T. Modelling changes, stakeholders and their relations in semantic 3d city models. In Proceedings of the 16th 3D GeoInfo Conference, New York, NY, USA, 11–14 October 2021. [Google Scholar]
- Jiang, H.; Yao, L.; Lu, N.; Qin, J.; Liu, T.; Liu, Y.; Zhou, C. Geospatial assessment of rooftop solar photovoltaic potential using multi-source remote sensing data. Energy AI 2022, 10, 100185. [Google Scholar] [CrossRef]
- LiDAR Data from The Netherlands. Available online: https://forestlabdotnet.wordpress.com/2014/03/14/lidar-data-from-the-netherlands/ (accessed on 27 January 2023).
- National Land Survey of Finland. Available online: https://www.maanmittauslaitos.fi/en/maps-and-spatial-data/expert-users/product-descriptions/laser-scanning-data (accessed on 27 January 2023).
- Elevation Data. Available online: https://geoportaal.maaamet.ee/eng/Spatial-Data/Elevation-data-p308.html (accessed on 27 March 2023).
- Yousef, G.A.; Elazony, M.A.; Abdelsattar, A.; Sewailam, M.M.; Elsaid, O.H. Applying an integrated Remote Sensing-GIS approach in the documentation of handicraft centers at New Valley Governorate, Egypt. Egypt. J. Remote Sens. Space Sci. 2022, 25, 731–739 . [Google Scholar] [CrossRef]
- Suszanowicz, D.; Ratuszny, P.; Wróbel, R. The potential of roofs in city centers to be used for photovoltaic micro- installations. IOP Conf. Ser. Mater. Sci. Eng. 2019, 564, 012128. [Google Scholar] [CrossRef]
- Shao, H.; Song, P.; Mu, B.; Tian, G.; Chen, Q.; He, R.; Kim, G. Assessing city-scale green roof development potential using Unmanned Aerial Vehicle (UAV) imagery. Urban For. Urban Green. 2021, 57, 126954. [Google Scholar] [CrossRef]
- Pomeroy, J. Room at the Top—The Roof as an Alternative Habitable/Social Space in the Singapore Context. J. Urban Des. 2012, 17, 413–424. [Google Scholar] [CrossRef]
- Buslaev, A.; Iglovikov, V.I.; Khvedchenya, E.; Parinov, A.; Druzhinin, M.; Kalinin, A.A. Albumentations: Fast and Flexible Image Augmentations. Mach. Learn. Python 2020, 11, 125. [Google Scholar] [CrossRef]
- Prabowo, Y.; Sakti, A.D.; Pradono, K.A.; Amriyah, Q.; Rasyidy, F.H.; Bengkulah, I.; Ulfa, K.; Candra, D.S.; Imdad, M.T.; Ali, S. Deep Learning Dataset for Estimating Burned Areas: Case Study, Indonesia. Spat. Data Sci. Digit. Earth 2021, 7, 78. [Google Scholar] [CrossRef]
- Dimitrov, H.D. Petrova-Antonova, 3D city model as a first step towards digital twin of Sofia city. Int. Arch. Photogramm. Remote Sens. Spatial Inf. Sci. 2021, XLIII-B4-2021, 23–30. [Google Scholar] [CrossRef]
- Gröger, G.; Kolbe, T.H.; Czerwinski, A. Candidate OpenGIS® CityGML Implementation Specification (City Geography Markup Language); Open Geospatial Consortium Inc.: Arlington, TX, USA, 2006. [Google Scholar]
- Krapf, S.; Bogenrieder, L.; Netzler, F.; Balke, G.; Lienkamp, M. RID—Roof Information Dataset for Computer Vision-Based Photovoltaic Potential Assessment. Remote Sens. 2022, 14, 2299. [Google Scholar] [CrossRef]
- Krapf, S. Github. 11 May 2022. Available online: https://github.com/TUMFTM/RID (accessed on 27 March 2023).
- Alidoost, F.; Arefi, H. A CNN-Based Approach for Automatic Building Detection and Recognition of Roof Types Using a Single Aerial Image. PFG J. Photogramm. Remote Sens. Geoinf. Sci. 2019, 86, 235–248. [Google Scholar] [CrossRef]
- Alidoost, F.; Arefi, H. Github. 7 April 2020. Available online: https://github.com/loosgagnet/Building-detection-and-roof-type-recognition (accessed on 27 March 2023).
- Ren, J.; Zhang, B.; Wu, B.; Huang, J.; Fan, L.; Ovsjanikov, M.; Wonka, P. Intuitive and Efficient Roof Modeling for Reconstruction and Synthesis. ACM Trans. Graph. 2021, 40, 1–17. [Google Scholar] [CrossRef]
- Ren, J.; Zhang, B.; Wu, B.; Huang, J.; Fan, L.; Ovsjanikov, M.; Wonka, P. Github. 11 May 2022. Available online: https://github.com/llorz/SGA21_roofOptimization (accessed on 27 March 2023).
- Chen, Q.; Wang, L.; Wu, Y.; Wu, G.; Guo, Z.; Waslander, S.L. TEMPORARY REMOVAL: Aerial Imagery for Roof Segmentation: A Large-Scale Dataset towards Automatic Mapping of Buildings. ISPRS J. Photogramm. Remote Sens. 2018, 147, 42–55. [Google Scholar] [CrossRef]
- Kaggle. Available online: https://www.kaggle.com/datasets/atilol/aerialimageryforroofsegmentation?resource=download (accessed on 27 March 2023).
- National Statistical Institute. Population by Towns and Sex. Available online: https://www.nsi.bg/en/content/2981/population-towns-and-sex (accessed on 27 January 2023).
- lozenets.sofia.bg. District Lozenets. 2011. Available online: https://lozenets.sofia.bg/za-rayona/ (accessed on 27 March 2023).
- Mapflow. Available online: https://mapflow.ai/ (accessed on 27 March 2023).
Figure 1.
Sample dataset with mostly pitched roofs.

Figure 2.
Sample dataset with simple and clear flat roofs and pitched roofs in good condition with homogeneous colours and textures.
Figure 2.
Sample dataset with simple and clear flat roofs and pitched roofs in good condition with homogeneous colours and textures.

Figure 3.
Sample dataset with complex pitched roofs with many edges and ridges, which are still a regular type.
Figure 3.
Sample dataset with complex pitched roofs with many edges and ridges, which are still a regular type.

Figure 4.
Aerial Imagery for Roof Segmentations dataset.

Figure 5.
Boundaries of Sofia municipality districts, including the Lozenets district (orange).

Figure 6.
Distribution of the buildings by function.

Figure 7.
Sequence diagram of the approach.

Figure 8.
Orthophoto tiles. (a) Orthophoto clipped by the boundary of the Lozenets district; (b) the distribution of the full and partial tiles; (c) the entire tile-grid.
Figure 8.
Orthophoto tiles. (a) Orthophoto clipped by the boundary of the Lozenets district; (b) the distribution of the full and partial tiles; (c) the entire tile-grid.

Figure 9.
Orthophoto coverage of both versions of the approach. (a) The initial version partially covers the Lozenets district, including the blue tile; (b) The improved version completely covers the Lozenets district.
Figure 9.
Orthophoto coverage of both versions of the approach. (a) The initial version partially covers the Lozenets district, including the blue tile; (b) The improved version completely covers the Lozenets district.

Figure 10.
Automatically recognised roof outlines by Mapflow. (a) Zoom-out results; (b) Zoom-in results.
Figure 10.
Automatically recognised roof outlines by Mapflow. (a) Zoom-out results; (b) Zoom-in results.

Figure 11.
Result from the improved version, where 3834 objects are recognized as buildings. (a) Orthophoto of the Lozenets district; (b) Distribution of the recognized building by Mapflow.
Figure 11.
Result from the improved version, where 3834 objects are recognized as buildings. (a) Orthophoto of the Lozenets district; (b) Distribution of the recognized building by Mapflow.

Figure 12.
Manual adjustment of rooftop outlines in the initial approach. The yellow outlines are automatically generated, and the purple ones are manually corrected.
Figure 12.
Manual adjustment of rooftop outlines in the initial approach. The yellow outlines are automatically generated, and the purple ones are manually corrected.

Figure 13.
Automatic simplification of roof geometries in QGIS. (a) generated buildings before simplification; (b) new outlines of the buildings after simplification.
Figure 13.
Automatic simplification of roof geometries in QGIS. (a) generated buildings before simplification; (b) new outlines of the buildings after simplification.

Figure 14.
Generated 2 m. buffer (orange outlines) by the roof outlines (purple).

Figure 15.
Bounding boxes (green), generated according to the buffer outlines (orange).

Figure 16.
Examples of roof GeoTIFFs produced by the initial version of the approach (without mask).
Figure 16.
Examples of roof GeoTIFFs produced by the initial version of the approach (without mask).

Figure 17.
Examples of roof GeoTIFFs produced by the improved version of the approach (with mask).

Figure 18.
Examples of pitched roofs, obtained from the improved version of the approach.

Figure 19.
Examples of flat roofs, obtained from the improved version of the approach.

Figure 20.
Examples of complex roofs, obtained from the improved version of the approach.

Figure 21.
Examples of roofs in the bugs category, obtained from the improved version of the approach.
Figure 21.
Examples of roofs in the bugs category, obtained from the improved version of the approach.

Figure 22.
Share distribution of the different types of roofs for the initial version (a) and improved version (b) of the approach.
Figure 22.
Share distribution of the different types of roofs for the initial version (a) and improved version (b) of the approach.

Figure 23.
Final dataset of 3617 GeoTIFFs with a mask.

Figure 24.
Examples of roofs in bugs category.


Table 1.
Main steps of the approach for elaboration of the dataset.
| Steps | Initial Version | Improved Version | Tools |
|---|---|---|---|
| Step 1: preprocessing raw data | YES | YES | QGIS |
| Step 2: automatic image recognition | YES | YES | QGIS (Mapflow plugin) |
| Step 3: manual adjustments | YES | QGIS | |
| Step 4: automatic simplification | YES | QGIS | |
| Step 5: creating a buffer | YES | YES | QGIS |
| Step 6: creating a bounding box | YES | QGIS | |
| Step 7: clipping | YES | YES | QGIS + Python |
| Step 8: annotation | YES | YES | Manual (folders) |
Table 2.
Distribution of the roofs by category.
| Roof Types/Versions | Initial Version | Improved Version | ||
|---|---|---|---|---|
| Number | % | Number | % | |
| Flat roofs | 25 | 7 | 844 | 23 |
| Pitched roofs | 280 | 80 | 1640 | 45 |
| Complex roofs (mix of pitched, flat, terraces etc.) | 45 | 13 | 676 | 19 |
| Bugs (blurry, construction sites, unclear, others) | 0 | 0 | 459 | 13 |
Disclaimer/Publisher’s Note: The statements, opinions and data contained in all publications are solely those of the individual author(s) and contributor(s) and not of MDPI and/or the editor(s). MDPI and/or the editor(s) disclaim responsibility for any injury to people or property resulting from any ideas, methods, instructions or products referred to in the content. |
© 2023 by the authors. Licensee MDPI, Basel, Switzerland. This article is an open access article distributed under the terms and conditions of the Creative Commons Attribution (CC BY) license (https://creativecommons.org/licenses/by/4.0/).
Share and Cite
MDPI and ACS Style
Hristov, E.; Petrova-Antonova, D.; Petrov, A.; Borukova, M.; Shirinyan, E. Remote Sensing Data Preparation for Recognition and Classification of Building Roofs. Data 2023, 8, 80. https://doi.org/10.3390/data8050080
AMA Style
Hristov E, Petrova-Antonova D, Petrov A, Borukova M, Shirinyan E. Remote Sensing Data Preparation for Recognition and Classification of Building Roofs. Data. 2023; 8(5):80. https://doi.org/10.3390/data8050080
Chicago/Turabian StyleHristov, Emil, Dessislava Petrova-Antonova, Aleksandar Petrov, Milena Borukova, and Evgeny Shirinyan. 2023. "Remote Sensing Data Preparation for Recognition and Classification of Building Roofs" Data 8, no. 5: 80. https://doi.org/10.3390/data8050080