
DriverSVT: Smartphone-Measured Vehicle Telemetry Data for Driver State Identification


1
Information Technology and Programming Faculty, ITMO University, St. Petersburg 197101, Russia
2
Institute of Mathematics and Information Technologies, Perozavodsk State University (PetrSU), Petrozavodsk 185035, Russia
3
St. Petersburg Federal Research Center of the Russian Academy of Sciences (SPC RAS), St. Petersburg 199178, Russia
*
Author to whom correspondence should be addressed.
Data 2022, 7(12), 181; https://doi.org/10.3390/data7120181
Submission received: 30 November 2022
/
Revised: 10 December 2022
/
Accepted: 12 December 2022
/
Published: 15 December 2022
Abstract
:One of the key functions of driver monitoring systems is the evaluation of the driver’s state, which is a key factor in improving driving safety. Currently, such systems heavily rely on the technology of deep learning, that in turn requires corresponding high-quality datasets to achieve the required level of accuracy. In this paper, we introduce a dataset that includes information about the driver’s state synchronized with the vehicle telemetry data. The dataset contains more than 17.56 million entries obtained from 633 drivers with the following data: the driver drowsiness and distraction states, smartphone-measured vehicle speed and acceleration, data from magnetometer and gyroscope sensors, g-force, lighting level, and smartphone battery level. The proposed dataset can be used for analyzing driver behavior and detecting aggressive driving styles, which can help to reduce accidents and increase safety on the roads. In addition, we applied the K-means clustering algorithm based on the 11 least-correlated features to label the data. The elbow method showed that the optimal number of clusters could be either two or three clusters. We chose to proceed with the three clusters to label the data into three main scenarios: parking and starting driving, driving in the city, and driving on highways. The result of the clustering was then analyzed to see what the most frequent critical actions inside the cabin in each scenario were. According to our analysis, an unfastened seat belt was the most frequent critical case in driving in the city scenario, while drowsiness was more frequent when driving on the highway.
1. Introduction
Human safety has always been the ultimate goal of researchers. According to the World Health Organization (WHO), approximately 1.3 million people die every year as a result of road traffic accidents [1]. These accidents often happen due to the drivers’ lack of attention or to their risky driving style. With the advance of machine learning and computer vision techniques, the research interest has been drawn to the reduction of car accidents by building driver assistance and driver behavior analysis systems. Such systems aim to evaluate the driving style and the driver’s behavior to detect any risky situation that can cause an accident. In-cabin driver monitoring includes systems aimed at analyzing the driver’s state (drowsiness [2,3,4], sleepiness [5,6], fatigue [7,8,9], and not paying attention to the road [10,11]), and systems aimed at analyzing the driver’s driving style [12,13,14]. The latter systems can use data collected by smartphones’ sensors, such as a gyroscope and an accelerometer, which can be analyzed as indicators to detect aggressive driving such as sudden braking, speeding, and sudden turns. Palimkar et al. [15] used machine learning algorithms to recognize different human activities using data collected from various sensors (magnetometer, accelerometer, and gyroscope) attached to the human body.
To detect fatigue and sleepiness, two approaches have been adopted: the first approach uses physiological signals such as heart rate [16], the time percentage of eye closure [17], and the behavioral characteristics of the driver such as the head position and the posture. The other approach relies on information about the driving behavior such as the vehicle speed and position in the lane, the steering wheel movements, and the steering angles. The first approach focuses on the driver and shows more accurate results than the second approach, but it requires more sensor data.
In this paper, we introduce the DriverSVT dataset to investigate driver behavior using data collected from smartphone sensors such as an accelerometer, gyroscope, etc. In contrast to our previous DriverMVT dataset [18], we present all our anonymized vehicle telemetry data collected during the last 5 years as well critical events (drowsiness, distraction, etc.) associated with the data. The data were recorded using different smartphones in real driving scenarios that took place in different traffic and road circumstances using the previously developed Drive Safely system [19,20]. The dataset contains more than 17.56 million entries collected from 633 different drivers and can be used to improve driver safety by building a driver behavior classifier. It also can be used to analyze the driving style and build a driver recognizing system. Since the dataset contains information about the driver’s heart rate and dangerous situations detected by the monitoring system (normal, drowsiness, distraction, unfasten belt, smartphone usage), this information can be used additionally to enhance the accuracy of driver behavior classifiers. In addition, we used K-mean clustering to label the data. K-means clustering [21] is a widely used algorithm in machine learning. The goal of using this method is to divide the dataset into a predefined number K of clusters. The number of clusters was calculated based on the elbow method. The cluster can be defined as a group of data points whose interpoint distances are small if compared with the distances of points outside of the cluster. We chose the K-means clustering over other unsupervised methods such as hierarchical clustering, and density-based spatial clustering, because it is more efficient at handling large datasets such as ours. Our main motivation was to provide the scientific community with a dataset that can help develop models to increase the safety on the road. The contributions of this paper can be summarized as follows:
- We introduced a diverse dataset collected using different sensors in real-time driving scenarios for analyzing driver behavior.
- We applied an unsupervised method (the K-means clustering) for labeling the data, then we analyzed the obtained results to detect the most frequent dangerous situations in each scenario.
2. Related Work
In this section, we briefly overview the datasets and methods used for driver monitoring and analysis systems. The authors of paper [22] presented a video dataset for a driver behavior classification task. The dataset was collected from twenty drivers and contained manual annotations for the image segmentation, namely, the location of the driver (the ground truth) alongside with the corresponding classes. Each driving posture in the dataset belonged to one of six activity classes (talking on the phone, eating, grasping the steering wheel, operating the shift gear, smoking, and phone play).
The MPIIGaze dataset [23] was built over 3 months using a monocular camera with 15 subjects simulating driving activity on a computer. The dataset has 213,659 images with gaze positions annotations. The dataset has different conditions of illuminance and movement and can be used to detect a driver’s lack of attention.
The DrivFace dataset [24] was published in 2016 with the purpose of estimating the driver’s level of attention. It contains 606 samples from four drivers in real driving scenarios. The dataset has frame-aligned annotations for the driver’s head pose angles and the looking direction.
The UAH-DriveSet dataset [25] contains 500 min of driving videos collected from six different drivers driving on two different road types: highways and secondary roads. The data simulated three different driving behavior styles: normal, drowsy, and aggressive. The videos were associated with raw and processed metadata collected using different sensors, including data from GPS and accelerometer. The dataset can be used for event recognition (acceleration, braking, turning, lane weaving, lane drifting, overspeeding, car following) and for driving style (normal, drowsy, and aggressive).
The authors of paper [26] introduced a dataset for classifying the driver behavior. The dataset had over 15,000 entries obtained from experienced drivers using smartphone sensors (accelerometers, gyroscopes, etc.) in real driving scenarios.
Machine learning methods have been widely used in driver monitoring and behavior analysis systems. Some researchers used traditional machine learning techniques such as [27], who used a support vector machine (SVM) to detect the activity state of the driver based on head pose, eye state, and hand cues. Ref. [28] used dynamic Bayesian networks and [29] used a logistic regression to detect drowsiness, while other researchers [30,31] used deep neural networks for drowsiness recognition.
Kontaxi et al. [32] used high-resolution smartphone data to investigate the impact of detailed trip characteristics on the frequency of harsh acceleration and harsh braking events. They used the sensors embedded in smartphones to collect the data (e.g., accelerometers and gyroscopes, magnetometers, and global navigation satellite system).
Liu et al. [33] proposed a motion-capture-based driving behavior analysis and monitoring system aimed to classify driver’s actions as normal or abnormal driving behaviors based on inertial measurement units, and the body’s joint angle series obtained by the iterative operation of a consecutive segment under the assumption of a rigid structure.
3. Dataset
In this section, an overview of the dataset is presented. Section 3.1 describes the methodology used for collecting the dataset, while Section 3.2 addresses the description of the dataset, and finally, in Section 3.3, an exploratory analysis of the dataset is presented.
3.1. Collection Methodology
The data were collected from 633 different drivers using smartphones with embedded accelerometer and gyroscope sensors while driving a vehicle. The data contain more than 17.56 million samples that describe driving behavior. Mobile devices were used to collect the accelerometer, the gyroscope, and the magnetometer data, as well as recording videos of the drivers. These videos were then analyzed by a set of deep-NN-based models to calculate the driver’s head pose [34], the safety belt state [35], the mouth openness ratio, and to detect dangerous states (e.g., eating, smoking, using phone, distraction, etc.) using trained neural networks. Additional features such as the heart rate were measured using a Xiaomi Mi Band 5 smartwatch.
3.2. Data Description
The collected data contained information about the driving behavior (see Table 1), including the starting time of the trip presented in milliseconds (Unix timestamp), the date time represented in milliseconds (Unix timestamp), which describes the time of current entry, the car speed and acceleration, the acceleration on the X, Y, and Z axes, the light level, the driver’s head pose angles (roll, pitch, and yaw) calculated using the method proposed in paper [34], the data from the gyro sensor (accelerometer data, gyroscope data, and magnetometer data), the PERCLOS, the Euler angle of the phone rotation, the user id to detect different drivers, the g-force (the acceleration data from the g-force (g-shock) sensor that can be used to detect small sudden movements), the device information that contains a description of the device used to collect data such as the device type and its specification (e.g., RAM capacity), the mouth openness ratio, the heart rate measured using a Xiaomi Mi Band 5 smartwatch, and dangerous states detecting a driver’s abnormal behavior such as using the phone while driving.
3.3. Data Exploration
In this section, we present an exploratory analysis of the data. The experiments were carried out using an Intel Core i9 server with 3.7 GHz processor frequency, 64 Gb RAM, and RTX 2080 Ti GPU.
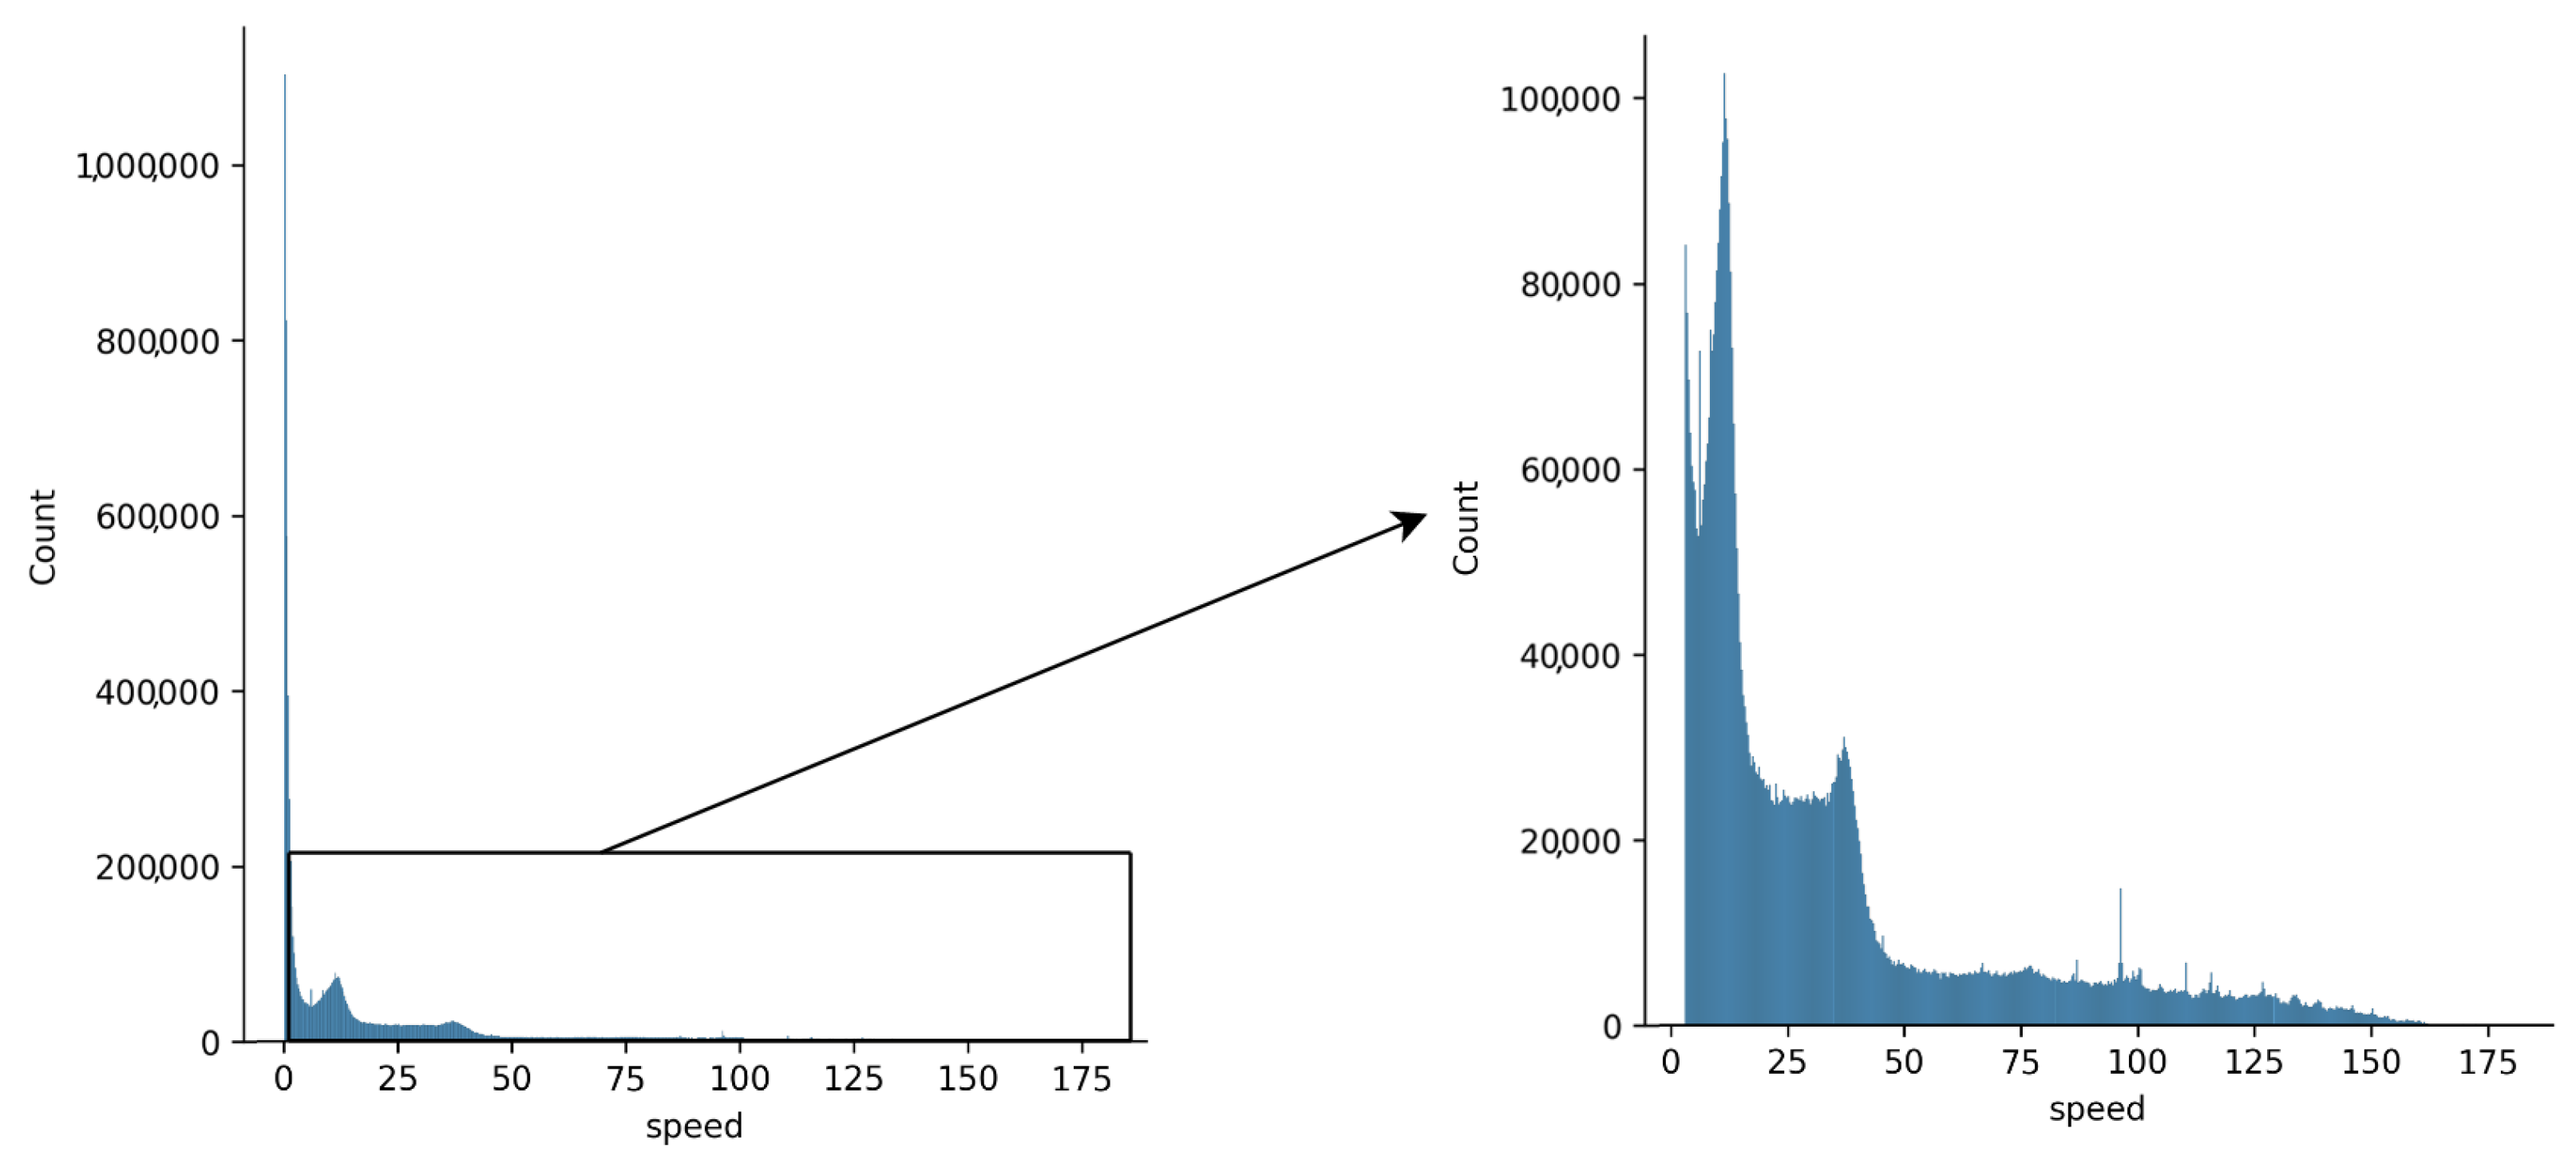
The histogram distribution of nonzero speed is presented in Figure 1. The dataset contained 6,176,105 entries with zero speed (caused by being stuck in traffic jams).
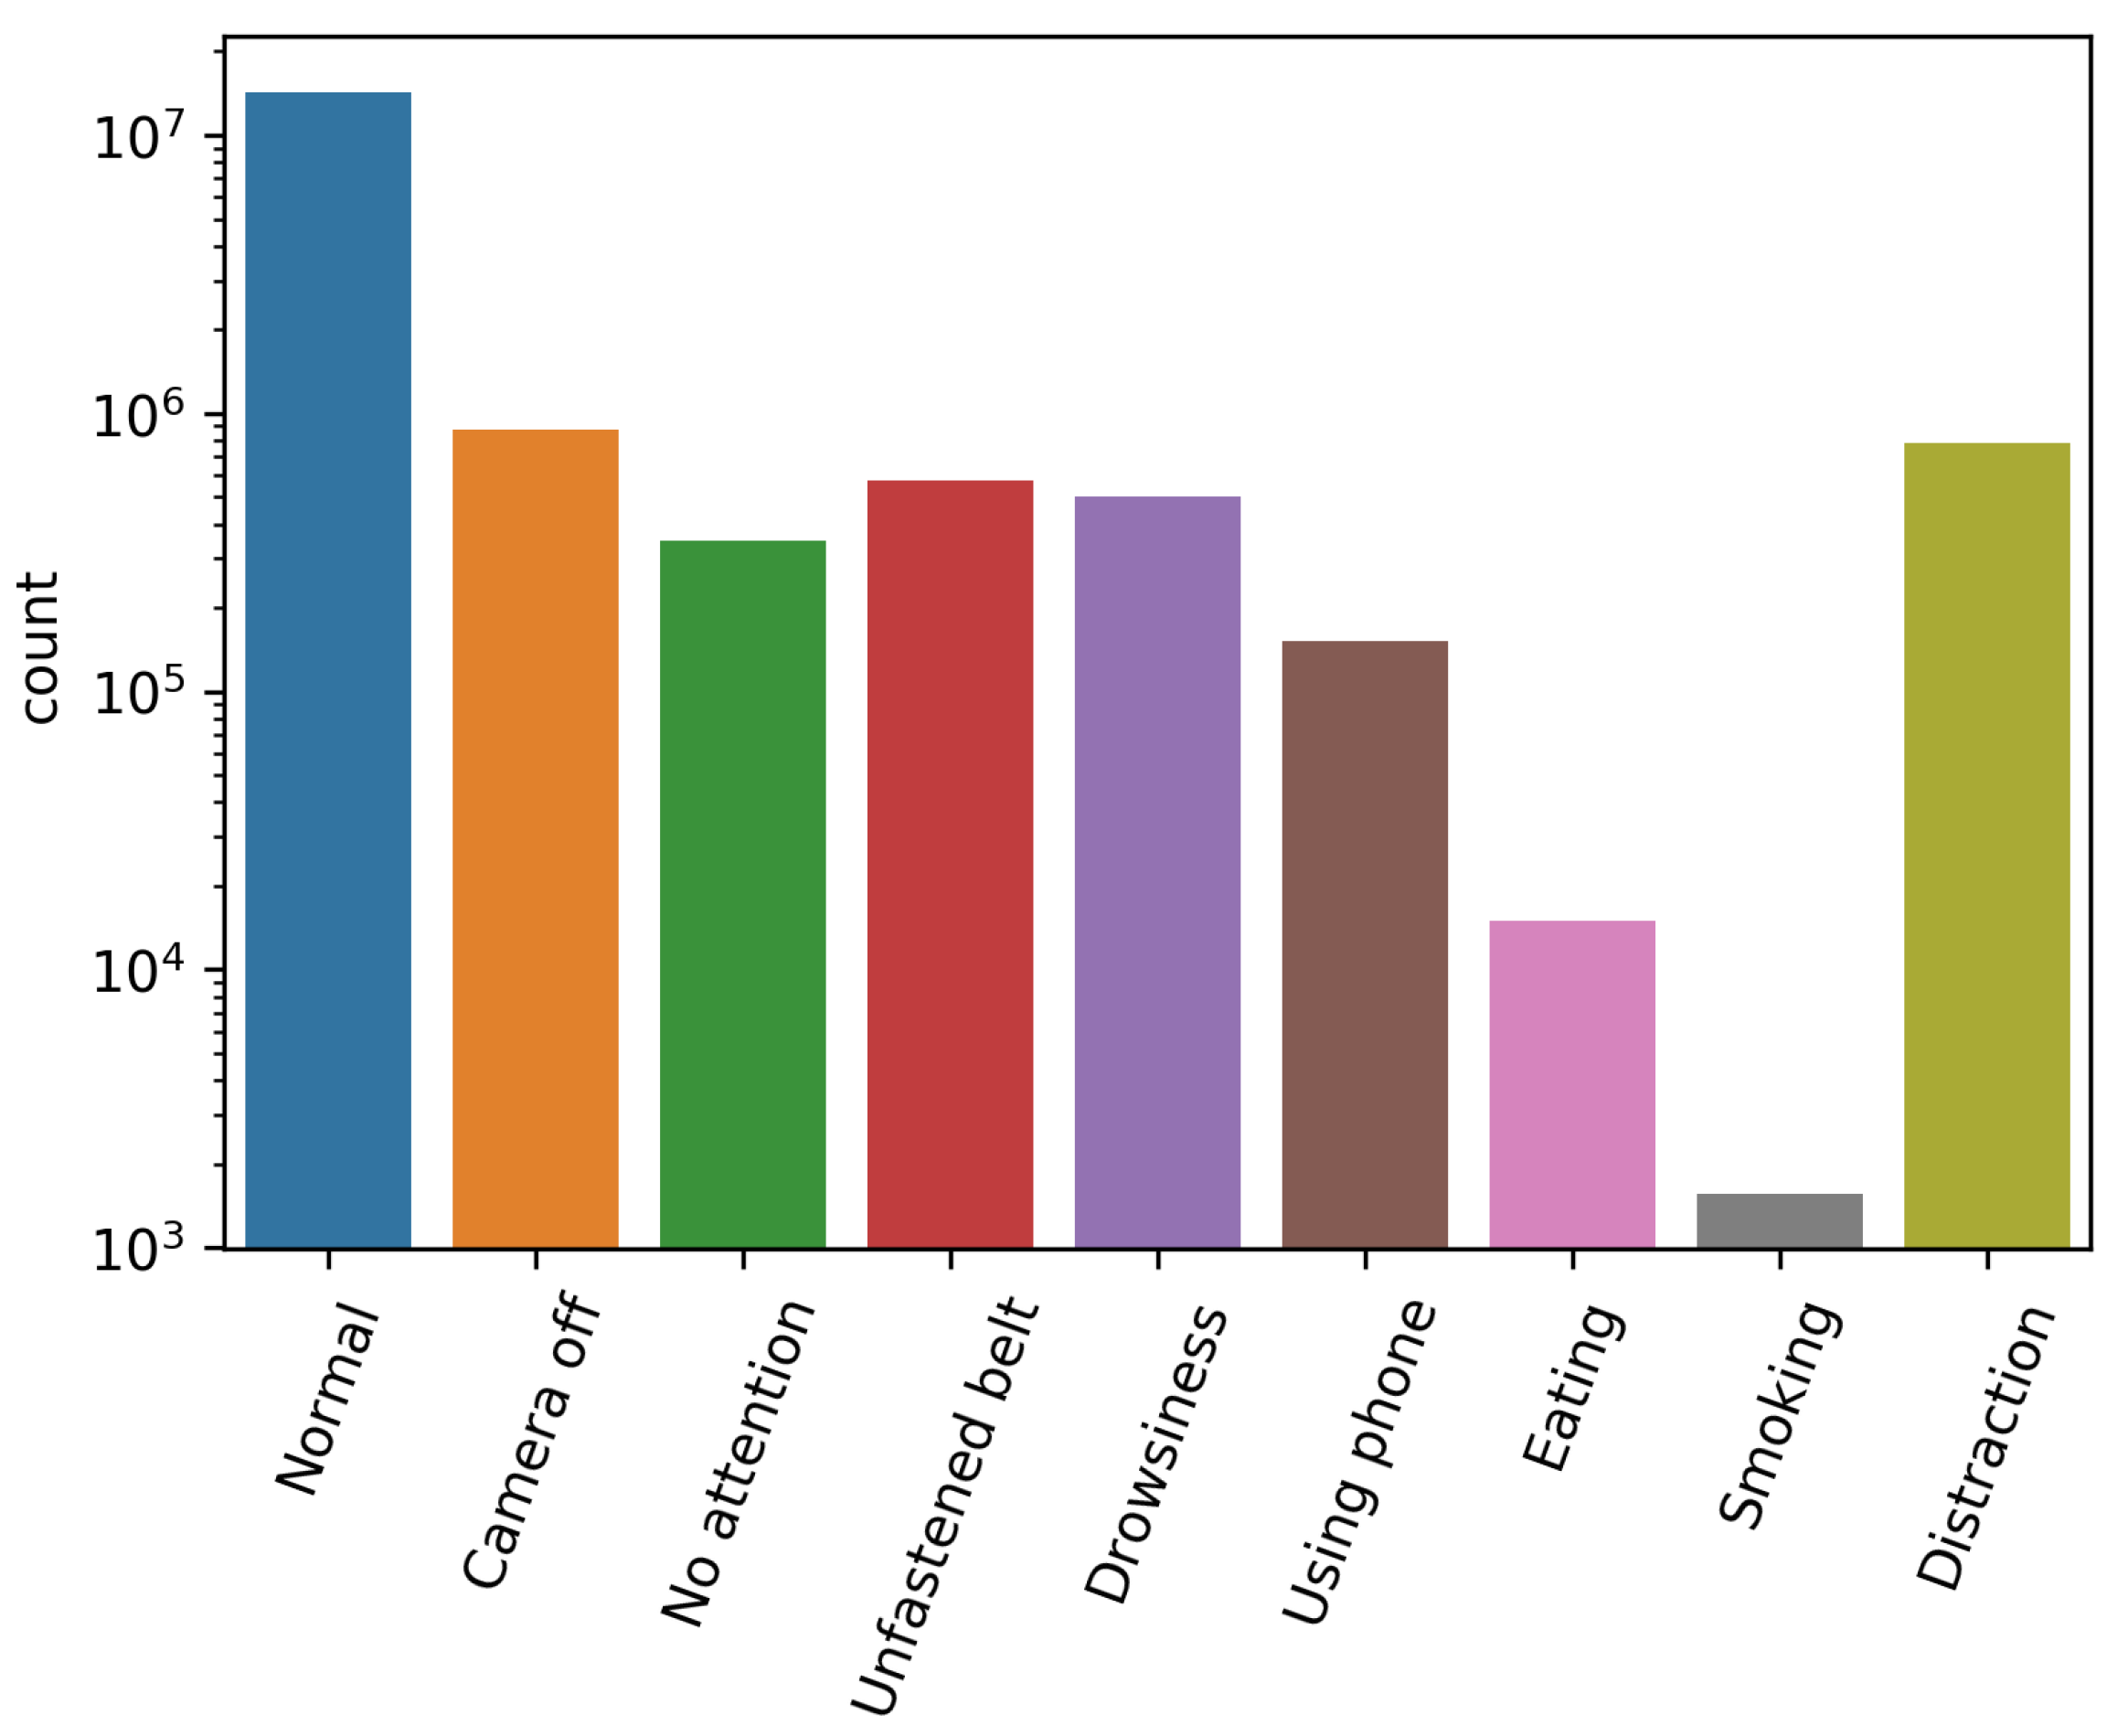
Figure 2 shows the number of samples for each critical event. Since there was a huge difference in the number of samples, the logarithmic scale of the count-axis was used.
Table 2 shows the maximum values for the sensors’ data for each critical event.
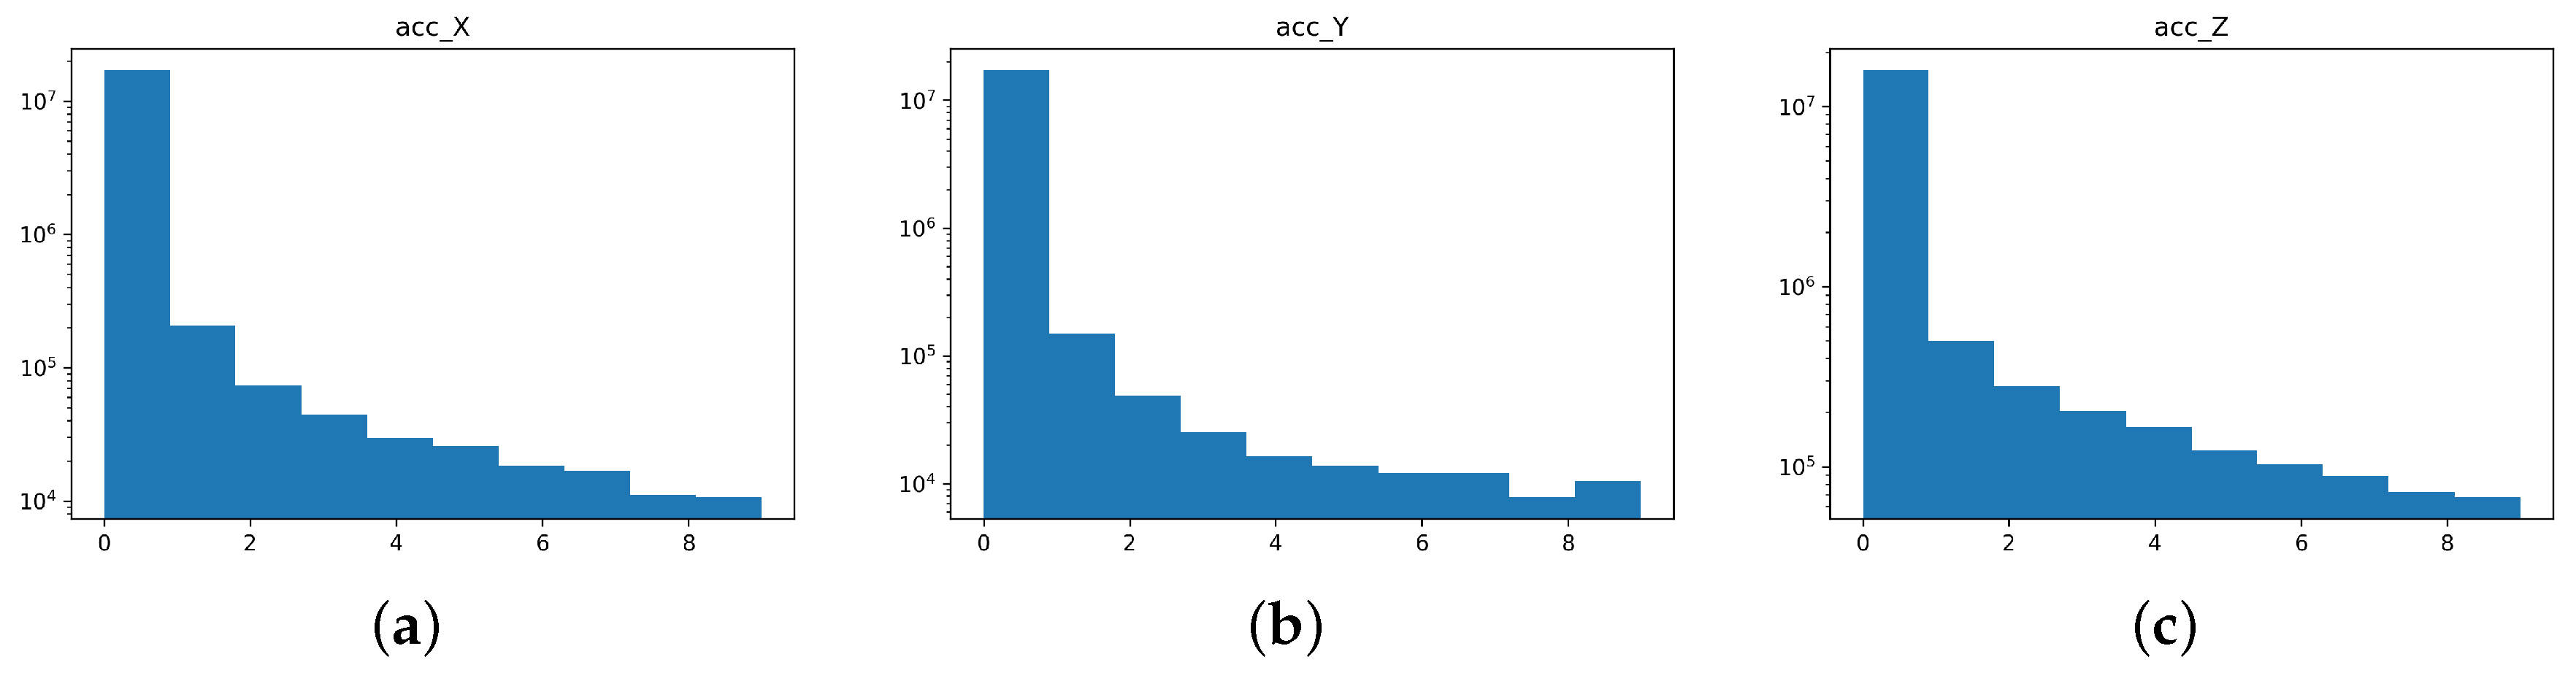
Figure 3 shows the histogram distribution of the acceleration data.
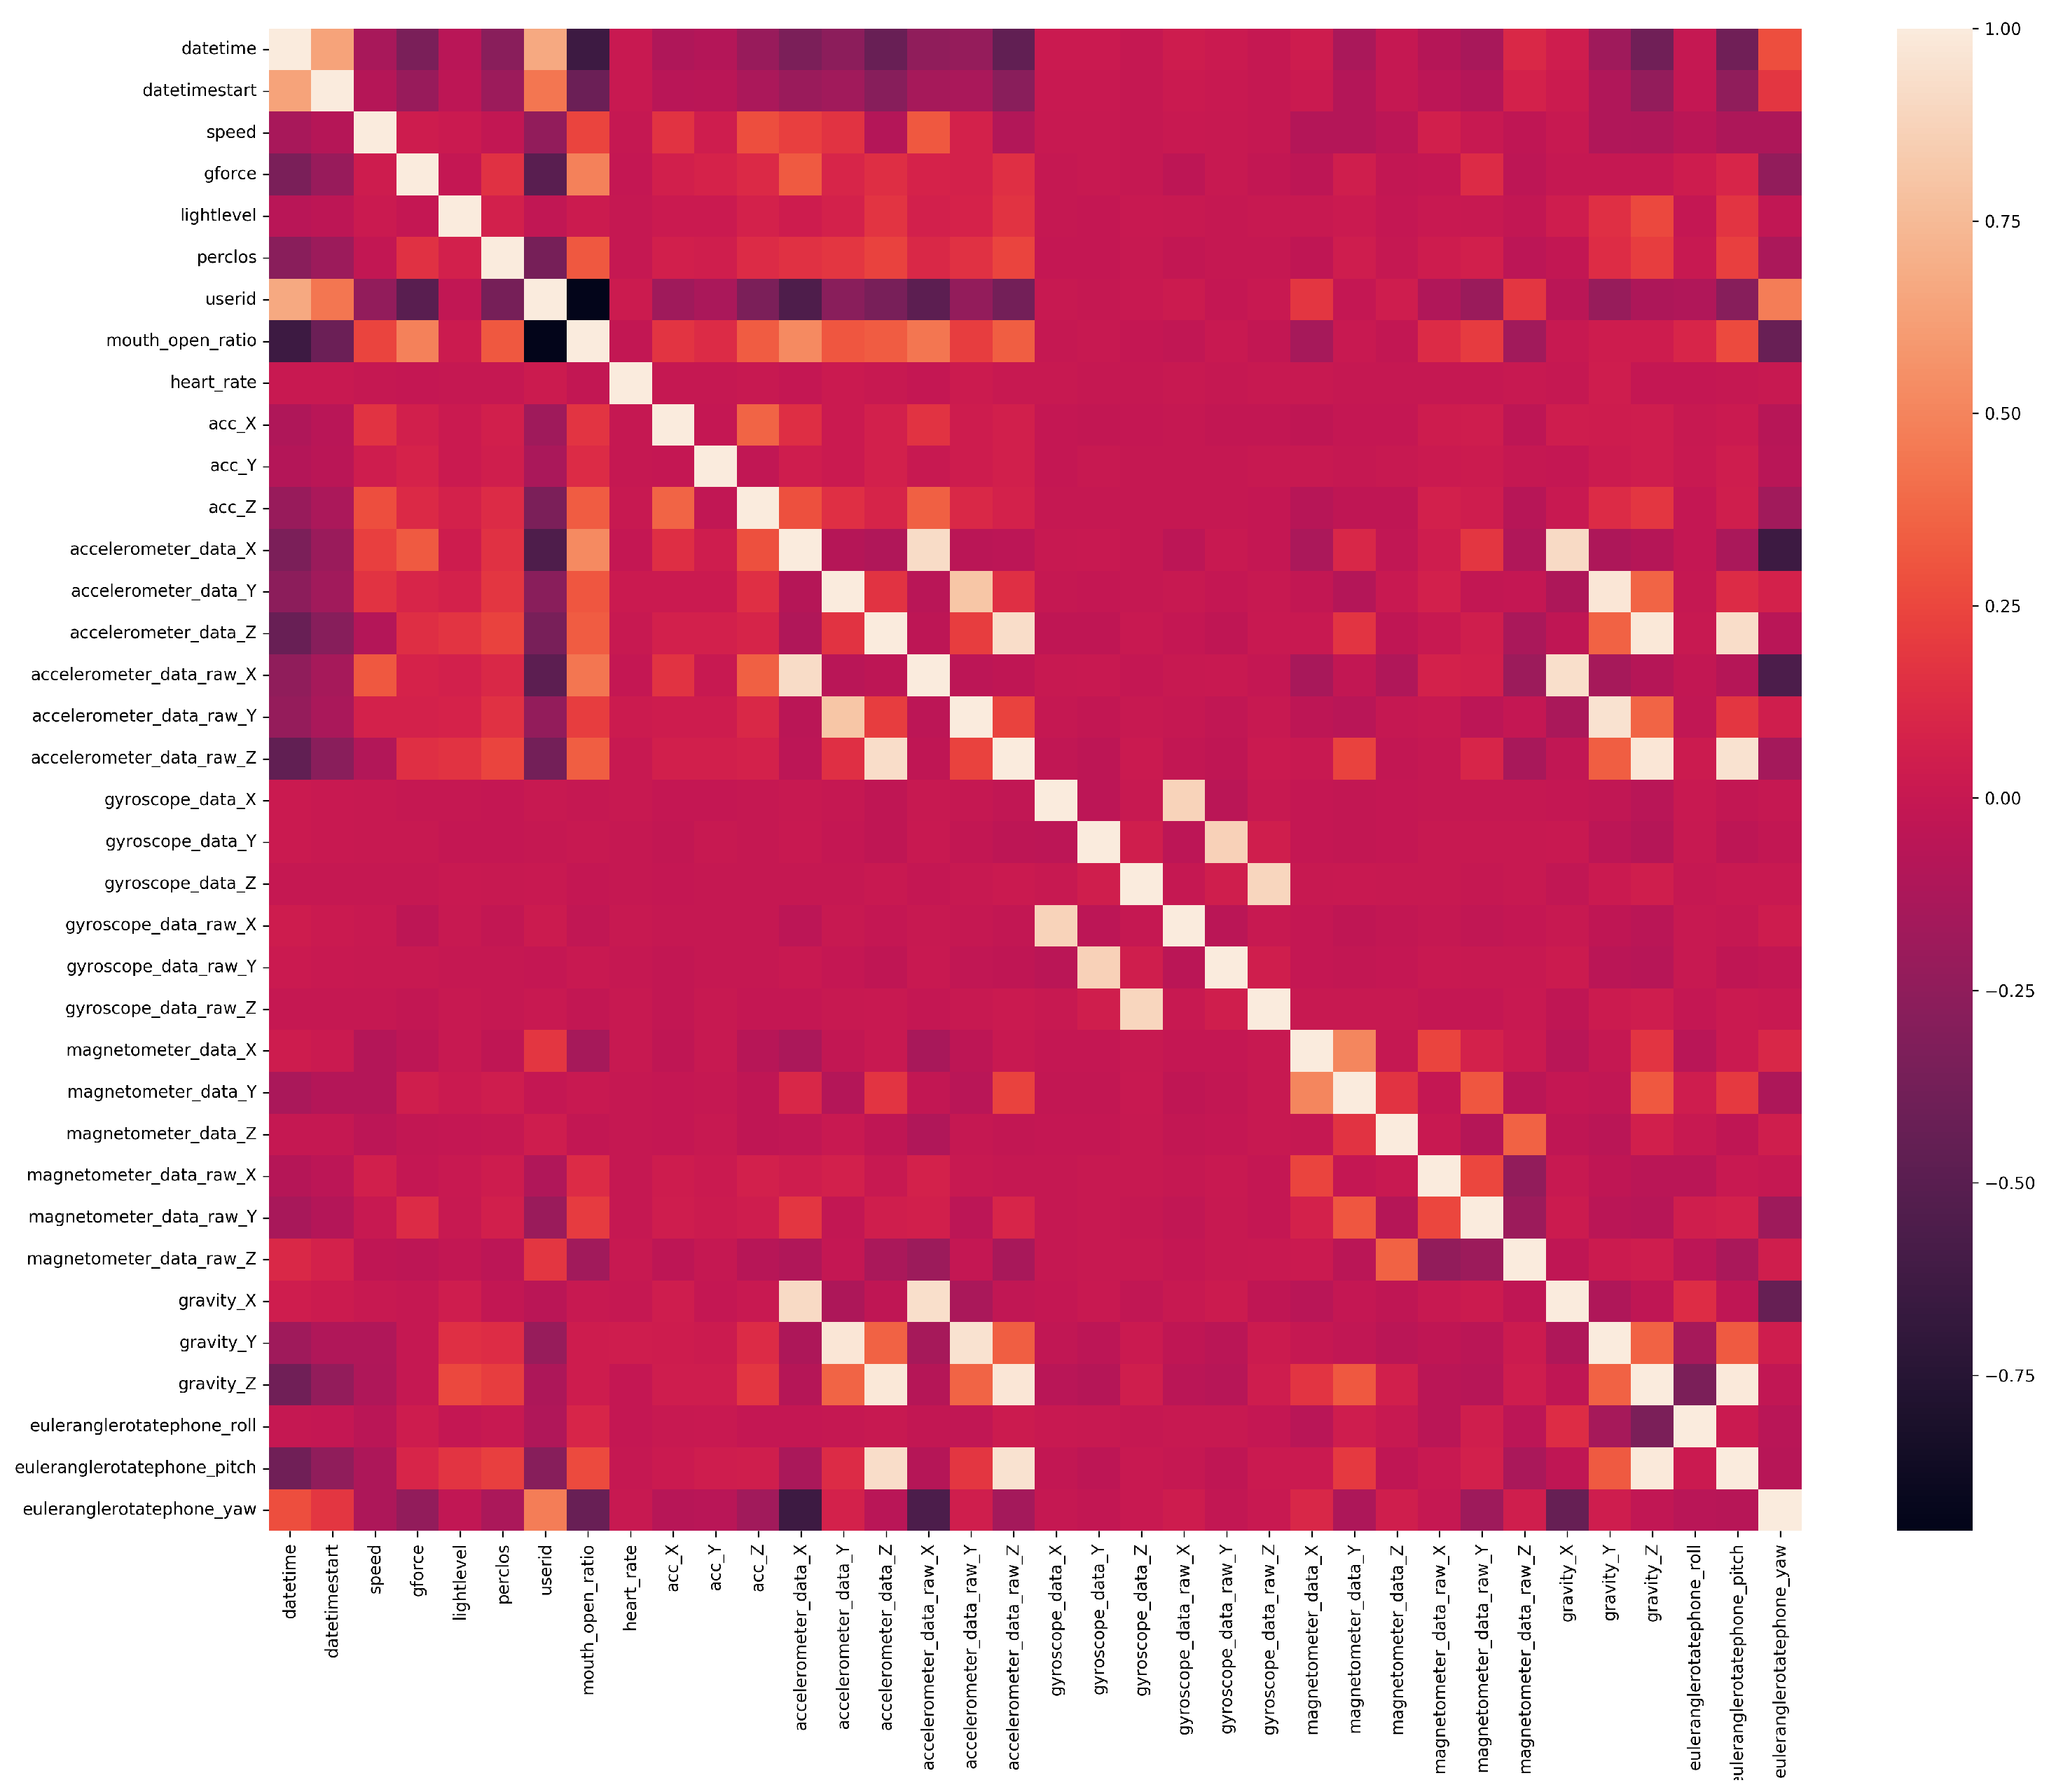
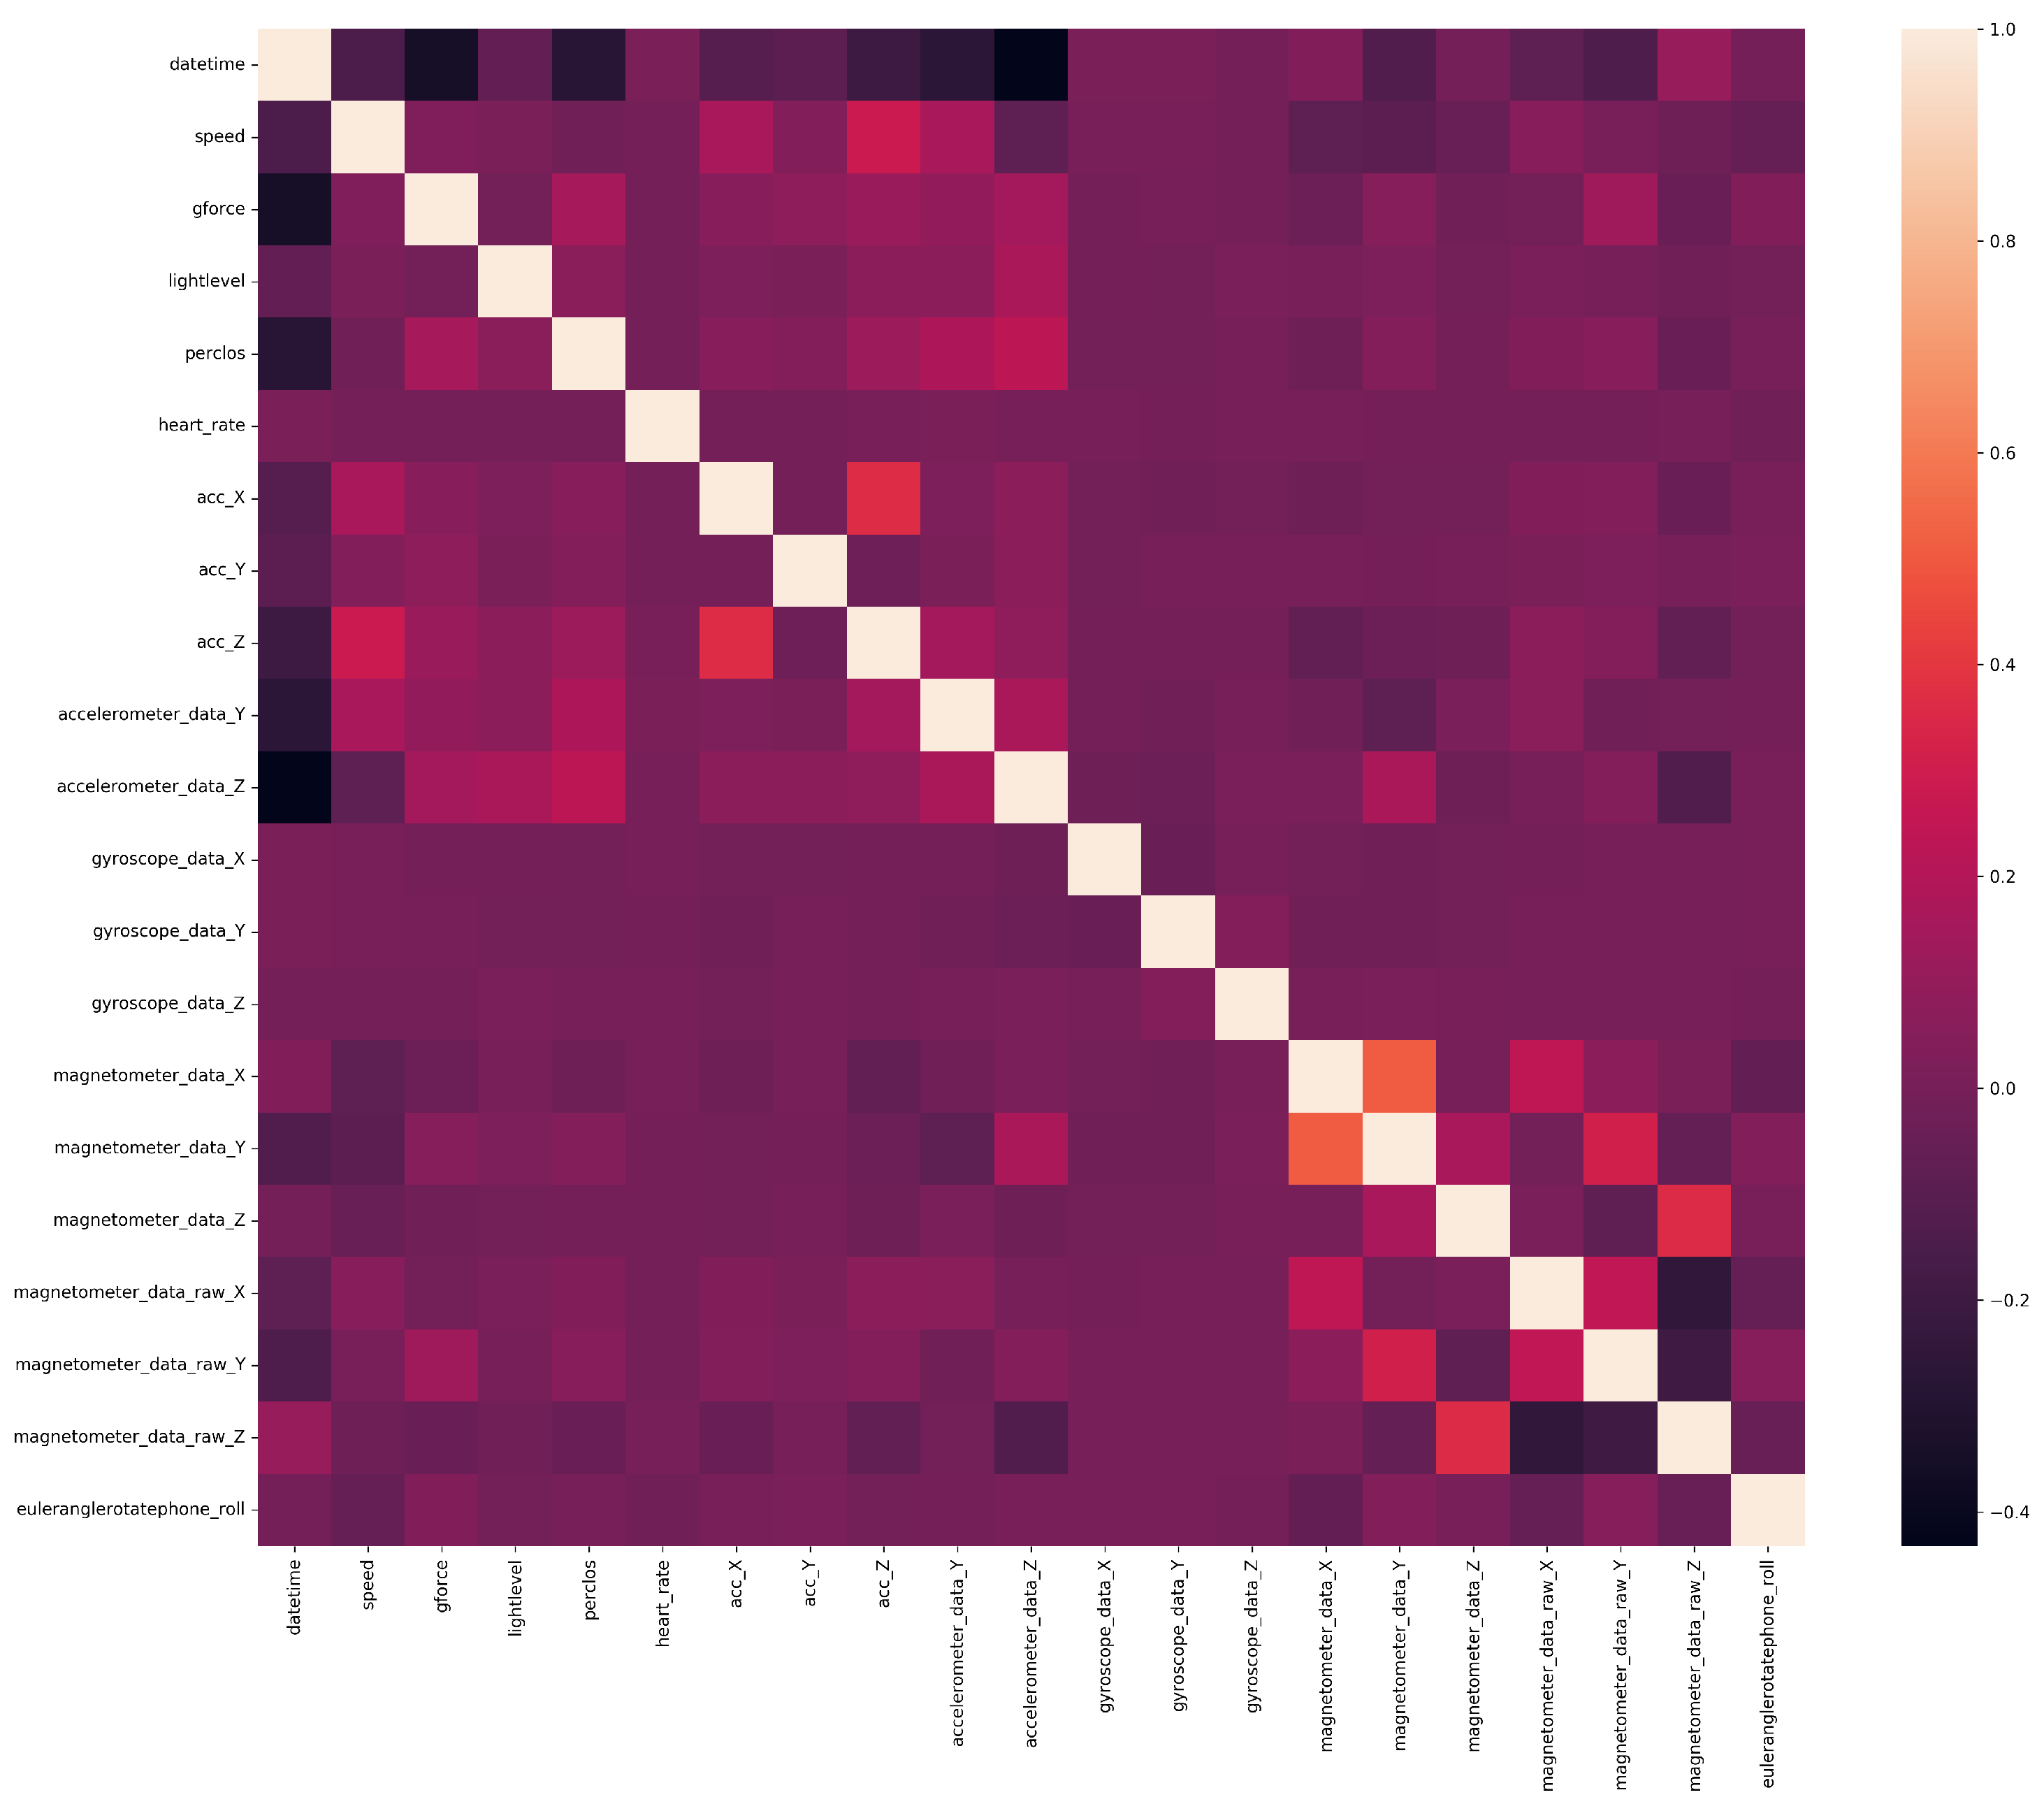
To analyze the data, we calculated the correlation matrix between the features. The “corr” function from the Python library “pandas” was used to compute pairwise correlation of the columns, then using the heatmap function from the Python library “seaborn”, we plotted the correlation matrix as a color-encoded heatmap. The results are shown in Figure 4. It can be observed that features had different levels of correlation and some of them were highly correlated. When the highly correlated features were removed, 24 features were left in dataset. Figure 5 shows the correlation matrix of these features.
4. Data Evaluation
We applied unsupervised learning method (K-means clustering) on the following features: speed, acc_X, acc_Y, acc_Z, gforce, accelerometer_data_X, accelerometer_data_Y, accelerometer_data_Z, gyroscope_data_X, gyroscope_data_Y, gyroscope_data_Z to explore the underlying patterns. We grouped the entries based on their similarity and showed whether clusters were related to critical events in the dataset. The K-means clustering technique is the most widely used in machine learning; it finds similar groups by minimizing the Euclidean distances between cluster centroids. To choose the optimal number of clusters to be used in the K-means procedure, the elbow method was used based on inertia. Inertia is defined as the sum of the samples’ squared distances to their closest cluster’s center. The elbow method suggests selecting the number of clusters when a significant change in inertia occurs. Figure 6 shows the change in inertia per number of clusters where the number of clusters was between one and eight.
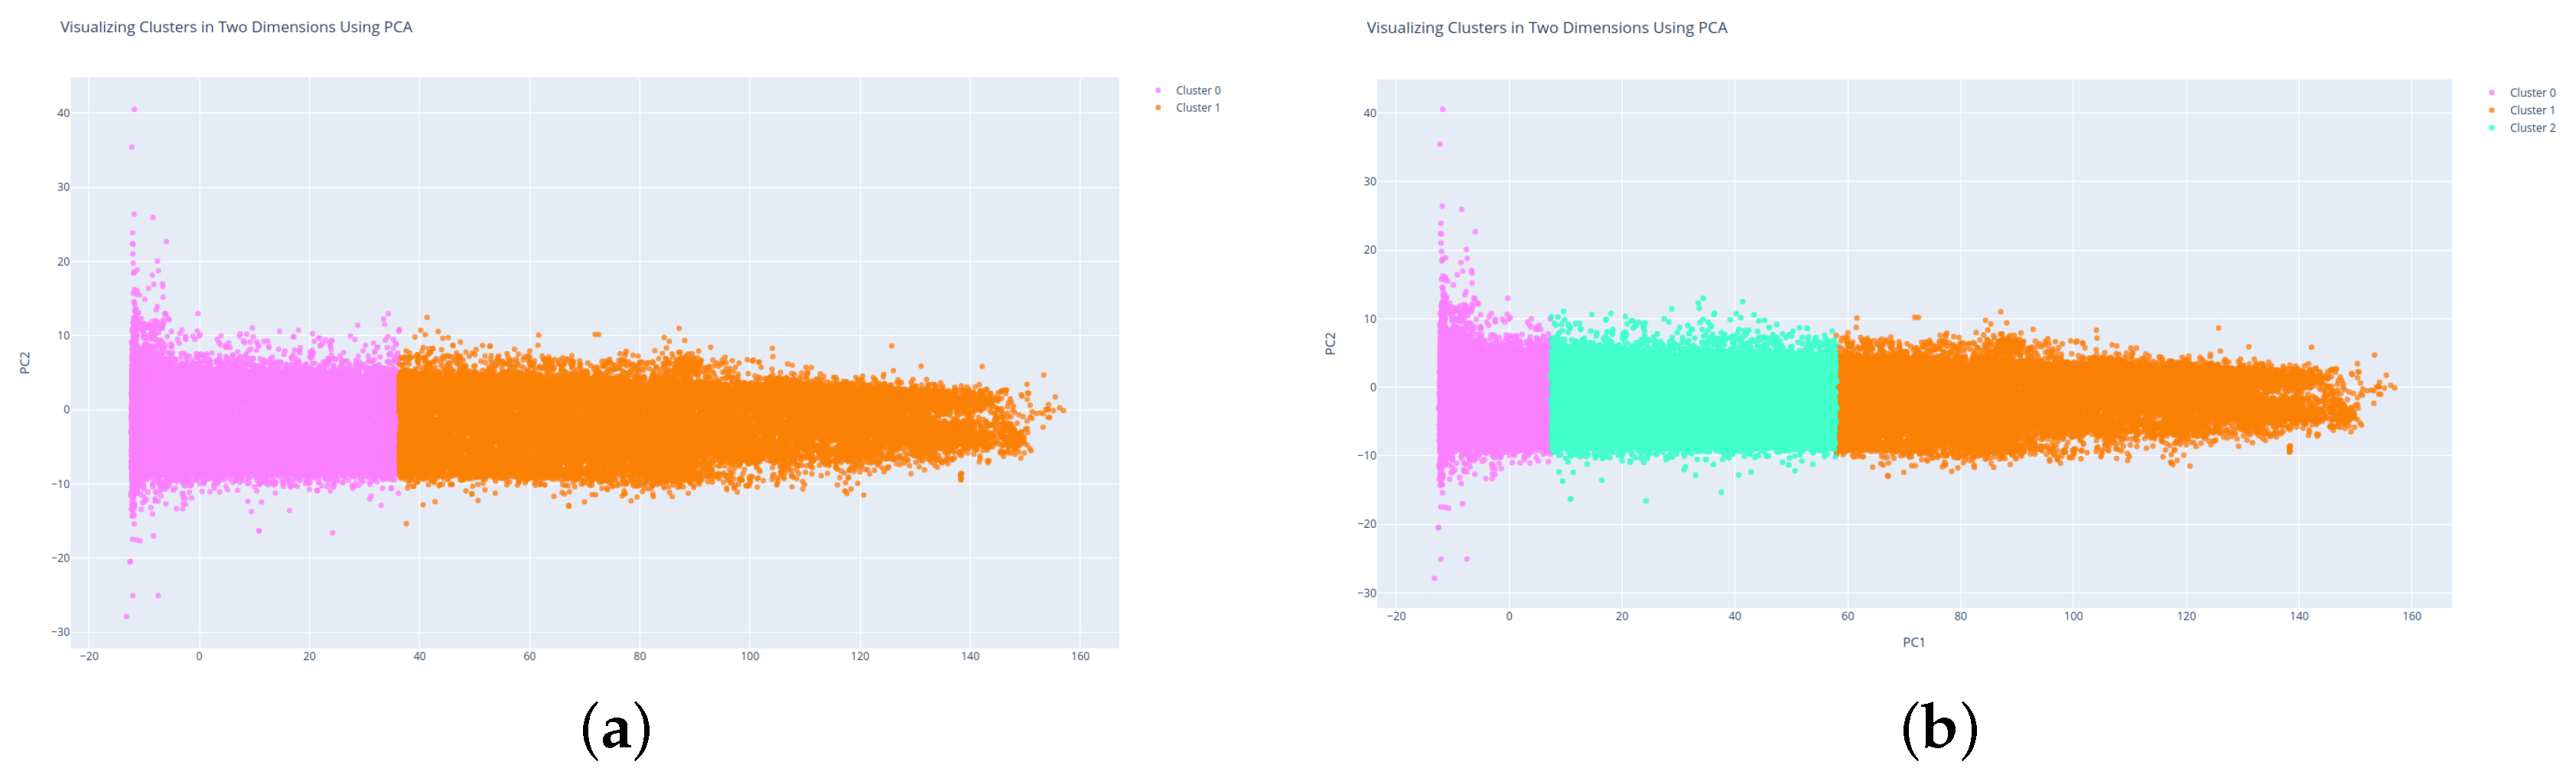
As we can see from the graph shown in Figure 6, the optimal number of clusters could be either two or three. To decide on the number of clusters we visualized 500 K samples of the data for both two and three clusters. Since the number of features was too high to visualize them in the conventional way, a dimensionality reduction technique was required to reduce the number of features to a more interpretable combination. The principal component analysis (PCA) is an unsupervised technique for dimensionality reduction that transforms correlated features linearly to a new set of uncorrelated principal components. Figure 7 shows the K-means clustering results with two and three clusters after representing the features using a PCA for 500 K randomly selected entries.
We counted the number of samples per cluster in the cases of two and three clusters. The results can be seen in Table 3 and Table 4.
After clustering the data, we analyzed the data for each cluster. Table 5 shows the analysis of the data for each cluster.
We show in Table 5 that cluster 0 contained entries with a speed range from 20 up to 70 km/h, which mostly represented driving in the city scenarios. Cluster 1 represented driving on highway trips. Cluster 2 contained entries with a speed range between 0 and 19.62 km/h, which mostly represented parking and starting driving scenarios.
Table 6 shows the percentage of critical events for each cluster. We excluded the critical events for cluster 2 since our system for detecting dangerous states was automatically turned off for speeds less than 20 km/h.
One can see from Table 6 that the most frequent critical event when driving in the city was an unfastened belt, while in highway driving scenarios, drowsiness was the most common dangerous situation. Therefore, we proved the general concept that usually, in the city, drivers do not like to use a seat belt since the speed is not very high and on highways, they often become drowsy since highway driving is monotonous.
5. Discussion
In this paper, we presented an extensive new dataset containing data on vehicle drivers’ physiological characteristics, together with the vehicles’ telemetry data and some auxiliary technical data. The anonymized data were collected from 633 different drivers driving in different conditions. All these data were analyzed in order to evaluate the driver state and behavior, taking into account the context of the vehicle.
The primary goal of the dataset is for studying and training machine learning models when developing driver monitoring systems. However, the variety of data included makes it possible to apply it to different tasks as well, such as the dependence between car movement and driver state or even driver identification based on the behavior and driving style.
The limitation of the dataset can be related to the fact that some of the drivers’ characteristics were obtained via computer vision models applied to recorded videos. Thus, in certain extent, the data depended on the quality of the applied models. However, in our previous works, we analyzed the quality of the applied models and showed that it was high enough not to affect the results significantly (e.g., [34,35]).
We believe that this dataset opens a wide range of possibilities for solving various tasks related to building machine learning models aimed at driver behavior and vehicle movement analysis.
6. Conclusions and Future Work
In this paper, we introduced a new extensive dataset for driver monitoring and behavior analysis. The dataset contained more than 17.56 million entries obtained from 633 different drivers in different illumination and road circumstances. The dataset contained a large number of raw and processed features. The raw features were collected using smartphones’ sensors such as accelerometer, magnetometer, gyroscope, and others, as well as a Xiaomi Mi Band 5 smartwatch that measured the driver’s heart rate. The processed features contained the drivers’ head pose and critical event detection (driver drowsiness, distraction, smartphone usage, etc.).
The dataset can be used for analyzing driver behavior and detecting aggressive driving style, which can help reduce accidents and increase road safety.
In addition, we applied K-mean clustering to the dataset for analyzing and labeling. The relationship between the clusters and the critical events were discussed. We proved the general concept that usually, in the city, drivers do not like to use a seat belt and on highways they often become drowsy.
Our future work will aim to extend the dataset by increasing the number of samples and adding more information about the driver’s vital signs such as respiratory rate and blood pressure values.
Author Contributions
W.O. was responsible for dataset preparation, formal analysis, and paper writing. A.K. was responsible for conceptualization, reviewing, and funding acquisition. B.H. was responsible for editing. N.S. was responsible for conceptualization and proofreading. All authors have read and agreed to the published version of the manuscript.
Funding
This work was supported by the Russian Science Foundation (project 18-71-10065). Described in
Section 5, the data evaluation that considered critical events analysis was supported by Russian Foundation for Basic Research (project no. 19-29-09081).
Institutional Review Board Statement
Not applicable.
Informed Consent Statement
Informed consent was obtained from all subjects involved in the study.
Data Availability Statement
Our dataset is available at the following web page: https://doi.org/10.5281/zenodo.7385340.
Conflicts of Interest
The authors declare no conflict of interest.
References
- Road Traffic Injuries. Available online: https://www.who.int/news-room/fact-sheets/detail/road-traffic-injuries (accessed on 21 October 2022).
- Zohoorian Yazdi, M.; Soryani, M. Driver drowsiness detection by identification of yawning and eye closure. Automot. Sci. Eng. 2019, 9, 3033–3044. [Google Scholar]
- Reddy, B.; Kim, Y.H.; Yun, S.; Seo, C.; Jang, J. Real-time driver drowsiness detection for embedded system using model compression of deep neural networks. In Proceedings of the IEEE Conference on Computer Vision and Pattern Recognition Workshops, Honolulu, HI, USA, 21–26 July 2017; pp. 121–128. [Google Scholar]
- Maior, C.B.S.; das Chagas Moura, M.J.; Santana, J.M.M.; Lins, I.D. Real-time classification for autonomous drowsiness detection using eye aspect ratio. Expert Syst. Appl. 2020, 158, 113505. [Google Scholar] [CrossRef]
- Muthukumaran, N.; Prasath, N.R.G.; Kabilan, R. Driver Sleepiness Detection Using Deep Learning Convolution Neural Network Classifier. In Proceedings of the 2019 3rd IEEE International conference on I-SMAC (IoT in Social, Mobile, Analytics and Cloud)(I-SMAC), Palladam, India, 12–14 December 2019; pp. 386–390. [Google Scholar]
- Huda, C.; Tolle, H.; Utaminingrum, F. Mobile-based driver sleepiness detection using facial landmarks and analysis of EAR Values. Int. Assoc. Online Eng. 2020, 14, 14. [Google Scholar] [CrossRef]
- Li, Z.; Li, S.E.; Li, R.; Cheng, B.; Shi, J. Online detection of driver fatigue using steering wheel angles for real driving conditions. Sensors 2017, 17, 495. [Google Scholar] [CrossRef] [Green Version]
- Patel, M.; Lal, S.K.; Kavanagh, D.; Rossiter, P. Applying neural network analysis on heart rate variability data to assess driver fatigue. Expert Syst. Appl. 2011, 38, 7235–7242. [Google Scholar] [CrossRef]
- Zhang, C.; Wang, H.; Fu, R. Automated detection of driver fatigue based on entropy and complexity measures. IEEE Trans. Intell. Transp. Syst. 2013, 15, 168–177. [Google Scholar] [CrossRef]
- Kim, W.; Choi, H.K.; Jang, B.T.; Lim, J. Driver distraction detection using single convolutional neural network. In Proceedings of the 2017 International Conference on Information and Communication Technology Convergence (ICTC), Jeju Island, Republic of Korea, 18–20 October 2017; pp. 1203–1205. [Google Scholar] [CrossRef]
- Eraqi, H.M.; Abouelnaga, Y.; Saad, M.H.; Moustafa, M.N. Driver distraction identification with an ensemble of convolutional neural networks. J. Adv. Transp. 2019, 2019, 1–12. [Google Scholar] [CrossRef]
- Chen, K.T.; Chen, H.Y.W. Driving style clustering using naturalistic driving data. Transp. Res. Rec. 2019, 2673, 176–188. [Google Scholar] [CrossRef]
- Mantouka, E.G.; Barmpounakis, E.N.; Vlahogianni, E.I. Identifying driving safety profiles from smartphone data using unsupervised learning. Saf. Sci. 2019, 119, 84–90. [Google Scholar] [CrossRef]
- Fazeen, M.; Gozick, B.; Dantu, R.; Bhukhiya, M.; González, M.C. Safe Driving Using Mobile Phones. IEEE Trans. Intell. Transp. Syst. 2012, 13, 1462–1468. [Google Scholar] [CrossRef]
- Palimkar, P.; Bajaj, V.; Mal, A.K.; Shaw, R.N.; Ghosh, A. Unique action identifier by using magnetometer, accelerometer and gyroscope: KNN approach. In Advanced Computing and Intelligent Technologies; Springer: Berlin/Heidelberg, Germany, 2022; pp. 607–631. [Google Scholar]
- Salvati, L.; d’Amore, M.; Fiorentino, A.; Pellegrino, A.; Sena, P.; Villecco, F. Development and Testing of a Methodology for the Assessment of Acceptability of LKA Systems. Machines 2020, 8, 47. [Google Scholar] [CrossRef]
- McDonald, A.D.; Schwarz, C.; Lee, J.D.; Brown, T.L. Real-time detection of drowsiness related lane departures using steering wheel angle. In Proceedings of the Human Factors and Ergonomics Society Annual Meeting, Boston, MA, USA, 22–26 October 2012; Sage Publications Sage CA: Los Angeles, CA, USA, 2012; Volume 56, pp. 2201–2205. [Google Scholar]
- Othman, W.; Kashevnik, A.; Ali, A.; Shilov, N. DriverMVT: In-Cabin Dataset for Driver Monitoring Including Video and Vehicle Telemetry Information. Data 2022, 7, 62. [Google Scholar] [CrossRef]
- Kashevnik, A.; Lashkov, I.; Gurtov, A. Methodology and Mobile Application for Driver Behavior Analysis and Accident Prevention. IEEE Trans. Intell. Transp. Syst. 2020, 21, 2427–2436. [Google Scholar] [CrossRef]
- Kashevnik, A.; Lashkov, I.; Ponomarev, A.; Teslya, N.; Gurtov, A. Cloud-Based Driver Monitoring System Using a Smartphone. IEEE Sens. J. 2020, 20, 6701–6715. [Google Scholar] [CrossRef]
- Kanungo, T.; Mount, D.M.; Netanyahu, N.S.; Piatko, C.D.; Silverman, R.; Wu, A.Y. An efficient k-means clustering algorithm: Analysis and implementation. IEEE Trans. Pattern Anal. Mach. Intell. 2002, 24, 881–892. [Google Scholar] [CrossRef]
- Zhao, C.; Zhang, B.; He, J.; Lian, J. Recognition of driving postures by contourlet transform and random forests. IET Intell. Transp. Syst. 2012, 6, 161–168. [Google Scholar] [CrossRef]
- Zhang, X.; Sugano, Y.; Fritz, M.; Bulling, A. MPIIGaze: Real-World Dataset and Deep Appearance-Based Gaze Estimation. IEEE Trans. Pattern Anal. Mach. Intell. 2017, 41, 162–175. [Google Scholar] [CrossRef] [Green Version]
- Diaz-Chito, K.; Hernández-Sabaté, A.; López, A.M. A reduced feature set for driver head pose estimation. Appl. Soft Comput. 2016, 45, 98–107. [Google Scholar] [CrossRef]
- Romera, E.; Bergasa, L.M.; Arroyo, R. Need data for driver behaviour analysis? Presenting the public UAH-DriveSet. In Proceedings of the 2016 IEEE 19th International Conference on Intelligent Transportation Systems (ITSC), Rio de Janeiro, Brazil, 1–4 November 2016; pp. 387–392. [Google Scholar]
- Wawage, P.; Deshpande, Y. Smartphone Sensor Dataset for Driver Behavior Analysis. Data Brief 2022, 41, 107992. [Google Scholar] [CrossRef]
- Ohn-Bar, E.; Martin, S.; Tawari, A.; Trivedi, M.M. Head, eye, and hand patterns for driver activity recognition. In Proceedings of the 2014 IEEE 22nd International Conference on Pattern Recognition, Stockholm, Sweden, 24–28 August 2014; pp. 660–665. [Google Scholar]
- McDonald, A.D.; Lee, J.D.; Schwarz, C.; Brown, T.L. A contextual and temporal algorithm for driver drowsiness detection. Accid. Anal. Prev. 2018, 113, 25–37. [Google Scholar] [CrossRef]
- Murata, A. Proposal of a method to predict subjective rating on drowsiness using physiological and behavioral measures. IIE Trans. Occup. Ergon. Hum. Factors 2016, 4, 128–140. [Google Scholar] [CrossRef]
- Correa, A.G.; Orosco, L.; Laciar, E. Automatic detection of drowsiness in EEG records based on multimodal analysis. Med. Eng. Phys. 2014, 36, 244–249. [Google Scholar] [CrossRef]
- de Naurois, C.J.; Bourdin, C.; Stratulat, A.; Diaz, E.; Vercher, J.L. Detection and prediction of driver drowsiness using artificial neural network models. Accid. Anal. Prev. 2019, 126, 95–104. [Google Scholar] [CrossRef] [PubMed]
- Kontaxi, A.; Ziakopoulos, A.; Yannis, G. Trip characteristics impact on the frequency of harsh events recorded via smartphone sensors. IATSS Res. 2021, 45, 574–583. [Google Scholar] [CrossRef]
- Liu, L.; Wang, Z.; Qiu, S. Driving behavior tracking and recognition based on multisensors data fusion. IEEE Sens. J. 2020, 20, 10811–10823. [Google Scholar] [CrossRef]
- Kashevnik, A.; Ali, A.; Lashkov, I.; Zubok, D. Human Head Angle Detection Based on Image Analysis. In Proceedings of the Future Technologies Conference (FTC) 2020, Virtual, 5–6 November 2020; Springer International Publishing: Cham, Switzerland, 2021; Volume 1, pp. 233–242. [Google Scholar]
- Kashevnik, A.; Ali, A.; Lashkov, I.; Shilov, N. Seat Belt Fastness Detection Based on Image Analysis from Vehicle In-abin Camera. In Proceedings of the 2020 26th Conference of Open Innovations Association (FRUCT), Yaroslavl, Russia, 23–24 April 2020; pp. 143–150. [Google Scholar] [CrossRef]
Figure 1.
Distribution of vehicle speed in the whole dataset.

Figure 2.
Distribution of the critical events calculated using camera images.

Figure 3.
Histogram of the acceleration distribution. (a) Acceleration along X-axis. (b) Acceleration along Y-axis. (c) Acceleration along Z-axis.
Figure 3.
Histogram of the acceleration distribution. (a) Acceleration along X-axis. (b) Acceleration along Y-axis. (c) Acceleration along Z-axis.

Figure 4.
Feature correlation matrix.

Figure 5.
The correlation matrix of the selected features.

Figure 6.
The change of inertia with respect to the number of clusters.

Figure 7.
K-means with two and three clusters after representing the features using PCA. (a) K-means clustering results with two clusters. (b) K-means clustering results with three clusters.
Figure 7.
K-means with two and three clusters after representing the features using PCA. (a) K-means clustering results with two clusters. (b) K-means clustering results with three clusters.


Table 1.
Dataset features’ description.
| Column Name | Description | Notation/Unit |
|---|---|---|
| datetime | Time the entry was recorded | Unix timestamp (ms) |
| datetimestart | Driving trip starting time | Unix timestamp (ms) |
| speed | Vehicle speed | km/h |
| acc_X,acc_Y,acc_Z | Linear acceleration on X, Y, Z axes, respectively | m/ |
| lightlevel | Light level | lux |
| euleranglerotatephone | The Euler angles of the used phone | degrees |
| perclos | Percentage of time when the driver’s eyes were closed | - |
| userid | The id of the driver | - |
| accelerometer_data_raw | Raw data from the accelerometer | m/s |
| gyroscope_data_raw | Raw data from the gyroscope | degree/s |
| magnetometer_data_raw | Raw data from the magnetometer | Tesla |
| deviceinfo | Specifications of the device used to collect the information | - |
| gforce | Data provided by the g-force sensor | - |
| head_pose | Raw Euler angles (pitch, yaw, roll) | degrees |
| accelerometer_data | Changes in velocity | m/ |
| gyroscope_data | Angular velocity | degree/s |
| magnetometer_data | Magnetic field intensity | Tesla |
| face_mouth | Mouth openness ratio | - |
| heart_rate | Driver’s heart rate | beats per minute |
| dangerousstate | A critical event | - |
Table 2.
Sensors’ data maximum values for each critical event.
| Critical Event | Speed | acc | gforce | gyro_X | gyro_Y | gyro_Z | mag_X | mag_Y | mag_Z | grv_X | grv_Y | grv_Z |
|---|---|---|---|---|---|---|---|---|---|---|---|---|
| No attention | 139.65 | 2.75 | 6.0 | 0.49 | 0.46 | 0.46 | 361.23 | 586.99 | 556.92 | 9.79 | 9.8 | 9.74 |
| Smoking | 79.81 | 0.0 | 0.0 | 0.0 | 0.0 | 0.0 | 0.0 | 0.0 | 0.0 0.0 | 0.0 | 0.0 | 0.0 |
| Eating | 127.02 | 6.32 | 7.84 | 1.24 | 1.27 | 0.25 | 20.57 | 0.0 | 12.21 | 2.1 | 3.6 | 9.8 |
| Unfastened belt | 127.09 | 3.84 | 12.93 | 1.312 | 0.99 | 0.66 | 60.7 | 61.48 | 175.75 | 9.8 | 9.78 | 9.74 |
| Using phone | 129.65 | 7.76 | 4.08 | 0.38 | 1.52 | 0.74 | 110.68 | 46.09 | 11.53 | 2.8 | 9.8 | 9.78 |
| Camera off | 71.3 | 15.13 | 21.81 | 2.79 | 3.05 | 3.01 | 286.97 | 589.69 | 559.71 | 9.8 | 9.8 | 9.8 |
| Distraction | 169.97 | 44.55 | 69.58 | 7.35 | 5.57 | 4.84 | 818.10 | 851.94 | 213.20 | - | - | - |
| Drowsiness | 163.65 | 44.55 | 22.52 | 6.39 | 4.29 | 2.66 | 828.6 | 871.86 | 261.53 | 1.52 | 9.75 | 0.0 |
| Normal | 169.89 | 46.85 | 105.819 | 8.36 | 12.7 | 11.71 | 2603.9 | 1902.78 | 4915.05 | 9.8 | 9.8 | 9.8 |
Table 3.
Number of samples per cluster for two clusters.
| Cluster | Number of Samples |
|---|---|
| Cluster 0 | 16,257,599 |
| Cluster 1 | 1,303,902 |
Table 4.
Number of samples per cluster for three clusters.
| Cluster | Number of Samples |
|---|---|
| Cluster 0 | 2,187,217 |
| Cluster 1 | 933,391 |
| Cluster 2 | 14,440,893 |
Table 5.
Analyzing the data for each cluster.
| Cluster 0 | Cluster 1 | Cluster 2 | |||||||
|---|---|---|---|---|---|---|---|---|---|
| min | Mean | max | min | Mean | max | min | Mean | max | |
| speed | 18.96 | 36.31 | 70.38 | 69.29 | 103.35 | 169.97 | 0.00 | 2.31 | 19.62 |
| gforce | −13.18 | 0.11 | 69.58 | −11.14 | 0.25 | 30.67 | −24.85 | 0.14 | 105.82 |
| acc_X | 0.00 | 0.07 | 9.00 | 0.00 | 0.43 | 9.00 | 0.00 | 0.04 | 9.00 |
| acc_Y | 0.00 | 0.06 | 9.00 | 0.00 | 0.11 | 9.00 | 0.00 | 0.04 | 9.00 |
| acc_Z | 0.00 | 0.50 | 9.00 | 0.00 | 1.62 | 9.00 | 0.00 | 0.19 | 9.00 |
| accelerometer_data_X | −18.05 | 1.32 | 22.84 | −14.01 | 4.07 | 23.54 | −55.13 | 0.80 | 49.67 |
| accelerometer_data_Y | −32.74 | 0.75 | 27.81 | −10.60 | 2.83 | 22.72 | −78.44 | 0.76 | 39.23 |
| accelerometer_data_Z | −42.55 | 1.04 | 32.44 | −18.14 | 1.43 | 20.41 | −63.33 | 2.00 | 54.54 |
| gyroscope_data_X | −5.99 | 0.00 | 3.89 | −5.71 | 0.00 | 3.59 | −11.93 | 0.00 | 8.36 |
| gyroscope_data_Y | −8.10 | 0.00 | 5.25 | −4.32 | 0.00 | 3.03 | −17.82 | 0.00 | 12.70 |
| gyroscope_data_Z | −4.69 | 0.00 | 4.84 | −2.55 | 0.00 | 1.61 | −9.31 | 0.00 | 11.71 |
| magnetometer_data_X | −963.73 | −3.88 | 816.90 | −963.73 | −11.56 | 828.60 | −1448.70 | −1.23 | 2603.90 |
| magnetometer_data_Y | −2596.39 | −4.56 | 863.88 | −2535.17 | −7.85 | 871.86 | −2599.13 | 8.55 | 1902.78 |
| magnetometer_data_Z | −775.52 | −1.67 | 852.60 | −734.27 | −6.55 | 381.81 | −1160.90 | 0.67 | 4915.05 |
| gravity_X | −9.70 | 0.00 | 9.81 | −9.71 | −0.04 | 9.75 | −9.80 | −0.02 | 9.81 |
| gravity_Y | −9.36 | 0.05 | 9.81 | −3.44 | 0.01 | 9.81 | −9.81 | 0.40 | 9.81 |
| gravity_Z | −6.09 | 0.58 | 9.81 | −3.43 | 0.09 | 9.78 | −9.80 | 1.20 | 9.81 |
| euleranglerotatephone_roll | −180.00 | −3.03 | 180.00 | −180.00 | −13.02 | 180.00 | −180.00 | 1.58 | 180.00 |
| euleranglerotatephone_pitch | −85.18 | 7.18 | 90.00 | −84.70 | 6.50 | 89.95 | −89.88 | 15.18 | 90.00 |
| euleranglerotatephone_yaw | −180.00 | −13.53 | 180.00 | −180.00 | −33.41 | 180.00 | −180.00 | −9.36 | 180.00 |
Table 6.
Critical event clusters.
| State | Cluster 0 | Cluster 1 |
|---|---|---|
| Unfastened belt | 14.88% | 0.09% |
| Drowsiness | 6.34% | 21.29% |
| Eating | 0.35% | 0.41% |
| Distraction | 6.50% | 11.36% |
| Normal | 58.10% | 62.86% |
| Smoking | 0.04% | 0.05% |
| No attention | 8.96% | 2.31% |
| Camera off | 1.15% | 0.01% |
| Using phone | 3.67% | 1.61% |
Publisher’s Note: MDPI stays neutral with regard to jurisdictional claims in published maps and institutional affiliations. |
© 2022 by the authors. Licensee MDPI, Basel, Switzerland. This article is an open access article distributed under the terms and conditions of the Creative Commons Attribution (CC BY) license (https://creativecommons.org/licenses/by/4.0/).
Share and Cite
MDPI and ACS Style
Othman, W.; Kashevnik, A.; Hamoud, B.; Shilov, N. DriverSVT: Smartphone-Measured Vehicle Telemetry Data for Driver State Identification. Data 2022, 7, 181. https://doi.org/10.3390/data7120181
AMA Style
Othman W, Kashevnik A, Hamoud B, Shilov N. DriverSVT: Smartphone-Measured Vehicle Telemetry Data for Driver State Identification. Data. 2022; 7(12):181. https://doi.org/10.3390/data7120181
Chicago/Turabian StyleOthman, Walaa, Alexey Kashevnik, Batol Hamoud, and Nikolay Shilov. 2022. "DriverSVT: Smartphone-Measured Vehicle Telemetry Data for Driver State Identification" Data 7, no. 12: 181. https://doi.org/10.3390/data7120181