
Invasion of Bythotrephes longimanus and Cercopagis pengoi in Lake Champlain: Impacts on the Native Zooplankton Community

Lake Champlain Research Institute, SUNY Plattsburgh, Plattsburgh, NY 12901, USA
*
Author to whom correspondence should be addressed.
Diversity 2023, 15(11), 1112; https://doi.org/10.3390/d15111112
Submission received: 15 September 2023
/
Revised: 17 October 2023
/
Accepted: 19 October 2023
/
Published: 25 October 2023
(This article belongs to the Special Issue Advances in the Diversity and Ecology of Zooplankton)
Abstract
:The zooplankton community of Lake Champlain has been altered over the past decade due to the introduction of two predatory zooplankton species. Bythotrephes longimanus Leydig, 1860 was first detected in Lake Champlain in August 2014, and Cercopagis pengoi (Ostroumov, 1891) was detected in August 2018. Monitoring for both invasive species at 15 lake sites using whole water tow sampling has been ongoing since 2010 with no detection of either species until 2014. Utilizing data from the Lake Champlain long-term monitoring program, we assessed pre- and post-invasion population dynamics of both invasive species on the native zooplankton community. Our results showed shifts in community structure following invasion, including a reduction in Diacyclops thomasi (Forbes, 1882) populations by both invaders and a reduction in Daphnia retrocurva Forbes, 1882 following the introduction of B. longimanus. Other cyclopoids, bosminids, and rotifers were also reduced, corresponding to both introduced species. The native large-bodied plankton predator Leptodora kindtii (Focke, 1844) appears to be unable to coexist with either invasive predatory cladoceran, displaying seasonal partitioning between L. kindtii and the Cercopagidae. These findings suggest that the invasion of both large predators in Lake Champlain have impacted pelagic zooplankton community structure.
1. Introduction
The introduction of invasive species to North America has led to the alteration of ecosystems and great economic damage [1]. A vast number of invasive species have made their way to the Great Lakes through accidental introduction from vessel ballast water, fish stocking, and recreational fishing or boating [2]. The impact that invasive species have on ecosystem functioning and their invasion to nearby lake systems gives reason for concern of their arrival and the alteration of Lake Champlain. A number of these species that have entered the Great Lakes have already migrated to Lake Champlain most likely via the Champlain Canal. These invasive species have caused lasting alterations to Lake Champlain’s planktonic community [3]. The most notable invasive species into Lake Champlain was Dreissena polymorpha, which impacted the planktonic food web and resulted in a major decline in rotifers throughout the lake following its invasion in the early 1990s [4,5].
Lake Champlain is among the largest lakes in the United States after the Great Lakes and is an important limnological system in the region. Zooplankton monitoring in Lake Champlain has been conducted since the early 1990s and has been ongoing to the present day, resulting in extensive historical data. This wealth of historical data aids greatly in determining the significance of disturbances, which may impact Lake Champlain’s zooplankton community structure. In the past decade, two invasive predatory zooplankton species, B. longimanus and C. pengoi, have invaded Lake Champlain, both of which have a history of altering the native zooplankton community structure [6,7].
Bythotrephes longimanus (spiny water flea) and C. pengoi (fishhook water flea) are large generalist planktivorous cladocerans [6,8,9] that originated from the waterbodies of the Palearctic region and the Ponto-Caspian region, respectively [10,11]. Both species are visual predators [11,12]. B. longimanus preferentially seeks large bodied prey, such as cladocerans [12], while C. pengoi is less selective and consumes smaller organisms [13]. These predatory cladocerans are typically found within the epilimnion and upper metalimnion of invaded lakes [14,15], though C. pengoi is more restricted to the epilimnion than B. longimanus [16,17]. The first report of B. longimanus in the Adirondack region was at Sacandaga Lake in upstate New York in 2008 [18]. Subsequently B. longimanus was detected in the Champlain Canal system (2010) and Lake George in 2012 [18], prior to the detection of a small population in Lake Champlain in August 2014. Bythotrephes longimanus was detected throughout Lake Champlain in very high densities by September 2014, and levels continued increasing through the following year. Cercopagis pengoi was first detected in Lake Champlain 2018 but unlike B. longimanus was not previously reported in any adjacent waterbodies.
Potential Impact of the Cercopagidae Invasion
The invasion of C. pengoi and B. longimanus to North American lakes typically results in a shift in the zooplankton community composition of these water bodies [19,20,21,22]. Both Cercopagidae cause severe density reductions to many key zooplankton species through the summer months when the Cercopagidae are at peak abundance [19,21,22]. Cercopagis pengoi typically reaches peak density in July and August in the Great Lakes region [23], and B. longimanus typically reaches peak density during July to September, varying depending on the lake [24]. Species that are at high abundance during these months are likely to have reduced peak abundance after either invasion.
Daphnia retrocurva is the dominant daphniid in Lake Champlain [4] and is known to decline in abundance in Cercopagidae-invaded lakes [15,25]. Although D. retrocurva density is reduced by C. pengoi in invaded lakes [25] and D. retrocurva shares a similar vertical distribution to C. pengoi, its large adult body size makes it difficult to process during feeding for C. pengoi [6], which reduces its vulnerability as D. retrocurva mature. Bythotrephes longimanus on the other hand is a significant predator of D. retrocurva; its large body size and slow swimming speed makes D. retrocurva highly susceptible to predation throughout its entire lifespan [26]. The second most abundant large-bodied daphniid of Lake Champlain Daphnia mendotae (Birge, 1918) [4] may increase in density after B. longimanus invasion. The fast escape response of D. mendotae decreases the likelihood of capture by B. longimanus, and predation on other slower daphnids by B. longimanus reduces the competitors of D. mendotae [26]. Based on studies in the Great Lakes and the Baltic Sea, the presence of C. pengoi leads to a decrease in small-bodied zooplankton biomass, such as Bosmina longirostris (Muler, 1776) and Ceriodaphnia spp. [9,16]. B. longimanus may indirectly increase the population of Bosmina longirostris after it establishes a population, as found in Lake Michigan in the years during its initial detection [27].
Diacyclops thomasi, the most abundant copepod in Lake Champlain [4], has decreased in abundance following C. pengoi invasions in other freshwater systems either through direct predation or competition with C. pengoi for prey [12,21]. D. thomasi seasonal density dynamics are less commonly impacted by B. longimanus along with most other copepods [7,19]. The other two common cyclopoids of Lake Champlain, Tropocyclops prasinus mexicanus Kiefer, 1938 and Mesocyclops edax (Forbes, 1890), are epilimnetic species like D. thomasi [28]. Since both Cercopagidae are predominantly found in the epilimnion, all three cyclopoids are at risk of population density decline by Cercopagidae predation. One of the highest impacted groups in Lake Michigan and Ontario were cyclopoid copepods during high C. pengoi density years [22,29].
Cercopagis pengoi is known to prey heavily on rotifers, especially when in early instars [30]. Smaller bodied rotifers, such as Kellicottia spp. and Conochilus spp., increased in dominance, whereas large rotifers, such as Asplanchna spp., decreased after C. pengoi introduction in Lake Ontario in the late 1990s [21,31]. Conochilus spp., Keratella spp., and Polyarthra spp. may benefit from high B. longimanus density as total rotifer density increased in many Canadian Shield lakes during high B. longimanus density [32]. Bythotrephes longimanus may increase Conochilus spp. density through the suppression of Leptodora kindtii, a major predator of Conochilus spp. [27].
The invasive Cercopagidae and native L. kindtii are generalist predators with overlapping prey size and species preferences, making their coexistence unlikely [33,34]. In Lakes Huron and Michigan, the invasion of B. longimanus coincided with the drastic reduction in native L. kindtii [34,35], and B. longimanus are found to prey upon L. kindtii directly [36]. Leptodora kindtii is unable to prey upon B. longimanus due to its size-limited capturing appendages, while B. longimanus are capable of capturing and processing L. kindtii [36]. The smaller body size of C. pengoi in comparison to the other two predators renders it unable to prey on mature adult L. kindtii and B. longimanus [33]; however, C. pengoi is thought to have caused a decline in L. kindtii through competition in Lake Ontario [6,37]. In addition, L. kindtii is unable to effectively prey on C. pengoi due to its size-limited capturing appendages [12]. There is evidence that B. longimanus controls C. pengoi population and distribution in the Great Lakes [17]. Thus, years where both species are abundant could see an increase in B. longimanus abundance, while C. pengoi decreases.
This study was conducted to document the invasion dynamics of C. pengoi and B. longimanus and determine changes in the zooplankton community composition of Lake Champlain. We hypothesized that B. longimanus would reduce the abundance of large-bodied and slow-swimming species, while C. pengoi would reduce the abundance of small-bodied species. We also hypothesized that L. kindtii may exhibit spatial and temporal partitioning with the Cercopagidae after each invasion.
2. Materials and Methods
2.1. Zooplankton Community Sampling
Zooplankton samples were collected by the Lake Champlain Monitoring Program (LTMP) using vertical whole water column net tows [38]. Vertical whole water column tows were conducted biweekly during the growing season (May–October). Whole water net tows were taken at midday 1 m from the lake bottom once per date sampled. The time range of the samples used for the present analysis spanned from 2013 to 2019. Samples prior to 2013 were excluded from analysis due to the extreme flooding event that occurred in 2011, which severely altered the zooplankton community during that year and the year following [39]. Samples were generated through the entire field season (May–October) with two samples taken at each station bimonthly, early month (between 1st and 15th) and late month (after 15th) to allow for analysis of seasonal patterns. Zooplankton samples were taken using a zooplankton vertical tow net that was 30 cm in diameter with 153 um mesh net and retrieved at a rate of 0.5 m per second. The samples were condensed into 125 mL bottles and preserved with 5% formalin-Rose Bengal solution. No correction for net efficiency was used. Subsamples were taken from the 125 mL bottle using a Hensen Stempel pipette measured at 1 mL and viewed using Leica inverted microscopes. Contents of subsamples were counted until the entire slide sample was investigated or until a minimum of 100 total individuals were counted through multiple subsamples. Zooplankton species were identified using A Revised Key to the Zooplankton of Lake Champlain [40].
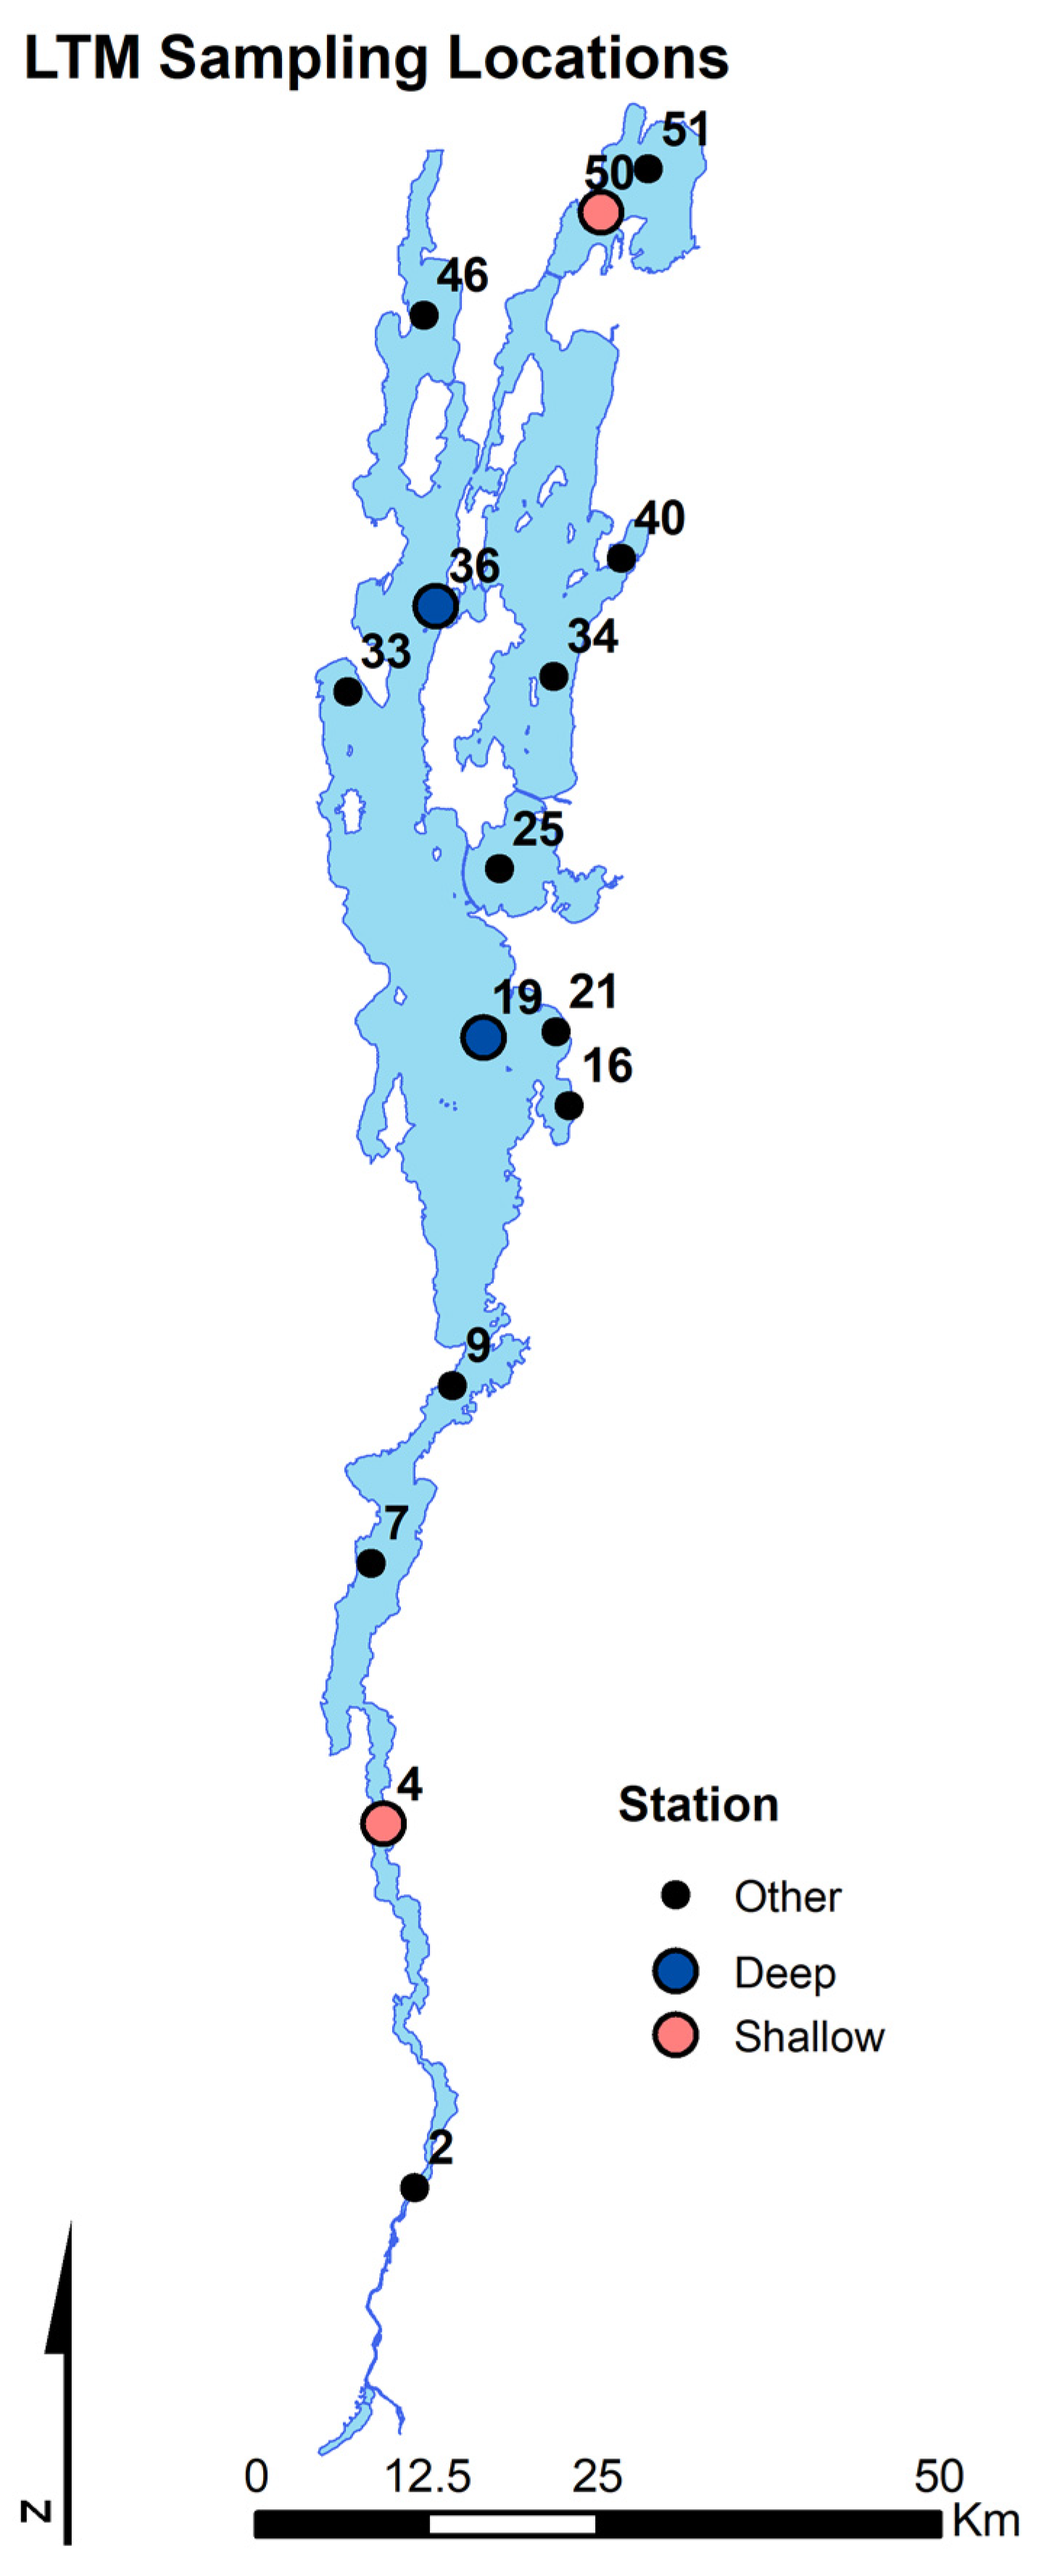
Samples utilized in this study to produce data were collected from 4 LTMP monitoring stations two shallow locations (stations 4 at 10 m and 50 at 5 m) and two deep stratified locations (stations 19 at 99 m and 36 at 50 m) (Figure 1). These stations were chosen as their locations are central to major portions of the lake and are representative of the average environmental conditions to that region. Predatory cladoceran samples were taken at all 15 LTMP stations to determine predatory cladoceran density.
Bythotrephes longimanus and C. pengoi sampling was conducted in a similar manner to zooplankton composition sampling using a standard LTMP procedure. A 0.5 m diameter 250 μm mesh net was used to accommodate the large size of the predatory cladocerans and to prevent net avoidance during the tow. Samples were collected through whole water vertical tows retrieved at a rate of 1 m per second. Samples were preserved initially in a 5% formalin-Rose Bengal solution and later transferred to an 80% pure ethanol solution. The sampling of invasive B. longimanus and C. pengoi was conducted lakewide throughout the study period with no detection of either species in Lake Champlain prior to 2014. Entire samples were analyzed for B. longimanus and C. pengoi density using dissecting microscopes. All samples analyzed are archived for long-term storage at the Lake Champlain Research Institute.
2.2. Data Analysis
2.2.1. Ordination Analysis
In order to determine changes in community composition between pre- and post-invasion communities, multiple non-metric multidimensional scaling (NMDS) ordinations were conducted using relative abundance data calculated from the zooplankton density data. NMDS was chosen due to the highly variable nature of zooplankton populations. Differences between species populations and presence/absence in certain samples or stations do not impact the results of NMDS, which is ideal in the case of zooplankton population dynamics. Two ordinations were conducted using data from differing station depths, one using deep station (19 and 36) data and the using other shallow station (4 and 50) data. Ordinations were run in R Studio [41] using the ‘vegan’ package [42]. The metaMDS function of the vegan package was utilized with the index set to Bray-Curtis dissimilarity and 5 dimensions. NMDS were performed on datasets for deep/shallow groupings using portions of relative abundance data based on timespans. The BVSTEP procedure was used to determine the most influential genera to use for ordination [43]. The BIOENV procedure was utilized to further determine influential genera and the environmental variables with the most influence on the community [43]. The BIOENV procedure was performed using the ‘vegan’ package while BVSTEP were performed using the ‘sinkr’ package [44].
The most influential genera of each major zooplankton taxa (Cladocera, Copepoda, Rotifera) were chosen from the BIOENV procedure. A total of 18 plots were generated from the two ordinations to reduce visual clutter, 6 per major genera, 3 per deep and shallow stations ordinations. The 3 plots per deep/shallow stations category contain points based on the month range the sample was taken, and points were colored based on the specific month. Point size was based on the density of the influential genera found in the sample. The invasive Cercopagidae and Leptodora kindtii and any relevant environmental factors determined by the BIOENV procedure were plotted as environmental variables for each ordination.
2.2.2. Community Structure Analysis
To assess potential changes in community structure before and after invasion, the zooplankton abundance data were rank ordered for each individual sample across all study years. Ranks were then compared among the following categories: before (2013), after B. longimanus (2014–2015), and after C. pengoi (2018–2019) during July, August, and September for all stations. Ranked data were then used to run Kendall’s w coefficient of concordance to determine community rank order changes before and after invasion.
3. Results
3.1. Invasion Dynamics in Lake Champlain
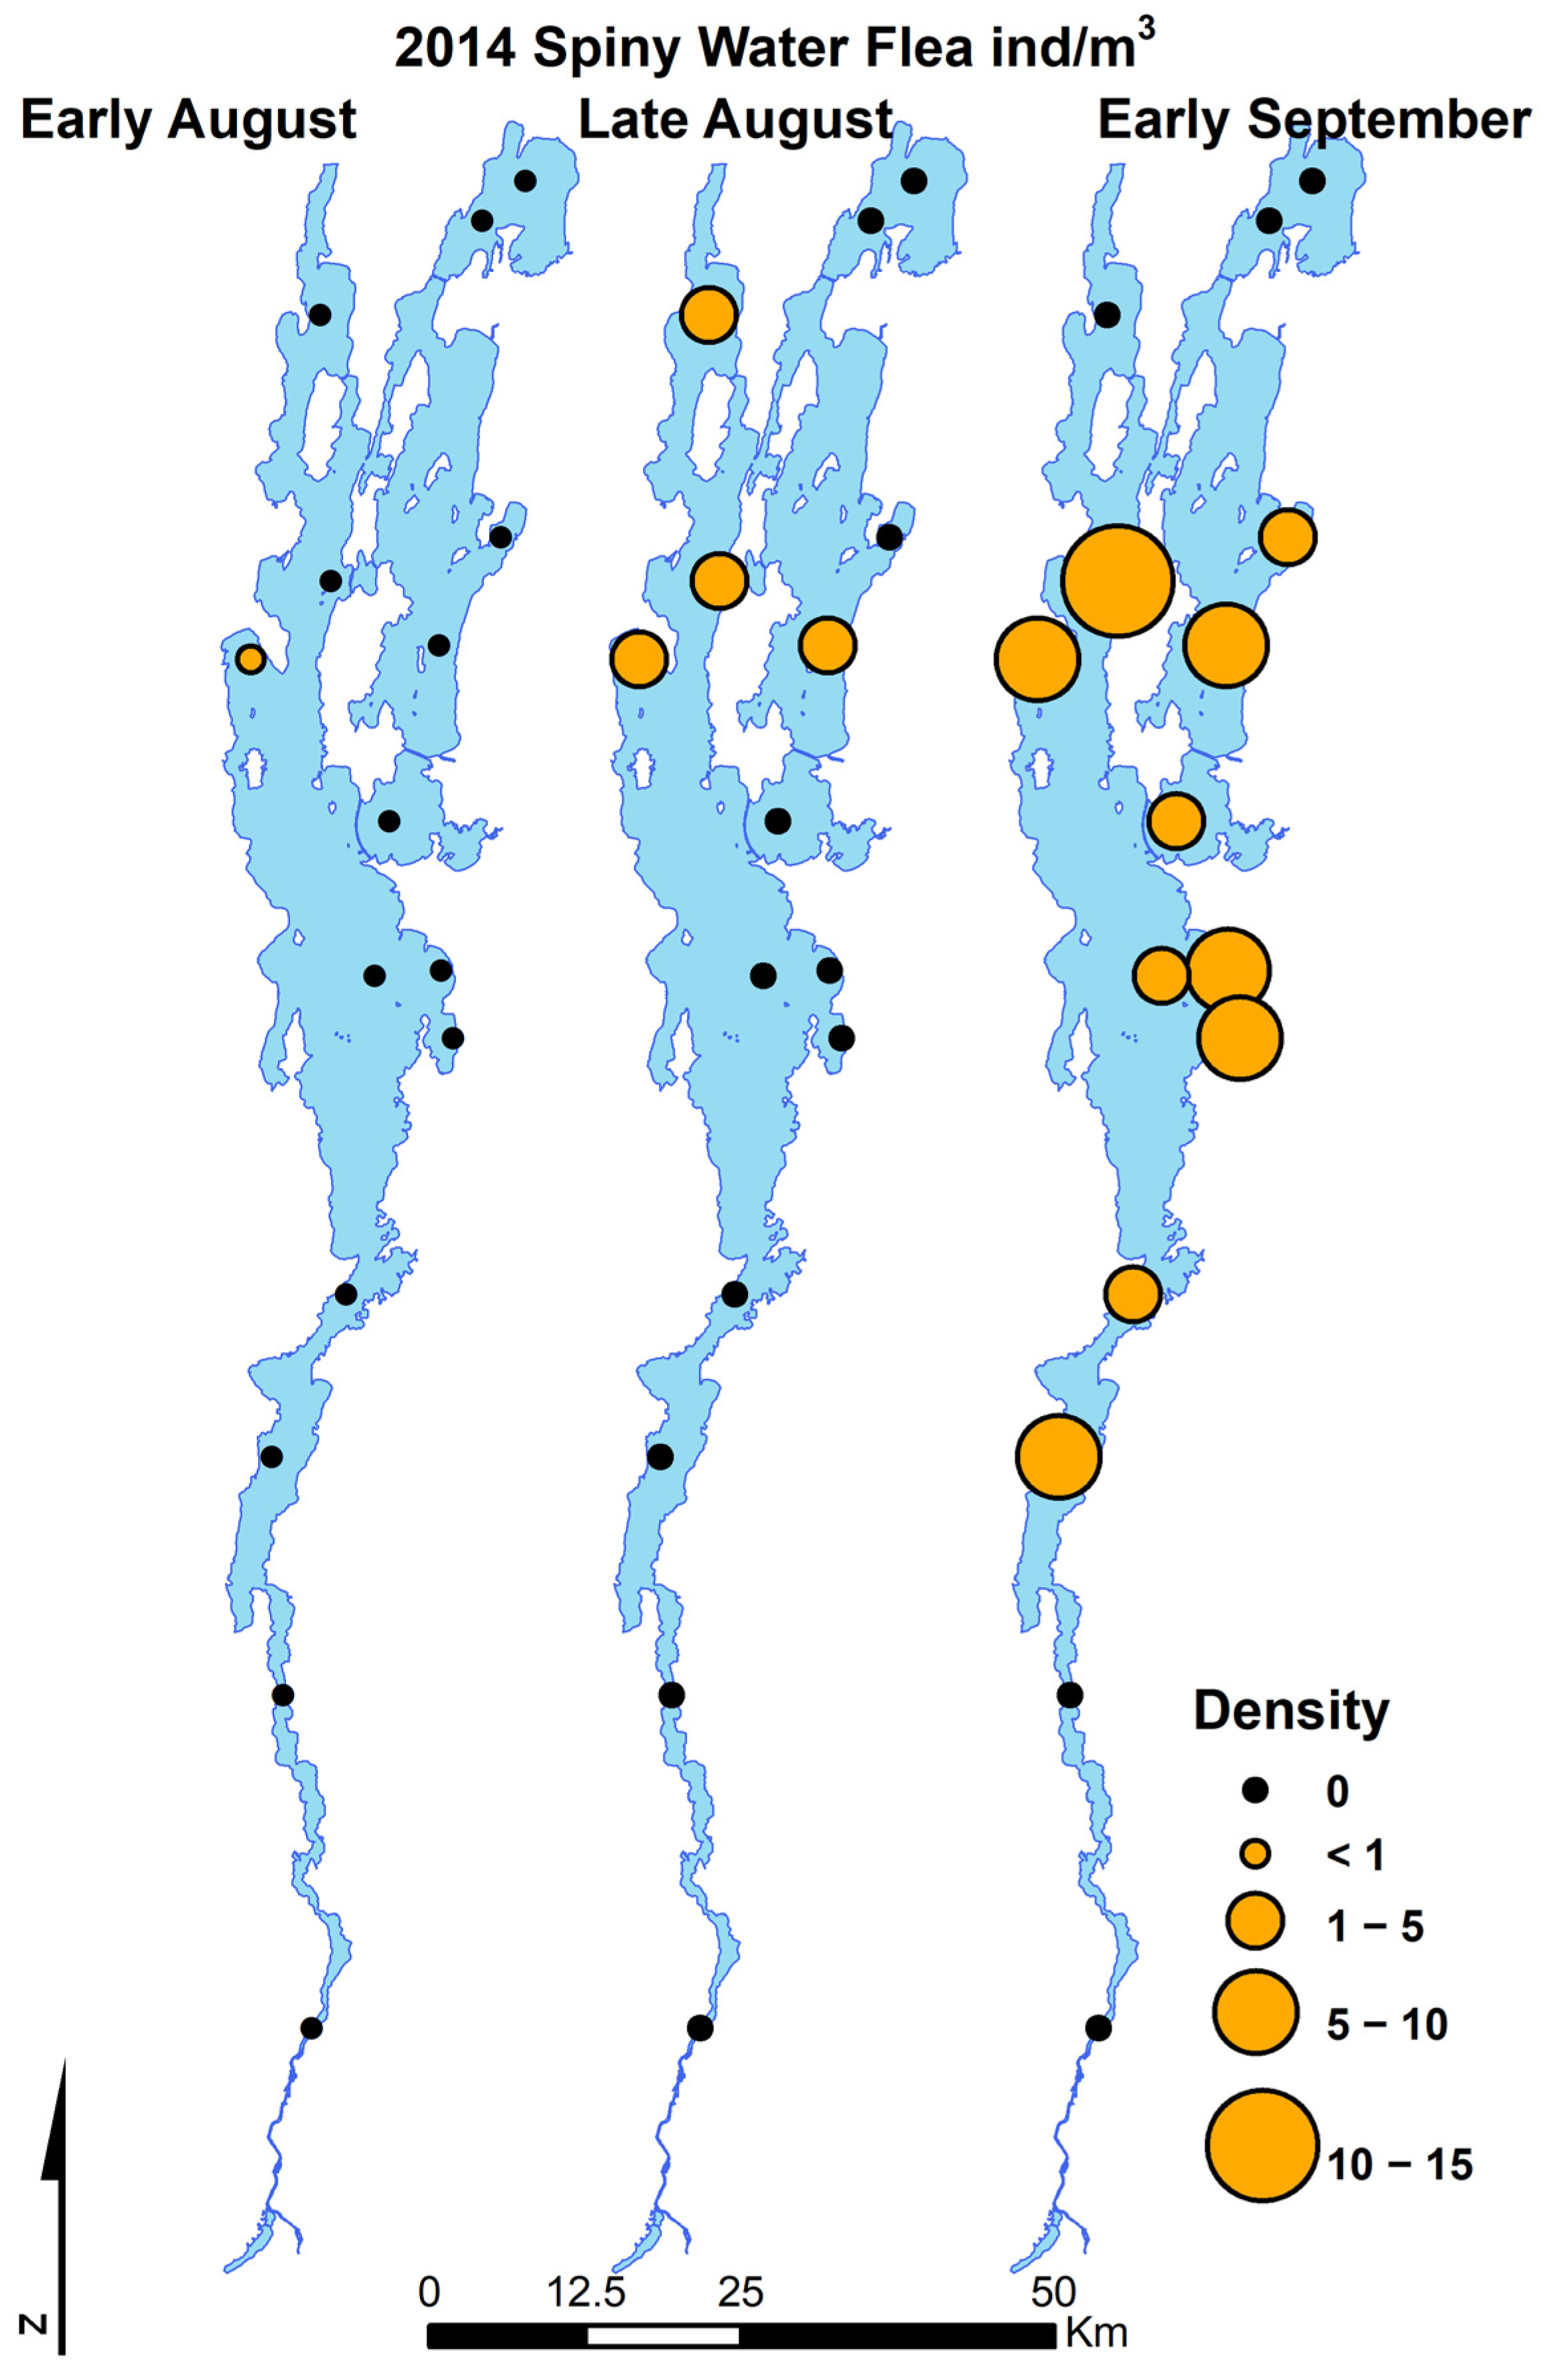
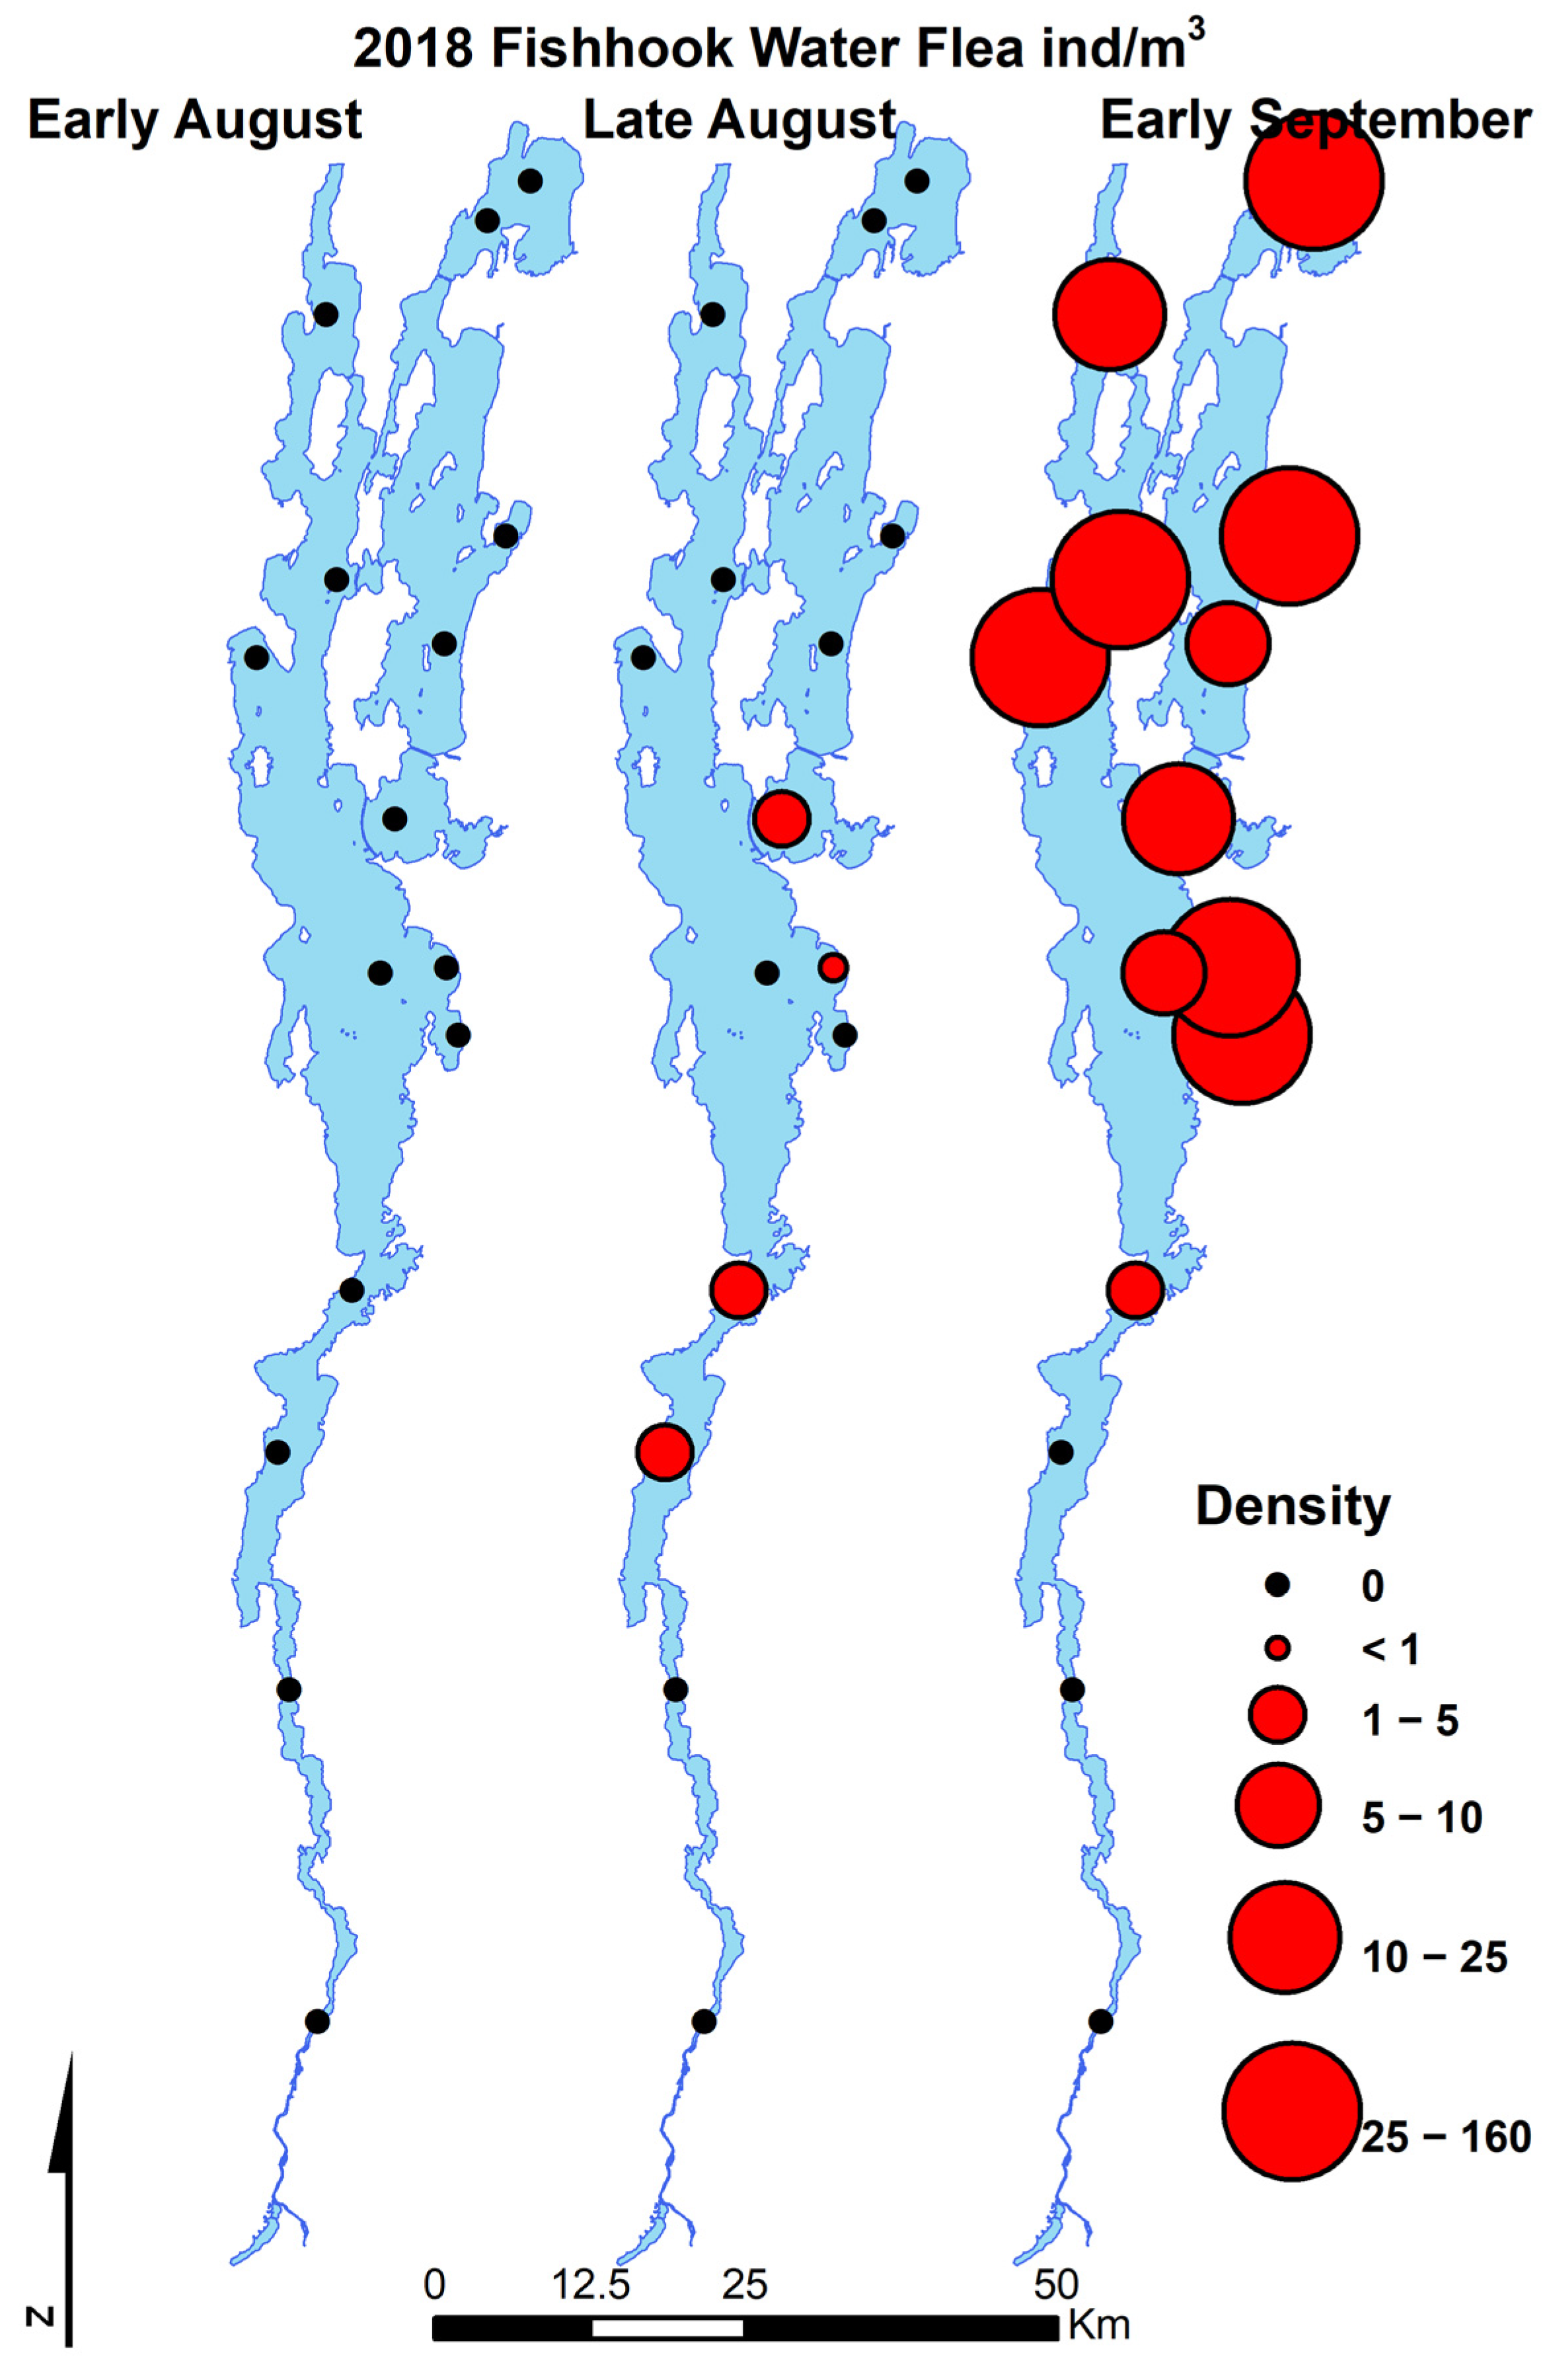
Bythotrephes longimanus was first detected in Lake Champlain in early August 2014, and Cercopagis pengoi was first detected in Lake Champlain monitoring in late August 2018 (Figure 2 and Figure 3). Neither species was detected in any of the Lake Champlain samples at any monitoring sites lakewide prior to 2014 (B. longimanus) or 2018 (C. pengoi) despite extensive sampling efforts. Bythotrephes longimanus was first detected at low abundance at station 2 (Figure 1) in the southern lake in August 2014. The data collected from net tows illustrate a rapid population expansion from that initial detection throughout most of Lake Champlain to relatively high abundances (>5 per m2) lakewide by September–October 2014 (Figure 2). Cercopagis pengoi was first detected in samples used for Lake Champlain monitoring in late August at several main lake locations and also exhibited a rapid expansion of populations lakewide within several weeks (Figure 3). Both Cercopagid invaders appear to have spread lakewide very quickly upon initial detection.
Bythotrephes longimanus was detected again in mid-late summer 2015 at relatively high abundance. This was followed by a decline in abundance lakewide in 2016 and subsequent years with no detection at most stations in 2017 and 2018. The population of C. pengoi showed a similar invasion dynamic with rapid expansion from a small initial population in August 2018 (Figure 3). C. pengoi was abundant from August until October in Lake Champlain in 2019 and has remained at high abundance through 2022 (personal observation).
3.2. Response of Large Bodied Native L. kindtii
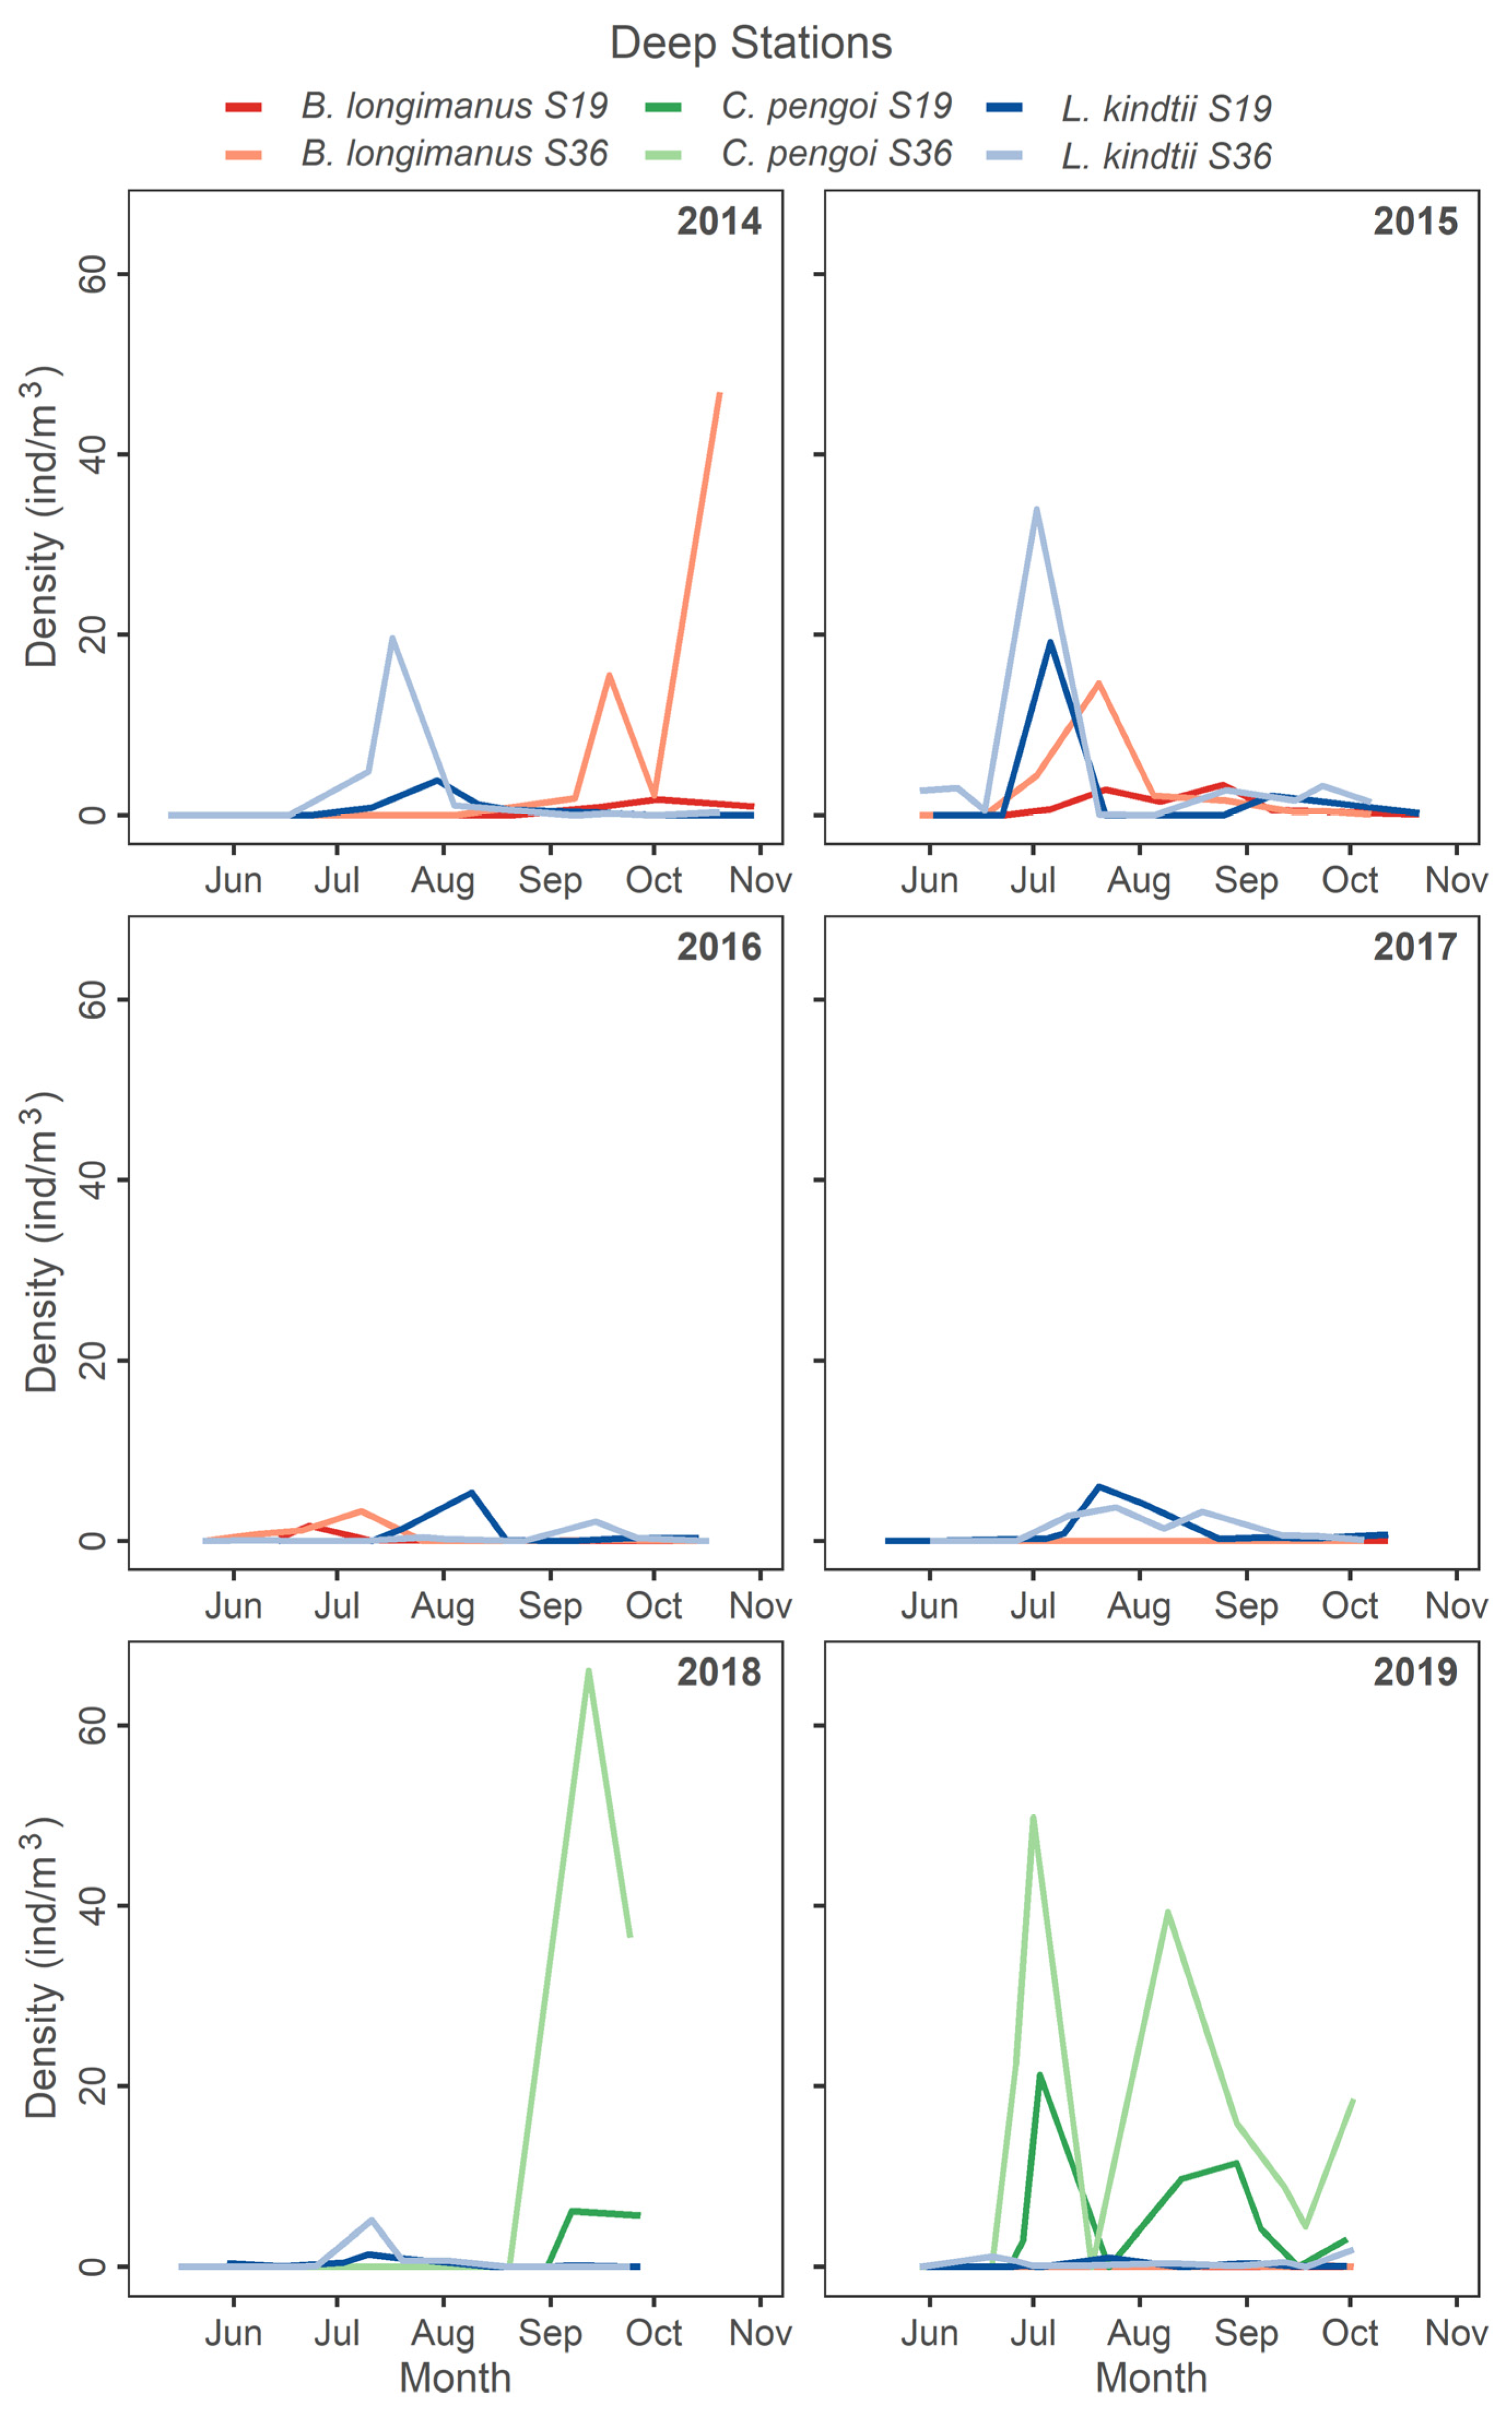
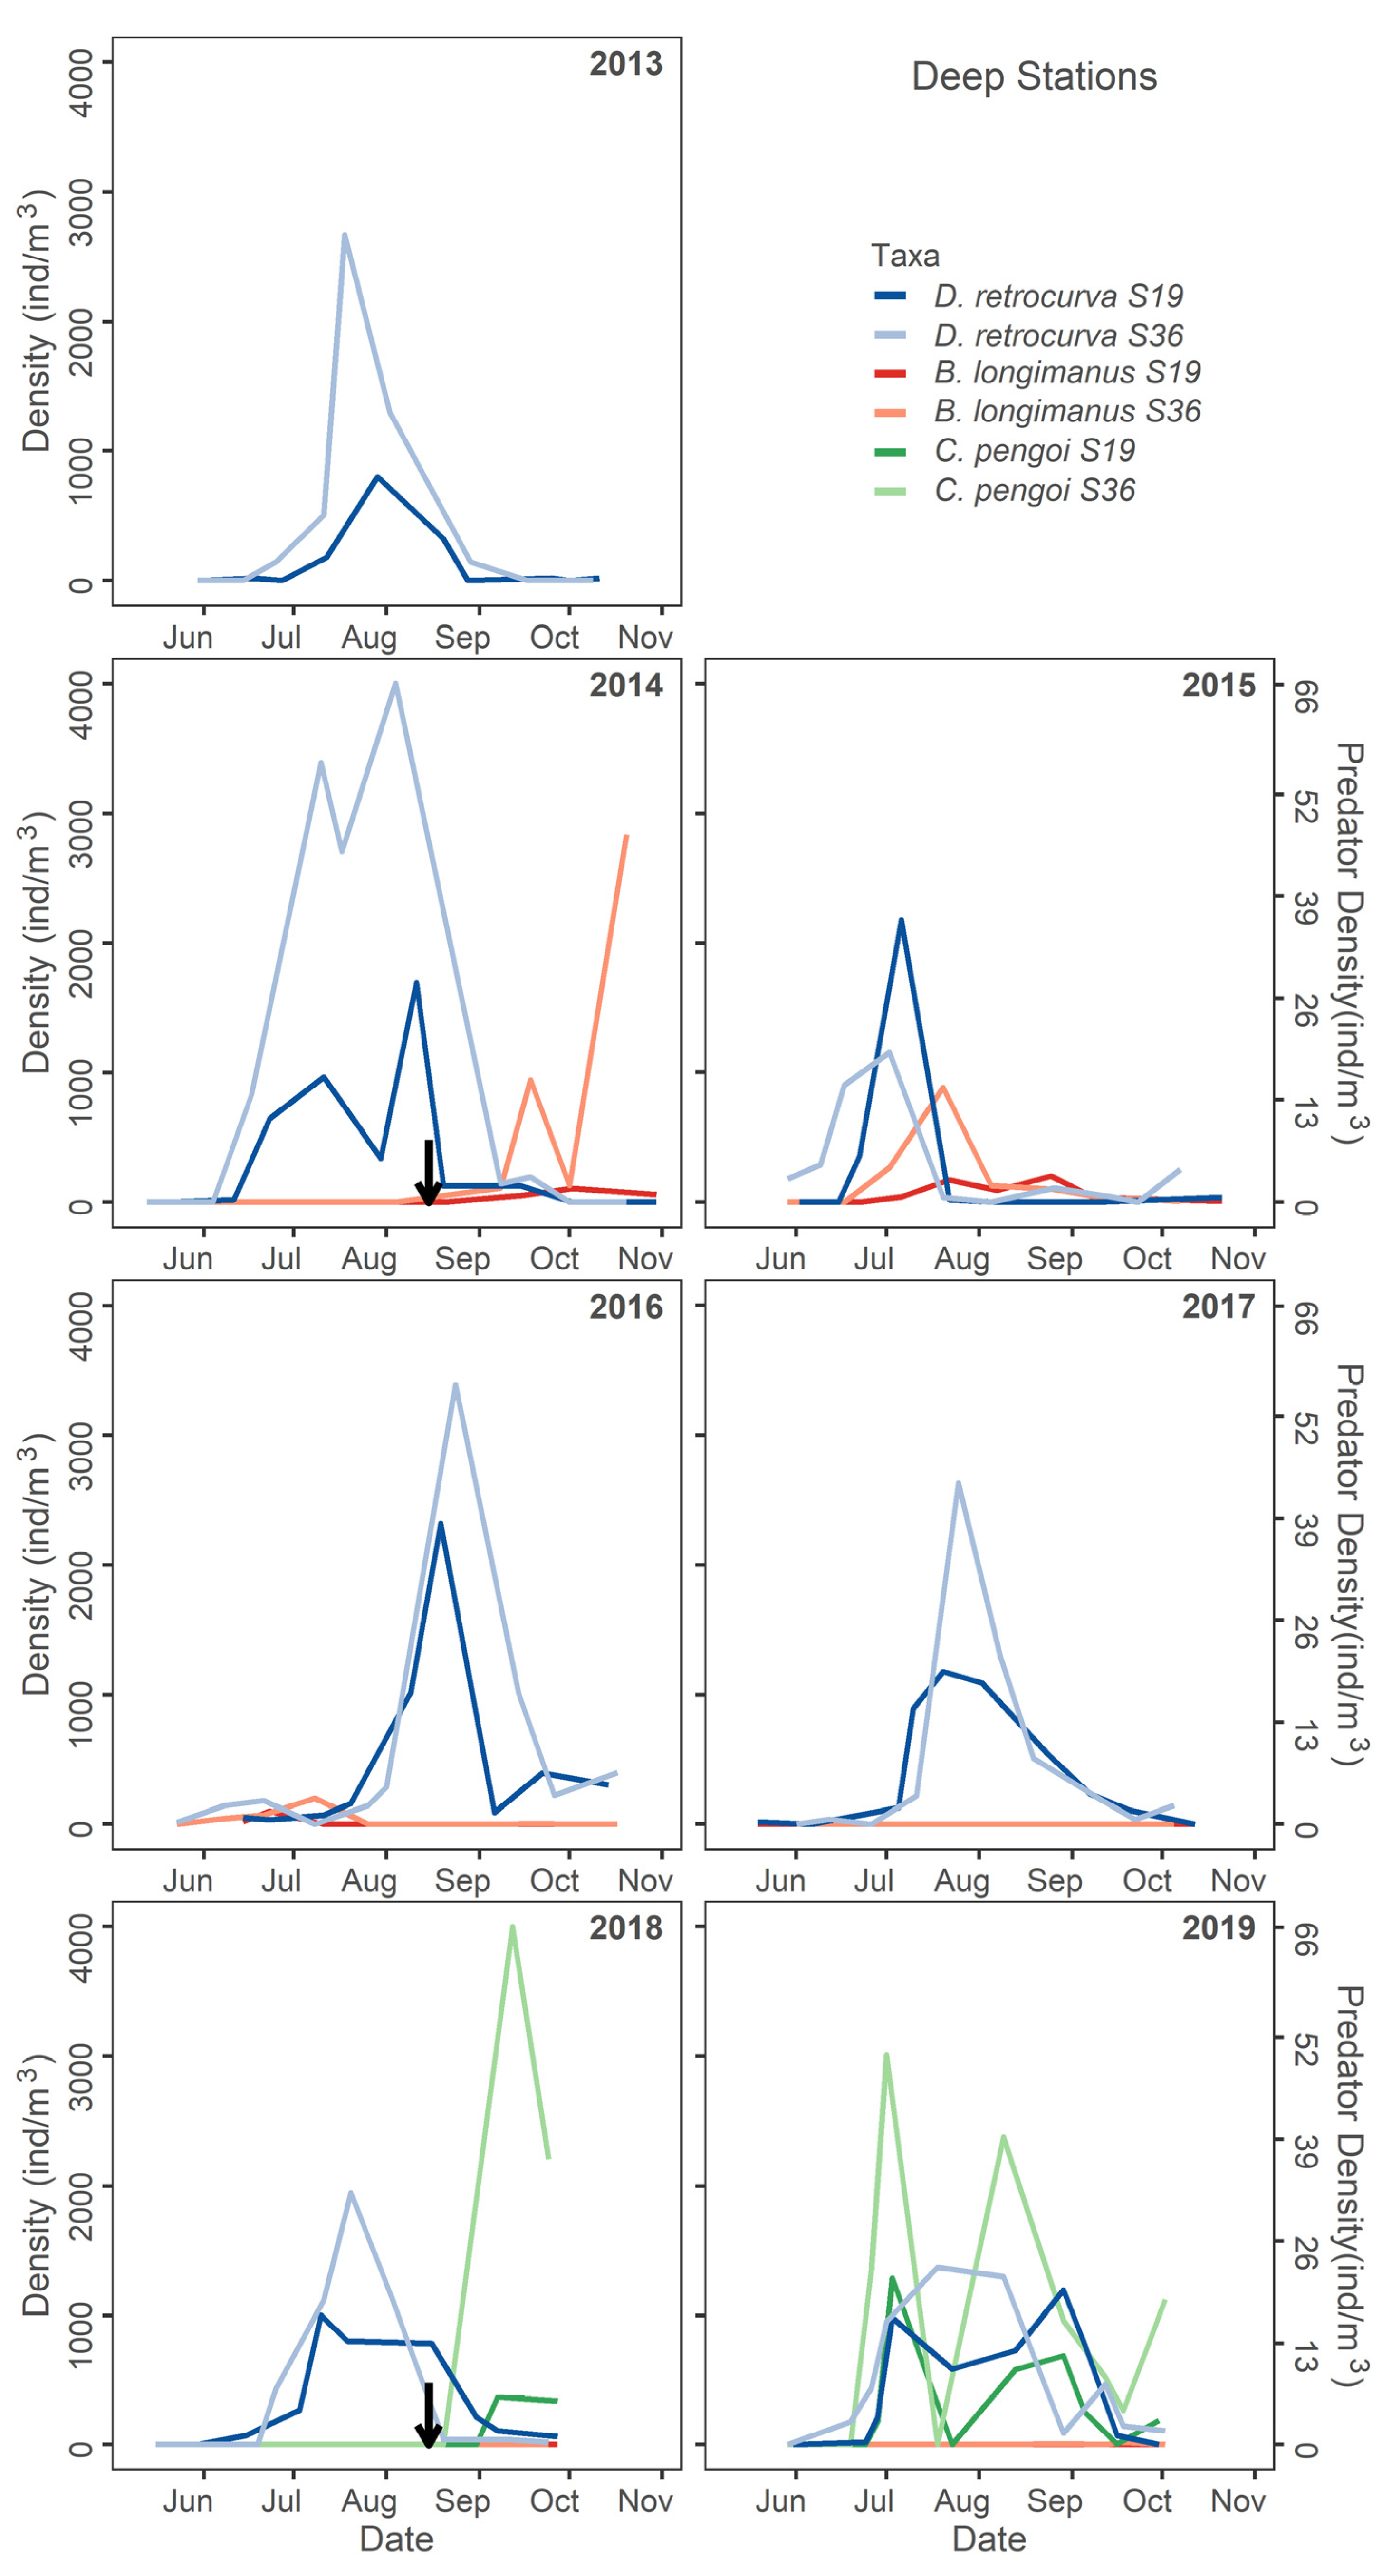
At deep stations during the post-2014 B. longimanus detection period, L. kindtii was typically found at peak seasonal abundance in July (Figure 4). Bythotrephes longimanus peaked in October in 2014 and late July 2015, while L. kindtii peaked in early July and declined later in the season as B. longimanus increased (Figure 4). In 2016 and 2017 L. kindtii was found at lower density but peaked later in the season in the absence of B. longimanus. In 2018 and 2019, which represent years where C. pengoi was in high density, L. kindtii was found at low densities (Figure 4). Cercopagis pengoi peaked in October 2018 and was abundant, while L. kindtii density was low during the entire season in 2019 when C. pengoi was abundant (Figure 4).
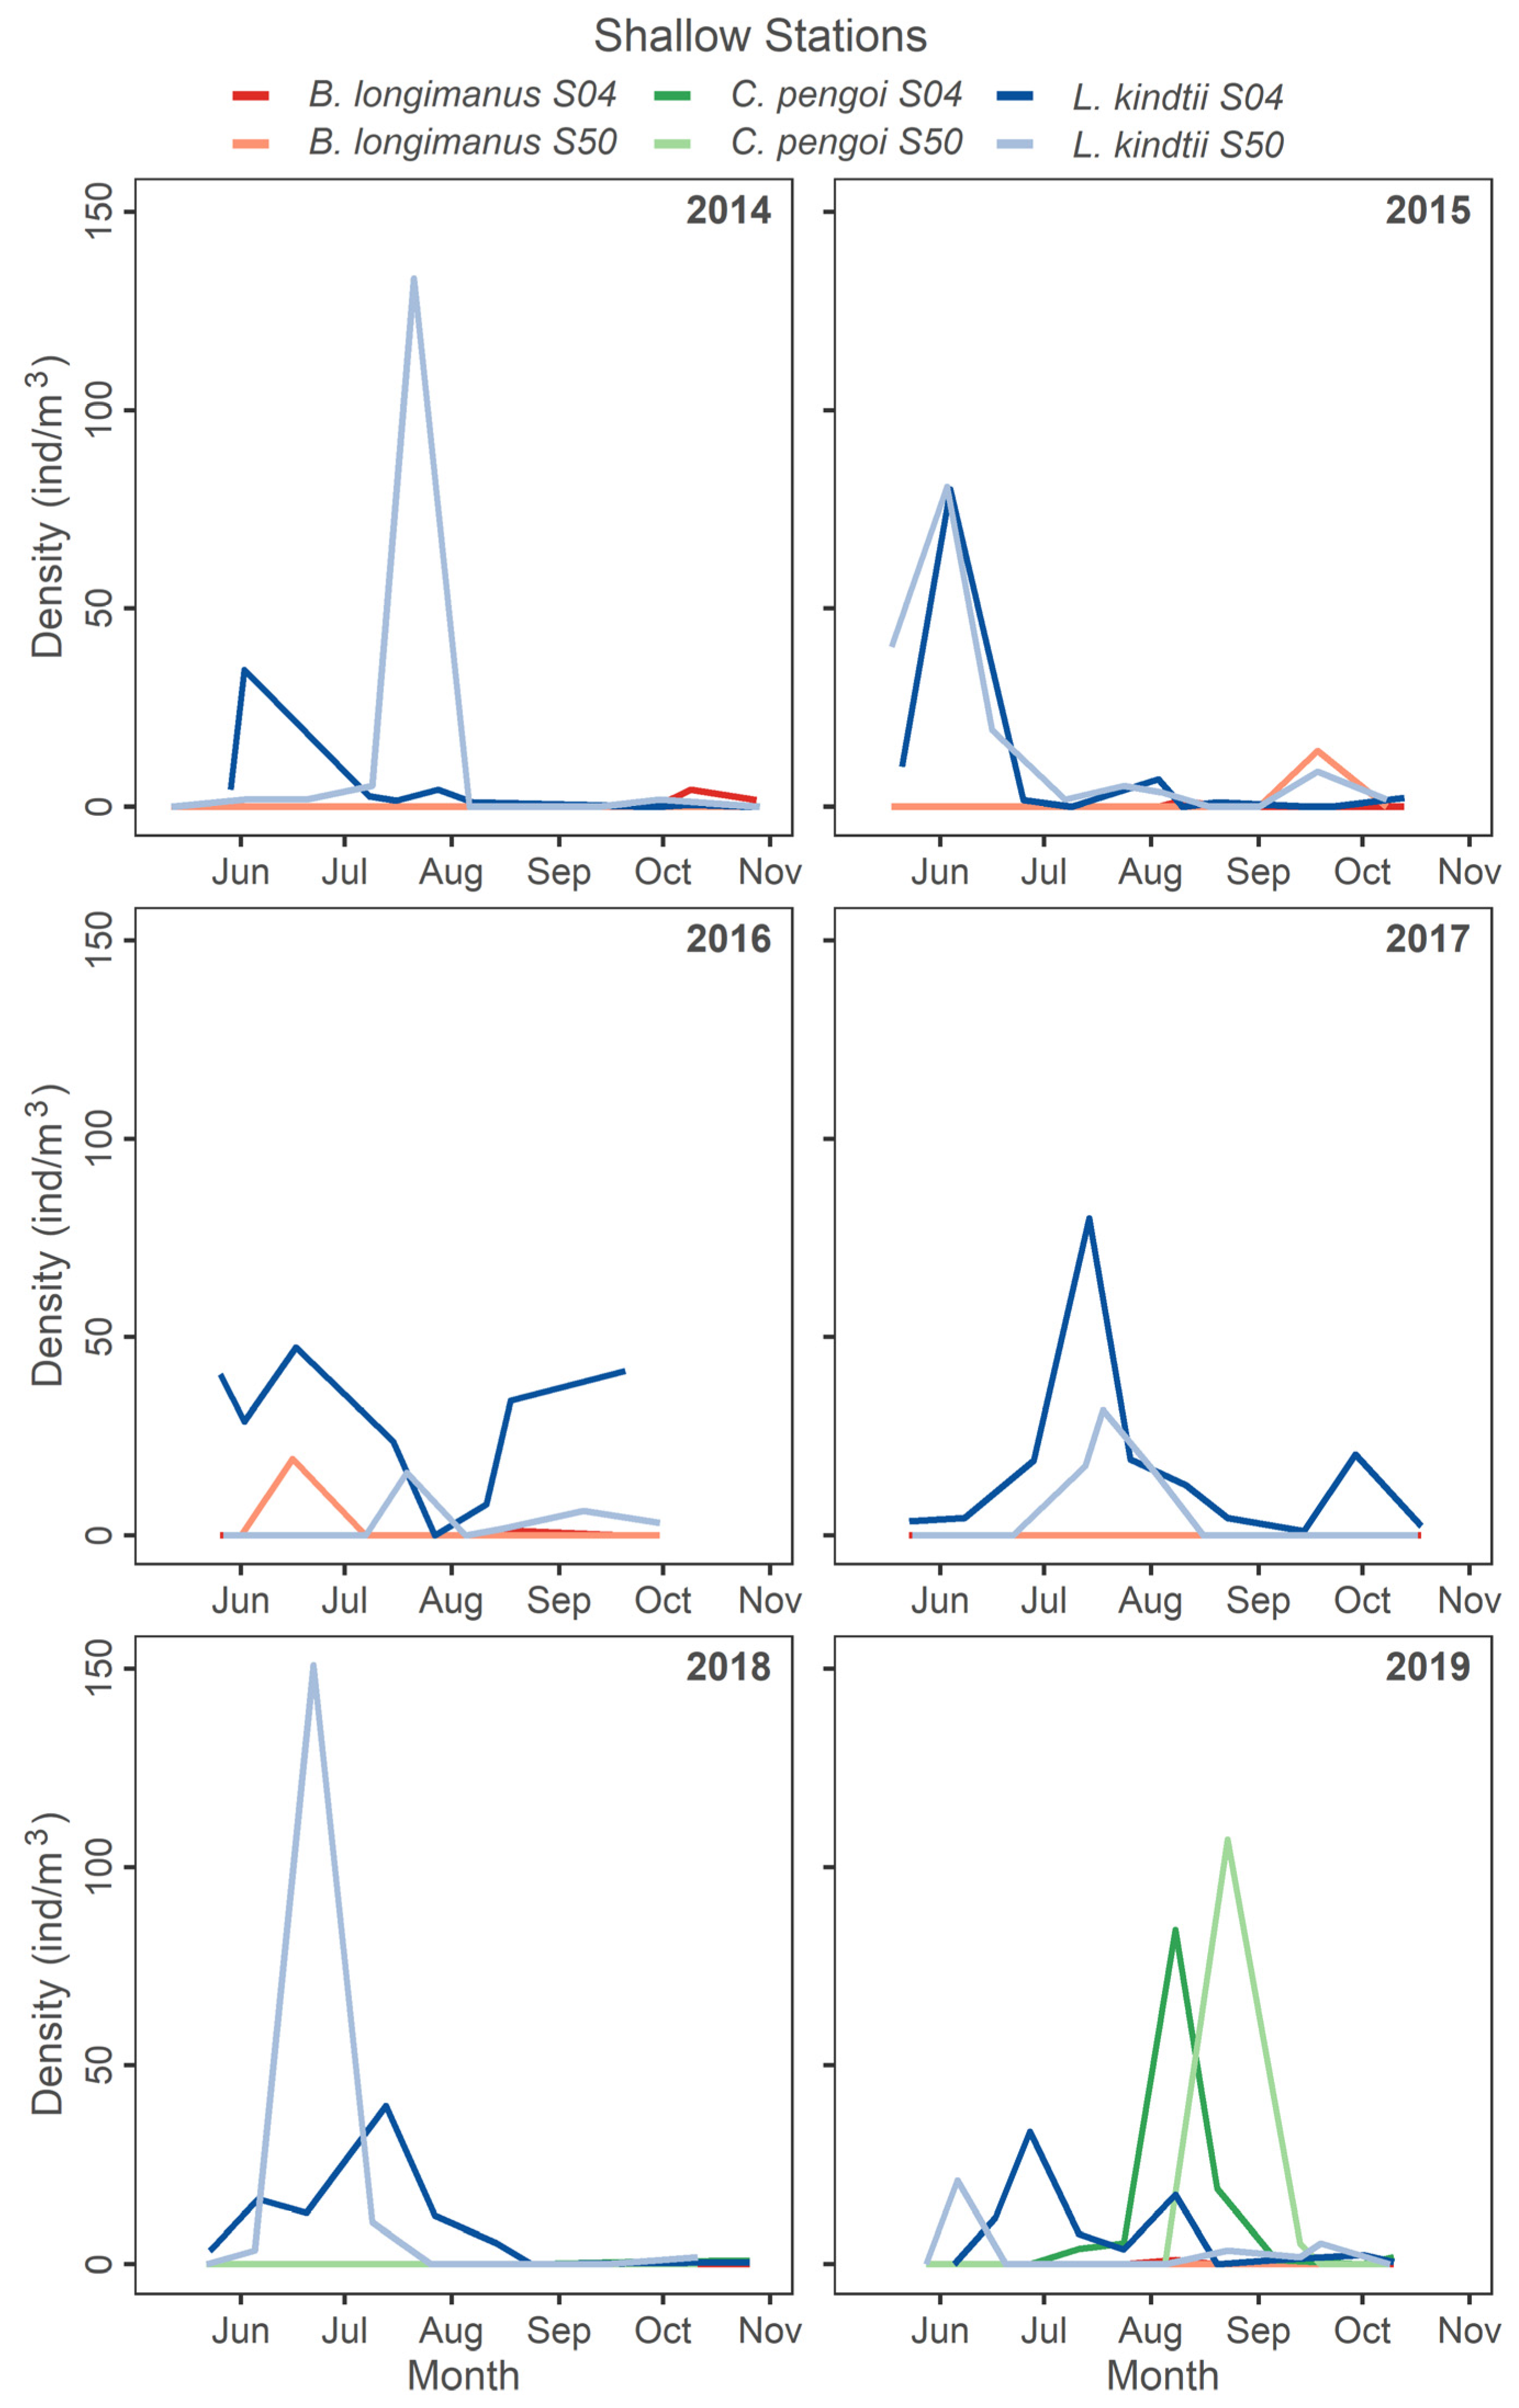
At shallow stations, L. kindtii peaked in abundance in June and July with some variability in timing for all years (Figure 5). Bythotrephes longimanus was noted at low density in October 2014, present during late September 2015, and peaked in June 2016 (Figure 5). Post C. pengoi detection, L. kindtii peaked during June and July for both years (Figure 5). In 2019, C. pengoi was far more abundant than the year prior and peaked in August and September (Figure 5). In general, the population of L. kindtii was found at a low density in Lake Champlain when either Cercopagidae invader was at high density.
3.3. Zooplankton Abundance Patterns Following Invasion
Zooplankton seasonal population dynamics differed between pre- and post-Cercopagidae detection. At both deep and shallow stations, an overall decrease in density occurred for all major zooplankton species following invasion of both Cercopagidae. This change was more pronounced in deep stations; thus, results are presented herein for deep lake stations in response to Cercopagidae invasion (Figure 6, Figure 7 and Figure 8).
The seasonality of peak abundance of the most dominant cladoceran, Daphnia retrocurva, was most notably altered in 2015 as it shifted from the beginning of August prior to the invasion of B. longimanus to early July following the invasion (Figure 6). Daphnia retrocurva peaked earlier in 2015 and then decreased in abundance during the summer peak of B. longimanus at deep stations (Figure 6). Minimal changes in the seasonal dynamics of D. retrocurva were observed during the C. pengoi invasion in 2018–2019 (Figure 6).
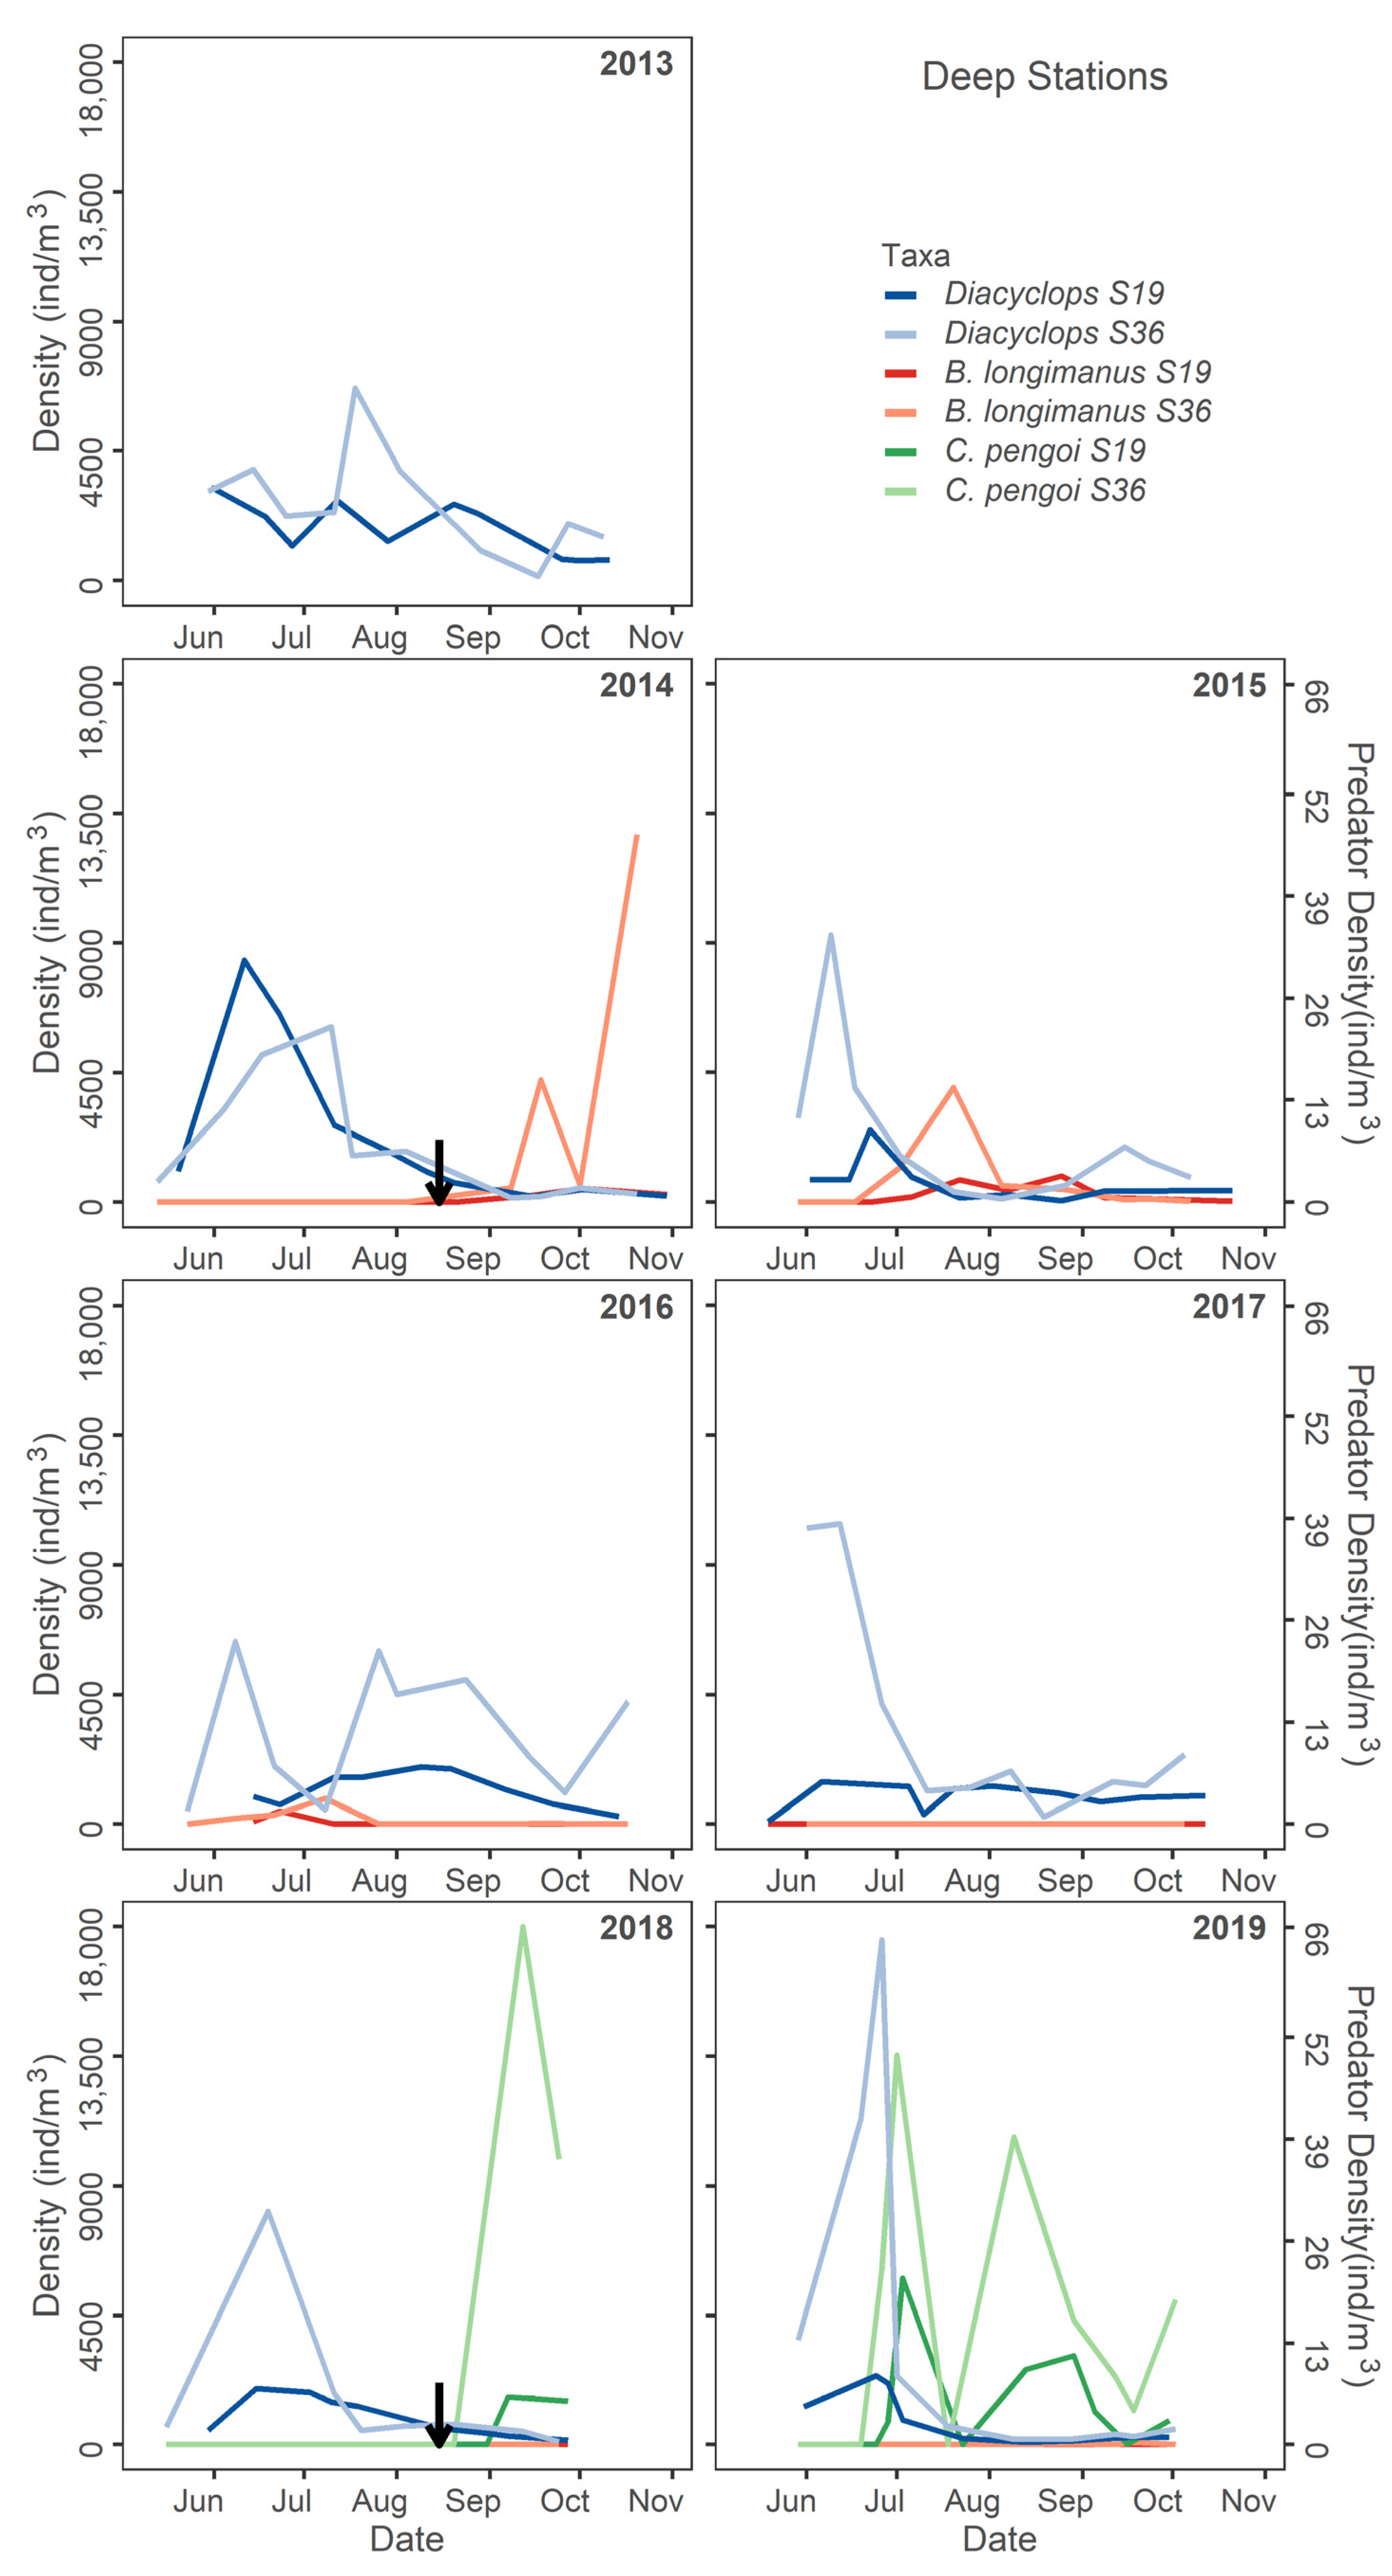
The most apparent alteration in seasonal population dynamics amongst the copepods was observed at deep stations for D. thomasi, with low abundance occurring during seasonal periods of high density for either Cercopagid (Figure 7). Diacyclops thomasi declined during high Cercopagidae density in 2015 and 2019, the years after B. longimanus (2015) and C. pengoi (2019) were detected in Lake Champlain (Figure 7). During years of high Cercopagidae abundance, D. thomasi abundance peaked early in the season and then declined in July (with the onset of peak Cercopagidae summer populations). However, during years with low Cercopagidae abundance (2013, 2016,2017) D. thomasi peak abundance shifted later into the season (Figure 7). There was little discernable change to the D. thomasi seasonal population trends during periods of high Cercopagidae abundance at shallow stations.
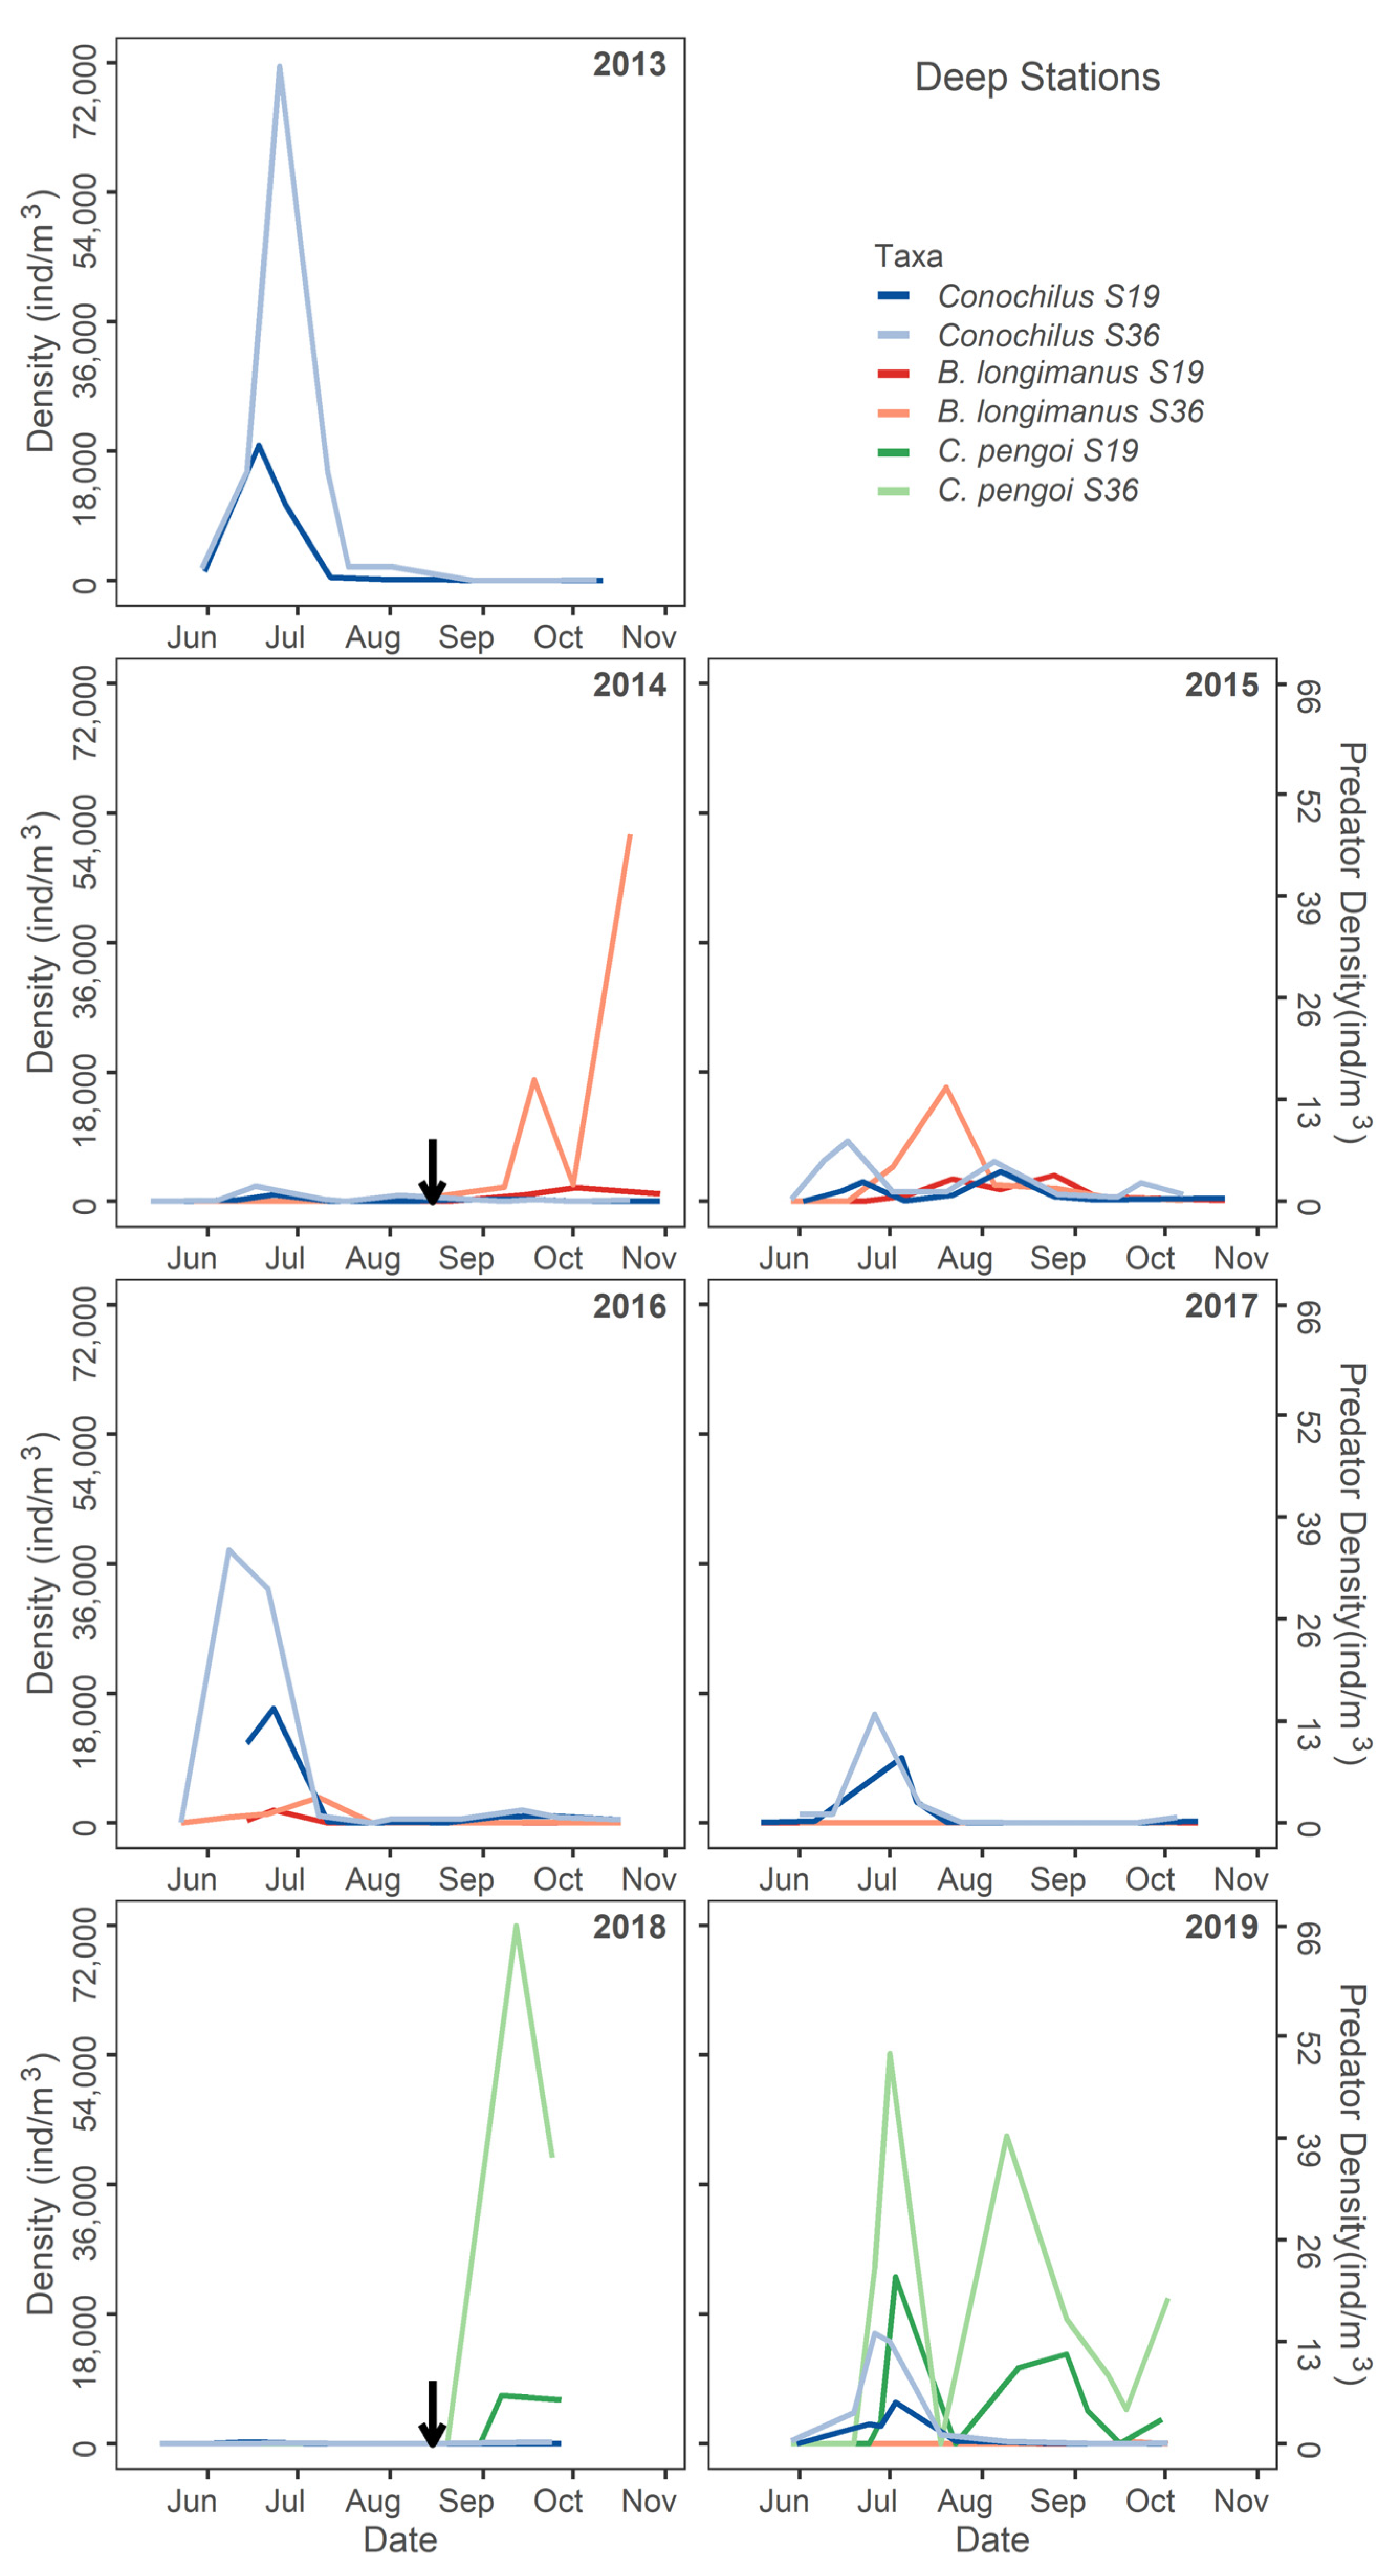
The seasonal dynamics of the predominant rotifer in Lake Champlain, Conochilus spp., showed little response to the B. longimanus invasion (Figure 8). The abundance of Conochilus spp. was somewhat lower throughout the season during the initial detection years of both predators (Figure 8). During 2019, Conochilus spp. density declined when C. pengoi densities increased seasonally in both deep and shallow sites (Figure 8).
3.4. Zooplankton Community Structure Following Invasion
A summary of community structure patterns from Kendall’s w coefficient of concordance appears in Table 1. Results indicate that zooplankton community structure (rank order of species abundance) differed between pre- (2013) and post-B. longimanus invasion samples in August and September and between pre- and post-C. pengoi invasion samples in August and September. This illustrates a shift in community composition associated with both invasions.
Community structure change was more prevalent after the C. pengoi invasion than the documented changes following the invasion of B. longimanus (Table 1). This may be attributed to the shift in rank of T. prasinus mexicanus, which decreased rank at all stations in 2018–2019 following the C. pengoi invasion. Other species that shifted (>5) in rank following C. pengoi invasion are D. retrocurva, which declined in community rank at deep stations; Eubosmina coregoni (Baird, 1857); and Asplanchna spp., which declined at shallow stations. Rank change occurred after B. longimanus in E. coregoni (declined) and Conochilus spp. (increased), which altered community rank at deep stations.
3.5. Community Patterns Pre- and Post-Invasion
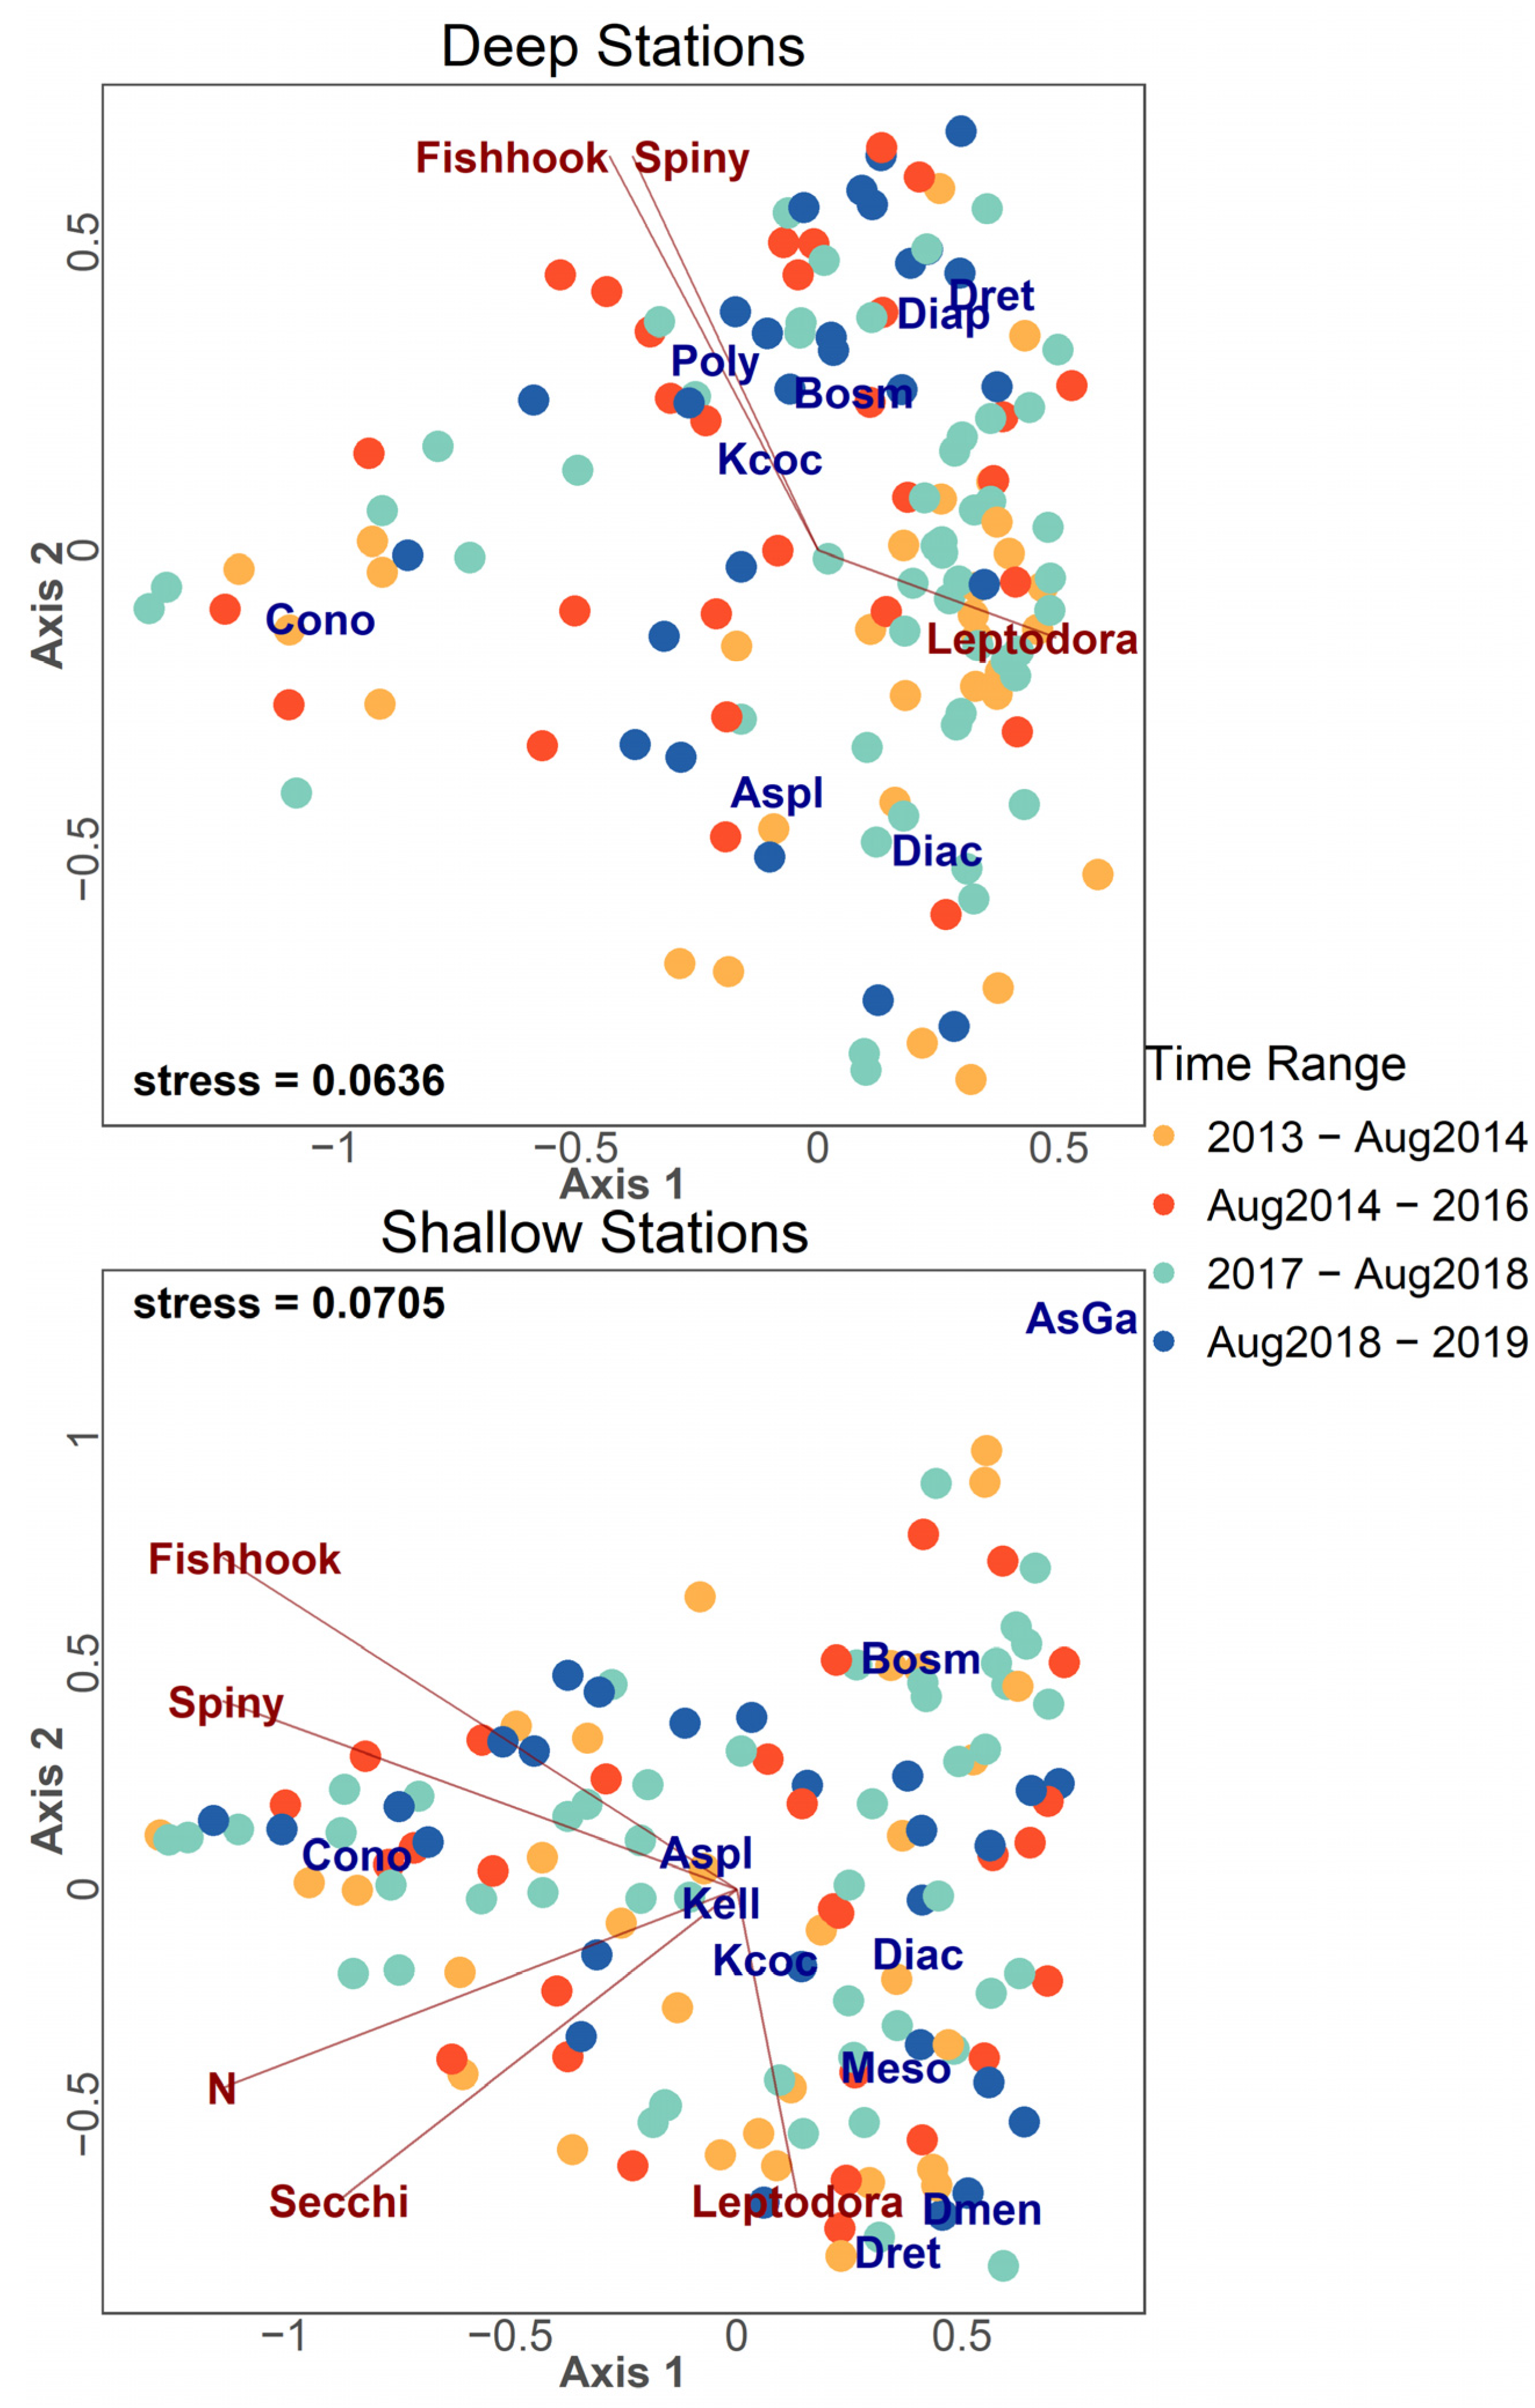
Community ordination results are found in Figure 9, Figure 10, Figure 11 and Figure 12 for both deep stations and shallow stations throughout the study period (2013–2019). NMDS ordinations in Figure 9 display the full plots that were used to plot the separated Figure 10, Figure 11 and Figure 12. Taxa and environmental variables determined to be most influential were plotted on both deep stations and shallow stations panels. Ordination results illustrate the pattern of Leptodora kindtii, exhibiting higher abundance in pre-invasion samples and an inverse abundance relationship with both Cercopagid invaders (Figure 9). Samples taken pre-Cercopagidae and during years of low B. longimanus density (2016–August 2018) were most similar in community composition in deep stations with shifts in community composition associated with post-Cercopagid invasion periods (Figure 9). Diacyclops thomasi was negatively correlated with both Cercopagidae in both deep and shallow stations, more so in deep sites (Figure 9). Conochilus spp. were negatively correlated with L. kindtii in deep stations and less strongly in shallow stations (Figure 9).
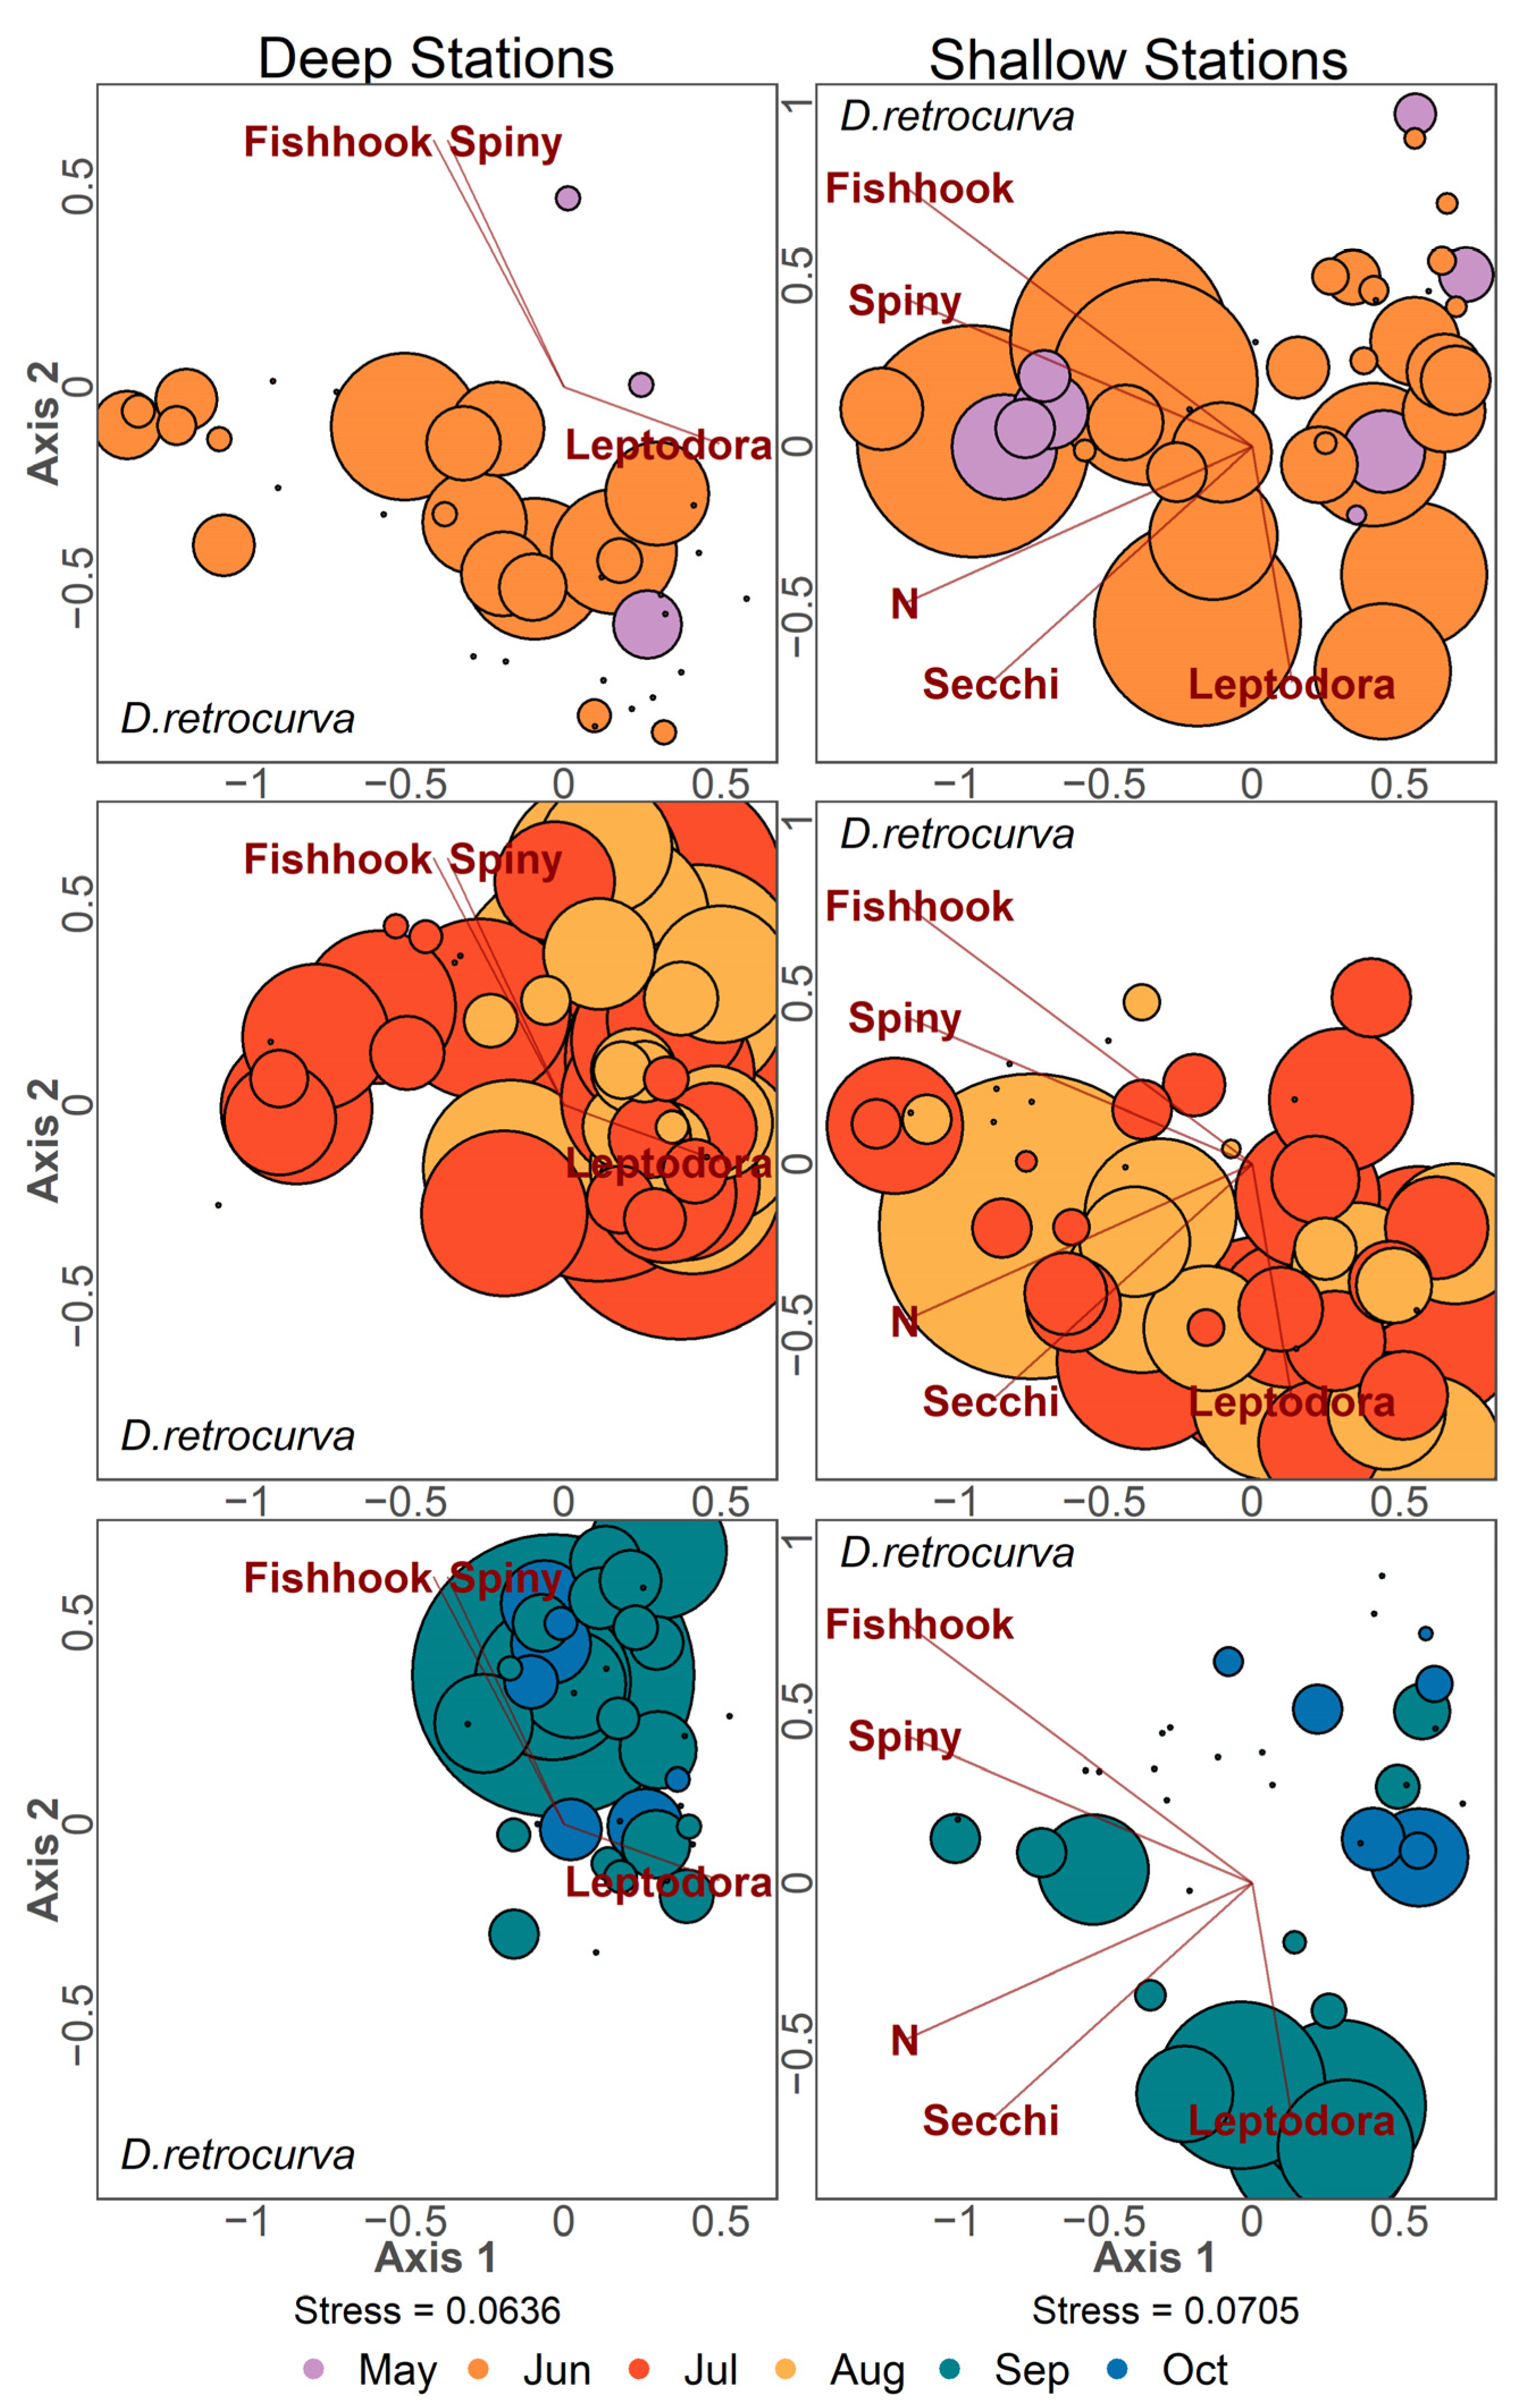
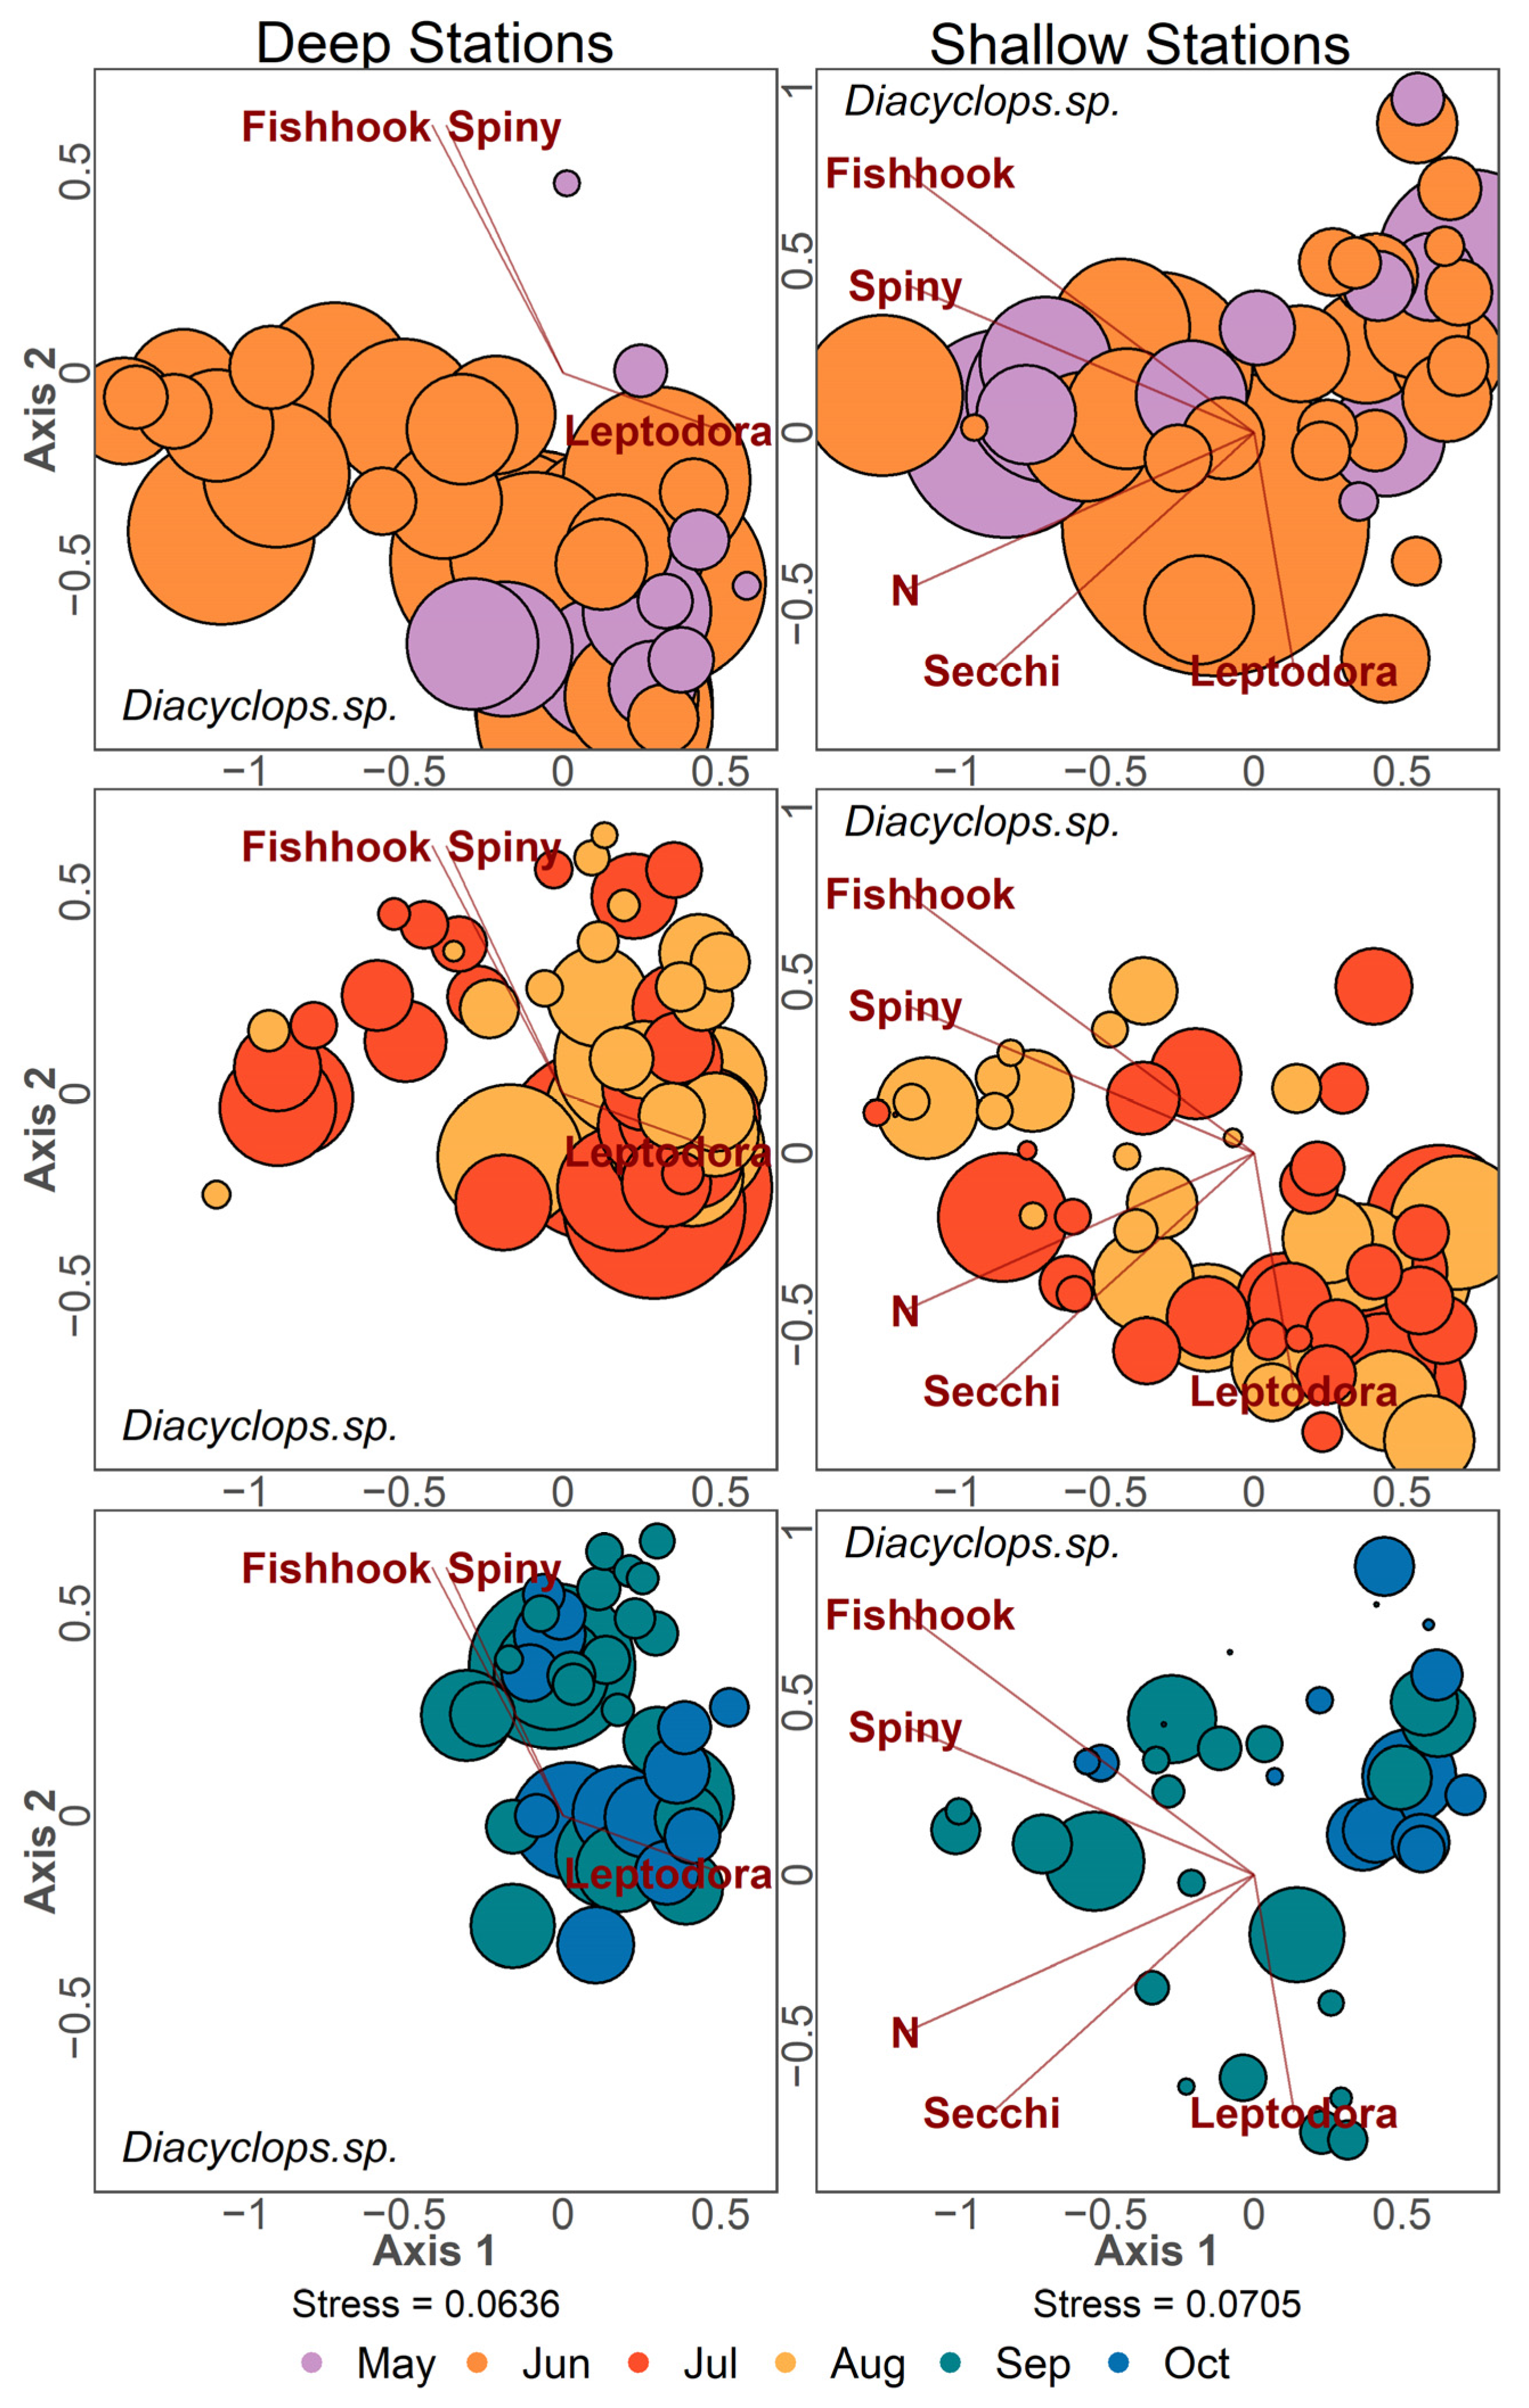
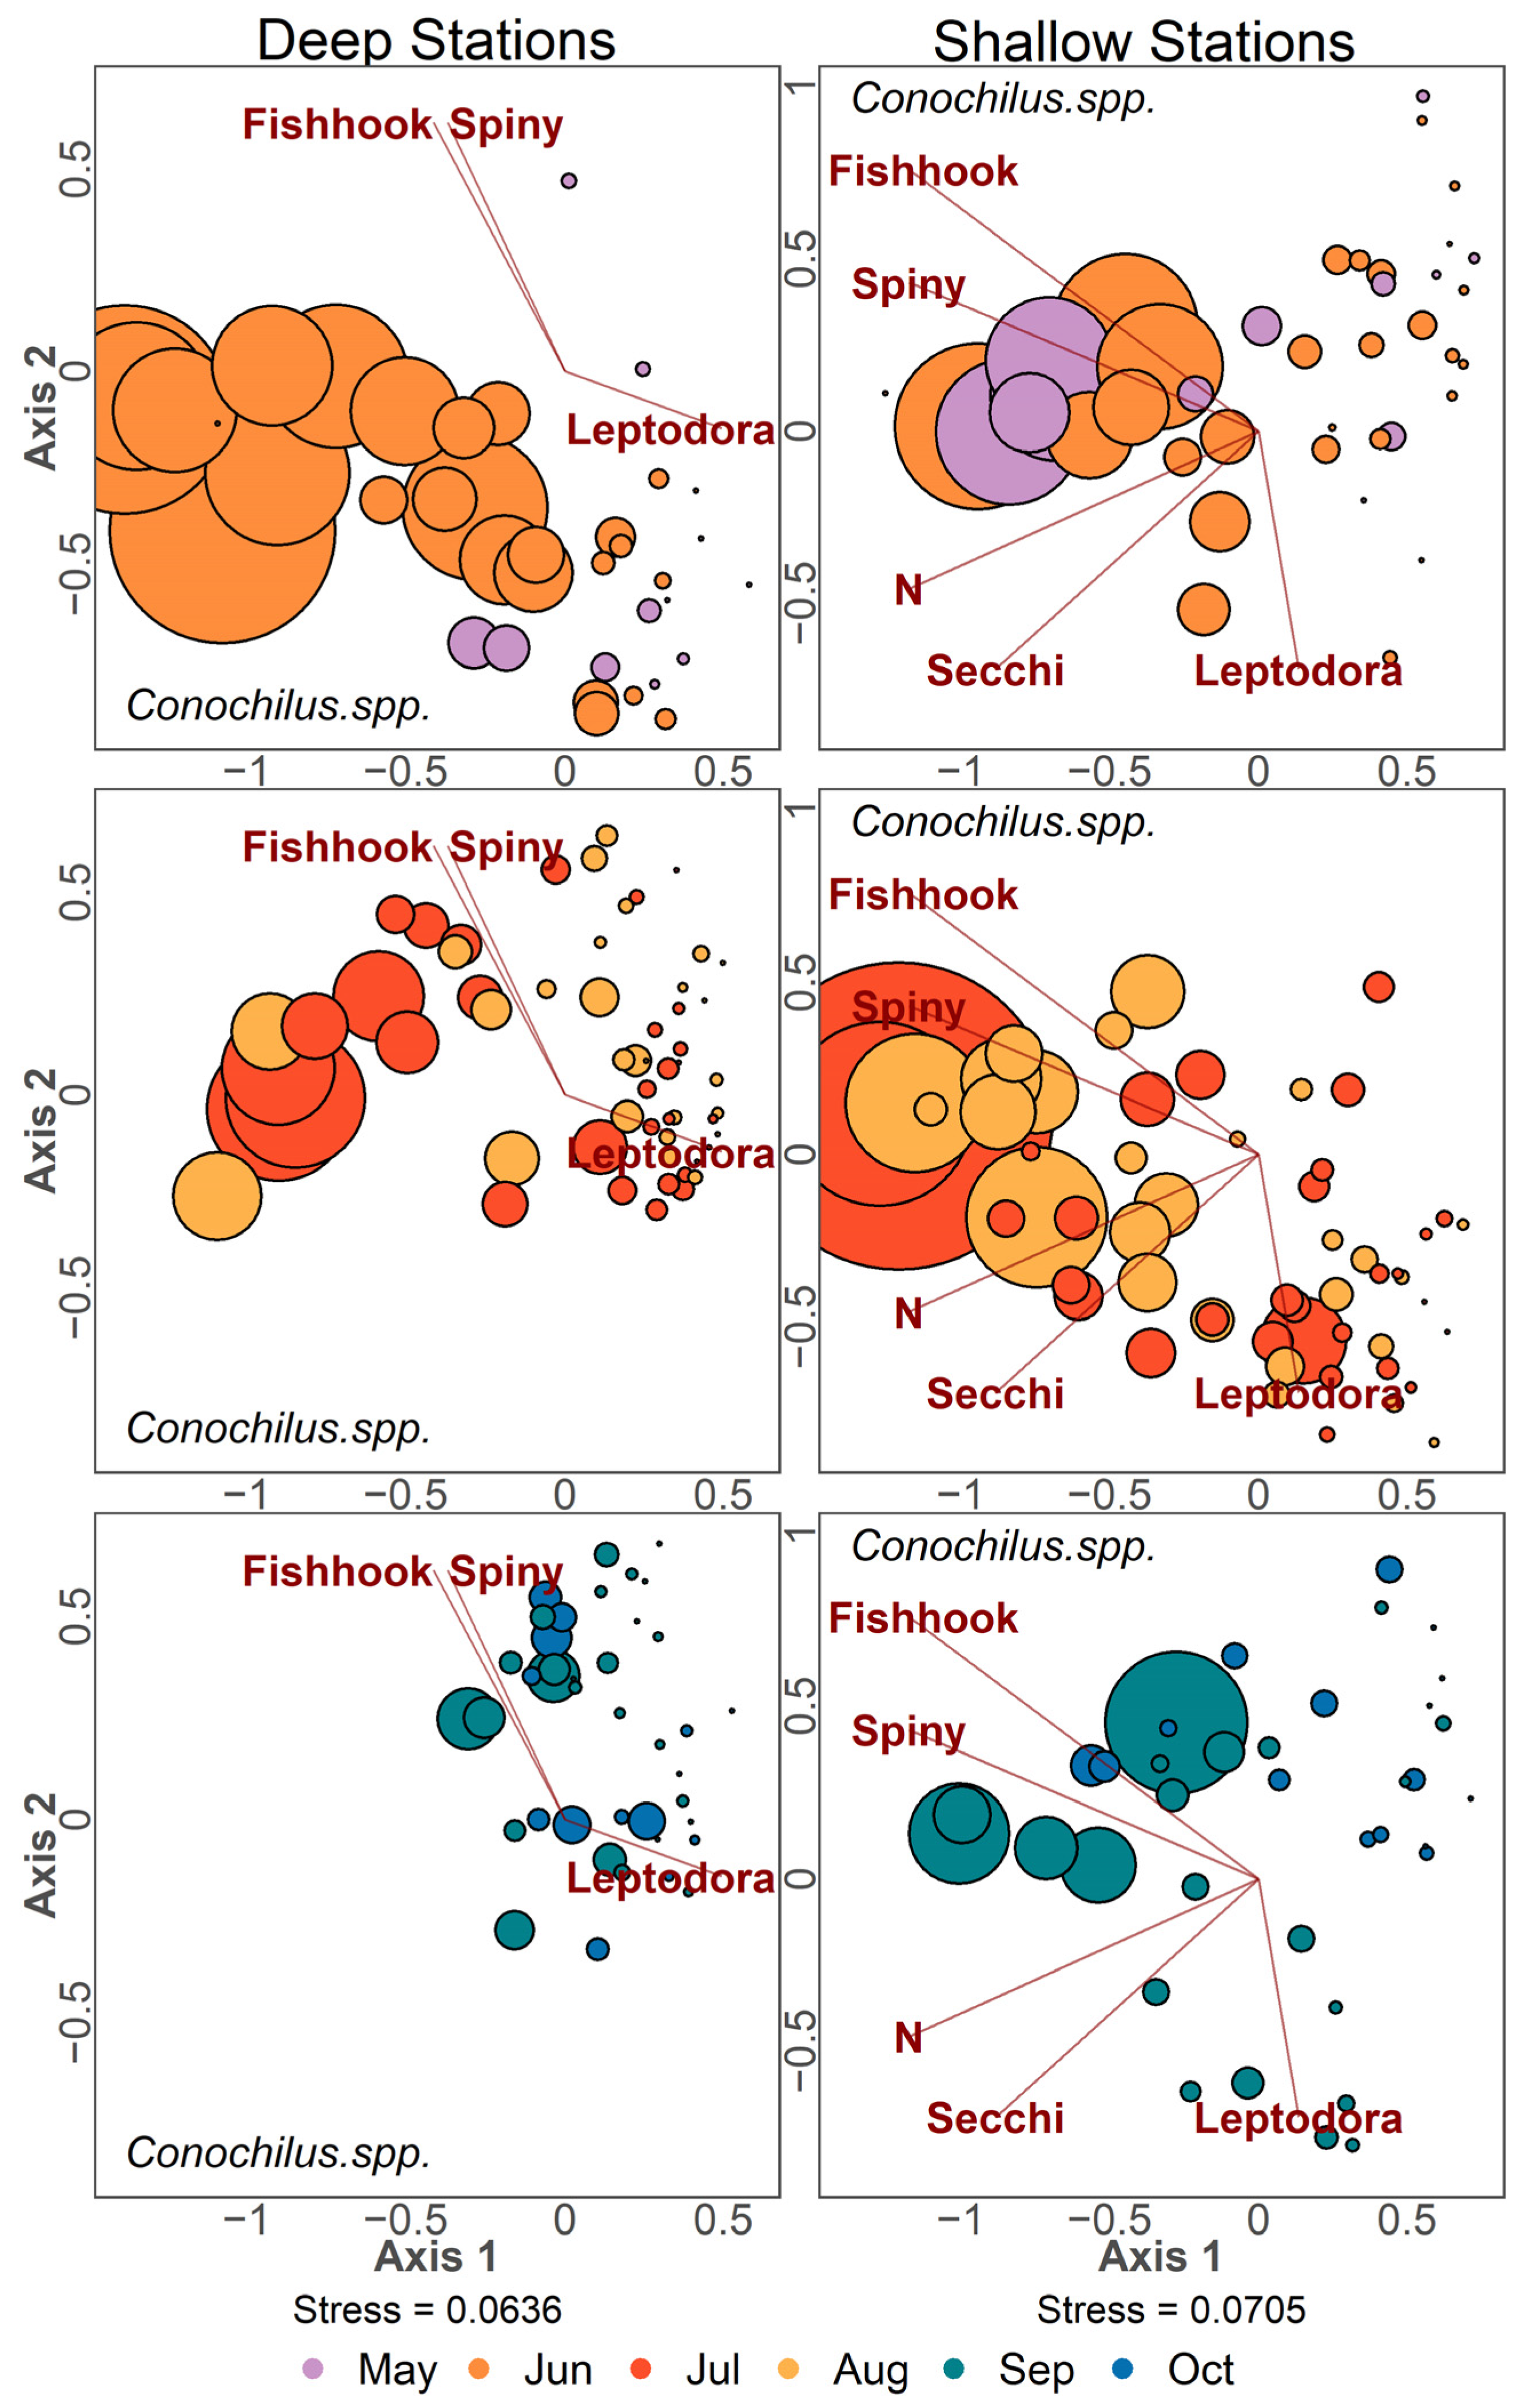
NMDS ordinations with point size scaled by density for the three most abundant taxa in Lake Champlain are presented (D. retrocurva in Figure 10, D. thomasi in Figure 11 and Conochilus spp. in Figure 12). Ordination points were plotted separately for 2-month timespans for each panel. Daphnia retrocurva was abundant in July and August in all years at all stations and in June for shallow stations (Figure 10). D. retrocurva experienced an abundance decline in late season (September and October) most notably in samples containing invasive B. longimanus or C. pengoi (Figure 10). Diacyclops thomasi was at high density in June and July at all stations with late season declines associated with the two Cercopagid invaders (Figure 11). Conochilus spp. was most abundant in June and July at deep stations and more spread across May to August in shallow stations (Figure 12). Conochilus spp. also exhibited abundance declines mainly associated with the invasion of C. pengoi (Figure 12).
4. Discussion
4.1. Large Predatory Cladoceran Patterns
Bythotrephes longimanus was only in high abundance during the first two years (2015–2016) following its first detection in Lake Champlain in late 2014. During this period, it had an evident impact on native large-bodied zooplankton taxa, most notably L. kindtii and D. retrocurva. The seasonal abundance patterns of B. longimanus in Lake Champlain were similar to seasonal patterns found in other comparable lakes. Peak abundance of B. longimanus occurs during summer and fall in Lake Michigan [45], and mid-July to October in western Lake Erie after its first detection year [46]. After 2016, B. longimanus has remained at a nearly undetectable population level throughout the lake. Despite B. longimanus having many advantages over the other predatory cladocerans in terms of feeding efficiency and diet size range [17,47], it remains the least abundant large-bodied predator in Lake Champlain. The possible cause for this near absence may be due to predation from alewife [48] or native fish species, such as cisco [49]. B. longimanus were the preferred prey for adult alewife in Lake Michigan, and their consumption rate exceeds the B. longimanus production rate [50].
Unlike Bythotrephes longimanus, Cercopagis pengoi has remained abundant in Lake Champlain following the initial detection. On average, at every lake sampling station, the C. pengoi population has been more abundant than the earlier invader, B. longimanus. Alewife were found to be far less likely to consume C. pengoi over B. longimanus at Lake Michigan [50], which may also help to explain why it is still abundant in Lake Champlain. The seasonal population dynamics of C. pengoi in Lake Champlain appear to be similar to other invaded North American lakes, where they are found in samples from July to October with their peak abundance occurring in August [6,29,51]. C. pengoi populations remain high in Lake Champlain through all post detection years up to 2022 (personal observation), suggesting it will remain a long-term dominant large predatory plankter.
Leptodora kindtii appears to be unable to compete with B. longimanus in other lake studies [14,27,33,36], and peak densities of L. kindtii and C. pengoi rarely overlap [33]. Lake Champlain shows similar results to previous studies, where the peak density of L. kindtii does not overlap with the peak density of either Cercopagidae. It appears that L. kindtii has an advantage over the Cercopagidae at shallow water stations, as their density is not drastically reduced at these locations compared to deep water stations during the years when the Cercopagidae had invaded. For nearly every year, L. kindtii has been the dominant predatory cladoceran in shallow lake stations except in 2019, where C. pengoi became extremely abundant lakewide in August. Perhaps in shallow sites, higher turbidity may give L. kindtii an advantage over the other two sight-based predators [52]. Leptodora kindtii displays a similar population trend in the Great Lakes, remaining at high abundance at nearshore environments in Lake Michigan and Erie, locations where B. longimanus seems unable to survive [19].
4.2. Zooplankton Invasion Response Trends
Our results suggest that both the Bythotrephes longimanus and Cecropagis pengoi invasion caused a change in the zooplankton community in Lake Champlain. The density of common species, such as Daphnia retrocurva and Diacyclops thomasi, were reduced during the years of high Cercopagidae abundance in addition to peak abundance shifting seasonally when compared to years without high Cercopagidae density. These reductions in abundance and the temporal shifting of peak density following the invasions varied between taxa, study years, and deep and shallow lake stations. Most of these changes occurred during the year immediately following first detection of both Cercopagids, especially B. longimanus in 2015. Similar high declines of native species during the years of first detection for both Cercopagidae have been found in the Great Lakes as well [6,19,25].
4.3. Filter-Feeding Cladocerans
The decline in D. retrocurva during the initial detection years of B. longimanus invasion is a common outcome found in the Laurentian region [14,19,53]. Daphnia retrocurva was found to have almost no overlap in occurrence with B. longimanus in Great Lakes studies [19,54]. This decline has been attributed to the inability of D. retrocurva to escape predation by B. longimanus [25]. Daphnia retrocurva density was not reduced by the C. pengoi invasion to the same severity as that noted for the B. longimanus invasion in Lake Champlain. Similar results were found at Lake Ontario through PCA analysis, showing similar distributions of C. pengoi and D. retrocurva in the lake [6]. This similar distribution was attributed to the large body size of D. retrocurva, making it less likely to be preyed upon by C. pengoi [6].
While D. retrocurva had declined due to the presence of B. longimanus in Lake Champlain, D. mendotae had not increased (see supplemental graphs) as expected based on the outcome of other studies [55,56]. Throughout this study, D. retrocurva has remained the most abundant daphniid in Lake Champlain, and D. mendotae has remained low in density. D. mendotae was seemingly unable to occupy the open niche space available in 2015–2016 when D. retrocurva populations were impacted by B. longimanus.
Bosmina longirostris declined during high Cercopagidae density periods but to a much less severe degree compared to other studies, such as those performed in Lake Ontario [6,22,51] and Lake Huron [55] (see supplemental graphs). Eubosmina coregoni appears to have been impacted by both Cercopagid invaders, especially during 2019 when C. pengoi density was at its highest (see supplemental graphs). C. pengoi has been found to greatly reduce E. coregoni abundance when it is at its peak abundance in Lake Ontario [22,51].
Due to the near disappearance of B. longimanus in more recent years, it is likely that D. retrocurva will remain the dominant daphniid of Lake Champlain because of its large body size, which C. pengoi is unable to process [6]. The average body size of D. retrocurva may become larger over time as a result of this pressure; however, this is unlikely due to the size pressure exerted by Alewife [4]. Ceriodaphnia spp. are smaller bodied than other daphniids and as such are subject to predation from C. pengoi, causing their population to remain at low density. Bosminids were in high abundance in years prior to the C. pengoi invasion but are likely to remain reduced in years following because of their small average body size.
4.4. Copepods
Changes in seasonal abundance of Diacyclops thomasi, the most common copepod in Lake Champlain, occurred in both periods of high Cercopagidae density. During both invasions, the peak abundance of D. thomasi shifts to early summer (May–August), and said abundance peak is lower when Cercopagidae are in high abundance. Before either Cercopagidae had invaded it appears D. thomasi peak abundance occurred during the early to midsummer (late June–July). This is consistent with other studies, finding that D. thomasi reached peak abundance in July before Cercopagidae were detected [22,48]. The density dynamics of D. thomasi were also highly reduced in temporal comparisons between pre and post invasion communities in the lakes at Voyageurs National Park (MN) [57].
Mesocyclops edax decreased in density after B. longimanus reached detectable density (see supplemental graphs). Mesocyclops edax exhibited a highly reduced population throughout the entire study period during high B. longimanus density in smaller Laurentian lakes [19,53,56]. This decline was attributed to B. longimanus predation upon their copepodid and naupliar life stages [57]. Mesocyclops edax was extremely low in years of high C. pengoi density as well. T. prasinus mexicanus has been impacted by both C. pengoi and B. longimanus invasions, as their population often decreased during periods of high Cercopagidae density (see supplemental graphs). Due to the small body size of T. prasinus mexicanus, they are likely to remain at low density from predation by C. pengoi.
While the Cercopagidae invasions have impacted the major cyclopoid species in Lake Champlain, B. longimanus and C. pengoi appear to have little influence on diaptomid population trends (see supplemental graphs). This outcome has been observed in other lake systems, where overall calanoid abundance did not decrease despite high nauplii consumption in the epilimnion of studied lakes invaded by Cercopagidae [14,19,48,55].
4.5. Rotifers
Rotifera abundance has been reduced in the Great Lakes due to C. pengoi presence [21,31]; however, a comparable decline has not occurred in Lake Champlain. High reduction in Asplanchna spp. occurred in years where C. pengoi is in high abundance in the Great Lakes [21]. Asplanchna spp. exhibited a decline, but to a lesser degree in Lake Champlain than the Great Lakes (see supplemental graphs). However, Conochilus spp. seem to be much more consistently impacted. It seems that C. pengoi preys upon the rotifer Conochilus spp. heavily throughout many areas of the lake. Some studies have proposed that an observed decline in rotifer abundance was due to the presence of C. pengoi, while others have found no change in the rotifer community following invasion [31]. The population dynamics of other rotifer taxa had little noticeable change in response to either Cercopagidae, likely due to their already small presence in Lake Champlain resulting from the Dreissena polymorpha invasion in the 1990s [4].
5. Conclusions
The invasion of Bythotrephes longimanus and Cercopagis pengoi have caused a reduction in the density of key zooplankton species and shifted seasonal peak density in some. The dominant daphniid Daphnia retrocurva declined during the initial years where B. longimanus reached a detectable density in 2014 and 2015. Diacyclops thomasi similarly declined in density during these years as well as after C. pengoi reached detectable abundance. D. thomasi additionally shifted in seasonal peak abundance to earlier in June. The most dominant rotifer Conochilus spp. greatly declined during the years C. pengoi reached high density in 2018 and 2019. The changes in the population dynamics of these species occurred most notably at deep water stations, while these changes did not appear to occur at shallow stations.
While the B. longimanus population may have become negligible throughout the lake possibly due to high fish predation, the C. pengoi population remains strong. Bythotrephes longimanus likely has little long-term influence on zooplankton population dynamics, while C. pengoi will likely continue to impact the middle food web in the years following. It will be important to continue monitoring the invasive predatory cladoceran population in the years to come with both major invasive species now present in Lake Champlain.
Supplementary Materials
The following supporting information can be downloaded at: https://www.mdpi.com/article/10.3390/d15111112/s1, Seasonal deep station density of Daphnia mendotae compared to Bythotrephes longimanus and Cercopagis pengoi in all study years. The black arrow denotes the time when a Cercopagidae was first detected (B. longimanus 2014, C. pengoi 2018), Figure S2. Seasonal deep station density of Ceriodaphnia spp. compared to Bythotrephes longimanus and Cercopagis pengoi in all study years. The black arrow denotes the time when a Cercopagidae was first detected (B. longimanus 2014, C. pengoi 2018), Figure S3. Seasonal deep station density of Bosmina longirostris compared to Bythotrephes longimanus and Cercopagis pengoi in all study years. The blackarrow denotes the time when a Cercopagidae was first detected (B. longimanus 2014, C. pengoi 2018), Figure S4. Seasonal deep station density of Eubosmina coregoni compared to Bythotrephes longimanus and Cercopagis pengoi in all study years. The black arrow denotes the time when a Cercopagidae was first detected (B. longimanus 2014, C. pengoi 2018), Figure S5. Seasonal deep station density of Mesocyclops edax compared to Bythotrephes longimanus and Cercopagis pengoi in all study years. The black arrow denotes the time when a Cercopagidae was first detected (B. longimanus 2014, C. pengoi 2018), Figure S6. Seasonal deep station density of Tropocyclops prasinus mexicanus compared to Bythotrephes longimanus and Cercopagis pengoi in all study years. The black arrow denotes the time when a Cercopagidae was first detected (B. longimanus 2014, C. pengoi 2018), Figure S7. Seasonal deep station density of Diaptomidae calanoid copepods compared to Bythotrephes longimanus and Cercopagis pengoi in all study years. The black arrow denotes the time when a Cercopagidae was first detected (B. longimanus 2014, C. pengoi 2018), Figure S8. Seasonal deep station density of Asplanchna spp. compared to Bythotrephes longimanus and Cercopagis pengoi in all study years. The black arrow denotes the time when a Cercopagidae was first detected (B. longimanus 2014, C. pengoi 2018).
Author Contributions
Conceptualization, T.B.M. and Z.A.C.; methodology, T.B.M., L.W.M. and Z.A.C.; software, Z.A.C.; validation, T.B.M. and L.W.M.; formal analysis, Z.A.C.; investigation, Z.A.C.; resources, T.B.M. and L.W.M.; data curation, Z.A.C.; writing—original draft preparation, Z.A.C.; writing—review and editing, T.B.M., L.W.M. and Z.A.C.; visualization, Z.A.C.; supervision, T.B.M. and L.W.M.; project administration, T.B.M.; funding acquisition, T.B.M. All authors have read and agreed to the published version of the manuscript.
Funding
This project was supported by the Lake Champlain Long-term Monitoring program with funding provided by the Lake Champlain Basin Program on SUNY Research Foundation award 88867.
Institutional Review Board Statement
Not Applicable.
Data Availability Statement
Data utilized in this study are available at the Vermont DEC website at https://anrweb.vermont.gov/dec/_dec/LongTermMonitoringLakes.aspx (accessed on 23 October 2023).
Conflicts of Interest
The authors declare no conflict of interest. The funders had no role in the design of the study; in the collection, analyses, or interpretation of data; in the writing of the manuscript; or in the decision to publish the results.
References
- Escobar, L.; Mallez, S.; McCartney, M.; Lee, C.; Lielinski, D.; Ghosal, R.; Bajer, P.; Wagner, C.; Nash, B.; Tomamichel, M.; et al. Aquatic invasive species in the Great Lakes region: An overview. Rev. Fish. Sci. Aquac. 2017, 26, 121–138. [Google Scholar] [CrossRef]
- Sturtevant, R.; Mason, D.; Rutherford, E.; Elgin, A.; Lower, E.; Martinez, F. Recent history of nonindigenous species in the Laurentian Great Lakes; An update to Mills et al., 1993 (25 years later). J. Great Lakes Res. 2019, 45, 1011–1035. [Google Scholar] [CrossRef]
- Marsden, J.E.; Hauser, M. Exotic species in Lake Champlain. J. Great Lakes Res. 2009, 35, 250–265. [Google Scholar] [CrossRef]
- Mihuc, T.; Dunlap, F.; Binggeli, C.; Myers, L.; Pershyn, C.; Groves, A.; Waring, A. Long-term patterns in Lake Champlain’s zooplankton: 1992–2010. J. Great Lakes Res. 2012, 38, 49–57. [Google Scholar] [CrossRef]
- Mihuc, T.B.; Recknagel, F. Lessons from Bioinvasion of Lake Champlain, U.S.A. In Ecological Informatics; Recknagel, F., Michener, W., Eds.; Springer: Cham, Switzerland, 2018. [Google Scholar] [CrossRef]
- Benoit, H.; Johannsson, O.; Warner, D.; Sprules, W.; Rudstam, L. Assessing the impact of a recent predatory invader: The population dynamics, vertical distribution, and potential prey of Cercopagis pengoi in Lake Ontario. Limnol. Oceanogr. 2002, 47, 626–635. [Google Scholar] [CrossRef]
- Boudreau, S.; Yan, N. The differing crustacean zooplankton communities of Canadian Shield lakes with and without the nonindigenous zooplanktivore Bythotrephes longimanus. Can. J. Aquat. Sci. 2003, 60, 1307–1313. [Google Scholar] [CrossRef]
- Kim, N.; Yan, N. Food limitation impacts life history of the predatory cladoceran Bythotrephes longimanus, an invader to North America. Hydrobiologia 2013, 715, 213–224. [Google Scholar] [CrossRef]
- Pawlowski, M.; Branstrator, D.; Hrabik, T.; Sterner, R. Changes in the cladoceran community of Lake Superior and the role of Bythotrephes longimanus. J. Great Lakes Res. 2017, 43, 1101–1110. [Google Scholar] [CrossRef]
- Cristescu, M.; Hebert, P.; Witt, J.; MacIsaac, H.; Grigorovich, I. An invasion history for Cercopagis pengoi based on mitochondrial gene sequences. Limnol. Oceanogr. 2001, 46, 224–229. [Google Scholar] [CrossRef]
- Muirhead, J.; Sprules, G. Reaction distance of Bythotrephes longimanus, encounter rate and index of prey risk for Harp Lake, Ontario. Freshw. Biol. 2003, 48, 135–146. [Google Scholar] [CrossRef]
- Pichlova-Ptacnikova, R.; Vanderploeg, H. The invasive cladoceran Cercopagis pengoi is a generalist predator capable of feeding on a variety of prey species of different sizes and escape abilities. Fundam. Appl. Limnol. Arch. Fur Hydrobiol. 2009, 173, 267–279. [Google Scholar] [CrossRef]
- Grigorovich, I.; Pashkova, O.; Gromova, Y.; Overdijk, C. Bythotrephes longimanus in the Commonwealth of Independent States: Variability, distribution and ecology. Hydrobiologia 1998, 379, 183–198. [Google Scholar] [CrossRef]
- Jokela, A.; Arnott, S.; Beisner, B. Patterns of Bythotrephes longimanus distribution relative to native macroinvertebrates and zooplankton prey. Biol. Invasions 2011, 13, 2573–2594. [Google Scholar] [CrossRef]
- Lehman, J.; Caceres, C. Food-web responses to species invasion by a predatory invertebrate: Bythotrephes in Lake Michigan. Limnol. Oceanogr. 1993, 38, 879–891. [Google Scholar] [CrossRef]
- Ojaveer, H.; Kuhns, L.; Barbiero, R.; Tuchman, M. Distribution and population characteristics of Cercopagis pengoi in Lake Ontario. J. Great Lakes Res. 2001, 27, 10–18. [Google Scholar] [CrossRef]
- Pichlova-Ptacnikova, R.; Vanderploeg, H.; Cavaletto, J. Big versus small: Does Bythotrephes longimanus predation regulate spatial distribution of another invasive predatory cladoceran, Cercopagis pengoi? J. Great Lakes Res. 2015, 41, 143–149. [Google Scholar] [CrossRef]
- VTDEC; NYDEC. Lake Champlain Long-Term Water Quality and Biological Monitoring Program: Summary of Program Activities During 2012. Lake Champlain Basin Program. 2012. Available online: https://dec.vermont.gov/sites/dec/files/wsm/lakes/docs/lp_2012lcmannualreport.pdf (accessed on 23 October 2023).
- Barbiero, R.; Tuchman, M. Changes in the crustacean communities of Lakes Michigan, Huron, and Erie following the invasion of the predatory cladoceran Bythotrephes longimanus. Can. J. Fish. Aquat. Sci. 2004, 61, 2111–2125. [Google Scholar] [CrossRef]
- Yan, N.; Leung, B.; Lewis, M.; Peacor, S. The spread, establishment and impacts of the spiny water flea, Bythotrephes longimanus, in temperate North America: A synopsis of the special issue. Biol. Invasions 2011, 13, 2423–2432. [Google Scholar] [CrossRef]
- Barbiero, R.; Warren, G. Rotifer communities in the Laurentian Great Lakes. 1983–2006 and the factors affecting their composition. J. Great Lake Res. 2011, 37, 528–540. [Google Scholar] [CrossRef]
- Laxson, C.; McPhedran, K.; Makarewicz, J.; Telesh, I.; MacIsaac, H. Effects of the non-indigenous cladoceran Cercopagis pengoi on the lower food web of Lake Ontario. Freshw. Biol. 2003, 48, 2094–2106. [Google Scholar] [CrossRef]
- Facey, D.; Marsden, E.; Mihuc, T.; Howe, E. Lake Champlain 2010: A summary of recent research and monitoring initiatives. J. Great Lakes Res. 2012, 38, 1–5. [Google Scholar] [CrossRef]
- Young, J.; Strecker, A.; Yan, N. Increased abundance of the non-indigenous zooplanktivore, Bythotrephes longimanus, is strongly correlated with greater spring prey availability in Canadian Shield lakes. Biol. Invasions 2011, 13, 2605–2619. [Google Scholar] [CrossRef]
- Bowen, K.; Johannsson, O. Changes in zooplankton biomass in the Bay of Quinte with the arrival of the mussels, Dreissena polymorpha and D. rostiformis bugensis, and the predatory cladoceran, Cercopagis pengoi: 1975 to 2008. Aquat. Ecosyst. Health Manag. 2011, 14, 44–55. [Google Scholar] [CrossRef]
- Pichlova-Ptacnikova, R.; Vanderploeg, H. The quick and the dead: Might differences in escape rates explain the changes in the zooplankton community composition of Lake Michigan after invasion by Bythotrephes? Biol. Invasions 2011, 13, 2595–2604. [Google Scholar] [CrossRef]
- Branstrator, D.; Lehman, J. Invertebrate predation in Lake Michigan: Regulation of Bosmina longirostris by Leptodora kindtii. Limnol. Oceanogr. 1991, 36, 483–495. [Google Scholar] [CrossRef]
- LaMay, M. Diel Vertical Migration of Zooplankton in a Lake Containing the Invasive Bythotrephes longimanus (Lake George) Compared to a Non-Invaded Lake (Lake Champlain). Master’s Thesis, State University of New York at Plattsburgh, Plattsburgh, NY, USA, 2014; p. 157. [Google Scholar]
- Witt, A.; Dettmers, J.; Caceres, C. Cercopagis pengoi in Southwestern Lake Michigan in four years following invasion. J. Great Lakes Res. 2005, 31, 245–252. [Google Scholar] [CrossRef]
- Gorokhova, E. Zooplankton spatial distribution and potential predation by invertebrate zooplanktivores. In Proceedings of the Second BAYSYS Annual Science Conference, Stockholm, Sweden, 23–25 September 1998. Paper Abstracts: 7. [Google Scholar]
- Makarewicz, J.; Lewis, T. Long-term changes in Lake Ontario rotifer abundance and composition: A response to Cercopagis predation? J. Great Lakes Res. 2015, 41, 192–199. [Google Scholar] [CrossRef]
- Hovius, J.; Beisner, B.; McCann, K. Epilimnetic rotifer community responses to Bythotrephes longimanus invasion in Canadian Shield lakes. Limnol. Oceanogr. 2006, 51, 1004–1012. [Google Scholar] [CrossRef]
- Cavaletto, J.; Vanderploeg, H.; Ptacnikova, R.; Pothoven, S.; Liebig, J.; Fahnenstiel, G. Temporal and spatial separation allow coexistence of predatory cladocerans: Leptodora kindtii. Bythotrephes longimanus and Cercopagis pengoi in southeastern Lake Michigan. J. Great Lakes Res. 2010, 36, 65–73. [Google Scholar] [CrossRef]
- Enz, C.; Heller, C.; Muller, R.; Burgi, H. Investigations on fecundity of Bythotrephes longimanus in Lake Lucerne (Switzerland) and on niche segregation of Leptodora kindtii and Bythotrephes longimanus in Swiss lakes. Hytrobiologia 2001, 464, 143–151. [Google Scholar] [CrossRef]
- Kane, D.; Haas, E.; Culver, D. The characteristics and potential ecological effects of the exotic crustacean zooplankter Cercopagis pengoi (Cladocera: Cercopagidae), a recent invader of Lake Erie. Ohio J. Sci. 2003, 103, 79–83. [Google Scholar]
- Branstrator, D. Ecological interactions between Bythotrephes longimanus and Leptodora kindtii and the implications for species replacement in Lake Michigan. J. Great Lakes Res. 1995, 21, 670–679. [Google Scholar] [CrossRef]
- Johannsson, O.; Bowen, K. Zooplankton production in the Bay of Quinte 1975–2008: Relationships with primary production.habitat. planktivory. and aquatic invasive species (Dreissena spp. and Cercopagis pengoi). Can. J. Fish. Aquat. Sci. 2012, 69, 2046–2063. [Google Scholar] [CrossRef]
- Lake Champlain Basin Program. Long-term water quality and biological monitoring project for Lake Champlain. In Proceedings of the 2018–2023 Quality Assurance Project Plan/Workplan, Grand Isle, VT, USA, 5 June 2020; Vermont/New York Department of Environmental Conservation Watershed Management Division/Division of Water, Lake Champlain Basin Program (Vermont). Lake Champlain Basin Program, 54 West Shore Road Grand Isle, Vermont. p. 68. [Google Scholar]
- Hayes-Pontius, E.M. Zooplankton Community Dynamics Following Extreme Flood Events in Lake Champlain. Master’s Thesis, State University of New York at Plattsburgh, Plattsburgh, NY, USA, 2013; p. 103. [Google Scholar]
- LaMay, M.; Hayes-Pontius, E.; Ater, I.; Mihuc, T. A revised key to the zooplankton of Lake Champlain. State Univ. N. Y. Plattsbg. 2013, 6, 1–41. [Google Scholar]
- R Core Team. R: A Language and Environment for Statistical Computing. R Foundation for Statistical Computing. Vienna, Austria. 2023. Available online: https://www.R-project.org/ (accessed on 23 October 2023).
- Oksanen, J.; Simpson, G.; Blanchet, F.; Kindt, R.; Legendre, P.; Minchin, P.; O’Hara, R.; Solymos, P.; Stevens, M.; Szoecs, E.; et al. _Vegan: Community Ecology Package_. R Package Version 2.6-4. 2022. Available online: https://CRAN.R-project.org/package=vegan (accessed on 23 October 2023).
- Clarke, K.; Warwick, R. Quantifying structural redundancy in ecological communities. Oecologia 1998, 113, 278–289. [Google Scholar] [CrossRef]
- Taylor, M. _sinkr: Collection of Functions with Emphasis in Multivariate Data Analysis_. R Package Version 0.7. 2022. Available online: https://github.com/marchtaylor/sinkr (accessed on 23 October 2023).
- Vanderploeg, H.; Pothoven, S.; Fahnestiel, G.; Cavaletto, J.; Liebig, J.; Stow, C.; Nalepa, T.; Madenjian, C.; Bunnell, D. Seasonal zooplankton dynamics in Lake Michigan: Disentangling impacts of resource limitation, ecosystem engineering, and predation during a critical ecosystem transition. J. Great Lakes Res. 2012, 38, 336–352. [Google Scholar] [CrossRef]
- Berg, D.; Garton, D. Seasonal abundance of the exotic predatory cladoceran Bythotrephes longimanus, in western Lake Erie. J. Great Lakes Res. 1988, 14, 479–488. [Google Scholar] [CrossRef]
- Branstrator, D. Contrasting life histories of the predatory cladocerans Leptodora kindtii and Bythotrephes longimanus. J. Plankton Res. 2005, 27, 569–585. [Google Scholar] [CrossRef]
- Mills, E.; Gorman, R.; DeGisi, J.; Heberger, R.; House, R. Food of the alewife (Alosa pseudoharengus) in Lake Ontario before and after the establishment of Bythtrephes longimanus. Can. J. Fish Aquat. Sci. 1992, 49, 2009–2019. [Google Scholar] [CrossRef]
- Martin, B.; Mrnak, J.; Vander Zanden, J. Evaluating the potential role of predation by native fish regulating the abundance of invasive spiny water flea. J. Freshw. Ecol. 2023, 38, 2187470. [Google Scholar] [CrossRef]
- Pothoven, S.; Vanderploeg, H.; Cavaletto, J.; Krueger, D.; Mason, D.; Brandt, S. Alewife planktivory controls the abundance of two invasive predatory cladocerans in Lake Michigan. Freshw. Biol. 2007, 52, 561–573. [Google Scholar] [CrossRef]
- Makarewicz, J.; Damaske, E.; Laxson, C. Seasonal and Vertical Distribution, Food Web Dynamics and Contaminant Biomagnification of Cercopagis pengoi in Lake Ontario. SUNY Open Access Repository (SOAR). Brockport Technical Reports (Water Resources). 2002. Available online: https://soar.suny.edu/handle/20.500.12648/4437 (accessed on 23 October 2023).
- Sorenson, M.; Branstrator, D. The North American invasive zooplanktivore Bythotrephes longimanus is less hypoxia-tolerant than the native Leptodora kindtii. Can. J. Fish Aquat. Sci. 2016, 74, 824–832. [Google Scholar] [CrossRef]
- Yan, N.; Pawson, T. Changes in the crustacean zooplankton community of Harp Lake, Canada, following invasion by Bythotrephes longimanus. Freshw. Biol. 1997, 37, 409–425. [Google Scholar] [CrossRef]
- Barbiero, R.; Rudstam, L.; Watkins, J.; Lesht, B. A cross-lake comparison of crustacean zooplankton communities in the Laurentian Great Lakes, 1997–2016. J. Great Lakes Res. 2019, 45, 672–690. [Google Scholar] [CrossRef]
- Bunnell, D.; Keeler, K.; Puchala, E.; Davis, B.; Pothoven, S. Comparing seasonal dynamics of the Lake Huron zooplankton community between 1983–1984 and 2007 and revisiting the impact of Bythotrephes planktivory. J. Great Lakes Res. 2012, 38, 451–462. [Google Scholar] [CrossRef]
- Yan, N.; Blukacz, A.; Sprules, G.; Kindy, P.; Hackett, D.; Girard, R.; Clark, B. Changes in zooplankton and the phenology of the spiny water flea, Bythotrephes, following its invasion of Harp Lake, Ontario, Canada. Can. J. Fish. Aquat. Sci. 2001, 58, 2341–2350. [Google Scholar] [CrossRef]
- Kerfoot, W.; Hobmeier, M.; Yousef, F.; Lafrancois, B.; Maki, R.; Hirsch, J. A plague of waterfleas (Bythotrephes): Impacts on microcrustacean community structure, seasonal biomass, and secondary production in a large inland-lake complex. Biol. Invasions 2016, 18, 1121–1145. [Google Scholar] [CrossRef]
Figure 1.
Map of Lake Champlain displaying all LTM sampling locations labeled by station number, with the four stations where the zooplankton samples were collected and used in data analysis represented as colored points. Blue points represent deep stations, and red points represent shallow stations.

Figure 2.
Map series of Lake Champlain displaying all LTM sampling locations where Cercopagidae were sampled during the initial detection of Bythotrephes longimanus.
Figure 2.
Map series of Lake Champlain displaying all LTM sampling locations where Cercopagidae were sampled during the initial detection of Bythotrephes longimanus.

Figure 3.
Map series of Lake Champlain displaying all LTM sampling locations where Cercopagidae were sampled during the initial detection of Cercopagis pengoi.
Figure 3.
Map series of Lake Champlain displaying all LTM sampling locations where Cercopagidae were sampled during the initial detection of Cercopagis pengoi.

Figure 4.
Seasonal density of predatory cladocerans at deep stations in all study years.

Figure 5.
Shallow stations seasonal density of predatory cladocerans in all study years.

Figure 6.
Seasonal deep station density of Daphnia retrocurva compared to Bythotrephes longimanus and Cercopagis pengoi in all study years. The black arrow denotes the time when a Cercopagidae was first detected (B. longimanus 2014, C. pengoi 2018).
Figure 6.
Seasonal deep station density of Daphnia retrocurva compared to Bythotrephes longimanus and Cercopagis pengoi in all study years. The black arrow denotes the time when a Cercopagidae was first detected (B. longimanus 2014, C. pengoi 2018).

Figure 7.
Seasonal deep station density of Diacyclops thomasi compared to Bythotrephes longimanus and Cercopagis pengoi in all study years. The black arrow denotes the time when a Cercopagidae was first detected (B. longimanus 2014, C. pengoi 2018).
Figure 7.
Seasonal deep station density of Diacyclops thomasi compared to Bythotrephes longimanus and Cercopagis pengoi in all study years. The black arrow denotes the time when a Cercopagidae was first detected (B. longimanus 2014, C. pengoi 2018).

Figure 8.
Seasonal deep station density of Conochilus spp. compared to Bythotrephes longimanus and Cercopagis pengoi in all study years. The black arrow denotes the time when a Cercopagidae was first detected (B. longimanus 2014, C. pengoi 2018).
Figure 8.
Seasonal deep station density of Conochilus spp. compared to Bythotrephes longimanus and Cercopagis pengoi in all study years. The black arrow denotes the time when a Cercopagidae was first detected (B. longimanus 2014, C. pengoi 2018).

Figure 9.
NMDS ordinations of zooplankton samples for both deep station and shallow station data. Color of points denotes the time range the sample was taken. The species abbreviations are as follows: AsGa (Ascomorpha/Gastropus spp.), Aspl (Asplanchna spp.), Bosm (Bosmina longirostris), Cono (Conochilus spp.), Diac (Diacyclops thomasi), Diap (Diaptomidae), Dmen (Daphnia mendotae), Dret (Daphnia retrocurva), Meso (Mesocyclops edax), Poly (Polyarthra spp.), Kcoc (Keratella cochlearis), and Kell (Kellicottia spp.).

Figure 10.
NMDS ordination of zooplankton samples where point size is based on density of Daphnia retrocurva found in the sample. Color of points denotes the month the sample was taken. Left column panels contain data from deep stations and the right column panels contain data from shallow stations. Data points were separated into three panels to reduce visual clutter and contain samples from two consecutive months. Environmental variables are Leptodora kindtii, Bythotrephes longimanus (Spiny), Cercopagis pengoi (Fishhook), nitrogen (N), and Secchi depth (Secchi).

Figure 11.
NMDS ordination of zooplankton samples where point size is based on density of Diacyclops thomasi found in the sample. Color of points denotes the month the sample was taken. Left column panels contain data from deep stations, and the right column panels contain data from shallow stations. Data points were separated into three panels to reduce visual clutter and contain samples from two consecutive months. Environmental variables are Leptodora kindtii, Bythotrephes longimanus (Spiny), Cercopagis pengoi (Fishhook), nitrogen (N), and Secchi depth (Secchi).

Figure 12.
NMDS ordination of zooplankton samples where point size is based on density of Conochilus spp. found in the sample. Color of points denotes the month the sample was taken. Left column panels contain data from deep stations, and the right column panels contain data from shallow stations. Data points were separated into three panels to reduce visual clutter and contain samples from two consecutive months. Environmental variables are Leptodora kindtii, Bythotrephes longimanus (Spiny), Cercopagis pengoi (Fishhook), nitrogen (N), and Secchi depth (Secchi).


Table 1.
Results of Kendall’s w statistic for species rank order by month comparing reference species rank order (2013) to Spiny invasion years (2014–2015) and Fishhook invasion years (2018–2019). p values less than 0.05 indicate that the rank order of species was not similar across the reference and invasion samples. Bold results indicate significance at the 0.05 confidence level.
| Station | Month | Fishhook Impact | Spiny Impact |
|---|---|---|---|
| 4 | July | 0.672 | 0.965 |
| August | 0.029 | 0.242 | |
| September | 0.854 | 0.107 | |
| 19 | July | 0.313 | 0.864 |
| August | 0.031 | 0.934 | |
| September | 0.134 | 0.016 | |
| 36 | July | 0.429 | 0.168 |
| August | 0.902 | 0.221 | |
| September | 0.022 | 0.302 | |
| 50 | July | 0.051 | 0.281 |
| August | 0.012 | 0.008 | |
| September | 0.082 | 0.005 |
Disclaimer/Publisher’s Note: The statements, opinions and data contained in all publications are solely those of the individual author(s) and contributor(s) and not of MDPI and/or the editor(s). MDPI and/or the editor(s) disclaim responsibility for any injury to people or property resulting from any ideas, methods, instructions or products referred to in the content. |
© 2023 by the authors. Licensee MDPI, Basel, Switzerland. This article is an open access article distributed under the terms and conditions of the Creative Commons Attribution (CC BY) license (https://creativecommons.org/licenses/by/4.0/).
Share and Cite
MDPI and ACS Style
Cutter, Z.A.; Mihuc, T.B.; Myers, L.W. Invasion of Bythotrephes longimanus and Cercopagis pengoi in Lake Champlain: Impacts on the Native Zooplankton Community. Diversity 2023, 15, 1112. https://doi.org/10.3390/d15111112
AMA Style
Cutter ZA, Mihuc TB, Myers LW. Invasion of Bythotrephes longimanus and Cercopagis pengoi in Lake Champlain: Impacts on the Native Zooplankton Community. Diversity. 2023; 15(11):1112. https://doi.org/10.3390/d15111112
Chicago/Turabian StyleCutter, Zachary A., Timothy B. Mihuc, and Luke W. Myers. 2023. "Invasion of Bythotrephes longimanus and Cercopagis pengoi in Lake Champlain: Impacts on the Native Zooplankton Community" Diversity 15, no. 11: 1112. https://doi.org/10.3390/d15111112
Note that from the first issue of 2016, this journal uses article numbers instead of page numbers. See further details here.