
Biomonitoring for Watershed Protection from a Multiscale Land-Use Perspective
by
 , ,
, ,
Kaline de Mello
1,*, 
Ricardo Hideo Taniwaki
2,
Diego Rodrigues Macedo
3,
Cecília Gontijo Leal
4 and
Timothy O. Randhir
5 1
Research Institute for the Environment and Livelihoods, Charles Darwin University, Ellengowan Drive, Casuarina, NT 0810, Australia
2
Center for Engineering, Modelling and Applied Social Sciences, Federal University of ABC, 5001 Av. Dos Estados, Santo Andre 09210-580, SP, Brazil
3
Department of Geography, Institute of Geosciences, Federal University of Minas Gerais, 6627 Av. Antônio Carlos, Belo Horizonte 31270-901, MG, Brazil
4
Lancaster Environment Centre, Lancaster University, Lancaster LA1 4YQ, UK
5
Department of Environmental Conservation, College of Natural Sciences, University of Massachusetts, 160 Holdsworth Way, Holdsworth Hall, Amherst, MA 01003, USA
*
Author to whom correspondence should be addressed.
Diversity 2023, 15(5), 636; https://doi.org/10.3390/d15050636
Submission received: 4 March 2023
/
Revised: 4 May 2023
/
Accepted: 4 May 2023
/
Published: 8 May 2023
(This article belongs to the Special Issue Biomonitoring of Freshwater Ecosystems)
Abstract
:The types and intensification of land use in the watershed affect the living organisms in aquatic ecosystems differently; this impact will also vary according to temporal and spatial scales. Understanding these interactions is crucial in the design of biomonitoring programs to detect the effect of different pollutants in freshwater ecosystems and improve watershed management and conservation strategies. Therefore, this paper qualitatively reviews biomonitoring studies in freshwater ecosystems to evaluate the impact of different land use types on multiple scales in watersheds. The paper is organized into four sections. The first section presents biomonitoring in different freshwater systems (streams, rivers, lakes, and reservoirs). In the second section, we describe the biomonitoring characteristics of the main land use types. In the third section, we explain how spatial and temporal scales affect biomonitoring. Finally, in the fourth section, we focus on biomonitoring planning and future prediction and discuss how to design biomonitoring programs and how to use models and eDNA in biomonitoring. Our review will assist in decision-making regarding biomonitoring programs in watersheds and will guide future studies on the different bioindicators for various land use types in diverse ecosystems worldwide.
1. Introduction
Human activities have significantly altered freshwater ecosystems worldwide [1], affecting flow regimes, freshwater biodiversity, water quality, and water security [2,3,4,5,6]. Pollutant accumulation patterns in freshwater ecosystems are influenced by land use and land cover in the catchment areas [7]. The type and intensity of land use in the riparian zone and/or in the watershed will affect aquatic organisms differently, according to temporal and spatial scales [8,9]. Biomonitoring is thus essential to assess the state and health of water bodies and to improve watershed management [3,10]. It is also used to record their improvements following management or restoration actions.
Land use changes affect the physical, biological, and chemical linkages between watercourses, the riparian system, and the surrounding watershed. The impacts are far-reaching for many processes, such as nutrient cycling, food webs, streamflow, runoff, and sedimentation, affecting the aquatic biota [11,12]. In addition, the chemical compounds associated with land use can accumulate in the environment and in the tissues of living organisms [7]. Biomonitoring can thus be used at a watershed scale to evaluate diffuse pollution from different land use types [13], to assess pollution from specific activities such as industrial production or mining [14], or to monitor river conditions after environmental disasters such as the collapse of a mining dam [15] or oil spills in rivers [16].
Different biological groups are used in freshwater ecosystem biomonitoring programs due to species differences in terms of their sensitivity to pollution and response time to contamination [17]. The various assemblages used include: cyanobacteria, diatoms, and microbial communities [15,17,18,19]; fungal communities [20]; biofilms [14]; phytoplankton [21]; algae [13]; zooplankton [16,22]; macroinvertebrates [7,23,24]; fish [25,26,27]. For example, microbial communities may respond to sudden disturbances by exhibiting resilience, enabling rapid recovery toward pre-existing ecosystem functions [15,18]. Due to the relatively short life cycles of zooplankton organisms, these communities respond quickly to environmental changes of both natural and anthropogenic origin [22]. Macroinvertebrates are recognized as one of the most suitable organisms for biomonitoring as they have low mobility, display a wide range of responses to contaminants, and are in contact with both sediments and the water column, thereby being exposed to pollutants in both compartments [10]. Fish are also widely used in biomonitoring, due to their ease of collection and identification, quick responses to environmental changes, representativeness in the trophic chain, and presence in different aquatic habitats [28]. The choice of which biological group to monitor depends on the pollution source and the system being evaluated. Therefore, it is crucial to consider the differences between the impacts of each contaminant on each taxon [20].
Systematic biomonitoring is essential for assessing pollution status, determining contaminant sources, and evaluating the remediation outcomes of pollutants in watersheds [29]. For that purpose, in addition to choosing the best biological groups to monitor, biomonitoring programs should be designed that consider spatial and temporal scales [8,30]; they should also be cost-effective, ecologically relevant, sensitive, and standardized [31]. Models and new techniques, such as the advent of environmental DNA (eDNA) metabarcoding, are increasingly being used to evaluate and predict the impacts of land use on aquatic biota [5,32]. These new methods are capable of handling the lack of data and the difficulties of field sampling when upscaling biomonitoring to a global scale [33].
In this paper, we review biomonitoring in freshwater ecosystems to evaluate the impacts of different land use types at multiple scales on aquatic biota. For this purpose, we collected relevant academic publications from Scopus and the Web of Science databases. We prioritized articles published in English over the last ten years but included essential papers that had been published prior to that period. Our intention was not to generate a quantitative review of biomonitoring in watersheds but to focus on pertinent examples illustrating the general patterns, main stressors, indicators, types of impacts, scale effects, potentials, and gaps in biomonitoring in watersheds. The paper is organized into four sections. First, we describe the process of biomonitoring in different freshwater systems (streams, rivers, lakes, and reservoirs). Second, we describe biomonitoring characteristics for the main land use types. Third, we elaborate on how spatial and temporal scales affect biomonitoring. Finally, we discuss biomonitoring planning and future predictions, explaining how to design biomonitoring programs and use models and eDNA in biomonitoring. This review will facilitate decision-making regarding biomonitoring programs in watersheds and guide future studies about the different bioindicators for various land use types in diverse ecosystems worldwide.
2. Biomonitoring in Different Freshwater Systems
2.1. Streams and Rivers
When biomonitoring lotic ecosystems such as streams and rivers, one needs to consider, among several stressors, the effects of precipitation in the streamflow, which is one of the most critical components in controlling fluvial ecosystem structure and function [34,35], due to the convergence of the flow of matter and energy in the watershed. Other peculiarities of these environments that are relevant to biomonitoring programs are: (i) a strong connection to adjacent landscapes, whereby the aquatic communities also reflect impacts from terrestrial ecosystems [36,37]; (ii) the quality, quantity, and frequency of the inputs of organic matter from the riparian zone and adjacent landscapes, which influence the lotic ecosystems’ organisms [38,39,40]; (iii) the hydrological and geochemical characteristics of the watershed influence the biological communities found in lotic ecosystems [41]. Therefore, biomonitoring programs in streams and rivers largely depend on local and regional characteristics because of climate, land use patterns, and physical characteristics that affect their flow.
Rivers are transitional systems, changing from small, shallow, flashy first-order streams that are closely connected to the landscape to large, relatively deep, and steady rivers that may be tidally influenced as they become estuarine near their outlets [42]. For biomonitoring programs, it is thus necessary to consider the order or the streamflow and the interplay between light, nutrients, and turbulent energy and circulation structures in the biotic community, which changes along the river from the sources to the mouth.
Multimetric indices (see Section 5.2) have previously been applied in large-scale biomonitoring programs to assess the different anthropogenic stressors related to different climates, biogeography zones, geology features, and relief characteristics. Such indices incorporate taxonomic richness, assemblage composition, and functional feeding groups, among other biological responses [43,44]. An example of the use of large-scale multimetric indices is the National Rivers and Streams Assessment (NRSA), which provides information on the ecological condition of the rivers and streams on both ecoregional and national scales in the United States. It is based on a statistically valid survey design that samples a representative set of rivers and streams across the country. The goal of the NRSA is to provide information on the ecological condition of rivers and streams, identify the trends and stressors that impact their health, and guide actions to improve and protect them.
Another large-scale biomonitoring program is the European Union Water Framework Directive (WFD), which monitors streams and rivers with the aim of reducing water pollution. WFD follows an integrative assessment methodology for evaluating the ecological status of water bodies, forcing a re-orientation of existing monitoring procedures toward an integrative type- and reference-specific approach [45], which will be discussed in Section 5.2.
2.2. Lakes and Reservoirs
The biomonitoring of lentic systems such as lakes and reservoirs remains critical since sediment accumulation and contaminant loading can influence aquatic habitat conditions. A common characteristic of natural lakes and the man-made impoundments of streams is that they can easily become eutrophic due to the increased input of substances [46].
Aquatic ecosystems with high organismal diversity respond to the impacts of water quality on biological and ecological traits through habitat pressures [47]. Vertebrates, macroinvertebrates, phytoplankton, zooplankton, cyanobacteria, and macrophytes are commonly used as bioindicators in lakes and reservoirs [19,25,48,49,50]. The integrative use of biotic indices and ecotoxicological endpoints can allow the determination of water quality and ecological status [51]. In addition, the fish size spectrum can provide information on responses to environmental changes and management efficiency [52]. Aquatic macroinvertebrates are primarily used in water-quality assessment in lakes and reservoirs because of specific life-history traits and ecology (e.g., limited mobility, relatively long lifespans, and a broad tolerance range); these assessments include saprobic (organismal capacity), diversity (richness, uniformity, and abundance), and biotic (ecological sensitivity) approaches [50,53]. Macroinvertebrate assemblages also experience multiple pressures, depending on the lake zones (littoral and profundal habitats), which influence the choice of biomonitoring tools [54].
Lake and reservoir biomonitoring has its own challenges in sampling, related to biogeographical and spatial variations in their chemical and physical properties [54]. Changes along the water column, especially solar incidence, oxygenation, and the nature of stratification, are critical dimensions of biomonitoring design in lakes and reservoirs. Differing methods that characterize each lake habitat zone [54] are suggested to capture variability in lake characteristics. Bioindicators and sampling design can be defined to match the habitat zones (e.g., littoral or limnetic, photic or aphotic, and epilimnion or hypolimnion) of reservoirs and lakes. Variables selected for biomonitoring, in general, should be of societal relevance, sensitive to environmental stresses, low in uncertainty, cost-effective, and have minimal ecological impacts [55].
3. Biomonitoring the Effects of Different Land Uses on Freshwater Ecosystems
In this section, we describe the main physical and chemical stressors affecting freshwater ecosystems, according to each land use type (Table 1), along with their biological responses, and present the main monitoring techniques that can be used to capture these responses.
3.1. Agriculture
The main stressors related to agriculture are the ones pertaining to sedimentation due to heavy machinery use, agricultural practices, agrochemicals from fertilization, and pest control [7,8,20]. Chemical pesticides persist in freshwater ecosystems for many years, causing impacts on non-target organisms [27]. Another stressor is represented by the increased temperature range due to deforestation, especially in the riparian zones of agricultural watersheds [56]. The single and combined effects of these stressors are related to shifts in aquatic biodiversity and processes [57,58,59]. The intensity, type of agricultural management, and the riparian conservation status will also influence how these stressors impact aquatic biodiversity [8].
Most biomonitoring tools that have been used to detect the impacts of agricultural practices on freshwater biodiversity are related to benthic invertebrates, benthic algae, and fishes. The macroinvertebrate community has been helpful in successfully detecting the effects of pesticide contamination in freshwater systems, especially in streams [60,61,62]. They also respond clearly to sedimentation and eutrophication in streams impacted by agricultural activities [63,64]. However, in most cases, it is very difficult to relate the shifts in community composition to specific stressors because there are often several stressors interacting at the same time in freshwater ecosystems [65]. Modules such as the saprobic and general degradation indices are used in some countries to assess the status of aquatic ecosystems [66].
Another biological community that has been very useful in detecting agricultural impacts in freshwater ecosystems is the benthic algae community, also called the periphyton. Being primary producers, this community can be very sensitive to nutrient enrichment and herbicide contamination in freshwater ecosystems. For example, the periphytic community successfully responded to the single and combined effects of sedimentation, nutrient addition, and warming in the stream mesocosm [59]. This community also responded to herbicide contamination [67] and agricultural pollution in large rivers [68]. However, other natural stressors can override anthropogenic stressor responses in benthic algae. For example, in the tropics, intense rains can modulate the benthic algae community because of the resulting elevated streamflow, overriding the effects of eutrophication and herbicide contamination [69,70].
Compared to benthic algae and macroinvertebrates, fish are used less widely for biomonitoring agricultural impacts. Some studies indicate that depending on the community structure of this group (e.g., the dominance of omnivores), they might not represent the local environmental conditions [71]. In addition, fish have a greater ability to move around and avoid harsh environmental conditions, compared with benthic algae and macroinvertebrates and, therefore, are less susceptible to agricultural impacts on a local scale.
3.2. Urban and Industry
Urban areas, including industrial regions, are the major sources of metal pollution [14,29,32] and many other pollutants, such as dissolved nutrients, pharmaceuticals, and personal care products (PPCPs), through industrial effluents and domestic wastewater [72,73,74,75]. The primary pollutants in domestic effluents are related to organic load, which enriches the water with nutrients and facilitates saprobity increases and eutrophication. Usually, this process is indicated by an increase in nitrogen and phosphorus concentrations, an increase in turbidity and the presence of suspended solids, and increased microbiological activity, which leads to a reduction in dissolved oxygen concentrations [76]. In addition, precipitation flowing over impervious surfaces transfers a complex mixture of contaminants to streams and water bodies. Metals, polycyclic aromatic hydrocarbons (PAH), pesticides, and other pollutants emitted by urban activities are washed from streets and parking lots or leached from roofs, along with other construction material, by stormwater runoff and are subsequently carried into aquatic ecosystems [75]. Industrial effluents, on the other hand, include all kinds of elements linked to industrial activity, especially heavy metals (e.g., As, Cd, Pb, Ni, Co, Hg, and Ag) that limit the presence of and development of sensitive organisms [77].
Countries in the Global South suffer more intensely from urban and industrial pollution than developed countries, where the problem of punctual loads has already been overcome in most cases through the implementation of effluent collection and treatment systems [78] and, to some extent, the recovery of watercourses [79]. However, even in areas with wastewater treatment, this process could be deficient in removing specific pollutants via conventional treatment, such as pharmaceutical compounds, heavy metals, and microplastics [78]. In this way, the countries of the Global North have major problems in urban areas that are linked to diffuse runoff, which is difficult to control, and this can be related to all types of pollutants present on the surface [76,77].
Due to the extensive range of pollutant types, biomonitoring based on biological metrics such as taxa richness, diversity, and abundance is effective for environmental monitoring in urban landscapes. Therefore, various biological groups have been used in urban biomonitoring abroad, including benthic macroinvertebrates, algae, diatoms, fish, and zooplankton [28]. Within this perspective, the before–after control–impact (BACI) approach is generally focused on taxonomic composition and diversity indices and is used in urbanized areas to identify changes between pre-intervention periods in point pollution sources—especially sewage in a post-intervention situation, where, in general, punctual pollution inputs are predominant against diffuse sources [80,81]. In recent years, studies have shown that urban areas are important sources and dispersers of microplastics in the environment that can be incorporated into organic tissues. Microplastics are considered a pollutant of significant impact but they are difficult to detect and control [82].
Currently, biomonitoring programs in urban landscapes also adopt citizen science [83]. The idea is to replicate simplified monitoring methodologies in such a way that people with a basic level of training can perform them. Examples in urban areas showed that the qualitative analysis carried out with macroinvertebrate data collected by citizens (i.e., taxonomic richness) was fairly similar to data analyzed in the laboratory by specialists [83,84].
3.3. Mining
Mining activities are a substantial source of pollution worldwide, causing considerable disturbances in aquatic ecosystems, especially regarding metal contamination [10,15]. Furthermore, the waste from mineral processes returns several pollutants to the environment, especially metals from the mined matrix, in much higher concentrations than are naturally available. Therefore, the primary approach currently used in biomonitoring mining areas is to monitor metal bioaccumulation, in which aquatic organisms incorporate metals into their tissues through the trophic chain and via respiration [85]. Thus, it is possible to use these biological and ecological traits to determine the contamination of specific elements in sediment or the water column [86].
Reflecting the importance of evaluating mining areas, several studies focus on assessing impacts from mining tailings and, in critical cases, the impacts associated with the failure of containment dams. In this sense, the 2015 Fundão dam rupture (Minas Gerais, Brazil), which released about 60 million cubic meters of mine tailings that reached the Doce River basin (Southeastern Brazil), has prompted several studies with efficient approaches related to the use of biological indicators. For example, studies carried out after dam failures have used a functional approach based on the assemblage taxa presence. The authors of [87] identified 12 species of fish most suitable for monitoring, while another study [88] used DNA metabarcoding to identify microbial communities affected by tailing remnants in the water column and sediment. In addition, there are studies focused on the bioaccumulation of metals at high rates in fish tissues [89,90] and in shrimp [91], showing that dam tailing effects continue to impact the Doce River and its estuary.
3.4. Forestry
Forestry activities generally show lower impacts in freshwater ecosystems when compared to agricultural activities or pasturelands because of the longer harvest cycles. However, the magnitude of their effects also depends on management practices. Harvesting represents the biggest impact on forestry activities due to catchment hydrology changes (as a result of harvesting) and the use of heavy machinery to remove the logs, which may increase sediment inputs in freshwater ecosystems [92,93]. If clear-fell logging is adopted, changes in stream invertebrates can be observed, primarily because of the changes in streamflow during rain events, which scour the streambed and alter the benthic community [94]. A study analyzing the adoption of best management practices (including soil and water conservation practices, other management techniques, and social actions that are developed in agricultural areas aiming at environmental protection; see [95]) on freshwater ecosystems has demonstrated their positive effects on macroinvertebrate communities and water chemistry [96]. Another study has demonstrated that despite their effect on water quality, forestry practices do not affect biological communities in forest plantations that adopt best management practices [97]. However, selective logging in tropical forests affects both the instream habitat [98] and fish fauna of small streams, with the latter showing little recovery eight years after the logging event [99]. Therefore, biomonitoring programs to detect the impacts of forestry should take into account management practices in the catchment.
3.5. Pasture
Pasturelands are generally dominated by grass and the presence of grazing animals, which may or may not have access to freshwater ecosystems for watering. The impacts of pasture on streams are similar to those related to agricultural practices, including the fertilization and sedimentation caused by soil compaction by grazing animals. Those effects should be more pronounced when pastures are intensively managed and watershed physical conditions are unfavorable (e.g., high slopes or inappropriate soil types) [100]. When animals can reach freshwater ecosystems, contamination by fecal coliforms is of concern, increasing the inputs of organic matter and nitrogen compounds. Because of the similarities between pasturelands and agricultural fields, studies developing tools for pasture biomonitoring are less common than for other land uses but are no less important, especially when manure contamination is present. Studies comparing freshwater communities in pasturelands and other land uses have found significant differences in community composition [101]. Still, most were not specific enough to analyze pasture management’s impacts in depth. In the case of pasture, using bacterial communities as bioindicators has been useful in detecting pasturelands’ effects on freshwater ecosystems [102]. Biomonitoring studies in pasturelands should focus on detecting changes in the biological communities as a result of changes in the riparian vegetation (due to the access of cattle to the area), changes in the organic matter inputs (due to the inputs of feces and urine), which can change the microbial communities and biogeochemical cycles, and changes in the stream structure as a result of sedimentation and cattle trampling in the watercourses of streams and rivers.
4. Multiscale Perspective of Biomonitoring
Biomonitoring requires a multiscale approach because biological responses to changes in the freshwater environment vary across space and time [103]. In addition, because of the connected nature of freshwater ecosystems, they can be affected by different stressors in different ways throughout the watershed [104,105]. Nevertheless, monitoring across meaningful spatiotemporal dimensions is often challenging because of logistical and financial constraints and our limited understanding of how freshwater ecosystems respond to anthropogenic impacts.
Accounting for appropriate spatial and temporal scales is critical to monitor freshwater ecosystem conditions effectively. However, these dimensions are often a trade-off in terms of biomonitoring: either small areas are monitored over a long period, or the opposite occurs. A failure to consider the relevant spatial and temporal scales hampers accurately capturing the changes to freshwater ecosystems. This may lead to the conclusion that there has been no impact or that it is of a lower magnitude [103]. Biomonitoring over time is important to disentangle biotic responses to impact from their natural seasonal variations, which can interfere with interpreting the results. The duration also needs to be long enough to capture both the short- and long-term responses of freshwater species to stressors (Figure 1). Responses to disturbances can initially be subtle or absent and may take a long time to fully manifest, due to time lags between the impact and the appearance of changes in biological assemblages [103,106]. However, it is often unclear how much time is needed for biomonitoring to capture these short- and long-term changes. This is because of our insufficient knowledge about freshwater ecosystems and the fact that different organisms respond differently to distinct stressors over time. Both between and within taxonomic groups, species can vary in their tolerance to anthropogenic impacts. Moreover, short-cycle species (e.g., macroinvertebrates) can manifest changes more quickly than those that live for several years (e.g., fish).
Ideally, biomonitoring should take place before the impact and the follow-up from that point on, a design known as before–after control–impact (BACI) [107]. The BACI design is considered one of the best for environmental monitoring and requires that (i) the impact has not occurred before the monitoring starts, (ii) the timing and location where the impact will happen is known, and (iii) that undisturbed control sites are available for comparison. However, assumptions (i) and (ii) are not often the case when monitoring, for instance, non-point source pollution in freshwater ecosystems (e.g., groundwater contamination, agricultural land use, or the long-distance atmospheric transport of particles). Another challenge with BACI is in finding comparable control or undisturbed sites in the study area. For that reason, minimally or the least disturbed sites are often used to represent a reference condition or benchmark site for the wider region. Such regional reference sites should typify the landscape (e.g., soil, vegetation type, the land’s surface form, etc.) and local (e.g., flow, substrate, channel gradient, etc.) characteristics of the impacted sites for which they will act as the controls [45] The reference condition approach (RCA) offers an alternative to BACI that is often applied in the national monitoring of freshwater ecosystems (e.g., RIVPACS, AusRivAS-ACT, and NARS) [108,109]. It assumes that the impact has already happened and that the timing and location are not necessarily known, and usually uses regional reference sites as the control (see Section 5.2).
To what extent biomonitoring should be conducted to evaluate the impacts of different stressors is more complex and unclear. Freshwater ecosystems are connected to each other and to the environment around them through multiple pathways: laterally (i.e., exchanges between the channel and riparian area/floodplain), longitudinally (i.e., up- and downstream connections from headwaters to estuaries), and vertically (i.e., links between the atmosphere, channel surface, and groundwater) [110]. This means that the consequences of anthropogenic activities can span farther distances in the watershed [111]. For the biota, this can be amplified by metacommunity dynamics occurring at much greater distances [112,113]. Not accounting for the complex and multidimensional hydrological connections of freshwater ecosystems can result in poor or biased biomonitoring. Watershed-level biomonitoring is often recommended; however, for practical reasons, it is often constrained to the reach scale [103]. Accounting for entire river basins can be complex in large systems, both in terms of logistics and also the confounding effects of the cumulative and interactive consequences of unknown stressors that might take place.
Large-scale and long-term biomonitoring is paramount for providing a good overview of river health worldwide and understanding the impacts of issues such as climate and land-use change [43]. However, global monitoring programs do not exist. Initiatives are, at most, national or multinational but are primarily regional or catchment-wide. Moreover, regular and long-term monitoring is mainly restricted to Global North countries, due to local legislation [79]. The most notable examples are in the United States [114], the European Union [115], New Zealand [116], and South Korea [117]. In other places, biomonitoring usually follows up from a specific event with an impact, cases in which there are not always proper pre- and post-impact assessments [79]. Attempts to combine information from regional assessments to perform a global overview of freshwater conditions face multiple challenges, including different experimental designs, sampling methods, and indicators, as well as the uneven knowledge of freshwater biodiversity in many countries. Therefore, establishing wide-ranging monitoring networks, standardized sampling protocols, and reporting systems, and investing in assessments in understudied regions is essential.
5. Planning Strategies and Future Predictions
5.1. How to Design Biomonitoring Programs
Designing and implementing biomonitoring programs is a challenging endeavor undertaken by many agencies, NGOs, universities, research institutes, and citizen groups worldwide [118]. However, many monitoring programs fail to deliver helpful information for various reasons, including technical issues (e.g., with sampling design and data analysis) [118].
As discussed before, an effective biomonitoring program for watersheds must consider choosing the best biological groups to monitor and must also consider the spatiotemporal variation of multiple trophic levels to understand the underlying dynamics of both biodiversity patterns and food-web characteristics [30]. To be effective, first, it is essential to have a clear question that must be answered with the biomonitoring program. Second, a good monitoring design is critical, setting out the data collection sites and taxonomic groups to be collected. For example, bacterial groups can be helpful in detecting short-term effects, while aquatic insects and fishes can be useful in detecting long-term effects. The authors of [119] recommend using at least two taxonomic groups for bioassessment programs of streams and rivers. Several studies that have compared assemblage-specific indices with regard to their sensitivity in identifying the major stressors of a particular study area suggest that multiple assemblages are needed to accurately assess water and habitat quality [26].
The authors of [118] proposed a ten-step roadmap for designing and implementing a monitoring program, comprising four general phases:
1. Frame the problem, clarify the objectives, develop a conceptual model of the system, and identify possible management actions;
2. Design the monitoring process, including the data collection, analysis, and management components. This step entails first deciding whether monitoring is even required;
3. Implement the monitoring and learn from the data; inform decision-making;
4. Learn to improve the monitoring process; incorporate new tools and system information, and revise the objectives, design, and methods, as appropriate.
5.2. The Use of Models in Biomonitoring
The need for implementing biomonitoring programs at different spatial and temporal scales, combined with the fact that many regions worldwide have scarce or absent reference sites and biomonitoring stations, has fostered the development of alternative methods as predictive models [5,120,121,122,123]. Predictive models are generally based on the reference condition approach (RCA), using the best-known environmental state based on the physical, chemical, and biological habitat [124]. The expected natural biological pattern without human disturbance conditions is used to establish which environmental features best differentiate the biological groups obtained. After the given model is built, it is possible to predict biological conditions in non-sampled areas and measure how much these areas “deviate” from natural conditions by comparing the observed taxa with the expected taxa, providing a measure of the impairment level of a site that results in an observed/expected index (O/E index).
The O/E index is used by nationals’ biomonitoring schemes [79,120] abroad, such as the O/E of taxa loss in the USA, the British river prediction and classification system (RIVPACS), and the Australian river assessment system (AUSRIVAS). The US and British approaches use the following schema: E is the sum of probabilities of occurrence in a macroinvertebrate sample of those taxa with a predicted probability above a specified value (commonly 0.5), and O is the number of those taxa recorded in the sample. The O/E index, used by AUSRIVAS and similar bioassessment methods such as RIVPACS, combines two variables, namely, the predicted probability that a taxon will occur in a sample under reference conditions (a continuous variable ranging from 0 to 1) and the detection or non-detection of a taxon on a sample (a binary variable with values of 0 or 1). These tools were developed using macroinvertebrate assemblages; however, some studies also developed this approach to fish and diatoms [122].
Besides national biomonitoring programs, several studies based on the expected/observed approach have been conducted worldwide [79,122]. This approach is especially helpful for predicting species distribution over large, unsampled areas and reducing sampling costs in Latin America and Africa [121,125]. Effective habitat models need to be simple, robust, and, at the same time, biologically meaningful [125]. However, inadequate procedures, such as variable reference-site status, inappropriate model predictors, inconstant sampling methods, and the neglect of non-seasonal temporal variability resulted in poor performance in AUSRIVAS and RIVPACS studies [120].
Artificial intelligence models have been applied as predictive modeling to support the development of a standard habitat assessment protocol that links organisms and habitat information to environmental data [122,125,126]. The authors of [125] used generalized additive models (GAMs), and classification trees (CTs), combined with genetic algorithms (GA), to identify biological determinants in the context of macroinvertebrate groups and environmental parameters in the Gilgel Gibe watershed, Ethiopia. Another study [126] used classification and regression tree models (CART) and ordination analysis to identify the important variables affecting macroinvertebrate community patterns in the Lake Tana watershed, which is also in Ethiopia. The authors of [127] developed a Hydra model for Portuguese streams using support vector machines (SVM), multi-layer perceptron, and the k-nearest neighbor (KNN) algorithm to predict the taxa expected at a stream reach, using a similar RIVPACS classification. Another robust technique uses boosted regression trees (BRT), which are used by the authors of [123] for developing predictive models based on regional (land use and land cover assessment) and local (nutrients, habitat, and contaminants) stressors in the USA. In Amazonian streams, structural equation models (SEM) were helpful in predicting anthropogenic stressors on fish assemblages [128]. The authors of [32] applied multiple regression models in urban areas in the US using density maps values and land use at the sampling sites as candidate predictor variables, with heavy metals measurements as the response variables. The trained models were subsequently used to make spatially continuous predictions regarding the relative concentrations of each pollutant across the entire study area. Regardless of their mathematical formulations, these models allow the assessment of anthropic disturbances on the watershed scale as predictors of biological responses, as represented by metrics (e.g., taxonomic richness, tolerance, multimetric indices, and traits), taking into account the effect of natural environmental variations (geodynamic factors), in addition to enabling the prediction of biological responses in unsampled locations [129] or in future scenarios [130].
The multimeric index (MMI) or index of biotic integrity (IBI), elaborated with different biological indicators, yields simpler models that have been applied globally [44,131]. These indexes integrate, into a single measure, the various components of resident organism assemblages (the number of species, dominance, taxonomic composition, trophic groups, mobility, pollution tolerance, etc.) in response to natural environmental variations (also based on the RCA approach; see [124]) and anthropogenic pressures [44]. Metrics address the comparable ecological aspects of a community, regardless of the stressor to which they are responding [45]. For example, the first MMI/IBI for assessing rivers was developed to evaluate the United States’ water condition, as highlighted by the Clean Water Act of 1972 [132]. Studies and national control agencies worldwide have adopted the MMI/IBI [45,133] for use to assess macroinvertebrates, diatoms, and fish [79]. However, it is difficult to identify the metric’s sensitivity to anthropogenic impact because it can also be affected by natural gradients such as altitude, precipitation, and temperature, among others [134]. Therefore, MMIs have generally been developed for ecoregions or river typologies with the same natural conditions. There is a challenge in upscaling this method because of the many interacting pressures and stressors affecting MMI scores, which vary regionally [135,136]. Because it is a very popular approach used on all continents and in several countries, various indices are constructed robustly and then simplified [131]. The first step in MMI approaches is defining the river or lake typification or ecoregional classification a priori. The authors of [44] suggested including an appropriate reference conditions assessment; robust sampling methodology; rigorous statistical procedures; and validation with an independent dataset to improve their applicability. Elsewhere, another study [45] presents a procedure for the development of an MMI with five steps, including metrics selection, the generation of an MMI, setting class boundaries, and the interpretation of results. This “cookbook” was based on experience gained from the European AQEM and STAR projects.
Another national biomonitoring framework that can be simplified and used to assess ecological conditions is the United States Environmental Protection Agency’s biological condition gradient (BCG; see [137]). The BCG is grounded in the concepts of stress ecology. The BCG starts by describing biological conditions in natural or minimally disturbed habitats and the expected changes in biological conditions, mapped along a stressor gradient caused by human-induced environmental changes. The original BCG was developed based on the common patterns of biological responses to stressors, as observed empirically by aquatic biologists and ecologists from different geographic areas in the United States. This approach was also recently used in Kenyan rivers [79].
Watershed modeling, used to evaluate water yield and quality [138], has also been applied to predict the ecological conditions of streams. The authors of [5] used the SWAT model (soil and water assessment tool) to build an eco-hydrological model of an agricultural catchment in Spain. Evaluation of the ecological conditions of the stream network was performed by coupling the outputs of the SWAT model and the regressions between nutrient concentrations and macroinvertebrate-based metrics. Elsewhere, another study [11] proposed a dynamic simulation model using STELLA to study land use and riparian influence on dwarf wedge mussel populations in a mixed land-use watershed in the northeastern USA.
5.3. Environmental DNA
With advances in environmental DNA (eDNA) metabarcoding, studies have quickly demonstrated its vast potential to monitor target taxa and communities on a landscape scale [139]. The eDNA approach is based on isolating DNA from water samples and the subsequent high-throughput sequencing of PCR-amplified DNA barcodes. Selecting suitable PCR primers allows the identification of species from the specific taxonomic groups present in an ecosystem [139].
Metabarcoding techniques allow the parallelized and simultaneous taxonomic identification of many species from a single analyzed eDNA sample [140]. The use of eDNA is especially interesting in tropical and subtropical regions with high biodiversity and a lack of monetary resources available for large-scale biomonitoring, such as the Amazon, Congo, and Mekong River basins [139]. However, these regions lack the genomic reference libraries to identify taxa in eDNA samples [141]. This method allows the identification of biodiversity hotspots that could otherwise be overlooked, enabling the implementation of focused conservation strategies [140].
The use of DNA metabarcoding makes it possible to identify organisms at a more refined taxonomic resolution (e.g., the genus or species) concerning traditional biomonitoring, mainly in groups such as benthic macroinvertebrates [142] and diatom algae [143], when there is previous information from the river where the biomonitoring will take place (i.e., a genomic library). This approach allows the addition of information on the presence and estimated abundance of organisms that are sensitive to certain pollutants, bringing significant advances in biomonitoring [144,145].
The authors of [139] used an eDNA multi-site sampling campaign across Thailand’s 200,000 km2 Chao Phraya River basin to provide key information on fish diversity. The same author assessed the spatiotemporal patterns of multi-trophic (fish, bacteria, and invertebrate) biodiversity and food-web characteristics across the Thur catchment in Switzerland, which covers approximately 700 km2 [30]. In the same watershed, the authors of [140] combined eDNA extracted from stream water samples with models based on hydrological principles (the eDITH framework—eDNA integrating transport and hydrology) to evaluate spatial patterns of aquatic insect diversity. The authors of [146] tested the eDNA to assess eukaryotic biodiversity from the Glatt River catchment in Switzerland for broad spatial scales. Previously, the authors of [31] compared data from eDNA with morphological macroinvertebrate metrics for macroinvertebrates and found the same changes across an environmental gradient in 23 watersheds in Ontario, Canada. The authors of [25] used eDNA to monitor the fish pass system of the Itaipu Hydroelectric Power Plant at the border between Brazil and Paraguay. Elsewhere, the authors of [147] investigated the effects of land use and seasonality on headwater community richness and functional diversity via spatiotemporal dynamics, using both eDNA and traditional sampling. They found that eDNA provided greater spatial and temporal resolution in assessing macroinvertebrate diversity dynamics in the Conwy catchment, north Wales, United Kingdom.
Environmental DNA is a promising tool that allows upscaling of the biomonitoring of complex and large systems and offers a non-invasive method of collecting biodiversity information [30]. However, eDNA implementation on a large scale still faces multiple challenges, including, for instance, problems of taxa detection, depending on the ecology of individual species and seasonal variations. Another critical limitation in highly diverse tropical ecosystems is the lack of comprehensive DNA barcode reference libraries. The current coverage of such reference datasets is highly unequal globally [3,143]. The reference databases need to be continuously fed with additional information on the species that occur in a region [25]. Taxonomy-free eDNA approaches have been proposed to overcome some of these challenges concerning their broad use in biomonitoring [148]. However, they should be considered with caution, given the sensitivity of the results to different bioinformatic treatments and filtering thresholds [141].
5.4. Live-Cell Sensors
Biosensors using intact and functional cells are commonly referred to as live-cell biosensors. Measuring diverse cell attributes such as viability, proliferation, metabolic state, and many others serves as a readout to detect toxic changes in the water sample [149]. The authors of [150] observed that various live-cell biosensors had been developed using native and recombinant cell lines. Live-cell sensors use cell attributes to detect changes in water quality and can be used in developing biological early warning systems or for the online detection of water quality changes [149]. Emerging approaches in the biosensing of multiple pollutants include recombinant microbes, cell immobilization techniques, and live-cell microarrays [149,151].
5.5. Stable Isotopes and Bioaccumulation
More sophisticated approaches have also been employed in biomonitoring, including the use of stable isotopes, the bioaccumulation of heavy metals, and the presence of microplastics in organic tissue.
The analysis of stable isotopes such as carbon (ẟ13C) and nitrogen (ẟ15N) represents an approach that is especially useful in areas that suffer from point source pollution [152,153]. These isotopes are related to the assimilation of carbon and nitrogen in the trophic chain and allow identifying the origins of these elements (i.e., if it comes from anthropic sources, such as sewage, or the ecological processes of nutrient cycling) [153,154]. However, this approach is also interesting for assessing the quality of effluent treatment as observed by the authors of [155] through an analysis of the community of the benthic macroinvertebrates.
Assessment of the bioaccumulation of metals is also used, especially in areas with potential impacts from industrial plants [77] and mining [85]. For example, the authors of [156] recorded lead concentrations higher than 1000 times that expected in algal biomass, suggesting that algal biomass is a very good heavy metal accumulator.
6. Conclusions
This paper provides a comprehensive overview of the key elements of biomonitoring programs for various freshwater systems worldwide. Choosing the right organisms and spatial and temporal scales is crucial to accurately detect the primary impacts resulting from land use and other human activities. An inadequately designed biomonitoring program may fail to identify negative effects, leading to a misinterpretation of the true impact of human activities on the freshwater ecosystem. Thus, it is essential to carefully plan and implement biomonitoring programs to obtain reliable data and ensure the effective management of freshwater resources.
For this purpose, we must consider that lentic and lotic freshwater ecosystems present different physical, chemical, and biological dynamics. Moreover, we must assume that the different taxa have different sensitivities to the diversity of stressors linked to land use and land cover in the watershed and that the stressors are acting at the same time.
The multiscale approach is important because biological responses to changes in the freshwater environment vary across multilevel space and time and can be affected by different stressors in different ways throughout the watershed system. Ideally, biomonitoring should take place before the impact and the follow-up from that point on, a design known as before–after control–impact.
The need for implementing biomonitoring programs at different spatial and temporal scales, combined with the fact that many regions worldwide have scarce information available, is fostering the development of alternative methods such as predictive models, e-DNA metabarcoding, live-cell sensors, stable isotopes, and bioaccumulation.
Finally, we need to integrate biomonitoring with other monitoring data (i.e., water quality and hydrologic dynamics) to understand the anthropogenic stressors affecting the watershed better and identify the most effective management strategies for reducing these stressors’ impacts. Such an understanding is crucial to plan effective measures to reduce the effects of human influences on water resources synergically.
Author Contributions
Conceptualization, K.d.M., R.H.T. and T.O.R.; methodology, K.d.M., R.H.T. and T.O.R.; software, K.d.M.; validation, K.d.M.; formal analysis, K.d.M., R.H.T., C.G.L., D.R.M. and T.O.R.; investigation, K.d.M., R.H.T., C.G.L., D.R.M. and T.O.R.; resources, K.d.M., R.H.T., C.G.L., D.R.M. and T.O.R.; data curation, K.d.M.; writing—original draft preparation, K.d.M., R.H.T., C.G.L., D.R.M. and T.O.R.; writing—review and editing, K.d.M., R.H.T., C.G.L., D.R.M. and T.O.R.; visualization, K.d.M.; supervision, T.O.R.; project administration, K.d.M. and T.O.R.; funding acquisition, K.d.M., R.H.T., C.G.L., D.R.M. and T.O.R. All authors have read and agreed to the published version of the manuscript.
Funding
K.M. was funded by the São Paulo Research Foundation, FAPESP (processes 2021/10125-1 and 2022/03860-0), Charles Darwin University, and CSIRO. R.H.T. was funded by the São Paulo Research Foundation, FAPESP (process 2020/02375-5). D.R.M. was supported by the National Council for Scientific and Technological Development CNPq (process PQ-309763-2020-7) and the Minas Gerais Research Foundation FAPEMIG (processes APQ-00715-22 and APQ-00261-22). C.G.L. was funded by the UKRI Future Leaders Fellowship (MR/W011085/1). Partial support was provided to T.R. by the National Institute of Food and Agriculture, CSREES, the US Department of Agriculture, and Massachusetts Agricultural Experiment Station (MAES), under projects MAS00036, MAS00035, and MAS00045. The partial support given to T.R. from the US National Science Foundation’s grant no. 2120948 under Growing Convergence Research is gratefully acknowledged.
Acknowledgments
We are grateful for the hard work of the three anonymous reviewers who helped to improve the article.
Conflicts of Interest
The authors declare no conflict of interest.
References
- Grill, G.; Lehner, B.; Thieme, M.; Geenen, B.; Tickner, D.; Antonelli, F.; Babu, S.; Borrelli, P.; Cheng, L.; Crochetiere, H.; et al. Mapping the World’s Free-Flowing Rivers. Nature 2019, 569, 215–221. [Google Scholar] [CrossRef] [PubMed]
- Feio, M.J.; Hughes, R.M.; Serra, S.R.Q.; Nichols, S.J.; Kefford, B.J.; Lintermans, M.; Robinson, W.; Odume, O.N.; Callisto, M.; Macedo, D.R.; et al. Fish and Macroinvertebrate Assemblages Reveal Extensive Degradation of the World’s Rivers. Glob. Chang. Biol. 2023, 29, 355–374. [Google Scholar] [CrossRef]
- Li, F.; Zhang, Y.; Altermatt, F.; Zhang, X.; Cai, Y.; Yang, Z. Gap Analysis for DNA-Based Biomonitoring of Aquatic Ecosystems in China. Ecol. Indic. 2022, 137, 108732. [Google Scholar] [CrossRef]
- Ross, E.R.; Randhir, T.O. Effects of Climate and Land Use Changes on Water Quantity and Quality of Coastal Watersheds of Narragansett Bay. Sci. Total Environ. 2022, 807, 151082. [Google Scholar] [CrossRef]
- Vagheei, H.; Laini, A.; Vezza, P.; Palau-Salvador, G.; Boano, F. Ecohydrologic Modeling Using Nitrate, Ammonium, Phosphorus, and Macroinvertebrates as Aquatic Ecosystem Health Indicators of Albaida Valley (Spain). J. Hydrol. Reg. Stud. 2022, 42, 101155. [Google Scholar] [CrossRef]
- Vörösmarty, C.J.; McIntyre, P.B.; Gessner, M.O.; Dudgeon, D.; Prusevich, A.; Green, P.; Glidden, S.; Bunn, S.E.; Sullivan, C.A.; Liermann, C.R.; et al. Global Threats to Human Water Security and River Biodiversity. Nature 2010, 467, 555–561. [Google Scholar] [CrossRef] [PubMed]
- Borges, A.C.P.; Piassão, J.F.G.; Albani, S.M.; Albertoni, E.F.; Martins, M.C.; Cansian, R.L.; Valduga, A.T.; Hepp, L.U.; Mielniczki-Pereira, A.A. Multiple Metals and Agricultural Use Affects Oxidative Stress Biomarkers in Freshwater Aegla Crabs. Braz. J. Biol. 2022, 82, 230147. [Google Scholar] [CrossRef]
- Mello, K.; Taniwaki, R.H.; de Paula, F.R.; Valente, R.A.; Randhir, T.O.; Macedo, D.R.; Leal, C.G.; Rodrigues, C.B.; Hughes, R.M. Multiscale Land Use Impacts on Water Quality: Assessment, Planning, and Future Perspectives in Brazil. J. Environ. Manag. 2020, 270, 110879. [Google Scholar] [CrossRef]
- Randhir, T.O.; Ekness, P. Water Quality Change and Habitat Potential in Riparian Ecosystems. Ecohydrol. Hydrobiol. 2013, 13, 192–200. [Google Scholar] [CrossRef]
- Rico-Sánchez, A.E.; Rodríguez-Romero, A.J.; Sedeño-Díaz, J.E.; López-López, E.; Sundermann, A. Aquatic Macroinvertebrate Assemblages in Rivers Influenced by Mining Activities. Sci. Rep. 2022, 12, 3209. [Google Scholar] [CrossRef]
- Randhir, T.O.; Hawes, A.G. Watershed Land Use and Aquatic Ecosystem Response: Ecohydrologic Approach to Conservation Policy. J. Hydrol. 2009, 364, 182–199. [Google Scholar] [CrossRef]
- Brooks, K.N.; Ffolliott, P.F.; Magner, J.A. Hydrology and the Management of Watersheds, 4th ed.; Wiley-Blackwell: Ames, IA, USA, 2012; ISBN 9780470963050. [Google Scholar]
- Calizza, E.; Favero, F.; Rossi, D.; Careddu, G.; Fiorentino, F.; Sporta Caputi, S.; Rossi, L.; Costantini, M.L. Isotopic Biomonitoring of N Pollution in Rivers Embedded in Complex Human Landscapes. Sci. Total Environ. 2020, 706, 136081. [Google Scholar] [CrossRef] [PubMed]
- Arini, A.; Feurtet-Mazel, A.; Morin, S.; Maury-Brachet, R.; Coste, M.; Delmas, F. Remediation of a Watershed Contaminated by Heavy Metals: A 2-Year Field Biomonitoring of Periphytic Biofilms. Sci. Total Environ. 2012, 425, 242–253. [Google Scholar] [CrossRef] [PubMed]
- Garris, H.W.; Baldwin, S.A.; Taylor, J.; Gurr, D.B.; Denesiuk, D.R.; Van Hamme, J.D.; Fraser, L.H. Short-Term Microbial Effects of a Large-Scale Mine-Tailing Storage Facility Collapse on the Local Natural Environment. PLoS ONE 2018, 13, e0196032. [Google Scholar] [CrossRef]
- Isibor, P.O.; Imoobe, T.O.T.; Dedeke, G.A.; Adagunodo, T.A.; Taiwo, O.S. Health Risk Indices and Zooplankton-Based Assessment of a Tropical Rainforest River Contaminated with Iron, Lead, Cadmium, and Chromium. Sci. Rep. 2020, 10, 16896. [Google Scholar] [CrossRef]
- Rimet, F.; Bouchez, A. Biomonitoring River Diatoms: Implications of Taxonomic Resolution. Ecol. Indic. 2012, 15, 92–99. [Google Scholar] [CrossRef]
- Lenart-Boroń, A.; Boroń, P.; Kulik, K.; Prajsnar, J.; Żelazny, M.; Chmiel, M.J. Anthropogenic Pollution Gradient along a Mountain River Affects Bacterial Community Composition and Genera with Potential Pathogenic Species. Sci. Rep. 2022, 12, 18140. [Google Scholar] [CrossRef]
- Persaud, A.D.; Paterson, A.M.; Dillon, P.J.; Winter, J.G.; Palmer, M.; Somers, K.M. Forecasting Cyanobacteria Dominance in Canadian Temperate Lakes. J. Environ. Manag. 2015, 151, 343–352. [Google Scholar] [CrossRef]
- Jabiol, J.; Chauvet, E.; Guérold, F.; Bouquerel, J.; Usseglio-Polatera, P.; Artigas, J.; Margoum, C.; Le Dréau, M.; Moreira, A.; Mazzella, N.; et al. The Combination of Chemical, Structural, and Functional Indicators to Evaluate the Anthropogenic Impacts on Agricultural Stream Ecosystems. Environ. Sci. Pollut. Res. 2022, 29, 29296–29313. [Google Scholar] [CrossRef]
- Qu, Y.; Wu, N.; Guse, B.; Makarevičiūtė, K.; Sun, X.; Fohrer, N. Riverine Phytoplankton Functional Groups Response to Multiple Stressors Variously Depending on Hydrological Periods. Ecol. Indic. 2019, 101, 41–49. [Google Scholar] [CrossRef]
- Gomes, A.C.A.M.; Gomes, L.F.; Roitman, I.; Pereira, H.R.; Junior, A.F.C.; da Costa, E.M.M.; da Silva, M.L.C.; Jacobson, T.K.B.; da Costa Ribeiro, R.J.; de Miranda Filho, R.J.; et al. Forest Cover Influences Zooplanktonic Communities in Amazonian Streams. Aquat. Ecol. 2020, 54, 1067–1078. [Google Scholar] [CrossRef]
- Brase, R.A.; Schwab, H.E.; Li, L.; Spink, D.C. Elevated Levels of Per- and Polyfluoroalkyl Substances (PFAS) in Freshwater Benthic Macroinvertebrates from the Hudson River Watershed. Chemosphere 2022, 291, 132830. [Google Scholar] [CrossRef]
- Edegbene, A.O. Assessing the Health of Forested Riverine Systems in the Niger Delta Area of Nigeria: A Macroinvertebrate-Based Multimetric Index Approach. Environ. Sci. Pollut. Res. 2022, 29, 15068–15080. [Google Scholar] [CrossRef]
- Dal Pont, G.; Duarte Ritter, C.; Agostinis, A.O.; Stica, P.V.; Horodesky, A.; Cozer, N.; Balsanelli, E.; Netto, O.S.M.; Henn, C.; Ostrensky, A.; et al. Monitoring Fish Communities through Environmental DNA Metabarcoding in the Fish Pass System of the Second Largest Hydropower Plant in the World. Sci. Rep. 2021, 11, 23167. [Google Scholar] [CrossRef]
- Johnson, S.L.; Ringler, N.H. The Response of Fish and Macroinvertebrate Assemblages to Multiple Stressors: A Comparative Analysis of Aquatic Communities in a Perturbed Watershed (Onondaga Lake, NY). Ecol. Indic. 2014, 41, 198–208. [Google Scholar] [CrossRef]
- Shah, Z.U.; Parveen, S. Oxidative, Biochemical and Histopathological Alterations in Fishes from Pesticide Contaminated River Ganga, India. Sci. Rep. 2022, 12, 3628. [Google Scholar] [CrossRef]
- Resh, V.H. Which Group Is Best? Attributes of Different Biological Assemblages Used in Freshwater Biomonitoring Programs. Environ. Monit. Assess. 2008, 138, 131–138. [Google Scholar] [CrossRef]
- Li, D.; Pi, J.; Zhang, T.; Tan, X.; Fraser, D.J. Evaluating a 5-Year Metal Contamination Remediation and the Biomonitoring Potential of a Freshwater Gastropod along the Xiangjiang River, China. Environ. Sci. Pollut. Res. 2018, 25, 21127–21137. [Google Scholar] [CrossRef]
- Blackman, R.C.; Ho, H.C.; Walser, J.C.; Altermatt, F. Spatio-Temporal Patterns of Multi-Trophic Biodiversity and Food-Web Characteristics Uncovered across a River Catchment Using Environmental DNA. Commun. Biol. 2022, 5, 259. [Google Scholar] [CrossRef]
- Emilson, C.E.; Thompson, D.G.; Venier, L.A.; Porter, T.M.; Swystun, T.; Chartrand, D.; Capell, S.; Hajibabaei, M. DNA Metabarcoding and Morphological Macroinvertebrate Metrics Reveal the Same Changes in Boreal Watersheds across an Environmental Gradient. Sci. Rep. 2017, 7, 12777. [Google Scholar] [CrossRef]
- Messager, M.L.; Davies, I.P.; Levin, P.S. Low-Cost Biomonitoring and High-Resolution, Scalable Models of Urban Metal Pollution. Sci. Total Environ. 2021, 767, 144280. [Google Scholar] [CrossRef]
- Tiegs, S.D.; Costello, D.M.; Isken, M.W.; Woodward, G.; Mcintyre, P.B.; Gessner, M.O.; Chauvet, E.; Griffiths, N.A.; Flecker, A.S.; Acuña, V.; et al. Global Patterns and Drivers of Ecosystem Functioning in Rivers and Riparian Zones. Sci. Adv. 2019, 5, eaav0486. [Google Scholar] [CrossRef]
- Dodds, W.K.; Gido, K.; Whiles, M.R.; Daniels, M.D.; Grudzinski, B.P. The Stream Biome Gradient Concept: Factors Controlling Lotic Systems across Broad Biogeographic Scales. Freshw. Sci. 2015, 34, 1. [Google Scholar] [CrossRef]
- Poff, N.L.; Allan, J.D.; Bain, M.B.; Karr, J.R.; Prestegaard, K.L.; Richter, B.D.; Sparks, R.E.; Stromberg, J.C. The Natural Flow Regime. Bioscience 1997, 47, 769–784. [Google Scholar] [CrossRef]
- Anbumozhi, V.; Radhakrishnan, J.; Yamaji, E. Impact of Riparian Buffer Zones on Water Quality and Associated Management Considerations. Ecol. Eng. 2005, 24, 517–523. [Google Scholar] [CrossRef]
- Auble, G.T.; Friedman, J.M.; Scott, M.L. Relating Riparian Vegetation to Present and Future Streamflows. Ecol. Appl. 1994, 4, 544–554. [Google Scholar] [CrossRef]
- Boyero, L.; Pearson, R.G.; Dudgeon, D.; Ferreira, V.; Graca, M.A.S.; Gessner, M.O.; Boulton, A.J.; Chauvet, E.; Yule, C.M.; Albarino, R.J.; et al. Global Patterns of Stream Detritivore Distribution: Implications for Biodiversity Loss in Changing Climates. Glob. Ecol. Biogeogr. 2012, 21, 134–141. [Google Scholar] [CrossRef]
- Goncalves, J.F., Jr.; Callisto, M. Organic-Matter Dynamics in the Riparian Zone of a Tropical Headwater Stream in Southern Brasil. Aquat. Bot. 2013, 109, 8–13. [Google Scholar] [CrossRef]
- Tonin, A.M.; Gonçalves, J.F.; Bambi, P.; Couceiro, S.R.M.; Feitoza, L.A.M.; Fontana, L.E.; Hamada, N.; Hepp, L.U.; Lezan-Kowalczuk, V.G.; Leite, G.F.M.; et al. Plant Litter Dynamics in the Forest-Stream Interface: Precipitation Is a Major Control across Tropical Biomes. Sci. Rep. 2017, 7, 10799. [Google Scholar] [CrossRef]
- Paola, C.; Foufoula-Georgiou, E.; Dietrich, W.E.; Hondzo, M.; Mohrig, D.; Parker, G.; Power, M.E.; Rodriguez-Iturbe, I.; Voller, V.; Wilcock, P. Toward a Unified Science of the Earth’s Surface: Opportunities for Synthesis among Hydrology, Geomorphology, Geochemistry, and Ecology. Water Resour. Res. 2006, 42, 2336. [Google Scholar] [CrossRef]
- Limburg, K.E.; Swaney, D.P.; Strayer, D.L. River Ecosystems. In Encyclopedia of Biodiversity, 2nd ed.; Elsevier Inc.: Amsterdam, The Netherlands, 2013; pp. 469–484. ISBN 9780123847195. [Google Scholar]
- Buss, D.F.; Carlisle, D.M.; Chon, T.-S.; Culp, J.; Harding, J.S.; Keizer-Vlek, H.E.; Robinson, W.A.; Strachan, S.; Thirion, C.; Hughes, R.M. Stream Biomonitoring Using Macroinvertebrates around the Globe: A Comparison of Large-Scale Programs. Environ. Monit. Assess. 2015, 187, 4132. [Google Scholar] [CrossRef]
- Vadas, R.L.; Hughes, R.M.; Bae, Y.J.; Baek, M.J.; Gonzáles, O.C.B.; Callisto, M.; de Carvalho, D.R.; Chen, K.; Ferreira, M.T.; Fierro, P.; et al. Assemblage-Based Biomonitoring of Freshwater Ecosystem Health via Multimetric Indices: A Critical Review and Suggestions for Improving Their Applicability. Water Biol. Secur. 2022, 1, 100054. [Google Scholar] [CrossRef]
- Hering, D.; Feld, C.K.; Moog, O.; Ofenböck, T. Cook Book for the Development of a Multimetric Index for Biological Condition of Aquatic Ecosystems: Experiences from the European AQEM and STAR Projects and Related Initiatives. In The Ecological Status of European Rivers: Evaluation and Intercalibration of Assessment Methods; Springer: Dordrecht, The Netherlands, 2006; pp. 311–324. [Google Scholar]
- Cooke, G.D.; Welch, E.B.; Peterson, S.A.; Newroth, P.R. Lake and Reservoir Restoration; Elsevier: Amsterdam, The Netherlands, 1986; ISBN 9780250406432. [Google Scholar]
- Menezes, S.; Baird, D.J.; Soares, A.M.V.M. Beyond Taxonomy: A Review of Macroinvertebrate Trait-Based Community Descriptors as Tools for Freshwater Biomonitoring. J. Appl. Ecol. 2010, 47, 711–719. [Google Scholar] [CrossRef]
- Yang, J.; Zhang, X.; Xie, Y.; Song, C.; Zhang, Y.; Yu, H.; Burton, G.A. Zooplankton Community Profiling in a Eutrophic Freshwater Ecosystem-Lake Tai Basin by DNA Metabarcoding. Sci. Rep. 2017, 7, 1773. [Google Scholar] [CrossRef]
- Van den Broeck, M.; Waterkeyn, A.; Rhazi, L.; Grillas, P.; Brendonck, L. Assessing the Ecological Integrity of Endorheic Wetlands, with Focus on Mediterranean Temporary Ponds. Ecol. Indic. 2015, 54, 1–11. [Google Scholar] [CrossRef]
- Odountan, O.H.; Janssens de Bisthoven, L.; Abou, Y.; Eggermont, H. Biomonitoring of Lakes Using Macroinvertebrates: Recommended Indices and Metrics for Use in West Africa and Developing Countries. Hydrobiologia 2019, 826, 1–23. [Google Scholar] [CrossRef]
- Palma, P.; Matos, C.; Alvarenga, P.; Köck-Schulmeyer, M.; Simões, I.; Barceló, D.; López de Alda, M.J. Ecological and Ecotoxicological Responses in the Assessment of the Ecological Status of Freshwater Systems: A Case-Study of the Temporary Stream Brejo of Cagarrão (South of Portugal). Sci. Total Environ. 2018, 634, 394–406. [Google Scholar] [CrossRef]
- Marin, V.; Arranz, I.; Grenouillet, G.; Cucherousset, J. Fish Size Spectrum as a Complementary Biomonitoring Approach of Freshwater Ecosystems. Ecol. Indic. 2023, 146, 109833. [Google Scholar] [CrossRef]
- Metcalfe, J.L.; Hayton, A. Comparison of Leeches and Mussels as Biomonitors for Chlorophenol Pollution. J. Great Lakes Res. 1989, 15, 654–668. [Google Scholar] [CrossRef]
- Poikane, S.; Johnson, R.K.; Sandin, L.; Schartau, A.K.; Solimini, A.G.; Urbanič, G.; Arbačiauskas, K.; Aroviita, J.; Gabriels, W.; Miler, O.; et al. Benthic Macroinvertebrates in Lake Ecological Assessment: A Review of Methods, Intercalibration and Practical Recommendations. Sci. Total Environ. 2016, 543, 123–134. [Google Scholar] [CrossRef]
- Gerritsen, J.; Carlson, R.E.; Dycus, D.L.; Faulkner, C.; Gibson, G.R.; Harcum, J.; Markowitz, S.A. Lake and Reservoir Bioassessment and Biocriteria: Technical Guidance Document; USEPA Office of Water: Washington, DC, USA, 1998.
- de Paula, F.R.; Leal, C.G.; Leitão, R.P.; Ferraz, S.F.D.B.; Pompeu, P.S.; Zuanon, J.A.S.; Hughes, R.M. The Role of Secondary Riparian Forests for Conserving Fish Assemblages in Eastern Amazon Streams. Hydrobiologia 2022, 849, 4529–4546. [Google Scholar] [CrossRef]
- Macaulay, S.J.; Buchwalter, D.B.; Matthaei, C.D. Water Temperature Interacts with the Insecticide Imidacloprid to Alter Acute Lethal and Sublethal Toxicity to Mayfly Larvae. N. Z. J. Mar. Freshw. Res. 2020, 54, 115–130. [Google Scholar] [CrossRef]
- Piggott, J.J.; Lange, K.; Townsend, C.R.; Matthaei, C.D. Multiple Stressors in Agricultural Streams: A Mesocosm Study of Interactions among Raised Water Temperature, Sediment Addition and Nutrient Enrichment. PLoS ONE 2012, 7, e49873. [Google Scholar] [CrossRef]
- Piggott, J.J.; Niyogi, D.K.; Townsend, C.R.; Matthaei, C.D. Multiple Stressors and Stream Ecosystem Functioning: Climate Warming and Agricultural Stressors Interact to Affect Processing of Organic Matter. J. Appl. Ecol. 2015, 52, 1126–1134. [Google Scholar] [CrossRef]
- Egler, M.; Buss, D.F.; Moreira, J.C.; Baptista, D.F. Influence of Agricultural Land-Use and Pesticides on Benthic Macroinvertebrate Assemblages in an Agricultural River Basin in Southeast Brazil. Braz. J. Biol. 2012, 72, 437–443. [Google Scholar] [CrossRef]
- Maltby, L.; Hills, L. Spray Drift of Pesticides and Stream Macroinvertebrates: Experimental Evidence of Impacts and Effectiveness of Mitigation Measures. Environ. Pollut. 2008, 156, 1112–1120. [Google Scholar] [CrossRef]
- Schäfer, R.B.; Caquet, T.; Siimes, K.; Mueller, R.; Lagadic, L.; Liess, M. Effects of Pesticides on Community Structure and Ecosystem Functions in Agricultural Streams of Three Biogeographical Regions in Europe. Sci. Total Environ. 2007, 382, 272–285. [Google Scholar] [CrossRef]
- Helson, J.E.; Williams, D.D. Development of a Macroinvertebrate Multimetric Index for the Assessment of Low-Land Streams in the Neotropics. Ecol. Indic. 2013, 29, 167–178. [Google Scholar] [CrossRef]
- Sutherland, A.B.; Culp, J.M.; Benoy, G.A. Evaluation of Deposited Sediment and Macroinvertebrate Metrics Used to Quantify Biological Response to Excessive Sedimentation in Agricultural Streams. Environ. Manag. 2012, 50, 50–63. [Google Scholar] [CrossRef]
- Taniwaki, R.H.; Piggott, J.J.; Ferraz, S.F.B.; Matthaei, C.D. Climate Change and Multiple Stressors in Small Tropical Streams. Hydrobiologia 2017, 793, 41–53. [Google Scholar] [CrossRef]
- Vitecek, S.; Johnson, R.; Poikane, S. Assessing the Ecological Status of European Rivers and Lakes Using Benthic Invertebrate Communities: A Practical Catalogue of Metrics and Methods. Water 2021, 13, 346. [Google Scholar] [CrossRef]
- Debenest, T.; Pinelli, E.; Coste, M.; Silvestre, J.; Mazzella, N.; Madigou, C.; Delmas, F. Sensitivity of Freshwater Periphytic Diatoms to Agricultural Herbicides. Aquat. Toxicol. 2009, 93, 11–17. [Google Scholar] [CrossRef] [PubMed]
- Fore, L.S.; Grafe, C. Using Diatoms to Assess the Biological Condition of Large Rivers in Idaho (U.S.A.). Freshw.iol. 2002, 47, 2015–2037. [Google Scholar] [CrossRef]
- Schneck, F.; Schwarzbold, A.; Melo, A.S. Substrate Roughness Affects Stream Benthic Algal Diversity, Assemblage Composition, and Nestedness. J. N. Am. Benthol. Soc. 2011, 30, 1049–1056. [Google Scholar] [CrossRef]
- Taniwaki, R.H.; Matthaei, C.D.; Cardoso, T.K.M.; Ferraz, S.F.B.; Martinelli, L.A.; Piggott, J.J. The Effect of Agriculture on the Seasonal Dynamics and Functional Diversity of Benthic Biofilm in Tropical Headwater Streams. Biotropica 2019, 51, 18–27. [Google Scholar] [CrossRef]
- Mangadze, T.; Bere, T.; Mwedzi, T. Choice of Biota in Stream Assessment and Monitoring Programs in Tropical Streams: A Comparison of Diatoms, Macroinvertebrates and Fish. Ecol. Indic. 2016, 63, 128–143. [Google Scholar] [CrossRef]
- Edegbene, A.O.; Akamagwuna, F.C.; Odume, O.N.; Arimoro, F.O.; Edegbene Ovie, T.T.; Akumabor, E.C.; Ogidiaka, E.; Kaine, E.A.; Nwaka, K.H. A Macroinvertebrate-Based Multimetric Index for Assessing Ecological Condition of Forested Stream Sites Draining Nigerian Urbanizing Landscapes. Sustainability 2022, 14, 11289. [Google Scholar] [CrossRef]
- Gebrehiwot, M.; Awoke, A.; Beyene, A.; Kifle, D.; Triest, L. Macroinvertebrate Community Structure and Feeding Interactions along a Pollution Gradient in Gilgel Gibe Watershed, Ethiopia: Implications for Biomonitoring. Limnologica 2017, 62, 68–76. [Google Scholar] [CrossRef]
- Grabicová, K.; Vojs Staňová, A.; Švecová, H.; Nováková, P.; Kodeš, V.; Leontovyčová, D.; Brooks, B.W.; Grabic, R. Invertebrates Differentially Bioaccumulate Pharmaceuticals: Implications for Routine Biomonitoring. Environ. Pollut. 2022, 309, 119715. [Google Scholar] [CrossRef]
- Park, C.B.; Kim, G.E.; Kim, D.W.; Kim, S.; Yeom, D.H. Biomonitoring the Effects of Urban-Stream Waters on the Health Status of Pale Chub (Zacco Platypus): A Comparative Analysis of Biological Indexes and Biomarker Levels. Ecotoxicol. Environ. Saf. 2021, 208, 111452. [Google Scholar] [CrossRef]
- McGrane, S.J. Impacts of Urbanisation on Hydrological and Water Quality Dynamics, and Urban Water Management: A Review. Hydrol. Sci. J. 2016, 61, 2295–2311. [Google Scholar] [CrossRef]
- Amoatey, P.; Baawain, M.S. Effects of Pollution on Freshwater Aquatic Organisms. Water Environ. Res. 2019, 91, 1272–1287. [Google Scholar] [CrossRef] [PubMed]
- Hughes, R.M.; Dunham, S.; Maas-Hebner, K.G.; Yeakley, J.A.; Schreck, C.; Harte, M.; Molina, N.; Shock, C.C.; Kaczynski, V.W.; Schaeffer, J. A Review of Urban Water Body Challenges and Approaches: (1) Rehabilitation and Remediation. Fisheries 2014, 39, 18–29. [Google Scholar] [CrossRef]
- Feio, M.J.; Hughes, R.M.; Callisto, M.; Nichols, S.J.; Odume, O.N.; Quintella, B.R.; Kuemmerlen, M.; Aguiar, F.C.; Almeida, S.F.P.; Alonso-EguíaLis, P.; et al. The Biological Assessment and Rehabilitation of the World’s Rivers: An Overview. Water 2021, 13, 371. [Google Scholar] [CrossRef]
- Callisto, M.; Massara, R.L.; Linares, M.S.; Hughes, R.M. Benthic Macroinvertebrate Assemblages Detect the Consequences of a Sewage Spill: A Case Study of a South American Environmental Challenge. Limnology 2022, 23, 181–194. [Google Scholar] [CrossRef]
- Macedo, D.R.; Callisto, M.; Linares, M.S.; Hughes, R.M.; Romano, B.M.L.; Rothe-Neves, M.; Silveira, J.S. Urban Stream Rehabilitation in a Densely Populated Brazilian Metropolis. Front. Environ. Sci. 2022, 10, 921934. [Google Scholar] [CrossRef]
- Horton, A.A.; Walton, A.; Spurgeon, D.J.; Lahive, E.; Svendsen, C. Microplastics in Freshwater and Terrestrial Environments: Evaluating the Current Understanding to Identify the Knowledge Gaps and Future Research Priorities. Sci. Total Environ. 2017, 586, 127–141. [Google Scholar] [CrossRef]
- França, J.S.; Solar, R.; Hughes, R.M.; Callisto, M. Student Monitoring of the Ecological Quality of Neotropical Urban Streams. Ambio 2019, 48, 867–878. [Google Scholar] [CrossRef]
- Krabbenhoft, C.A.; Kashian, D.R. Citizen Science Data Are a Reliable Complement to Quantitative Ecological Assessments in Urban Rivers. Ecol. Indic. 2020, 116, 106476. [Google Scholar] [CrossRef]
- Bonnail, E.; Sarmiento, A.M.; DelValls, T.A.; Nieto, J.M.; Riba, I. Assessment of Metal Contamination, Bioavailability, Toxicity and Bioaccumulation in Extreme Metallic Environments (Iberian Pyrite Belt) Using Corbicula Fluminea. Sci. Total Environ. 2016, 544, 1031–1044. [Google Scholar] [CrossRef]
- Albuquerque, F.E.A.; Herrero-Latorre, C.; Miranda, M.; Barrêto Júnior, R.A.; Oliveira, F.L.C.; Sucupira, M.C.A.; Ortolani, E.L.; Minervino, A.H.H.; López-Alonso, M. Fish Tissues for Biomonitoring Toxic and Essential Trace Elements in the Lower Amazon. Environ. Pollut. 2021, 283, 117024. [Google Scholar] [CrossRef] [PubMed]
- Condini, M.V.; Pichler, H.A.; de Oliveira-Filho, R.R.; Cattani, A.P.; Andrades, R.; Vilar, C.C.; Joyeux, J.-C.; Soeth, M.; De Biasi, J.B.; Eggertsen, L.; et al. Marine Fish Assemblages of Eastern Brazil: An Update after the World’s Largest Mining Disaster and Suggestions of Functional Groups for Biomonitoring Long-Lasting Effects. Sci. Total Environ. 2022, 807, 150987. [Google Scholar] [CrossRef] [PubMed]
- de Almeida, P.I.N.; de Jesus, H.E.; Pereira, P.H.F.; Vieira, C.E.D.; Bianchini, A.; Martins, C.D.M.G.; dos Santos, H.F. The Microbial Profile of Rivers and Lagoons Three Years after the Impact of the World’s Largest Mining Disaster (Fundão Dam, Brazil). Environ. Res. 2023, 216, 114710. [Google Scholar] [CrossRef] [PubMed]
- Bevitório, L.Z.; da Silva, N.G.; Pirovani, J.C.M.; Marques, J.A.; Vieira, C.E.D.; Zebral, Y.D.; Damasceno, E.M.; Lopes, L.L.R.; de Sant’Ana, L.P.; Marube, L.C.; et al. Impacts of Tailings of Fundão Dam (Brazil) Rupture on Marine Fish: Metals Bioaccumulation and Physiological Responses. Mar. Pollut. Bull. 2022, 177, 113511. [Google Scholar] [CrossRef] [PubMed]
- de Matos, A.R.; da Silva, H.T.; da Faria, M.C.S.; Freire, B.M.; Pereira, R.M.; Batista, B.L.; Rodrigues, J.L. Environmental Disaster in Mining Areas: Routes of Exposure to Metals in the Doce River Basin. Int. J. Environ. Sci. Technol. 2022, 19, 12091–12102. [Google Scholar] [CrossRef]
- Maraschi, A.C.; Marques, J.A.; Costa, S.R.; Vieira, C.E.D.; Geihs, M.A.; Costa, P.G.; Martins, C.d.M.G.; Sandrini, J.Z.; Bianchini, A.; Souza, M.M. Marine Shrimps as Biomonitors of the Fundão (Brazil) Mine Dam Disaster: A Multi-Biomarker Approach. Environ. Pollut. 2022, 305, 119245. [Google Scholar] [CrossRef]
- Rodrigues, C.B.; Taniwaki, R.H.; Lane, P.; de Paula Lima, W.; de Barros Ferraz, S.F. Eucalyptus Short-Rotation Management Effects on Nutrient and Sediments in Subtropical Streams. Forests 2019, 10, 519. [Google Scholar] [CrossRef]
- van Dijk, A.I.J.M.; Keenan, R.J. Planted Forests and Water in Perspective. For. Ecol. Manag. 2007, 251, 1–9. [Google Scholar] [CrossRef]
- Trayler, K.M.; Davis, J.A. Forestry Impacts and the Vertical Distribution of Stream Invertebrates in South-Western Australia. Freshw. Biol. 1998, 40, 331–342. [Google Scholar] [CrossRef]
- USDA—United States Department of Agriculture. Best Management Practices to Minimize Agricultural Phosphorus Impacts on Water Quality; USDA: Washington, DC, USA, 2006.
- Vowell, J.L.; Frydenborg, R.B. A Biological Assessment of Best Management Practice Effectiveness during Intensive Silviculture and Forest Chemical Application. Water Air Soil Pollut. Focus 2004, 4, 297–307. [Google Scholar] [CrossRef]
- Erdozain, M.; Kidd, K.A.; Emilson, E.J.S.; Capell, S.S.; Luu, T.; Kreutzweiser, D.P.; Gray, M.A. Forest Management Impacts on Stream Integrity at Varying Intensities and Spatial Scales: Do Biological Effects Accumulate Spatially? Sci. Total Environ. 2021, 763, 144043. [Google Scholar] [CrossRef] [PubMed]
- Prudente, B.S.; Pompeu, P.S.; Juen, L.; Montag, L.F.A. Effects of Reduced-Impact Logging on Physical Habitat and Fish Assemblages in Streams of Eastern Amazonia. Freshw. Biol. 2017, 62, 303–316. [Google Scholar] [CrossRef]
- Dias, M.S.; Magnusson, W.E.; Zuanon, J. Effects of Reduced-Impact Logging on Fish Assemblages in Central Amazonia. Conserv. Biol. 2010, 24, 278–286. [Google Scholar] [CrossRef] [PubMed]
- Mello, K.D.; Valente, R.A.; Randhir, T.O.; dos Santos, A.C.A.; Vettorazzi, C.A. Effects of Land Use and Land Cover on Water Quality of Low-Order Streams in Southeastern Brazil: Watershed versus Riparian Zone. Catena 2018, 167, 130–138. [Google Scholar] [CrossRef]
- Hepp, L.U.; Santos, S. Benthic Communities of Streams Related to Different Land Uses in a Hydrographic Basin in Southern Brazil. Environ. Monit. Assess. 2009, 157, 305–318. [Google Scholar] [CrossRef]
- Sunohara, M.D.; Topp, E.; Wilkes, G.; Gottschall, N.; Neumann, N.; Ruecker, N.; Jones, T.H.; Edge, T.A.; Marti, R.; Lapen, D.R. Impact of Riparian Zone Protection from Cattle on Nutrient, Bacteria, F-Coliphage, Cryptosporidium, and Giardia Loading of an Intermittent Stream. J. Environ. Qual. 2012, 41, 1301–1314. [Google Scholar] [CrossRef]
- Griffith, M.B.; McManus, M.G. Consideration of Spatial and Temporal Scales in Stream Restorations and Biotic Monitoring to Assess Restoration Outcomes: A Literature Review, Part 1. River Res. Appl. 2020, 36, 1385–1397. [Google Scholar] [CrossRef]
- Hermoso, V.; Linke, S.; Prenda, J.; Possingham, H.P. Addressing Longitudinal Connectivity in the Systematic Conservation Planning of Fresh Waters. Freshw. Biol. 2011, 56, 57–70. [Google Scholar] [CrossRef]
- Leal, C.G.; Pompeu, P.S.; Gardner, T.A.; Leitão, R.P.; Hughes, R.M.; Kaufmann, P.R.; Zuanon, J.; de Paula, F.R.; Ferraz, S.F.B.; Thomson, J.R.; et al. Multi-Scale Assessment of Human-Induced Changes to Amazonian Instream Habitats. Landsc. Ecol. 2016, 31, 1725–1745. [Google Scholar] [CrossRef]
- Brejão, G.L.; Hoeinghaus, D.J.; Pérez-Mayorga, M.A.; Ferraz, S.F.B.; Casatti, L. Threshold Responses of Amazonian Stream Fishes to Timing and Extent of Deforestation. Conserv. Biol. 2018, 32, 860–871. [Google Scholar] [CrossRef]
- Green, R.H. Sampling Design and Statistical Methods for Environmental Biologists; John Wiley & Sons: Hoboken, NJ, USA, 1979. [Google Scholar]
- Wright, J.; Sutcliffe, D.; Furse, M. Assessing the Biological Quality of Fresh Water: RIVPACS and Other Techniques; Freshwater Biological Association: Cumbria, UK, 2000. [Google Scholar]
- Bailey, R.; Norris, R.; Reynoldson, T. Bioassessment of Freshwater Ecosystems Using the Reference Condition Approach; Kluwer Academic Publishers: Boston, UK, 2004. [Google Scholar]
- Ward, J.V. The Four-Dimensional Nature of Lotic Ecosystems. J. North Am. Benthol. Soc. 1989, 8, 2–8. [Google Scholar] [CrossRef]
- Allan, D.; Erickson, D.; Fay, J. The Influence of Catchment Land Use on Stream Integrity across Multiple Spatial Scales. Freshw. Biol. 1997, 37, 149–161. [Google Scholar] [CrossRef]
- Altermatt, F. Diversity in Riverine Metacommunities: A Network Perspective. Aquat. Ecol. 2013, 47, 365–377. [Google Scholar] [CrossRef]
- Heino, J. The Importance of Metacommunity Ecology for Environmental Assessment Research in the Freshwater Realm. Biol. Rev. 2013, 88, 166–178. [Google Scholar] [CrossRef]
- Paulsen, S.G.; Peck, D.V.; Kaufmann, P.R.; Herlihy, A.T. Rivers and Streams: Upgrading Monitoring of the Nation’s Freshwater Resources—Meeting the Spirit of the Clean Water Act. In Water Quality—Science, Assessments and Policy; IntechOpen: Rijeka, Croatia, 2020. [Google Scholar]
- Poikane, S.; Zampoukas, N.; Borja, A.; Davies, S.P.; van de Bund, W.; Birk, S. Intercalibration of Aquatic Ecological Assessment Methods in the European Union: Lessons Learned and Way Forward. Environ. Sci. Policy 2014, 44, 237–246. [Google Scholar] [CrossRef]
- Clapcott, J.E.; Goodwin, E.O.; Snelder, T.H.; Collier, K.J.; Neale, M.W.; Greenfield, S. Finding Reference: A Comparison of Modelling Approaches for Predicting Macroinvertebrate Community Index Benchmarks. N. Z. J. Mar. Freshw. Res. 2017, 51, 44–59. [Google Scholar] [CrossRef]
- Lee, J.-Y.; Kwon, K. Current Status of Groundwater Monitoring Networks in Korea. Water 2016, 8, 168. [Google Scholar] [CrossRef]
- Reynolds, J.H.; Knutson, M.G.; Newman, K.B.; Silverman, E.D.; Thompson, W.L. A Road Map for Designing and Implementing a Biological Monitoring Program. Environ. Monit. Assess. 2016, 188, 399. [Google Scholar] [CrossRef] [PubMed]
- Barbour, C.D.M.T.; Gerritsen, J.; Snyder, B.D.; Stribling, J.B. Rapid Bioassessment Protocols for Use in Streams and Wadeable Rivers: Periphyton, Benthic Macroinvertebrates and Fish, 2nd ed.; Environmental Protection Agency, Office of Water: Washington, DC, USA, 1999.
- Chessman, B.C. What’s Wrong with the Australian River Assessment System (AUSRIVAS)? Mar. Freshw. Res. 2021, 72, 1110–1117. [Google Scholar] [CrossRef]
- De Souza, N.F.; Baptista, D.F.; Buss, D.F. A Predictive Index Based on Environmental Filters for the Bioassessment of River Basins without Reference Areas in Atlantic Forest Biome, Brazil. Biota Neotrop. 2019, 19, e20180601. [Google Scholar] [CrossRef]
- Feio, M.J.; Poquet, J.M. Predictive Models for Freshwater Biological Assessment: Statistical Approaches, Biological Elements and the Iberian Peninsula Experience: A Review. Int. Rev. Hydrobiol. 2011, 96, 321–346. [Google Scholar] [CrossRef]
- Waite, I.R.; Van Metre, P.C. Multistressor Predictive Models of Invertebrate Condition in the Corn Belt, USA. Freshw. Sci. 2017, 36, 901–914. [Google Scholar] [CrossRef]
- Stoddard, J.L.; Larsen, D.P.; Hawking, C.P.; Johnson, R.K.; Norris, R.H. Setting Expectations for the Ecological Condition of Streams: The Concept of Reference Condition. Ecol. Appl. 2006, 16, 1267–1276. [Google Scholar] [CrossRef]
- Ambelu, A.; Mekonen, S.; Koch, M.; Addis, T.; Boets, P.; Everaert, G.; Goethals, P. The Application of Predictive Modelling for Determining Bio-Environmental Factors Affecting the Distribution of Blackflies (Diptera: Simuliidae) in the Gilgel Gibe Watershed in Southwest Ethiopia. PLoS ONE 2014, 9, e112221. [Google Scholar] [CrossRef] [PubMed]
- Gezie, A.; Mulat, W.L.; Anteneh, W.; Dejen, E.; Kloos, H.; Mereta, S.T. Habitat Suitability Modelling of Benthic Macroinvertebrate Community in Wetlands of Lake Tana Watershed, Northwest Ethiopia. Wetlands 2020, 40, 853–864. [Google Scholar] [CrossRef]
- Feio, M.J.; Viana-Ferreira, C.; Costa, C. Testing a Multiple Machine Learning Tool (HYDRA) for the Bioassessment of Fresh Waters. Freshw. Sci. 2014, 33, 1286–1296. [Google Scholar] [CrossRef]
- Leitão, R.P.; Zuanon, J.; Mouillot, D.; Leal, C.G.; Hughes, R.M.; Kaufmann, P.R.; Villéger, S.; Pompeu, P.S.; Kasper, D.; de Paula, F.R.; et al. Disentangling the Pathways of Land Use Impacts on the Functional Structure of Fish Assemblages in Amazon Streams. Ecography 2018, 41, 219–232. [Google Scholar] [CrossRef]
- Waite, I.R.; Brown, L.R.; Kennen, J.G.; May, J.T.; Cuffney, T.F.; Orlando, J.L.; Jones, K.A. Comparison of Watershed Disturbance Predictive Models for Stream Benthic Macroinvertebrates for Three Distinct Ecoregions in Western US. Ecol. Indic. 2010, 10, 1125–1136. [Google Scholar] [CrossRef]
- Keith, D.A.; Akçakaya, H.R.; Thuiller, W.; Midgley, G.F.; Pearson, R.G.; Phillips, S.J.; Regan, H.M.; Araújo, M.B.; Rebelo, T.G. Predicting Extinction Risks under Climate Change: Coupling Stochastic Population Models with Dynamic Bioclimatic Habitat Models. Biol. Lett. 2008, 4, 560–563. [Google Scholar] [CrossRef]
- Ruaro, R.; Gubiani, É.A.; Hughes, R.M.; Mormul, R.P. Global Trends and Challenges in Multimetric Indices of Biological Condition. Ecol. Indic. 2020, 110, 105862. [Google Scholar] [CrossRef]
- Karr, J.R. Assessment of Biotic Integrity Using Fish Communities. Fisheries 1981, 6, 21–27. [Google Scholar] [CrossRef]
- Ndiritu, G.G.; Terer, T.; Njoroge, P.; Muiruri, V.M.; Njagi, E.L.; Kosgei, G.; Njoroge, L.; Kamau, P.W.; Malonza, P.K.; Muchane, M.; et al. Using the Biological Condition Gradient Model as a Bioassessment Framework to Support Rehabilitation and Restoration of the Upper Tana River Watershed in Kenya. Front. Environ. Sci. 2021, 9, 671051. [Google Scholar] [CrossRef]
- De Oliveira, R.B.D.S.; Mugnai, R.; Pereira, P.D.S.; De Souza, N.F.; Baptista, D.F. A Predictive Multimetric Index Based on Macroinvetebrates for Atlantic Forest Wadeable Streams Assessment. Biota Neotrop. 2019, 19, e20180541. [Google Scholar] [CrossRef]
- Martins, I.; Macedo, D.R.; Hughes, R.M.; Callisto, M. Major Risks to Aquatic Biotic Condition in a Neotropical Savanna River Basin. River Res. Appl. 2021, 37, 858–868. [Google Scholar] [CrossRef]
- Silva, D.R.O.; Herlihy, A.T.; Hughes, R.M.; Macedo, D.R.; Callisto, M. Assessing the Extent and Relative Risk of Aquatic Stressors on Stream Macroinvertebrate Assemblages in the Neotropical Savanna. Sci. Total Environ. 2018, 633, 179–188. [Google Scholar] [CrossRef]
- USEPA—United States Environmental Protection Agency. The Biological Condition Gradient (BCG): A Model for Interpreting Anthropogenic Stress on the Aquatic Environment; USEPA: Washington, DC, USA, 2021.
- Mello, K.D.; Randhir, T.O.; Valente, R.A.; Vettorazzi, C.A. Riparian Restoration for Protecting Water Quality in Tropical Agricultural Watersheds. Ecol. Eng. 2017, 108, 514–524. [Google Scholar] [CrossRef]
- Blackman, R.C.; Osathanunkul, M.; Brantschen, J.; Di Muri, C.; Harper, L.R.; Mächler, E.; Hänfling, B.; Altermatt, F. Mapping Biodiversity Hotspots of Fish Communities in Subtropical Streams through Environmental DNA. Sci. Rep. 2021, 11, 10375. [Google Scholar] [CrossRef]
- Carraro, L.; Mächler, E.; Wüthrich, R.; Altermatt, F. Environmental DNA Allows Upscaling Spatial Patterns of Biodiversity in Freshwater Ecosystems. Nat. Commun. 2020, 11, 3585. [Google Scholar] [CrossRef]
- Carvalho, D.C.; Leal, C.G. Steps Forward in Biomonitoring 2.0: EDNA Metabarcoding and Community-level Modelling Allow the Assessment of Complex Drivers of Neotropical Fish Diversity. Glob. Chang. Biol. 2023, 29, 1688–1690. [Google Scholar] [CrossRef]
- Zizka, V.M.A.; Geiger, M.F.; Leese, F. DNA Metabarcoding of Stream Invertebrates Reveals Spatio-Temporal Variation but Consistent Status Class Assessments in a Natural and Urban River. Ecol. Indic. 2020, 115, 106383. [Google Scholar] [CrossRef]
- Pérez-Burillo, J.; Trobajo, R.; Vasselon, V.; Rimet, F.; Bouchez, A.; Mann, D.G. Evaluation and Sensitivity Analysis of Diatom DNA Metabarcoding for WFD Bioassessment of Mediterranean Rivers. Sci. Total Environ. 2020, 727, 138445. [Google Scholar] [CrossRef] [PubMed]
- Jiang, P.; Zhang, S.; Xu, S.; Xiong, P.; Cao, Y.; Chen, Z.; Li, M. Comparison of Environmental DNA Metabarcoding and Bottom Trawling for Detecting Seasonal Fish Communities and Habitat Preference in a Highly Disturbed Estuary. Ecol. Indic. 2023, 146, 109754. [Google Scholar] [CrossRef]
- Skelton, J.; Cauvin, A.; Hunter, M.E. Environmental DNA Metabarcoding Read Numbers and Their Variability Predict Species Abundance, but Weakly in Non-Dominant Species. Environ. DNA 2022, 1–13. [Google Scholar] [CrossRef]
- Deiner, K.; Fronhofer, E.A.; Mächler, E.; Walser, J.C.; Altermatt, F. Environmental DNA Reveals That Rivers Are Conveyer Belts of Biodiversity Information. Nat. Commun. 2016, 7, 12544. [Google Scholar] [CrossRef] [PubMed]
- Seymour, M.; Edwards, F.K.; Cosby, B.J.; Bista, I.; Scarlett, P.M.; Brailsford, F.L.; Glanville, H.C.; de Bruyn, M.; Carvalho, G.R.; Creer, S. Environmental DNA Provides Higher Resolution Assessment of Riverine Biodiversity and Ecosystem Function via Spatio-Temporal Nestedness and Turnover Partitioning. Commun. Biol. 2021, 4, 512. [Google Scholar] [CrossRef] [PubMed]
- Mächler, E.; Walser, J.; Altermatt, F. Decision-making and Best Practices for Taxonomy-free Environmental DNA Metabarcoding in Biomonitoring Using Hill Numbers. Mol. Ecol. 2021, 30, 3326–3339. [Google Scholar] [CrossRef]
- Wlodkowic, D.; Karpiński, T.M. Live-Cell Systems in Real-Time Biomonitoring of Water Pollution: Practical Considerations and Future Perspectives. Sensors 2021, 21, 7028. [Google Scholar] [CrossRef]
- Gu, M.B.; Mitchell, R.J.; Kim, B.C. Whole-Cell-Based Biosensors for Environmental Biomonitoring and Application. In Biomanufacturing. Advances in Biochemical Engineering; Zhong, J.J., Ed.; Springer: Berlin/Heidelberg, Germany, 2004; Volume 87. [Google Scholar]
- Eltzov, E.; Marks, R.S. Whole-Cell Aquatic Biosensors. Anal. Bioanal. Chem. 2011, 400, 895–913. [Google Scholar] [CrossRef]
- Dalu, T.; Cuthbert, R.N.; Taylor, J.C.; Magoro, M.L.; Weyl, O.L.F.; Froneman, P.W.; Wasserman, R.J. Benthic Diatom-Based Indices and Isotopic Biomonitoring of Nitrogen Pollution in a Warm Temperate Austral River System. Sci. Total Environ. 2020, 748, 142452. [Google Scholar] [CrossRef]
- de Carvalho, D.R.; Alves, C.B.M.; Pompeu, P.S. Uncertainty in Estimating Fish Trophic Positions and Food Web Structure in Highly Polluted River Basins. Environ. Biol. Fishes 2022, 105, 119–137. [Google Scholar] [CrossRef]
- de Carvalho, D.R.; Flecker, A.S.; Alves, C.B.M.; Sparks, J.P.; Pompeu, P.S. Trophic Responses to Aquatic Pollution of Native and Exotic Livebearer Fishes. Sci. Total Environ. 2019, 681, 503–515. [Google Scholar] [CrossRef] [PubMed]
- Morrissey, C.A.; Boldt, A.; Mapstone, A.; Newton, J.; Ormerod, S.J. Stable Isotopes as Indicators of Wastewater Effects on the Macroinvertebrates of Urban Rivers. Hydrobiologia 2013, 700, 231–244. [Google Scholar] [CrossRef]
- Sekabira, K.; Origa, H.O.; Basamba, T.A.; Mutumba, G.; Kakudidi, E. Application of Algae in Biomonitoring and Phytoextraction of Heavy Metals Contamination in Urban Stream Water. Int. J. Environ. Sci. Technol. 2011, 8, 115–128. [Google Scholar] [CrossRef]
- Yan, Z.; Chen, Y.; Bao, X.; Zhang, X.; Ling, X.; Lu, G.; Liu, J.; Nie, Y. Microplastic Pollution in an Urbanized River Affected by Water Diversion: Combining with Active Biomonitoring. J. Hazard. Mater. 2021, 417, 126058. [Google Scholar] [CrossRef]
- Bertoli, M.; Pastorino, P.; Lesa, D.; Renzi, M.; Anselmi, S.; Prearo, M.; Pizzul, E. Microplastics Accumulation in Functional Feeding Guilds and Functional Habit Groups of Freshwater Macrobenthic Invertebrates: Novel Insights in a Riverine Ecosystem. Sci. Total Environ. 2022, 804, 150207. [Google Scholar] [CrossRef]
Figure 1.
The spatiotemporal dimensions to be considered in the biomonitoring design.


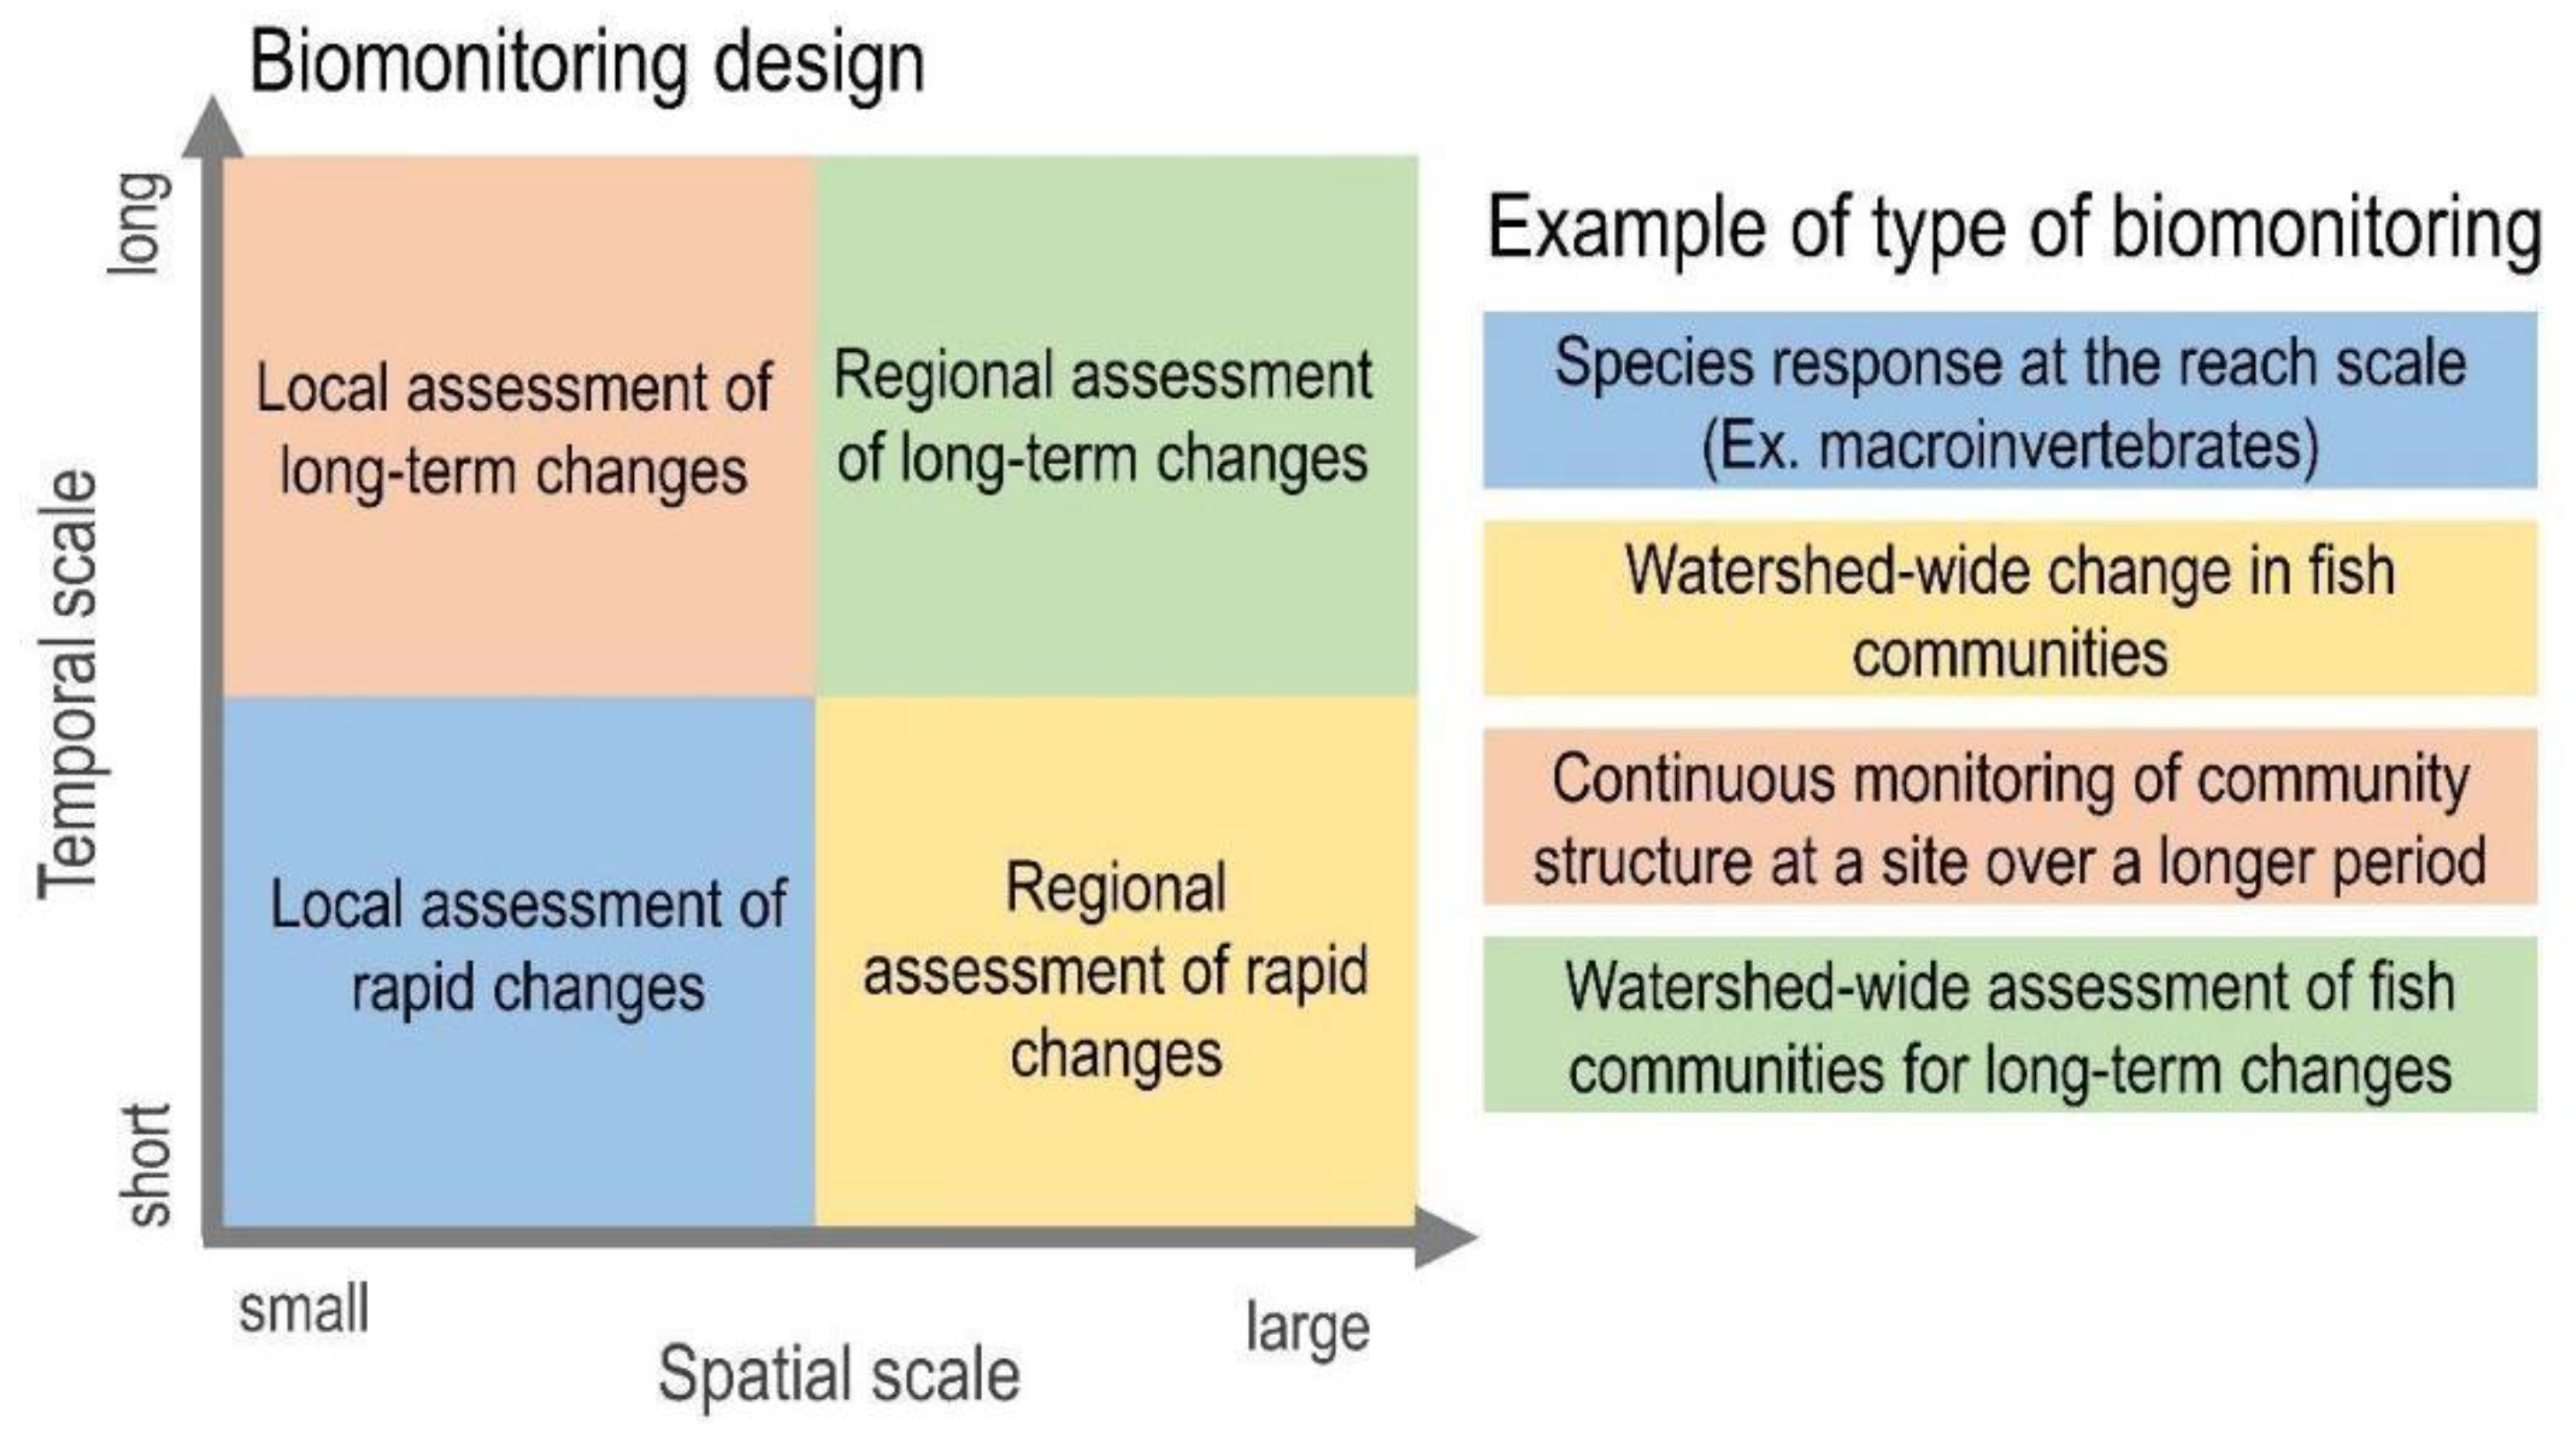
Table 1.
Main physical and chemical stressors on freshwaters of each land use type in the watershed.
Table 1.
Main physical and chemical stressors on freshwaters of each land use type in the watershed.
| Land Use Type | Main Stressors |
|---|---|
| Agriculture | Sedimentation, nutrient loading, changes in pH, increased temperature range (due to deforestation), and the increased runoff of pesticides and herbicides |
| Urban and industry | Industrial effluents, domestic wastewaters, the complex mixture of pollutants from urban drainage, heavy metals, temperature range increases, microplastics, increased nutrient loading, and changes in pH |
| Mining | Metal contamination from mining processes; sedimentation |
| Forestry | Fluctuations in water yield and nutrient load, changes in pH, pest control, and increased sediment inputs from harvesting |
| Pasture | Fertilizer runoff, organic matter loads, increased temperature range, and sedimentation |
Disclaimer/Publisher’s Note: The statements, opinions and data contained in all publications are solely those of the individual author(s) and contributor(s) and not of MDPI and/or the editor(s). MDPI and/or the editor(s) disclaim responsibility for any injury to people or property resulting from any ideas, methods, instructions or products referred to in the content. |
© 2023 by the authors. Licensee MDPI, Basel, Switzerland. This article is an open access article distributed under the terms and conditions of the Creative Commons Attribution (CC BY) license (https://creativecommons.org/licenses/by/4.0/).
Share and Cite
MDPI and ACS Style
de Mello, K.; Taniwaki, R.H.; Macedo, D.R.; Leal, C.G.; Randhir, T.O. Biomonitoring for Watershed Protection from a Multiscale Land-Use Perspective. Diversity 2023, 15, 636. https://doi.org/10.3390/d15050636
AMA Style
de Mello K, Taniwaki RH, Macedo DR, Leal CG, Randhir TO. Biomonitoring for Watershed Protection from a Multiscale Land-Use Perspective. Diversity. 2023; 15(5):636. https://doi.org/10.3390/d15050636
Chicago/Turabian Stylede Mello, Kaline, Ricardo Hideo Taniwaki, Diego Rodrigues Macedo, Cecília Gontijo Leal, and Timothy O. Randhir. 2023. "Biomonitoring for Watershed Protection from a Multiscale Land-Use Perspective" Diversity 15, no. 5: 636. https://doi.org/10.3390/d15050636
Note that from the first issue of 2016, this journal uses article numbers instead of page numbers. See further details here.