Article

Application of Phytoplankton Taxonomic α-Diversity Indices to Assess Trophic States in Barrier Lake: A Case of Jingpo Lake

1
College of Life Science and Technology, Harbin Normal University, Harbin 150025, China
2
Key Laboratory of Biodiversity of Aquatic Organisms, Harbin Normal University, Harbin 150025, China
3
Modern Educational Technology and Experiment Center, Harbin Normal University, Harbin 150025, China
*
Authors to whom correspondence should be addressed.
These authors contributed equally to this work.
Diversity 2022, 14(11), 1003; https://doi.org/10.3390/d14111003
Submission received: 19 October 2022 / Revised: 16 November 2022 / Accepted: 17 November 2022 / Published: 19 November 2022
(This article belongs to the Special Issue Diversity and Ecology of Algae in China)

Abstract

:
Phytoplankton taxonomic α-diversity indices are useful tools to characterize the trophic states in freshwater ecosystems. However, the application of these indices to assess trophic states in large barrier lakes is rare, especially in China. To test the usefulness of phytoplankton taxonomic α-diversity indices in trophic state assessments, we investigated the taxonomic α-diversity-Comprehensive Trophic Level Index (TLI) relationships in the second largest alpine lava barrier lake (Jingpo Lake, China) in the rainy and dry season from 2017 to 2018. Based on a two-year dataset, we found that there was a significant difference in the phytoplankton community, α-diversity indices, and TLI dynamic between the rainy season and the dry season. First, there was significant variation in phytoplankton abundance, the Margalef index, and the Shannon-Wiener index in different hydrological periods (p < 0.05). Second, the mean TLI in the rainy season (44 ± 5) was higher than in the dry season (41 ± 5) (p < 0.05). Lastly, the response characteristics of the Margalef and Shannon-Wiener index with TLI were different in different hydrological periods, and the relationship between the Pielou evenness index and TLI was weak. This study highlights that phytoplankton taxonomic α-diversity indices are relevant tools in water quality assessments but selecting the fit index is necessary. The current study provides key information about phytoplankton community, α-diversity, and trophic states in the largest alpine lava barrier lake, and the results of the study will benefit water quality management and biodiversity conservation in barrier lakes.

1. Introduction

Phytoplankton are quantitatively vital primary producers in lake ecosystems [1]. They comprise more than half of the total primary production in lakes [2,3]. Thus, they play a critical role in lake food webs. Due to their key role in lake food webs, phytoplankton are one of the widely used biological quality parameters that monitor and assess freshwater ecosystems [4]. These examples have demonstrated that adequate investigation of the availability and limitations of α-diversity indices can provide important assistance for water quality conservation [5,6]. Additionally, phytoplankton communities play an important role regarding biomonitoring, particularly for the indication of anthropogenic eutrophication [7,8]. Phytoplankton diversity metrics are indisputably one of the most frequently used quantitative descriptors of water quality in freshwater ecosystems [9,10]. Metrics such as biomass, sensitivity/tolerance, composition, and bloom metrics are irrefutably useful ecological state indicators [11,12]. Phytoplankton taxonomic diversity indices are widely utilized to assess water quality because they are simple to calculate and contain detailed ecological information [13,14,15]. There are some arguments regarding the usefulness of phytoplankton taxonomic α-diversity indices in different aquatic systems (lotic or lentic ecosystem). Schuster et al. [14] noted that phytoplankton diversity metrics are relevant tools for describing lotic ecosystem properties, such as complexity, stability, and functioning. In recent years, phytoplankton diversity indices have become universal indices used for biological trophic states assessment in lentic ecosystems [15]. Thus, testing the usefulness of phytoplankton taxonomic diversity indices in trophic states assessments is beneficial for water quality management and biodiversity conservation.
Lake ecosystems experience various changes as a result of anthropogenic interference [16]. The input of agrochemicals from agricultural activities, urbanization, and tourism has a damaging impact on lake ecosystems [17]. Urbanization and anthropogenic discharge result in eutrophication in many inland lakes [18]. The loss of biodiversity and integrity have a major impact on the serving and functioning of lakes [19]. A significant measure of a healthy lake ecosystem is the state of the physicochemical environment and diversity indices. However, most studies showed that measuring physical and chemical water quality parameters did not accurately represent the status and disturbance events in the lake systems over time [13]. Phytoplankton α-diversity indices have proven to be the most successful in capturing instant impacts caused by pollutants at very low concentrations [15]. An increase in the phytoplankton Shannon-Wiener index, such as that shown in the study of Lake Chao Hu, may be a response to anthropogenic eutrophication [20]. Phytoplankton diversity patterns provide excellent information about anthropogenic impacts [14]. However, varying results have been reported for eutrophication in different areas. Notably, the correlation between phytoplankton diversity and trophic states in quake lakes remains poorly documented.
Heilongjiang province is one of the most developed areas in NE China. The 90.3 km2 area of Jingpo Lake, China’s largest alpine lava barrier lake, flows through the center of this region. The average depth of Jingpo Lake is 40 m. The Jingpo Lake has experienced rapid industrialization and urbanization since the end of the 1970s and it became one of the greatest hydroelectric power station regions and densely populated areas in northeastern China [21]. Furthermore, Jingpo Lake is an important tourism and cultural area. Urbanization, industrialization, agriculture, and tourism have resulted in eutrophication and pollution in Jingpo Lake in the past decade. Previous studies have shown that Jingpo Lake is mesotrophic to eutrophic [22]. The phytoplankton community documented in Jingpo Lake indicates a low diversity and a wide distribution of potentially harmful species [23,24]. However, none of these studies evaluated the relationship between phytoplankton α-diversity and trophic states in Jingpo Lake. The application of phytoplankton α-diversity indices should be strongly considered in rhithral and large river water quality assessments. However, the efficiency of phytoplankton α-diversity indices in assessing the water quality of barrier lakes are still disputed. Phytoplankton α-diversity indices are influenced by various physical disturbances and show high within year variability; thus, there is no agreement on the usefulness of these indices as water quality indicators.
This study involved a Comprehensive Trophic Level Index (TLI) where three α-diversities (the Shannon-Wiener, Margalef, and Pielou indices) were measured in the rainy season (August) and dry season (October) of Jingpo Lake from 2017 to 2018. Correlation analysis (CA) and spatial interpolation analysis (inverse distance weighting, IDW) were used to understand the response of phytoplankton taxonomic α-diversities to trophic states. The aims of the study are as follows: (1) to provide key information about phytoplankton community and α-diversity indices dynamics in Jingpo Lake, and (2) to test the usefulness of phytoplankton taxonomic diversity indices in assessing the trophic state in Jingpo Lake.

2. Materials and Methods

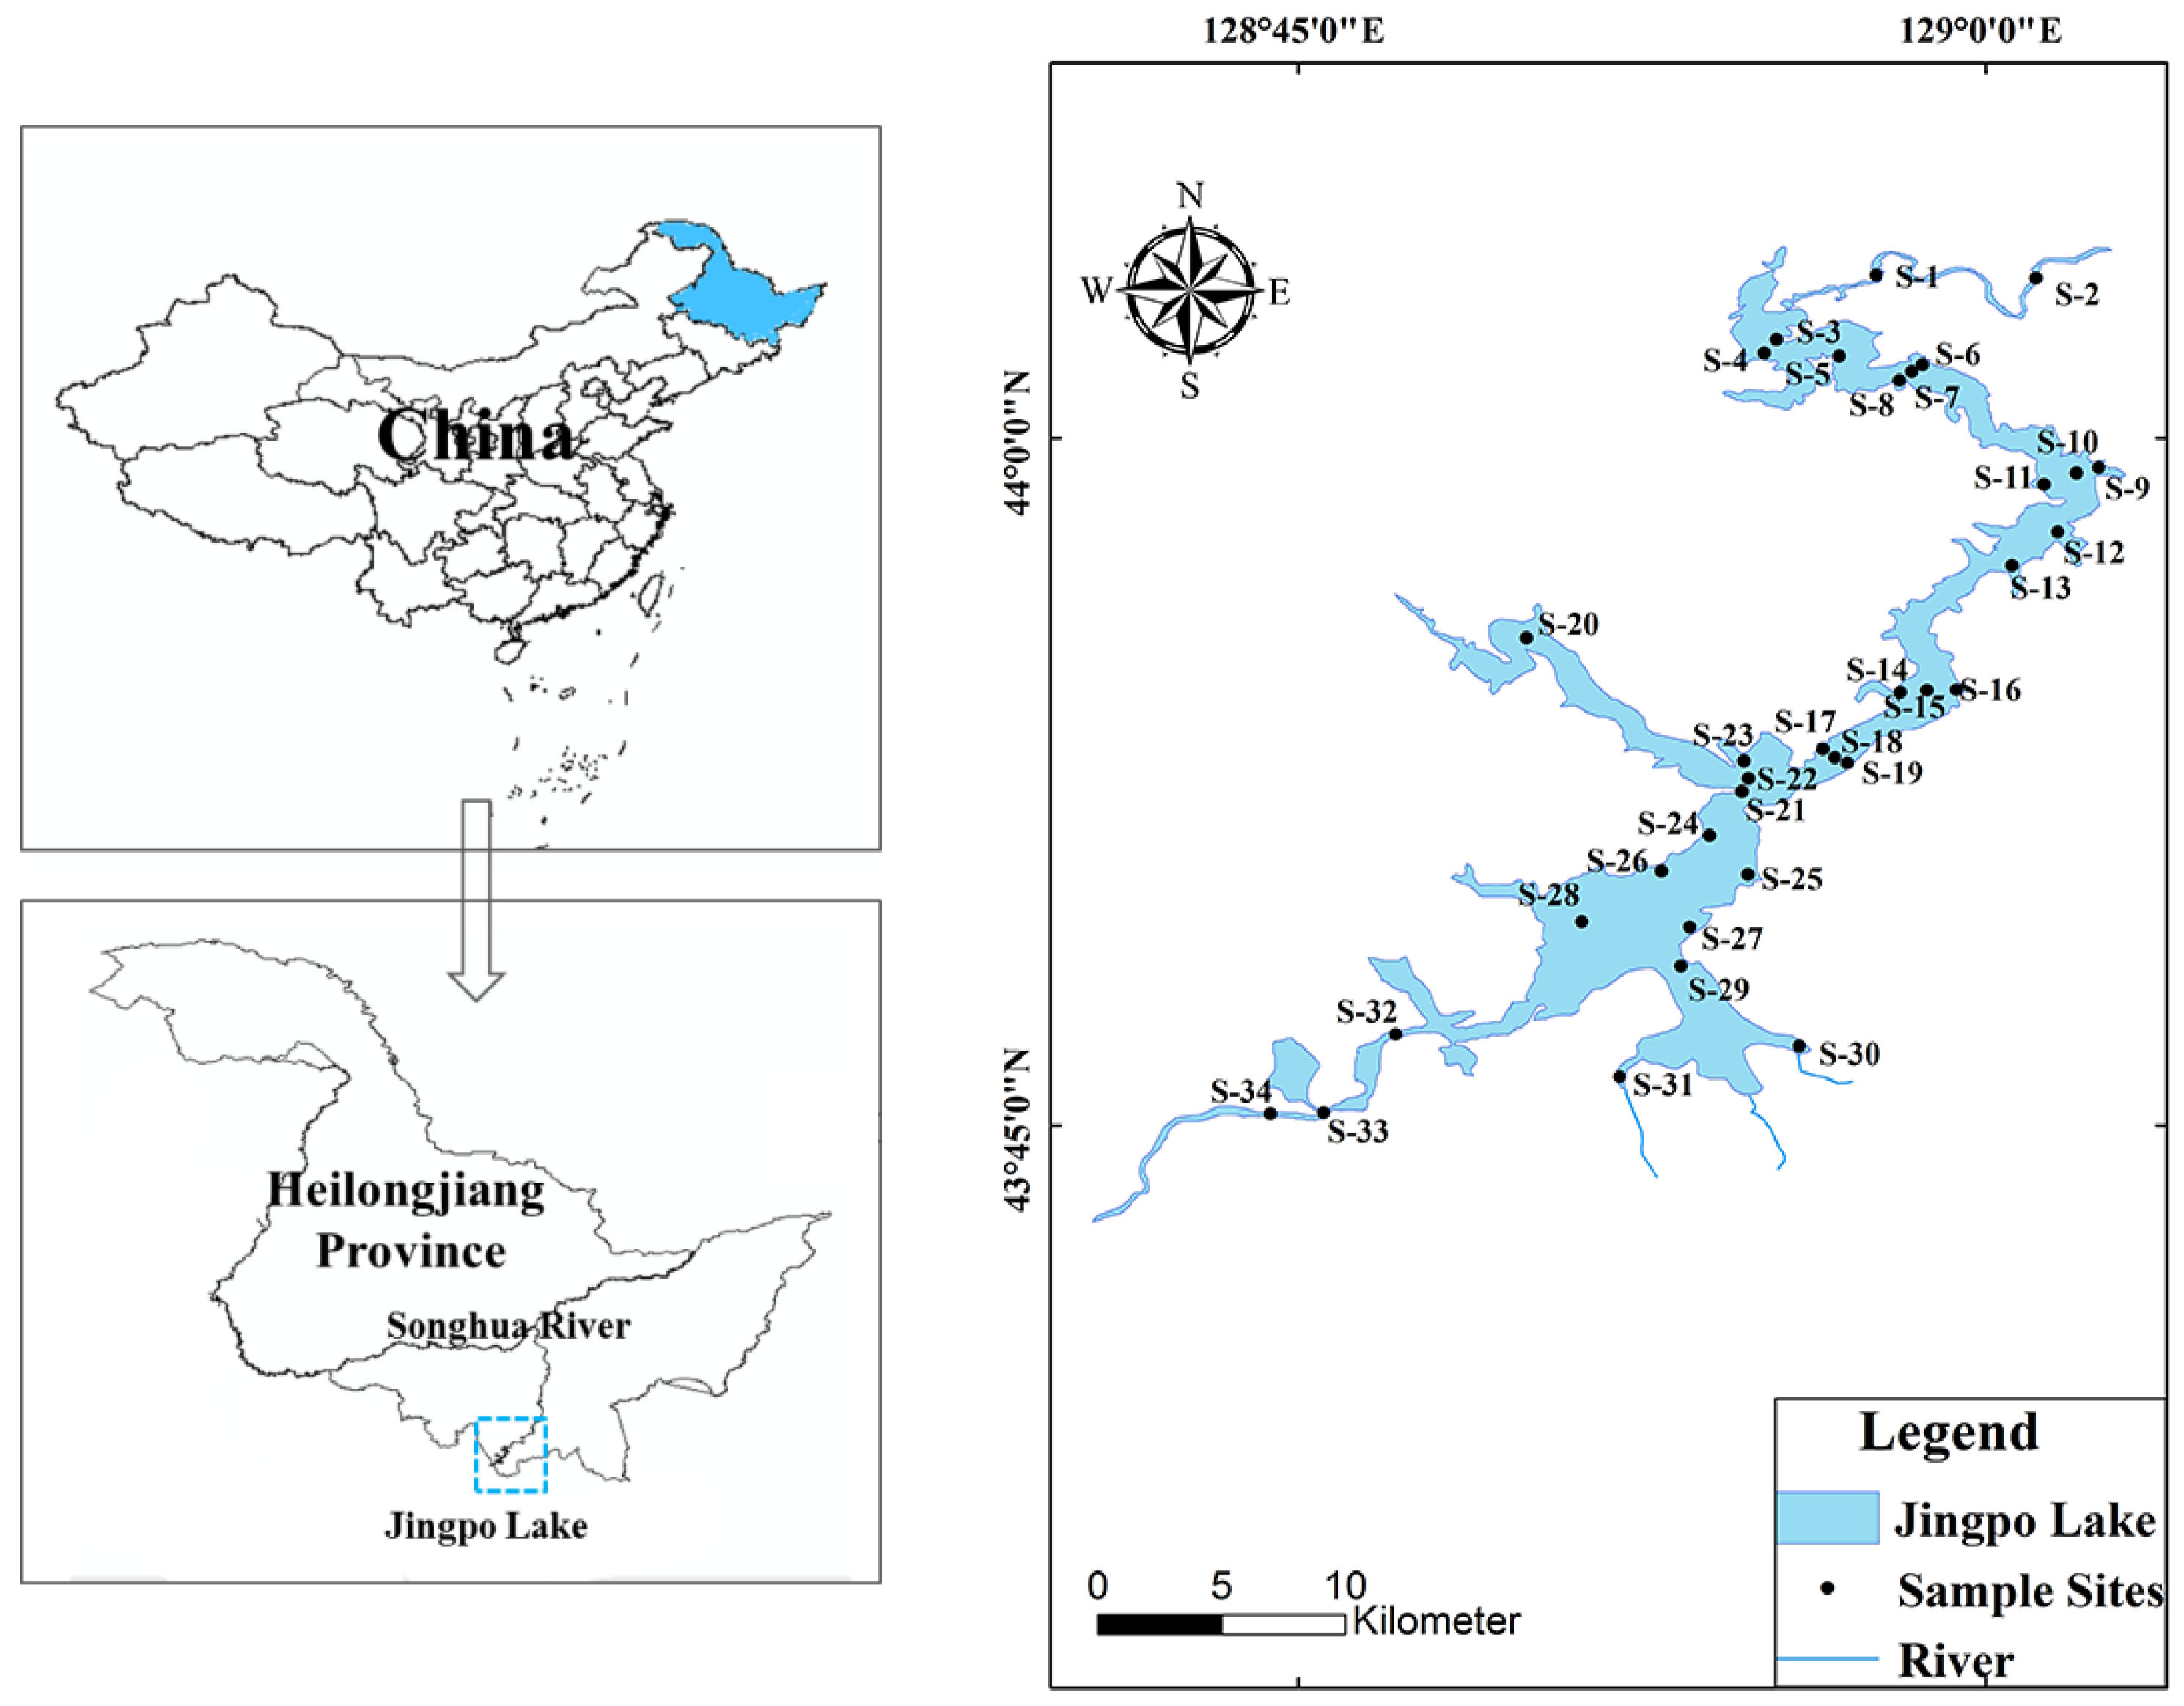
2.1. Study Area, Sample Collection, and Laboratory Analyses

Jingpo Lake is the largest alpine lava barrier lake in China and the second largest in the world. It is a typical river connected deep water lake with special topography and landform. It has a water area of 91.5 km2 and a water storage capacity of 11.8 × 10⁸ m3. It is about 45 km in length (mean depth 40 m, maximum depth 70 m in rainy season). The highest water level (354 m) occurs from June to August (rainy season), and the lowest water level (330 m) is recorded from September to November (dry season). In the middle of the 20th century, the water quality of Jingpo Lake was class I, based on the Surface Water Environmental Quality Standard China (GB 3838-2002). Due to the development of tourism and the intensification of anthropogenic activities, the water quality decreased to class Ⅲ in the 1980s, and the distribution area of blue-green algae increased gradually, accounting for 40% of the water surface at its highest time. In 2016, the water quality of Jingpo Lake was class Ⅳ.
In the present study, a total of four samples were taken during the study period (August 2017, October 2017, August 2018, October 2018). We collected water samples from thirty-four stations in Jingpo Lake (Figure 1). Sites S1 and S2 were located in the north part of the inflow rivers around Lake Jingpo, and Sites S30–S34 were located in the south part of the inflow rivers around Jingpo Lake. At each sampling station, geographic coordinates were determined using a Garmin Etrex GPS. Three replicate phytoplankton samples were collected from subsurface water (5-50 cm) using a 10 L bucket and then filtered through a 20 μm mesh plankton net. A total of 10 L were collected by a plastic bottle preserved with 1% Lugol’s solution and refrigerated in dark conditions until laboratory analysis [20]. At the same time with phytoplankton sampling, the 10 L samples for physical chemical analyses were collected. All of the samples for physical chemical analyses were preserved immediately in a brown glass bottle at 4 °C in a portable refrigerator. A YSI probe was used to assess physical parameters such as conductivity, dissolved oxygen, water temperature, and pH. Total nitrogen (TN), total phosphorus (TP), chlorophyll a (Chl-a), and chemical oxygen demand (CODMn) were determined according to the Chinese national standards for water quality in a laboratory within 24 h [20]. The phytoplankton samples were counted at the 0.1 mL counting chamber under 400× magnification by light microscope (Optec B302, Chongqing, China). The species were identified and enumerated to the highest resolution possible. The identification of phytoplankton species was completed using descriptions of species found in the literature [25,26].

2.2. Taxonomic α-Diversity Indices

The dominant species of phytoplankton were determined based on the dominance value, Y, for each species, as follows [27]:
Y = P i × f i
Phytoplankton taxonomy diversity indices were evaluated using the Shannon-Wiener diversity index, the Margalef index, and Pielou evenness index.
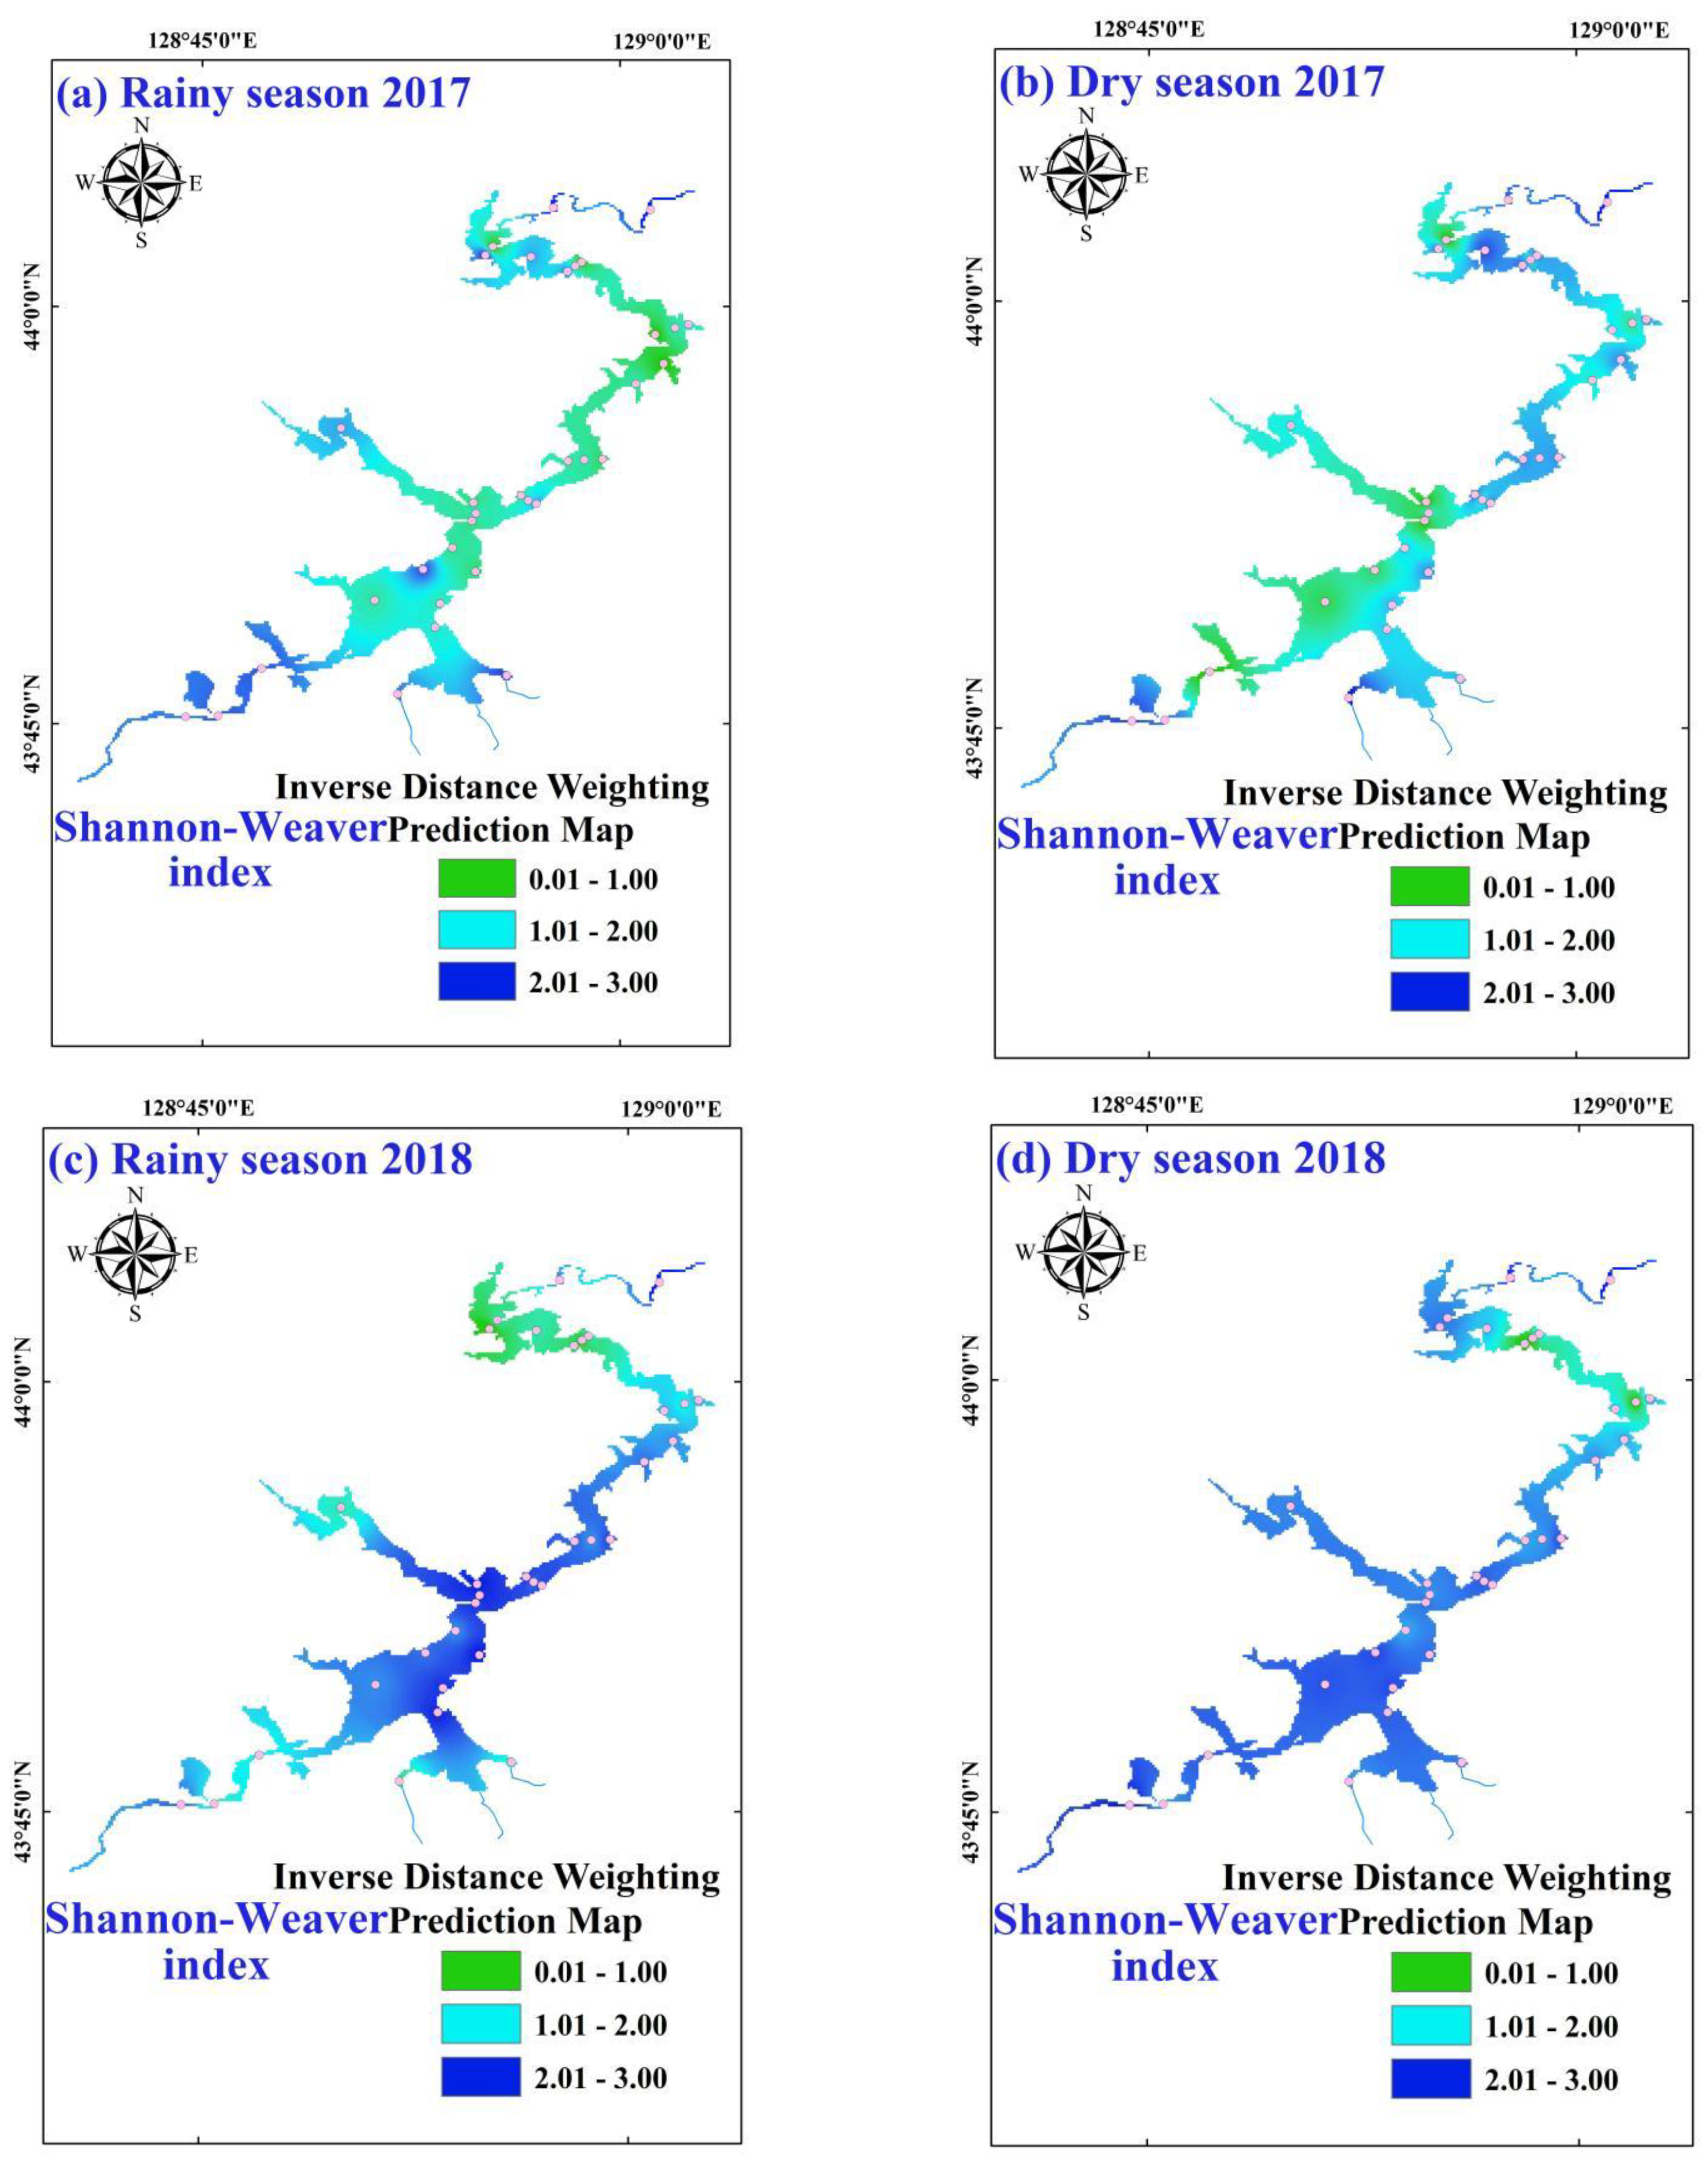
  • Shannon-Wiener index:
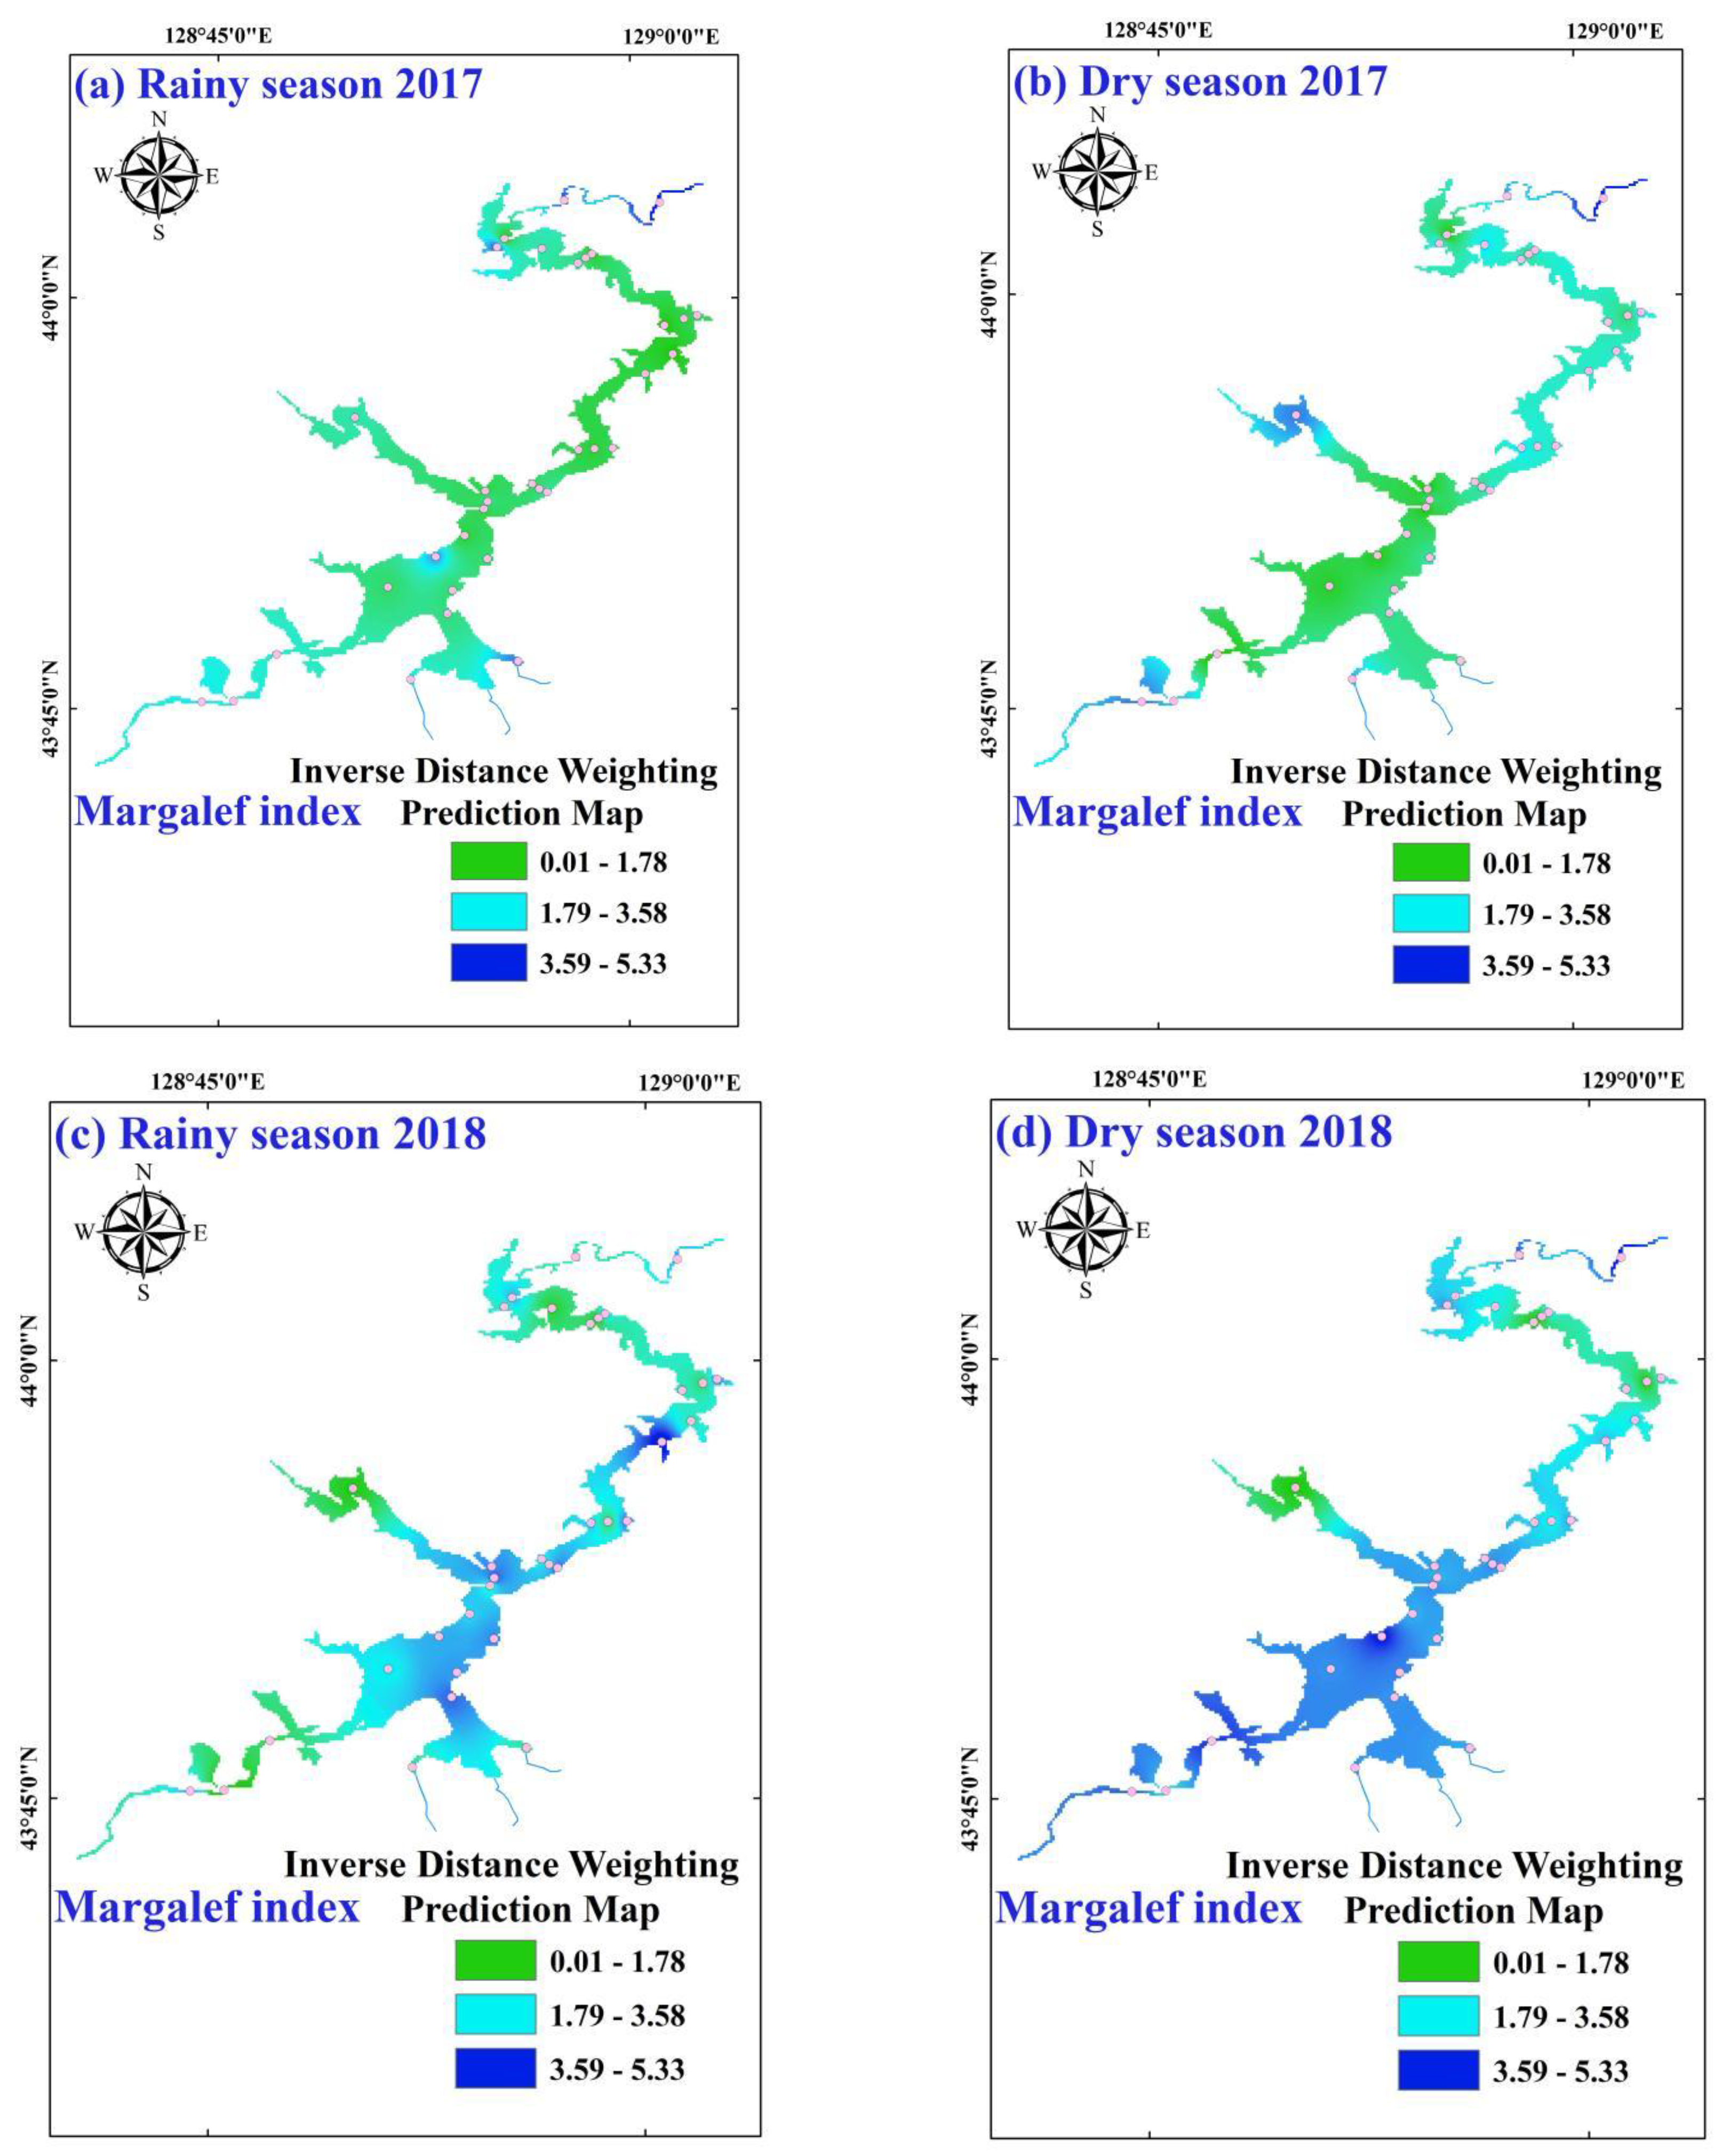
    H = i = 1 s P i × ln P i
  • Margalef index:
    H = ( S 1 ) / ln N
  • Pielou evenness index:
    J = H / ln S
    where ni and N are the numbers of individuals of species i and the total number of individuals of all species within site; S is the total species in the sample; fi is the occurrence frequency of the species i; Pi = ni/N. Evaluation standard: Margalef > 5 cleanness, >4 oligotrophic, >3 β-mesotrophic, <3 α-mesotrophic; Shannon-Wiener index > 3 oligotrophic, 2–3 β-mesotrophic, 1–2 α-mesotrophic, 0–1 eutrophic.
 

2.3. Statistical Analysis

In the current study, eight physicochemical parameters were considered for multivariate statistical analysis, including WT, DO, conductivity, pH, Chl-a, TN, TP, and CODMn. All eight factors and phytoplankton metrics were normalized using [log10(x ± 1)] transformation. Independent-samples t-test and Spearman correlation analysis were performed in SPSS 20.0 Software.

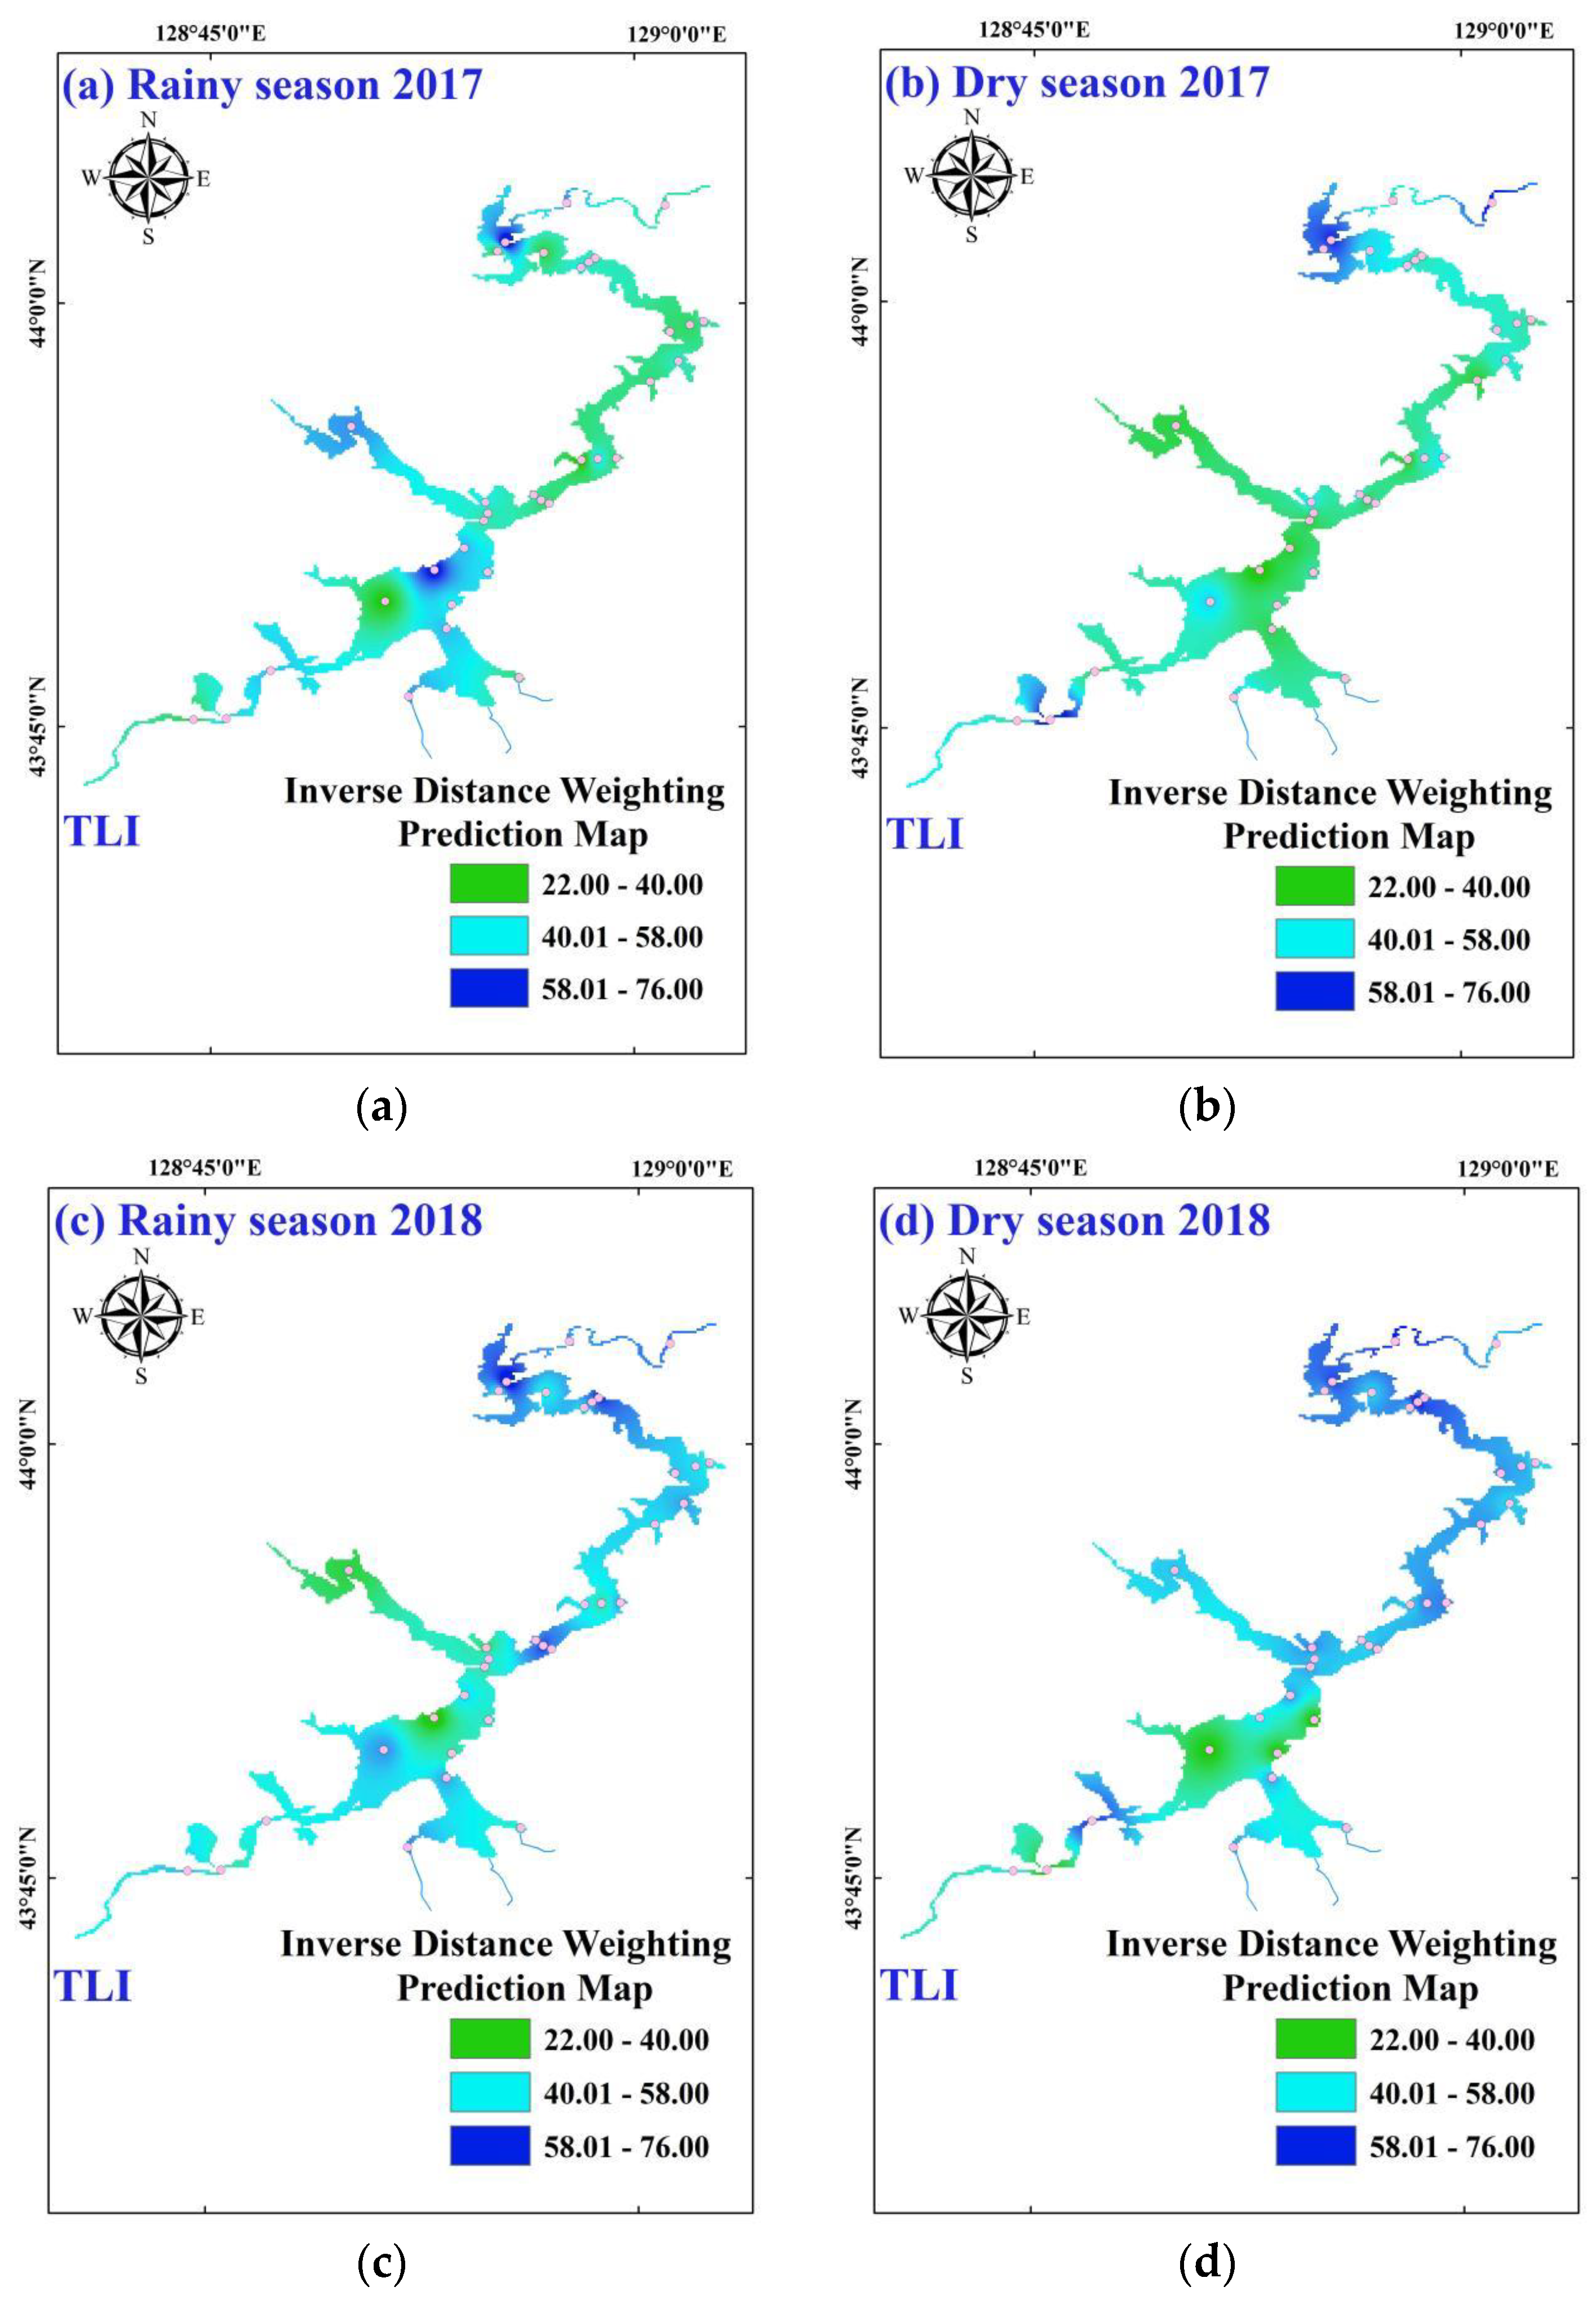
2.4. Comprehensive Trophic Level Index (TLI)

Comprehensive TLI was performed to determine the trophic status of Jingpo Lake. The equations for TLI are as follows [28]:
TLI(TN) = 10(14.625 + 4.979 ln TN)
TLI(TP) = 10(24.286 + 4.895 ln TP)
TLI(CODMn) = 10(6.230 + 2.079 ln CODMn)
TLI(∑) = TLI (TP) ∗ 0.3414 + TLI (TN) ∗ 0.3253 + TLI (CODMn) ∗ 0.3333
Evaluation standard: 0 < TLI ≤ 30 oligotrophic, 30 < TLI ≤ 50 mesotrophic, TLI > 50 eutrophic, 50 < TLI ≤ 60 light eutrophic, 60 < TLI ≤ 70 middle eutrophic, TLI > 70 high eutrophic [29].

3. Results

3.1. Environmental Characteristics and Trophic States

Four environmental parameters, WT, TN, TP, and CODMn, presented significant differences (p < 0.05) between the two periods, whereas three variables, conductivity, pH, and DO were not significantly different (p > 0.05) (Table 1). TP was generally high during the dry season, whereas TN was generally high during the rainy season. An analysis of the spatial and temporal variations of total TLI (the combination of the TLI for TP, TN, CODMn) was performed (Figure 2). The results of TLI indicated that the trophic states of the study area are mesotrophic. The mean TLI in the rainy season was 44 ± 5 and that in the dry season was 41 ± 5 (p < 0.05).

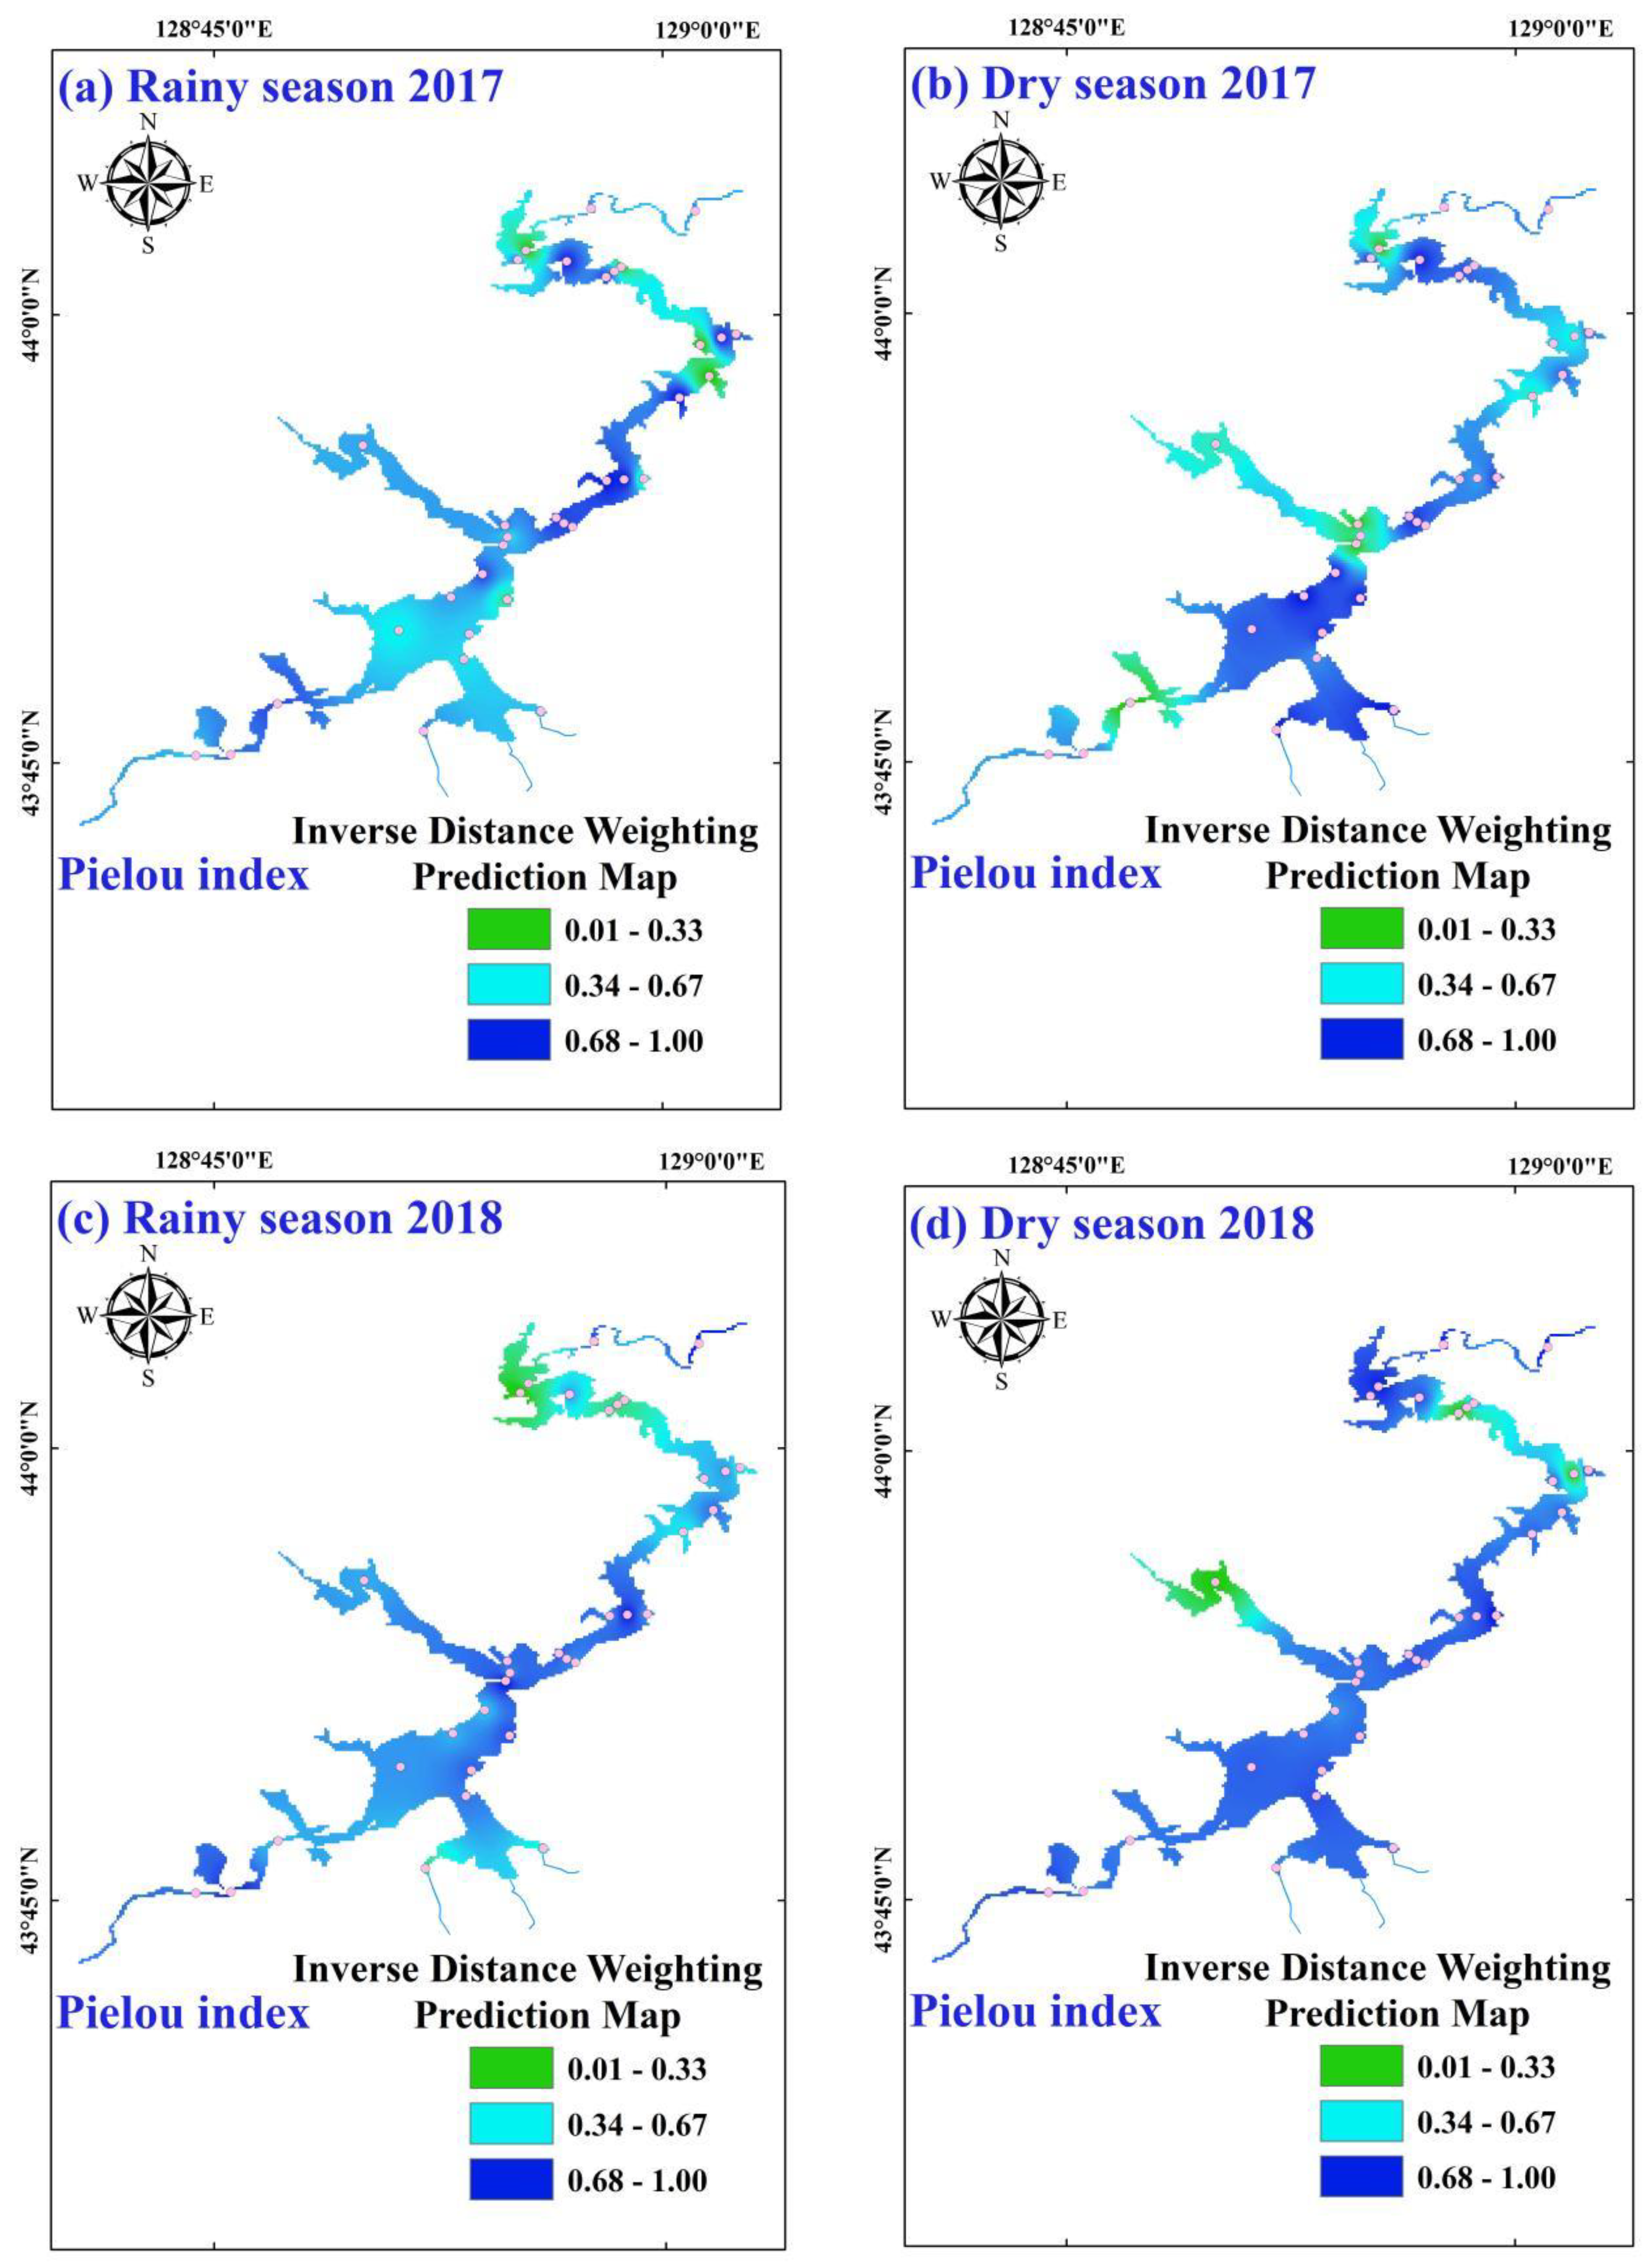
3.2. Temporal-Spatial Variations of Phytoplankton Diversity Indices

A total of 137 species of phytoplankton belonging to 8 phyla and 103 genera were identified, including Chlorophyta (37%), Bacillariophyta (31%), Cyanobacteria (16%), Euglenophyta (6%), Cryptophyta (4%), and others (6%). The range of total phytoplankton abundance at each sample station ranged from 0 × 104 ind./L to 1158.67 × 104 ind./L during the study period. There was significant variation in the phytoplankton abundance in different hydrological period (p < 0.05). Overall, Cyanobacteria and Bacillariophyta were codominant in the study period, which contributed to more than 80% of total phytoplankton abundance (mean 13.69 × 10⁴ ind./L and 90.43 × 10⁴ ind./L, respectively) (Table 2). According to the dominance index (Y ≥ 0.02), 34 species of dominant algae (Table 3) were identified. The five dominant species were identified with the highest relative abundance, namely Fragilaria capucina, Melosira granulata, Melosira varians, Nitzschia palea, and Cryptomonas erosa. The Margalef index showed a significant change between the rainy season (2.15 ± 2.58) and the dry season (2.27 ± 2.66). The t-test showed a significant difference in the hydrological period (p < 0.05). The spatial and temporal distribution of phytoplankton determined by the Shannon-Wiener index was very similar to the Margalef index. The Shannon-Wiener index of the interconnected aquatic habitats was 1.69 ± 1.34 in the rainy season and 1.54 ± 1.42 in the dry season. The Margalef index patterns revealed that the increased rainfall reduced the richness of the phytoplankton community. There was also a significant difference in the Margalef (Figure 3) and Shannon-Wiener (Figure 4) indices (p < 0.05) between the 2017 and the 2018. The Pielou evenness index of the rainy season was 0.70 ± 0.36 and 0.72 ± 0.28 in the dry season (Figure 5).

3.3. The Correlation between Phytoplankton Taxonomic α-Diversity Indices and TLI

Correlation analysis (CA) showed that the TLI in all samples was weakly positively correlated when using the Margalef (r = 0.066, p > 0.05), Shannon-Wiener (r = 0.074, p > 0.05), and Pielou indices (r = 0.074, p > 0.05) (Table 4) in all samples. Additionally, CA in all samples based on different hydrological periods was performed. The result of CA between phytoplankton taxonomic α-diversity indices and TLI in rainy season samples was different in all samples (Table 4), which significantly correlates with Margalef (r = 0.495, p < 0.01) and Shannon-Wiener indices (r = 0.494, p < 0.01). The results of CA between phytoplankton taxonomic α-diversity indices and TLI in dry season were similar in all the samples, with significantly negative correlation with the Margalef (r = −0.513, p < 0.01) and Shannon-Wiener indices (r = −0.411, p < 0.01) (Table 4). In this study, Spearman correlation analysis showed that the Margalef index for all samples was significantly positively correlated with the Shannon-Wiener index (r = 0.886, p < 0.01), and significantly negatively correlated with the Pielou index (r = −0.241, p < 0.01) (Table 5). In summary, the Margalef and Shannon-Wiener indices showed a strong correlation with the other two indices in all hydrological periods.

4. Discussion

Two basic techniques from limnology and ecology are used to assess lake trophic states. One is TLI, such as using the weight score of concentration of TN, TP, and CODMn in the water column [29]. The other is taxonomic α-diversity indices in the water column [30,31]. Based on these two tools, it is possible to comprehensively reveal the trophic states in barrier lakes. The development of efficient tools to assess trophic states is a key component in environmental safety conservation and ecological health framework. Taxonomic α-diversity indices reflect the present state and past trends of accurate information with respect to the environmental behavior since it records cumulative changes over time [32]. In particular, phytoplankton taxonomic α-diversity indices have also been used as a tool to assess the impact of hydrological connectivity on phytoplankton community dynamics [33,34]. In this study, we hypothesized that the phytoplankton taxonomic α-diversity indices had the potential to provide a signal correlation with trophic states between different hydrological periods in the barrier lake. We found that the Margalef and Shannon-Wiener indices are closely associated with TLI (p < 0.05). In addition, we found that there was a weak correlation between the Pielou evenness index and TLI (p > 0.05). This finding verified our hypothesis that the phytoplankton taxonomic diversity indices were a potential signal for indicating trophic states in Jingpo Lake. In future studies, it is necessary to choose the appropriate phytoplankton taxonomic α-diversity index to assess trophic states in barrier lake.

4.1. Effects of Environmental Factors on Phytoplankton Community Structure

The dynamic changes of phytoplankton richness, composition, and abundance in temperate lakes mainly depend on the changes of environmental factors [35]. Classical PEG models of phytoplankton show that temperate lakes are dominated by Chlorophyta in summer and Cyanobacteria in late summer and early autumn. In this study, it was observed that the abundance of phytoplankton decreased significantly from the rainy season (average 1.60 ×10⁶ ind./L) to the dry season (average 1.00 ×10⁶ ind./L), during which the abundance of Bacillariophyta, Chlorophyta, and Cyanobacteria decreased (p < 0.05), and the abundance of Cryptophyta increased (ns). Therefore, the changes of phytoplankton community structure were consistent with the PEG model. Brasil et al. [36] reported that rainfall is the key component in improving nutrient concentration, leading to higher algal biomass. These finding indicate that rainfall is a key component in influencing the environmental variables in temperate lakes [37]. The natural disturbance from rainfall leading to an increase in phytoplankton abundance has been widely recorded in template and trophic lakes [38,39]. In addition, we found that the abundance of phytoplankton cells in 2017 was significantly lower than in 2018, due to the extremely heavy rainfall in Jingpo Lake Basin in 2017 (rainfall was approximately 150 mm), which severely reduced the water transparency and further affected the phytoplankton community structure. Meng et al. [40] noted that rainfall events are a key component which impact the phytoplankton colonization and reproduction. The increased abundance from the 2017 to 2018 indicted that the phytoplankton abundance is a relevant tool used to indicate the natural disturbance in a barrier lake.
The change in water nutrient concentration will also affect the phytoplankton community. Nitrogen is one of the large number of elements required for the growth and metabolism of phytoplankton, and the change of its concentration affects the metabolism of aquatic organisms and the dynamic pattern of the community [41]. TN is used as a nutrient indicator to evaluate water quality in the National Environmental Quality Standards for Surface Water of China (GB 3838-2002). Furthermore, the TN concentration was widely considered as the indicator for eutrophication in rivers and lakes [42,43]. The TN concentration from the dry season (0.14 ± 0.09 mg/L) was significantly lower than from the rainy season (0.20 ± 0.08 mg/L) (p < 0.05) (Table 1). Bacillariophyta was dominant in the phytoplankton community (Table 2). Previous studies have shown that the Bacillariophyta is suited to a high-nitrogen environment, and its growth requires more nitrogen [41,44]. In 2018, the mean value of TN was the highest during the study period. Moreover, the abundance of Bacillariophyta, which was correspondingly higher, also confirmed this point. Therefore, the increase of TN concentration not only has a positive effect on colonization, but also has a positive effect on reproduction. With appropriate light, temperature, and nutrient conditions, the critical N/P mass ratio of algae life is 7:1 [45]. In Jingpo Lake, the N/P ratio is greater than seven in both rainy and dry seasons, indicating that Jingpo Lake is a typical phosphorus restricted water body. Phosphorus is an essential element for aquatic biomass synthesis and energy transfer [46]. The TP concentration in rainy season was significantly lower than that in dry season (p < 0.05), and the mean values of TP in the two periods were 0.02 mg/L and 0.03 mg/L, respectively. Generally, Chlorophyta and Cyanobacteria are more suitable for water with high phosphorus and when phosphorus was the minimum limiting factor. As a result, they were in a disadvantageous position in the competition and could not occupy the dominant position in the community, which was consistent with the community structure of Jingpo Lake. CODMn is often used as an important indicator for monitoring point source pollution and non-point source pollution [47]. The external pollution of Jingpo Lake is mainly from the industrial wastewater and domestic sewage of Dunhua City located upstream of Jingpo Lake, and CODMn is mainly affected by the industrial wastewater. In the dry season, CODMn was significantly higher than that in the rainy season (p < 0.05), which may be because the hydrologic connectivity was higher under the influence of rainfall and surface runoff in the wet season, and the inflow of external water diluted the original pollutants, leading to the reduction of pollutant content in this period. Therefore, point source pollution and non-point source pollution may be one of the factors affecting the composition and distribution of phytoplankton in Jingpo Lake.
Recent studies have proven that extreme nutrient input from anthropogenic activities leads to eutrophication and harmful algal blooms in lake ecosystems [48]. Based on TLI, we found that the trophic state of the study is mesotrophic. Although the physical and chemical indices and phytoplankton community structure of Jingpo Lake are changing dynamically, we found that the nutrient level of Jingpo Lake is stable with medium nutrient level compared with previous studies [49].

4.2. Response of Phytoplankton α-Diversity Indices to Nutrient State Changes in Different Hydrological Periods

Phytoplankton community is sensitive to water quality changes and its community structure and diversity are often used as important biological indicators to evaluate water quality and nutritional status [36,50]. In this study, the Spearman correlation analysis showed that the Margalef index of all samples was significantly positively correlated with the Shannon-Wiener index (r = 0.886, p < 0.01), and significantly negatively correlated with the Pielou index (r = −0.241, p < 0.01). The results revealed that the ecological information contained in the Margalef and Shannon-Wiener indices has high redundancy.
By analyzing the correlation between phytoplankton α-diversity index and TLI, we found that the Margalef and Shannon-Wiener indices were significantly different from TLI, indicating that the α-diversity index and nutrient response were different. The Margalef index quantifies the diversity relating specific richness to the total number of individuals [51]. The Shannon-Wiener index is based on information theory and assumes that individuals are sampled at random from an “indefinitely large” community, and that all the species are represented in the sample [52]. In this study, the Margalef and Shannon-Wiener indices were significantly positively correlated with TLI in the rainy season, and significantly negatively correlated with TLI in the dry season (p < 0.01). However, they were weakly positively correlated with TLI in all samples. Based on the results of the Margalef and Shannon-Wiener indices during the rainy season, we found that increased hydrological connectivity and disturbance of rainfall events can accelerate the transport of organisms and nutrients, which may be an important cause of phytoplankton community succession. The moderate disturbance hypothesis suggests that, within a certain environmental threshold, appropriate disturbances can increase phytoplankton biodiversity, which is consistent with the results obtained during the rainy season [53,54].
The Margalef and Shannon-Wiener indices were significantly negatively correlated with TLI during the dry season, possibly because phytoplankton diversity in freshwater lakes is affected by bottom-up effects (control of nutrient levels) and top-down effects (control of zooplankton predation) [55,56]. However, the composition of fish and algae in oligotrophic or mesotrophic lakes is different from that in eutrophic lakes [57]. Therefore, the mixing of the two effects will reduce the correlation between water nutrient concentration and phytoplankton diversity. This also explains the weak positive correlation between the Margalef and Shannon-Wiener indices with TLI in all samples during the study period. The study of Yang et al. [58] proved that, in lakes with severe eutrophication, the Shannon-Wiener index of phytoplankton has a significant positive interannual correlation with TLI, while the Margalef and Pielou indices have a significant negative interannual correlation with TLI. However, different results were obtained in our study on the nutrient level of Jingpo Lake. We suggest that the effects of natural disturbances (e.g., rainfall) on the results of the Margalef and Shannon-Wiener indices should be taken into account when applying them.
There was a weak positive correlation between the Pielou index and TLI during the study period (p > 0.05). The Pielou index is considered to be an indicator of community uniformity in lake ecosystems. In addition, although limited by abundance information, the Pielou index has the advantage of focusing on uniformity. Generally, with an increase in water nutrient level, the growth and reproduction of phytoplankton are promoted, and the uniformity of phytoplankton community is increased. In the current study, although the TLI in rainy season (mean 44.42) was higher than that in the dry season (mean 41.29), the correlation coefficient between the Pielou index and TLI in the rainy season was only 0.043. These results may be attributed to natural disturbances in rainfall during the study period. The disturbance of rainfall not only affects the light capture of phytoplankton, but also absorbs living and non-living matter, including nutrients, accelerating the decline of phytoplankton diversity and homogeneity [38,59]. Therefore, natural disturbances such as rainfall will weaken the ability of the Pielou index to describe the nutritional status of Jingpo Lake.
Our study provides evidence that the results of the Margalef and Shannon-Wiener indices with TLI in mesotrophic lakes at different hydrological periods were significantly different from those in eutrophic lakes. In fact, understanding the relationships between phytoplankton taxonomic α-diversity indices and trophic state is still a challenge faced in ecological research. Moreover, it is essential for establishing a taxonomic index database of barrier lakes in a larger spatial and temporal scale. In addition, because the nutrients in a barrier lake water column come not only from a watershed but also from lake sediment, the nutrient content in the water column may be subject to seasonal and temporal variation. We propose that studies focusing on the relationships between phytoplankton taxonomic α-diversity indices and trophic state of sediments are necessary. In the future, it is necessary for further surveys to focus on the differential stratification of phytoplankton communities (three depths: surface, middle, and bottom) in Jingpo Lake.

5. Conclusions

In the current study, we provided key information about phytoplankton taxonomic α-diversity in Jingpo Lake, which is the largest alpine lava barrier lake in China. The phytoplankton community, three α-diversity indices, and TLI patterns were developed in this study from 2017 to 2018 in Jingpo Lake. We found that the phytoplankton community variation was closely linked to trophic states. Furthermore, the diatom distribution pattern was a potential indictor for eutrophication in the barrier lake. The CA revealed that the Margalef and Shannon-Wiener indices were a relevant tool to characterize the trophic states especially in the rainy season. All of these results highlight that phytoplankton taxonomic α-diversity indices are an effective tool that can be used to assess the trophic states in barrier lakes.

Author Contributions

X.L. and Y.C. formulated a concept of the paper, wrote its original draft, and performed software; Y.L., L.Q., T.S. and N.Z. performed the review, editing the manuscript, investigation, improved the original text, figures and funding; Y.F. performed the project administration. All authors have read and agreed to the published version of the manuscript.

Funding

The National Natural Science Foundation of China (31870187, 31970213) and Natural Science Foundation of Heilongjiang, China (YQ2020C032, LH2020C067), Innovative talent training program of Heilongjiang (UNPYSCT-2020133), Harbin Normal University Doctoral Innovation Fund Project (HSDBSCX2019-04) and Science and Technology Innovation Climbing Program of Harbin Normal University (No. XPPY202207).

Data Availability Statement

Not Applicable.

Acknowledgments

We thanks for Zhenxiang Li, Hao Wang, Chao Ma, Yan Zhang’s works for data analysis.

Conflicts of Interest

The authors declare no conflict of interest.

References

  1. Amorim, C.A.; Valenca, C.R.; Moura-Falcao, R.H.; Moura, A.d.N. Seasonal variations of morpho-functional phytoplankton groups influence the top-down control of a cladoceran in a tropical hypereutrophic lake. Aquat. Ecol. 2019, 53, 453–464. [Google Scholar] [CrossRef]
  2. Bolgovics, A.; B-Beres, V.; Varbiro, G.; Krasznai-K, E.A.; Acs, E.; Kiss, K.T.; Borics, G. Groups of small lakes maintain larger microalgal diversity than large ones. Sci. Total Environ. 2019, 678, 162–172. [Google Scholar] [CrossRef] [PubMed] [Green Version]
  3. Jacquemin, C.; Bertrand, C.; Franquet, E.; Mounier, S.; Misson, B.; Oursel, B.; Cavalli, L. Effects of catchment area and nutrient deposition regime on phytoplankton functionality in alpine lakes. Sci. Total Environ. 2019, 674, 114–127. [Google Scholar] [CrossRef] [PubMed]
  4. Liu, B.; Chen, S.; Liu, H.; Guan, Y. Blue-green algae enhanced performance of diatom-based multimetric index on de fining lake condition under high level of human disturbance. Sci. Total Environ. 2020, 730. [Google Scholar] [CrossRef] [PubMed]
  5. Demir, A.N.; Fakioglu, O.; Dural, B. Phytoplankton functional groups provide a quality assessment method by the Q assemblage index in Lake Mogan (Turkey). Turk. J. Bot. 2014, 38, 169–179. [Google Scholar] [CrossRef]
  6. Korneva, L.G.; Solovyeva, V.V. Dynamics of Morphofuncitonal Groups of Phytoplankton in the Rybinsk Resrevoir and Assessment of the Resevoir Water Quality by the Community Index. Water Resour. 2021, 48, 65–72. [Google Scholar] [CrossRef]
  7. Liu, L.; Zhu, Y.; Li, B.; Chen, X. Assessment of phytoplankton biological integrity in Jiangsu section of Yangtze River based on MBFG. Water Res. Protein 2020, 36, 13–20. [Google Scholar]
  8. Ward, B.B.; Van Oostende, N. Phytoplankton assemblage during the North Atlantic spring bloom assessed from functional gene analysis. J. Plankton Res. 2016, 38, 1135–1150. [Google Scholar] [CrossRef] [Green Version]
  9. Marra, R.C.; Algarte, V.M.; Ludwig, T.A.V.; Padial, A.A. Diatom diversity at multiple scales in urban reservoirs in Southern Brazil reveals the likely role of trophic state. Limnologica 2018, 70, 49–57. [Google Scholar] [CrossRef]
  10. Behl, S.; Donval, A.; Stibor, H. The relative importance of species diversity and functional group diversity on carbon uptake in phytoplankton communities. Limnol. Oceanogr. 2011, 56, 683–694. [Google Scholar] [CrossRef]
  11. Beisner, B.E.; Longhi, M.L. Spatial overlap in lake phytoplankton: Relations with environmental factors and consequences for diversity. Limnol. Oceanogr. 2013, 58, 1419–1430. [Google Scholar] [CrossRef]
  12. Terseleer, N.; Bruggeman, J.; Lancelot, C.; Gypens, N. Trait-based representation of diatom functional diversity in a plankton functional type model of the eutrophied southern North Sea. Limnol. Oceanogr. 2014, 59, 1958–1972. [Google Scholar] [CrossRef] [Green Version]
  13. Rodrigues, L.C.; Simoes, N.R.; Bovo-Scomparin, V.M.; Jati, S.; Santana, N.F.; Roberto, M.C.; Train, S. Phytoplankton alpha diversity as an indicator of environmental changes in a neotropical floodplain. Ecol. Indic. 2015, 48, 334–341. [Google Scholar] [CrossRef]
  14. Schuster, K.F.; Tremarin, P.I.; de Souza-Franco, G.M. Alpha and beta diversity of phytoplankton in two subtropical eutrophic streams in southern Brazil. Acta Bot. Bras. 2015, 29, 597–607. [Google Scholar] [CrossRef] [Green Version]
  15. Nabout, J.C.; Nogueira, I.d.S.; de Oliveira, L.G.; Morais, R.R. Phytoplankton diversity (alpha, beta, and gamma) from the Araguaia River tropical floodplain lakes (central Brazil). Hydrobiologia 2007, 575, 455–461. [Google Scholar] [CrossRef]
  16. Vitousek, P.M.; Aber, J.D.; Howarth, R.W.; Likens, G.E.; Matson, P.A.; Schindler, D.W.; Schlesinger, W.H.; Tilman, D. Human alteration of the global nitrogen cycle: Sources and consequences. Ecol. Appl. 1997, 7, 737–750. [Google Scholar] [CrossRef] [Green Version]
  17. Dudgeon, D.; Arthington, A.H.; Gessner, M.O.; Kawabata, Z.-I.; Knowler, D.J.; Leveque, C.; Naiman, R.J.; Prieur-Richard, A.-H.; Soto, D.; Stiassny, M.L.J.; et al. Freshwater biodiversity: Importance, threats, status and conservation challenges. Biol. Rev. 2006, 81, 163–182. [Google Scholar] [CrossRef]
  18. Paerl, H.W.; Otten, T.G. Harmful Cyanobacterial Blooms: Causes, Consequences, and Controls. Microb. Ecol. 2013, 65, 995–1010. [Google Scholar] [CrossRef]
  19. Strayer, D.L.; Dudgeon, D. Freshwater biodiversity conservation: Recent progress and future challenges. J. N. Am. Benthol. Soc. 2010, 29, 344–358. [Google Scholar] [CrossRef] [Green Version]
  20. Jiang, Y.J.; He, W.; Liu, W.X.; Qin, N.; Ouyang, H.L.; Wang, Q.M.; Kong, X.Z.; He, Q.S.; Yang, C.; Yang, B.; et al. The seasonal and spatial variations of phytoplankton community and their correlation with environmental factors in a large eutrophic Chinese lake (Lake Chaohu). Ecol. Indic. 2014, 40, 58–67. [Google Scholar] [CrossRef]
  21. Chen, R.; Shen, J.; Li, C.H.; Zhang, E.L.; Sun, W.W.; Ji, M. Mid- to late-Holocene East Asian summer monsoon variability recorded in lacustrine sediments from Jingpo Lake, Northeastern China. Holocene 2015, 25, 454–468. [Google Scholar] [CrossRef]
  22. Li, Y.L.; Liao, M.N.; Chen, R.; Shen, J. Diatom-based inference of variations in the strength of East Asian spring wind speeds since mid-Holocene. Palaeogeogr. Palaeocl. 2015, 418, 65–74. [Google Scholar] [CrossRef]
  23. Lin, K.; Wang, X.; Wang, Y.; Zhou, J.; Liu, L.; Zhu, Y.; Xia, Y. Composition and Influencing Factors of Algal Functional Groups in Jingpo Lake. Res. Environ. Sci. 2017, 30, 520–528. [Google Scholar]
  24. Song, C.; Yu, H. Phytoplankton Diversity in Jingpo Lake and Water Quality Evaluation. J. North-East For. Univ. 2009, 37, 40–42. [Google Scholar]
  25. Yuan, Y.; Jiang, M.; Liu, X.; Yu, H.; Otte, M.L.; Ma, C.; Her, Y.G. Environmental variables influencing phytoplankton communities in hydrologically connected aquatic habitats in the Lake Xingkai basin. Ecol. Indic. 2018, 91, 1–12. [Google Scholar] [CrossRef]
  26. Bellinger, E.G.; Sigee, D.C. Freshwater Algae Identification, Enumeration and Use as Bioindicators; John Wiley & Sons, Ltd.: Hoboken, NJ, USA, 2015. [Google Scholar]
  27. Guo, B.Q.; Wang, Q.C.; Hong-Li, Y.U.; Mou, P.P. Stream water quality and its influencing factor in lower order streams in upriver sections of Ashihe River. J. For. Res. 2005, 16, 181–186. [Google Scholar]
  28. Jin, X.; Tu, Q. Guidelines for Lake Eutrophication Investigation, 2nd ed.; China Environmental Science Press: Beijing, China, 1990. (In Chinese) [Google Scholar]
  29. Tao, F.; Chao, W.; Hou, J.; Wang, P.; Yao, L.; Dai, Q.; Yang, Y.; You, G. Effect of inter-basin water transfer on water quality in an urban lake: A combined water quality index algorithm and biophysical modelling approach. Ecol. Indic. 2017, 92, 61–71. [Google Scholar]
  30. Hu, J.C.; Song, Z.B.; Zhou, J.C.; Soininen, J.; Tan, L.; Cai, Q.H.; Tang, T. Differences in diversity and community assembly processes between planktonic and benthic diatoms in the upper reach of the Jinsha River, China. Hydrobiologia 2022, 849, 1577–1591. [Google Scholar] [CrossRef]
  31. Meng, F.; Li, Z.; Li, L.; Lu, F.; Liu, Y.; Lu, X.; Fan, Y. Phytoplankton alpha diversity indices response the trophic state variation in hydrologically connected aquatic habitats in the Harbin Section of the Songhua River. Sci. Rep. 2020, 10, 21337. [Google Scholar] [CrossRef]
  32. Motwani, G.; Raman, M.; Matondkar, P.; Parab, S.; Pednekar, S.; Solanki, H. Comparison between phytoplankton bio-diversity and various indices for winter monsoon and inter monsoon periods in north-eastern Arabian Sea. Indian J. Geo-Mar. Sci. 2014, 43, 1513–1518. [Google Scholar]
  33. Ding, Y.; Pan, B.; Zhao, G.; Sun, C.; Han, X.; Li, M. Geo-climatic factors weaken the effectiveness of phytoplankton diversity as a water quality indicator in a large sediment-laden river. Sci. Total Environ. 2021, 792, 148346. [Google Scholar] [CrossRef] [PubMed]
  34. Doan-Nhu, H.; Nguyen-Ngoc, L.; Nguyen, C.T. ENSO and anthropogenic impacts on phytoplankton diversity in tropical coastal waters. Prog. Oceanogr. 2016, 140, 1–13. [Google Scholar] [CrossRef]
  35. Tõnno, I.; Talas, L.; Freiberg, R.; Kisand, A.; Belle, S.; Stivrins, N.; Alliksaar, T.; Heinsalu, A.; Veski, S.; Kisand, V. Environmental drivers and abrupt changes of phytoplankton community in temperate lake Lielais Svētiņu, Eastern Latvia, over the last Post-Glacial period from 14.5 kyr. Quat. Sci. Rev. 2021, 263, 107006. [Google Scholar] [CrossRef]
  36. Brasil, J.; Santos, J.B.O.; Sousa, W.; Menezes, R.F.; Huszar, V.L.M.; Attayde, J.L. Rainfall leads to habitat homogenization and facilitates plankton dispersal in tropical semiarid lakes. Aquat. Ecol. 2020, 54, 225–241. [Google Scholar] [CrossRef]
  37. Li, X.; Huang, T.; Ma, W.; Sun, X.; Zhang, H. Effects of rainfall patterns on water quality in a stratified reservoir subject to eutrophication: Implications for management. Sci. Total Environ. 2015, 521, 27–36. [Google Scholar] [CrossRef]
  38. Rooney, G.G.; van Lipzig, N.; Thiery, W. Estimating the effect of rainfall on the surface temperature of a tropical lake. Hydrol. Earth Syst. Sci. 2018, 22, 6357–6369. [Google Scholar] [CrossRef]
  39. Onyango, A.O.; Xu, H.; Lin, Z. Diurnal cycle of rainfall over Lake Victoria Basin during the long-rain season based on TRMM satellite estimate. Int. J. Climatol. 2020, 40, 4622–4637. [Google Scholar] [CrossRef]
  40. Meng, P.J.; Tew, K.S.; Hsieh, H.Y.; Chen, C.C. Relationship between magnitude of phytoplankton blooms and rainfall in a hyper-eutrophic lagoon: A continuous monitoring approach. Mar. Pollut. Bull. 2017, 124, 897–902. [Google Scholar] [CrossRef]
  41. Pandey, L.K.; Lavoie, I.; Morin, S.; Park, J.; Lyu, J.; Choi, S.; Lee, H.; Han, T. River water quality assessment based on a multi-descriptor approach including chemistry, diatom assemblage structure, and non-taxonomical diatom metrics. Ecol. Indic. 2018, 84, 140–151. [Google Scholar] [CrossRef] [Green Version]
  42. Wang, X.l.; Lu, Y.l.; He, G.z.; Han, J.y.; Wang, T.y. Exploration of relationships between phytoplankton biomass and related environmental variables using multivariate statistic analysis in a eutrophic shallow lake: A 5-year study. J. Environ. Sci. 2007, 19, 920–927. [Google Scholar] [CrossRef]
  43. Shi, X.; Sun, Z.; Liu, G.; Xu, H. Insights into community-based discrimination of water quality status using an annual pool of phytoplankton in mid-subtropical canal systems. Environ. Sci. Pollut. R. 2015, 22, 1199–1206. [Google Scholar] [CrossRef] [PubMed]
  44. Arab, S.; Hamil, S.; Rezzaz, M.A.; Chaffai, A.; Arab, A. Seasonal variation of water quality and phytoplankton dynamics and diversity in the surface water of Boukourdane Lake, Algeria. Arab. J. Geosci. 2019, 12, 29. [Google Scholar] [CrossRef]
  45. de Souza, D.G.; Bueno, N.C.; Bortolini, J.C.; Rodrigues, L.C.; Bovo-Scomparin, V.M.; de Souza Franco, G.M. Phytoplankton functional groups in a subtropical Brazilian reservoir: Responses to impoundment. Hydrobiologia 2016, 779, 47–57. [Google Scholar] [CrossRef]
  46. de Oliveira, F.H.P.C.; Capela e Ara, A.L.S.; Moreira, C.H.P.; Lira, O.O.; Padilha, M.D.R.F.; Shinohara, N.K.S. Seasonal changes of water quality in a tropical shallow and eutrophic reservoir in the metropolitan region of Recife (Pernambuco-Brazil). An. Acad. Bras. Cienc. 2014, 86, 1863–1872. [Google Scholar] [CrossRef] [Green Version]
  47. Hou, L.; Zhou, Z.; Wang, R.; Li, J.; Dong, F.; Liu, J. Research on the Non-Point Source Pollution Characteristics of Important Drinking Water Sources. Water 2022, 14, 211. [Google Scholar] [CrossRef]
  48. Huang, C.; Li, Y.; Yang, H.; Sun, D.; Yu, Z.; Zhang, Z.; Chen, X.; Xu, L. Detection of algal bloom and factors influencing its formation in Taihu Lake from 2000 to 2011 by MODIS. Environ. Earth Sci. 2014, 71, 3705–3714. [Google Scholar] [CrossRef]
  49. Cai, Y.; Lu, x.; Ba, Q.; Fan, Y. Plankton community structure and its relationship with environmental factors in spring and summer in Jingpo Lake. Oceanogr. Limnol. 2019, 13, 84–92. (In Chinese) [Google Scholar]
  50. Arnan, X.; Cerda, X.; Retana, J. Partitioning the impact of environment and spatial structure on alpha and beta components of taxonomic, functional, and phylogenetic diversity in European ants. PEER J. 2015, 3, e1241. [Google Scholar] [CrossRef] [Green Version]
  51. Korneva, L.G. Changes in phytoplankton diversity in the Volga Basin waterbodies. Inland Water Biol. 2010, 3, 322–328. [Google Scholar] [CrossRef]
  52. Xiao, J.; Wang, B.; Qiu, X.L.; Yang, M.; Liu, C.Q. Interaction between carbon cycling and phytoplankton community succession in hydropower reservoirs: Evidence from stable carbon isotope analysis. Sci. Total Environ. 2021, 774, 145141. [Google Scholar] [CrossRef]
  53. Cho, I.H.; Kim, H.K.; Lee, M.H.; Kim, Y.J.; Lee, H.; Kim, B.H. The Effect of Monsoon Rainfall Patterns on Epilithic Diatom Communities in the Hantangang River, Korea. Water 2020, 12, 1471. [Google Scholar] [CrossRef]
  54. Zhang, Y.; Peng, C.; Huang, S.; Wang, J.; Xiong, X.; Li, D. The relative role of spatial and environmental processes on seasonal variations of phytoplankton beta diversity along different anthropogenic disturbances of subtropical rivers in China. Environ. Sci. Pollut. Res. 2019, 26, 1422–1434. [Google Scholar] [CrossRef] [PubMed]
  55. Hansson, L.A.; Annadotter, H.; Bergman, E.; Hamrin, S.F.; Jeppesen, E.; Kairesalo, T.; Luokkanen, E.; Nilsson, P.A.; Sondergaard, M.; Strand, J. Biomanipulation as an application of food-chain theory: Constraints, synthesis, and recommendations for temperate lakes. Ecosystems 1998, 6, 558–574. [Google Scholar] [CrossRef]
  56. Jeppesen, E.; Peder Jensen, J.; Søndergaard, M.; Lauridsen, T.; Junge Pedersen, L.; Jensen, L. Top-down control in freshwater lakes: The role of nutrient state, submerged macrophytes and water depth. Hydrobiologia 1997, 342/343, 151–164. [Google Scholar] [CrossRef]
  57. Salcher, M.M.; Posch, T.; Pernthaler, J. In situ substrate preferences of abundant bacterioplankton populations in a prealpine freshwater lake. ISME J. 2013, 5, 896–907. [Google Scholar] [CrossRef] [Green Version]
  58. Yang, B.; Jiang, Y.J.; He, W.; Liu, W.X.; Kong, X.Z.; Jorgensen, S.E.; Xu, F.L. The tempo-spatial variations of phytoplankton diversities and their correlation with trophic state levels in a large eutrophic Chinese lake. Ecol. Indic. 2016, 66, 153–162. [Google Scholar] [CrossRef]
  59. Noirmain, F.; Baray, J.-L.; Tridon, F.; Cacault, P.; Billard, H.; Voyard, G.; Van Baelen, J.; Latour, D. Interdisciplinary strategy to survey phytoplankton dynamics of a eutrophic lake under rain forcing: Description of the instrumental set-up and first results. Biogeosciences 2022, 24, 1–30. [Google Scholar]
Figure 1. The location of sampling sites in the study area.
Diversity 14 01003 g001
Figure 2. The spatial distribution of TLI in the study period. (a) Rainy season (August 2017); (b) dry season (October 2017); (c) rainy season (August 2018); (d) dry season (October 2018). The interpolation map was constructed by ArcGIS software using the Inverse Distance Weighting method.
Diversity 14 01003 g002
Figure 3. The spatial distribution of Margalef Index in study period. (a) Rainy season (August 2017); (b) dry season (October 2017); (c) rainy season (August 2018); (d) dry season (October 2018). The interpolation map was constructed by ArcGIS software using the Inverse Distance Weighting method.
Diversity 14 01003 g003
Figure 4. The spatial distribution of Shannon-Wiener Index in study period. (a) Rainy season (August 2017); (b) dry season (October 2017); (c) rainy season (August 2018); (d) dry season (October 2018). The interpolation map was constructed by ArcGIS software using the Inverse Distance Weighting method.
Diversity 14 01003 g004
Figure 5. The spatial distribution of Pielou evenness index in study period. (a) Rainy season (August 2017); (b) dry season (October 2017); (c) rainy season (August 2018); (d) dry season (October 2018). The interpolation map was constructed by ArcGIS software using the Inverse Distance Weighting method.
Diversity 14 01003 g005
Table 1. The temporal and spatial variation of environmental parameters during the study period.
SpCond (μs/cm)WTDOpHTNTPCODMn
(℃)(mg/L)(mg/L)(mg/L)(mg/L)
Rainy season106 ± 7725.37 ± 7.739.1 ± 3.69.00 ± 2.7150.20 ± 0.080.02 ± 0.021.25 ± 1.2
Dry season126.75 ± 44.6510.55 ± 6.458 ± 68.13 ± 1.4150.14 ± 0.090.03 ± 0.0233.16 ± 2.98
2017123.5 ± 94.515.93 ± 7.538 ± 68.995 ± 2.7150.15 ± 0.080.03 ± 0.02253.09 ± 3.04
2018133.4 ± 48.414.33 ± 12.698.13 ± 3.888.73 ± 1.550.23 ± 0.170.03 ± 0.022.69 ± 2.51
t-Test
Dry season × Rainy seasonnsp < 0.01nsnsp < 0.01p < 0.05p < 0.05
2017 × 2018nsnsnsnsnsnsns
ns: Not significant (p > 0.05).
Table 2. The temporal and spatial variation of phytoplankton community structure and taxonomy diversity indices in Jingpo Lake from 2017 to 2018.
t-Test
Rainy SeasonDry Season201720182017–2018Rainy Season × Dry Season2017 × 2018
Average abundance
(×104 ind./L)
159.91100.2777.10188.25130.09p < 0.05p < 0.05
Bacillariophyta
(×104 ind./L)
101.83 ± 165.5279.03 ± 172.2968.19 ± 182.57114.77 ± 150.0490.43p < 0.05p < 0.05
Cyanobacteria
(×104 ind./L)
25.56 ± 54.561.82 ± 4.942.20 ± 5.9026.64 ± 56.0013.69p < 0.05p < 0.05
Chlorophyta
(×104 ind./L)
19.79 ± 40.362.94 ± 5.561.19 ± 2.9422.70 ± 40.7511.37p < 0.05p < 0.05
Cryptophyta
(×104 ind./L)
9.29 ± 14.7413.67 ± 22.824.43 ± 9.7218.83 ± 23.5111.48nsp < 0.05
Euglenophyta
(×104 ind./L)
2.92 ± 6.601.71 ± 7.780.65 ± 1.614.12 ± 9.932.32nsp < 0.05
other
(×104 ind./L)
0.52 ± 1.381.10 ± 3.140.43 ± 2.271.20 ± 2.510.81nsns
Margalef index2.15 ± 2.582.27 ± 2.661.31 ± 2.663.15 ± 1.942.23p < 0.05p < 0.01
Shannon-Wiener index1.69 ± 1.341.54 ± 1.421.21 ± 1.282.04 ± 1.881.63p < 0.05p < 0.01
Pielou index0.70 ± 0.360.72 ± 0.280.74 ± 0.330.68 ± 0.330.71nsns
ns: Not significant (p > 0.05).
Table 3. Relative abundance of dominant species of phytoplankton in Jingpo Lake from 2017 to 2018.
Rainy SeasonDry Season20172018
BacillariophytaFragilaria capucina19.08%2.76%3.65%17.10%
Ulnaria ulna8.49%3.75%4.42%7.74%
Asterionella formosa0.14%0.32%0.14%0.17%
Melosira granulata12.63%4.80%2.24%12.97%
Melosira granulata var. angustissima0.76%0.22%1.56%0.12%
Aulacoseira pusilla0.14%0.36%0.45%0.14%
Melosira varians0.29%13.72%16.58%0.35%
Nitzschia palea5.26%6.86%11.49%3.41%
Cymbella turgidula3.78%4.86%8.48%2.31%
Gomphonema parvulum0.15%0.97%1.08%0.18%
ChlorophytaCrucigenia rectangularis4.64%0.07%0.14%4.23%
Crucigenia apiculata1.52%0.07%0.14%1.40%
Schroederia spiralis1.03%0.52%0.14%1.21%
Schroederia robusta0.14%0.27%0.19%0.09%
Ankistrodesmus angustus0.72%0.63%0.14%0.97%
Ankistrodesmus falcatus0.08%0.63%0.14%0.35%
Ankistrodesmus acicularis0.06%0.06%0.06%0.06%
Eudorina echidna1.03%0.14%0.11%0.90%
Pandorina morum0.24%0.14%0.46%0.14%
Ulothrix subconstricta0.06%0.06%0.06%0.06%
CyanobacteriaPseudanabaena limnetica6.10%0.19%0.06%5.58%
Anabaena azotica4.12%0.31%1.33%3.31%
Anabaena catenula3.78%0.14%0.14%3.42%
Aphanizomenon flosaquae0.35%0.14%0.14%0.32%
Oscillatoria princes0.22%0.17%0.21%0.20%
Aphanocapsa delicatissima0.14%0.14%0.14%0.14%
Merismopedia tenuissima0.14%0.68%0.14%0.48%
Chroococcus minutus0.07%0.07%0.07%0.07%
CryptophytaChroomonas caudata0.68%2.56%0.14%1.97%
Chroomonas acuta0.16%0.20%0.57%0.14%
Cryptomonas erosa3.65%10.59%5.01%6.76%
Cryptomonas ovata1.32%0.28%0.16%1.27%
EuglenophytaEuglena viridis0.65%0.46%0.22%0.74%
Trachelomonas oblonga0.49%0.66%0.42%0.61%
Table 4. The correlation coefficients found by CA of diversity indices and TLI in Jingpo Lake during the study periods.
Margalef IndexShannon-Wiener IndexPielou Evenness Index
All
Correlation with TLI0.0660.0740.074
Rainy-season
Correlation with TLI0.495 **0.494 **0.043
Dry-season
Correlation with TLI−0.513 **−0.411 **0.172
2017
Correlation with TLI0.2190.273 *0.241
2018
Correlation with TLI−0.005−0.062−0.125
* Denotes p < 0.05 (two-tailed). ** Denotes p < 0.01 (two-tailed).
Table 5. The correlation coefficients found by CA of diversity indices in Jingpo Lake during the study periods.
Margalef IndexShannon-Wiener IndexPielou Evenness Index
SamplesAllDry SeasonRainy SeasonAllDry SeasonRainy SeasonAllDry SeasonRainy Season
Margalef index
All 0.886 ** −0.241 **
Dry Season 0.64 0.92 **0.6 0.530.13
Rainy Season 0.540.93 ** 0.310.24
Shannon-Wiener index
All 0.082
Dry Season 0.51 0.78 **0.13
Rainy Season 0.290.53
Pielou evenness index
All
Dry Season 0.12
Rainy Season
** Denotes p < 0.01 (two-tailed).
Publisher’s Note: MDPI stays neutral with regard to jurisdictional claims in published maps and institutional affiliations.

