Article

Shading Gradients Drive Differential Responses of Leaf Traits in an Early Community Germinated by Forest Topsoil

1
CAS Key Laboratory of Tropical Forest Ecology, Xishuangbanna Tropical Botanical Garden, Chinese Academy of Sciences, Menglun 666303, China
2
University of Chinese Academy of Sciences, Beijing 100049, China
3
College of Life Science, Neijiang Normal University, Neijiang 641100, China
*
Author to whom correspondence should be addressed.
Diversity 2022, 14(8), 600; https://doi.org/10.3390/d14080600
Submission received: 27 June 2022 / Revised: 23 July 2022 / Accepted: 25 July 2022 / Published: 28 July 2022
(This article belongs to the Special Issue Restoration and Conservation of Tropical Degraded Forest)

Abstract

:
Seedling performance in the early stage is crucial to natural forest restoration, and functional traits have been widely employed in exploring plant adaptation under field conditions. However, the responses and variabilities of leaf traits have not been clearly defined at the light gradients that are used in restoration practices. We evaluated the variation in leaf treats in species and community levels in a controlled field plot with shading treatments. We found that the variation characteristics differed across different species and trait types along shading gradients. Individuals of most species had a larger leaf area (LA) and specific leaf area (SLA) in the shaded habitats, while only a few tree species showed significant responses in their leaf shape and chlorophyll concentration. Although LA and SLA showed similar directions and trends of changes in the trait mean, four response models were observed based on the light points corresponding to initial responses and following trends. The extent of within-species trait variation for each treatment was similar at the community level due to diverse changes in the direction and degrees of variation in co-occurring species. Intraspecific variation was limited within each shading treatment, while it noticeably contributed to the local adaptation in the entire heterogeneous restoration community. Our findings indicate that species with different trait combinations will have different responses to light gradients, and that the mean and degree of variation in leaf traits will also lead to distinctive strategies being created to match the different shading conditions. Vegetation restoration should consider the adaptive traits and their response diversity when selecting species and for habitat management with specific trait–environment interactions.

1. Introduction

The loss and degradation of natural forests are urgent environmental problems worldwide that threaten biodiversity and ecosystem services [1,2]. For this reason, the strategies and technologies of natural forest restoration have received increased attention in recent years. The transplantation of propagules from similar forests to reestablish or restore forms of vegetation in a destroyed, damaged, or degraded system is a popular approach in ecological practices [3,4,5,6], but the low community similarity between the restored vegetation and the reference forest limits its utilization. The succession process and biological characteristics that are involved indicate that seedling survival, individual growth, and community dynamics are strongly affected by physical environment factors, and light is one of the most important determinants [7,8,9]. Light as a fundamental resource is crucial for leaf development, photosynthetic accumulation, and individual survival and growth. Thus, light competition strongly shapes plant traits and affects community structure and dynamics [7,10,11,12,13]. However, shade is widespread in forests and other ecosystems, and the effect of shading on understory seedlings and neighboring species has attracted a great amount of attention [14,15,16]. Besides a reduction of the light quantity, shade can also alleviate thermal stress and raise the humidity in the microclimate [16], facilitating growth to plants [14,15]. Meanwhile, vegetation restoration with diverse tree species requires long-term successions, and seedling survival and growth are critical for successful community establishment in the early stages [17]. Excessive radiation can generate stress in plant individuals and communities; thus, shading is a necessary and effective method of protecting seedlings [6,18,19]. Shade effects are also considered as key determinants of organ functional differentiation, individual performance, and community dynamics [20,21,22,23]. However, the effects of light/shade gradients on saplings and communities in the early stages of forest restoration are not yet clearly understood.
Functional traits provide new insights into individual performance, population dynamics, community assembly, and ecosystem health in different habitats and the changing world [24,25,26,27,28]. Functional traits and variation patterns are key to understanding ecological processes and assisting in ecosystem restoration [29,30,31]. Diverse traits can be used to describe the niche of a plant species [25]. In addition to the mean of traits presenting the niche position of species or the underlying optimum of traits, variations in the functional traits reflect the plasticity within plant populations and species, and it should be an important adaptive performance depending on varied biotic and abiotic environmental variables [32,33,34]. Recent studies have revealed that functional traits are variable in gradient environments, and the diverse responses of species may reflect their different environmental demands and adaptation strategies [35,36,37,38]. In common concerned traits, leaf traits are tightly related to light and other environmental factors. The mean of leaf area and specific leaf area usually increase with a reduction of light [7,10,13]; they have relative high intraspecific variation [32]. Thus, variation of these traits within and among populations may be mainly affected by light heterogeneity and its accompanying factors. However, species with different ecological characteristics (e.g., shade-tolerant and -intolerant) may have distinguishable responses to shade, these asynchronous changes in the community will result in interspecific trait variation [11,15,33]. Intraspecific variation and species turnover both contribute to the mean traits and the relative variation at the community level [39,40]. Regarding trait variation along environmental gradients, contrasting findings have been reported on the changes in intraspecific variation in distinct environments [32,40]. Stress environments can promote intraspecific variation by expressing phenotypic and genetic variation [41], while these environments may constrain the variation in populations by abiotic filtering [42]. Moderate environments can improve intraspecific variation due to removing the limitations that are caused by physical factors, but the species that are growing in these habitats may suffer stronger competition because of increasing species richness and abundance. Variation within the population, between populations, and between species should be distinguished in exploring the process and mechanism of trait adaptation at various scales.
Many previous ecological studies have been conducted on trait variability in uncontrolled fields, some of them even at large scales [32,43,44]. The temporal environmental variables that are measured at a certain time may not reflect the scales (average, variation) of heterogeneous habitats. Thus, species and communities can be affected by multiple factors such as light, water, and nutrients [45]. Different extents of heterogeneity exist in the interior of each local site, which have been established as gradient sites. Under this condition, the variation (particularly the intraspecies variation) in local adaptation to a certain gradient factor may be overestimated, but a high diversity of microhabitats is a common pattern in many natural habitats. Therefore, specific environmental gradients and controlled experiments should be encouraged to investigate this variation and its relationship with abiotic factors [32].
Here, we used a forest restoration plot with shading gradients as the study system, which minimized the variation of soil resources and climatic factors, and generated communities from the same soil seed bank in natural forests [6]. Shading treatments produced microclimate gradients with setting light conditions. Leaf traits were chosen because the leaf functions are tightly related to the light conditions. The value changes and the variability of leaf traits were assessed along the shading gradient. This study aimed to address the following research questions. (a) Whether and how leaf traits vary with the shading gradient in a controlled field plot at the species and community levels. (b) Do traits within populations show the same patterns of mean and variability in their responses to shading treatment? (c) What is the extent of intraspecific variation relative to interspecific variation in leaf traits across shading gradients in the restoration community?

2. Materials and Methods

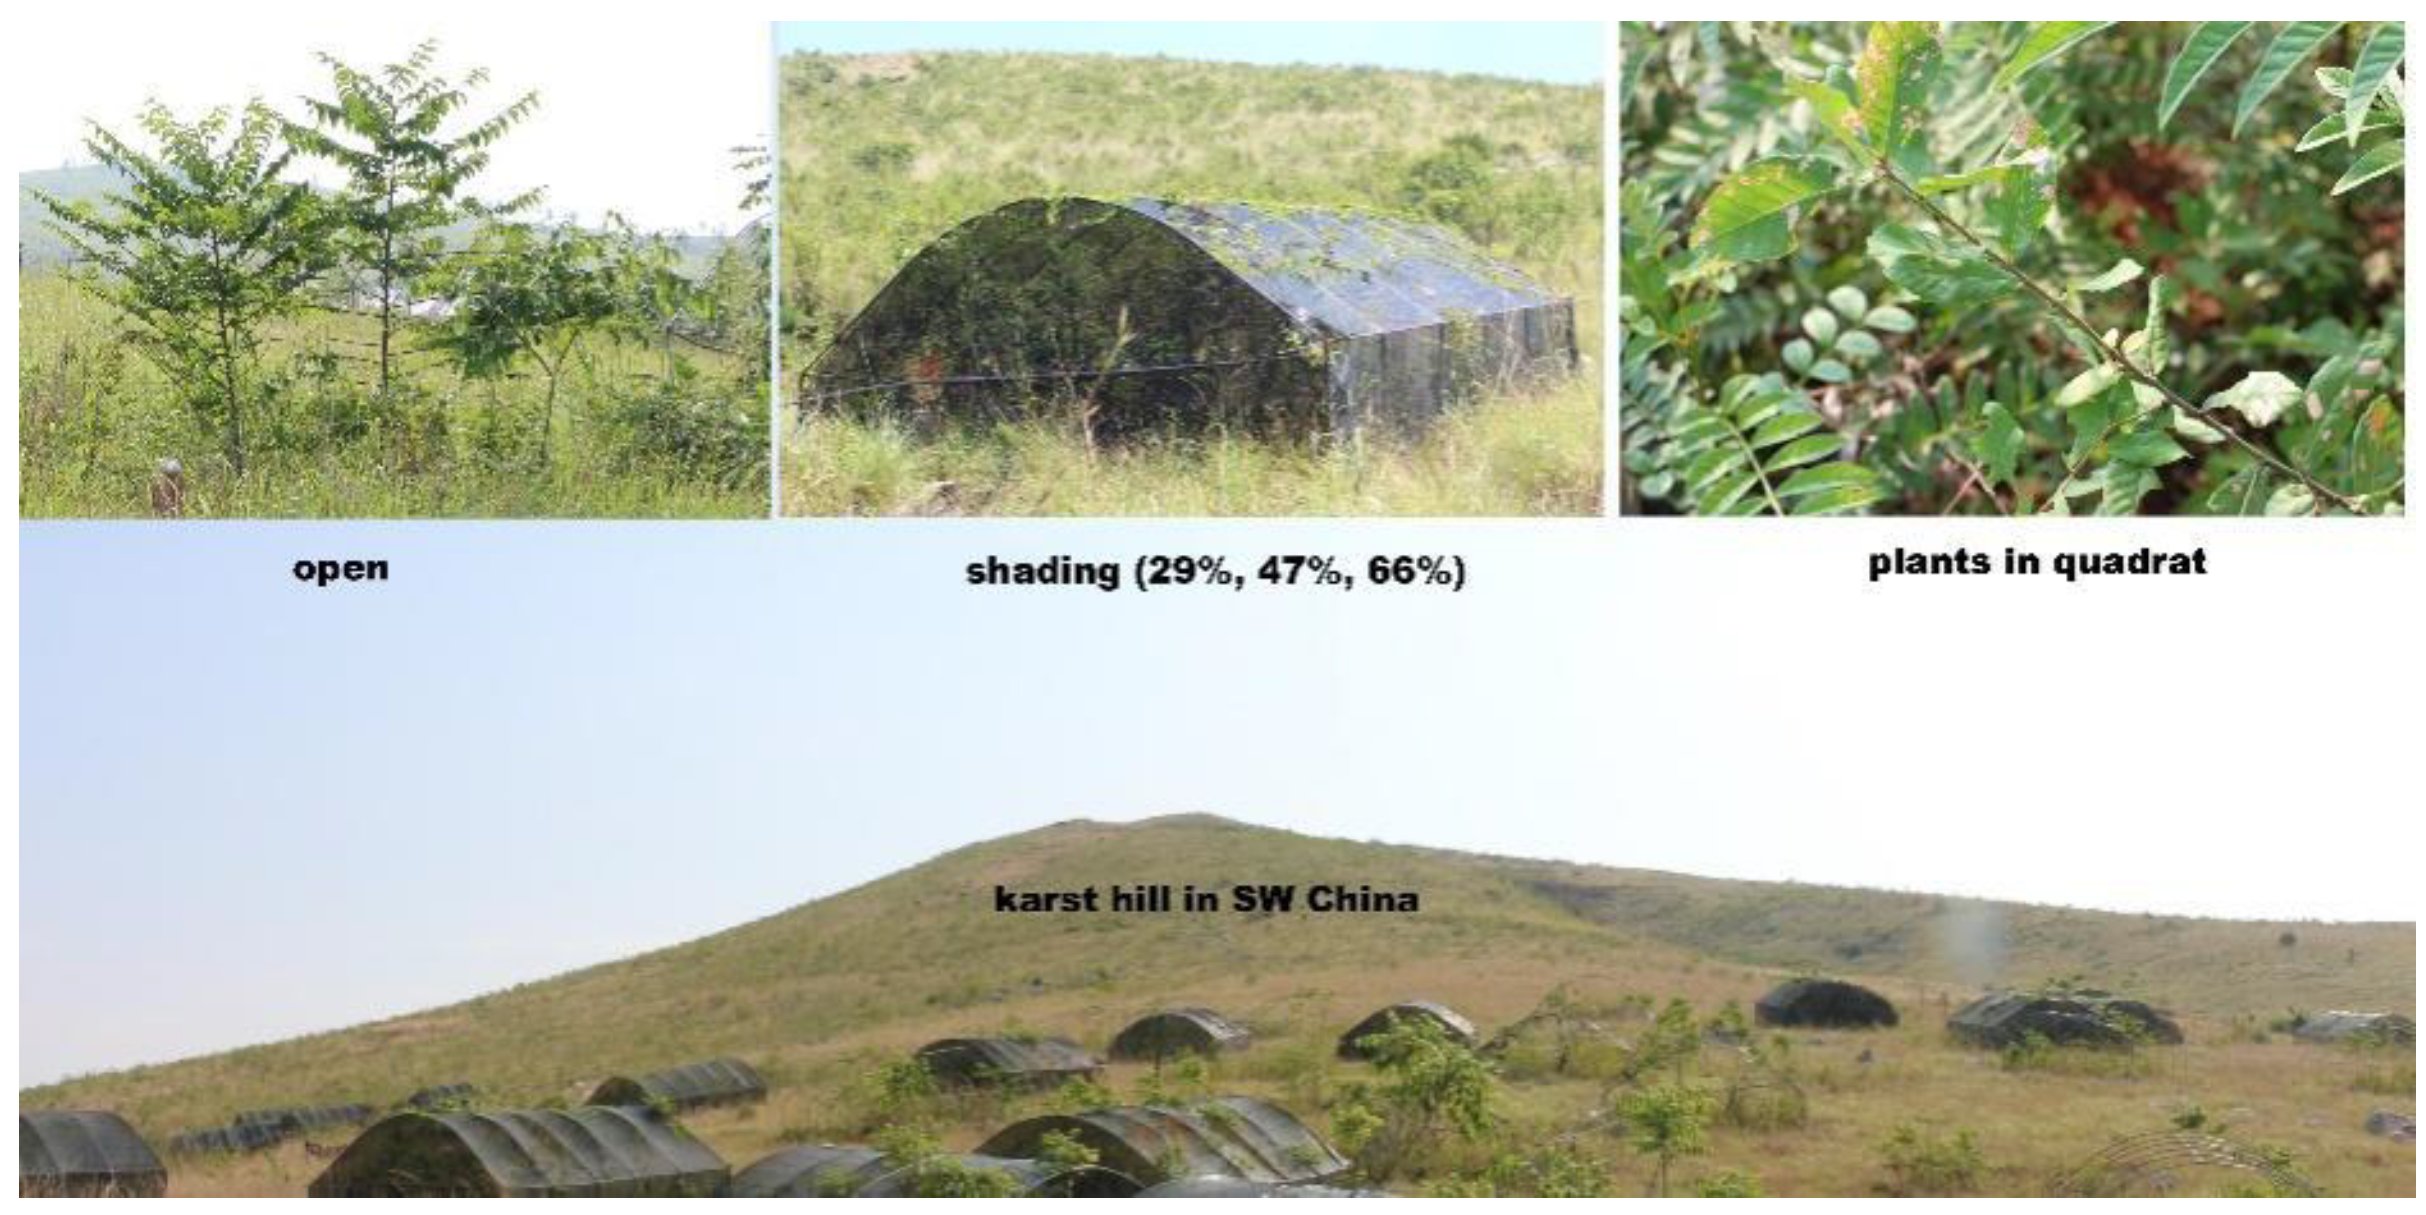
2.1. Study Area and Treatment

A field-controlled experiment was conducted in Jianshui County in the southern area of Yunnan Province, Southwest China. In the study area, the mean annual air temperature is 18.5 °C, with a maximum monthly mean temperature of 24.3 °C in July and a minimum of 12.8 °C in January. The mean annual precipitation amounts to 850 mm, with 85% rainfall in the rainy seasons from May to September. The soil of the study area is red earth. The natural vegetation are sclerophyllous evergreen broad-leafed forests and degraded grassland with massive rock outcrops. The main plant species that grow in the forest include Quercus cocciferoides, Fraxinus malacophylla, Paliurus orientalis, Osteomeles anthyllidifolia, Carissa spinarum, and Smilax china.
The field experiment plot (23°41′ N, 102°56′ E, 1498 m a.s.l.) was established on a karst hill with rocky desertification in 2017 [6]. The vegetation in the study area was degraded grassland with sporadic shrubs. A total of 40 quadrats (5 × 5 m) in five blocks were selected for shading treatments in this study (Figure 1). A total of eight quadrats in each block were randomly arranged with a distance of over three meters between adjacent quadrats, and then plants and topsoil (0–10 cm) in the quadrats were removed prior to soil translocation. Each quadrat had a transitional corridor to reduce the effect from the uncontrolled field areas. The quadrats were treated with different shading nets. They were watered with same volume at the same time in early stages of this experiment, and no weeding was applied. After shading, the photosynthetically active radiation under the nets was measured with a radiation meter (Skye Instruments Ltd., Powys, UK). The level of photosynthetically active radiation was over 2000 µmol·m−2·s−1 at midday in the summer. Reductions of 29%, 47%, and 66% in the total radiation in the open air were generated by the shading nets, and no shading in the open air was set as a control condition [6]. Restoration communities were generated from the soil seed bank in the well-mixed surface layer soil (0–10 cm), which was translocated from the corresponding soil depth of the local natural forest. Abundant plant species and individuals were obtained in the restoration communities [6].

2.2. Sampling and Measurement

We collected leaf samples for trait measurement in 2020. A total of three individuals were randomly selected and the leaves were gathered from their upper positions in different directions, but only one or none was sampled in some quadrats with a few plants of certain species. The leaves were healthy and mature, and the number of leaves from each individual was usually in the range of 6 to 20, depending on the leaf sizes of the species. We sampled leaflets if the plant species had compound leaves. Small individuals with few leaves were excluded from the sampling. All the leaves from one individual were mixed as one sample for measurement. In total, 1672 individuals from 28 species were sampled for the measurement of chlorophyll concentration, and 716 individuals were sampled for the determination of their leaf morphology and biomass (Table S1). The sample sizes of some species were limited in certain treatments where there were few individuals and too-small seedlings; consequently, not all plant species were employed in our trait analysis at all times.
There were four leaf traits that were measured for the analysis of the effects of shading. These traits included leaf shape index (LW, length and width ratio), leaf area (LA, cm2), specific leaf area (SLA, cm2·g−1), and chlorophyll concentration per area (CHL, SPAD value). LW and LA are measured by leaf area in meters (Wseen LA-S, Hangzhou, China). After scanning, the leaves were dried in an oven at 65 °C for 24 h and their weight was determined using an electronic balance with a 0.1 mg accuracy (Qinghai FA2004N, Shanghai, China). The SLA was calculated from the leaf area and weight. The CHL was directly measured using fresh leaves on plants in the field by a portable chlorophyll meter (SPAD-502 Plus, Konica Minolta Optics, Tokyo, Japan). A total of three individuals (if possible) and three leaves in every plant were selected in each quadrat. We carried out measurements two or four times (for large leaves) at different points of one leaf, and the mean of all the data from one individual was the CHL.

2.3. Data Analysis

The mean and variability of traits were analyzed along shading gradients. The coefficients of variation (CV, standard deviation divided by the mean) of the leaf traits in populations of each species in the different shading gradients were calculated in order to analyze trait variation [46]. The individuals of certain species from same shading condition were defined as a population. For exploring the community patterns, a general linear model was used to test the effects of shading and species on the mean and variation coefficients of traits, followed by the use of LSD multiple comparison for the shading gradient. For analyzing species-specific responses to shading, one-way ANOVAs were used to test the differences in each trait among the 0, 29%, 47%, and 66% shading treatments, followed by LSD multiple comparison. This method was also used to compare the mean among different leaf traits for exploring the trait-specific responses to shading. To analyze the changes in traits between open and shading conditions, averages of all shading treatments were counted, and we further calculated the relative percentage of the change values comparing to the mean values in the open conditions. Moreover, life form (tree, shrub and liana) was added as an independent variable to test the shading effects because leaves in branches may face varying light conditions due to their vertical positions in the community [13]. When analyzing the relative contribution of intra- and inter-species variation, we calculated the mean values of each population in each treatment. To control the effects of sample size and species turnover, the analytical plants included only the species assembly that emerged in four shading treatments, with at least 3 individuals from each treatment used to obtain the coefficient of variation. The relative intra- and inter-species variation was determined by an ANOVA in the general linear model.

3. Results

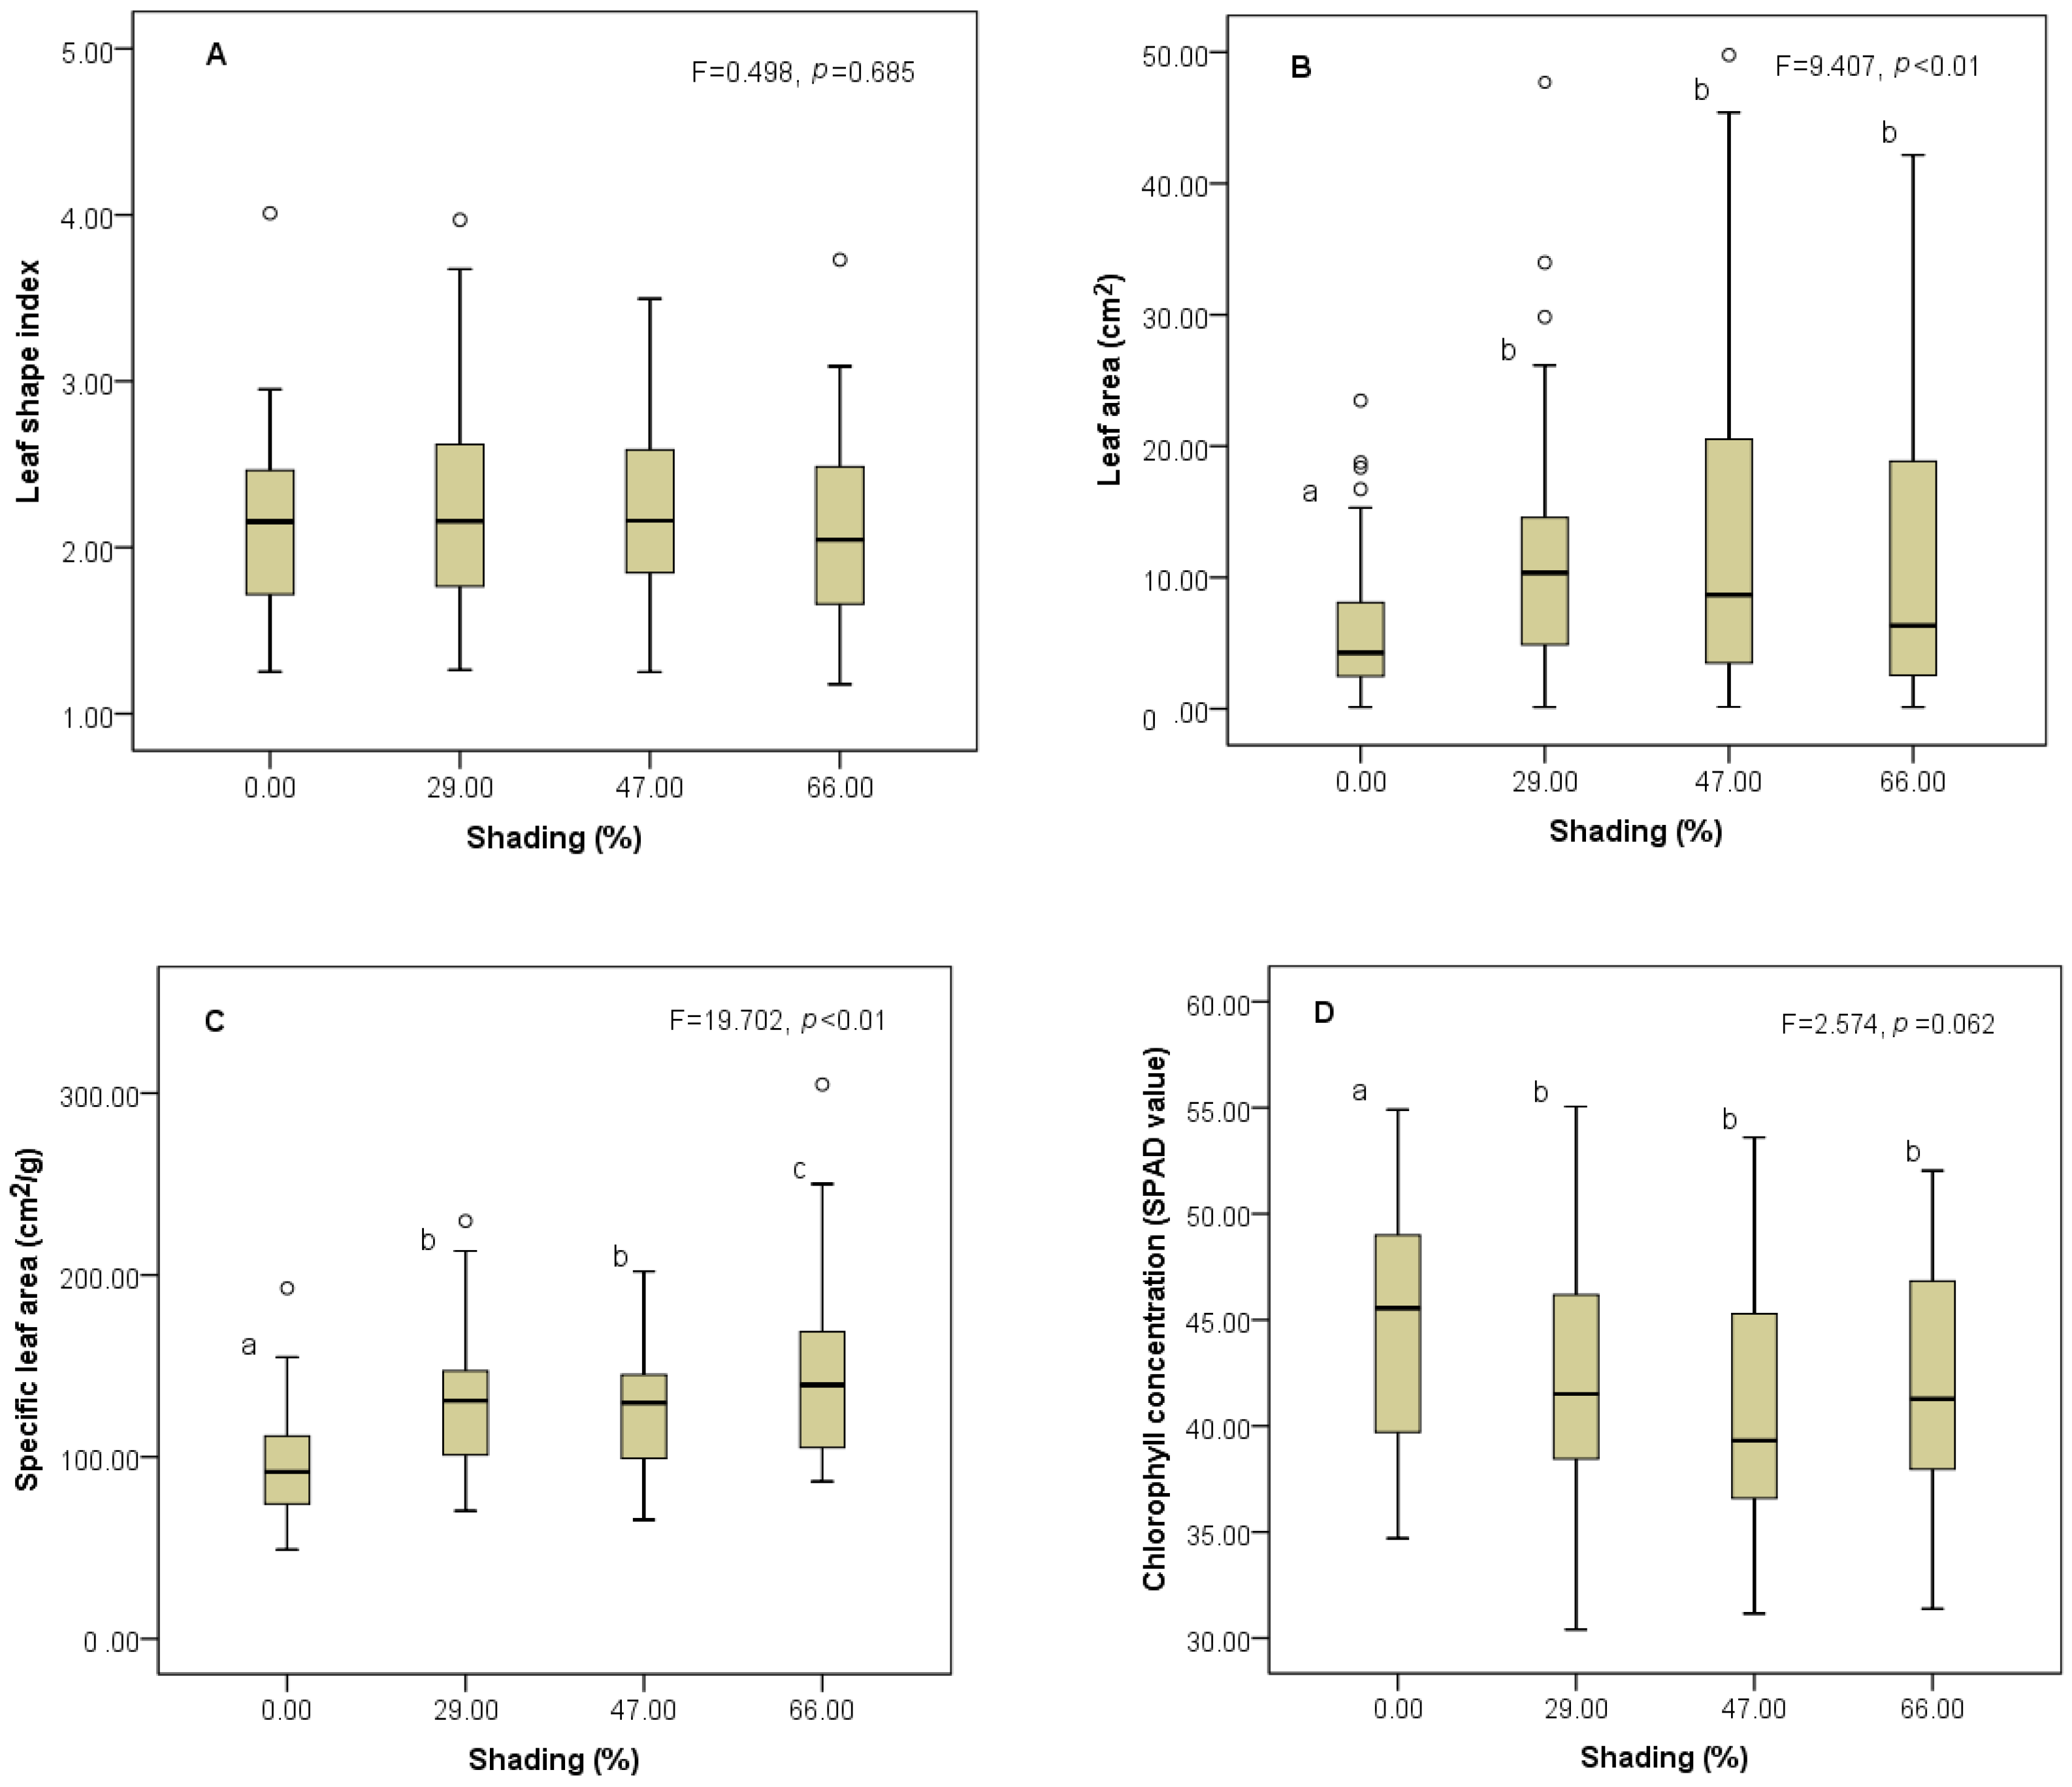
3.1. Responses of Trait Mean to Shading Gradients

At the community level, the shading treatments had significant effects on LA (F = 8.630, p < 0.01) and SLA (F = 21.240, p < 0.01) (Figure 2). The LA in the no shading plot was smaller than that in the shaded environments, but the values that were obtained under the three shading conditions were similar; the SLA in the no shading plot was also lower. The effect of shading on CHL was marginally significant (F = 2.574, p = 0.062), and the concentration under the full light condition was slightly higher than that in the other conditions (Figure 2). No statistically significant difference was found among the four light conditions in LW. We used two sample sets (all measured species, n = 28; and the same species in the four treatments, n = 20) to test the response of the leaf traits. The results were similar, except that the CHL showed a decreasing trend from the open to the shaded conditions when all the species were used in the analysis. When considering the life forms, similar results for the effects of shading were observed. Life form had an obvious effect on the values of LA (F = 5.242, p < 0.01) and SLA (F = 2.705, p = 0.072), and species of trees had larger leaves and lower SLA values than species of shrubs.
At the species level, plants showed distinct performances at different shading gradients. As shown in Figure 3, following a change in their shading gradient, 52.17% of the species showed significant changes in LA, 69.57% of the species showed changes in SLA, and only a few species showed significant changes in LW and CHL (13.04% and 17.39%, respectively, n = 23). The proportion of species responding to shading was higher in the tree species than in the shrub and woody vine species (F = 3.515, p = 0.039). For LA and SLA, the response patterns of saplings to shade can be grouped into four types based on when the significant trait changes were observed and the following trends (Figure 3). Stable response (mode 2) was the main mode for changes in LA and SLA in our restoration community (e.g., Rubus niveus and Albizia kalkora, respectively), and the leaf traits did not constantly change after receiving slight shade. Few species showed a significant increase in LA and SLA until the light radiation was reduced greatly (mode 3, Gymnosporia variabilis and Eriobotrya prinoides, respectively), while some species suffered a negative effect from severe shading and preferred a moderate light environment (mode 4, Albizia kalkora and Quercus cocciferoides, respectively). Comparing LA and SLA, mode 2 was the dominant response pattern in LA, while mode 1 and mode 2 were both common patterns in SLA. The response models of LA and SLA were not accordant in the same species and diverse combinations in the species were revealed (Table S2). In addition, LW exhibited an increasing trend with a slight decrease observed in the severe shading in Fraxinus malacophylla; CHL mainly exhibited a decreasing trend, while Rhus chinensis showed a continuous increase under moderate and severe shading conditions.

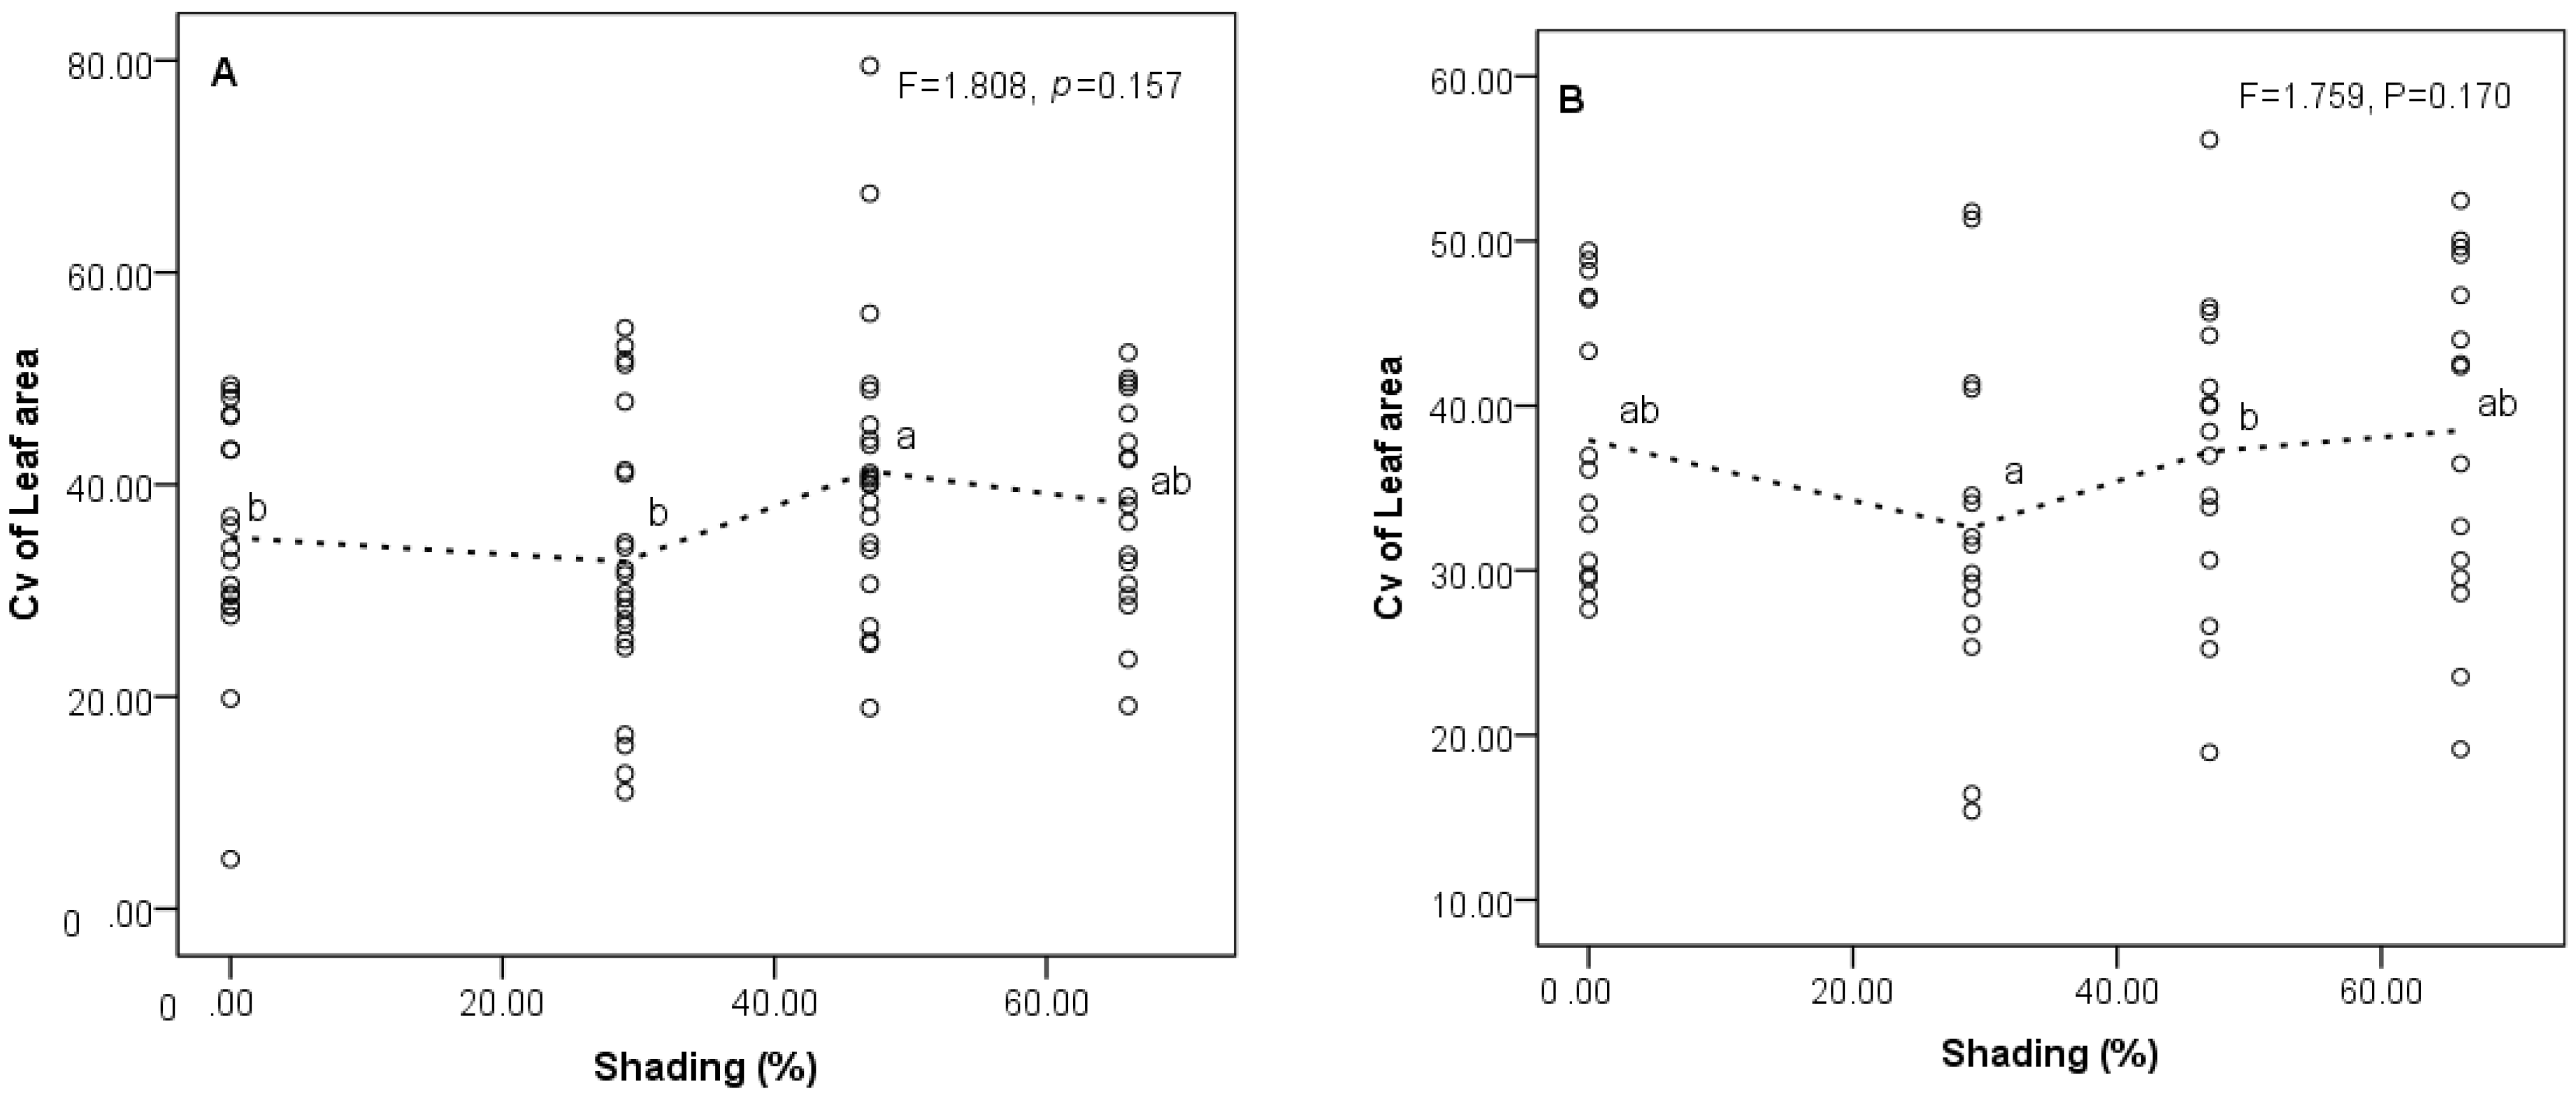
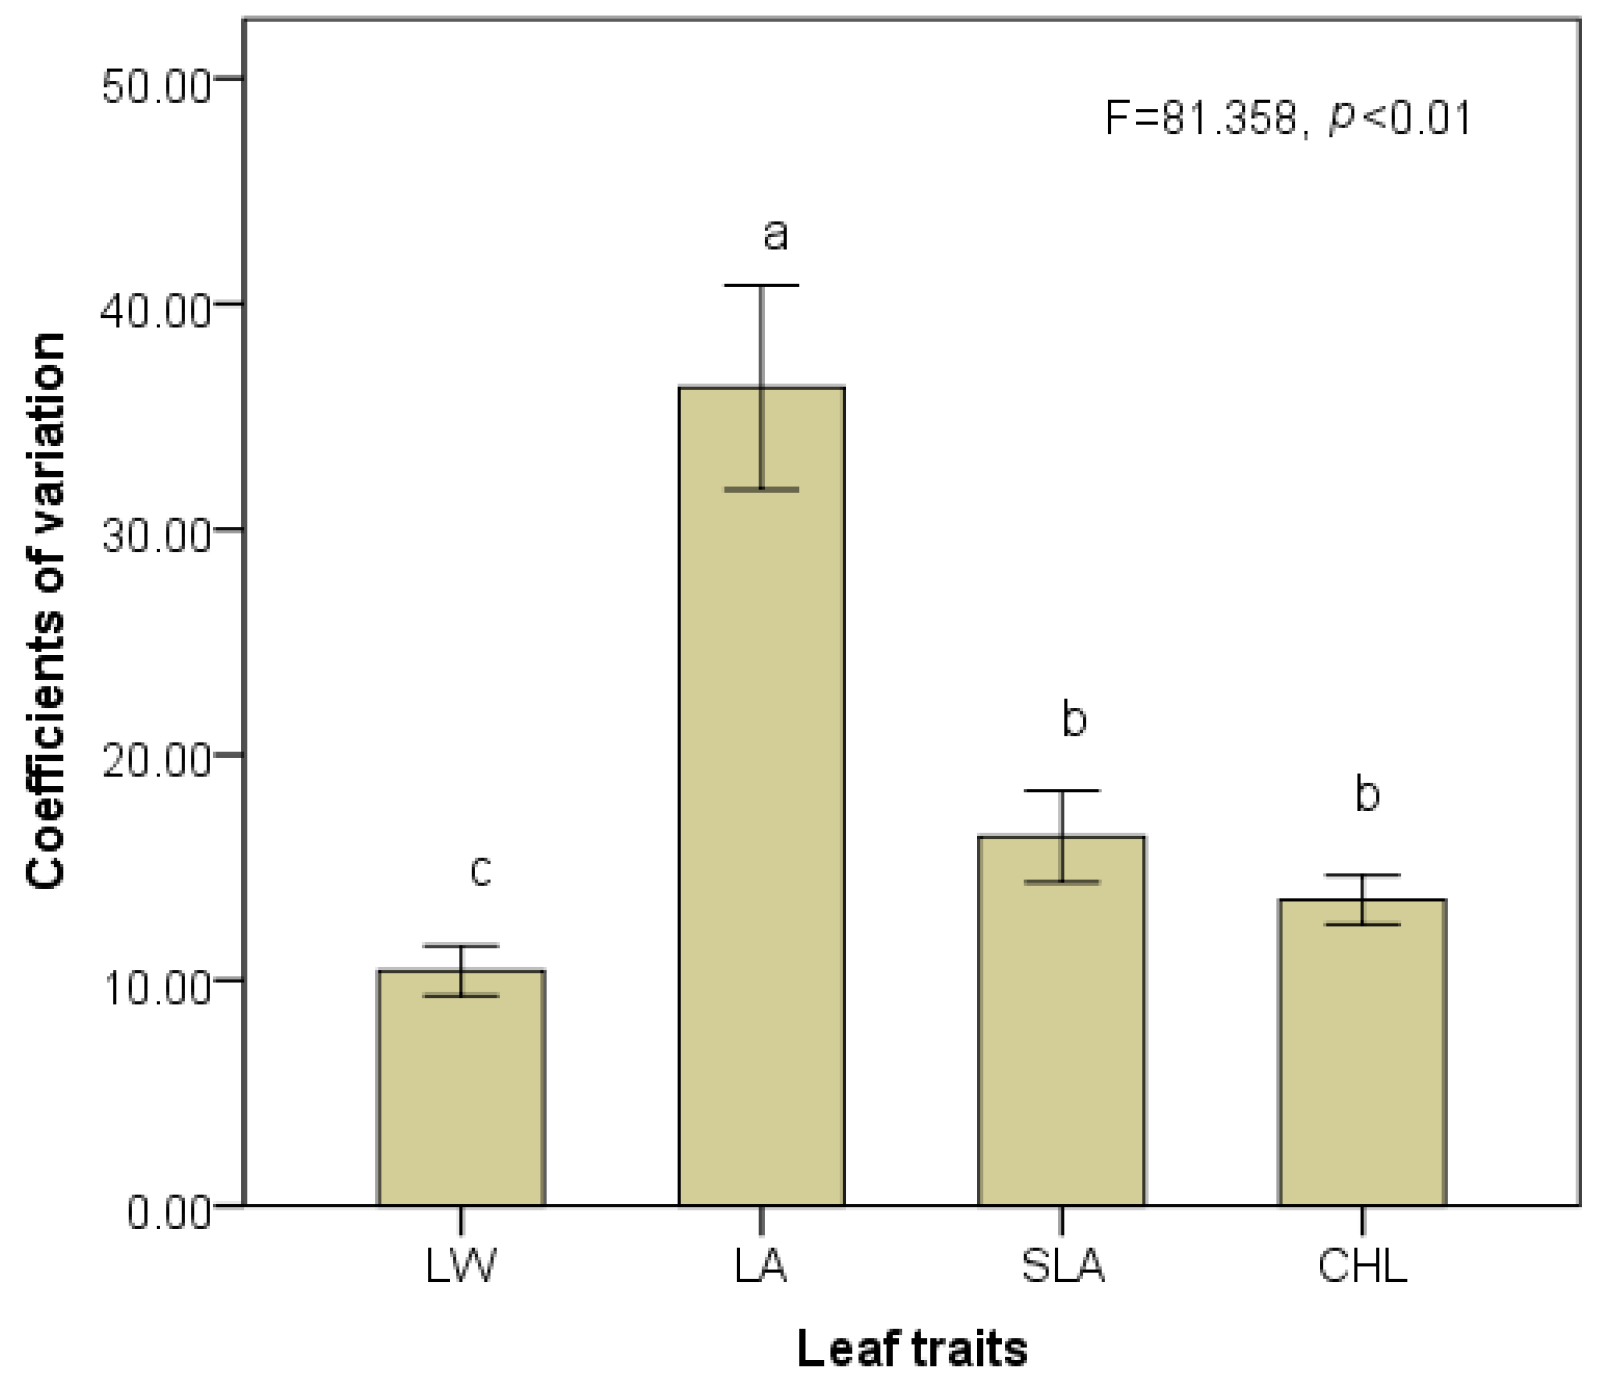
3.2. Responses of Trait Variability to Shading Gradients

Species had significant effects on the coefficients of variation in LW (F = 2.104, p = 0.032) and LA (F = 3.150, p = 0.002), but no effect of shading treatments was detected at the community level. Only the CV of LA in the 47% shading treatment was determined to be slightly higher than that of the 29% by multiple comparison (Figure 4, p = 0.004 and p = 0.043). Regarding the trait value, neither species nor shading had significant effects on the mean of CV in SLA and CHL.

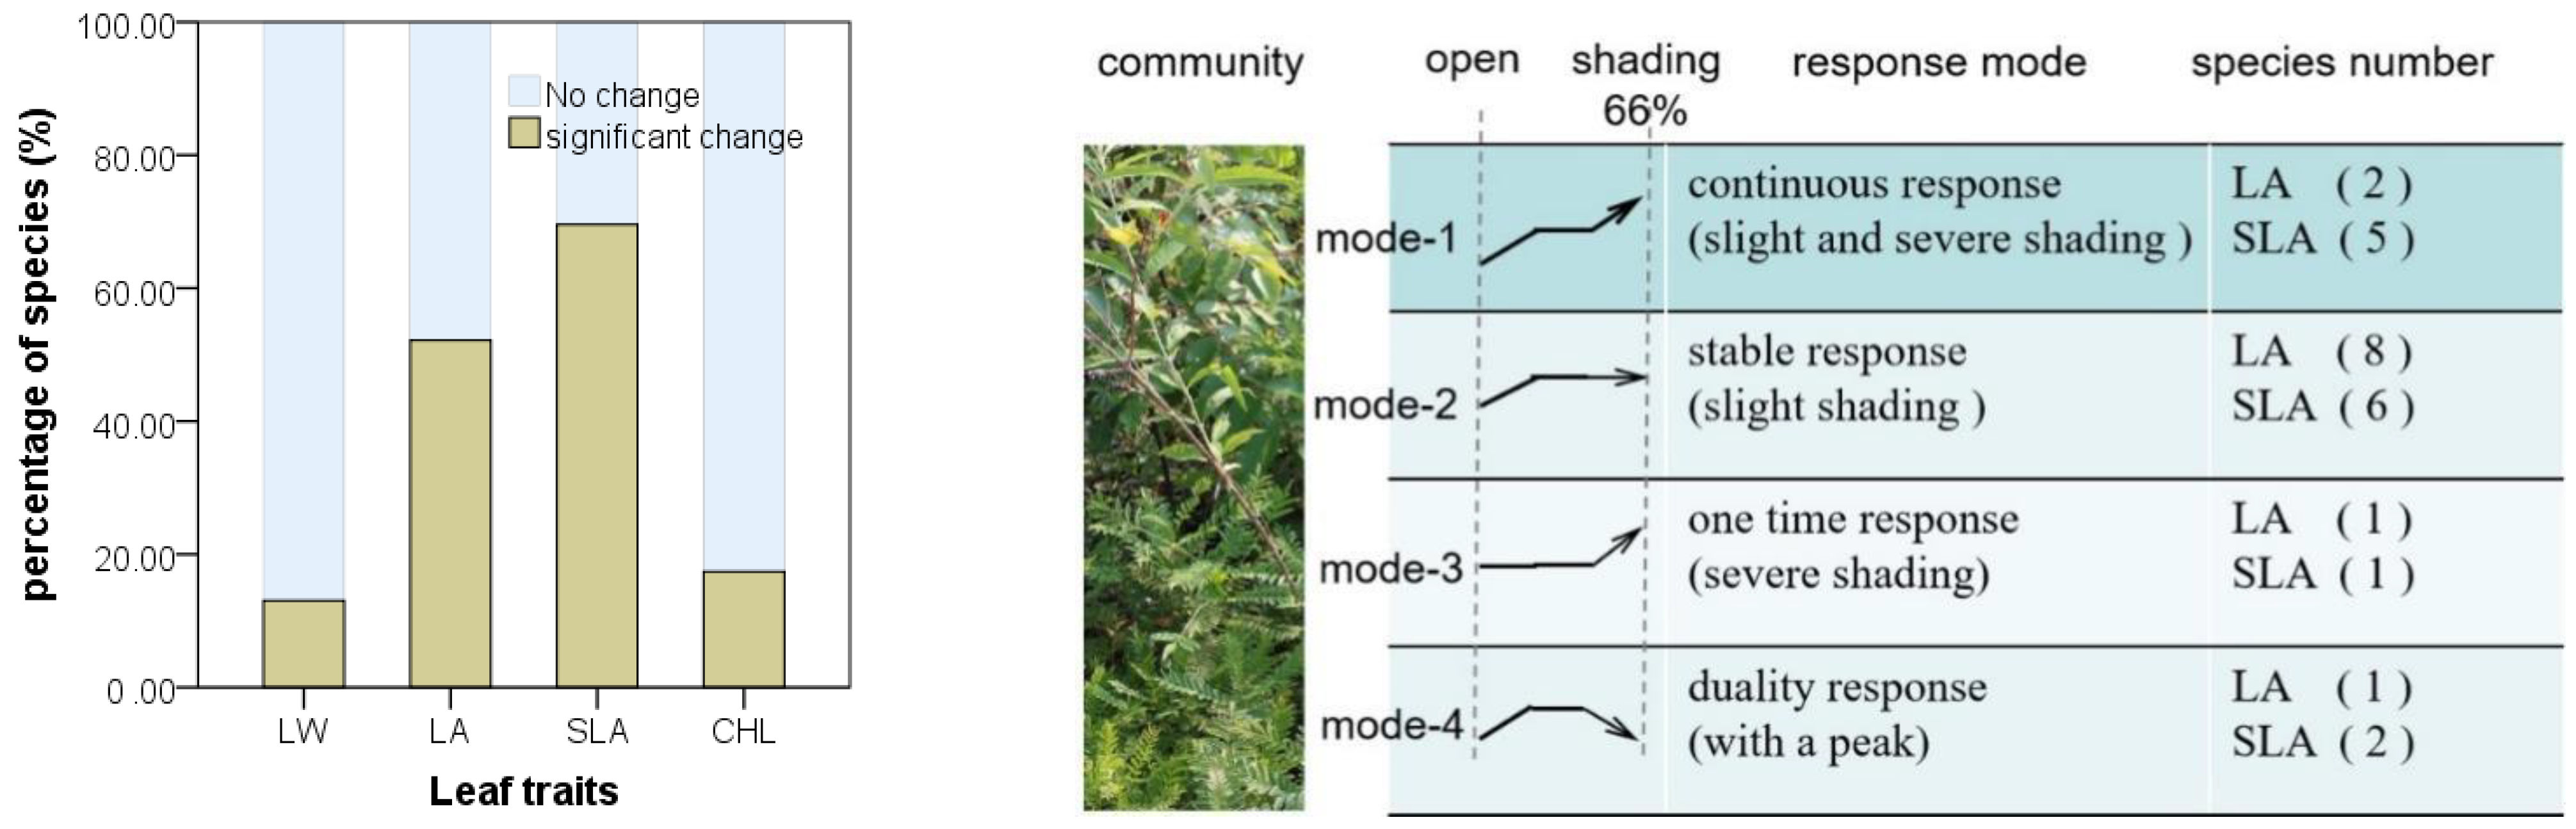
3.3. Species-Specific Changes of Leaf Traits

When considering species-specific responses, shading increased the values of LA and SLA in most species, while their responses to CV within populations showed different directions (Figure 5A,B). The proportions of species with increasing and decreasing trends were similar, and there was no difference in the variation amplitudes of LA and SLA (F = 1.878 and 0.225, p > 0.05). The change in trait mean between LA and SLA was significantly different (T = 3.099, p < 0.05), but for LA and SLA, no difference or correlation of changes between the trait mean and trait CV was detected. Moreover, tree species were more likely to have a higher change magnitude (Figure 5), and they also had significantly lower variation coefficients for LW (F = 4.788, p = 0.011) and CHL (F = 4.545, p = 0.014) than shrubs. No interaction of shading or life form effect was detected in this analysis.

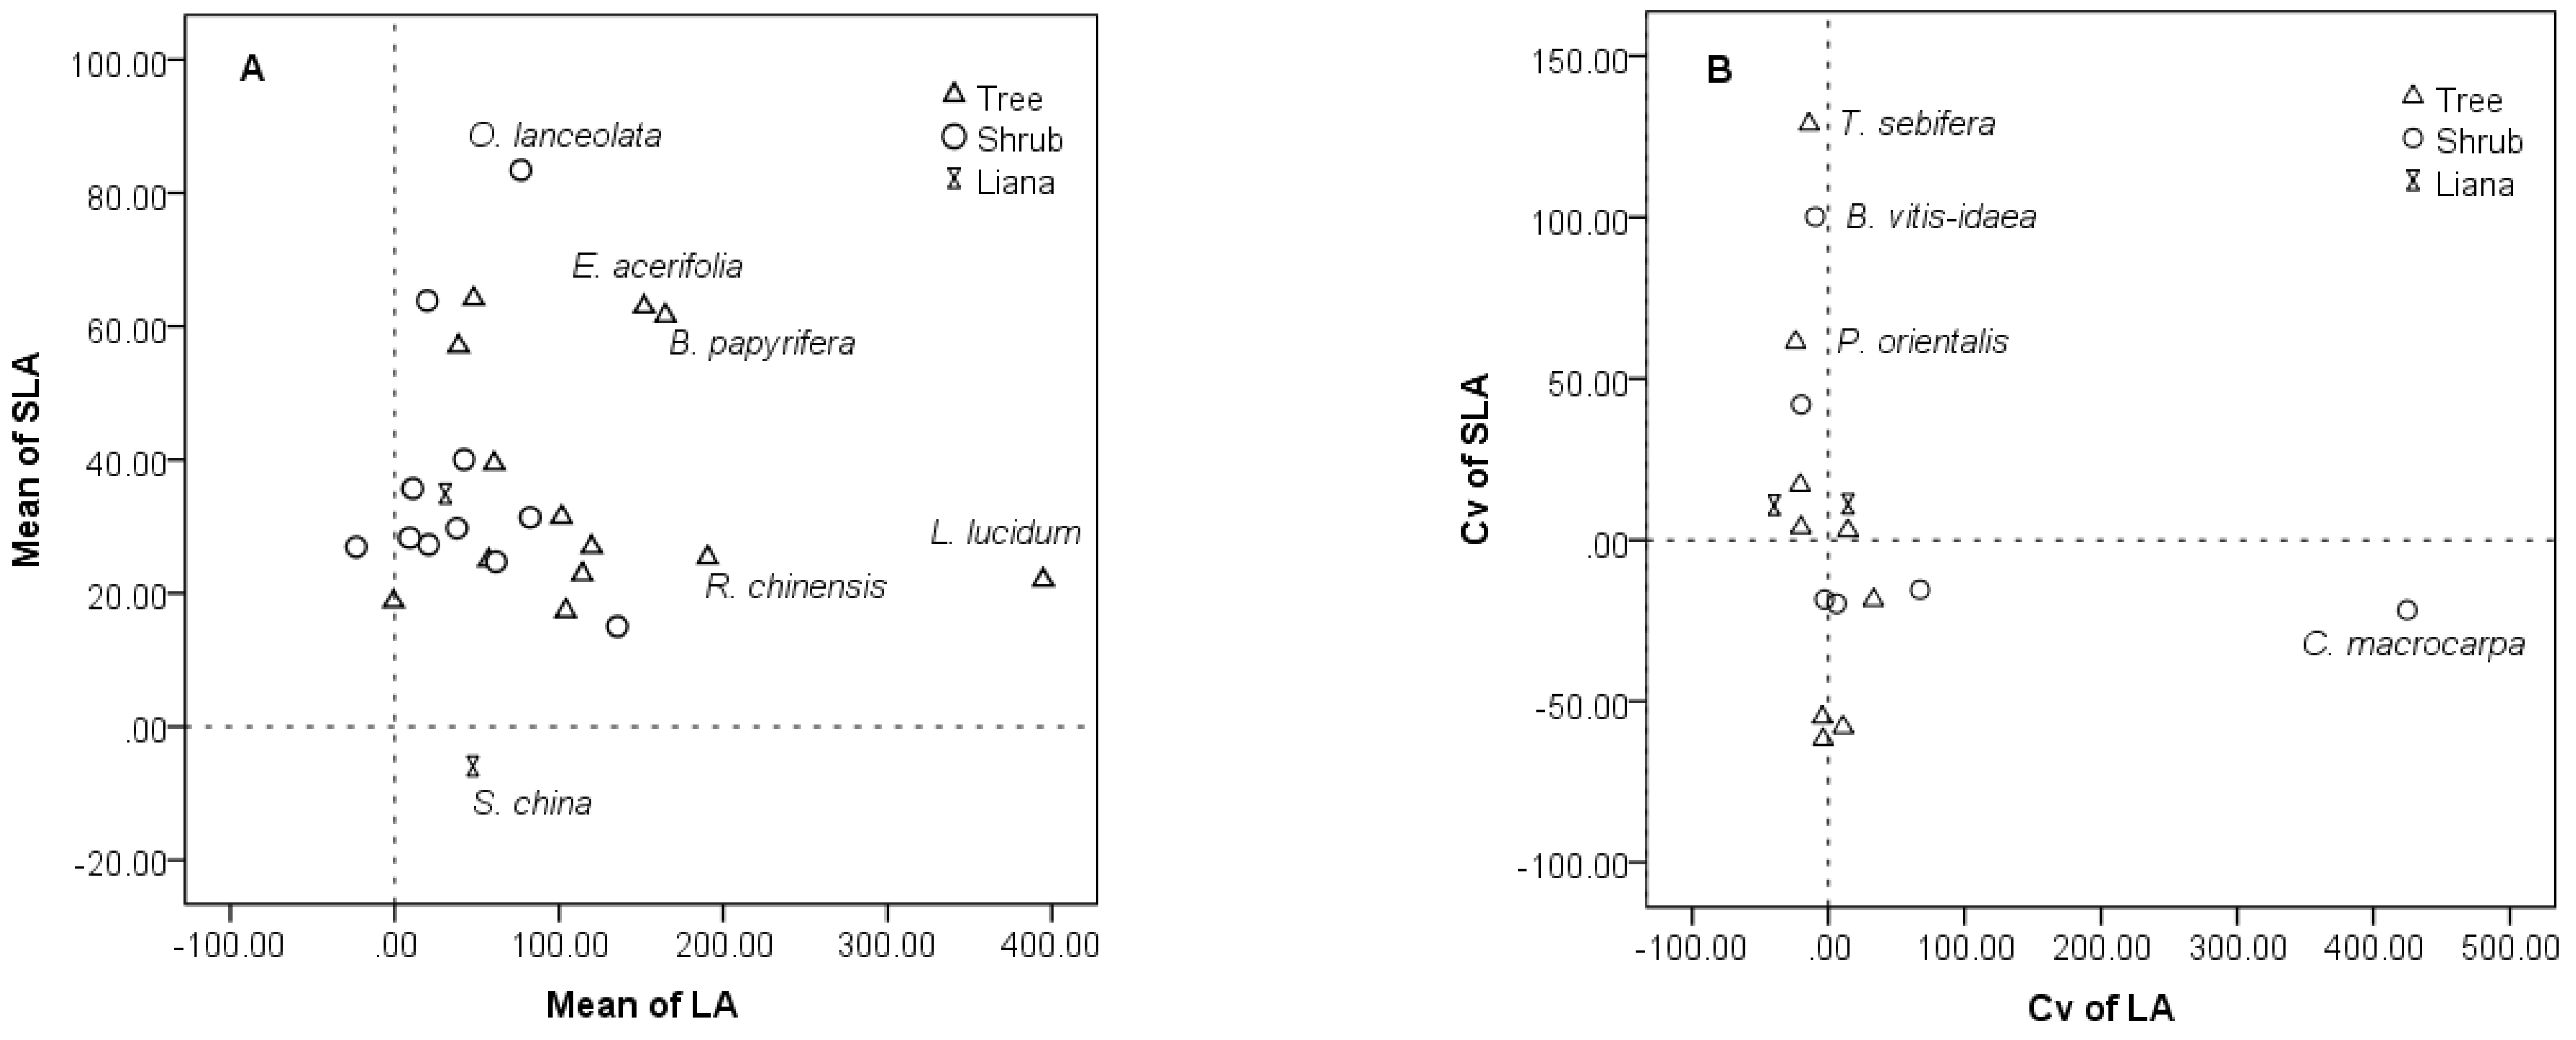
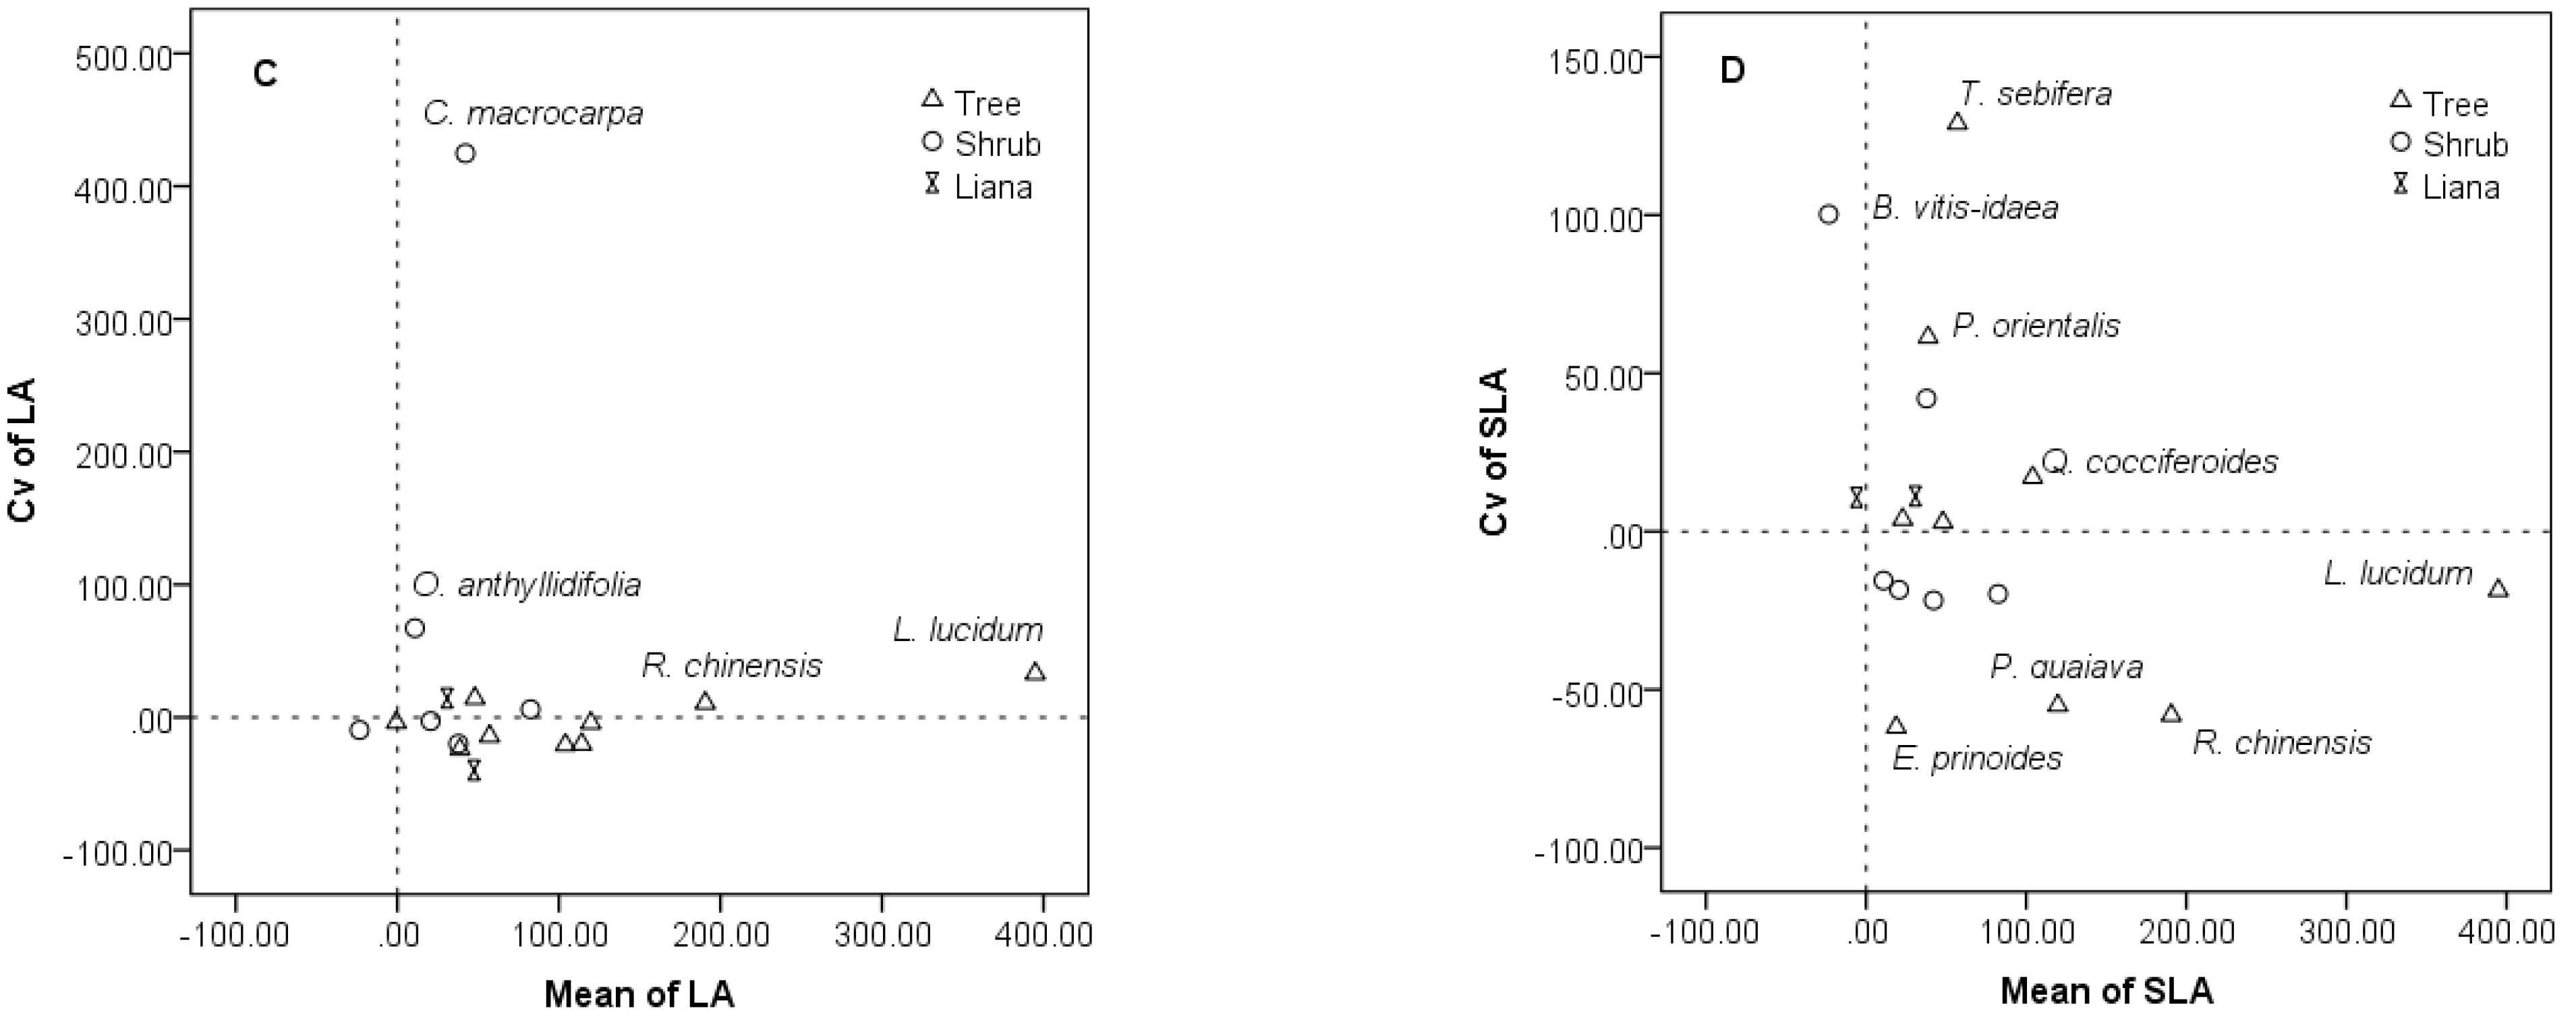
3.4. Intraspecific and Interspecific Variations in the Restoration Community

The CV of the leaf traits varied with the types of traits (F = 81.358, p < 0.01), and LA had the largest CV, followed by SLA and CHL (Figure 6). For all the leaf traits, intraspecies variation played a limited role in explaining the total variation within each treatment (all p > 0.05). In the whole experimental plot, plant community adapted to the heterogeneous environment through the difference in species and changing trait values between the populations. Intra-species variation in LA and SLA contributed 29.54% (F = 8.630, p < 0.01) and 46.94% (F = 21.240, p < 0.01) of the sum of intra- and inter-species variation, respectively, but the interspecies variation was still relatively higher in all the leaf traits (Table 1).

4. Discussion

Variation patterns of functional traits are key to understanding ecological processes and assisting ecosystem restoration [30,31,47]. This study assessed the changes in typical leaf traits in communities that were established from forest topsoil translocation by comparing the mean position and variability along shading gradients, and we further outlined the directional and quantitative variation at the species and community levels. Our study found that the shade gradients drove different responses in the trait mean and variability. The trait mean showed a similar change direction, but the responses were species-specific and trait-specific; four models in LA and SLA were separately identified in the assembling species. The variabilities changed to various degrees and had different directions; therefore, no discrepancy was observed at the community level. These results could help to enrich our understanding of trait–environment interactions in communities and direct restoration management.

4.1. Changes of Trait Mean along Shading Gradients

Our study on leaf traits was conducted in a controlled field plot and the seedlings were from the same native reference forest. Trait plasticity is based on ontogenetic stage and phenotypic and heritable genetic variation [32]. In this study, the last two factors (especially phenotypic variation) were the main sources of variation, because the plant communities were established by blending seedbank in topsoil at the same time, and the variation in other resources was minimized by controlled plots considering that trait performances could be affected by resource conditions [36,42,47]. The LA and SLA were found to be the most sensitive traits to shading in our study, and most of the species had larger leaves and higher values of area per mass after shading. These results are in accordance with those of previous studies that have reported leaf traits to be obviously changed by light conditions, and the changes showed similar trends [7,10,11,39], indicating that increasing LA and SLA to obtain adequate light resources should be a common strategy of response to low-light conditions in some groups [48,49], although these changes can be induced by both the quantity and quality of light [50]. At the community level, the chlorophyll content per area was higher in the open conditions than in the shading treatments; this trend was also found in Quercus plants [51], and thicker leaves might be the main reason for it. But this pattern is different to typical differences between shade and sun leaves, which show similar chlorophyll content per area in the two leaf types [52]. To measure deviation due to shade [43], functional traits with high plasticity should be used cautiously. However, many previous ecological studies on trait variability have been conducted in uncontrolled field trials, while trait variation largely has environmental dependence [32,43,53].
The responses of trait mean to environmental gradients could be species-specific [7,36,42,44]. When controlling the shade degree, different responses clearly emerge among co-occurring species. Here, four models were defined to describe the effects of shading on LA and SLA according to the degree of shading at which traits were induced to change and the following trends (Figure 3). Species with continuous and stable response models responded to shading in slight shading treatments, while some did not respond until severe shading. The dual response showed that slight shading increased the values of leaf traits and severe shading decreased them to that in full light conditions in a few species. In a given community, plant species usually present specific differences in response to light demand or shading tolerance; these differences may affect the responses of species that co-occurred across the shading gradients [14,15,19]. For seedlings of tropical tree species [7], the largest changes in most species in this study were observed to occur at relatively high light conditions compared to in low light conditions (3–12% daylight). Light partition will benefit co-occurring plant species, which have the advantages of utilizing light at different times [9]. Similarly, these obviously asynchronous responses permitted species to have differences in obtaining light resources in changing light environments; these species may be able to adapt to different microsites and engage in moderate competition in the seedling communities. In our study communities, species with different successional stages and abundance assembled in the same community. The dominant tree species in regional areas, such as Fraxinus malacophylla and Rhus chinensis, showed obvious changes in their leaf traits. This result was similar to that of a previous report stating that early successional plants seem to be more plastic [54]. Rhus chinensis is a pioneer species that usually grows fast in open places; it showed a significant increase in CHL with a reduction in radiation. The effects of shade can be positive or negative, both attenuating stress and limiting light resources are possible for plants [14,15,18]. We also observed decreases in the LA and SLA after increasing the level of shading; this phenomenon probably indicated that low light stress was present. The results that were obtained could direct habitat management to create a suitable light environment in the study area.

4.2. Changes of Trait Variability among Populations in Different Shading Treatments

Although the mean values of LA and SLA changed greatly in same direction along the shading gradients, the directions and extent of the trait CV of the species differed. Therefore, the extent of the trait variation of species in different shading conditions was similar at the community level. Previous studies have suggested that limitations in ecological factors could restrict the range of possible traits, while a stressful environment could also contribute to an increasing trend of intraspecific variation [40,42]. In our study communities, the no shading treatment caused a relatively harsh environment with intense radiation and high levels of evapotranspiration, and shaded habitats were relatively more favorable places, with higher levels of species richness and abundance. The differentiation of the CV response in different species may be the main reason for this phenomenon. Some species showed increased intraspecific variation along the shading gradients, while others showed decreased variation. Therefore, the mean CV in the populations in four treatments was relatively stable, although obvious changes in the trait values were observed between the open and shaded treatments. Some previous studies have suggested that variation in traits within populations can change along environment gradients [33,39,53], and it has been found that intraspecific trait variation differs in high- and low-light conditions for understory saplings and coffee trees [46,55]. Our findings support the notion that the extent of variation within populations differs along the shading gradient in most species, but no significant evidence was found to demonstrate that communities in shading habitats have higher or lower levels of intraspecific variation at the community scale. A similar pattern was also found in the traits of tree species in drought gradients [56]. Trait plasticity can alter the interactions of plants in communities [44,47], the responses of traits may differ in species along different stress gradients [56], and complementary variation can benefit species coexistence by balancing intra- and inter-species competition in a given environment. In practice, our results imply that sample sizes should be varied in order to acquire ranges of traits along environmental gradients at the species level, as variation in populations differs in different species and in different environmental conditions. In this study, we controlled the abiotic factors to acquire relatively homogeneous habitats in each treatment, but in large-scale field studies, it is impossible to maintain evenness in experimental plots. Thus, differences in environmental factors (light, water, etc.) can increase the intraspecific variation in one setting gradient [47]. This may be why some studies support the use of mean traits in biogeography studies and state that sampling ranges should not be excessively large [32].

4.3. Inter- and Intra-Specific Variation in the Community

Inter- and intra-specific variation jointly contribute to plant–environment interactions [32,44]. Our results showed that the intraspecific variations in LA and SLA were higher than the variations in LW and CHL at the community level, and they also showed a higher relative proportion in the total trait variation. This is similar to the results that were obtained from a global analysis, where the SLA shows relatively high intraspecific variation, with leaf width and length being the most stable traits [32]. The SLA was revealed to be highly dependent on light conditions, and trait–environment interactions may explain the responsiveness of plant traits to ecological processes or specific environmental gradients [31]. LW was not sensitive to changes in light level, partly because the function of the leaf shape may be weakly correlated to light, although several physical environmental factors might be altered to some degree by shading. In addition, leaf shape is considered as phylogenetically constrained trait [57]. CHL is key to photosynthesis and maintaining chlorophyll concentration per area will enhance the photosynthetic advantage that is obtained from having larger leaves. Related studies have also shown that leaf morphological traits are more conservative than other traits [32], Additionally, research has shown that the variation within species is correlated to the main function of the trait in a given condition [33,47]. Interspecific variability was found to be the main reason for the variation in the four leaf traits that were examined along the shading gradient in this study. Even so, these results further support the notion that intraspecific variability is trait-dependent and important for regional adaptation.

4.4. Implication for Management of Restoration Community

This study gives considerable insight into trait variation along shading gradients at the community level, and these results allow us to provide some practical suggestions for vegetation restoration. Firstly, shading is necessary for restoration in dry areas with strong radiation, because larger leaf areas and specific leaf areas seem to be adaptive traits in moderately shaded environments [7,58]. Thus, slight shading can be recommended for the protection of woody seedlings. Secondly, distinctive light conditions should be selected for raising seedlings of different tree species due to the different responses to shading, particularly when certain species have been propagated in artificial environments. In addition, native and diverse components can buffer the effects of fluctuations in trait variation in communities; therefore, the construction of a proper species composition (e.g., similar to that of the native community) may be a considerable factor for the restoration of communities that are coping with environmental changes. However, the sample size of some species and the range of shading treatments that were offered were limited in our study; shading treatments generated microclimate gradients with changes of temperature, evapotranspiration, and wind [16] and the effects of which were not explored in this study. Further research in more communities of various ecosystems is needed, and trait variation should be tested further in the context of forest restoration practices.

5. Conclusions

This study set out to evaluate the variation in leaf traits along the shading gradient in a field-controlled restoration community. The findings clearly indicated that variation patterns differed in different species and traits, while the trait mean and extent of variation responded to shading in different ways. The morphological traits that were closely correlated with photosynthesis had a level of high plasticity under heterogeneous light conditions, and species had variable response models. The extent of variation within species was relatively stable at the community level because changes took place in different species in opposite directions and at various magnitudes. Intraspecific and interspecific variation jointly affect changes in leaf traits across different habitats. The present study highlights the fact that the change in niche position that is characterized by the trait mean is the main strategy in local adaptation, and the degree of variation within populations may change along environmental gradients. Nevertheless, diverse species can buffer the variation degree in communities. Vegetation restoration should consider selecting species with specific trait–environment interactions and ensuring that environmental management is compatible based on the trait responses.

Supplementary Materials

The following supporting information can be downloaded at: https://www.mdpi.com/article/10.3390/d14080600/s1, Table S1: List of study species in the restoration community; Table S2: Matrix table of the plant species with different response modes of leaf area and specific leaf area.

Author Contributions

Conceptualization, F.C., G.Z. and Y.S.; Formal analysis, F.C. and X.F.; Funding acquisition, Y.S.; Investigation, F.C., G.Z., Z.L., B.T., H.Z. and Q.W.; Project administration, Y.S.; Visualization, X.F.; Writing—original draft, F.C.; Writing—review & editing, F.C. and Y.S. All authors have read and agreed to the published version of the manuscript.

Funding

This work was financially supported by the National Key Research and Development Program of Ministry of Science and Technology of the People’s Republic of China (2016YFC0502504), the “135 program” of the Chinese Academy of Science (No. 2017XTBG-F01) and Innovation team of Neijiang Normal University (2020TD02).

Institutional Review Board Statement

Not applicable.

Informed Consent Statement

Not applicable.

Acknowledgments

We thank Tingting Wang, Zihe Muliu, Lin Yang, Bin Xu, Jie Gao, and Ling Luo for their collaboration in the field sampling work, we also thank Shilan Ma, Yidan Zhang, and Nan Zhang for their assistance in measurement of leaf traits.

Conflicts of Interest

The authors declare no conflict of interest.

References

  1. FAO. Global Forest Resources Assessment 2020: Main Report; FAO: Rome, Italy, 2020; ISBN 9789251329740. [Google Scholar]
  2. Matricardi, E.A.T.; Skole, D.L.; Costa, O.B.; Pedlowski, M.A.; Samek, J.H.; Miguel, E.P. Long-term forest degradation surpasses deforestation in the Brazilian Amazon. Science 2020, 369, 1378–1382. [Google Scholar] [CrossRef] [PubMed]
  3. Rokich, D.P.; Dixon, K.W.; Sivasithamparam, K.; Meney, K.A. Topsoil handling and storage effects on woodland restoration in western Australia. Restor. Ecol. 2010, 8, 196–208. [Google Scholar] [CrossRef]
  4. Douterlungne, D.; Martinez, G.M.C.; Badano, E.I.; Cano, J.A.F.; Rivas, J.D.F. Restoring oak forests on bare ground using topsoil translocation. Ecol. Eng. 2018, 120, 76–84. [Google Scholar] [CrossRef]
  5. Zhou, Q.Q.; Li, F.; Cai, X.A.; Rao, X.Q.; Zhou, L.X.; Liu, Z.F.; Lin, Y.B.; Fu, S.L. Survivorship of plant species from soil seedbank after translocation from subtropical natural forests to plantation forests. For. Ecol. Manag. 2019, 432, 741–747. [Google Scholar] [CrossRef]
  6. Zhao, G.J.; Shen, Y.X.; Liu, W.Y.; Tan, B.L.; Li, Z.J.; Wang, Q.H. Quantifying the effect of shading and watering on seed germination in translocated forest topsoil at a subtropical karst of China. For. Ecol. Manag. 2020, 459, 117811. [Google Scholar] [CrossRef]
  7. Poorter, L. Growth responses of 15 rain-forest tree species to a light gradient: The relative importance of morphological and physiological traits. Funct. Ecol. 1999, 13, 396–410. [Google Scholar] [CrossRef]
  8. Lin, J.; Harcombe, P.A.; Fulton, M.R.; Hall, R.W. Sapling growth and survivorship as a function of light in a mesic forest of southeast Texas, USA. Oecologia 2002, 132, 428–435. [Google Scholar] [CrossRef] [PubMed]
  9. Kamiyama, C.; Oikawa, S.; Hikosaka, K. Seasonal change in light partitioning among coexisting species of different functional groups along elevation gradient in subalpine moorlands. New Phytol. 2014, 204, 913–923. [Google Scholar] [CrossRef] [PubMed]
  10. Sack, L.; Melcher, P.J.; Liu, W.H.; Middleton, E.; Pardee, T. How strong is intracanopy leaf plasticity in temperate deciduous trees? Am. J. Bot. 2006, 93, 829–839. [Google Scholar] [CrossRef] [Green Version]
  11. Legner, N.; Fleck, S.; Leuschner, C. Within-canopy variation in photosynthetic capacity, SLA and foliar N in temperate broad-leaved trees with contrasting shade tolerance. Trees 2014, 28, 263–280. [Google Scholar] [CrossRef]
  12. Sasso, S.A.Z.; Marchese, J.A.; Moura, A.P.C.; Gil, B.V.; Perboni, A.T.; Donazzolo, J.; Oliveira, F.L.R.; Sant’Anna-Santos, B.F.; Rohr, A.; Danner, M.A. Shade and sapling size influence restoration of Araucaria angustifolia. J. For. Res. 2020, 32, 1833–1841. [Google Scholar] [CrossRef]
  13. Williams, L.J.; Cavender-Bares, J.; Paquette, A.; Messier, C.; Reich, P.B. Light mediates the relationship between community diversity and trait plasticity in functionally and phylogenetically diverse tree mixtures. J. Ecol. 2020, 108, 1617–1634. [Google Scholar] [CrossRef]
  14. Pagès, J.P.; Pache, G.; Joud, D.; Magnan, N.; Michalet, R. Direct and indirect effects of shade on four forest tree seedlings in the french alps. Ecology 2003, 84, 2741–2750. [Google Scholar] [CrossRef]
  15. Semchenko, M.; Lepik, M.; Götzenberger, L.; Zobel, K. Positive effect of shade on plant growth: Amelioration of stress or active regulation of growth rate? J. Ecol. 2012, 100, 459–466. [Google Scholar] [CrossRef]
  16. Callaway, R.M. Positive Interactions and Interdependence in Plant Communities; Springer: Dordrecht, The Netherlands, 2007; pp. 23–48. [Google Scholar]
  17. Chang-Yang, C.-H.; Needham, J.; Lu, C.-L.; Hsieh, C.-F.; Sun, I.-F.; McMahon, S.M. Closing the life cycle of forest trees: The difficult dynamics of seedling-to-sapling transitions in a subtropical rain forest. J. Ecol. 2021, 109, 2705–2716. [Google Scholar] [CrossRef]
  18. Jefferson, L.V.; Pennacchio, M. The impact of shade on establishment of shrubs adapted to the high light irradiation of semi-arid environments. J. Arid Environ. 2005, 63, 706–716. [Google Scholar] [CrossRef]
  19. López, R.P.; Squeo, F.A.; Gutiérrez, J.R. Differential effect of shade, water and soil type on emergence and early survival of three dominant species of the Atacama Desert. Austral Ecol. 2016, 41, 428–436. [Google Scholar] [CrossRef]
  20. Lusk, C.H.; Reich, P.B.; Montgomery, R.A.; Ackerly, D.D.; Cavender-Bares, J. Why are evergreen leaves so contrary about shade? Trends Ecol. Evol. 2008, 23, 299–303. [Google Scholar] [CrossRef]
  21. Sánchez-Gómez, D.; Zavala, M.A.; Valladares, F. Functional traits and plasticity linked to seedlings’ performance under shade and drought in Mediterranean woody species. Ann. For. Sci. 2008, 65, 311. [Google Scholar] [CrossRef] [Green Version]
  22. Lusk, C.H.; Laughlin, D.C. Regeneration patterns, environmental filtering and tree species coexistence in a temperate forest. New Phytol. 2017, 213, 657–668. [Google Scholar] [CrossRef] [Green Version]
  23. Chen, X.P.; Sun, J.; Wang, M.T.; Lyu, M.; Niklas, K.J.; Michaletz, S.T.; Zhong, Q.L.; Cheng, D.L. The leaf economics spectrum constrains phenotypic plasticity across a light gradient. Front. Plant Sci. 2020, 11, 735. [Google Scholar] [CrossRef] [PubMed]
  24. Daz, S.; Cabido, M. Vive la différence: Plant functional diversity matters to ecosystem processes. Trends Ecol. Evol. 2001, 16, 646–655. [Google Scholar] [CrossRef]
  25. Kraft, N.J.B.; Valencia, R.; Ackerly, D.D. Functional traits and niche-based tree community assembly in an Amazonian forest. Science 2008, 322, 580–582. [Google Scholar] [CrossRef] [PubMed] [Green Version]
  26. Balachowski, J.A.; Volaire, F.A. Implications of plant functional traits and drought survival strategies for ecological restoration. J. Appl. Ecol. 2018, 55, 631–640. [Google Scholar] [CrossRef]
  27. Bergholz, K.; Kober, K.; Jeltsch, F.; Schmidt, K.; Weiss, L. Trait means or variance—What determines plant species’ local and regional occurrence in fragmented dry grasslands? Ecol. Evol. 2021, 11, 3357–3365. [Google Scholar] [CrossRef]
  28. Umaña, M.N.; Swenson, N.G.; Marchand, P.; Cao, M.; Lin, L.X.; Zhang, C.C. Relating leaf traits to seedling performance in a tropical forest: Building a hierarchical functional framework. Ecology 2021, 102, e03385. [Google Scholar] [CrossRef] [PubMed]
  29. Yang, J.; Cao, M.; Swenson, N.G. Why functional traits do not predict tree demographic rates. Trends Ecol. Evol. 2018, 33, 326–336. [Google Scholar] [CrossRef]
  30. Zeldin, J.; Lichtenberger, T.M.; Foxx, A.J.; Williams, E.W.; Kramer, A.T. Intraspecific functional trait structure of restoration-relevant species: Implications for restoration seed sourcing. J. Appl. Ecol. 2020, 57, 864–874. [Google Scholar] [CrossRef]
  31. Zirbel, C.R.; Brudvig, L.A. Trait-environment interactions affect plant establishment success during restoration. Ecology 2020, 101, e02971. [Google Scholar] [CrossRef] [Green Version]
  32. Siefert, A.; Violle, C.; Chalmandrier, L.; Albert, C.H.; Taudiere, A.; Fajardo, A.; Aarssen, L.W.; Baraloto, C.; Carlucci, M.B.; Cianciaruso, M.V.; et al. A global meta-analysis of the relative extent of intraspecific trait variation in plant communities. Ecol. Lett. 2015, 18, 1406–1419. [Google Scholar] [CrossRef] [Green Version]
  33. Burton, J.I.; Perakis, S.S.; Mckenzie, S.C.; Lawrence, C.E.; Puettmann, K.J. Intraspecific variability and reaction norms of forest understorey plant species traits. Funct. Ecol. 2017, 31, 1881–1893. [Google Scholar] [CrossRef] [Green Version]
  34. Roches, S.D.; Post, D.M.; Turley, N.E.; Bailey, J.K.; Hendry, A.P.; Kinnison, M.T.; Schweitzer, J.A.; Palkovacs, E.P. The ecological importance of intraspecific variation. Nat. Ecol. Evol. 2018, 2, 57–64. [Google Scholar] [CrossRef] [PubMed]
  35. Candeias, M.; Fraterrigo, J. Trait coordination and environmental filters shape functional trait distributions of forest understory herbs. Ecol. Evol. 2020, 10, 14098–14112. [Google Scholar] [CrossRef] [PubMed]
  36. Dong, N.; Prentice, I.C.; Wright, I.J.; Evans, B.J.; Togashi, H.F.; Caddy-Retalic, S.; McInerney, F.A.; Sparrow, B.; Leitch, E.; Lowe, A.J. Components of leaf-trait variation along environmental gradients. New Phytol. 2020, 228, 82–94. [Google Scholar] [CrossRef]
  37. Mello, F.N.A.; Estrada-Villegas, S.; DeFilippis, D.M.; Schnitzer, S.A. Can functional traits explain plant coexistence? A case study with tropical lianas and trees. Diversity 2020, 12, 397. [Google Scholar] [CrossRef]
  38. Di Biase, L.; Fattorini, S.; Cutini, M.; Bricca, A. The role of inter- and intraspecific variations in grassland plant functional traits along an elevational gradient in a Mediterranean mountain area. Plants 2021, 10, 359. [Google Scholar] [CrossRef]
  39. Pérez-Ramos, I.M.; Roumet, C.; Cruz, P.; Blanchard, A.; Autran, P.; Garnier, E. Evidence for a ‘plant community economics spectrum’ driven by nutrient and water limitations in a Mediterranean rangeland of southern France. J. Ecol. 2012, 100, 1315–1327. [Google Scholar] [CrossRef] [Green Version]
  40. Niu, K.; Zhang, S.; Lechowicz, M.J. Harsh environmental regimes increase the functional significance of intraspecific variation in plant communities. Funct. Ecol. 2020, 34, 1666–1677. [Google Scholar] [CrossRef]
  41. Hoffmann, A.A.; Merilä, J. Heritable variation and evolution under favourable and unfavourable conditions. Trends Ecol. Evol. 1999, 14, 96–101. [Google Scholar] [CrossRef]
  42. Valladares, F.; Gianoli, E.; Gómez, J.M. Ecological limits to plant phenotypic plasticity. New Phytol. 2007, 176, 749–763. [Google Scholar] [CrossRef]
  43. Keenan, T.F.; Niinemets, Ü. Global leaf trait estimates biased due to plasticity in the shade. Nat. Plants 2016, 3, 16201. [Google Scholar] [CrossRef] [PubMed] [Green Version]
  44. Westerband, A.C.; Funk, J.L.; Barton, K.E. Intraspecific trait variation in plants: A renewed focus on its role in ecological processes. Ann. Bot. 2021, 127, 397–410. [Google Scholar] [CrossRef]
  45. Hofhansl, F.; Chacón-Madrigal, E.; Brännström, Å.; Dieckmann, U.; Franklin, O. Mechanisms driving plant functional trait variation in a tropical forest. Ecol. Evol. 2021, 11, 3856–3870. [Google Scholar] [CrossRef]
  46. Buchanan, S.; Isaac, M.E.; Van den Meersche, K.; Martin, A.R. Functional traits of coffee along a shade and fertility gradient in coffee agroforestry systems. Agrofor. Syst. 2019, 93, 1261–1273. [Google Scholar] [CrossRef]
  47. Callaway, R.M.; Pennings, S.C.; Richards, C.L. Phenotypic plasticity and interactions among plants. Ecology 2003, 84, 1115–1128. [Google Scholar] [CrossRef] [Green Version]
  48. Poorter, H.; Niinemets, Ü.; Ntagkas, N.; Siebenkäs, A.; Mäenpää, M.; Matsubara, S.; Pons, T.L. A meta-analysis of plant responses to light intensity for 70 traits ranging from molecules to whole plant performance. New Phytol. 2019, 223, 1073–1105. [Google Scholar] [CrossRef] [Green Version]
  49. Sancho-Knapik, D.; Escudero, A.; Mediavilla, S.; Scoffoni, C.; Zailaa, J.; Cavender-Bares, J.; Álvarez-Arenas, T.G.; Molins, A.; Alonso-Forn, D.; Ferrio, J.P.; et al. Deciduous and evergreen oaks show contrasting adaptive responses in leaf mass per area across environments. New Phytol. 2021, 230, 521–534. [Google Scholar] [CrossRef] [PubMed]
  50. Ballaré, C.L. Illuminated behaviour: Phytochrome as a key regulator of light foraging and plant anti-herbivore defence. Plant Cell Environ. 2009, 32, 713–725. [Google Scholar] [CrossRef] [PubMed]
  51. Rodríguez-Calcerrada, J.; Pardos, J.A.; Gil, L.; Aranda, I. Acclimation to light in seedlings of Quercus petraea (Mattuschka) Liebl. and Quercus pyrenaica Willd. planted along a forest-edge gradient. Trees 2007, 21, 45–54. [Google Scholar] [CrossRef]
  52. Lambers, H.; Oliveira, R.S. Physiological Plant Ecology; Springer: Cham, Switzerland, 2019; p. 37. [Google Scholar]
  53. Matesanz, S.; Ramírez-Aliente, J.A. A review and meta-analysis of intraspecific differences in phenotypic plasticity: Implications to forecast plant responses to climate change. Glob. Ecol. Biogeogr. 2019, 28, 1682–1694. [Google Scholar] [CrossRef]
  54. Valladares, F.; Wright, S.J.; Lasso, E.; Kitajima, K.; Pearcy, R.W. Plastic phenotypic response to light of 16 congeneric shrubs from a panamanian rainforest. Ecology 2000, 81, 1925–1936. [Google Scholar] [CrossRef]
  55. Carlucci, M.B.; Debastiani, V.J.; Pillar, V.D.; Duarte, L.D.S. Between- and within-species trait variability and the assembly of sapling communities in forest patches. J. Veg. Sci. 2015, 26, 21–31. [Google Scholar] [CrossRef]
  56. Anderegg, L.D.L.; Loy, X.; Markham, I.P.; Elmer, C.M.; Hovenden, M.J.; HilleRisLambers, J.; Mayfield, M.M. Aridity drives coordinated trait shifts but not decreased trait variance across the geographic range of eight Australian trees. New Phytol. 2021, 229, 1375–1387. [Google Scholar] [CrossRef] [PubMed]
  57. Nicotra, A.B.; Leigh, A.; Boyce, C.K.; Jones, C.S.; Niklas, K.J.; Royer, D.L.; Tsukaya, H. The evolution and functional significance of leaf shape in the angiosperms. Funct. Plant Biol. 2011, 38, 535–552. [Google Scholar] [CrossRef] [Green Version]
  58. Wang, D.; Huang, X.L.; Chen, J.Z.; Li, L.X.; Cheng, J.; Wang, S.; Liu, J.M. Plasticity of leaf traits of juglans regia l. f. luodianense liu et xu seedlings under different light conditions in karst habitats. Forests 2021, 12, 81. [Google Scholar] [CrossRef]
Figure 1. Field restoration plot and experimental design in the karst hill, SW China. Dark rooms covered with different shading nets provided different shading gradients. Seedlings were germinated from the same topsoil that was translocated from the natural forest in local areas in shading rooms and open quadrats.
Diversity 14 00600 g001
Figure 2. The responses of leaf shape (A), leaf area (B), specific leaf area (C) and chlorophyll concentration (D) in different environments with shading gradients. The general linear model was used to test the significant difference of each trait in the four shading gradients (using species and shading as factors), followed by LSD multiple comparison. Here, 0.05 was used as the significance level. The analyzed samples (n = 28) were plant assemblies that emerged in the shaded treatments (n = 4). Box-plots are shown in this figure, and different lowercase letters indicate significant differences among the light treatments.
Diversity 14 00600 g002
Figure 3. The percentage of plant species with significant changes and response modes in leaf traits following shading gradient changes. The total number of analyzed species here is 23 (n = 23). LW is the leaf shape index defined by the ratio of the length and width of the leaf, LA is the leaf area, SLA is the specific leaf area, and CHL is the chlorophyll concentration in the leaf measured as a SPAD value. Open and 66% shading represent controlled treatments and severe shading, respectively. Contents in brackets following modes mean the points at which significant changes were observed (conducted by multiple comparison using LSD), and figures in brackets following traits mean the number of species with significant responses in this mode.
Diversity 14 00600 g003
Figure 4. The distribution of variation coefficients of leaf traits in different populations at different shading gradients. Each circle presents a value for a different species, and the dotted line presents the changes in the mean of the overall species. All species that were studied in the communities (A) and the same species in the four treatments (B) were analyzed. Different letters indicate significant differences among the four shading treatments.
Diversity 14 00600 g004
Figure 5. Change magnitude of leaf area (LA) and specific leaf area (SLA) in shading habitats compared to open habitats. All the data presented here are the percentages of changed values (mean in all the shading treatments minus the mean value in open conditions) relative to values that were obtained in open conditions. (A,B) show the changes in the trait mean or coefficient of variation (CV) in LA and SLA; (C,D) showed the changes in the mean and CV in LA or SLA.
Diversity 14 00600 g005aDiversity 14 00600 g005b
Figure 6. The coefficients of variation of four leaf traits in the study of restoration communities. The bars are the mean ± 2 SE, and the different letters indicate significant differences among the four shading treatments. LW is the leaf shape index, LA is the leaf area, SLA is the specific leaf area, and CHL is the chlorophyll concentration in the leaf that was measured as the SPAD value.
Diversity 14 00600 g006
Table 1. The relative percentage of variation in leaf traits intraspecies and interspecies in heterogenetic habitats that were produced by shading. The same species (n = 20) that emerged in the four treatments (trait mean of each species in each treatment, n = 4) were used for analysis.
Leaf TraitsSource of VariationdfRelative Variation (%)Fp
Leaf shape index
(LW)
Intra-species31.580.8210.488
Inter-species1998.4249.981<0.001
Leaf area
(LA)
Intra-species329.548.630<0.001
Inter-species1970.4620.587<0.001
Specific leaf area
(SLA)
Intra-species346.9421.240<0.001
Inter-species1953.0624.009<0.001
Chlorophyll concentration
(CHL)
Intra-species37.391.5950.202
Inter-species1792.6119.983<0.001
Publisher’s Note: MDPI stays neutral with regard to jurisdictional claims in published maps and institutional affiliations.

