Crystal Structure, Stability and Desolvation of the Solvates of Sorafenib Tosylate
by

Peng Yang
1,†, 
Chunlei Qin
1,†,
Shichao Du
1,
Lina Jia
1,
Yujia Qin
1,
Junbo Gong
1,2 and
Songgu Wu
1,2,* 1
State Key Laboratory of Chemical Engineering, School of Chemical Engineering and Technology, Tianjin University, Tianjin 300072, China
2
Collaborative Innovation Center of Chemical Science and Engineering, Tianjin 300072, China
*
Author to whom correspondence should be addressed.
†
Author contributions: P. Y. and C. Q. contributed equally.
Crystals 2019, 9(7), 367; https://doi.org/10.3390/cryst9070367
Submission received: 31 May 2019
/
Revised: 10 July 2019
/
Accepted: 11 July 2019
/
Published: 17 July 2019
(This article belongs to the Special Issue Anti-Solvent Crystallization)
Abstract
:In this study, three solvates of sorafenib tosylate were obtained from methanol, ethanol and n-methyl-2-pyrrolidone (NMP) after solvate screening and the effect of solvent on the formation of solvate was analyzed. The solvents with high value of polarity/dipolarity and appropriate hydrogen bond donor/acceptor propensity are more likely to form corresponding solvates. The crystal structures of the solvates were elucidated for the first time by using single crystal X-ray diffraction data. The analysis results indicate that methanol solvate and ethanol solvate are isostructural and hydrogen bonds could be formed between solvent molecules and sorafenib tosylate molecules. Hirshfeld surface analysis was used to research the interactions in the solvates, and the results reveal that the H···H, C···H/H···C and O···H/ H···O contacts play the vital role in molecular packing. In addition, three solvates were characterized by polarized light microscope, powder X-ray diffraction, thermogravimetric analysis and differential scanning calorimetry. The solvates show different thermodynamic stability in methanol +NMP and ethanol +NMP mixtures. Furthermore, the desolvation of solvates was studied by hot stage microscope and discussed.
Keywords:
sorafenib tosylate; solvate; formation; Hirshfeld surface analysis; stability; desolvation1. Introduction
Solvates, a common crystal form in the pharmaceutical industry [1,2], contains active pharmaceutical ingredient (API) molecules and solvent molecules within the crystal structure [3,4], and hydrates are the particular type of solvates with the solvent being water [5]. Solvates might exhibit different physicochemical properties compared with API, such as stability, solubility, dissolution rate, which could affect the bioavailability of pharmaceuticals [6,7,8]. Solvates typically appear during the purification and processing stages of API, such as mixing, wet granulating and spray drying [9,10]. In addition, solvates may exhibit the faster dissolution rate, higher solubility and better bioavailability than the stable crystal form of API [11,12,13]. More importantly, the desolvation of solvates could be the effective even the only way to obtain certain polymorphs [13,14]. With the purpose of controlling the formation of solvates and stabilizing the product quality, it is significant to study the solvates from the perspectives of crystal structure, formation mechanism, stability, desolvation behavior, and so on.
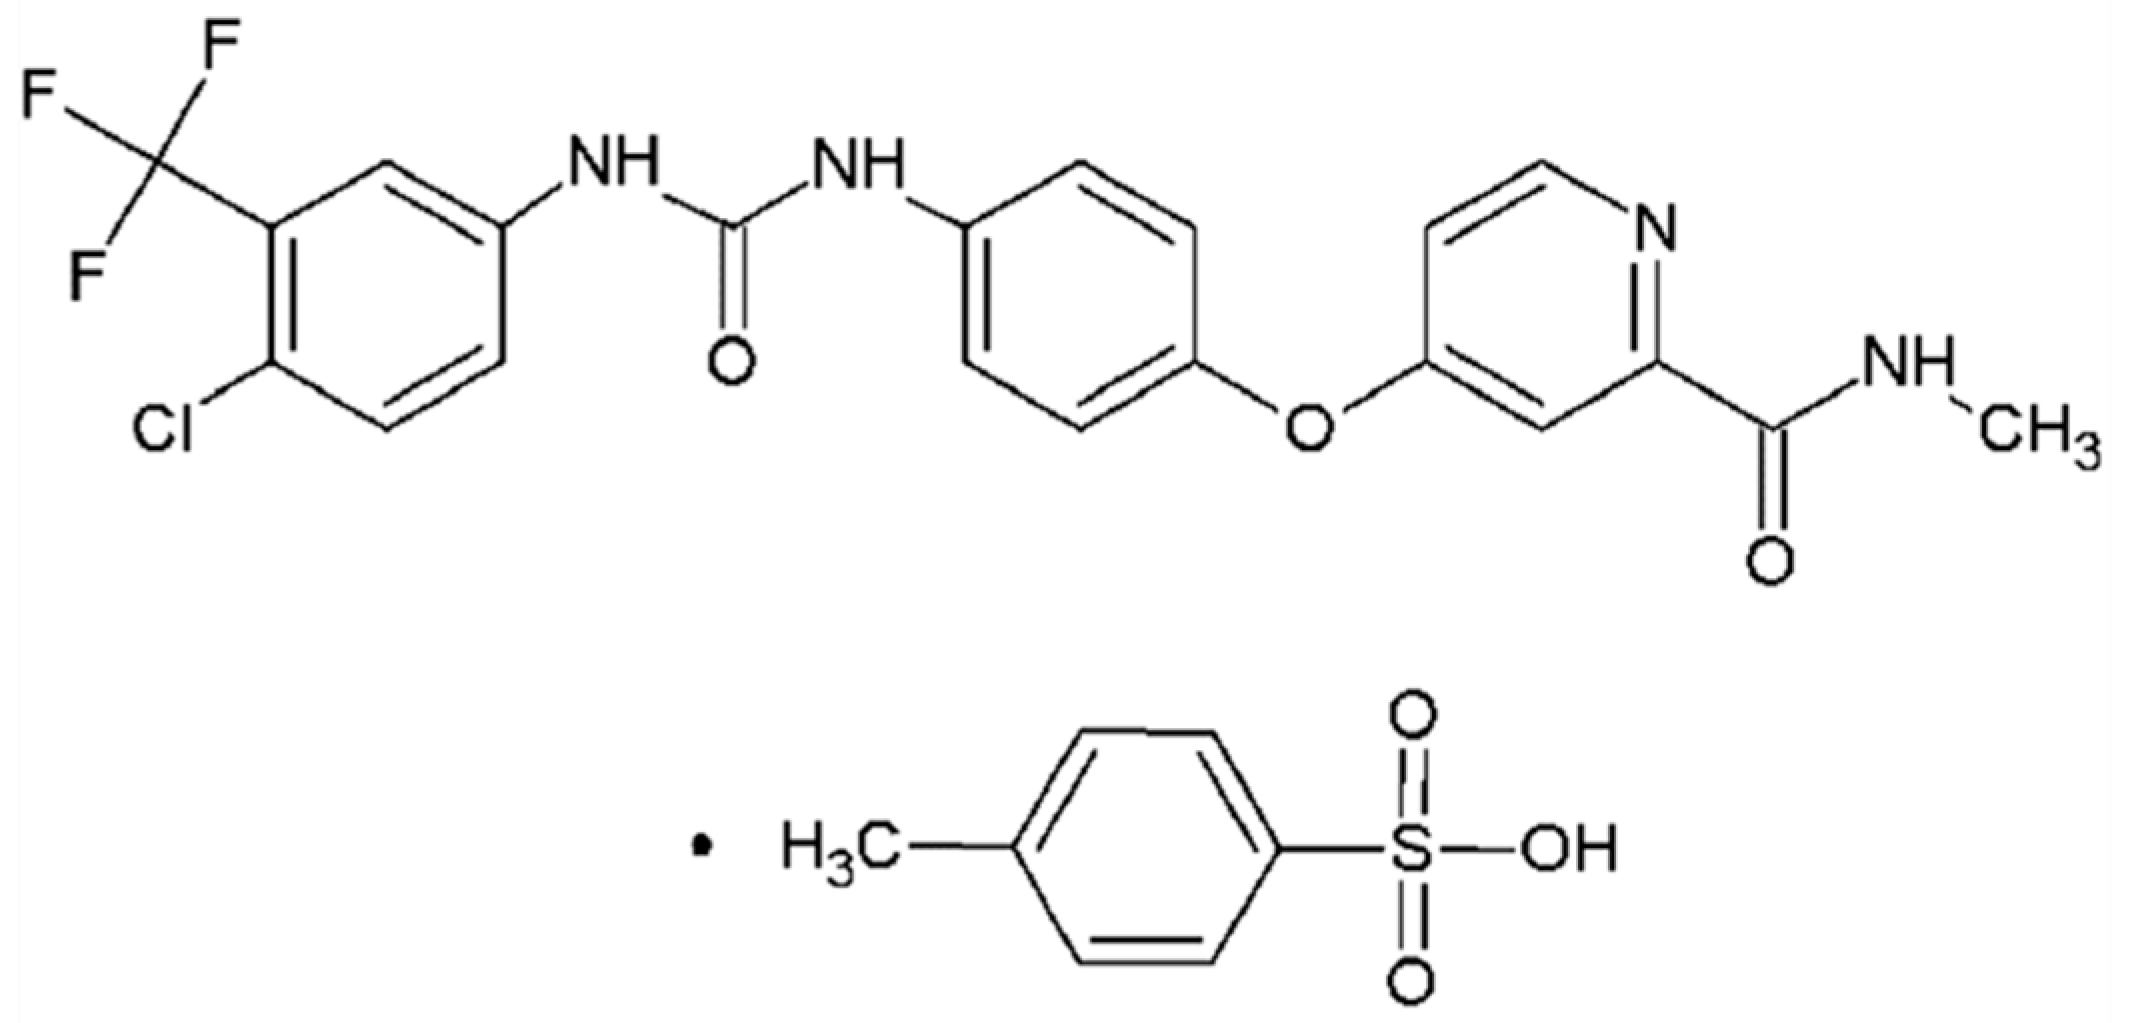
Sorafenib tosylate (ST, C21H16ClF3N4O3·C7H8O3S, CAS No.475207-59-1, Figure 1) has been proved to be a potent inhibitor in inhibiting several receptor tyrosine kinases which are involved in tumor cell proliferation and angiogenesis [15,16]. As a significant anticarcinogen, ST exhibits higher bioavailability and lower side effect compared with sorafenib [17]. However, little study about the crystal structure, stability, formation mechanism, and desolvation behavior has been carried out in the previous literature [18]. In this work, the crystal structures of three solvates obtained from methanol, ethanol and n-methyl-2-pyrrolidone (NMP) were determined by single crystal X-ray diffraction, and the effect of solvent properties on the formation of solvate was analyzed. Hirshfeld surface analysis was used to research the interactions in molecular packing. Then the polarized light microscope, powder X-ray diffraction, thermogravimetric analysis and differential scanning calorimetry were applied to fully characterize three solvates. Furthermore, the solubility of solvates in methanol +NMP and ethanol +NMP mixtures was determined to investigate the thermodynamic stability. In addition, a new NMP solvate was found and analyzed. More importantly, as a significant method to obtain certain polymorphs, the desolvation behavior of three solvates was researched by hot stage microscope and discussed.
2. Experimental Section
2.1. Materials
ST (>0.99 mass fraction) was provided by Huai’an Xinlicheng Chemical Co., Ltd. (Huai’an China), The purity of ST was determined by high-performance liquid chromatography. Methanol, ethanol, n-propanol, isopropanol, n-butanol, 2-butanol, isobutanol, acetone, acetonitrile, ethyl acetate, n-hexane, cyclohexane, dichloromethane, toluene and NMP are analytical reagents (>0.995 mass fraction) and were purchased from Tianjin Yuanli Chemical Co. (Tianjin China). These chemicals were used without further purification.
2.2. Solvate Screening and Preparation
The solvate screening of ST was investigated by selecting the most commonly used solvents. Excessive amount of ST and appropriate pure solvent were added into the EasyMax vessel (Mettler Toledo, Zurich, Switzerland) with an accuracy of 0.01 °C. After that, the EasyMax vessel was maintained at the desired temperature under the agitation speed of 200 rpm for 24 hours. Then the obtained solids were collected by filtration and characterized.
2.3. Crystal Structure Determination
The solvent evaporation method was employed to obtain the single crystals of methanol solvate and ethanol solvate of ST. Excessive amount of ST was added into methanol/ethanol. After that, the supernatant was withdrawn by a syringe with an organic filter membrane (0.22 µm) and injected into a 10 mL beaker. Then the beaker was sealed with plastic film and placed into a vacuum drying oven at 25 °C. The crystals of the solvate with suitable size for single crystal X-ray diffraction (SCXRD) were collected after several days. The NMP solvate was obtained in the 100 mL Easymax vessel by cooling crystallization. Certain amount of ST and NMP was added into vessel at 40 °C. After the dissolution of ST, the solution was cooled down to 5 °C at a rate of 0.1 °C/min, then the corresponding solvate with appropriate size for SCXRD was obtained. The Rigaku-Rapid II diffractometer with a Mo Kα radiation source (λ = 0.71073 Å) was used to collect the SCXRD data of solvates.
2.4. Characterization
Several analytical methods have been used to characterize the solvates of ST, including polarized light microscope (PLM), powder X-ray diffraction (PXRD), thermogravimetric analysis (TGA) and differential scanning calorimetry (DSC).
The morphologies of solvates were observed by a polarized light microscope (Olympus BX51, Tokyo, Japan) with a magnification of 100×.
The PXRD patterns were collected by a D/MAX-2500 diffractometer (Rigaku, Tokyo, Japan) with Cu Kα radiation (1.54056 Å) over a diffraction angle (2θ) range of 2–40° at a scanning rate of 8°/min.
Thermogravimetric analysis experiments were carried out on the TGA 1/SF (Mettler Toledo, Zurich, Switzerland) from 25 °C to 250 °C at a heating rate of 10 °C /min under nitrogen gas purge.
The DSC curves were acquired by the DSC 1/500 calorimeter (Mettler Toledo, Zurich, Switzerland) from 25 °C to 250 °C at a rate of 10 °C/min under protection of nitrogen gas.
The Fourier transform infrared (FTIR) spectra were collected in the range of 4000 to 400 cm−1 by using a Nicolet-Magna FT-IR 750 spectrometer (Waltham, MA, USA ) with the resolution of 4 cm−1.
2.5. Solubility Profile of Solvates in Binary Solvent Mixtures
To have a suitable understanding on the solution-mediated phase transformation of ST in binary solvent mixtures, the solubility of stable solvates in methanol + NMP and ethanol + NMP mixtures was determined by an Agilent 1200 HPLC system (Agilent Technologies, Santa Clara, CA, USA) at 5 °C. The chromatographic column used in this work is an Agilent Eclipse XDB-C18 column (250 × 4.6 mm, 5 µm). The composition of the mobile phase is acetonitrile/water (82.5/17.5, v/v) with a flow rate of 1.5 mL/min for ST and methanol/water (40/60, v/v) with a flow rate of 1.0 mL/min for NMP. The detection wavelengths of ST and NMP are 265 nm and 210 nm, respectively.
Excess ST was added into binary solvent mixtures (about 30 mL) in a 50 mL Erlenmeyer flask and this flask was kept at 5 °C by a thermostatic shaker (Tianjin Ounuo Instrument Co., Tianjin China) with an accuracy of 0.1 °C. After being stirred for 24 hours, the solution was kept static for 2 hours to allow undissolved particles to precipitate. After that, the supernatant was withdrawn by a syringe equipped with a 0.22 µm filter membrane and injected into a pre-weighted volumetric flask immediately. An electronic analytical balance (ML204, Mettler Toledo, Zurich Switzerland) with an accuracy of 0.0001 g was used to weigh the volumetric flask with saturated solution. Then the solution was diluted and analyzed by the HPLC method. Each experiment was repeated three times and the average value was adopted to calculate the mole fraction solubility. Finally, the solid remained in Erlenmeyer flask was analyzed by PXRD and TGA to determine its crystal form.
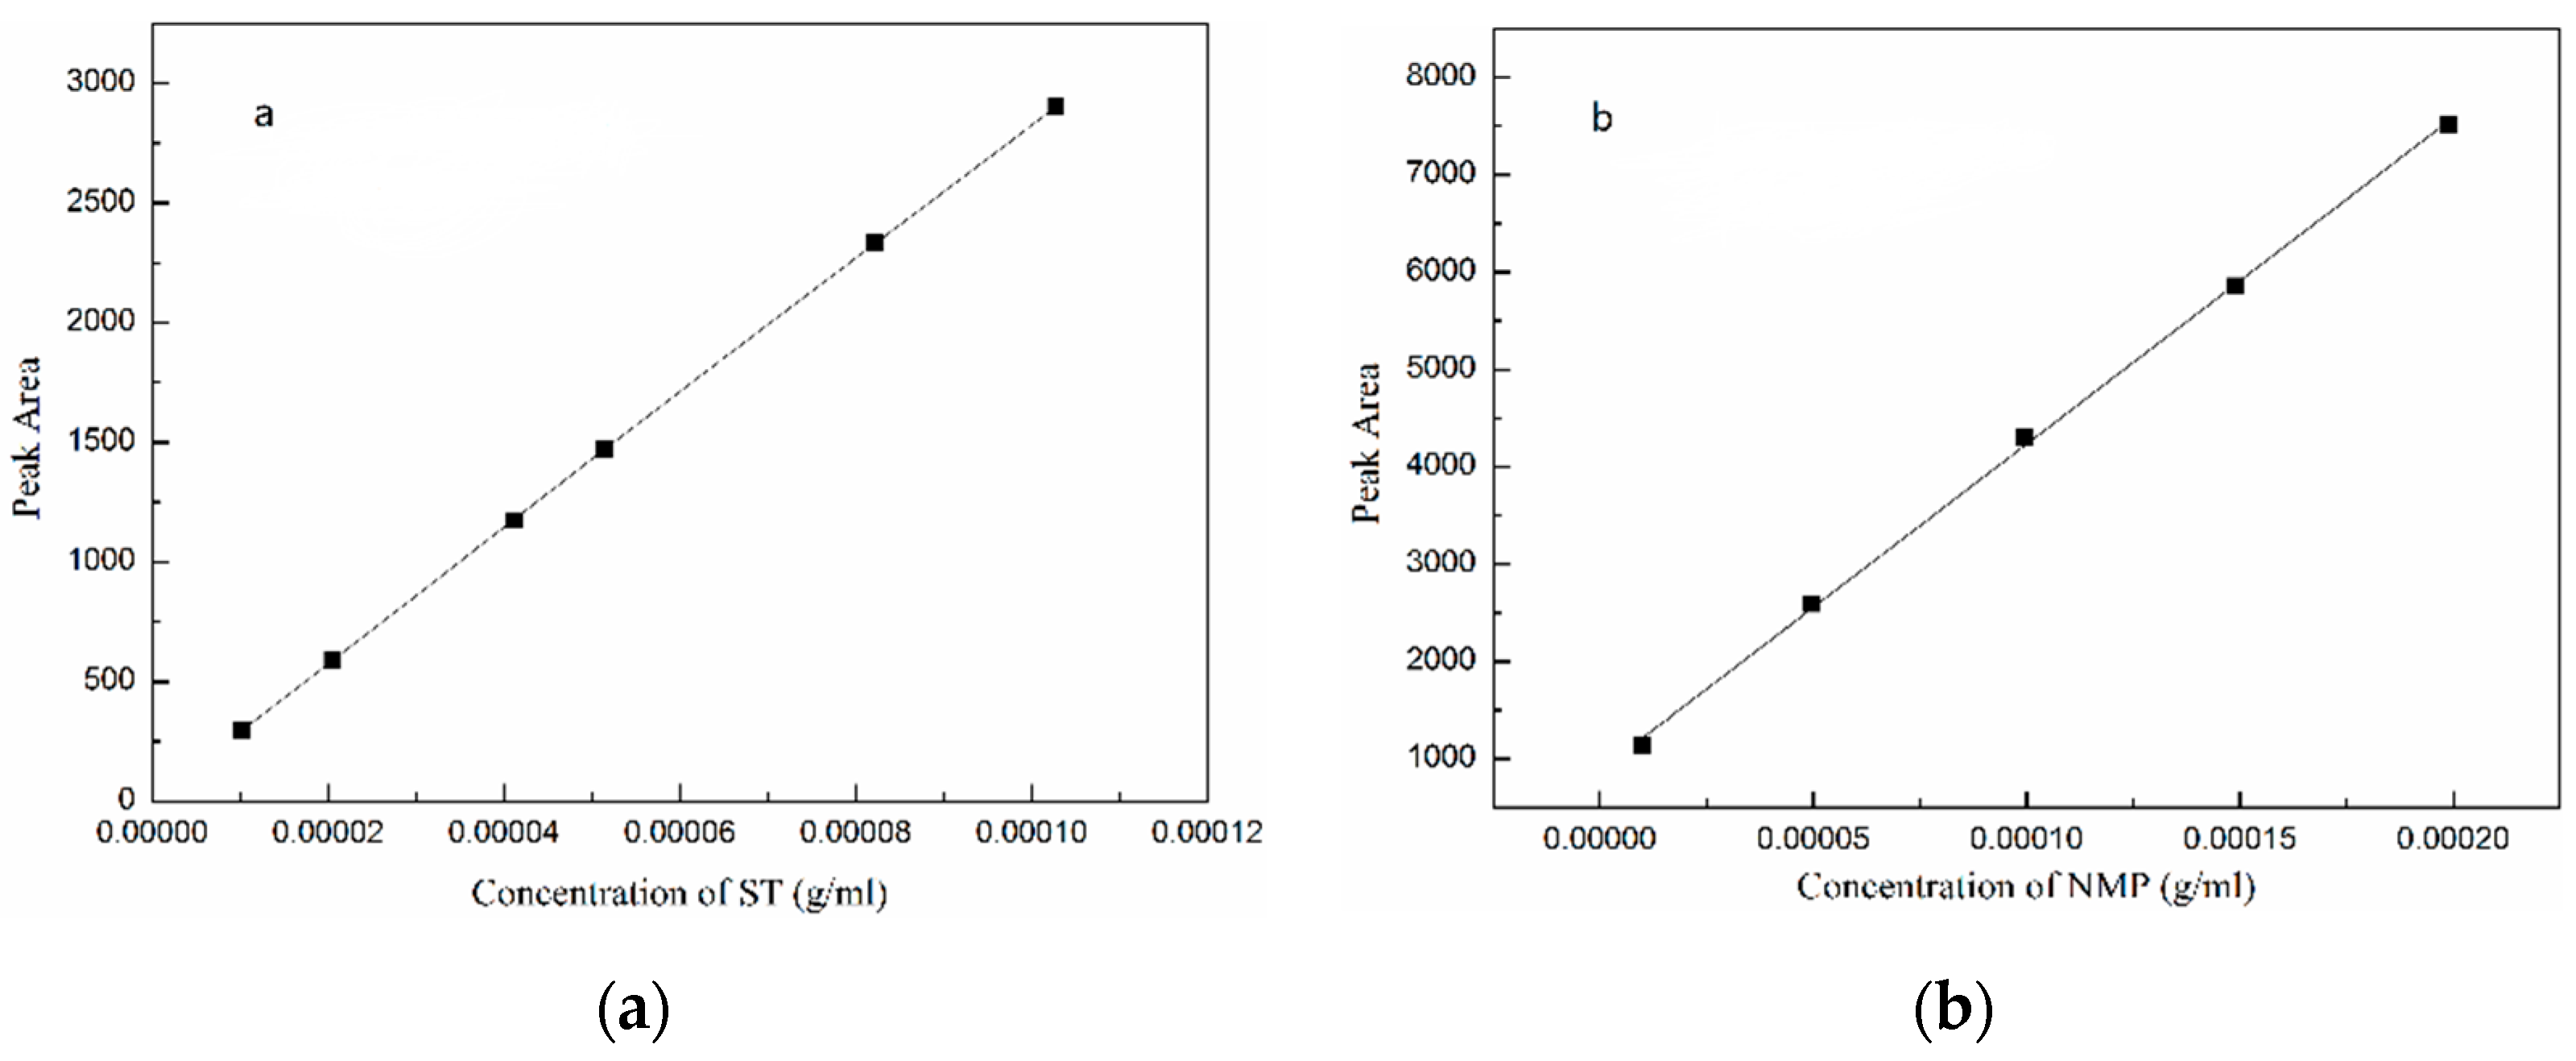
Before measuring the concentration of stable solvate, the calibration curves of ST and NMP were determined by HPLC method and are shown in Figure 2. The experiment was repeated three times to ensure the repeatability and accuracy. The calibration curves of ST and NMP are linear with R2 = 0.9999 and R2 = 0.9994, respectively.
2.6. Desolvation Behavior of Solvates
The desolvation behavior of solvates was observed by hot stage microscope (HSM, Olympus BX-51, Tokyo, Japan) from 25 °C to 250 °C at a heating rate of 5 °C /min.
3. Results and Discussion
3.1. Solvate Screening
The property parameters of solvents and crystal forms obtained in this work are given in Table 1 [19]. It can be seen that the solvates were obtained from methanol, ethanol and NMP, which can be labeled as SMe, SEt and SNMP, respectively. The result shows that the solvents play a significant role in the formation of solvate. To further understand the effect of solvent on the formation of solvate, and on the other hand, provide a suitable method for solvate screening, the properties of solvent including hydrogen bond donor propensity (Σα), hydrogen bond acceptor propensity (Σβ) and polarity/dipolarity (π*), were presented and discussed [20,21]. Table 1 shows that it is easy to form the corresponding solvate from solvents with a high value of π*. This can be concluded from the fact that the values of Σα and Σβ of the alcohols in Table 1 are close, but only methanol and ethanol with high values of π* can form corresponding solvates. This result indicates that the polarity/dipolarity of solvent has a vital effect on the formation of solvate, and that solvents with strong polarity/dipolarity can form corresponding solvates easily. However, it should be mentioned that some solvents with high values of π* are not necessarily able to form corresponding solvate, such as acetonitrile and dichloromethane. The reason for this phenomenon may be that the values of Σα and Σβ of these solvents are obviously lower compared with NMP, resulting in weak interactions with ST.
3.2. Crystal Structure of Solvate
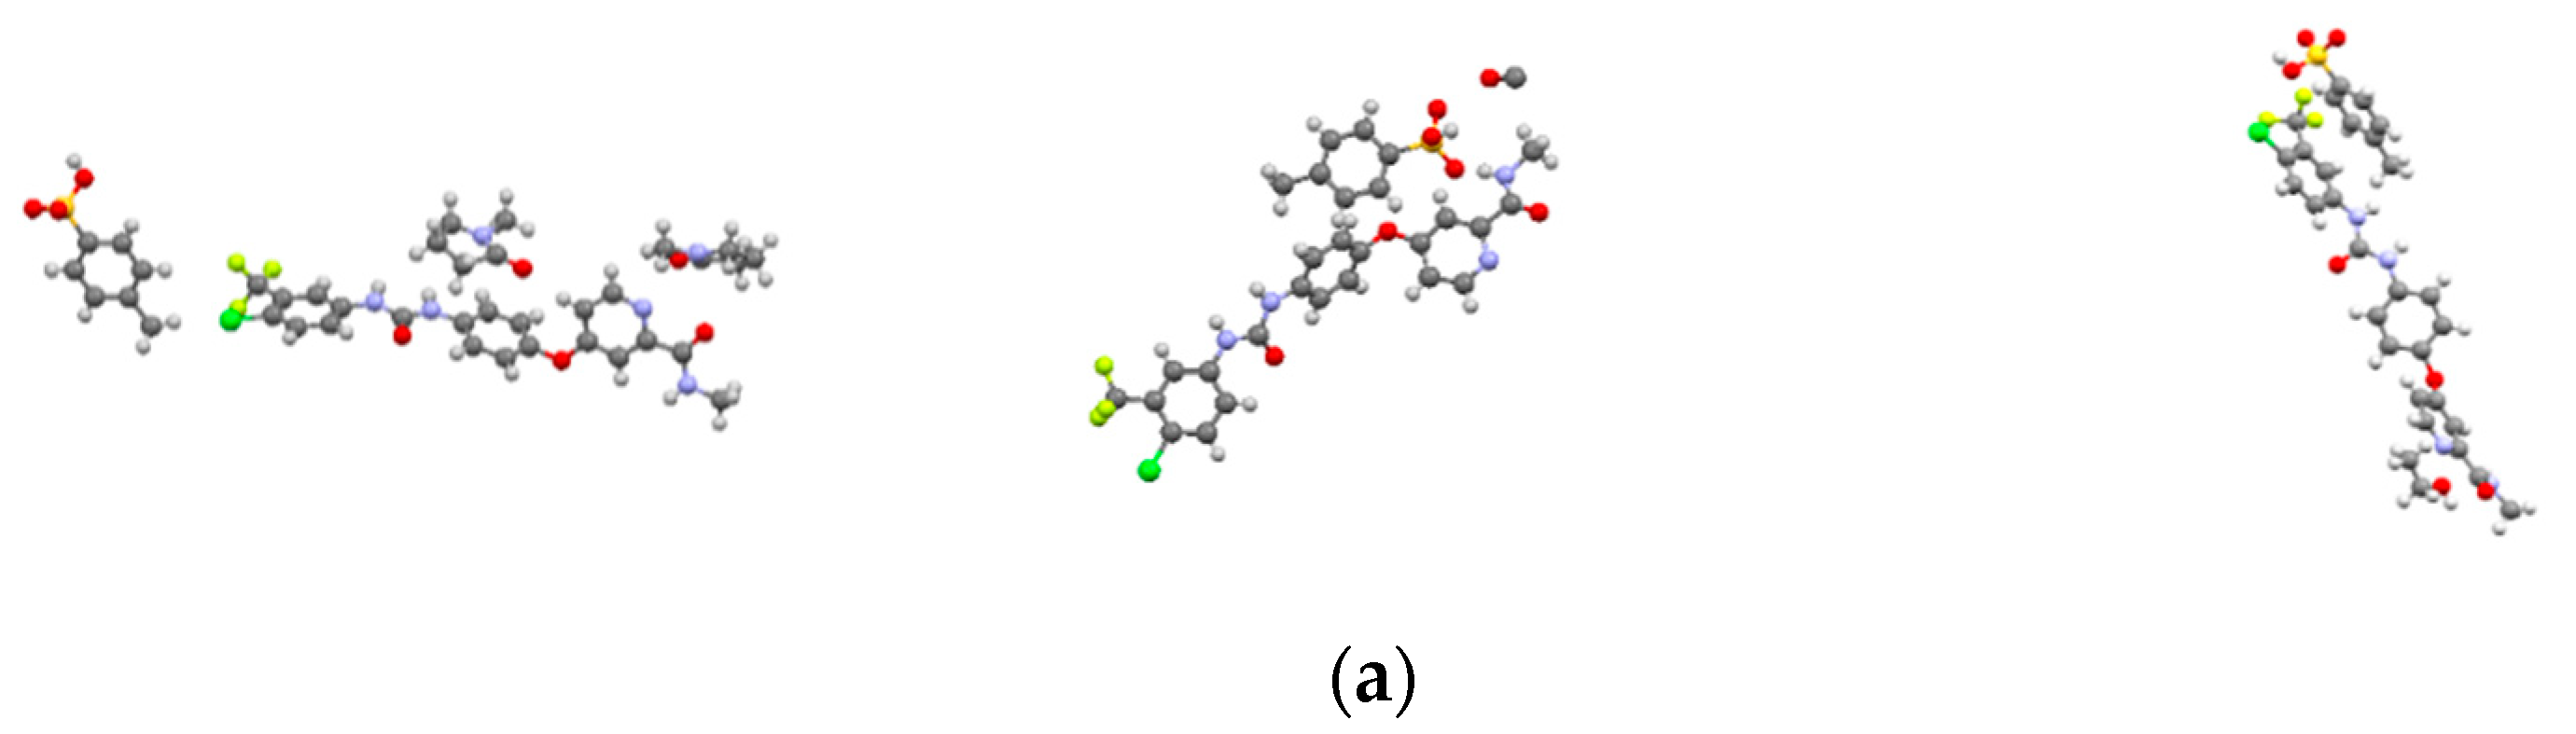
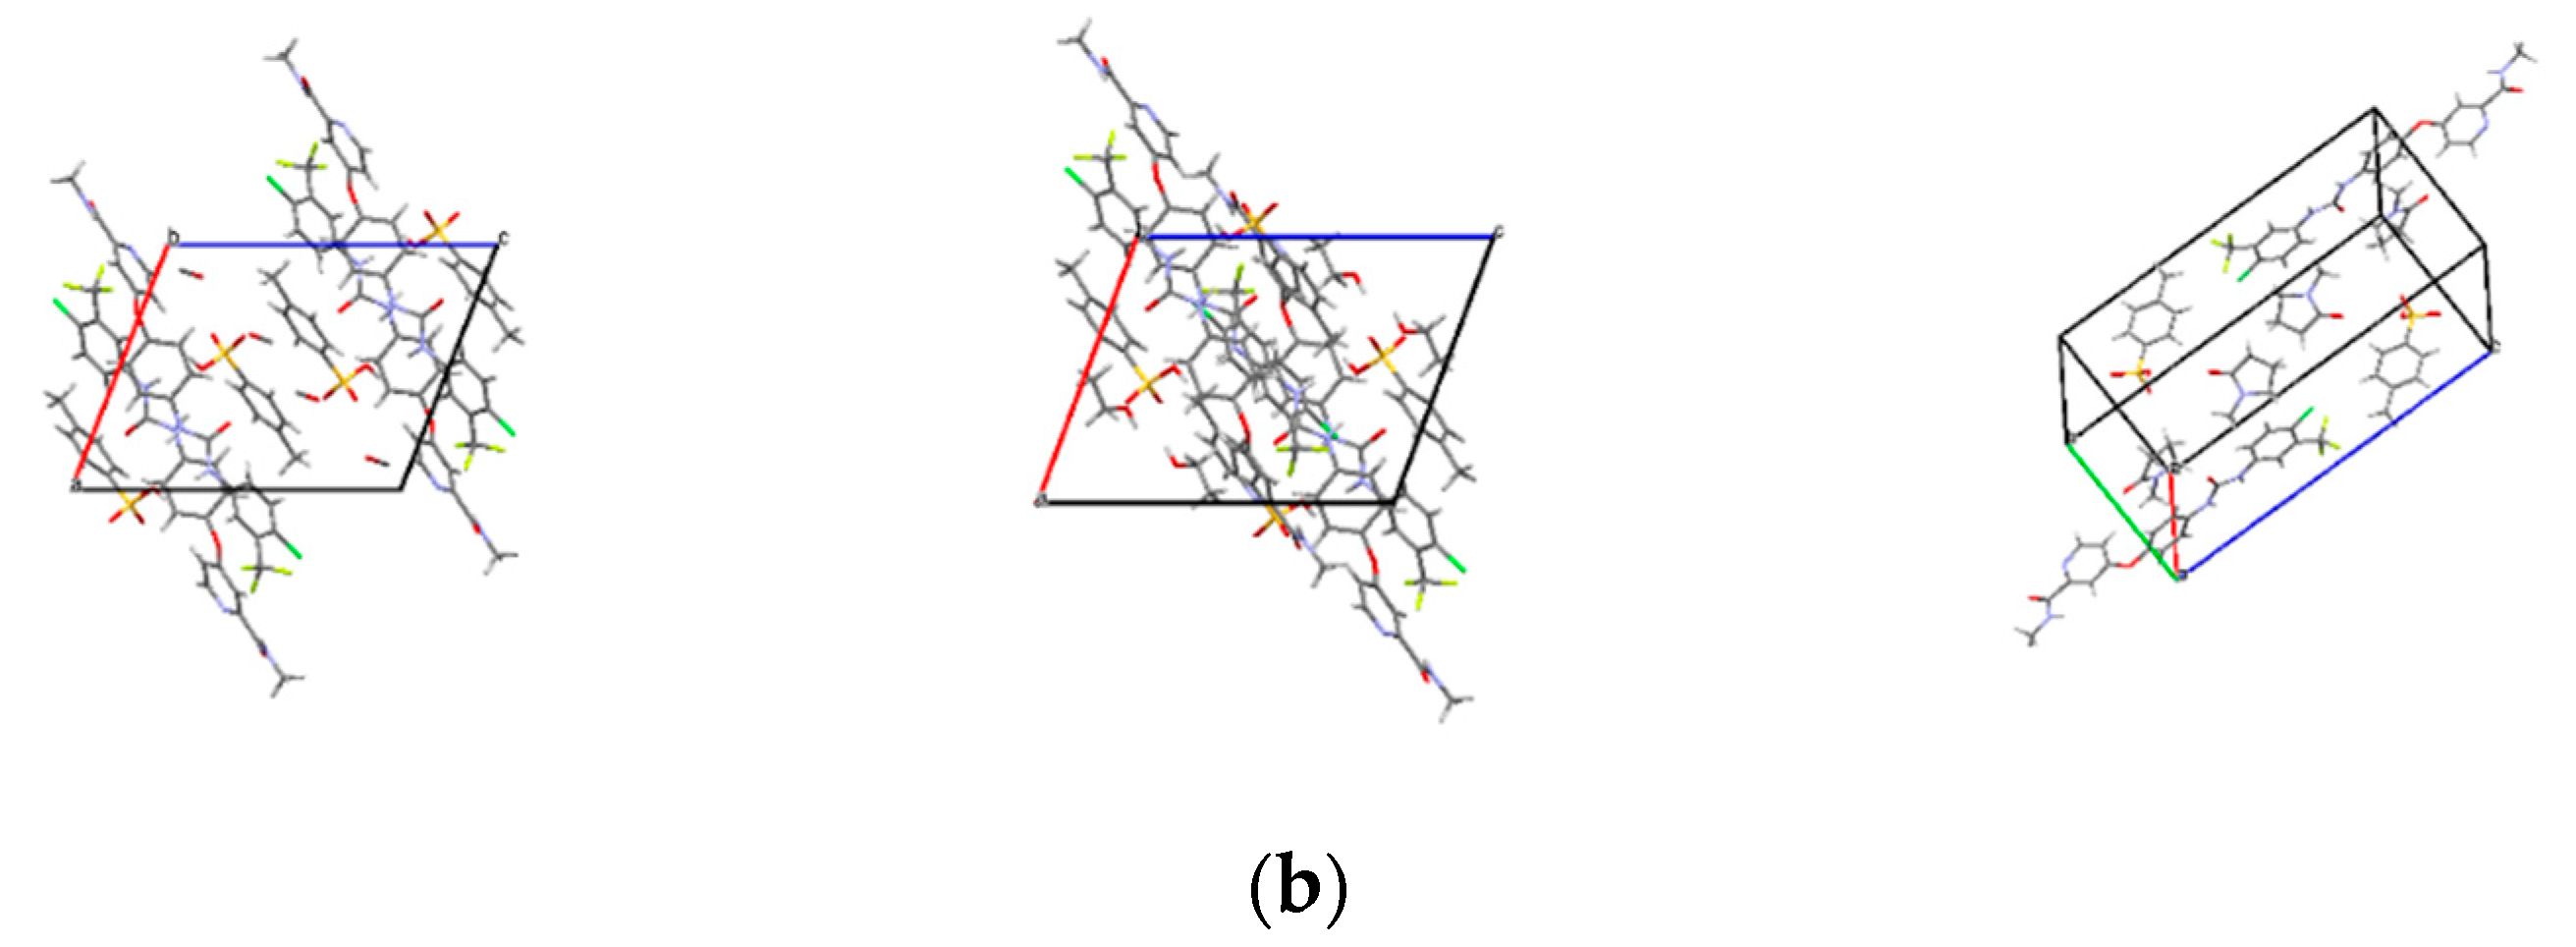
The crystal structures of SMe, SEt and SNMP were determined for the first time by SCXRD, and the crystallographic data are summarized in Table 2. The crystal structures are shown in Figure 3. The crystallographic data show that SMe and SEt are both monoclinic systems with P21/m space group, while SNMP belongs to triclinic system with space group. Table 2 illustrates that SMe and SEt have similar unit cell parameters, which are completely different from SNMP. Analysis of crystal structures indicates that SMe and SEt are isostructural. The geometrical parameters of hydrogen bonds and hydrogen bonds in three solvates are presented in Table 3 and Figure 4, respectively. Taking SEt as an example, hydrogen bonds could be formed between p-toluenesulfonic acid molecules and sorafenib molecules, and each ethanol molecule could form a hydrogen bond with a ST molecule in a crystal lattice. It is worth mentioning that the hydrogen bonds formed by methanol molecules and ST molecules cannot be displayed visually in Table 3 and Figure 4 for the reason that the methanol molecules in crystal lattice are disordered. The existence of hydrogen bonds formed by methanol molecules and ST molecules can be verified by TGA/DSC curves of SMe, which are present and are discussed in a later section. In addition, it can be seen from the crystal structure of SNMP that a single SNMP molecule is formed from an ST molecule and two NMP molecules. Furthermore, the hydrogen bond can be formed by one NMP molecule and a sorafenib molecule. Another NMP molecule will not provide the possibility for the formation of a hydrogen bond located in the cavity.
3.3. Hirshfeld Surface Analysis
As a visual and efficient way of analyzing the interactions in molecular packing and comparing the differences in crystal structures [22,23,24], Hirshfeld surfaces were used to investigate the solvates of ST. The Hirshfeld surfaces of SMe, SEt and SNMP were obtained by using CrystalExplorer 17.5 [25], and the corresponding 2D fingerprint plots are shown in Figure 5. In addition, the percentage contributions of different interactions to the Hirshfeld surface are presented in Figure 6. Due to the presence of N-H···O hydrogen bonds in SEt, the 2D fingerprint plot shows two sharp spikes, indicating strong O∙∙∙H/H∙∙∙O interactions. Similar situations could be found in the other two fingerprint plots. From Figure 6, it can be found that the H···H, C···H/H···C and O···H/H···O contacts make the greatest contribution to the Hirshfeld surface because of the H atoms on the surface and the hydrogen bonds [26]. By comparing the three histograms in Figure 6, it can also be found that the percentage contribution of H···H in SMe is much smaller than the values of SEt and SNMP. This may be caused by the disorder in SMe. In addition to the H···H, C···H and O···H contacts, the H···F/F···H contact also makes a certain contribution to the Hirshfeld surface.
3.4. Characterization
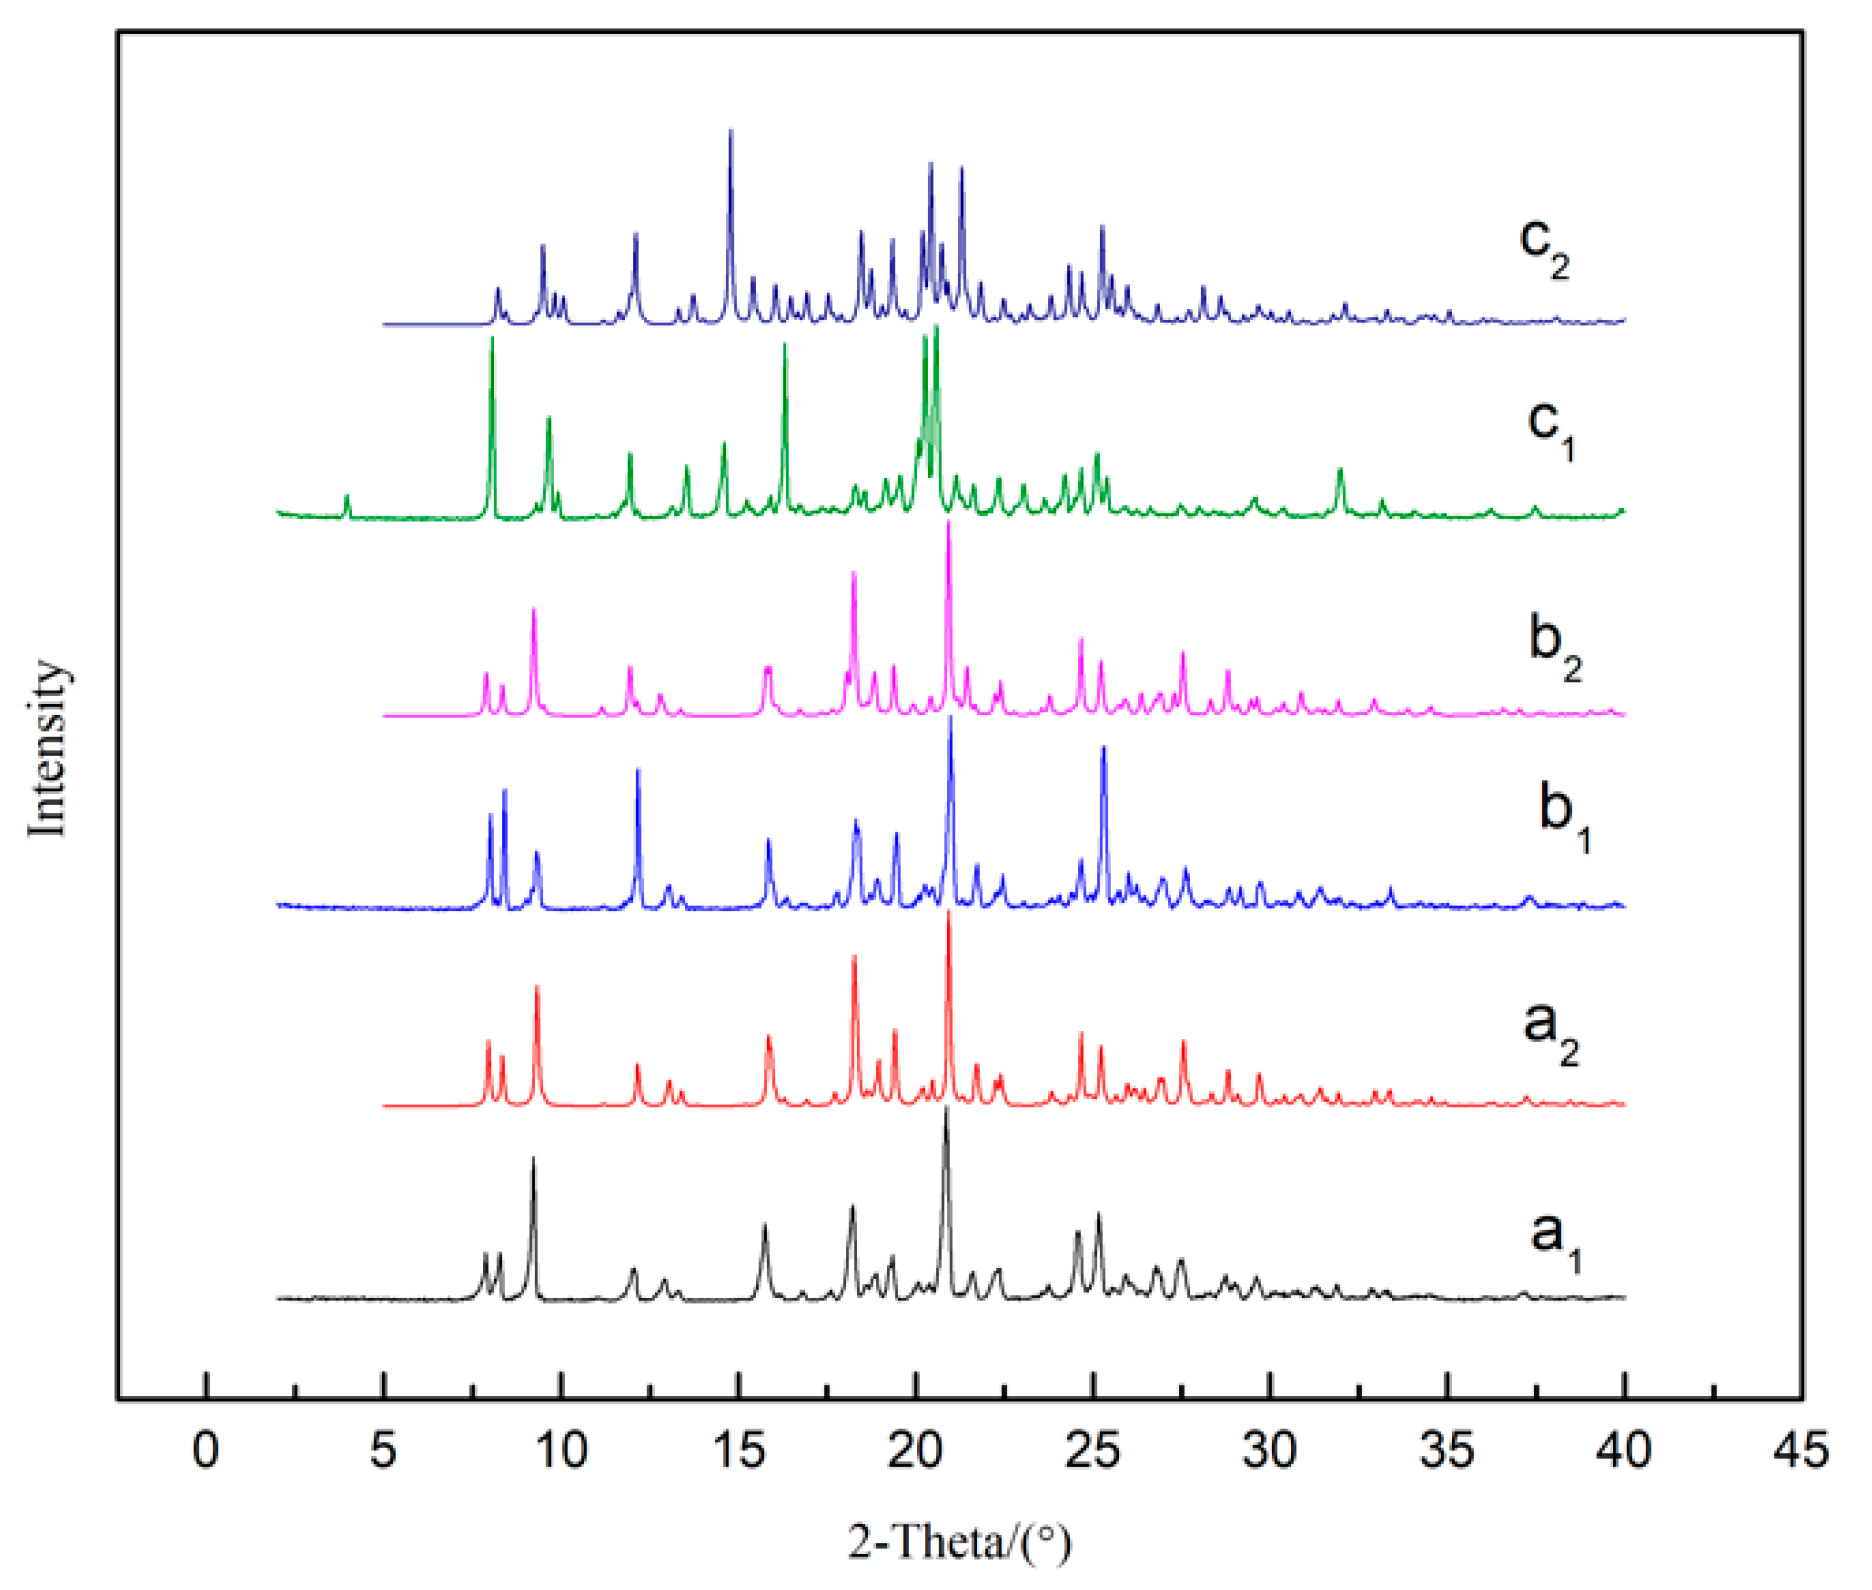
The PLM images of solvates are shown in Figure 7, indicating that SMe, SEt and SNMP exhibit diamond-like, plate-like and rod-like morphologies, respectively. The experimental and calculated PXRD patterns of solvates are shown in Figure 8. It can be seen that the experimental data show good consistency with the calculated results. It can also be found that SMe and SEt exhibit identical peaks, suggesting that SMe and SEt are isostructural, which is consistent with the analysis of the crystal structures described above.
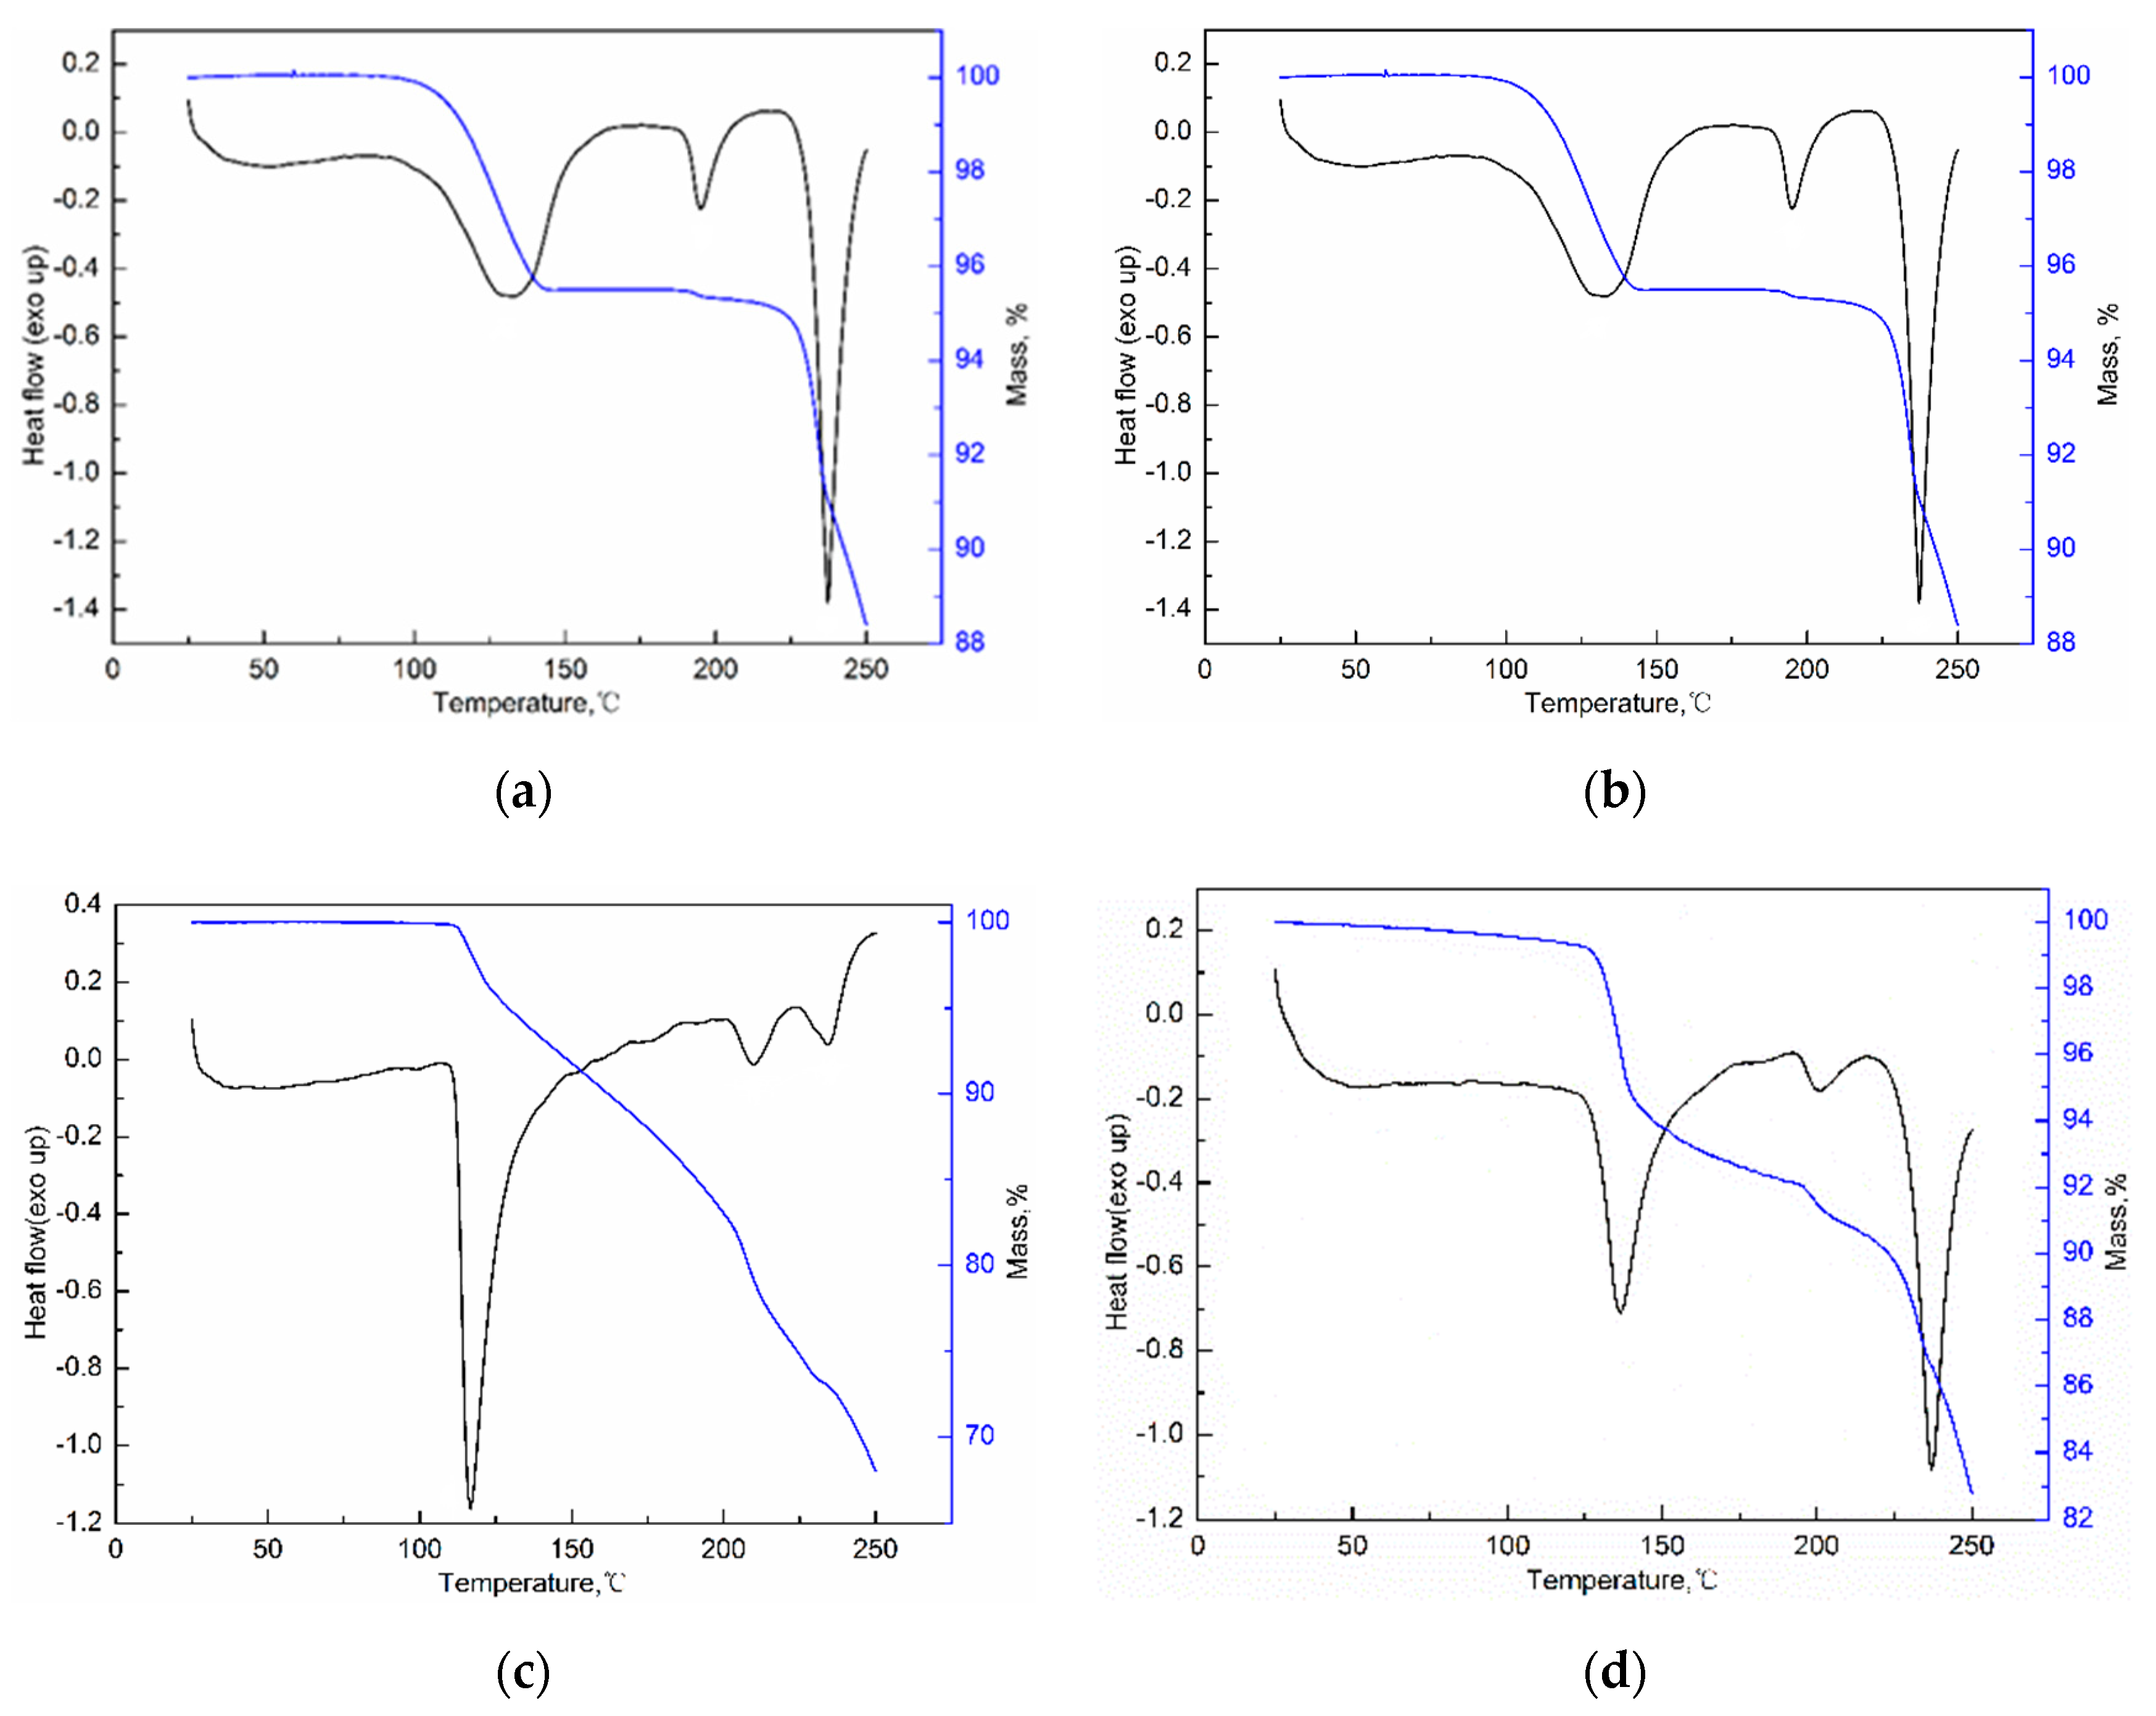
The DSC and TGA curves of three solvates are given in Figure 9. The solvent stoichiometry is verified by the weight loss in TGA curves. Then SMe/SEt is confirmed to be the monosolvate and the SNMP molecule is formed by a sorafenib molecule and two NMP molecules, suggesting that the obtained results are consistent with the crystal structures. It can be seen from Figure 9 that SMe and SEt exhibit almost the same DSC and TGA curves. The desolvation of SMe/SEt occurs at temperatures ranging from about 100 °C to 150 °C with a loss of solvent. Then the second endothermic peak is considered to be the melting peak of the product after desolvation. Finally, SMe/SEt shows an endothermic peak at 235 °C in DSC curve with a rapid mass loss in TGA curve because of the decomposition. It is worth noting that the desolvation temperature of SMe/SEt is much higher than the boiling point of solvent, which is due to the hydrogen bonding interactions between alcohol molecules and ST molecules. Starting from 106 °C, SNMP shows an endothermic peak in DSC curve with distinct tailing, which corresponds with the mass loss in TGA curve before 200 °C. Then NMP reaches boiling point at 204 °C, resulting in rapid mass loss in the TGA curve and an endothermic peak in the DSC curve. Finally, SNMP starts to decompose at 236 °C.
3.5. Solubility of Solvate
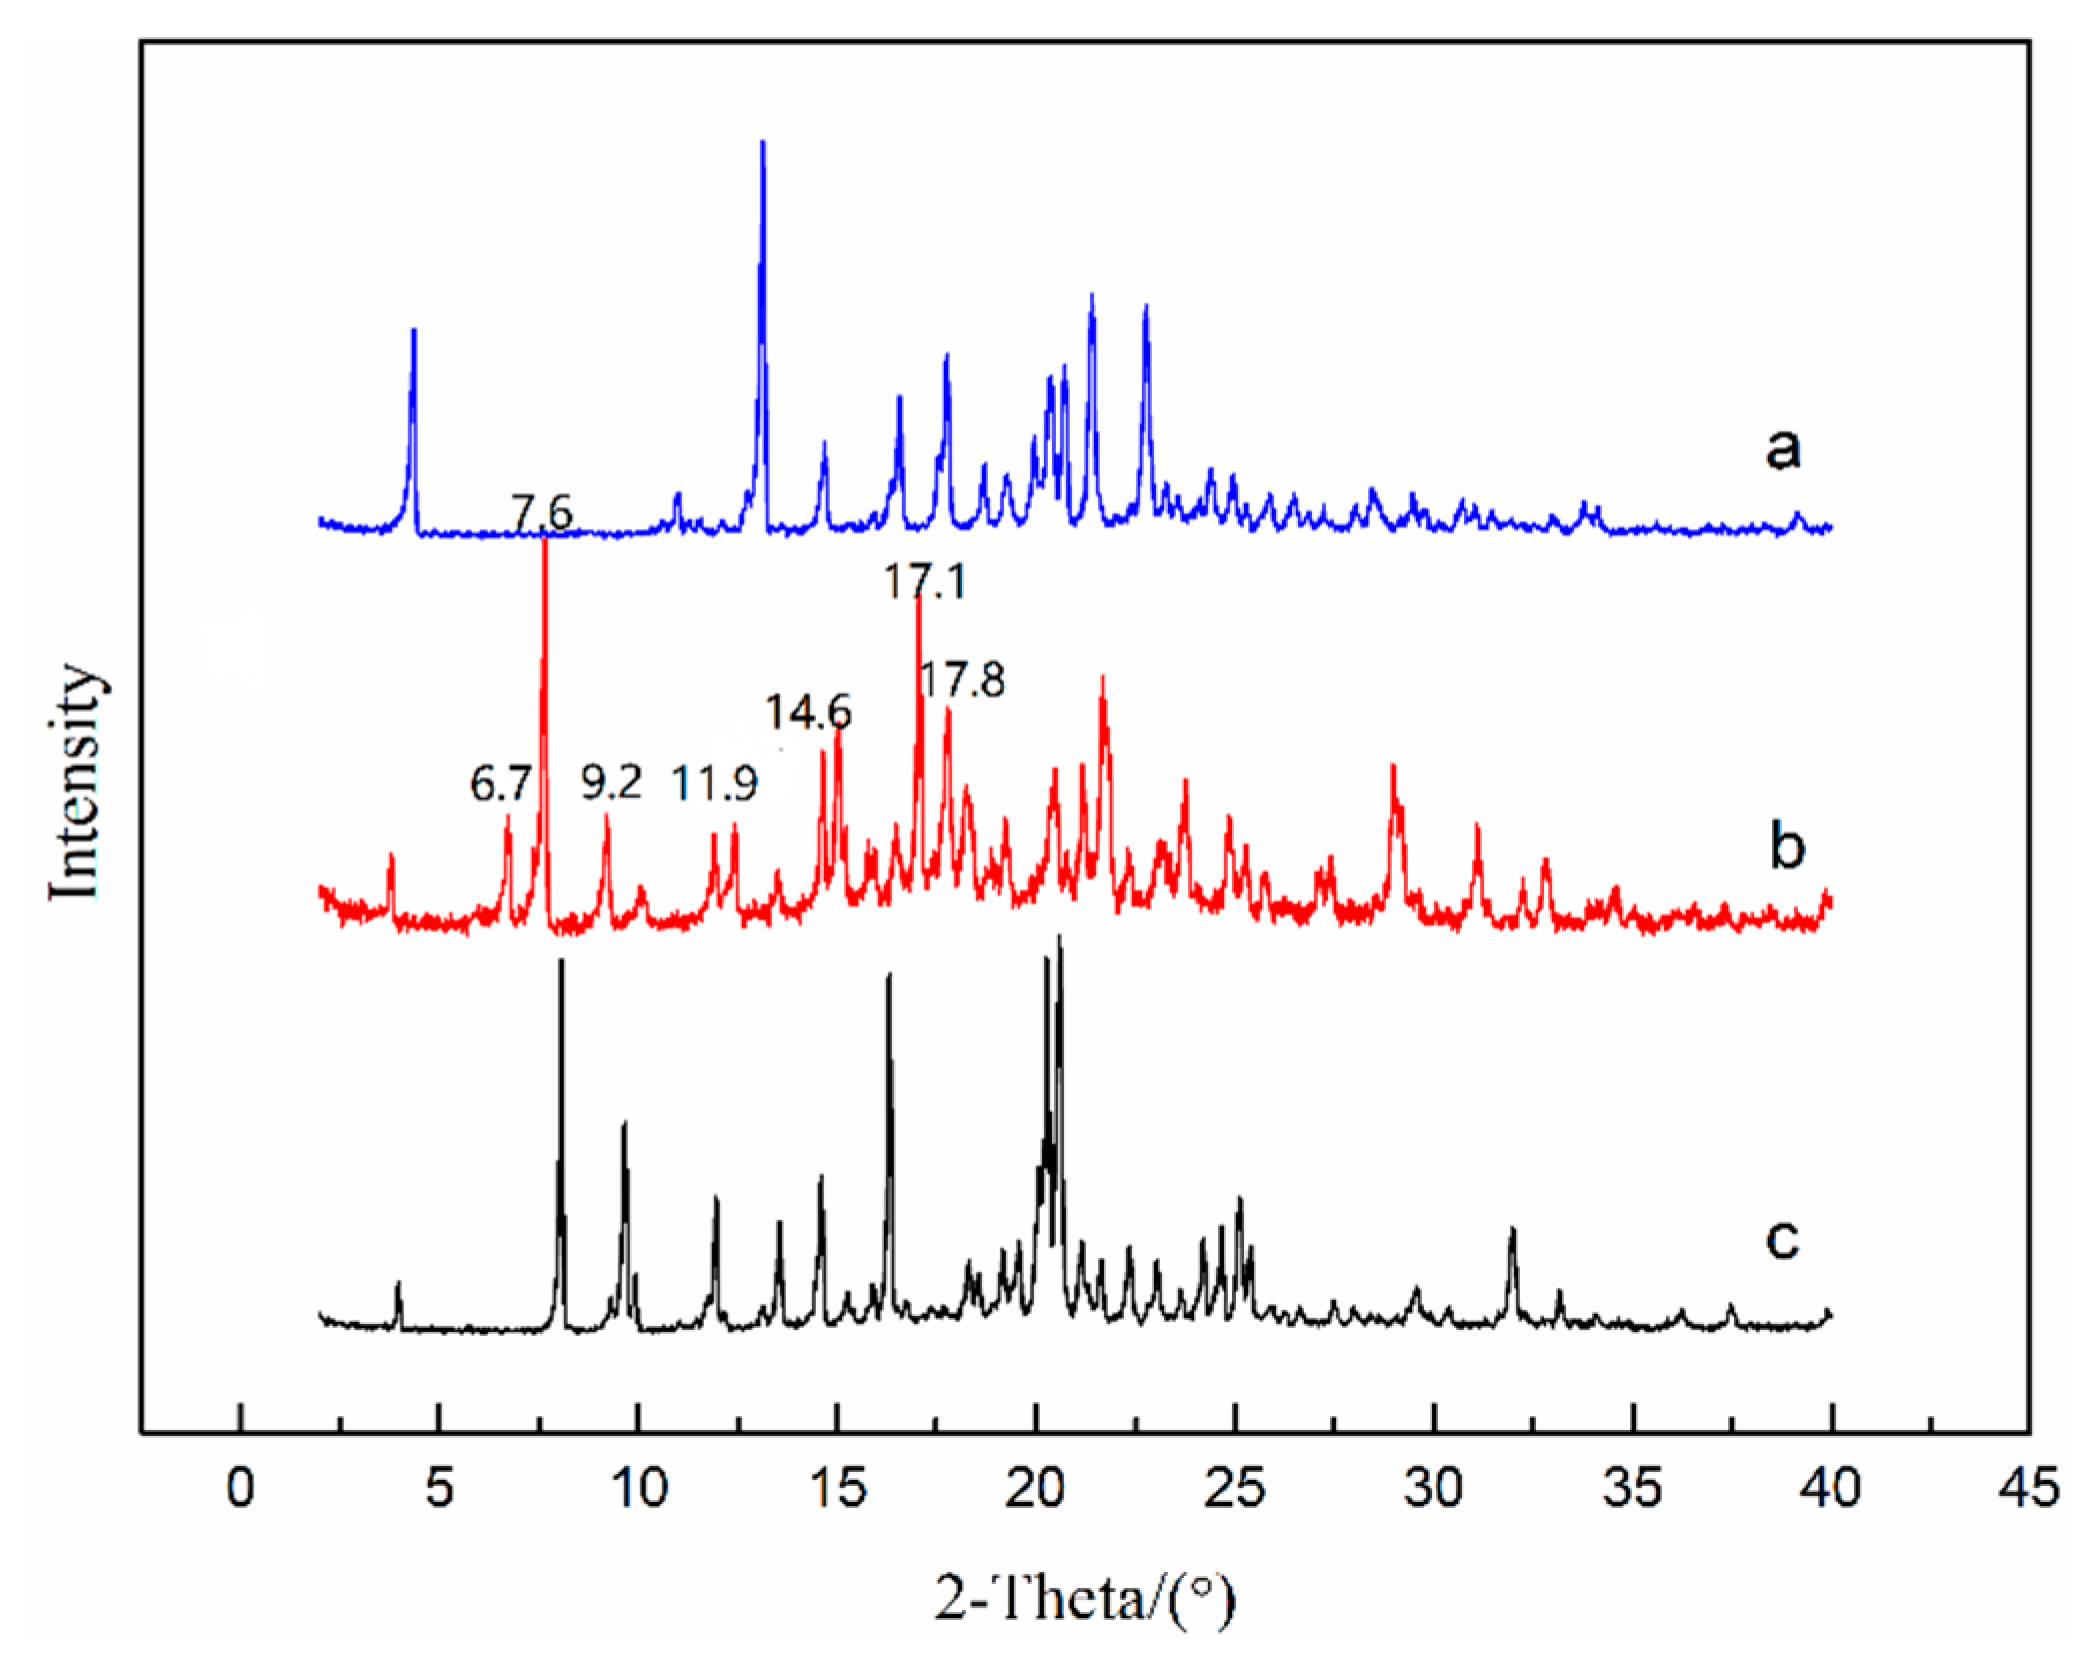
To investigate the thermodynamic stability of solvates of ST, the solubility of stable solvates in methanol + NMP and ethanol + NMP mixtures was determined. It is worth emphasizing that a new NMP solvate (labeled as SNMP-M) was obtained in binary solvent mixtures and the PXRD patterns of SNMP, SNMP-M and ST were compared in Figure 10. According to Figure 10, it can be seen that the new NMP solvate, SNMP-M, has a different PXRD pattern compared with the SNMP and ST. Compared to the SNMP and ST, the PXRD pattern of SNMP-M shows distinctly different diffraction peaks at 2θ = 6.7°, 7.6°, 9.2°, 11.9°, 14.6°, 17.1°, 17.8°. In addition, DSC and TGA curves of NMP solvates are presented in Figure 9. It can be seen that the starting temperatures of desolvation for SNMP and SNMP-M is 106 °C and 124 °C, respectively. The weight loss of SNMP during the desolvation is about 24.0%, which means that the stoichiometry (solvent: API) is 2:1, and this can be confirmed by its crystal structure. The weight loss of SNMP-M during desolvation is about 10.2%, and the stoichiometry is 1:1.
Moreover, FTIR spectroscopy was used to further confirm the differences of two NMP solvates, and the FTIR patterns of two NMP solvates are shown in Figure 11. Compared with the FTIR pattern of SNMP, it can be seen that SNMP-M shows additional peaks at 1686 cm−1, 1645 cm−1, 1486 cm−1 and 1132 cm−1 because of the differences of hydrogen bond network. It is worth mentioning that two NMP solvates obtained in this work were compared with three previously reported NMP solvates in the patent literature [27]. Based on the PXRD patterns and TGA curves in this paper and patent, SNMP is same with one of the NMP solvates in the patent. However, SNMP-M shows different diffraction peaks at 2θ = 6.7°, 7.6°, 12.4°, 17.1°, 17.8° in the PXRD pattern compared with the reported NMP solvates. In addition, the starting desolvation temperatures of SNMP-M (about 124 °C) in DSC curve are quite different from the results of NMP solvates (106 °C,114 °C and 142 °C) reported in patent [27]. Therefore, SNMP-M is further confirmed as a new NMP solvate.
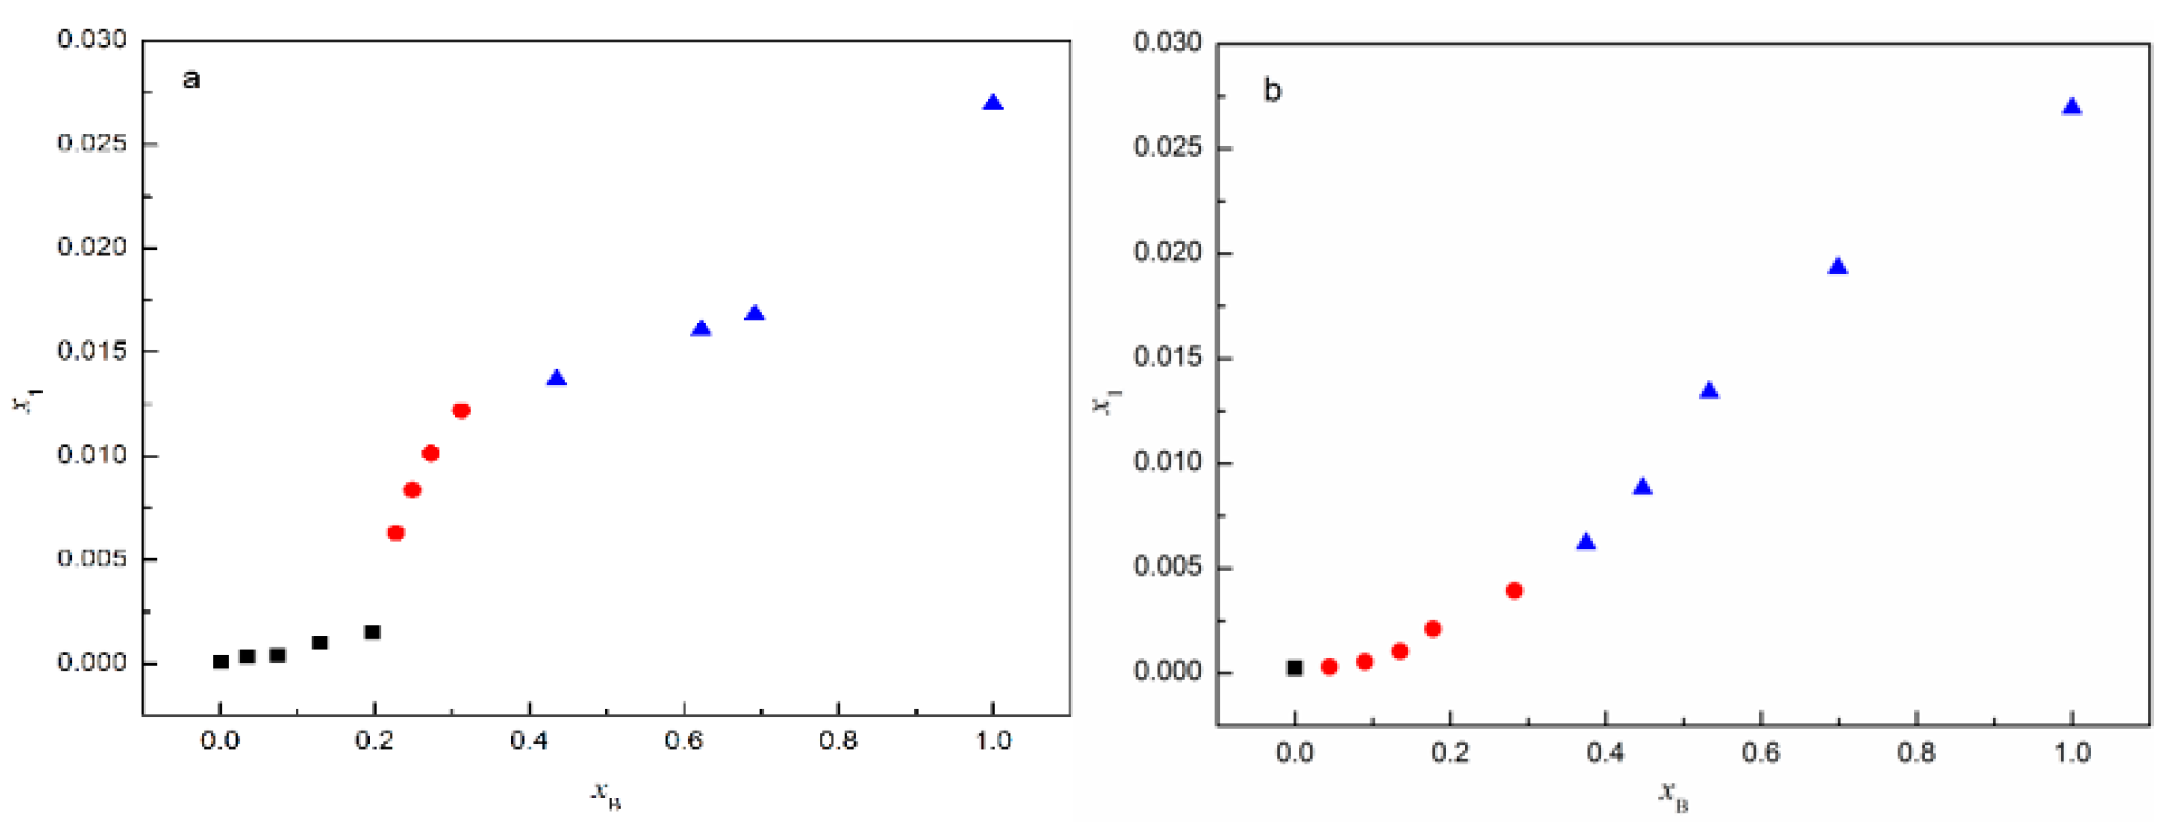
From Figure 12a, it can be seen that the stable solvate is SMe when xB ≤ 0.1973, and this changes into SNMP-M when 0.2272 ≤ xB ≤ 0.3122; when xB ≥ 0.4353, SNMP is the stable solvate. In addition, the experimental results in Figure 12b indicate that SEt exists only in pure ethanol. In ethanol + NMP mixtures, when 0.0444 ≤ xB ≤ 0.2824 and xB ≥ 0.3747, ST transforms into SNMP-M and SNMP, respectively. The experimental results reveal that the NMP content has a significant effect on the formation of solvate, which is the same as the phenomenon observed in anhydrous/hydrate systems in previous studies [28,29]. The interactions between ST molecules and NMP molecules increase with the increase of NMP content in methanol + NMP and ethanol + NMP mixtures, then resulting in the formation of NMP solvate, accordingly.
3.6. Desolvation of Solvates
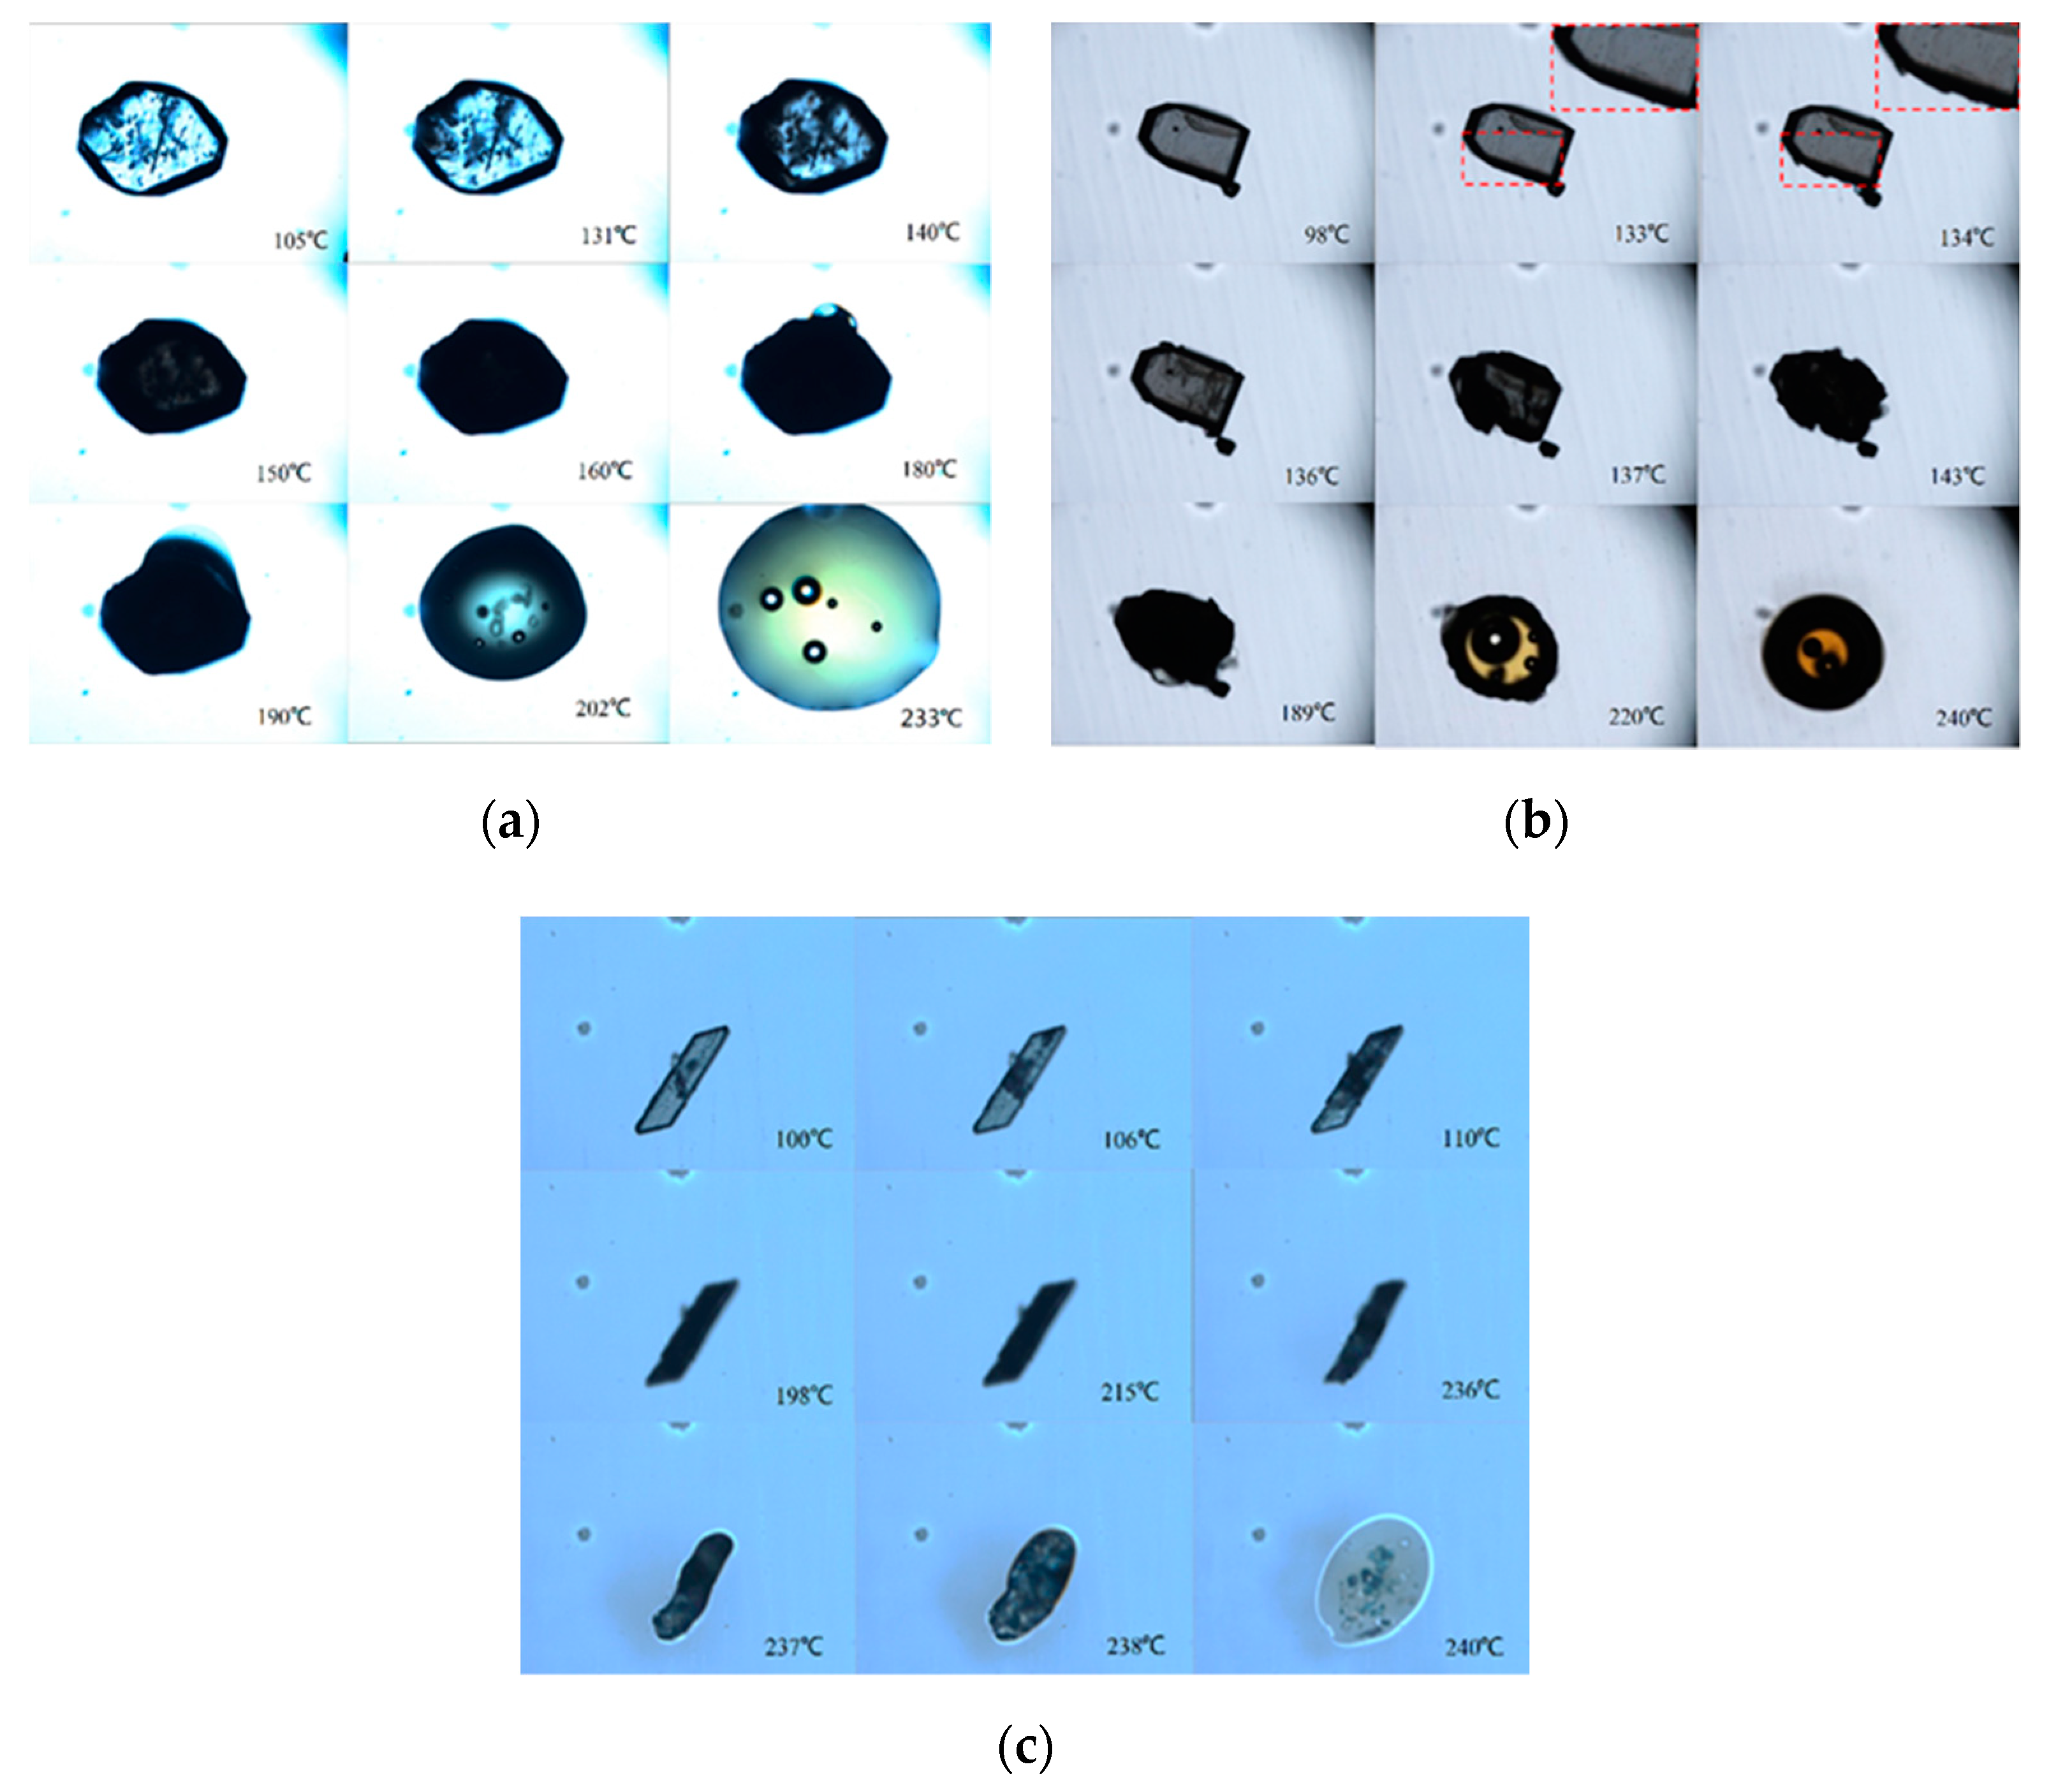
As shown in Figure 13, the desolvation process of solvates was studied visually using HSM. It can be seen from Figure 13a that SMe crystal showed no change before desolvation. Then solvent molecules escaped from crystals with the increase of temperature, resulting in the declining of crystal transparency. The opaque region expanded from the edge to the center of the crystals for the reason that desolvation process was prone to proceed on the edge of crystals [5]. After that, the crystals became almost opaque. Finally, crystals began to melt, and the transparency increased along with fusion.
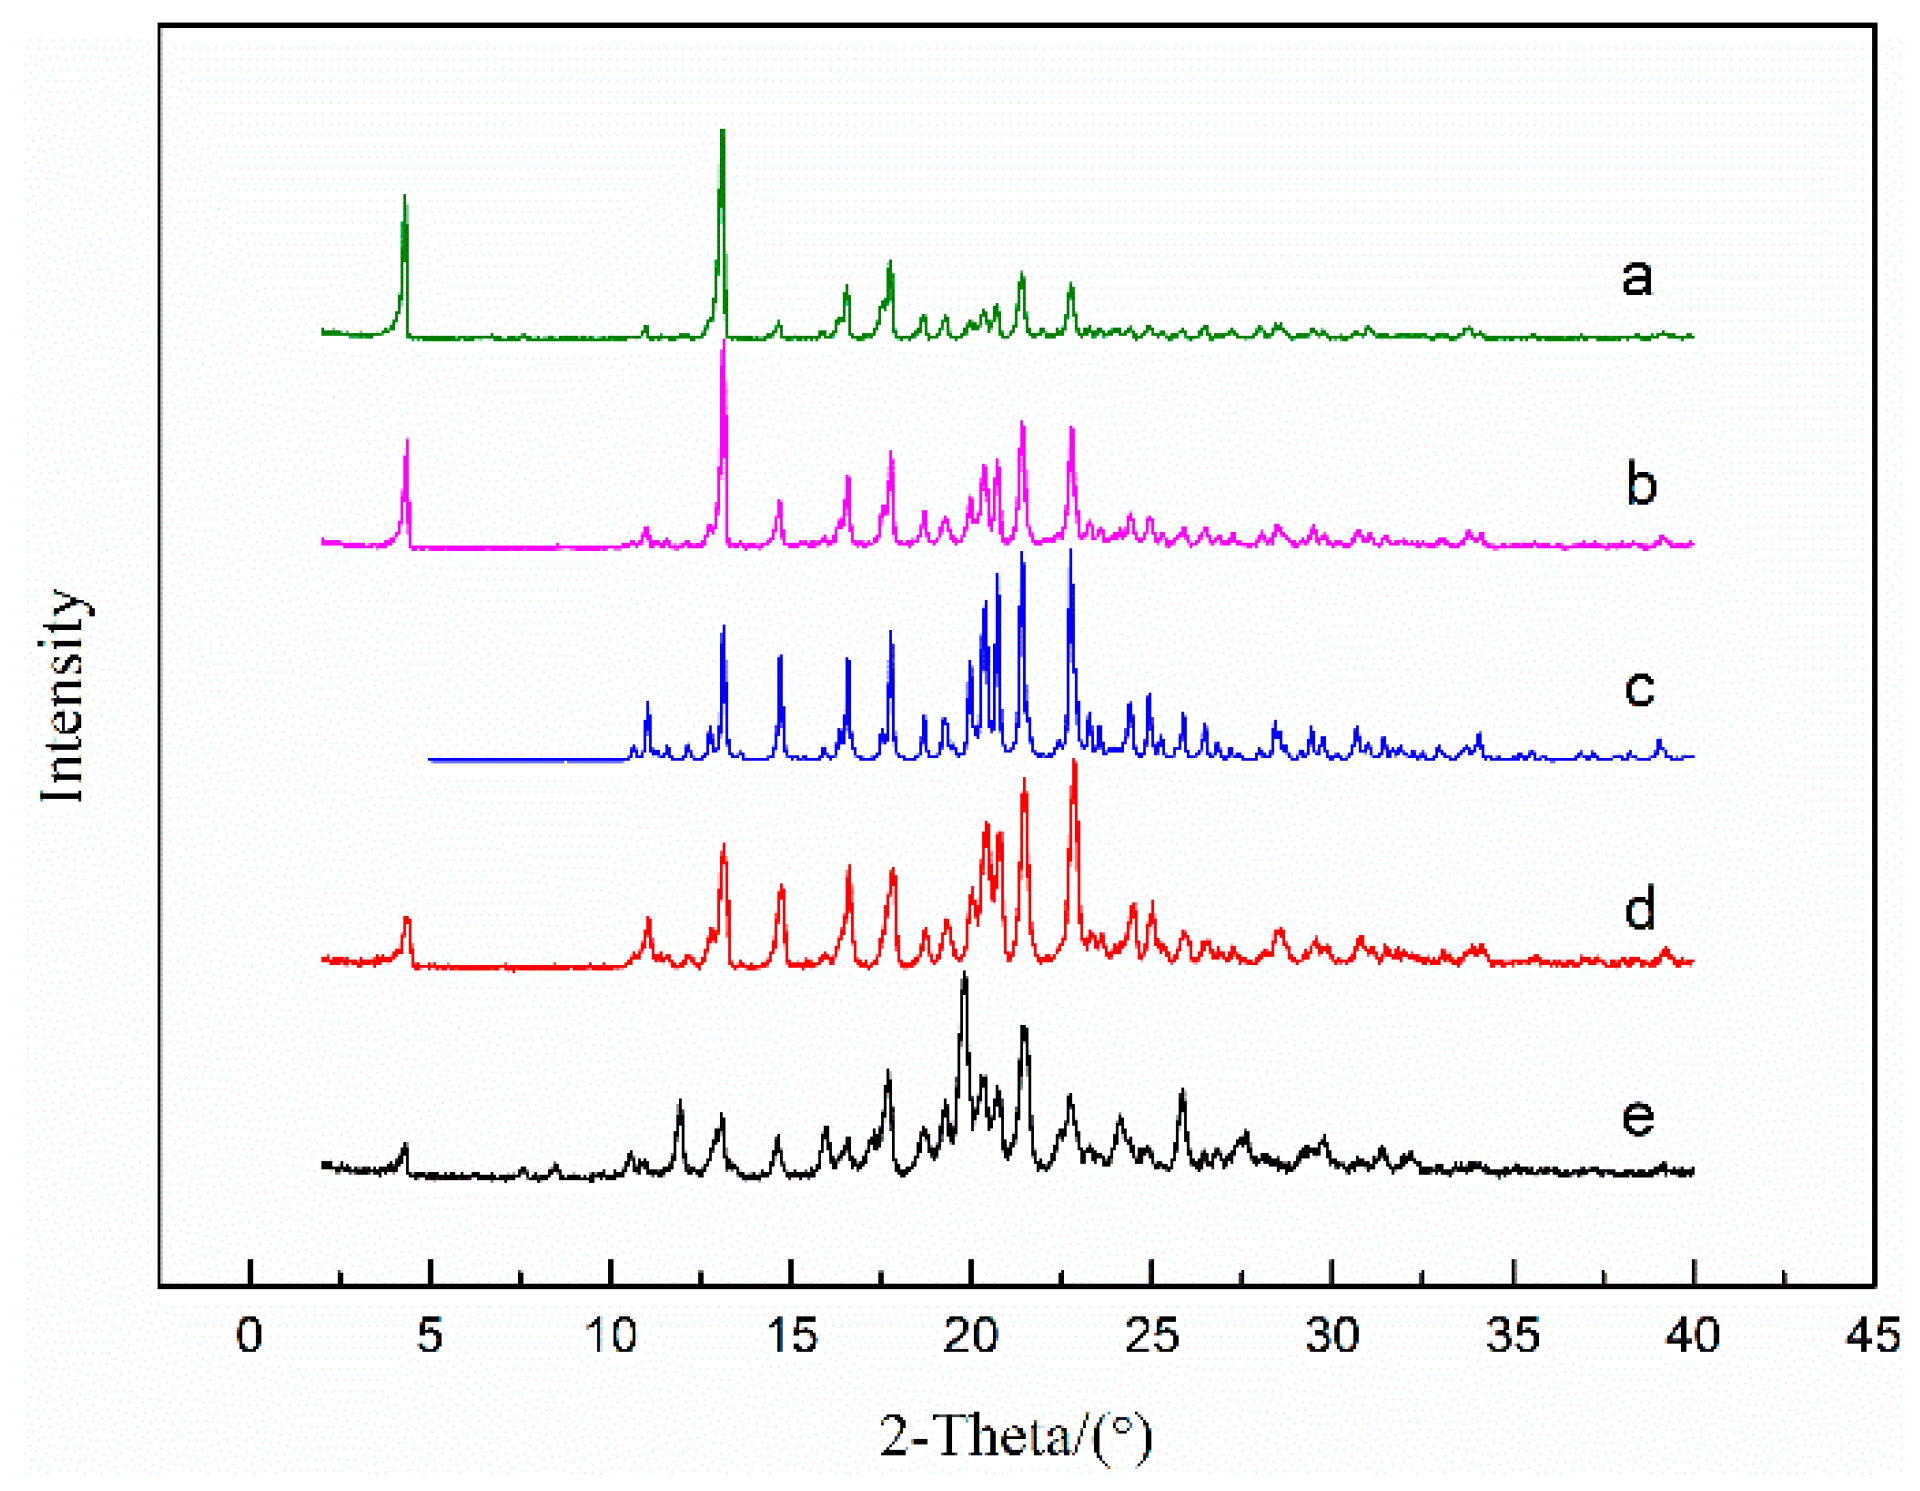
SEt and SNMP showed similar desolvation behavior to what SMe presented. A point worth emphasizing is that some breakages appeared on the crystal surface of SEt, but this phenomenon could not be observed on the crystal surface of SMe and SNMP. New cavities may be formed in SEt crystal during the desolvation process, resulting in breakages on the crystal surface. As shown in Figure 14, the desolvation products of the solvates were analyzed and compared with ST polymorphs. From Figure 14b,c, we can see that the PXRD pattern of experimental ST shows good consistence with the calculated results. Compared with the PXRD pattern of ST (Form I), the desolvation products of SNMP, SEt and SMe show the similar patterns. This means that the desolvation products of the SNMP, SEt and SMe are Form I of ST, which may be because Form I is the most stable polymorph among the ST polymorphs [30,31]. Additionally, the results of thermal analysis of solvates are summarized in Table 4 in order to concisely study the desolvation process.
4. Conclusions
In this work, three solvates were obtained from methanol, ethanol and NMP by the solvate screening of ST. The effect of solvent on the solvate formation was analyzed, indicating that the hydrogen bond donor propensity, hydrogen bond acceptor propensity and polarity/dipolarity have an integrated effect on the formation of solvate. The crystal structures of the three solvates were elucidated for the first time by using SCXRD data, suggesting that SMe and SEt are monoclinic systems with P21/m space group, and SNMP belongs to triclinic system with space group. Moreover, SMe and SEt are isostructural and solvent molecules form hydrogen bonds with ST molecules in the crystal lattice of solvates. Hirshfeld surface analysis was chosen to research the interactions in the solvates, and the results revealed that the H···H, C···H/H···C and O···H/ H···O contacts make the greatest contribution to the molecular packing.
SMe, SEt and SNMP were characterized by PLM, PXRD, DSC and TGA. The results of thermal analysis could be divided into three procedures: desolvation of solvate, melting of the product after desolvation and decomposition of the product after desolvation. The solubility of stable solvates in methanol + NMP and ethanol + NMP mixtures at 5 °C was measured to research the thermodynamic stability of solvates, indicating that the solubility of stable solvates increases with the increase of the NMP mole fraction and the NMP content has a significant effect on the formation of solvate. A new NMP solvate was found and confirmed. HSM analysis was used to study the desolvation of solvates, and the results show that SMe, SEt and SNMP could transform into Form I after desolvation.
Author Contributions
Conceptualization, Y.Q. and S.W.; methodology, P.Y., C.Q. and Y.Q.; software, L.J. and P.Y.; validation, S.W. and J.G..; formal analysis, S.D..; data curation, Y.Q., C.Q. and S.D.; investigation, P.Y. and C.Q.; writing—original draft preparation, P.Y. and C.Q..; writing—review and editing, P.Y., S.D., L.J., S.W. and J.G.; supervision, S.W. and J.G.; project administration, S.W. and J.G.; funding acquisition, S.W. and J.G.
Funding
The authors are grateful to the financial support of Major National Science and Technology Projects 2017ZX07402003, Innovative Group Project 21621004 and China Postdoctoral Science Foundation 2018M641651.
Conflicts of Interest
The authors declare no conflict of interest.
References
- Aitipamula, S.; Chow, P.S.; Tan, R.B.H. Solvates and polymorphic phase transformations of 2-chloro-4-nitrobenzoic acid. CrystEngComm 2011, 13, 1037–1045. [Google Scholar] [CrossRef]
- Fujii, K.; Aoki, M.; Uekusa, H. Solid-state hydration/dehydration of erythromycin A investigated by ab initio powder X-ray diffraction analysis: Stoichiometric and nonstoichiometric dehydrated hydrate. Cryst. Growth Des. 2013, 13, 2060–2066. [Google Scholar] [CrossRef]
- Yuan, L.; Lorenz, H. Solvate formation of bis (demethoxy) curcumin: Screening and characterization. Crystals 2018, 8, 407. [Google Scholar] [CrossRef]
- Bechtloff, B.; Nordhoff, S.; Ulrich, J. Pseudopolymorphs in industrial use. Cryst. Res. Technol. 2001, 36, 1315–1328. [Google Scholar] [CrossRef]
- Li, L.; Du, R.; Du, Y.; Zhang, C.; Guan, S.; Dong, C.; Zhang, L. Febuxostat-minoxidil salt solvates: Crystal structures, characterization, interconversion and solubility performance. Crystals 2018, 8, 85. [Google Scholar] [CrossRef]
- Ferrari, E.S.; Davey, R.J.; Cross, W.I.; Gillon, A.L.; Towler, C.S. Crystallization in polymorphic systems: The solution-mediated transformation of β to α glycine. Cryst. Growth Des. 2003, 3, 53–60. [Google Scholar] [CrossRef]
- Zhao, J.; Wang, M.; Dong, B.; Feng, Q.; Xu, C. Monitoring the polymorphic transformation of imidacloprid using in situ FBRM and PVM. Org. Process Res. Dev. 2013, 17, 375–381. [Google Scholar] [CrossRef]
- Zhu, M.; Wang, Y.; Li, F.; Bao, Y.; Huang, X.; Shi, X.; Hao, H. Theoretical model and experimental investigations on solution-mediated polymorphic transformation of theophylline: From polymorph I to polymorph II. Crystals 2019, 9, 260. [Google Scholar] [CrossRef]
- Bērziņš, A.; Skarbulis, E.; Rekis, T.; Actiņš, A. On the formation of droperidol solvates: Characterization of structure and properties. Cryst. Growth Des. 2014, 14, 2654–2664. [Google Scholar] [CrossRef]
- Chavez, K.J.; Guevara, M.; Rousseau, R.W. Characterization of solvates formed by sodium naproxen and an homologous series of alcohols. Cryst. Growth Des. 2010, 10, 3372–3377. [Google Scholar] [CrossRef]
- Thakuria, R.; Nangia, A. Olanzapinium salts, isostructural solvates, and their physicochemical properties. Cryst. Growth Des. 2013, 13, 3672–3680. [Google Scholar] [CrossRef]
- Perlovich, G.L.; Blokhina, S.V.; Manin, N.G.; Volkova, T.V.; Tkachev, V.V. Polymorphs and solvates of felodipine: Analysis of crystal structures and thermodynamic aspects of sublimation and solubility processes. CrystEngComm 2012, 14, 8577–8588. [Google Scholar] [CrossRef]
- Zhang, Q.; Lu, L.; Dai, W.; Mei, X. Polymorphism and isomorphism of Huperzine A solvates: Structure, properties and form transformation. CrystEngComm 2014, 16, 1919–1926. [Google Scholar] [CrossRef]
- Vangala, V.R.; Chow, P.S.; Tan, R.B.H. The solvates and salt of antibiotic agent, nitrofurantoin: Structural, thermochemical and desolvation studies. CrystEngComm 2013, 15, 878–889. [Google Scholar] [CrossRef]
- Ferrara, N. VEGF and the quest for tumour angiogenesis factors. Nat. Rev. Cancer 2002, 2, 795–803. [Google Scholar] [CrossRef]
- Sherman, J.H.; Kirzner, J.; Siu, A.; Amos, S.; Hussainic, I. Sorafenib tosylate as a radiosensitizer in malignant astrocytoma. J. Clin. Neurosci. 2014, 21, 131–136. [Google Scholar] [CrossRef] [PubMed]
- Porta, C.; Paglino, C.; Imarisio, I.; Ferraris, E. Sorafenib tosylate in advanced kidney cancer: Past, present and future. Anti-Cancer Drugs 2009, 20, 409–415. [Google Scholar] [CrossRef]
- Ravikumar, K.; Sridhar, B.; Bhujanga, R.A.K.S.; Reddy, P.M. Sorafenib and its tosylate salt: A multikinase inhibitor for treating cancer. Acta Crystallogr. C 2011, 67, o29–o32. [Google Scholar] [CrossRef]
- Abraham, M.H. Hydrogen bonding. 31. Construction of a scale of solute effective or summation hydrogen-bond basicity. J. Phys. Org. Chem. 1993, 6, 660–684. [Google Scholar] [CrossRef]
- Marcus, Y. The properties of organic liquids that are relevant to their use as solvating solvents. Chem. Soc. Rev. 1993, 22, 409–416. [Google Scholar] [CrossRef]
- Gu, C.; Li, H.; Gandi, R.B.; Raghavan, K. Grouping solvents by statistical analysis of solvent property parameters: Implication to polymorph screening. Int. J. Pharm. 2004, 283, 117–125. [Google Scholar] [CrossRef] [PubMed]
- Mckinnon, J.J.; Jayatilaka, D.; Spackman, M.A. Towards quantitative analysis of intermolecular interactions with Hirshfeld surfaces. Chem. Commun. 2007, 37, 3814–3816. [Google Scholar] [CrossRef]
- Spackman, M.A.; Jayatilaka, D. Hirshfeld surface analysis. CrystEngComm 2009, 11, 19–32. [Google Scholar] [CrossRef]
- Hussain, E.; Kumar, R.; Choudhary, M.I.; Yousuf, S. Crystal engineering of naturally occurring seselin to obtain cocrystal with enhanced anti-leishmanial activity, Hirshfeld surface analysis, and computational insight. Cryst. Growth Des. 2018, 18, 4628–4636. [Google Scholar] [CrossRef]
- Turner, M.J.; McKinnon, J.J.; Wolff, S.K.; Grimwood, D.J.; Spackman, P.R.; Jayatilaka, D.; Spackman, M.A. CrystalExplorer model energies and energy frameworks: Extension to metal coordination compounds, organic salts, solvates and open-shell systems. IUCrJ 2017, 4, 547–587. [Google Scholar]
- Jia, L.; Yu, Y.; Wang, M.; Ouyang, H.; Gong, J. Preparation and characterization for multicomponent crystals of the antidiabetic drug gliquidone based on crystal engineering. CrystEngComm 2019, 21, 1617–1625. [Google Scholar] [CrossRef]
- An, X.; Shen, S.; Wang, W. The preparation methods and properties of the polymorphs of sorafenib tosylate solvates. CN103896833A, 27 December 2012. [Google Scholar]
- Qu, H.; Louhi-Kultanen, M.; Rantanen, J.; Kallas, J. Solvent-mediated phase transformation kinetics of an anhydrate/hydrate system. Cryst. Growth Des. 2006, 6, 2053–2060. [Google Scholar] [CrossRef]
- Wang, X.; Wu, S.; Dong, W.; Gong, J. In situ monitoring of the solvent-mediated transformation of cefadroxil DMF solvate into monohydrate. Org. Process Res. Dev. 2013, 17, 1110–1116. [Google Scholar] [CrossRef]
- Grunenberg, A.; Lenz, J. Thermodynamically stable form of a tosylate salt. PCT WO2006/034797, 6 April 2006. [Google Scholar]
- Scarpitta, F.; Biljan, T. A process for the preparation of solid state forms of sorafenib besylate. PCT WO2012/071425, 31 May 2012. [Google Scholar]
Figure 1.
The chemical structure of sorafenib tosylate.

Figure 2.
Peak area versus concentration calibration curves: (a) ST; (b) NMP.

Figure 3.
Crystal structures of solvates: (a) ball and stick plots; (b) packing of unit cell. Subscript 1, 2 and 3 represent SMe, SEt and SNMP, respectively.
Figure 3.
Crystal structures of solvates: (a) ball and stick plots; (b) packing of unit cell. Subscript 1, 2 and 3 represent SMe, SEt and SNMP, respectively.


Figure 4.
The hydrogen bonds in SMe (a), SEt (b) and SNMP (c).

Figure 5.
2D fingerprint plots of SMe (a), SEt (b) and SNMP (c).

Figure 6.
Percentage contribution of different interactions to the Hirshfeld surface.

Figure 7.
Microscope images of SMe (a), SEt (b), SNMP (c).

Figure 8.
PXRD patterns of SMe (a), SEt (b) and SNMP (c). Subscript 1 and 2 represent experimental and calculated results, respectively.
Figure 8.
PXRD patterns of SMe (a), SEt (b) and SNMP (c). Subscript 1 and 2 represent experimental and calculated results, respectively.

Figure 9.
DSC and TGA curves of SMe (a), SEt (b), SNMP (c) and SNMP-M (d).

Figure 10.
PXRD patterns of ST—Form I (a), SNMP-M (b) and SNMP (c).

Figure 11.
FTIR patterns of SNMP-M (a), SNMP (b) and ST (c).

Figure 12.
Mole fraction solubility of solvates in (a) methanol + NMP and (b) ethanol + NMP mixtures at 5 °C: ■, SMe/SEt; ●, SNMP-M; ▲, SNMP.
Figure 12.
Mole fraction solubility of solvates in (a) methanol + NMP and (b) ethanol + NMP mixtures at 5 °C: ■, SMe/SEt; ●, SNMP-M; ▲, SNMP.

Figure 13.
HSM images of SMe (a), SEt (b) and SNMP (c).

Figure 14.
PXRD patterns of ST—Form I: (b) experimental and (c) calculated; and desolvation products of SNMP (a), SEt (d) and SMe (e).
Figure 14.
PXRD patterns of ST—Form I: (b) experimental and (c) calculated; and desolvation products of SNMP (a), SEt (d) and SMe (e).


Table 1.
The property parameters of solvents.
| Solvent | Σα | Σβ | π* | Form |
|---|---|---|---|---|
| methanol | 0.43 | 0.47 | 0.60 | YES |
| ethanol | 0.37 | 0.48 | 0.54 | YES |
| n-propanol | 0.37 | 0.48 | 0.52 | NO |
| isopropanol | 0.33 | 0.56 | 0.48 | NO |
| n-butanol | 0.37 | 0.48 | 0.47 | NO |
| 2-butanol | 0.33 | 0.56 | 0.40 | NO |
| isobutanol | 0.37 | 0.48 | 0.40 | NO |
| ethyl acetate | 0.00 | 0.48 | 0.55 | NO |
| acetone | 0.04 | 0.49 | 0.71 | NO |
| acetonitrile | 0.07 | 0.32 | 0.75 | NO |
| n-hexane | 0.00 | 0.00 | -0.04 | NO |
| cyclohexane | 0.00 | 0.00 | 0.00 | NO |
| dichloromethane | 0.10 | 0.05 | 0.82 | NO |
| toluene | 0.00 | 0.14 | 0.54 | NO |
| NMP | 0.00 | 0.77 | 0.92 | YES |
Table 2.
Crystallographic data of SMe, SEt and SNMP.
| Parameter | SMe | SEt | SNMP |
|---|---|---|---|
| Formula | C29H28ClF3N4O7S | C30H30ClF3N4O7S | C38H42ClF3N6O8S |
| Formula weight | 669.06 | 683.09 | 835.29 |
| Crystal system | monoclinic | monoclinic | triclinic |
| Space group | P21/m | P21/m | |
| Temperature/K | 293(2) | 293(2) | 293(2) |
| Wavelength/Å | 0.71073 | 0.71073 | 0.71073 |
| a/Å | 11.684(2) | 11.745(2) | 9.1884(18) |
| b/Å | 19.405(4) | 19.412(4) | 10.565(2) |
| c/Å | 14.564(3) | 14.650(3) | 21.769(4) |
| α/º | 90.000 | 90.000 | 87.27(3) |
| β/º | 111.53(3) | 110.57(3) | 81.17(3) |
| γ/º | 90.000 | 90.000 | 82.21(3) |
| Volume/ų | 3071.7(11) | 3127.1(11) | 2068.2(7) |
| Z | 4 | 4 | 2 |
| θ range/° | 3.01–25.50 | 3.08–25.50 | 3.07–25.50 |
| −14 ≤ h ≤ 14 | −14 ≤ h ≤ 14 | −11 ≤ h ≤ 11 | |
| Index ranges | −23 ≤ k ≤ 23 | −22 ≤ k ≤ 23 | −12 ≤ k ≤ 12 |
| −16 ≤ l ≤ 17 | −17 ≤ l≤ 17 | −26 ≤ l ≤ 26 | |
| Density/g·cm−3 | 1.447 | 1.451 | 1.341 |
| Rint | 0.0909 | 0.0657 | 0.0477 |
| R1[I>2σ(I)] | 0.0567 | 0.0577 | 0.0708 |
| wR2 | 0.1575 | 0.1718 | 0.2584 |
| Goodness-of-fit | 1.024 | 1.015 | 1.017 |
| CCDC No. | 1505023 | 1505022 | 1505021 |
Table 3.
Hydrogen bonds of SMe, SEt and SNMP.
| Solvate | D−H···A | d(D−H)/Å | d(H···A)/Å | d(D···A)/Å | ∠(DHA)/° |
|---|---|---|---|---|---|
| SMea | N(1)-H(1A)···O(4) | 0.86 | 2.06 | 2.895 | 162.3 |
| N(2)-H(2A)···O(4) | 0.86 | 2.26 | 3.064 | 155.0 | |
| SEtb | N(1)-H(1A)···O(5) | 0.86 | 2.06 | 2.892 | 163.0 |
| O(7)-H(7A)···O(6) | 0.82 | 2.02 | 2.771 | 151.5 | |
| SNMPc | N(1)-H(1A)···O(5) | 0.86 | 2.07 | 2.823(4) | 146.0 |
a.Symmetry transformations used to generate equivalent atoms: −x − 1, −y, −z. b.Symmetry transformations used to generate equivalent atoms: (1) x + 2, y, z + 1. (2) −x + 7/2, y − 1/2, −z + 3/2. (3) x+1/2, -y+1/2. c.Symmetry transformations used to generate equivalent atoms: (1) −x + 1, −y + 2, -z + 1. (2) x + 1, y, z + 1.
Table 4.
Thermal analysis results of three solvates.
| Solvate | SMe | SEt | SNMP |
|---|---|---|---|
| Solvent | Methanol | Ethanol | N-methyl-2-pyrrolidone |
| Stoichiometry | 1:1 | 1:1 | 1:2 |
| Theoretical weight loss/% | 4.8 | 6.7 | 23.7 |
| Experimental weight loss/% | 4.6 | 7.0 | 24.0 |
| Desolvation onset Ton/℃ | 102 | 98 | 106 |
| Desolvation product | Form I | Form I | Form I |
© 2019 by the authors. Licensee MDPI, Basel, Switzerland. This article is an open access article distributed under the terms and conditions of the Creative Commons Attribution (CC BY) license (http://creativecommons.org/licenses/by/4.0/).
Share and Cite
MDPI and ACS Style
Yang, P.; Qin, C.; Du, S.; Jia, L.; Qin, Y.; Gong, J.; Wu, S. Crystal Structure, Stability and Desolvation of the Solvates of Sorafenib Tosylate. Crystals 2019, 9, 367. https://doi.org/10.3390/cryst9070367
AMA Style
Yang P, Qin C, Du S, Jia L, Qin Y, Gong J, Wu S. Crystal Structure, Stability and Desolvation of the Solvates of Sorafenib Tosylate. Crystals. 2019; 9(7):367. https://doi.org/10.3390/cryst9070367
Chicago/Turabian StyleYang, Peng, Chunlei Qin, Shichao Du, Lina Jia, Yujia Qin, Junbo Gong, and Songgu Wu. 2019. "Crystal Structure, Stability and Desolvation of the Solvates of Sorafenib Tosylate" Crystals 9, no. 7: 367. https://doi.org/10.3390/cryst9070367
Note that from the first issue of 2016, this journal uses article numbers instead of page numbers. See further details here.