Data-Driven Studies of Li-Ion-Battery Materials


1
Materials Science & Engineering Department, University of Utah, Salt Lake City, UT 84112, USA
2
The Department of Physics, Harvard University, Cambridge, MA 02138, USA
*
Author to whom correspondence should be addressed.
†
These authors contributed equally to this work.
Crystals 2019, 9(1), 54; https://doi.org/10.3390/cryst9010054
Submission received: 9 December 2018
/
Revised: 13 January 2019
/
Accepted: 14 January 2019
/
Published: 18 January 2019
(This article belongs to the Special Issue New Materials for Li-Ion Batteries)
Abstract
:Batteries are a critical component of modern society. The growing demand for new battery materials—coupled with a historically long materials development time—highlights the need for advances in battery materials development. Understanding battery systems has been frustratingly slow for the materials science community. In particular, the discovery of more abundant battery materials has been difficult. In this paper, we describe how machine learning tools can be exploited to predict the properties of battery materials. In particular, we report the challenges associated with a data-driven investigation of battery systems. Using a dataset of cathode materials and various statistical models, we predicted the specific discharge capacity at 25 cycles. We discuss the present limitations of this approach and propose a paradigm shift in the materials research process that would better allow data-driven approaches to excel in aiding the discovery of battery materials.
1. Introduction
Battery materials research began with Volta’s voltaic pile in the 1800s [1]. Since then, new materials have facilitated the development of new batteries; each with desired properties such as enhanced energy density, rechargeability, high power output, and low cost. Li-ion batteries were conceived in 1980 by Mizushima, Jones, Wiseman, and Goodenough [2]. Today, they are one of the most popular batteries constituting approximately one third of all batteries [3] because of their high energy density and rechargeability.
Nevertheless, Li-ion batteries have a lot of room for improvement. For one thing, they are relatively high-cost owing to their use of transition metals such as Co, Ni, and Mn. Additionally, reliance on organic electrolytes has led to flammability and safety concerns upon dendrite growth. Another challenge is that high capacity anodes are still being developed or are not yet available. Therefore, we clearly see that each part of the battery would benefit from new materials being discovered, for example: an earth abundant cathode, a solid electrolyte, or a high capacity anode.
Currently, incremental local optimization is the primary tool for discovering new materials. However, it may be possible for data-driven methods to screen an enormous composition or micro-structural space. The principle being that machine learning (ML) models could learn from data that exists in the literature, and then very rapidly predict properties of interest for an enormous number of battery material candidates. The use of machine learning as a tool for materials discovery is rapidly growing. Examples can be found in the fields of thermoelectrics [4,5,6], superhard materials [7], thermochemical data [8,9], electronic properties [10,11,12,13,14], structural materials [15], functional materials [16,17,18], and structure classification [19,20,21,22,23]. Given the history of success of ML methods, it is natural to want to apply them to battery materials research. There are ∼10 battery publications per year (>7000/year for the last three years according to Scopus keyword search). Thus, there may be ample data available to exploit using statistical models. Indeed, battery researchers have recently shown an interest in employing machine learning to answer battery research questions. For example, Hu et al. used machine learning to predict the state-of-charge in batteries for electric vehicles [24]. Liu et al. showed that machine learning could successfully be used to predict the remaining useful life for batteries systems [25]. We applied ML methods to a set of data describing Li-ion-battery architecture, properties, and performance. We explored not only chemical descriptors, but also those associated with the architecture and battery testing conditions. We observed several hurdles for the successful application of ML methods to battery research, where heterogeneous materials and properties are common. We describe the challenges of applying a machine learning approach to the discovery of battery materials [24,25,26,27,28].
2. Materials and Methods
The data used for this work (see Supplementary Materials) were previously published by Ghadbeigi et al. as an analysis article [29]. This work did not attempt any machine learning, but instead provided unique visualization and sustainability metrics such as scarcity and Herfindahl–Hirschman index (HHI).
As a first step in the machine learning process, we needed to retrieve and clean the data. For the case of this dataset, there were extensive missing entries. This is largely due to poorly enforced standards for battery data reporting. For example, one author might provide the cathode type including the mass fraction of the binder and carbon additives, whereas another author might simply state that carbon additive was used. As a result, potentially useful descriptors—such as rate performance, calcination temperature, and synthesis route—need to be removed due to lack of useful information or excessive missing entries. This greatly reduces the data available for analysis. Furthermore, we chose the discharge capacity at 25 cycles as the target property for our analysis. Consequently, experimental descriptors correlated with the discharge capacity at 25 cycles, such as the discharge capacity at 50 cycles, were also removed. After removing the problematic columns, if a row still had missing entries, it was dropped. Besides learning from the metadata, additional descriptors were generated from the composition of the cathode material. These descriptors should be readily available (e.g., from databases) or easily computed without the need for computationally expensive simulations. Using the atomic properties of the constituent elements, we can construct a mathematical description, or descriptor, of the composition. That is, we consider the weighted average, and the maximum difference of a set of atomic properties for a given composition. Examples of the atomic properties include the ionic radius, electronegativity, and the number of valence electrons [30,31,32]. These preprocessing steps resulted in a total 215 entries and 49 descriptors. See Appendix A for the entire list of descriptors.
Information regarding the microscopic and macroscopic structure of the cathode materials is expected to play an important role in describing battery properties. However, since this information was poorly reported in the literature, our dataset did not possess structural descriptors beyond identifying the cathode structure class. We believe that it is in the interest of the scientific community that, in the future, information be standardized and more systematically reported in order to better serve data-driven studies [33]. Reporting of failed results should also be given equal weight to that of successful results.
The raw data were combined with additional data that were generated from creating additional descriptors from atomic properties. The first step of the data analytics process involved visualizing the data in such a way as to gain insights into their behavior. The data were then divided into a training set and a test set. The training data contained 172 entries leaving 43 values for the test set. We exploited machine learning models to approximate the relationship between descriptors of the battery materials and the target property, the specific discharge capacity at 25 cycles (in mAh g). We considered the scikit-learn [34] implementation of: lasso, kernel ridge regression (KRR), random forests (RF) and support vector regression (SVR) [35]. We used grid search and 10-fold cross-validation on the training data to obtain the hyper-parameters of our models in order to minimize the error on our test set (hyper-parameter values available in Appendix A). The random forests model allowed us to calculate a list of descriptor importances, which describes the relative importance of the descriptors used in the model. The top 25 descriptors were selected and used in a second round of model training in order to reduce over fitting and improve prediction performance on the test set. See Appendix A for a list of these descriptors. We report the test error for the models evaluated in terms of the mean absolute error and the coefficient of determination (R).
3. Results and Discussion
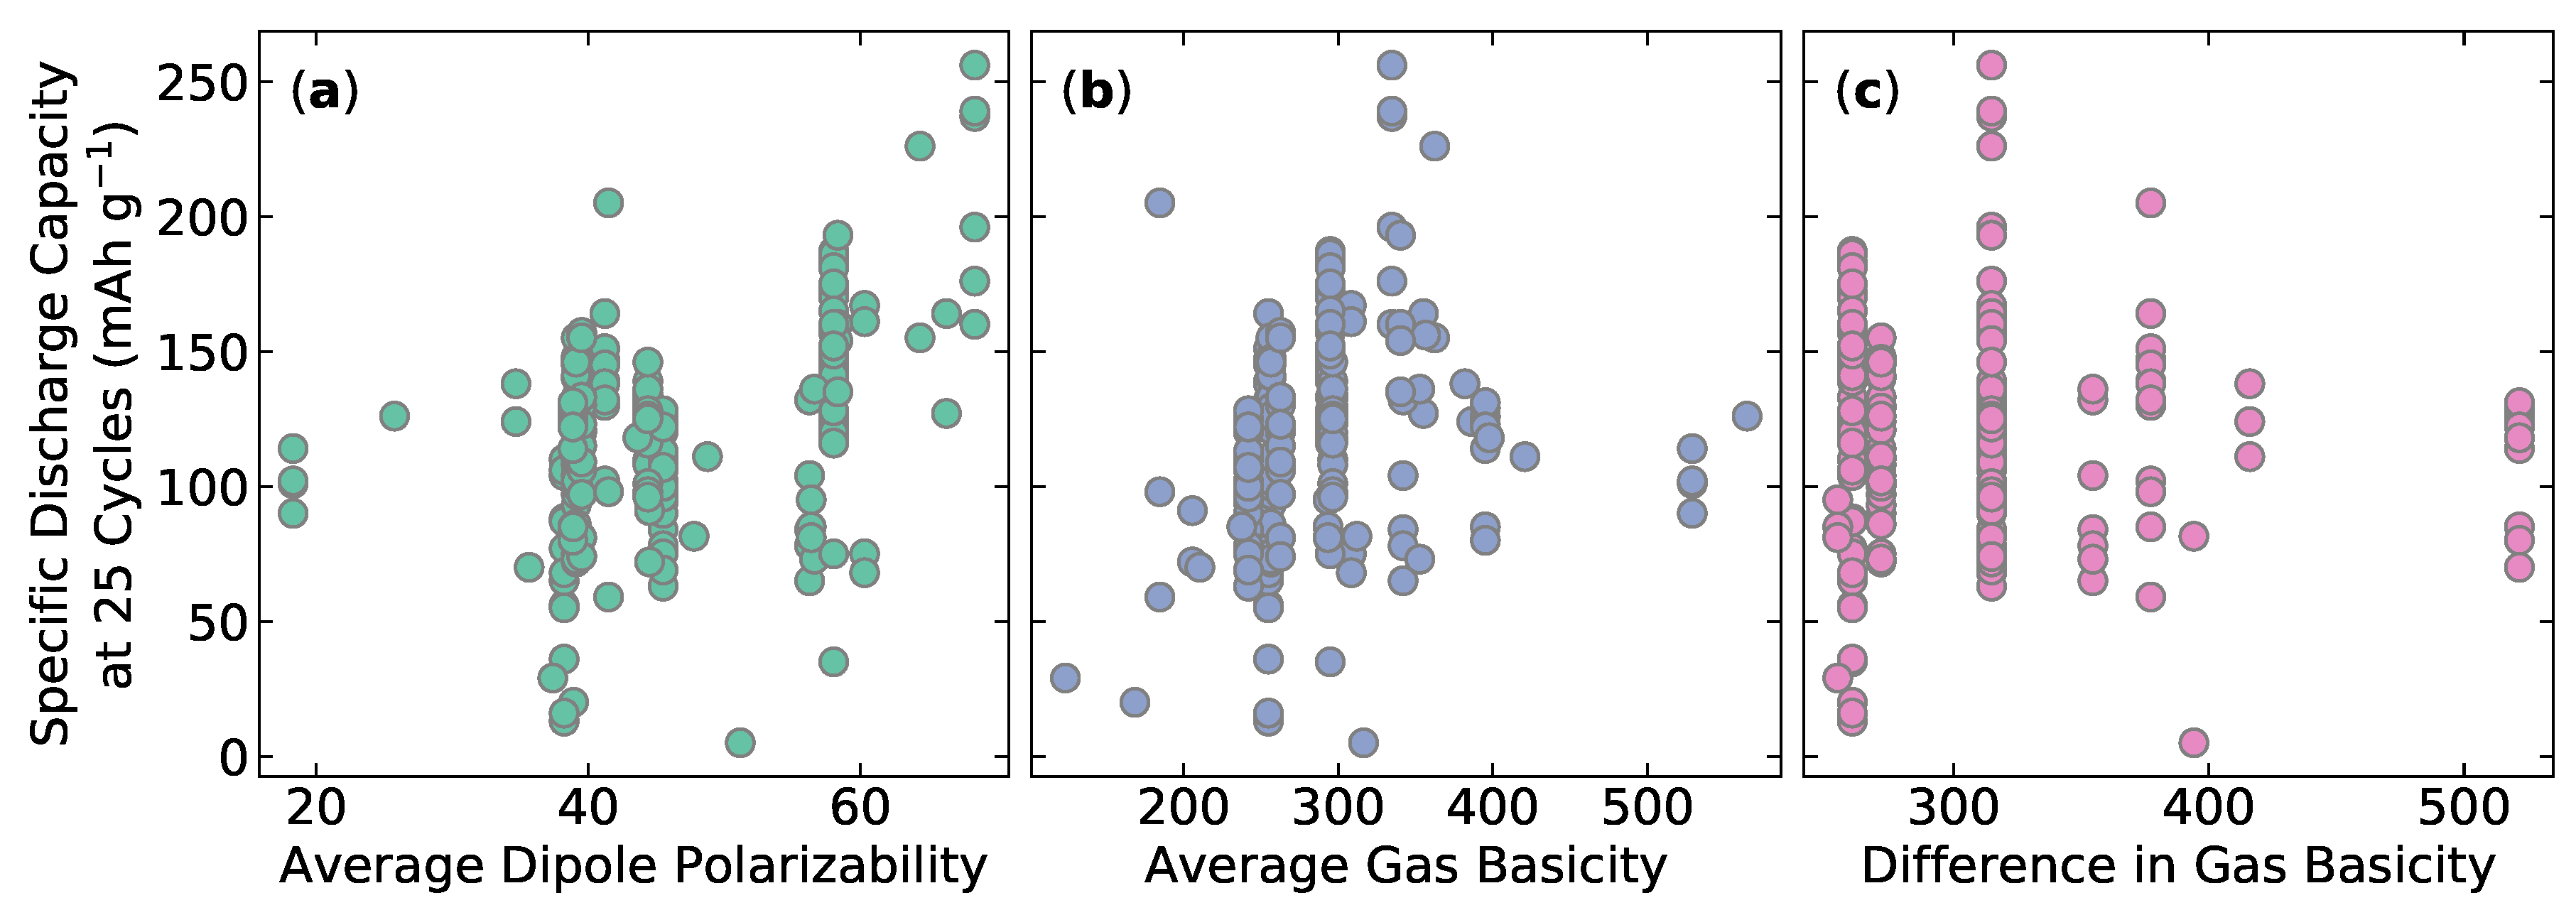
Individuals interested in modeling and predicting battery performance care about a number of different metrics. In this work, we used specific discharge capacity at 25 cycles as an example. We selected the discharge capacity at 25 cycles because capacity fade is an important property that involves very time consuming testing, which we would rather predict via a high fidelity machine learning model. For example, if a battery is being tested at a discharge rate of C/10, then the discharge–charge cycle takes almost an entire day, which means testing 25 cycles will take 20 days and testing 100 cycles would take nearly three months. It is possible to visualize how this target property varies with the available descriptors in order to explore correlations [36] with other material properties. If obvious correlations exist, then a human can detect and exploit them using intuition. However, as can be seen in Figure 1, there is no obvious correlation. Nevertheless, machine learning algorithms are capable of building predictive models using higher-dimensional data not perceived by humans.
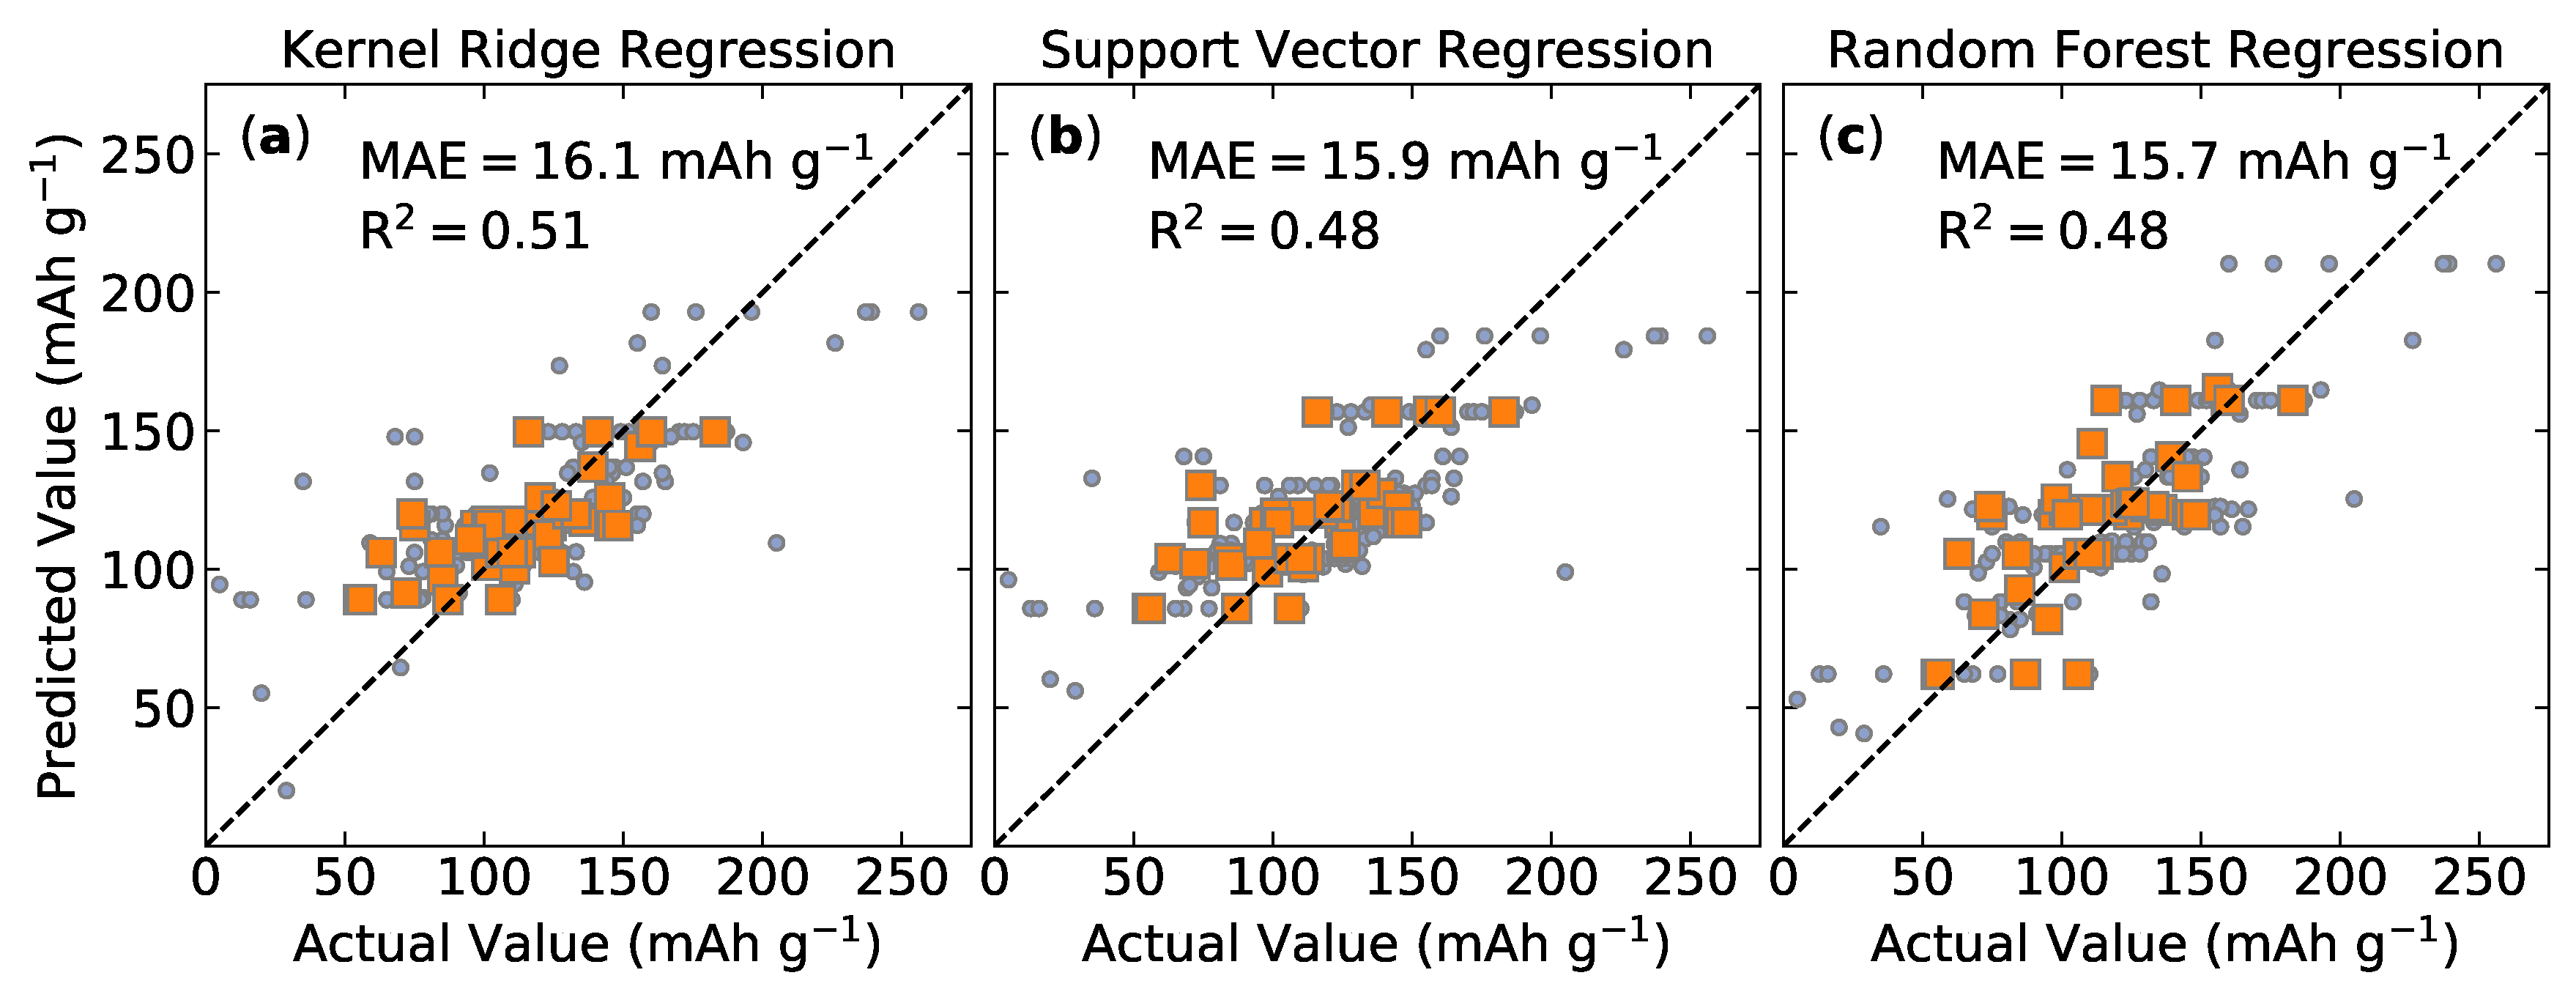
Lasso is a linear model, whereas KRR, SVR, and RF models allow for the learning of both linear and non-linear relationships. We attempted to map material descriptors to our target property using these models. Lasso, the only linear model, had the worst performance and is not reported here. The prediction accuracy of KRR, SVR, and RF models are shown in Figure 2. The model performance is below what is typically reported in the literature. This significant model error hinders the predictive utility for battery material discovery.
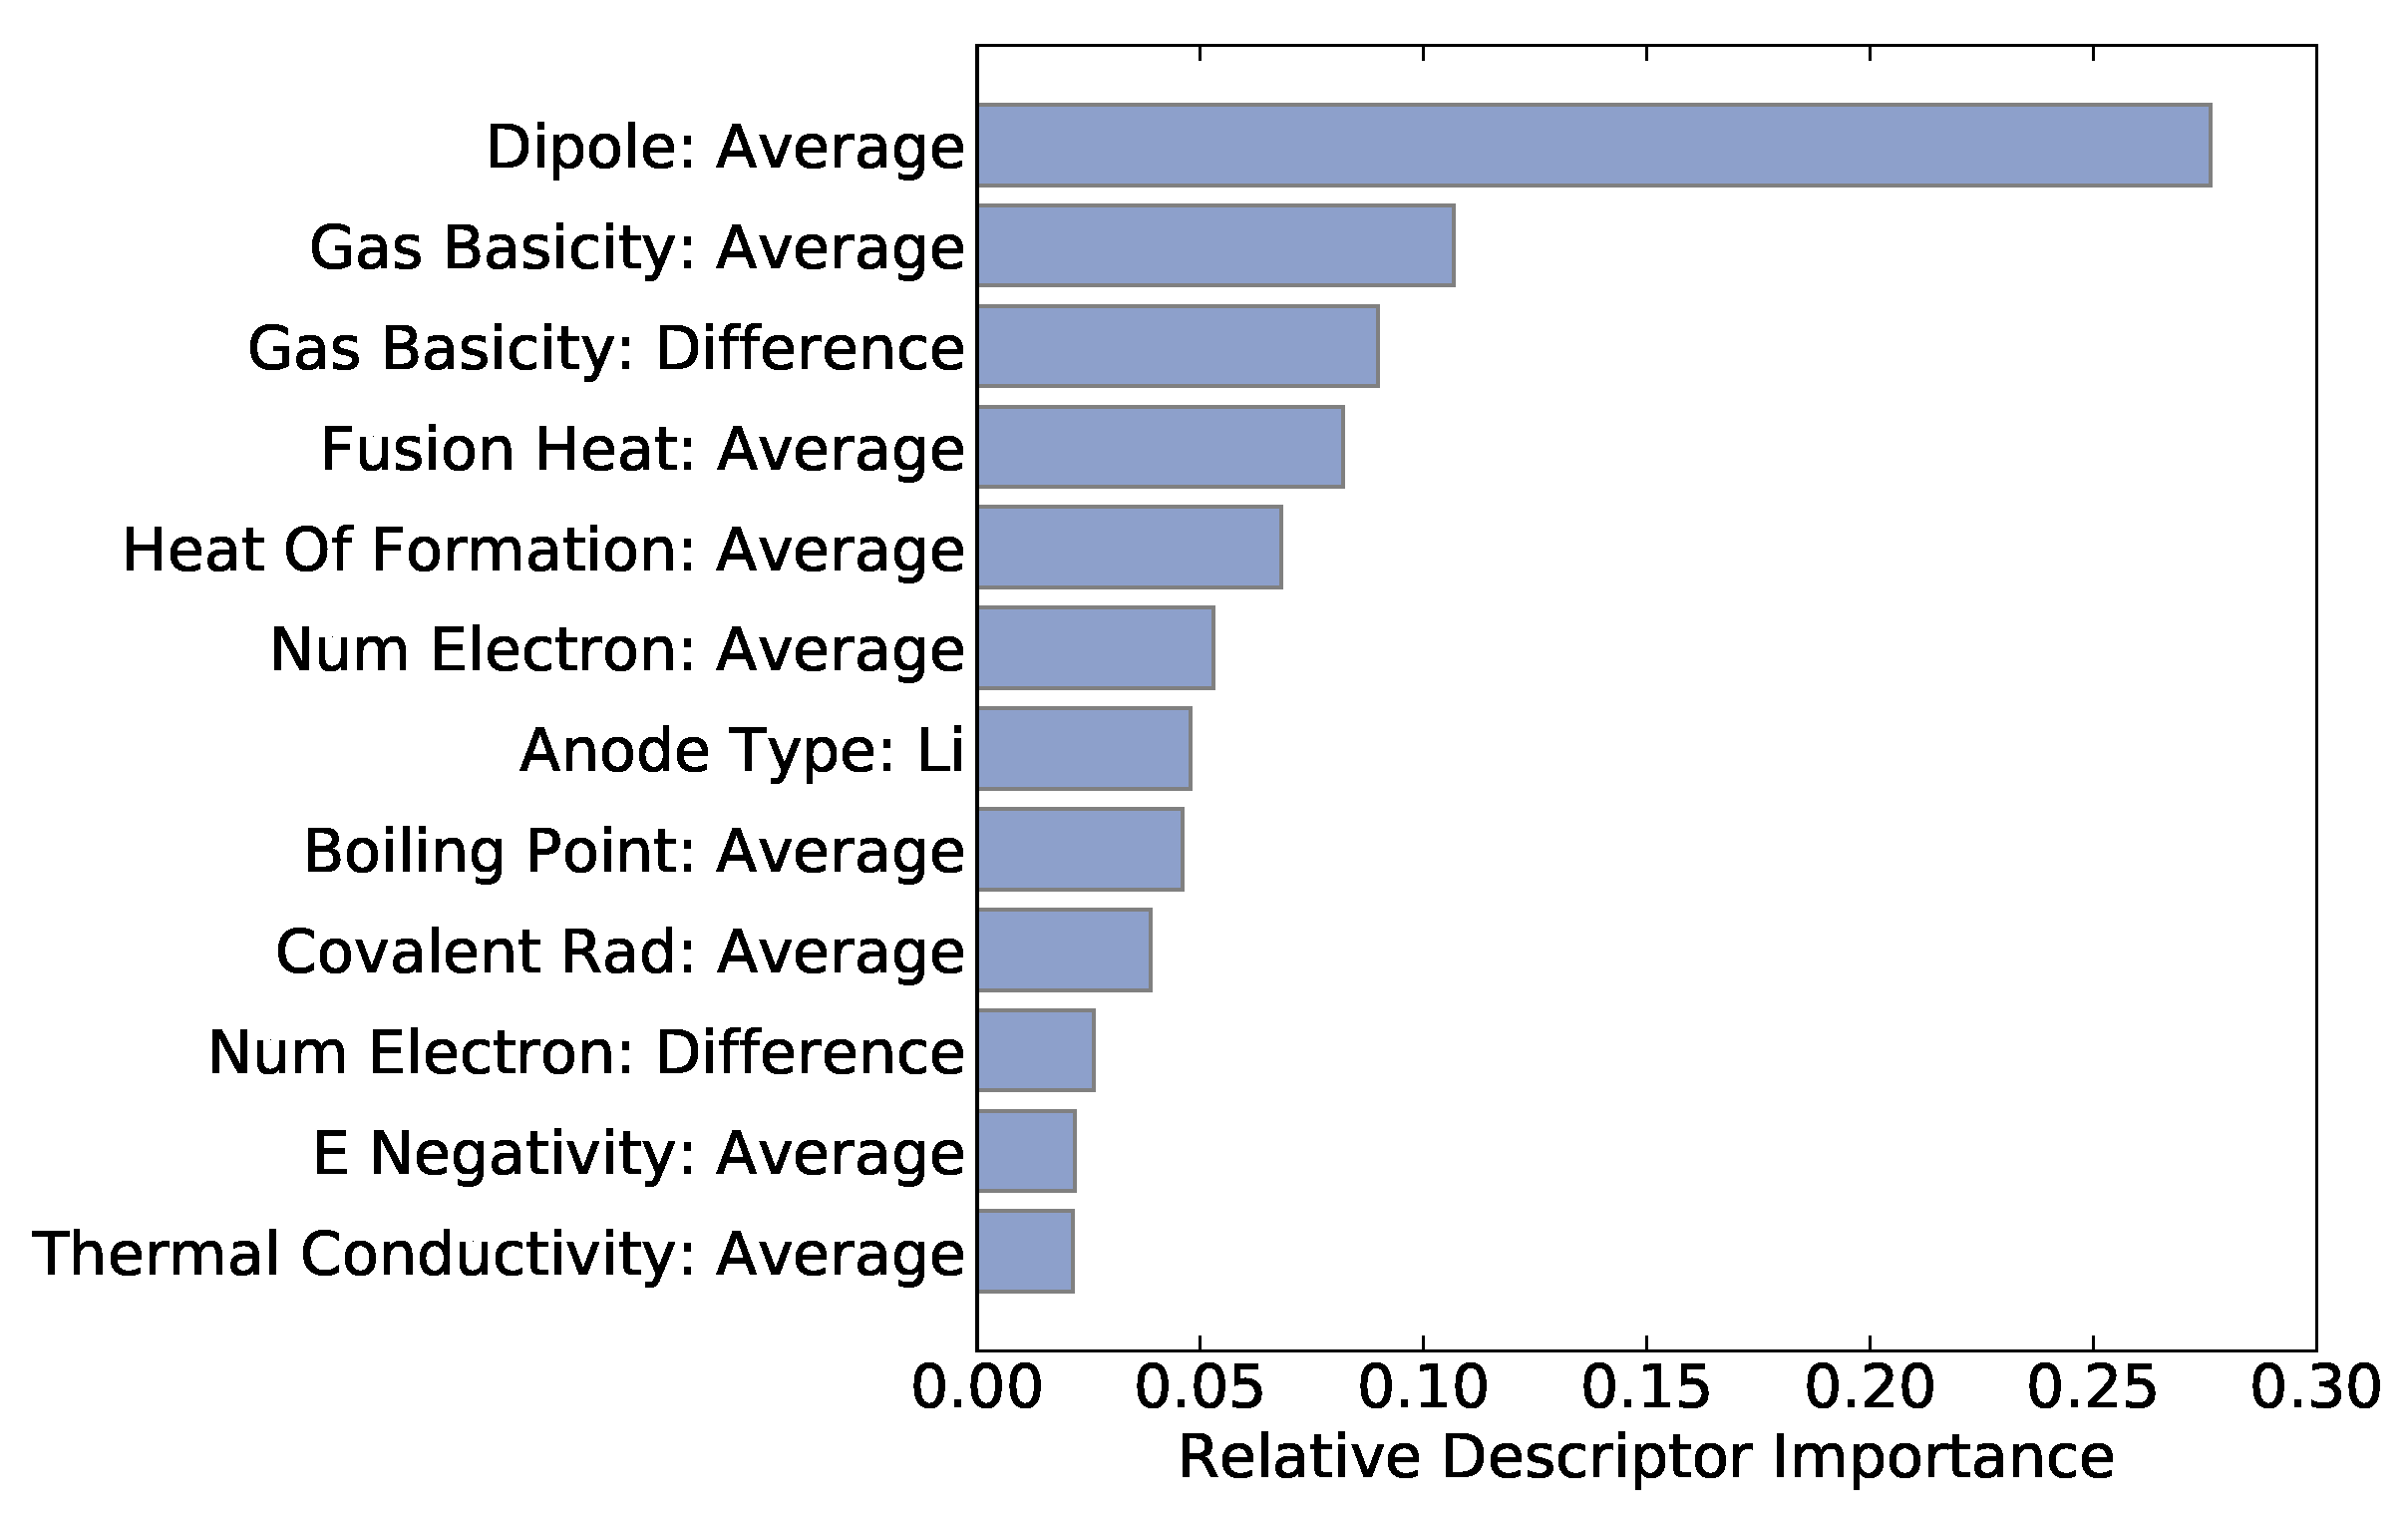
Descriptor importances can be extracted from the random forest model to determine which descriptors are most important for a successful prediction. Figure 3 shows the top twelve descriptors. Among the top descriptors are average dipole polarizability, average gas phase basicity, and the average heat of fusion. Electrochemical batteries rely on the insertion and removal of ions and the associated reduction–oxidation reaction. Therefore, the gas phase basicity (that is, the change of Gibbs free energy during deprotonation) is likely a pertinent materials descriptor which might lend itself to mechanistic analysis. Other descriptors such as heat of fusion or dipole polarizability are much less intuitive but could, hypothetically, play a subtle or higher-order role in determining Li-ion battery properties.
Although there are several battery materials with high values for the specific discharge capacity at 25 cycles, the vast majority of materials—all of which were investigated as potential battery materials—have much lower values. A successful machine learning model would cheaply and accurately predict the properties of a battery system, allowing researchers to identify materials with desirable properties without the need for costly experiments or simulations. The model performance shown in Figure 2 is not ideal, allowing for large prediction uncertainty. Although our model could conceivably distinguish between very small and large specific discharge capacities, the present predictive model would likely benefit from improvements in its performance prior to being used as a tool for materials discovery.
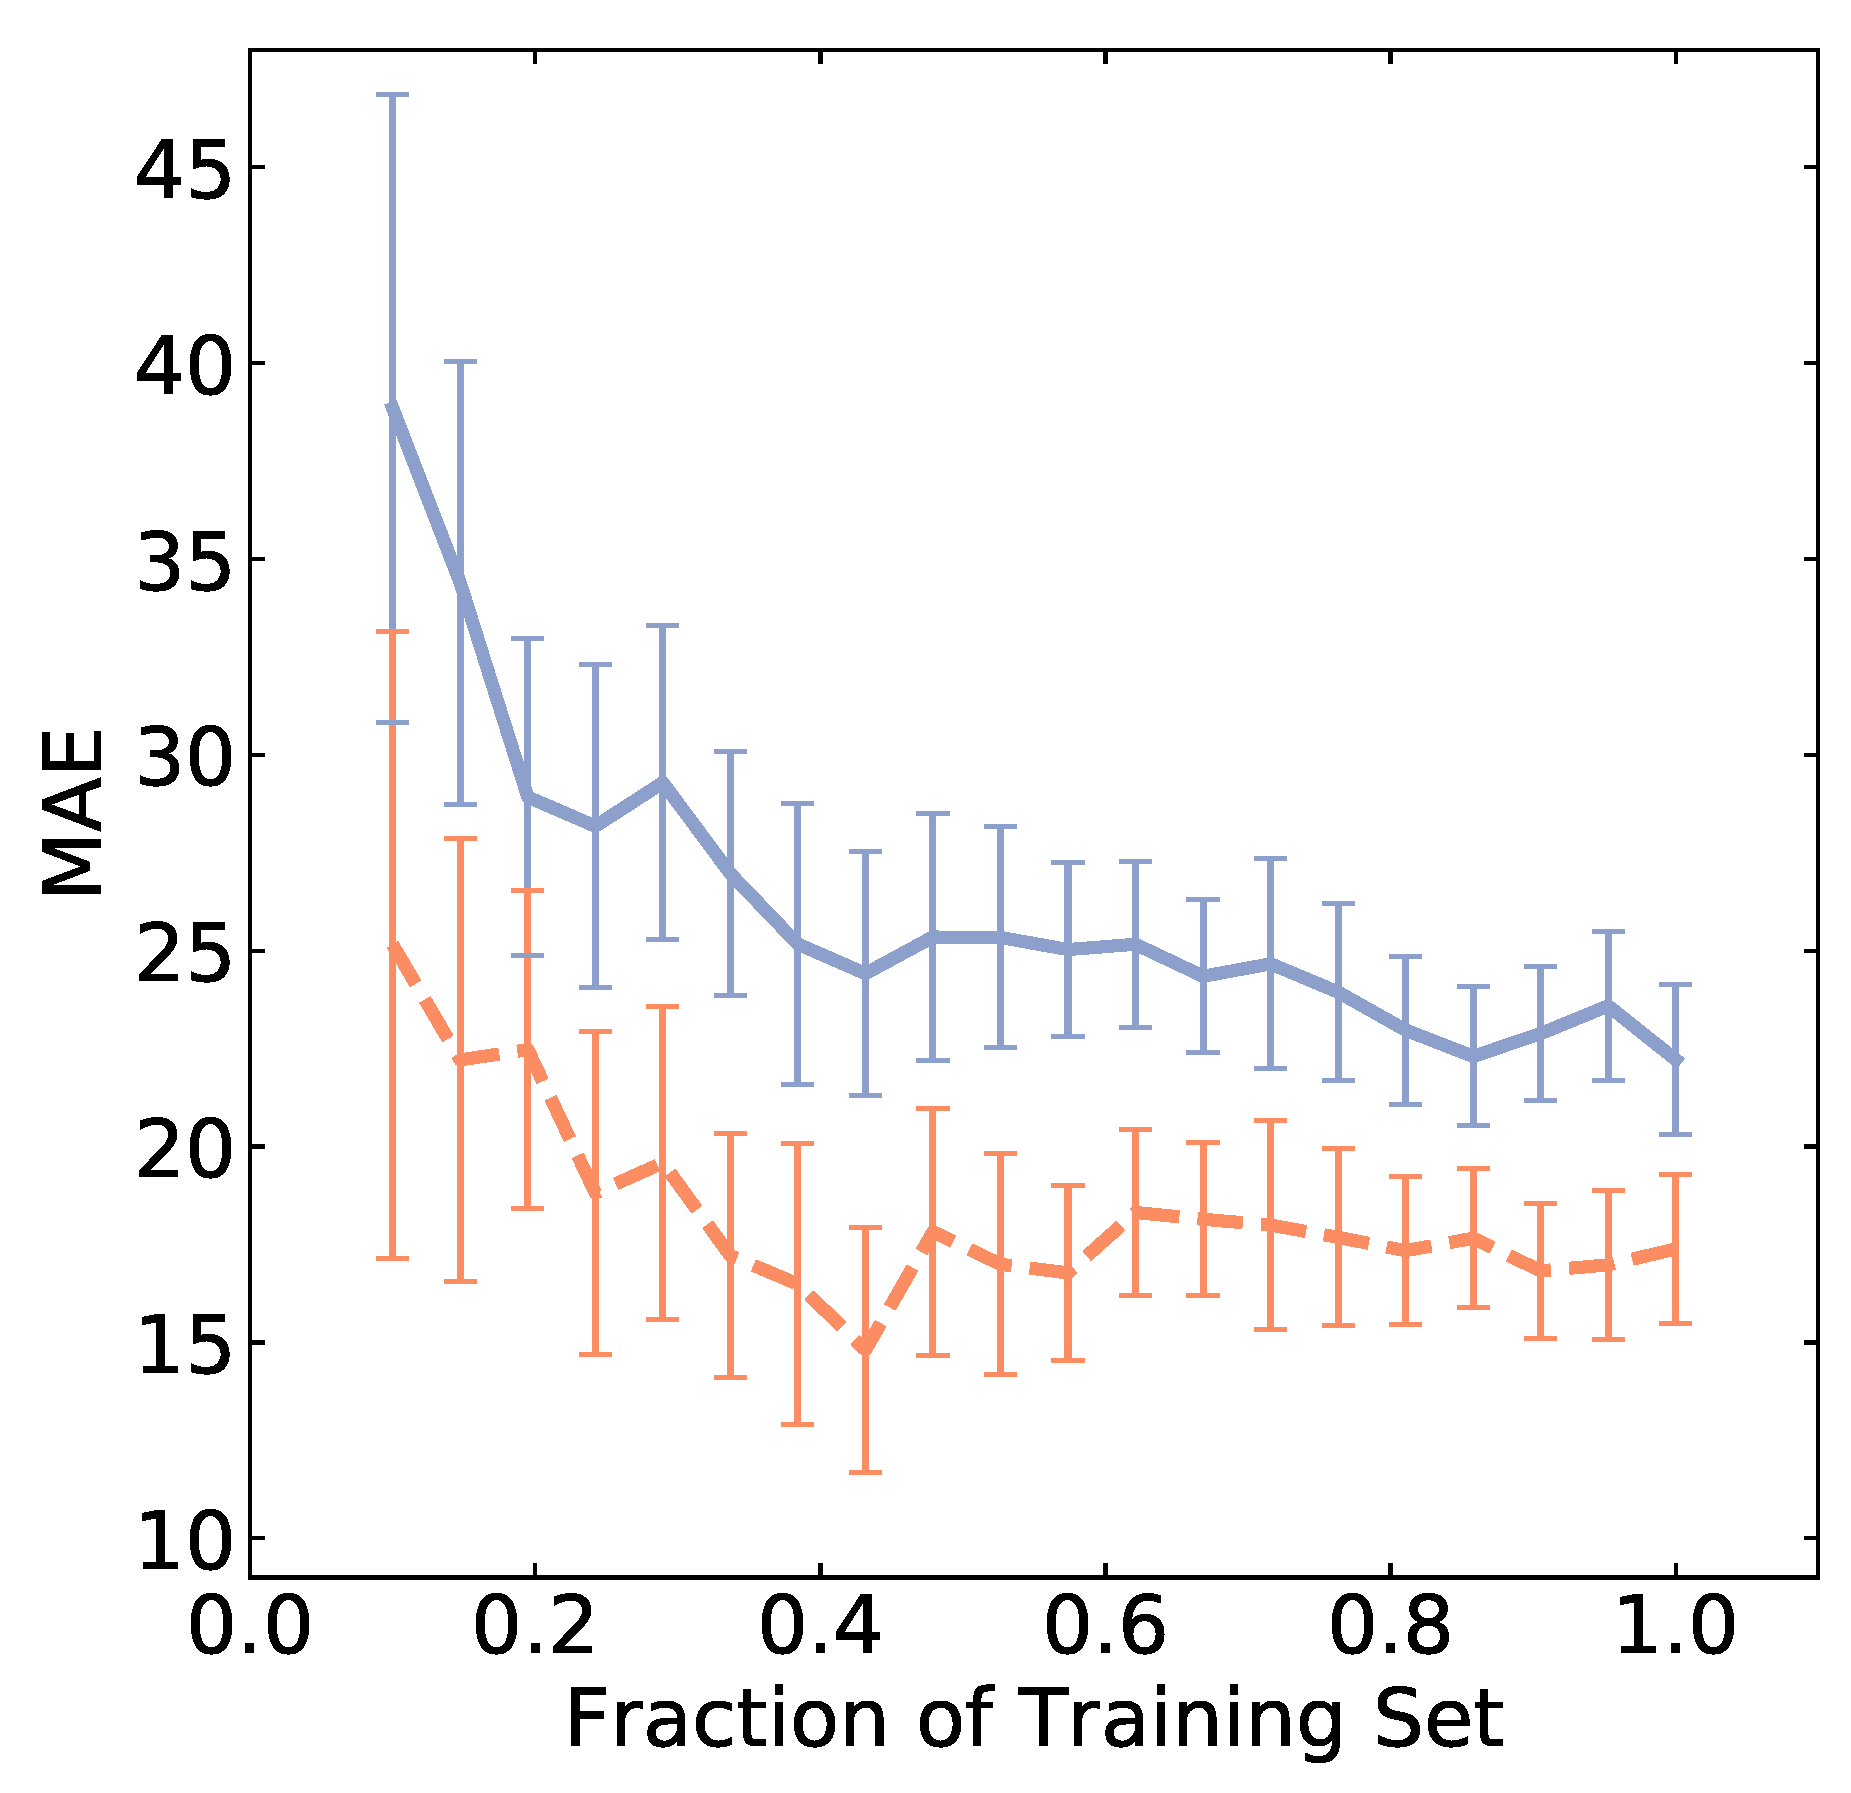
This lackluster model performance likely arises from several issues. An algorithm may not be capable of capturing underlying relationships, as is the case for Lasso. Lasso is a linear model not capable of capturing nonlinear relationships in the data. In addition, the descriptors might be insufficient to adequately describe a battery system. The design of material descriptors plays a critical role in model performance and is an active area of research [30,37,38,39]. In particular, the complexity of battery space likely requires appropriate descriptors as well as additional data for the successful training of ML models. The latter may be explored by studying how model error varies as a function of the size of the dataset. In Figure 4, we see the error plateau at a relatively large value when the size of the dataset approaches N = 90. We found that the training error is significantly lower than the test error, indicating the impact of over-fitting. This suggests that the model error is dominated by the lack of appropriate descriptors. It is conceivable that some of the metadata columns that needed to be removed might be useful for improving model accuracy. This highlights a key challenge that distinguishes battery research from other fields. That is, the complexity of battery architecture and materials coupled with the lack of uniformity in data measurement and reporting hinders a data-driven study of these systems.
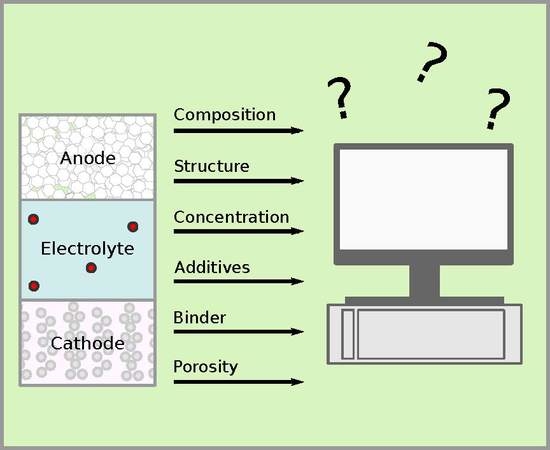
For example, consider the materials that constitute the battery components: anode, cathode, and electrolyte. We note that these are rarely single-phase materials. Instead, a cathode is typically made up of the active material mixed together with conductive additives as well as a binder. The ratio of these phases is not dictated by an agreed upon standard but is determined on a case-by-case basis. The cathode can also retain significant porosity, or even gradients in porosity [40,41] which is not uniformly reported but will certainly influence battery properties. Similarly, it is well known that grain size and grain morphology strongly influence properties such as electrical and ionic conductivity. Nevertheless, final microstructures are not always reported and even summary information such as particle size are rarely, if ever, reported. Likewise, the electrolyte in this dataset is very often the organic LiPF. This electrolyte can vary widely with different concentrations of additives, such as ethylene-carbonate, dimethyl carbonate, diethyl carbonate, and propylene carbonate. When it comes to assembling cells, even while testing similar cathode materials, researchers do not use a standard test cell architecture. In some cases, the counter electrode could be lithium, in others graphite, and so forth.
In addition, we must consider the complexity which simply arises from non-standardized testing. For example, cells can be tested at different discharge rates, which can vary over several orders of magnitude. This selection of discharge rate has a significant effect on cell performance. Consider the work of Wang et al. who demonstrated an increase in specific capacity of more than 100% when changing the discharge rate by an order of magnitude [42]. In other instances, researchers will report cyclic voltammograms, which require a data scientist to interpret voltage ranges by hand when retrieving the data.
Ultimately, it is up to the community of battery researchers to determine the most appropriate testing procedures and protocols. This has not yet come to pass. However, a starting point might be what has been put forward by the United States Advanced Battery Consortium. With this is mind, we summarize the key challenges that the community might consider addressing in order to increase the impact of a machine learning approach:
- There are many cell architectures.
- Each part of the cell is typically a composite, where the volume fraction, distribution, etc. are not always reported.
- Standardized description of the crystal structure of the cathode material should be reported.
- A uniform set of protocols for testing cells is not adhered to, and as a result reported data lack compatibility.
- The complexity associated with battery systems results in a large number of diverse descriptors. Even if the data were reported in a uniform way, this large number of descriptors might require large amounts of data for the accurate training of ML models.
4. Conclusions
The large amount of research being generated in battery materials provides an opportunity for potentially advancing this area of research using data-driven tools, which will aid battery modeling and the discovery of battery materials. This report highlights the challenges faced in generating high fidelity models, and suggests a framework that will guide the battery community when performing and reporting future experiments. Overcoming these challenges will benefit a data-driven approach to battery research and serve the entire community. This calls for efforts to thwart the lack of standardization which obfuscates experimental results and thus scientific advancement.
Supplementary Materials
The following are available online at https://www.mdpi.com/2073-4352/9/1/54/s1.
Author Contributions
T.D.R. and S.K.K. performed data curation. T.D.R. analyzed the data. S.K.K. and T.D.S. provided domain guidance. S.K.K., T.D.S., and T.D.R. wrote the paper.
Funding
This research and the APC were funded by the NSF CAREER grant number 1651668. T.D.R. is supported by the Harvard Future Faculty Leaders Postdoctoral Fellowship.
Acknowledgments
The authors would like to thank Efthimios Kaxiras and Leila Ghadbeigi for useful discussions. We would also like to thank the National Science Foundation for their support of this research under NSF CAREER Award 1651668.
Conflicts of Interest
The authors declare no conflict of interest.
Abbreviations
The following abbreviations are used in this manuscript:
| ML | Machine learning |
| HHI | Herfindahl–Hirschman index |
| KRR | Kernel ridge regression |
| RF | Random forests |
| SVR | Support vector regression |
Appendix A. Descriptor and Model Details
Originally, 49 descriptors that were considered (Table A1). The first two columns of Table A1 show the element-based descriptors that were considered. The element values were obtained using the Mendeleev package [43]. The far right column shows descriptors that were obtained from the battery data. The number of descriptors was reduced to 25 using the descriptor ranking from the random forest algorithm. All remaining descriptors used for training, along with their importances, are shown in Table A2. The training/test data were obtained by using a split of 80/20. Model validation and parameter selection were performed using 10-fold cross-validation.

Table A1.
The original 49 descriptors that were considered for learning. All averages are assumed to be weighted.
Table A1.
The original 49 descriptors that were considered for learning. All averages are assumed to be weighted.
| Element-Based Descriptor | Element-Based Descriptor | From Battery Data |
|---|---|---|
| Atomic Rad: Average | Ion: Average | Structure Type: Li3PO4 |
| Atomic Rad: Difference | Boiling Point: Average | Structure: LiCdBO3 |
| Atomic Vol: Average | Boiling Point: Difference | Structure: LiV3O8 |
| Atomic Vol: Difference | Density: Average | Structure: Na2FePO4F |
| Covalent Rad: Average | Density: Difference | Structure: Nasicon |
| Covalent Rad: Difference | Evaporation Heat: Average | Structure: Fluorophosphate |
| Dipole: Average | Evaporation Heat: Difference | Structure: Layered |
| Dipole: Difference | Fusion Heat: Average | Structure: Multiple |
| Num Electron: Average | Fusion Heat: Difference | Structure: Olivine |
| Num Electron: Difference | Gas Basicity: Average | Structure: Spinel |
| Van der Waals Radius: Average | Gas Basicity: Difference | Anode: Li |
| Van der Waals Radius: Difference | Heat of Formation: Average | Anode: Li4Ti5O12 |
| Electronegativity: Average | Heat of Formation: Difference | Anode: MCMB |
| Electronegativity: Difference | Melting Point: Average | Anode: Na |
| # Valence: Average | Melting Point: Difference | Anode: Graphite |
| # Valence: Difference | Thermal Conductivity: Average | |
| Ion: Average | Thermal Conductivity: Difference |
Table A2.
The 25 descriptors used for reported model performance and their ranked importance.
| Rank | Descriptor | Rank | Descriptor |
|---|---|---|---|
| 1 | Dipole: Average | 14 | Atomic Vol: Average |
| 2 | Gas Basicity: Average | 15 | Anode: Graphite |
| 3 | Gas Basicity: Difference | 16 | Electronegativity: Difference |
| 4 | Fusion Heat: Average | 17 | Melting Point: Average |
| 5 | Heat Of Formation: Average | 18 | Thermal Conductivity: Difference |
| 6 | # Electron: Average | 19 | Heat Of Formation: Difference |
| 7 | Anode: Li | 20 | Atomic Rad: Average |
| 8 | Boiling Point: Average | 21 | Van der Waals Radius: Average |
| 9 | Covalent Rad: Average | 22 | Melting Point: Difference |
| 10 | # Electron: Difference | 23 | Atomic Rad: Difference |
| 11 | Electronegativity: Average | 24 | Num Valence: Average |
| 12 | Thermal Conductivity: Average | 25 | Num Valence: Difference |
| 13 | Atomic Vol: Difference |
Table A3.
Optimized model parameters from training set.
| Model | Parameters |
|---|---|
| Lasso | |
| Kernel Ridge Regression | , |
| Support Vector Regression | , |
| Random Forest | , |
References
- Finn, B. Origin of Electrical Power. Essay from the National Museum of American History. 2001. Available online: http://americanhistory.si.edu/powering/past/prehist.htm (accessed on 21 November 2018).
- Mizushima, K.; Jones, P.; Wiseman, P.; Goodenough, J.B. LixCoO2 (0 < x < − 1): A new cathode material for batteries of high energy density. Mater. Res. Bull. 1980, 15, 783–789. [Google Scholar]
- Frost, S. Technical Insights Report: Energy Storage and Generation for Portable Power; Technical Report; Frost & Sullivan: London, UK, 2009. [Google Scholar]
- Sparks, T.D.; Gaultois, M.W.; Oliynyk, A.; Brgoch, J.; Meredig, B. Data mining our way to the next generation of thermoelectrics. Scr. Mater. 2016, 111, 10–15. [Google Scholar] [CrossRef] [Green Version]
- Gaultois, M.W.; Oliynyk, A.O.; Mar, A.; Sparks, T.D.; Mulholland, G.J.; Meredig, B. Perspective: Web-based machine learning models for real-time screening of thermoelectric materials properties. APL Mater. 2016, 4, 053213. [Google Scholar] [CrossRef]
- Oliynyk, A.O.; Sparks, T.D.; Gaultois, M.W.; Ghadbeigi, L.; Mar, A. Gd12Co5. 3Bi and Gd12Co5Bi, Crystalline Doppelganger with Low Thermal Conductivities. Inorg. Chem. 2016, 55, 6625–6633. [Google Scholar] [CrossRef]
- Mansouri Tehrani, A.; Oliynyk, A.O.; Parry, M.; Rizvi, Z.; Couper, S.; Lin, F.; Miyagi, L.; Sparks, T.D.; Brgoch, J. Machine learning directed search for ultraincompressible, superhard materials. J. Am. Chem. Soc. 2018, 140, 9844–9853. [Google Scholar] [CrossRef]
- Kauwe, S.K.; Graser, J.; Vazquez, A.; Sparks, T.D. Machine Learning Prediction of Heat Capacity for Solid Inorganics. Integr. Mater. Manuf. Innov. 2018, 7, 43–51. [Google Scholar] [CrossRef]
- Carrasquilla, J.; Melko, R.G. Machine learning phases of matter. Nat. Phys. 2017, 13, 431. [Google Scholar] [CrossRef]
- Balachandran, P.V.; Kowalski, B.; Sehirlioglu, A.; Lookman, T. Experimental search for high-temperature ferroelectric perovskites guided by two-step machine learning. Nat. Commun. 2018, 9, 1668. [Google Scholar] [CrossRef] [PubMed]
- Zhuo, Y.; Mansouri Tehrani, A.; Brgoch, J. Predicting the Band Gaps of Inorganic Solids by Machine Learning. J. Phys. Chem. Lett. 2018, 9, 1668–1673. [Google Scholar] [CrossRef] [PubMed]
- Kauwe, S.K.; Welker, T.; Sparks, T.D. Extracting Knowledge from DFT: Experimental Band Gap Predictions Through Ensemble Learning. MRS Commun. 2018. submitted. [Google Scholar]
- Zhuo, Y.; Tehrani, A.M.; Oliynyk, A.O.; Duke, A.C.; Brgoch, J. Identifying an efficient, thermally robust inorganic phosphor host via machine learning. Nat. Commun. 2018, 9, 4377. [Google Scholar] [CrossRef] [PubMed]
- Hutchinson, M.L.; Antono, E.; Gibbons, B.M.; Paradiso, S.; Ling, J.; Meredig, B. Overcoming data scarcity with transfer learning. arXiv, 2017; arXiv:1711.05099. [Google Scholar]
- Meredig, B.; Agrawal, A.; Kirklin, S.; Saal, J.E.; Doak, J.; Thompson, A.; Zhang, K.; Choudhary, A.; Wolverton, C. Combinatorial screening for new materials in unconstrained composition space with machine learning. Phys. Rev. B 2014, 89, 094104. [Google Scholar] [CrossRef]
- Cao, B.; Adutwum, L.A.; Oliynyk, A.O.; Luber, E.J.; Olsen, B.C.; Mar, A.; Buriak, J.M. How to optimize materials and devices via design of experiments and machine learning: Demonstration using organic photovoltaics. ACS Nano 2018, 12, 7434–7444. [Google Scholar] [CrossRef] [PubMed]
- Kusne, A.G.; Gao, T.; Mehta, A.; Ke, L.; Nguyen, M.C.; Ho, K.M.; Antropov, V.; Wang, C.Z.; Kramer, M.J.; Long, C.; et al. On-the-fly machine-learning for high-throughput experiments: Search for rare-earth-free permanent magnets. Sci. Rep. 2014, 4, 6367. [Google Scholar] [CrossRef] [PubMed]
- Landrum, G.A.; Penzotti, J.E.; Putta, S. Machine-learning models for combinatorial catalyst discovery. Meas. Sci. Technol. 2004, 16, 270. [Google Scholar] [CrossRef]
- Oliynyk, A.O.; Mar, A. Discovery of intermetallic compounds from traditional to machine-learning approaches. Acc. Chem. Res. 2017, 51, 59–68. [Google Scholar] [CrossRef] [PubMed]
- Graser, J.; Kauwe, S.K.; Sparks, T.D. Machine learning and energy minimization approaches for crystal structure predictions: A review and new horizons. Chem. Mater. 2018, 30, 3601–3612. [Google Scholar] [CrossRef]
- Oliynyk, A.O.; Gaultois, M.W.; Hermus, M.; Morris, A.J.; Mar, A.; Brgoch, J. Searching for Missing Binary Equiatomic Phases: Complex Crystal Chemistry in the Hf- In System. Inorg. Chem. 2018, 57, 7966–7974. [Google Scholar] [CrossRef]
- Oliynyk, A.O.; Antono, E.; Sparks, T.D.; Ghadbeigi, L.; Gaultois, M.W.; Meredig, B.; Mar, A. High-throughput machine-learning-driven synthesis of full-Heusler compounds. Chem. Mater. 2016, 28, 7324–7331. [Google Scholar] [CrossRef]
- Oliynyk, A.O.; Adutwum, L.A.; Harynuk, J.J.; Mar, A. Classifying crystal structures of binary compounds AB through cluster resolution feature selection and support vector machine analysis. Chem. Mater. 2016, 28, 6672–6681. [Google Scholar] [CrossRef]
- Hu, X.; Li, S.E.; Yang, Y. Advanced Machine Learning Approach for Lithium-Ion Battery State Estimation in Electric Vehicles. IEEE Trans. Transp. Electrif. 2016, 2, 140–149. [Google Scholar] [CrossRef]
- Liu, D.; Zhou, J.; Pan, D.; Peng, Y.; Peng, X. Lithium-ion battery remaining useful life estimation with an optimized Relevance Vector Machine algorithm with incremental learning. Measurement 2015, 63, 143–151. [Google Scholar] [CrossRef]
- Ahmad, Z.; Xie, T.; Maheshwari, C.; Grossman, J.C.; Viswanathan, V. Machine Learning Enabled Computational Screening of Inorganic Solid Electrolytes for Suppression of Dendrite Formation in Lithium Metal Anodes. ACS Central Sci. 2018, 4, 996–1006. [Google Scholar] [CrossRef]
- Sendek, A.D.; Yang, Q.; Cubuk, E.D.; Duerloo, K.A.N.; Cui, Y.; Reed, E.J. Holistic computational structure screening of more than 12000 candidates for solid lithium-ion conductor materials. Energy Environ. Sci. 2017, 10, 306–320. [Google Scholar] [CrossRef]
- Wu, B.; Han, S.; Shin, K.G.; Lu, W. Application of artificial neural networks in design of lithium-ion batteries. J. Power Sources 2018, 395, 128–136. [Google Scholar] [CrossRef]
- Ghadbeigi, L.; Harada, J.K.; Lettiere, B.R.; Sparks, T.D. Performance and resource considerations of Li-ion battery electrode materials. Energy Environ. Sci. 2015, 8, 1640–1650. [Google Scholar] [CrossRef]
- Ghiringhelli, L.M.; Vybiral, J.; Levchenko, S.V.; Draxl, C.; Scheffler, M. Big Data of Materials Science: Critical Role of the Descriptor. Phys. Rev. Lett. 2015, 114, 105503. [Google Scholar] [CrossRef] [PubMed]
- Seko, A.; Hayashi, H.; Nakayama, K.; Takahashi, A.; Tanaka, I. Representation of compounds for machine-learning prediction of physical properties. Phys. Rev. B 2017, 95, 144110. [Google Scholar] [CrossRef]
- Rhone, T.D.; Chen, W.; Desai, S.; Yacoby, A.; Kaxiras, E. Data-Driven Studies of Magnetic Two-Dimensional Materials. arXiv, 2018; arXiv:1806.07989. [Google Scholar]
- Ghiringhelli, L.M.; Carbogno, C.; Levchenko, S.; Mohamed, F.; Huhs, G.; Lüders, M.; Oliveira, M.; Scheffler, M. Towards efficient data exchange and sharing for big-data driven materials science: Metadata and data formats. NPJ Comput. Mater. 2017, 3, 46. [Google Scholar] [CrossRef]
- Pedregosa, F.; Varoquaux, G.; Gramfort, A.; Michel, V.; Thirion, B.; Grisel, O.; Blondel, M.; Prettenhofer, P.; Weiss, R.; Dubourg, V.; et al. Scikit-learn: Machine Learning in Python. J. Mach. Learn. Res. 2011, 12, 2825–2830. [Google Scholar]
- Hastie, T.; Tibshirani, R.; Friedman, J.H. The Elements of Statistical Learning: Data Mining, Inference, and Prediction, 2nd ed.; Springer Series in Statistics; Springer: New York, NY, USA, 2009. [Google Scholar]
- Reshef, D.N.; Reshef, Y.A.; Finucane, H.K.; Grossman, S.R.; McVean, G.; Turnbaugh, P.J.; Lander, E.S.; Mitzenmacher, M.; Sabeti, P.C. Detecting novel associations in large data sets. Science 2011, 334, 1518–1524. [Google Scholar] [CrossRef] [PubMed]
- Rupp, M.; Tkatchenko, A.; Müller, K.R.; von Lilienfeld, O.A. Fast and Accurate Modeling of Molecular Atomization Energies with Machine Learning. Phys. Rev. Lett. 2012, 108, 58301. [Google Scholar] [CrossRef] [PubMed]
- Hansen, K.; Biegler, F.; Ramakrishnan, R.; Pronobis, W.; von Lilienfeld, O.A.; Müller, K.R.; Tkatchenko, A. Machine Learning Predictions of Molecular Properties: Accurate Many-Body Potentials and Nonlocality in Chemical Space. J. Phys. Chem. Lett. 2015, 6, 2326–2331. [Google Scholar] [CrossRef] [PubMed]
- Thomas, N.; Smidt, T.; Kearnes, S.; Yang, L.; Li, L.; Kohlhoff, K.; Riley, P. Tensor field networks: Rotation- and translation-equivariant neural networks for 3D point clouds. arXiv, 2018; arXiv:1802.08219. [Google Scholar]
- Al Khateeb, S.; Sparks, T.D. Spray pyrolysis of conductor-and binder-free porous FeS 2 films for high-performance lithium ion batteries. J. Mater. Sci. 2019, 54, 4089–4104. [Google Scholar] [CrossRef]
- Liu, L.; Guan, P.; Liu, C. Experimental and Simulation Investigations of Porosity Graded Cathodes in Mitigating Battery Degradation of High Voltage Lithium-Ion Batteries. J. Electrochem. Soc. 2017, 164, A3163–A3173. [Google Scholar] [CrossRef] [Green Version]
- Wang, G.; Leng, X.; Han, S.; Shao, Y.; Wei, S.; Liu, Y.; Lian, J.; Jiang, Q. How to improve the stability and rate performance of lithium-ion batteries with transition metal oxide anodes. J. Mater. Res. 2017, 32, 16–36. [Google Scholar] [CrossRef]
- Mendeleev—A Python Resource for Properties of Chemical Elements, Ions and Isotopes, Ver. 0.4.3. 2014. Available online: https://bitbucket.org/lukaszmentel/mendeleev (accessed on 15 January 2019).
Figure 1.
Specific discharge capacity at 25 cycle (mAh g) versus the following descriptors: (a) mean of the dipole polarizability; (b) atomic volume maximum difference; and (c) the mean of the gas phase basicity.
Figure 1.
Specific discharge capacity at 25 cycle (mAh g) versus the following descriptors: (a) mean of the dipole polarizability; (b) atomic volume maximum difference; and (c) the mean of the gas phase basicity.

Figure 2.
Machine learning prediction results for specific discharge capacity at 25 cycles (mAh g) using: (a) kernel ridge regression; (b) support vector regression; and (c) random forests regression. Training (blue circles) and test (orange squares) performance show similar behavior. The mean absolute error (MAE) and coefficient of determination (R) are shown. Dotted lines are included to help visualize ideal model performance.

Figure 3.
The top twelve descriptors are shown along with their importances from the random forest regression.
Figure 3.
The top twelve descriptors are shown along with their importances from the random forest regression.

Figure 4.
A decrease in mean absolute error (MAE) specific discharge capacity at 25 cycles (in mAh g) is shown as a function of dataset size using the SVR algorithm. Blue (orange) represents the performance of the test (training) set. Error bars show the standard deviation (obtained by repeating the calculation 50 times, each with a random sampling of the training data).

© 2019 by the authors. Licensee MDPI, Basel, Switzerland. This article is an open access article distributed under the terms and conditions of the Creative Commons Attribution (CC BY) license (http://creativecommons.org/licenses/by/4.0/).
Share and Cite
MDPI and ACS Style
Kauwe, S.K.; Rhone, T.D.; Sparks, T.D. Data-Driven Studies of Li-Ion-Battery Materials. Crystals 2019, 9, 54. https://doi.org/10.3390/cryst9010054
AMA Style
Kauwe SK, Rhone TD, Sparks TD. Data-Driven Studies of Li-Ion-Battery Materials. Crystals. 2019; 9(1):54. https://doi.org/10.3390/cryst9010054
Chicago/Turabian StyleKauwe, Steven K., Trevor David Rhone, and Taylor D. Sparks. 2019. "Data-Driven Studies of Li-Ion-Battery Materials" Crystals 9, no. 1: 54. https://doi.org/10.3390/cryst9010054
Note that from the first issue of 2016, this journal uses article numbers instead of page numbers. See further details here.