
Comparative Analysis of Room Temperature Structures Determined by Macromolecular and Serial Crystallography


College of General Education, Kookmin University, Seoul 02707, Republic of Korea
Crystals 2024, 14(3), 276; https://doi.org/10.3390/cryst14030276
Submission received: 4 March 2024
/
Revised: 11 March 2024
/
Accepted: 12 March 2024
/
Published: 14 March 2024
(This article belongs to the Section Macromolecular Crystals)
Abstract
:Temperature directly influences the function and structure of proteins. Crystal structures determined at room temperature offer more biologically relevant structural information regarding flexibility, rigidity, and thermal motion than those determined by conventional cryocrystallography. Crystal structures can be determined at room temperature using conventional macromolecular crystallography (MX) or serial crystallography (SX) techniques. Among these, MX may theoretically be affected by radiation damage or X-ray heating, potentially resulting in differences between the room temperature structures determined by MX and SX, but this has not been fully elucidated. In this study, the room temperature structure of xylanase GH11 from Thermoanaerobacterium saccharolyticum was determined by MX (RT-TsaGH11-MX). The RT-TsaGH11-MX exhibited both the open and closed conformations of the substrate-binding cleft within the β-sandwich fold. The RT-TsaGH11-MX showed distinct structural changes and molecular flexibility when compared with the RT-TsaGH11 determined via serial synchrotron crystallography. The notable molecular conformation and flexibility of the RT-TsaGH11-MX may be induced by radiation damage and X-ray heating. These findings will broaden our understanding of the potential limitations of room temperature structures determined by MX.
1. Introduction
The use of X-ray crystallography to determine protein structure provides an opportunity to understand the molecular mechanisms underlying biology at the atomic level [1,2,3,4]. This structural information offers insights into the development of new drugs [5,6,7] and into protein engineering for the improvement of industrial enzyme applications [8,9,10]. In typical macromolecular crystallography, diffraction data are collected in cryogenic environments using cryocrystallography to reduce radiation damage [11,12,13]. As temperature directly affects protein activity and structural stability, protein structures in cryogenic environments through cryocrystallography may provide biologically inaccurate structural information regarding their molecular flexibility, rigidity, and thermal motion [14,15]. Therefore, the protein structure determined near room temperature offers more biologically relevant structural information than that obtained in a cryogenic environment [14].
Various room temperature structures of proteins have been determined using conventional macromolecular crystallography (MX) [16]. During the MX data collection, a single crystal is usually aligned with the path of the X-ray beam and exposed to the X-ray, while the complete three-dimensional diffraction dataset is collected [17,18]. Theoretically and practically, X-ray radiation damage can occur in the crystal samples during the data collection [19,20,21,22,23]. In addition, the X-ray absorption can induce heating around the crystal sample at the position of the X-ray penetration [20,24]. Therefore, the room temperature structure of macromolecules determined by MX may provide biologically less relevant structural information because of radiation damage and X-ray heating.
Serial crystallography (SX), which employs an X-ray-free electron laser or a synchrotron X-ray, is an experimental technique that can determine the room temperature structure while minimizing the radiation damage [25,26,27]. During an SX experiment, a large number of crystal samples are delivered to the X-ray interaction point and exposed to the X-ray only once. This approach minimizes the radiation damage and X-ray heating and enables the visualization of the time-resolved molecular dynamics during protein activity or the reactions using an optical laser [28,29] or a mixing device [30,31].
Consequently, the room temperature structure of a protein determined via the MX method is expected to differ from that determined via the SX approach, which minimizes radiation damage and thermal heating effects. However, no direct experimental comparisons of the differences in room temperature structures depending on the experimental technique have been reported. Therefore, comparing the room temperature structures collected using these different techniques can provide important insights into the experimental setup needed to obtain biologically relevant and reliable room temperature structures.
Xylanase degrades a lignocellulose-based biomass and has extensive applications in industries for the production of feed, paper, biofuel, and value-added products [8,32]. Xylanase GH11 from the hemicellulose-degrading bacterium Thermoanaerobacterium saccharolyticum (TsaGH11) was recently biochemically and structurally characterized [33]. TsaGH11 exhibited a maximum hydrolase activity at a pH of 5.0 and at 70 °C, with Km and kcat values toward the beechwood xylan of 12.9 mg mL−1 and 34,015.3 s−1, respectively [33]. The crystal structures of the TsaGH11 were determined using cryocrystallography and serial synchrotron crystallography (SSX). TsaGH11 has a β-jelly roll fold, and an analysis of the two molecules in the asymmetric unit demonstrated both open and closed conformations of the substrate-binding site [33]. The crystal structure of the TsaGH11 determined at room temperature via SSX (RT-TsaGH11-SSX) showed a higher flexibility than that determined at a cryogenic temperature via macromolecular crystallography (Cryo-TsaGH11-MX) [33].
Herein, rather than assessing the biological function of TsaGH11, this was used as a model sample to compare the room temperature structure determined via MX and SSX. The room temperature structure of RT-TsaGH11-MX was determined at 2.85 Å resolution. The open and closed conformations of RT-TsaGH11-MX from two molecules in an asymmetric unit were described and compared with those previously from RT-TsGH11-SSX. This structural comparison identified significant conformational changes and molecular flexibility between the structures. The structural disparities in the room temperature structure of TsaGH11 by MX and SSX are discussed. These findings contribute to expanding our understanding of the room temperature structures determined by MX.
2. Materials and Methods
2.1. Preparation of TsaGH11
The cloning and protein purification of the TsaGH11 were as previously described [33]. A codon-optimized TsaGH11 (UniProt: I3VTR8, Asp28-Trp211) gene for expression in Escherichia coli with the N-terminal hexahistidine was synthesized and cloned into a pBT7 vector (Bioneer, Daejeon, Republic of Korea). Recombinant DNA was transformed into E. coli BL21 (DE3) and then grown at 37 °C in an LB medium with 50 mg/mL of ampicillin. When the optical density at 600 nm reached 0.4–0.8, the protein expression was induced using 0.5 mM of isopropyl-D-1-thiogalactopyranoside, and the cells were incubated at 18 °C overnight. The cells were then disrupted by sonication, and the cell debris was removed by centrifugation. The supernatant was applied to a Ni–NTA resin (Qiagen, Valencia, CA, USA) in a column and washed with a buffer containing 50 mM Tris–HCl, pH 8.0, 200 mM NaCl, and 20 mM imidazole. Recombinant protein was eluted with a buffer containing 50 mM Tris–HCl, pH 8.0, 200 mM NaCl, and 300 mM imidazole. After the concentration of the eluted protein using a Centricon filter, thrombin (Sigma-Aldrich, St. Louis, MO, USA) was added to remove the N-terminal hexahistidine tag at 25 °C overnight. The cleaved protein was subsequently loaded onto a Sephacryl S-100 column (GE Healthcare, Chicago, IL, USA) and equilibrated with a buffer containing 10 mM Tris–HCl, pH 8.0, and 200 mM NaCl. The protein fractions were collected and concentrated to 20 mg/mL for crystallization.
2.2. Protein Crystallization
The TsaGH11 crystallization was performed using the hanging drop vapor diffusion method at 22 °C. The purified TsaGH11 solution (2 μL) was mixed with crystallization solutions (2 μL) containing 0.1 M sodium acetate, pH 4.6, and 4.0 M ammonium acetate and then equilibrated with a reservoir solution (500 μL). Suitable TsaGH11 crystals for X-ray diffraction were grown within 1 month. The dimensions of the TsaGH11 crystal were approximately 150 × 150 × 300 μm3.
2.3. Cryogenic X-ray Diffraction Data
The X-ray diffraction data were collected on Beamline 11C at Pohang Light Source II (PLS-II; Pohang, Republic of Korea) [34]. The TsaGH11 crystals were fished using a nylon loop and then mounted on a goniometer. The data collection was performed at 299 K. The X-ray exposure time was 100 ms for each image with 1° oscillation. The predicted average diffraction weighted dose and the average doses in the exposed region of the crystal were calculated using RADDOSE-3D [35]. The diffraction data were recorded using a Pilatus 6M detector (DECTRIS, Baden, Switzerland). The diffraction images were processed using an HKL2000 [36].
2.4. Crystal Structure Determination and Analysis
The phasing problem was solved by molecular replacement with MOLREP [37]. The crystal structure of the TsaGH11 determined by cryocrystallography (PDB code 8IH0) [33] was used as the search model. The model of the structure was built using COOT [38]. The model refinement was performed using refine.phenix in PHENIX [39]. The geometry of the final model structures was evaluated using MolProbity [40]. The protein structures were visualized and analyzed using PyMOL (DeLano Scientific LLC, San Carlos, CA, USA). The values of Rmerge and I/sigma were obtained from the HKL2000 [36]. The molecule superimposition was conducted with PyMOL. The B-factor and normalized B-factor values were analyzed using PHENIX [39].
3. Results
3.1. Data Collection for TsaGH11 at Room Temperature
To understand the differences in the room temperature structures determined via MX and SSX, the crystals suitable for full data collection at room temperature via the MX technique were screened. In the initial diffraction experiment, the various crystals held in the laboratory were placed in a quartz capillary with a reservoir solution, exposed to X-rays, and screened for the crystals capable of collecting a complete diffraction dataset. A complete three-dimensional diffraction dataset from TsaGH11 was successfully collected using MX.
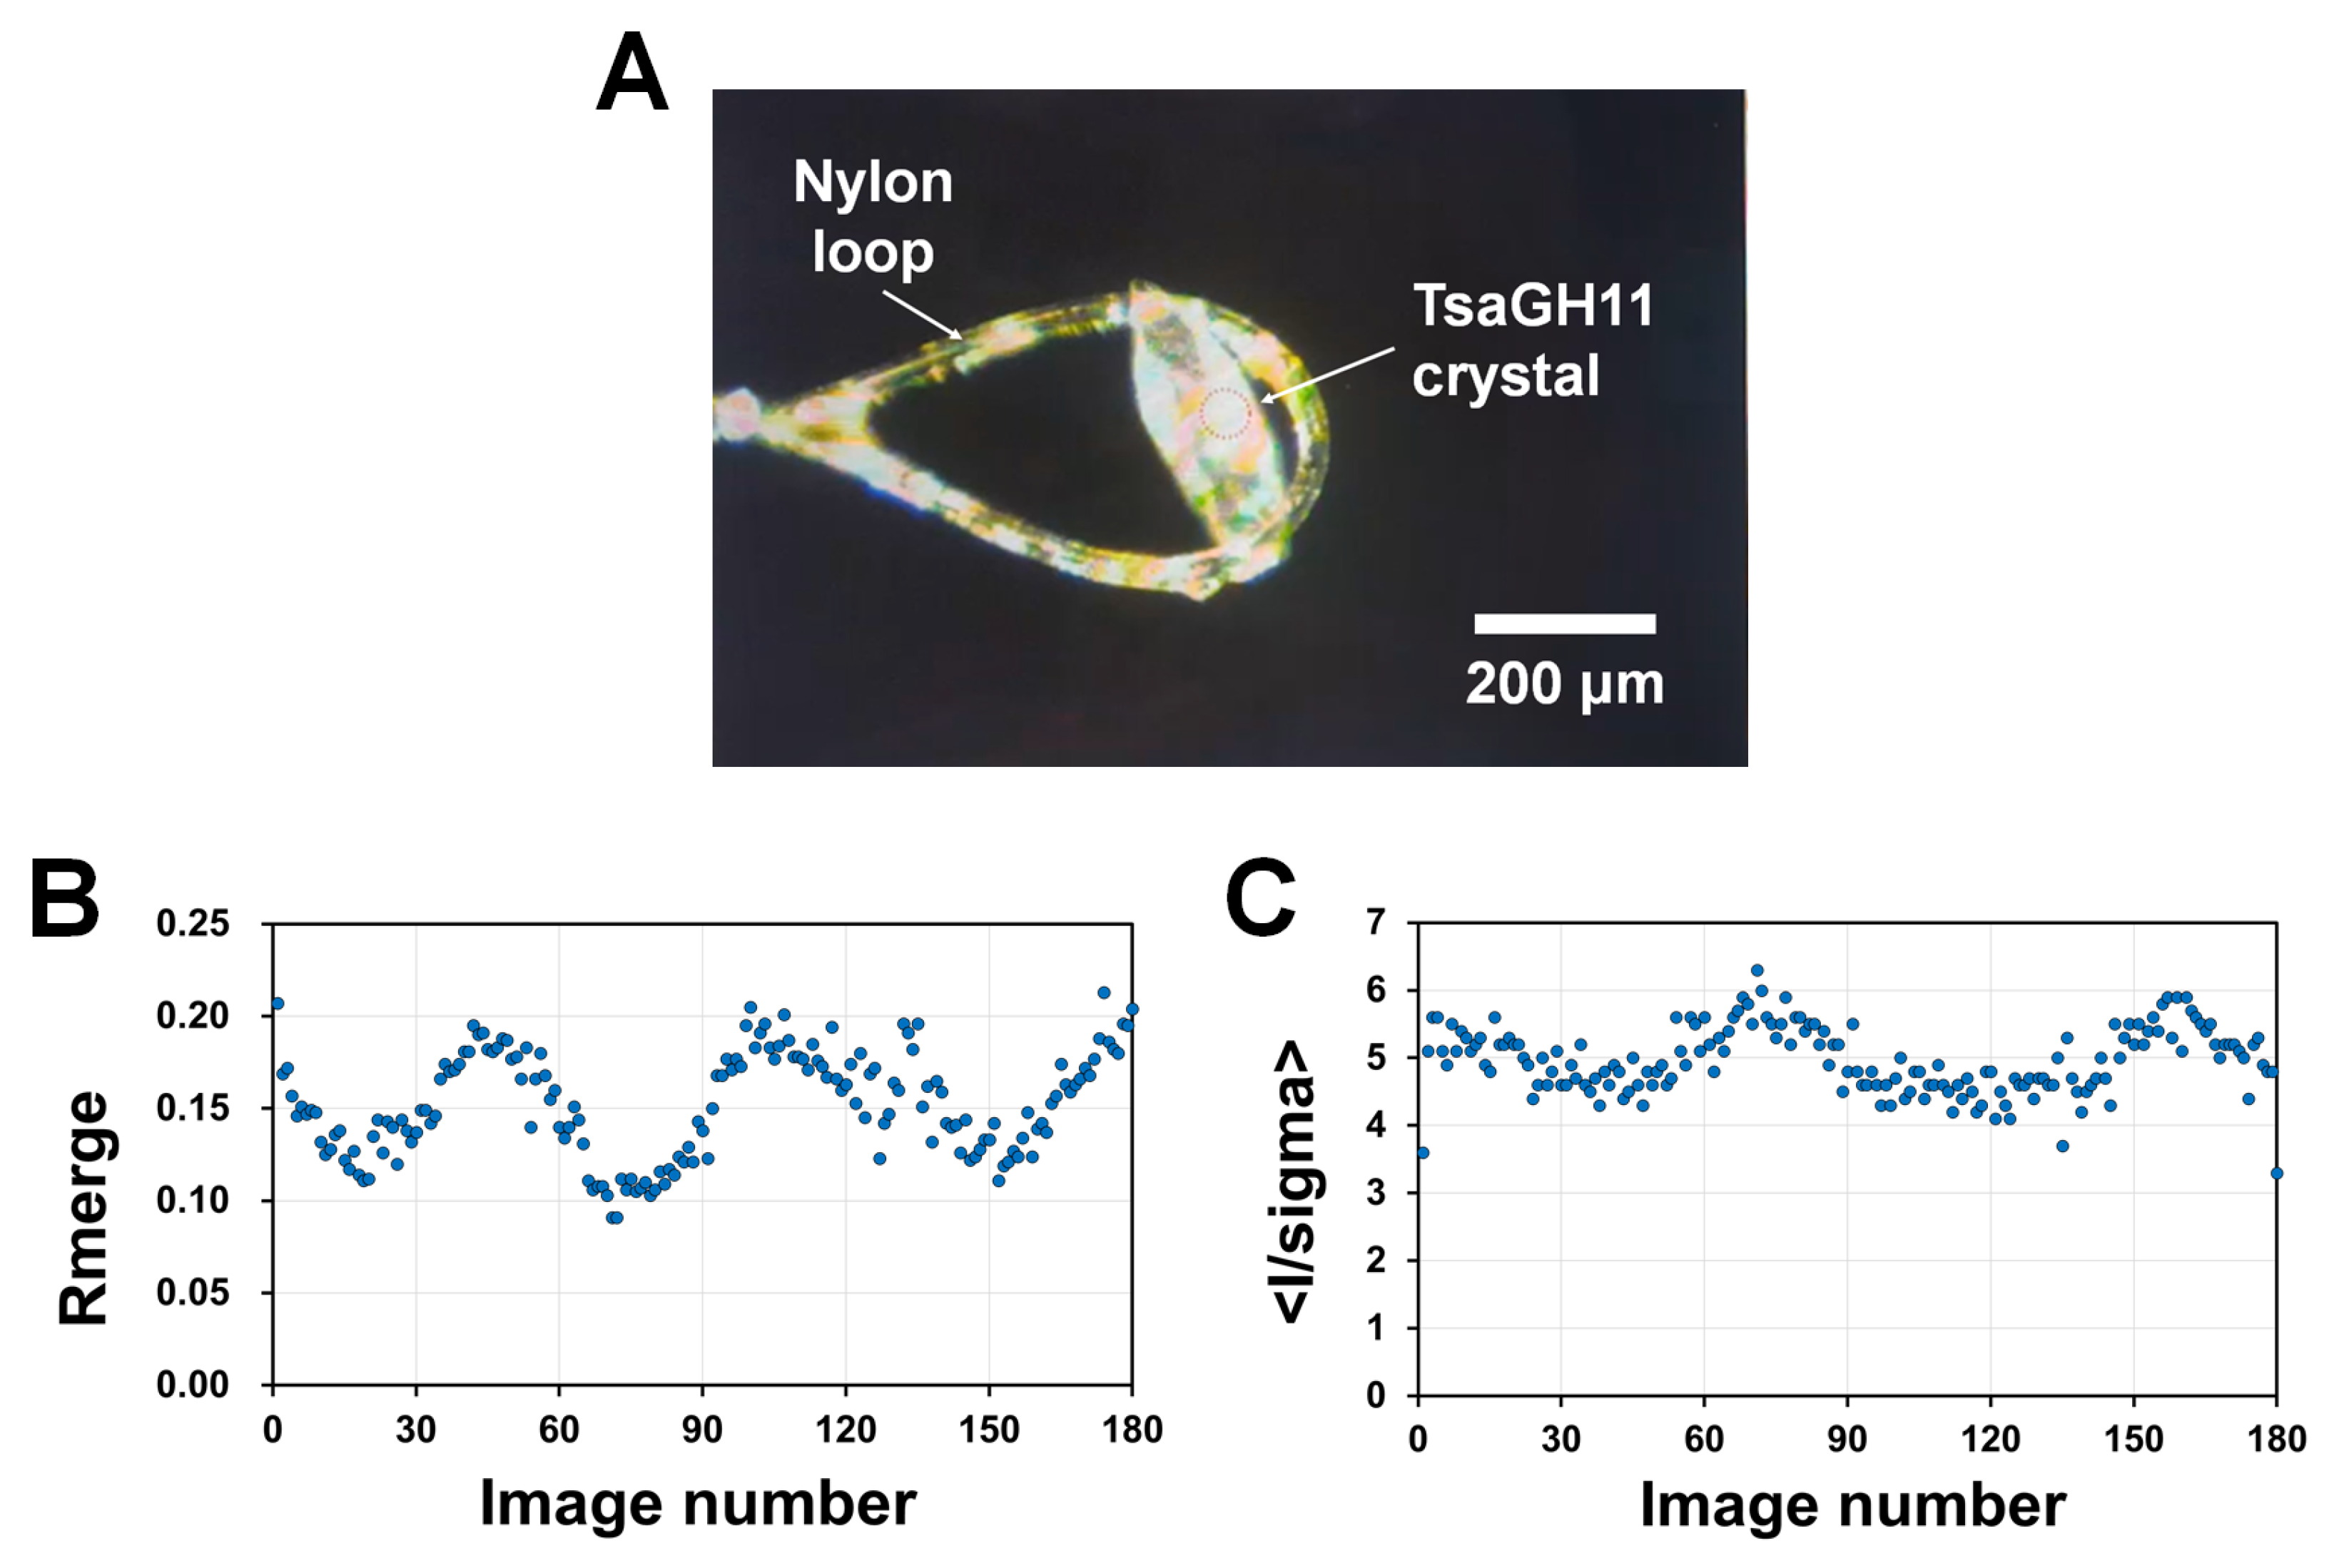
Continuous exposure of the capillary to X-rays can increase the temperature at the X-ray-exposed area due to X-ray absorption [24]. This potentially raises the temperature of the crystal sample to temperatures unexpectedly higher than room temperature, which may induce changes in the crystal structure. Therefore, to minimize the temperature increase in the crystals due to X-ray absorption, the crystal was placed on a nylon loop to collect the diffraction data. This approach not only reduced the thermal effect caused by the X-ray absorption of the solvent but also minimized the radiation damage to the crystals caused by the radicals generated from the solvent. Exposure to air can dehydrate the crystal environment but this may improve the signal-to-noise ratio by reducing the background scattering caused by the solvent.
The diffraction data collected from a crystal exposed to X-rays for an extended period also contains information about any accumulated radiation damage. In the previous cryocrystallography experiment, a single crystal of TsaGH11 was exposed for 1 s per 1° rotation of the crystal, whereas in the SSX experiment, each diffraction image was exposed for 100 ms [33]. Therefore, to try to reduce the radiation damage in this experiment using MX at room temperature, the X-ray exposure time to the crystal was set to 100 ms per 1° rotation (Figure 1).
On the other hand, when collecting the diffraction data on a crystal sample larger than the X-ray beam, after data collection for 180° oscillation, the I/sigma significantly decreases and the Rmerge increases [20]. To minimize radiation damage, only the images collected within 180° rotation of the diffraction data were used for the data analysis and structure determination. The calculated average diffracted weight dose and the average dose (the exposed region) of the crystal for the X-rays used in this experiment were calculated as 5.02 and 1.65 MGy, respectively.
A reduction in the I/sigma and an increase in the Rmerge are important criteria for determining the radiation damage in the diffraction data [41]. The diffraction data of RT-TsaGH11-MX did not exhibit a sharp decrease in the I/sigma or an increase in the Rmerge (Figure 1). This indicates that significant radiation damage was not included in the data processing statistics. However, the determined structures tentatively included radiation damage (see below). The partial increase and decrease in the I/sigma and Rmerge observed in the data plot are considered to be caused by differences in the quality of the diffraction data depending on the shape of the crystal during the crystal rotation during the data collection.
3.2. Structure Determination
The crystals of RT-TsaGH11-MX were resolved to 2.85 Å and exhibited the tetragonal space group P43212 (Table 1), which is identical to that for the previously reported TsaGH11 crystals [33]. An increase in the unit cell size of the crystal is generally observed when a crystal undergoes global radiation damage [42]. Herein, the unit cell dimensions of the RT-TsaGH11-MX (a = b = 69.89 Å and c = 170.42 Å) slightly differed from those previously reported for the RT-TsaGH11-SSX (a = b = 74.47 Å and c = 167.74 Å) and Cryo-TsaGH11-MX (a = b = 73.11 Å and c = 165.42 Å). For the room temperature structure, the unit cell dimensions for the a and b axes of the RT-TsaGH11-MX are shorter than those of the RT-TsaGH11-SSX, whereas the unit cell dimension for the c axis of the RT-TsaGH11-MX is longer than that of the RT-TsaGH11-SSX. This change in the unit cell dimensions may have occurred because of radiation damage, X-ray heating, or dehydration (see Discussion).
The refinement of RT-TsaGH11-MX was up to 2.85 Å, with Rwork and Rfree values of 18.32 and 25.62, respectively. This Rfree value is generally acceptable for macromolecular crystal structures but is slightly high when considering the Rwork value, which may be because of the partial disorder in the electron density map for the thumb domain (see below).
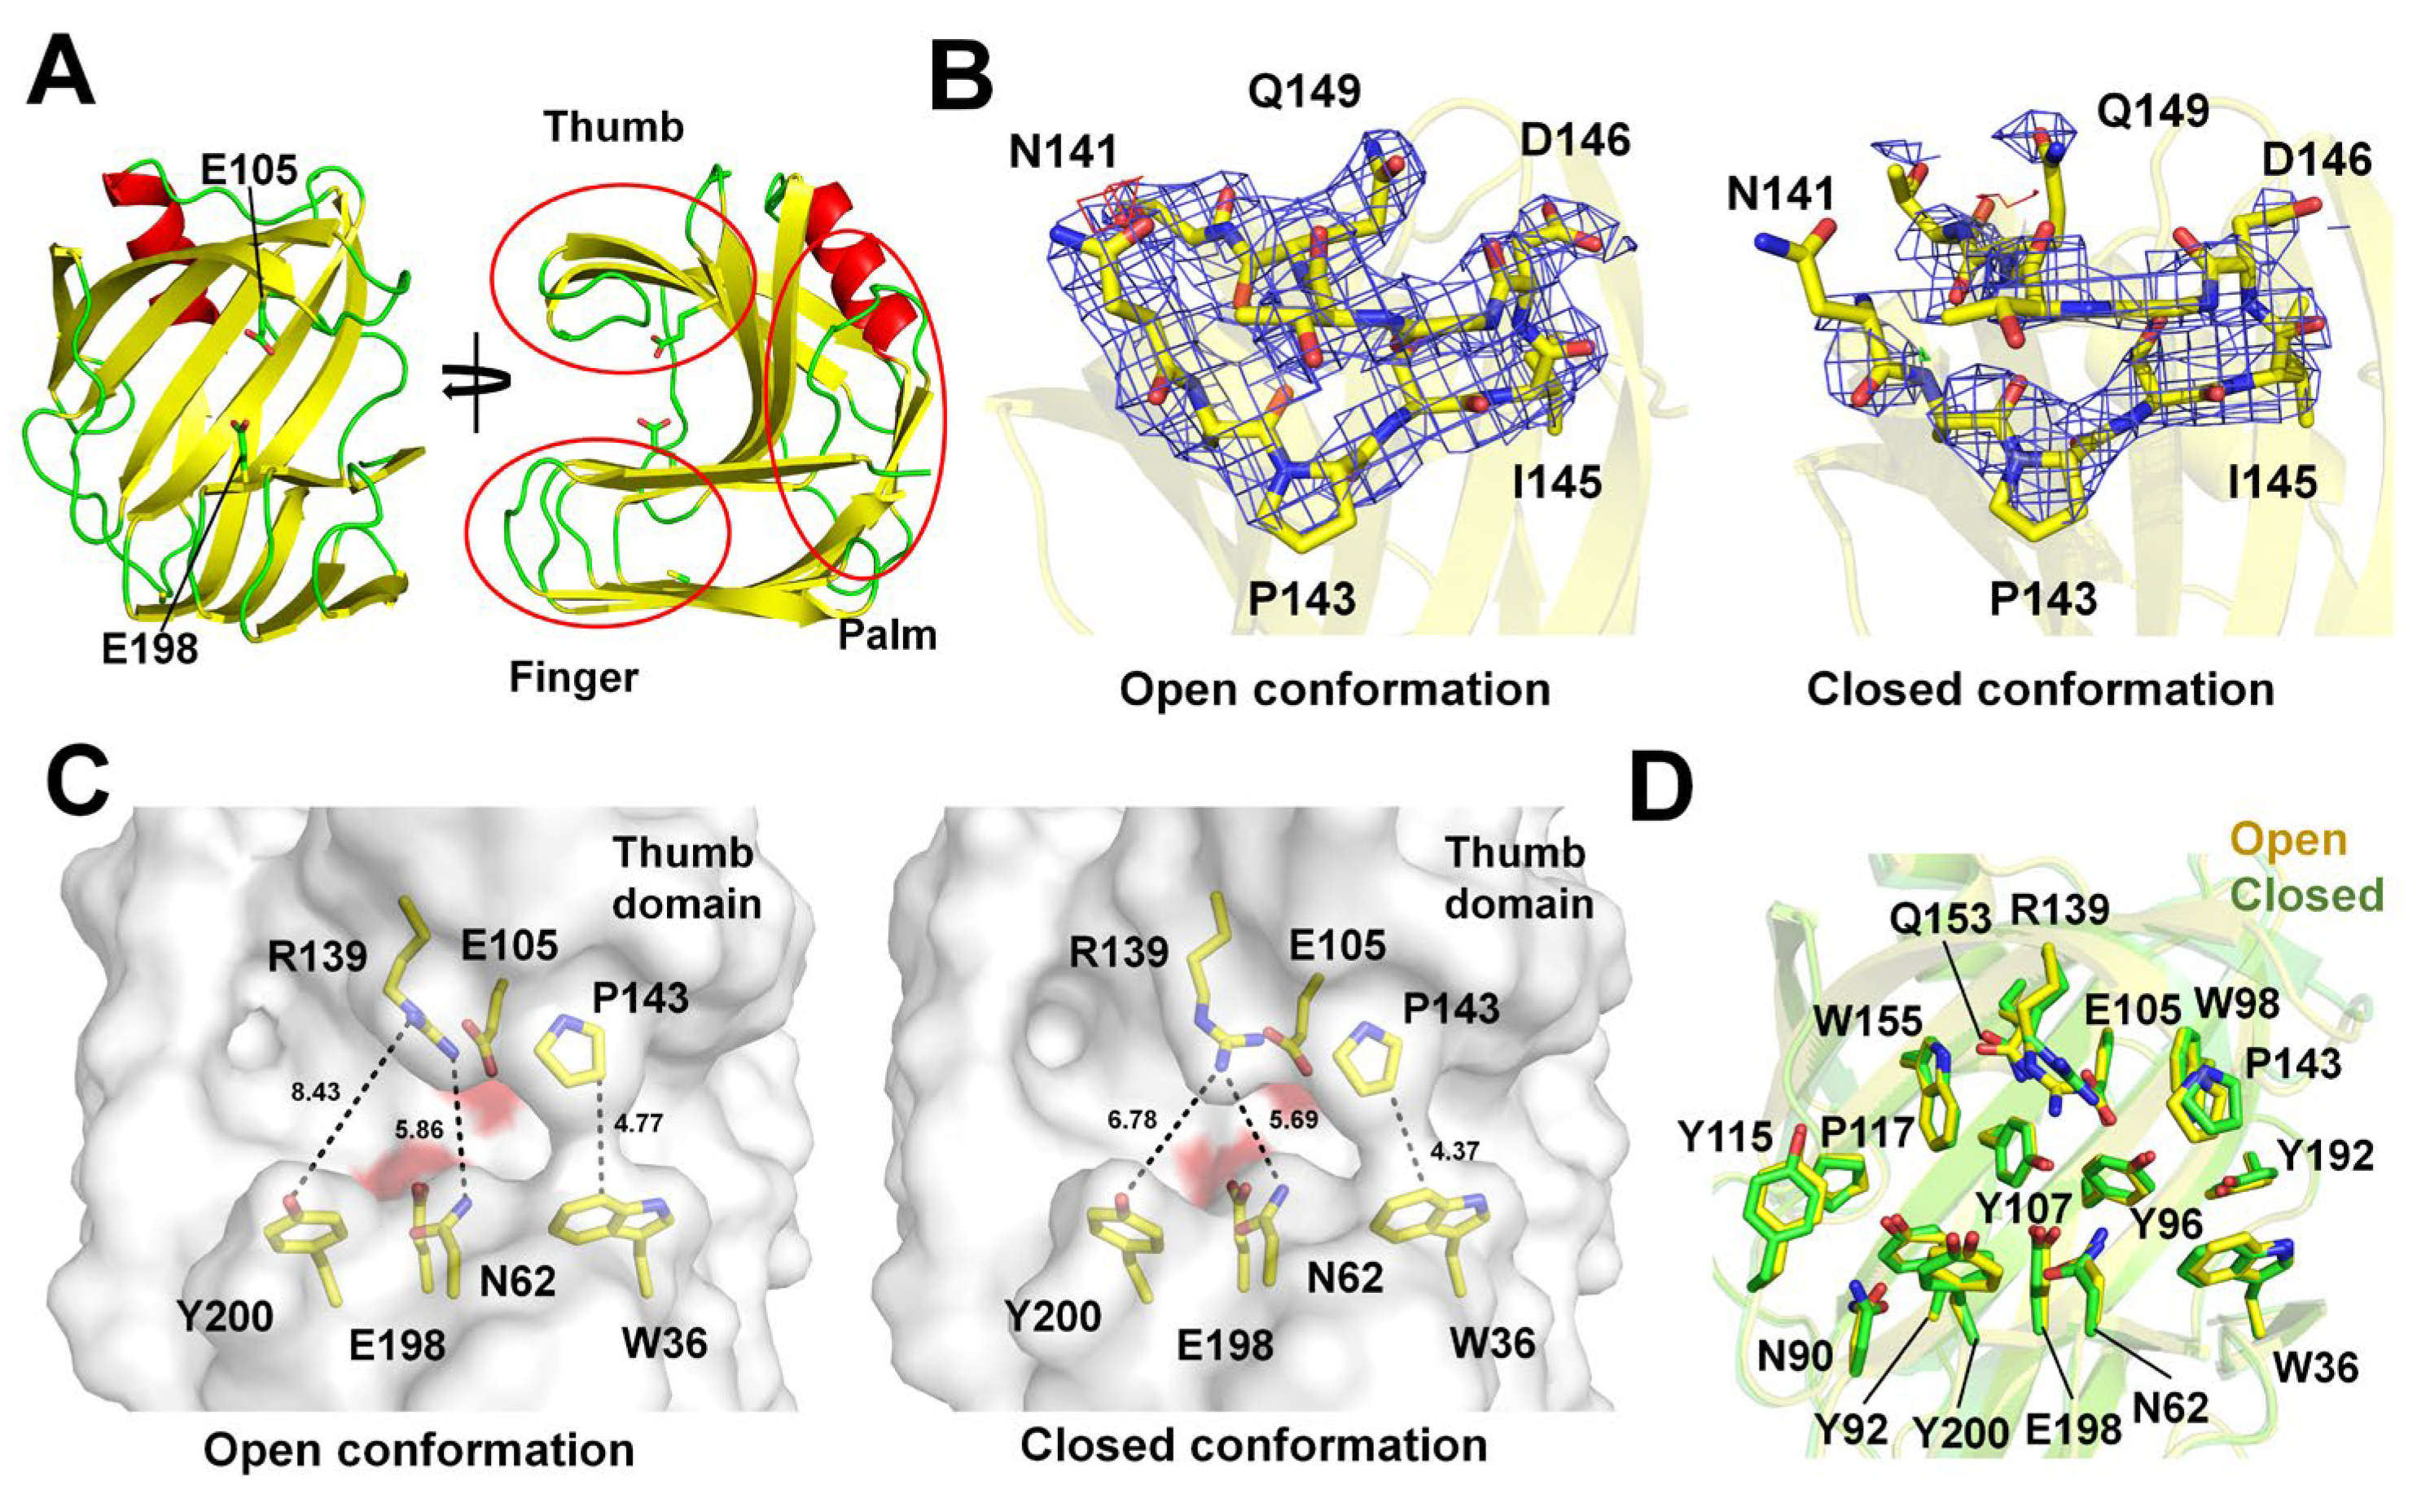
The TsaGH11 formed a typical β-sandwich fold resembling a right hand comprising thumb, finger, and palm domains (Figure 2A), as reported previously [33]. Two TsaGH11 molecules were present in the asymmetric unit. The electron density map of the thumb domain of Molecule A of the RT-TsaGH11-MX is clearly defined, showing a rigid conformation due to the crystal packing effect (Figure 2B). However, the thumb domain of Molecule B of the RT-TsaGH11-MX is exposed to the solvent region in the crystal packing, and the electron density map is partially disordered (Figure 2B). The substrate-binding cleft is located between the thumb and finger domains of the TsaGH11. Molecule A (the open conformation) exhibits a relatively wide substrate-binding cleft between the thumb and finger domains compared with that of Molecule B (the closed conformation) (Figure 2C). These two distinct conformations of the TsaGH11 molecules in the asymmetric unit have also been observed in structures that have been previously reported for RT-TsaGH11-SSX and Cryo-TesGH11-MX, but the detailed conformation and molecular flexibility are distinct (see below).
The superimposition of the open and closed conformations of the RT-TsaGH11-SSX has a root mean square deviation (RMSD) of 0.292 Å (Figure 2D). A subtle movement of the side chains of the catalytic active site residues (Glu105 and Glu198) and the substrate-binding residues (Asn62, Asn90, Tyr92, Tyr96, Trp98, Glu105, Tyr107, Tyr115, Pro117, Arg139, Pro143, Gln153, Trp155, Tyr192, Glu198, and Tyr200) between the open and closed conformations of the RT-TsaGH11-MX was observed (Figure 2D). In particular, a significant change in the side chain conformation of Arg139 was observed, affecting the interspace of the substrate-binding cleft. In the open conformation, the NH1 and NH2 atoms of the Arg139 are separated from the hydroxyl group of the Tyr200 and the NH1 atom of the Asn62 by distances of 8.43 and 5.86 Å, respectively (Figure 2C). The distance between the CB atom of the Pro143 and the CZ2 atom of the Trp36 is 4.77 Å. In the closed conformation, the NH2 atom of the Arg139 is separated from the hydroxyl group of the Tyr200 and the NH1 atom of the Asn62 by distances of 6.78 and 5.69 Å, respectively. The distance between the CB atom of the Pro143 and the CZ2 atom of the Trp36 is 4.33 Å (Figure 2C).
3.3. Comparison of the Open Conformation of the TsaGH11 Structures
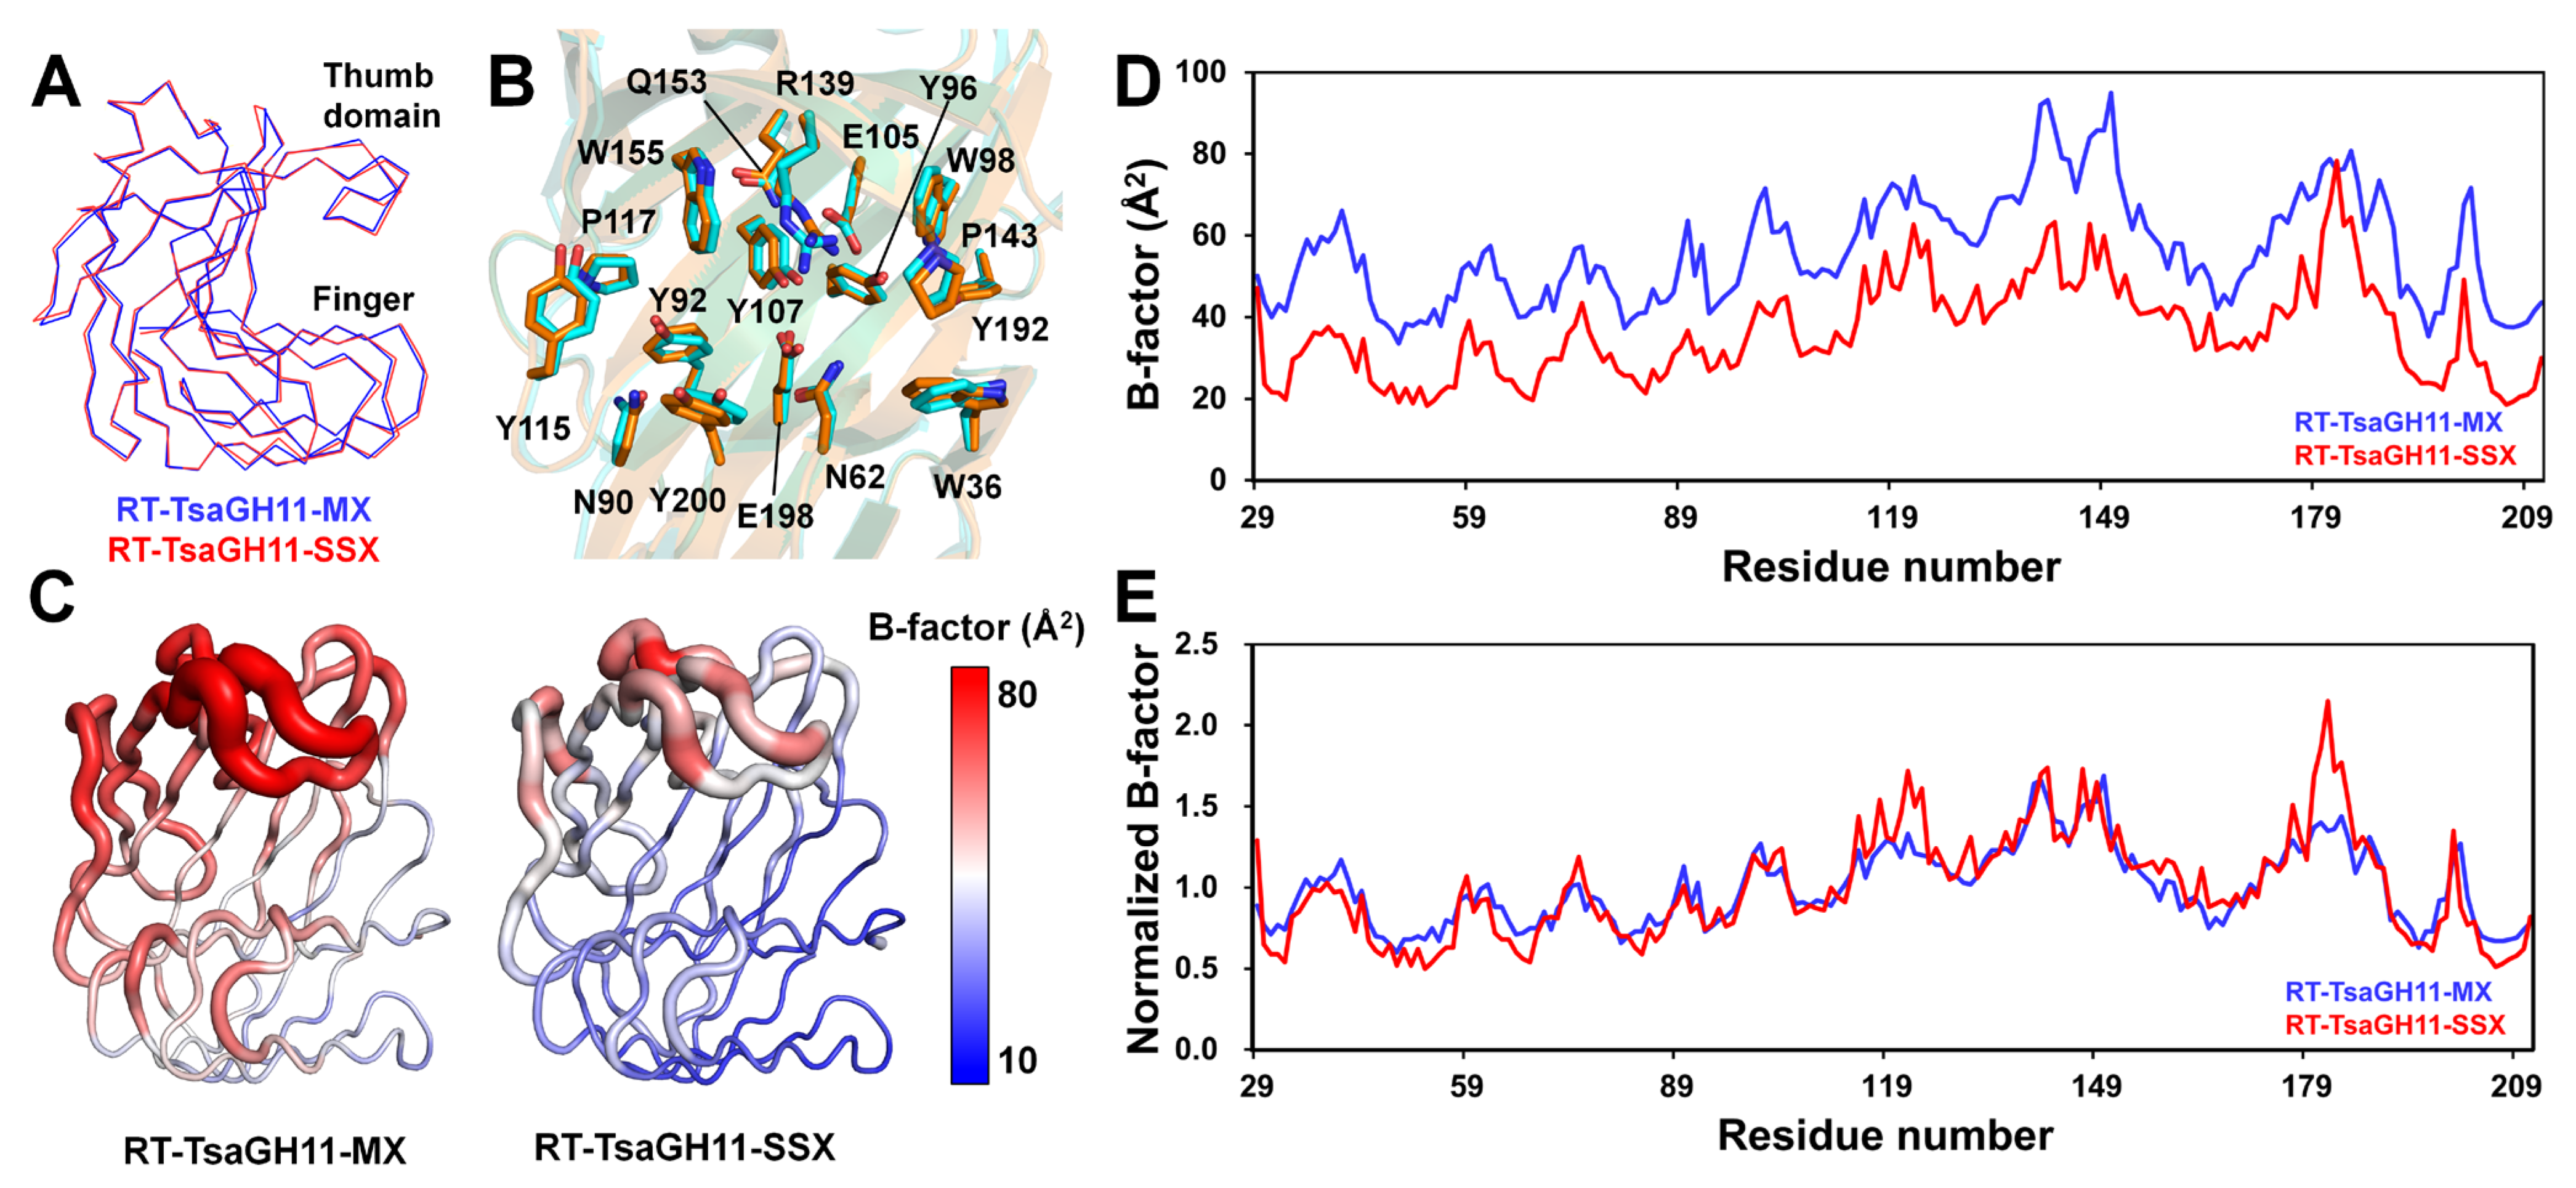
To analyze the structural differences according to the data collection techniques, the open and closed conformations of the RT-TsaGH11-MX and RT-TsaGH11-SSX were compared. The superimposition of the open conformation of the RT-TsaGH11-MX with RT-TsaGH11-SSX (PDB code: 8IH1) had an RMSD of 0.337 Å (Figure 3A). A positional difference in the main chain between the RT-TsaGH11-MX and RT-TsaGH11-SSX was observed (Figure 3A). The superimposed structures of the catalytic and substrate-binding cleft of the RT-TsaGH11 revealed the distinct positions of the side chains (Figure 3B), likely resulting from subtle movements of the main chain and conformational changes in the side chains of the RT-TsaGH11 (Table 2). In particular, the side chain of the Arg139 exhibited a significantly different conformation (Figure 3B). The distance between the two catalytic residues (Glu105 and Glu198) of the RT-TsaGH11-MX and RT-TsaGH11-SSX is 5.65 and 5.41 Å, respectively. The distance between the Cα atom and the OE1 atom position of the Glu105 between the RT-TsaGH11-MX and RT-TsaGH11-SSX is 0.28 and 0.65 Å, respectively. The distance between the Cα atom and the OE2 atom position of the Glu198 between the TsaGH11-MX and TsaGH11-SSX is 0.16 and 0.27 Å, respectively. The subtle movement of the Cα atom and the side chain of the substrate-binding residues between the closed conformation RT-TsaGH11-MX and RT-TsaGH11-SSX is 0.16–1.16 and 0.22–1.29 Å, respectively (Table 2). The B-factor putty representation and B-factor plots clearly show an overall B-factor indicative of a higher flexibility in the RT-TsaGH11-MX than in the RT-TsaGH11-SSX (Figure 3C,D). In the normalized B-factor analysis, the surroundings of Asn88 in the finger domain and Arg139–Gln149 in the thumb domain in the RT-TsaGH11-MX exhibited lower B-factors than those in the RT-TsaGH11-SSX (Figure 3E). Consequently, differences are present in the molecular flexibility between the open conformations of the RT-TsaGH11-MX and RT-TsaGH11-SSX.
3.4. Comparison of the Closed Conformation of the TsaGH11 Structures
The superimposition of the closed conformation of the RT-TsaGH11-MX with the RT-TsaGH11-SSX had an RMSD of 0.369 Å. A positional difference in the main chain between the RT-TsaGH11-MX and RT-TsaGH11-SSX was observed (Figure 4A). The superimposed structures of the catalytic and substrate-binding clefts of the closed conformation of the RT-TsaGH11 revealed the distinct positions of the side chains (Figure 4B and Table 3). In particular, the side chains of the Arg139 and Tyr200 exhibited significantly different conformations (Figure 3B). The distance between the two catalytic residues of the RT-TsaGH11-MX and RT-TsaGH11-SSX is 5.65 and 5.41 Å, respectively. The distance between the Cα atom and the OE2 atom of the Glu105 between the RT-TsaGH11-MX and RT-TsaGH11-SSX is 0.25 and 0.28 Å, respectively. The distance between the Cα atom and the OE2 atom of the Glu198 between the TsaGH11-MX and TsaGH11-SSX is 0.27 and 0.57 Å, respectively. The subtle movement of the Cα atom and the side chain of substrate-binding residues between the closed conformation of the RT-TsaGH11-MX and RT-TsaGH11-SSX is in the range of 0.13–0.59 and 0.21–1.71 Å, respectively (Table 3). The overall B-factor of the RT-TsaGH11-MX indicates that this has a higher flexibility than the RT-TsaGH11-SSX (Figure 3C,D). Moreover, in the normalized B-factor analysis, the surroundings of the Met122 in the linker region between the thumb and figure domains and the His182 in the thumb domain in the RT-TsaGH11-SSX exhibited higher B-factors than those of the RT-TsaGH11-MX (Figure 3E). Consequently, the molecular flexibility differs significantly between the closed conformations of the RT-TsaGH11-MX and RT-TsaGH11-SSX.
4. Discussion
The room temperature structure of a macromolecule is important because this provides biologically relevant structural information compared with the structures determined at cryogenic temperatures. Traditional MX techniques have long been used to determine the room temperature crystal structures, and, recently, such structures obtained via serial crystallography techniques have been gaining attention. In theory, the room temperature structure collected with MX is potentially limited by radiation damage and X-ray heating, but the extent to which this affects the structure is poorly understood. In this study, the room temperature crystal structure obtained using MX was compared with that obtained using SSX.
In this experiment, the diffraction data were collected from TsaGH11 crystals as a model sample at room temperature using the MX technique. When exposed to X-rays, radicals are generated not only in the crystal but also in the solution surrounding the crystal, which can increase the radiation damage to the sample. In addition, when X-rays are exposed to the crystal sample, the temperature in the solution increases, potentially raising the temperature environment of the crystal sample above room temperature. However, when crystals are exposed to the atmosphere, dehydration of the crystals occurs, which can affect the space group changes in the crystals [43]. To solve this problem, dehydration can be reduced by covering the crystal with a material such as oil [16], but this may perturb the protein structure. Accordingly, to minimize the influence of the crystallization solution, the TsaGH11 crystal was exposed on a nylon loop in an ambient environment during the data collection. This approach potentially reduces radiation damage and heating effects from the solution and the structural perturbations caused by the addition of organic solvent to avoid dehydration but may consequently produce dehydration effects.
The RT-TsaGH11-MX and RT-TsaGH11-SSX were collected in the same temperature environment but showed significant structural differences in the position and flexibility of their amino acids. This will depend on the radiation damage during the data collection and the X-rays and crystals for the MX and SSX techniques.
In the RT-TsaGH11-SSX experiment, one crystal volume was exposed to X-rays for only 100 ms [33], and the predicted average diffraction weighted dose and average doses (in the exposed region) received from a crystal in the SSX were 0.21 and 0.10 MGy, respectively. In the MX, a single crystal was exposed for 100 ms per 1°, and the diffraction data rotated 180° were used. Consequently, in the MX, a single crystal was exposed to 180-fold more X-rays than in the SSX and contained more radiation damage information. The predicted average diffraction weighted dose and average doses (in the exposed region) of the RT-TsaGH11-MX were 5.02 and 1.65 MGy, respectively. The relatively higher dose accumulation of the RT-TsaGH11-MX compared to that of the RT-TsaGH11-SSX, therefore, caused more radiation damage to the crystal, which is considered to have increased the B-factor and lowered the accuracy of the structure.
In addition, in the MX, the center of the crystal was aligned with the X-ray beam pass and continued to be exposed to X-rays during the data collection. Thus, the radiation damage increased in areas where the X-ray crystals were continuously exposed. In a previous study, when X-rays with a photon flux of 1012 per s were exposed to a capillary containing water, a crystallization solution, and a crystal suspension in a glass tube, the temperature in the vicinity of the X-ray interaction point increased by approximately 1 °C [24]. The temperature increase caused by X-ray exposure can vary depending on factors such as photon flux, photon density, and the materials exposed to the X-rays. Although the temperature at the X-ray exposure region in the RT-TsaGH11-MX could not be directly measured, the center of the crystal was exposed to X-rays for 18 s, thereby theoretically raising the temperature of the RT-TsaGH11-MX higher than the sample environment temperature.
From a theoretical perspective, the structure of the RT-TsaGH11-SX provides more biologically relevant structural information than that of the RT-TsaGH11-MX. The structural information obtained from the RT-TsaGH11-MX tentatively includes the flexibility, motion, and rigidity of the molecules with minimal biological relevance due to the radiation damage and X-ray heating. The RT-TsaGH11-MX can be tentatively used to analyze the overall structure of the TsaGH11 and to study radiation damage or X-ray heating effects, but it cannot be concluded that it is a structure with a high accuracy at room temperature.
Accordingly, the SSX-based room temperature structure determination is biologically preferable to the MX in terms of the radiation damage and X-ray heating. However, the SSX requires a large number of crystal samples, which may limit experimental approaches. In such cases, small wedge serial crystallography methods may be applied to enable the data collection while reducing the crystal sample consumption. However, if obtaining crystal samples is difficult, the application of MX may need to be reconsidered. To determine the protein structures at room temperature using the MX, a data collection strategy can be implemented in a way that minimizes the effects of radiation damage and X-ray heating. In this study, the room temperature structures were collected using the single-point data collection method, which potentially has disadvantages in terms of radiation damage or X-ray heating because the center of the crystal is continuously exposed to X-rays. This radiation damage and these X-ray heating effects can be reduced using helical scans or offset geometries instead of using single-point data collection methods. However, to collect data using these geometries, the size of the crystals must be larger than that of the X-rays. In addition, the data must be collected in an environment that supports a hydrated state while minimizing the radiation damage and X-ray heating caused by the solvent.
5. Conclusions
This study demonstrated that the protein structures determined at room temperature via MX differ from those determined via SSX. These differences are believed to be caused by factors such as radiation damage, X-ray heating, and the effects of the environment on the data collection. These results will potentially guide considerations regarding the reliability of room temperature structures collected using MX techniques.
Funding
This work was funded by the National Research Foundation of Korea (NRF) (NRF-2021R1I1A1A01050838).
Data Availability Statement
The structure factor and coordinates are deposited in the protein data bank (www.rcsb.org) with PDB code 8YEA.
Acknowledgments
I would like to thank the beamline staff at the 11C beamline at the Pohang Accelerator Laboratory for their assistance with the data collection.
Conflicts of Interest
The author declares no conflict of interest.
References
- Bose, K.; Rathore, I.; Mishra, V.; Bhaumik, P. Advancements in macromolecular crystallography: From past to present. Emerg. Top. Life Sci. 2021, 5, 127–149. [Google Scholar] [CrossRef] [PubMed]
- Jaskolski, M.; Dauter, Z.; Wlodawer, A. A brief history of macromolecular crystallography, illustrated by a family tree and its Nobel fruits. FEBS J. 2014, 281, 3985–4009. [Google Scholar] [CrossRef] [PubMed]
- Shi, Y. A Glimpse of Structural Biology through X-Ray Crystallography. Cell 2014, 159, 995–1014. [Google Scholar] [CrossRef] [PubMed]
- Wlodawer, A.; Minor, W.; Dauter, Z.; Jaskolski, M. Protein crystallography for aspiring crystallographers or how to avoid pitfalls and traps in macromolecular structure determination. FEBS J. 2013, 280, 5705–5736. [Google Scholar] [CrossRef] [PubMed]
- Maveyraud, L.; Mourey, L. Protein X-ray Crystallography and Drug Discovery. Molecules 2020, 25, 1030. [Google Scholar] [CrossRef] [PubMed]
- Carvalho, A.L.; Trincão, J.; Romão, M.J. X-Ray Crystallography in Drug Discovery. In Ligand-Macromolecular Interactions in Drug Discovery; Methods in Molecular Biology; Humana: Totowa, NJ, USA, 2010; pp. 31–56. [Google Scholar]
- Blundell, T.L.; Patel, S. High-throughput X-ray crystallography for drug discovery. Curr. Opin. Pharmacol. 2004, 4, 490–496. [Google Scholar] [CrossRef]
- Kim, I.J.; Kim, S.R.; Bornscheuer, U.T.; Nam, K.H. Engineering of GH11 Xylanases for Optimal pH Shifting for Industrial Applications. Catalysts 2023, 13, 1405. [Google Scholar] [CrossRef]
- Wang, Y.; Yu, L.; Shao, J.; Zhu, Z.; Zhang, L. Structure-driven protein engineering for production of valuable natural products. Trends Plant Sci. 2023, 28, 460–470. [Google Scholar] [CrossRef]
- Li, C.; Zhang, R.; Wang, J.; Wilson, L.M.; Yan, Y. Protein Engineering for Improving and Diversifying Natural Product Biosynthesis. Trends Biotechnol. 2020, 38, 729–744. [Google Scholar] [CrossRef]
- Garman, E.F.; Schneider, T.R. Macromolecular Cryocrystallography. J. Appl. Crystallogr. 1997, 30, 211–237. [Google Scholar] [CrossRef]
- Pflugrath, J.W. Practical macromolecular cryocrystallography. Acta Crystallogr. F Struct. Biol. Commun. 2015, 71, 622–642. [Google Scholar] [CrossRef] [PubMed]
- Vera, L.; Stura, E.A. Strategies for Protein Cryocrystallography. Cryst. Growth Des. 2013, 14, 427–435. [Google Scholar] [CrossRef]
- Thorne, R.E. Determining biomolecular structures near room temperature using X-ray crystallography: Concepts, methods and future optimization. Acta Crystallogr. D Biol. Crystallogr. 2023, 79, 78–94. [Google Scholar] [CrossRef] [PubMed]
- Dong, Y.-W.; Liao, M.-L.; Meng, X.-L.; Somero, G.N. Structural flexibility and protein adaptation to temperature: Molecular dynamics analysis of malate dehydrogenases of marine molluscs. Proc. Natl. Acad. Sci. USA 2018, 115, 1274–1279. [Google Scholar] [CrossRef] [PubMed]
- Fischer, M. Macromolecular room temperature crystallography. Q. Rev. Biophys. 2021, 54, e12021. [Google Scholar] [CrossRef]
- McPherson, A.; Gavira, J.A. Introduction to protein crystallization. Acta Crystallogr. F Struct. Biol. Commun. 2013, 70, 2–20. [Google Scholar] [CrossRef]
- Smyth, M.S.; Martin, J.H. X ray crystallography. Mol. Pathol. 2000, 53, 8–14. [Google Scholar] [CrossRef]
- Shelley, K.L.; Garman, E.F. Quantifying and comparing radiation damage in the Protein Data Bank. Nat. Commun. 2022, 13, 1314. [Google Scholar] [CrossRef]
- Nam, K.H. Radiation Damage on Thaumatin: A Case Study of Crystals That Are Larger Than the Microfocusing X-ray Beam. Appl. Sci. 2023, 13, 1876. [Google Scholar] [CrossRef]
- Garman, E.F. Radiation damage in macromolecular crystallography: What is it and why should we care? Acta Crystallogr. D Biol. 2010, 66, 339–351. [Google Scholar] [CrossRef] [PubMed]
- Nave, C. Radiation damage in protein crystallography. Radiat. Phys. Chem. 1995, 45, 483–490. [Google Scholar] [CrossRef]
- Sanishvili, R.; Yoder, D.W.; Pothineni, S.B.; Rosenbaum, G.; Xu, S.; Vogt, S.; Stepanov, S.; Makarov, O.A.; Corcoran, S.; Benn, R.; et al. Radiation damage in protein crystals is reduced with a micron-sized X-ray beam. Proc. Natl. Acad. Sci. USA 2011, 108, 6127–6132. [Google Scholar] [CrossRef] [PubMed]
- Kim, J.; Nam, K.H. X-ray-Induced Heating in the Vicinity of the X-ray Interaction Point. Appl. Sci. 2023, 13, 717. [Google Scholar] [CrossRef]
- Nam, K.H. Guide to serial synchrotron crystallography. Curr. Res. Struct. Biol. 2024, 7, 100131. [Google Scholar] [CrossRef] [PubMed]
- Martin-Garcia, J.M.; Conrad, C.E.; Coe, J.; Roy-Chowdhury, S.; Fromme, P. Serial femtosecond crystallography: A revolution in structural biology. Arch. Biochem. Biophys. 2016, 602, 32–47. [Google Scholar] [CrossRef]
- Barends, T.R.M.; Stauch, B.; Cherezov, V.; Schlichting, I. Serial femtosecond crystallography. Nat. Rev. Methods Primers 2022, 2, 59. [Google Scholar] [CrossRef]
- Orville, A.M. Recent results in time resolved serial femtosecond crystallography at XFELs. Curr. Opin. Struct. Biol. 2020, 65, 193–208. [Google Scholar] [CrossRef]
- Martin-Garcia, J.M. Protein Dynamics and Time Resolved Protein Crystallography at Synchrotron Radiation Sources: Past, Present and Future. Crystals 2021, 11, 521. [Google Scholar] [CrossRef]
- Hejazian, M.; Balaur, E.; Abbey, B. Recent Advances and Future Perspectives on Microfluidic Mix-and-Jet Sample Delivery Devices. Micromachines 2021, 12, 531. [Google Scholar] [CrossRef]
- Park, J.; Nam, K.H. Recent chemical mixing devices for time-resolved serial femtosecond crystallography. TrAC Trends Anal. Chem. 2024, 172, 117554. [Google Scholar] [CrossRef]
- Walia, A.; Guleria, S.; Mehta, P.; Chauhan, A.; Parkash, J. Microbial xylanases and their industrial application in pulp and paper biobleaching: A review. 3 Biotech 2017, 7, 11. [Google Scholar] [CrossRef] [PubMed]
- Kim, I.J.; Kim, S.R.; Kim, K.H.; Bornscheuer, U.T.; Nam, K.H. Characterization and structural analysis of the endo-1,4-β-xylanase GH11 from the hemicellulose-degrading Thermoanaerobacterium saccharolyticum useful for lignocellulose saccharification. Sci. Rep. 2023, 13, 17332. [Google Scholar] [CrossRef] [PubMed]
- Park, S.Y.; Ha, S.C.; Kim, Y.G. The Protein Crystallography Beamlines at the Pohang Light Source II. Biodesign 2017, 5, 30–34. [Google Scholar]
- Bury, C.S.; Brooks-Bartlett, J.C.; Walsh, S.P.; Garman, E.F. Estimate your dose: RADDOSE-3D. Protein Sci. 2018, 27, 217–228. [Google Scholar] [CrossRef] [PubMed]
- Otwinowski, Z.; Minor, W. Processing of X-ray diffraction data collected in oscillation mode. Methods Enzymol. 1997, 276, 307–326. [Google Scholar] [CrossRef]
- Vagin, A.; Teplyakov, A. Molecular replacement with MOLREP. Acta Crystallogr. D Biol. Crystallogr. 2010, 66, 22–25. [Google Scholar] [CrossRef]
- Casañal, A.; Lohkamp, B.; Emsley, P. Current developments in Coot for macromolecular model building of Electron Cryo-microscopy and Crystallographic Data. Protein Sci. 2020, 29, 1055–1064. [Google Scholar] [CrossRef]
- Liebschner, D.; Afonine, P.V.; Baker, M.L.; Bunkoczi, G.; Chen, V.B.; Croll, T.I.; Hintze, B.; Hung, L.W.; Jain, S.; McCoy, A.J.; et al. Macromolecular structure determination using X-rays, neutrons and electrons: Recent developments in Phenix. Acta Crystallogr. D Struct. Biol. 2019, 75, 861–877. [Google Scholar] [CrossRef]
- Williams, C.J.; Headd, J.J.; Moriarty, N.W.; Prisant, M.G.; Videau, L.L.; Deis, L.N.; Verma, V.; Keedy, D.A.; Hintze, B.J.; Chen, V.B.; et al. MolProbity: More and better reference data for improved all-atom structure validation. Protein Sci. 2018, 27, 293–315. [Google Scholar] [CrossRef] [PubMed]
- Ravelli, R.B.G.; McSweeney, S.M. The ‘fingerprint’ that X-rays can leave on structures. Structure 2000, 8, 315–328. [Google Scholar] [CrossRef] [PubMed]
- Ravelli, R.B.G.; Theveneau, P.; McSweeney, S.; Caffrey, M. Unit-cell volume change as a metric of radiation damage in crystals of macromolecules. J. Synchrotron Radiat. 2002, 9, 355–360. [Google Scholar] [CrossRef] [PubMed]
- Sanchez-Weatherby, J.; Bowler, M.W.; Huet, J.; Gobbo, A.; Felisaz, F.; Lavault, B.; Moya, R.; Kadlec, J.; Ravelli, R.B.G.; Cipriani, F. Improving diffraction by humidity control: A novel device compatible with X-ray beamlines. Acta Crystallogr. D Biol. 2009, 65, 1237–1246. [Google Scholar] [CrossRef] [PubMed]
Figure 1.
X-ray diffraction data collection of TsaGH11 at room temperature by macromolecular crystallography. (A) TsaGH11 crystal mounted on the nylon loop during the X-ray diffraction data collection. The X-ray exposure region is at the center of the red dot circle. Plot of (B) I/sigma and (C) Rmerge values of the RT-TsaGH11-MX datasets.

Figure 2.
Overall structure of RT-TsaGH11-MX. (A) Cartoon representation of RT-TsaGH11-MX. Catalytic residues Glu105 and Glu198 are indicated by sticks. The thumb, finger, and palm domains of TsaGH11 are indicated by red circles. (B) 2mFo-DFc (blue mesh, 1σ) and mFo-DFc (green, 3σ; red, −3σ) electron density maps for the thumb domain of the open and closed conformations of TsaGH11. (C) Surface structure of the open and closed conformations of RT-TsaGH11-MX. The surfaces of the catalytic residues are colored red. (D) Superimposition of the open (yellow) and closed (green) conformations of RT-TsaGH11-MX.

Figure 3.
Structure and temperature factor comparison of the open conformations of RT-TsaGH11-MX and RT-TsaGH11-SSX (PDB code 8IH1). Superimposition of the (A) main chain and (B) substrate-binding sites of RT-TsaGH11-MX (cyan) and RT-TsaGH11-SSX (orange). (C) B-factor putty representation of RT-TsaGH11-MX and RT-TsaGH11-SSX. The cartoon thickness and color reflect the relative Cα B-factors within the molecule. (D) B-factor and (E) normalized B-factor plots of RT-TsaGH11-MX (Blue) and RT-TsaGH11-SSX (red).

Figure 4.
Structural comparison of the closed conformations of RT-TsaGH11-MX and RT-TsaGH11-SSX (PDB code 8IH1). Superimposition of the (A) main chain and (B) substrate-binding sites of RT-TsaGH11-MX (cyan) and RT-TsaGH11-SSX (orange). (C) B-factor putty representation of RT-TsaGH11-MX and RT-TsaGH11-SSX. The cartoon thickness and color reflect the relative Cα B-factors within the molecule. (D) B-factor and (E) normalized B-factor plots of RT-TsaGH11-MX (Blue) and RT-TsaGH11-SSX (red).


Table 1.
Data collection and refinement statistics.
| Data Collection | RT-TsaG11-MX |
|---|---|
| X-ray Source | 11C beamline, PLS II |
| X-ray energy (eV) | 14,820 |
| Space group | P43212 |
| Cell dimension a, b, c (Å) α, β, γ (°) | 69.89, 69.89, 170.42 90.0, 90.0, 90.0 |
| Resolution (Å) | 50.0–2.85 (2.90–2.85) |
| Unique reflections | 10,422 (459) |
| Completeness (%) | 94.4 (88.3) |
| Redundancy | 6.0 (3.2) |
| I/σ | 9.2 (2.0) |
| Rmerge | 0.150 (0.293) |
| Rmeas | 0.161 (0.341) |
| Rpim | 0.056 (0.169) |
| CC1/2 | 1.006 (0.782) |
| CC* | 1.002 (0.937) |
| Refinement | |
| Resolution (Å) | 47.67–2.85 (3.00–2.85) |
| Rwork a | 0.1832 (0.2100) |
| Rfree b | 0.2562 (0.2748) |
| R.m.s. deviations | |
| Bonds (Å) | 0.008 |
| Angles (°) | 0.920 |
| B factors (Å2) | |
| Protein chain A | 36.75 |
| Protein chain B | 56.20 |
| Ramachandran plot | |
| Favored (%) | 93.92 |
| Allowed (%) | 5.52 |
| Outliers (%) | 0.55 |
Values for the outer shell are given in parentheses. a Rwork = Σ||Fobs|Σ|Fcalc||/Σ|Fobs|, where Fobs and Fcalc are the observed and calculated structure factor amplitudes, respectively. b Rfree was calculated as Rwork using a randomly selected subset (10%) of unique reflections not used for structural refinement.
Table 2.
Subtle movement of residues between the open conformations of RT-TsaGH11-MX and RT-TsaGH11-SSX.
Table 2.
Subtle movement of residues between the open conformations of RT-TsaGH11-MX and RT-TsaGH11-SSX.
| Residue | Distance (Å) | Residue | Distance (Å) | ||
|---|---|---|---|---|---|
| Cα Atom | Side Chain (Atom) | Cα Atom | Side Chain (Atom) | ||
| Trp36 | 0.39 | 0.78 (NE1) | Pro117 | 0.23 | 0.22 (CB) |
| Asn62 | 0.37 | 0.56 (CG) | Arg139 | 0.42 | 1.29 (NH1) |
| Asn90 | 0.27 | 0.66 (ND2) | Pro143 | 1.16 | 1.27 (CG) |
| Tyr92 | 0.20 | 0.40 (OH) | Qln153 | 0.35 | 0.61 (CD) |
| Tyr96 | 0.18 | 0.60 (OH) | Trp155 | 0.30 | 0.72 (CZ2) |
| Trp98 | 0.25 | 0.40 (CH2) | Tyr192 | 0.18 | 0.58 (OH) |
| Glu105 | 0.28 | 0.65 (OE1) | Glu198 | 0.16 | 0.27 (OE2) |
| Tyr107 | 0.27 | 0.60 (OH) | Tyr200 | 0.36 | 0.35 (OH) |
| Tyr115 | 0.21 | 0.75 (OH) | |||
Table 3.
Subtle movement of the residues between the closed conformations of RT-TsaGH11-MX and RT-TsaGH11-SSX.
Table 3.
Subtle movement of the residues between the closed conformations of RT-TsaGH11-MX and RT-TsaGH11-SSX.
| Residue | Distance (Å) | Residue | Distance (Å) | ||
|---|---|---|---|---|---|
| Cα Atom | Side Chain (Atom) | Cα Atom | Side Chain (Atom) | ||
| Trp36 | 0.18 | 0.92 (CZ3) | Pro117 | 0.59 | 0.65 (CB) |
| Asn62 | 0.25 | 0.31 (CG) | Arg139 | 0.27 | 1.25 (NH1) |
| Asn90 | 0.38 | 0.61(CG) | Pro143 | 0.49 | 0.53 (CG) |
| Tyr92 | 0.15 | 0.71 (CE2) | Qln153 | 0.15 | 0.45 (CD) |
| Tyr96 | 0.13 | 0.21 (OH) | Trp155 | 0.17 | 0.45(CZ2) |
| Trp98 | 0.17 | 0.55 (CH2) | Tyr192 | 0.33 | 0.35 (OH) |
| Glu105 | 0.20 | 0.28 (OE2) | Glu198 | 0.27 | 0.57 (OE2) |
| Tyr107 | 0.25 | 0.69 (OH) | Tyr200 | 0.58 | 1.71 (OH) |
| Tyr115 | 0.37 | 0.87 (OH) | |||
Disclaimer/Publisher’s Note: The statements, opinions and data contained in all publications are solely those of the individual author(s) and contributor(s) and not of MDPI and/or the editor(s). MDPI and/or the editor(s) disclaim responsibility for any injury to people or property resulting from any ideas, methods, instructions or products referred to in the content. |
© 2024 by the author. Licensee MDPI, Basel, Switzerland. This article is an open access article distributed under the terms and conditions of the Creative Commons Attribution (CC BY) license (https://creativecommons.org/licenses/by/4.0/).
Share and Cite
MDPI and ACS Style
Nam, K.H. Comparative Analysis of Room Temperature Structures Determined by Macromolecular and Serial Crystallography. Crystals 2024, 14, 276. https://doi.org/10.3390/cryst14030276
AMA Style
Nam KH. Comparative Analysis of Room Temperature Structures Determined by Macromolecular and Serial Crystallography. Crystals. 2024; 14(3):276. https://doi.org/10.3390/cryst14030276
Chicago/Turabian StyleNam, Ki Hyun. 2024. "Comparative Analysis of Room Temperature Structures Determined by Macromolecular and Serial Crystallography" Crystals 14, no. 3: 276. https://doi.org/10.3390/cryst14030276
Note that from the first issue of 2016, this journal uses article numbers instead of page numbers. See further details here.