
Automatic Detection of Cast Billet Dendrite Based on Improved Hough Transform

School of Information Science and Engineering, Northeastern University, Shenyang 110819, China
*
Author to whom correspondence should be addressed.
Crystals 2024, 14(3), 265; https://doi.org/10.3390/cryst14030265
Submission received: 4 February 2024
/
Revised: 26 February 2024
/
Accepted: 6 March 2024
/
Published: 8 March 2024
(This article belongs to the Section Crystalline Metals and Alloys)
Abstract
:Primary dendrite information is one of the most important metrics to measure the quality of continuous cast slabs. The contrast of low magnification images is very low under the influence of illumination and sampling devices, so the traditional dendrite detection method has the problem of missed detections. We propose an automatic dendrite detection method based on an improved Hough transform, which effectively improves the accuracy and efficiency of primary dendrite detection. By using the local grayscale features of the image, a genetic algorithm-based local contrast enhancement algorithm is proposed. Compared with the traditional contrast enhancement algorithm, it can retain all the information of the dendrites. Combined with the image binarization method based on Hessian matrix, we can obtain more detailed information about the dendrites. According to the continuity and solidification characteristics of dendrites, the Hough transform is improved to extract dendrite information, which effectively reduces the computational cost of the Hough transform. The experimental results show that the method of this paper has versatility, and the error is four pixels compared with the manual method, which can provide a reliable basis for the subsequent judgement of the quality of cast billets.
1. Introduction
Continuous casting billets have a wide range of applications in the manufacturing industry [1,2]. Dendrites are a major solidification structure in the solidification process of continuous casting billets. The dendrite growth process is influenced by the solidification heat transfer and steel flow of the billet [3,4,5], and the actual direction of dendrite growth often deviates from the vertical direction [6]. There is a redistribution of solute between different phases during the growth of dendrites. As the solubility of solute elements in the solid phase of the billet is lower than that in the liquid phase, the growth of dendrites from the surface to the center of the billet during solidification is accompanied by the enrichment of solute elements between the walls of the dendrite arms and, finally, the formation of segregation [7]. The degree of segregation is determined by the solute equilibrium partition coefficient, which is governed by the temperature interval of the liquid–solid phase line. The faster the cooling rate, the more uneven the diffusion, and the more uneven the composition of the dendritic crystal. The unstable state of the dendrite is prone to defects, leading to ambiguous information about the dendrite spacing [8].
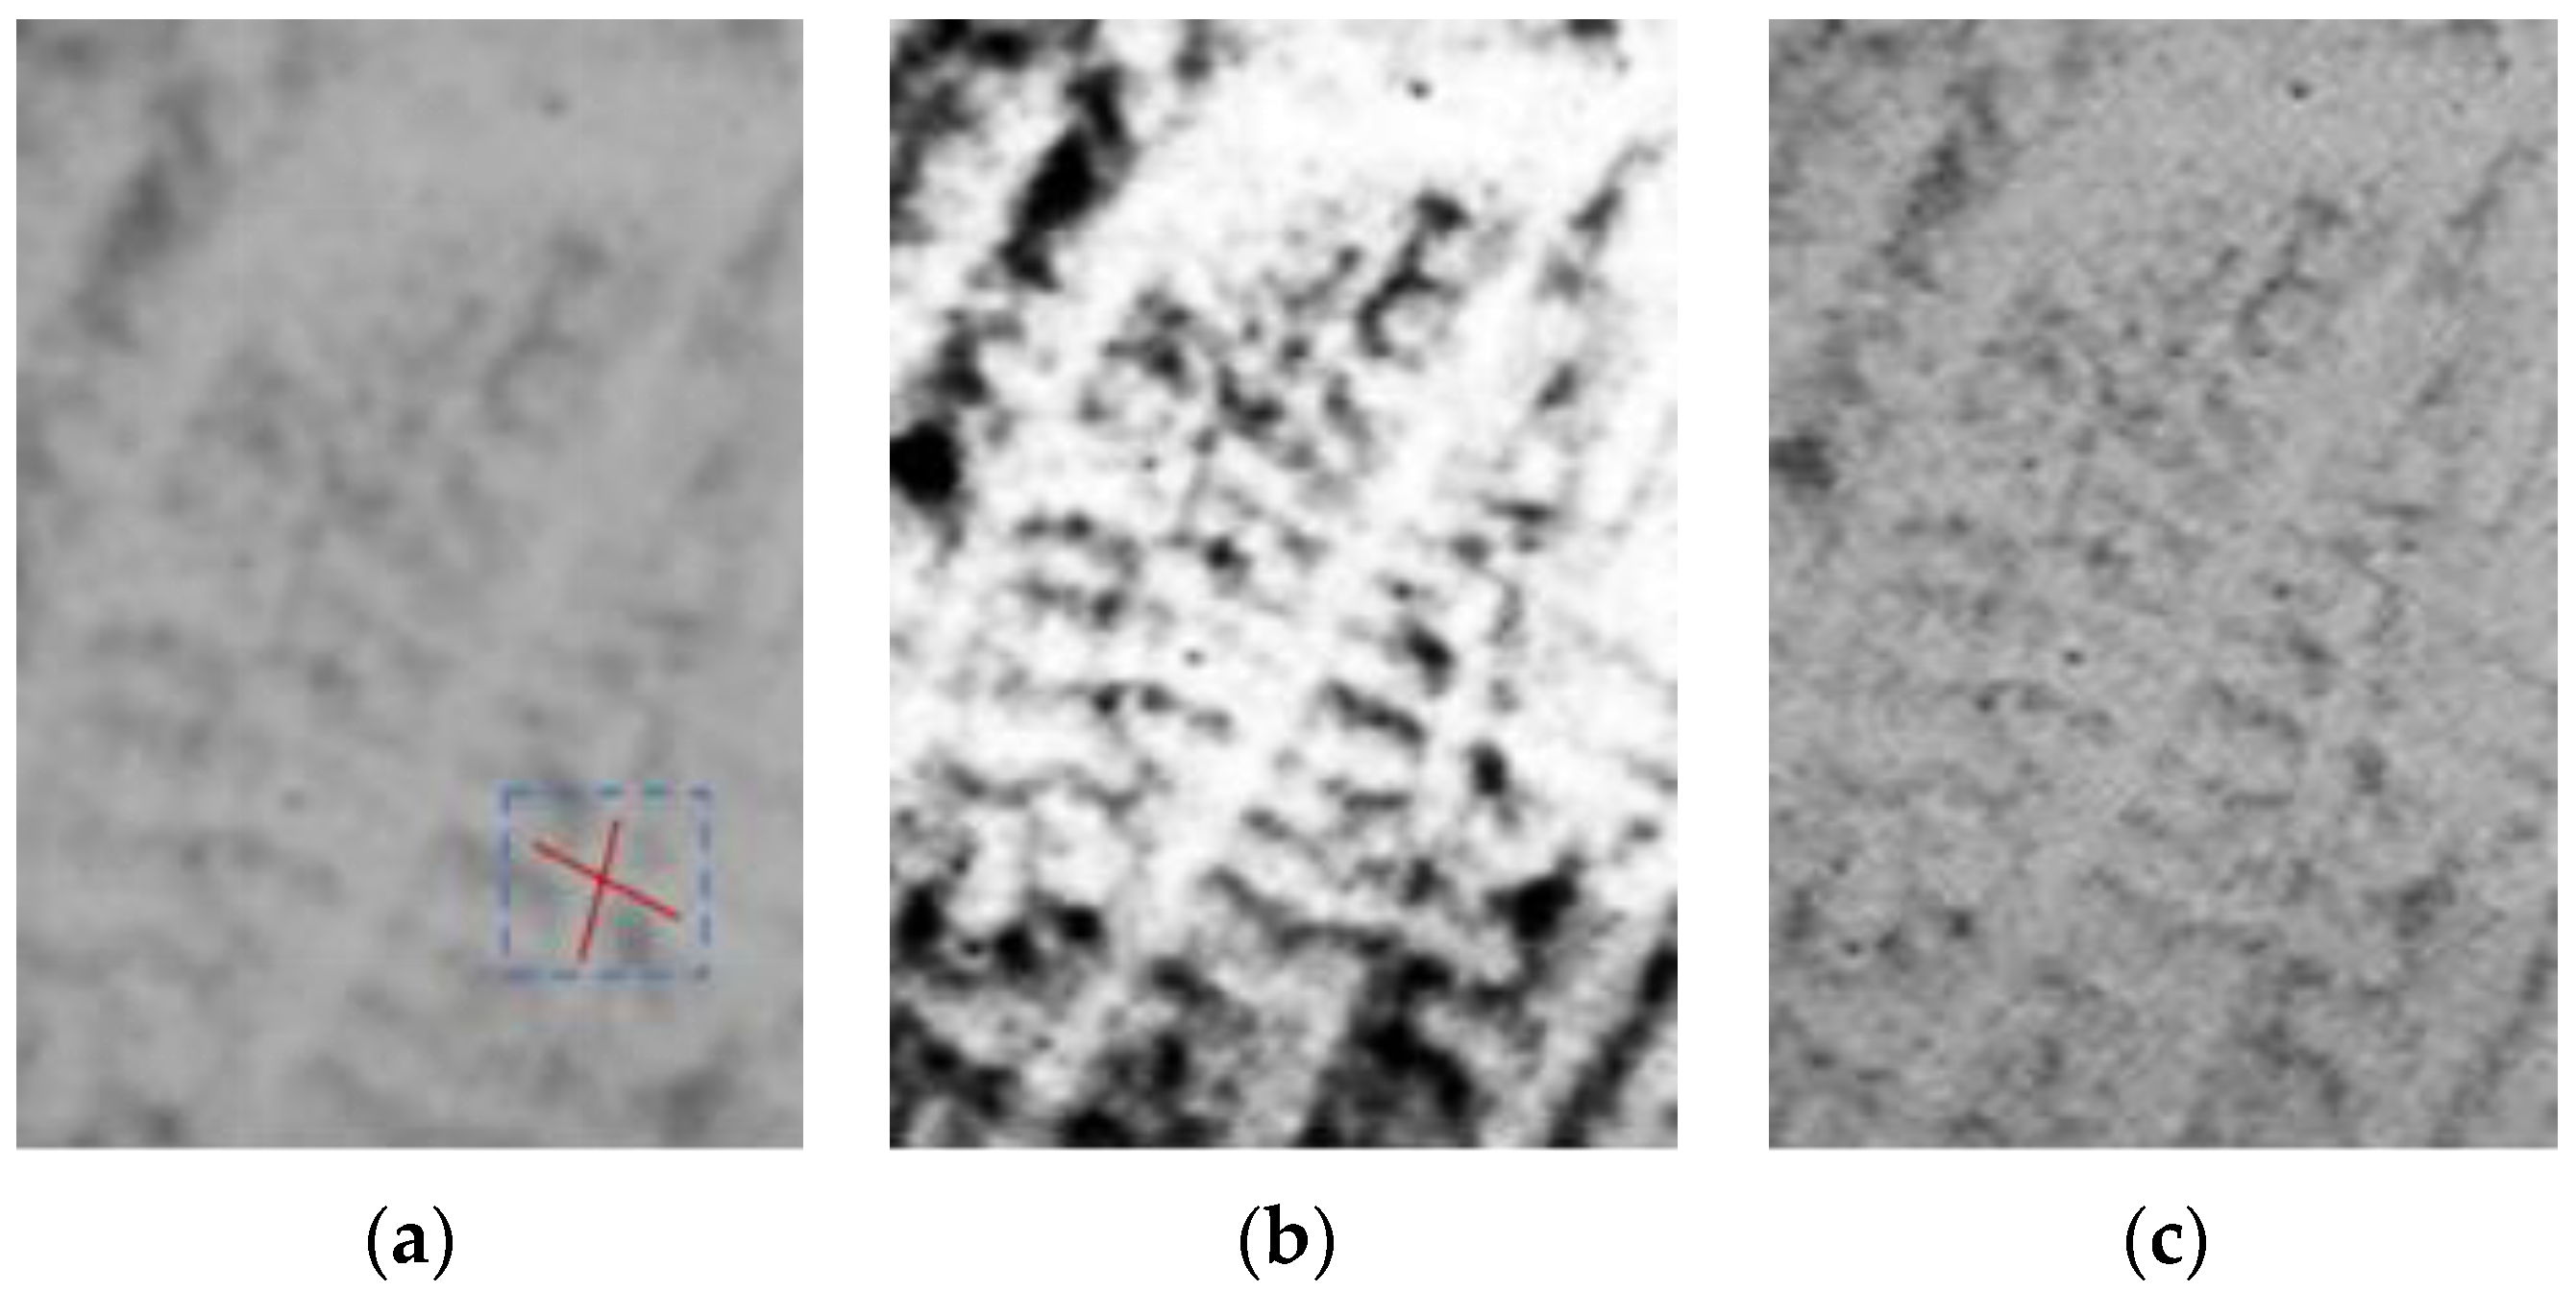
The primary dendrite arm spacing (PDAS) is the distance between two adjacent dendrite stems that are parallel to each other [9]. The PDAS characterizes the maximum length scale of alloy elemental segregation [10]. It was found that the PDAS has a large influence on the segregation and is directly related to the mechanical properties of the billet under the same solidification conditions [11,12,13,14,15,16]. Therefore, the study of PDAS can be used to evaluate the mechanical properties of continuous casting billets [17]. The national standard GB/T14999.7-2010 [18] specifies a method for the determination of PDAS in high-temperature alloy castings. The actual area of the specimen is converted via image magnification, and the average spacing of the primary dendrites in this field of view is calculated according to the formula. This method requires a professional to identify the number of points of dendritic centers in an image by the naked eye, and the results are influenced by objective factors and are less efficient. The traditional method of extracting dendrites from a continuous casting billet is to take a sample of the billet for corrosion, then take a photograph of the corroded sample to obtain a low magnification image where the dendrites can be seen, finally identifying the dendrite structure by the naked eye, and then calculate the primary dendrite arm spacing and dendrite growth angle with the aid of an instrument. The dendrite solidification structure has obvious features on the image, with a single dendrite in the form of a tree branch and the center of the dendrite in the form of a cross, as shown in Figure 1a.
The contrast of low magnification images is usually low, using the traditional histogram equalization method and Laplace algorithm to enhance dendrite images, for which the results are shown in Figure 1b,c; due to the small difference in grayscale between the dendrite region and the dendrite arm region, some of the dendrite information is lost in the enhanced image, it is difficult to identify the dendrite structures, and it takes a lot of time to measure manually [19].
The analysis of primary dendrite arm spacing characteristics by current researchers can be divided into studies of simulated images and studies of real images.
The study of simulated images is usually performed using numerical simulation methods. Numerical simulation techniques have been widely used in materials science, and researchers commonly use numerical simulation methods such as phase field methods, level sets, and meta cellular automata [20] to simulate the dendrite growth process and analyze the dendrite characteristics on the simulated images. Ci et al. developed a numerical model to predict the evolution of PDAS with additional manufacturing parameters and accurately predict the evolution of PDAS under pulsed laser process parameters [21]. Lee et al. proposed a coupled lattice Boltzmann method (LBM) cellular automata (CA) model that describes different types of dendrite formation under different solidification conditions (e.g., temperature gradients and growth rates) and can display dendrite morphology and quantitatively predict primary dendrite arm spacing [22]. Xue et al. proposed a coupled lattice Boltzmann method (LBM) cellular automata model that describes different types of dendrite formation under different solidification conditions (e.g., temperature gradients and growth rates) and can display dendrite morphology and quantitatively predict primary dendrite arm spacing. They used a cellular automata-finite difference (CA-FD) method to simulate the growth pattern of dendrites during directional solidification. The solute diffusion model was combined with a macroscopic temperature field model to predict the dendrite growth behavior [23]. Xiao et al. developed a multiscale model of transient heat transfer and phase field models to simulate solidification behavior and dendritic growth behavior in the melt pool and explored the relationship between the primary dendrite arm spacing and dendrite tip radius and the cooling rate [24]. Numerical simulation methods can simulate dendritic images from process parameters, but several boundary conditions are usually assumed, and the solution process is complex and computationally heavy.
Deep learning uses back propagation methods to adjust the parameters within the model and has been widely used in image recognition and segmentation [25]. Wang et al. proposed a new radiographic-based method to reduce the time required for microstructure data acquisition. It is used to achieve the in situ determination of specific regions during the solidification of thin samples. Deep learning methods based on the UNet and image processing methods were used to segment the microscopic images into dendrites [26]. Kaira et al. used a deep learning-based approach to segment micrographs of Al-Cu alloys by using TXM slices and corresponding manually segmented (individual) images as training inputs to the CNN model [27]. Wan et al. proposed a deep learning-based dendritic recognition algorithm that utilizes a faster test time enhancement R-CNN technique. Applying Voronoi surface segmentation in combination with a local multidirectional algorithm to compute a true local PDAS is more accurate and faster to detect than using Faster R-CNN alone for recognition [28]. Deep learning-based dendritic extraction methods have high accuracy results but usually require a large amount of data for training the model and require manual labeling of the data, which is costly and time-consuming.
Some researchers have made a lot of breakthroughs in the industrial detection industry by analyzing image features and applying image processing techniques to metal images [29,30,31]. Voronoi subdivision based on a spatial array of dendrite nuclei was used to determine the nearest neighbor and local dendrite arm spacing by Tschopp et al. [32,33]. Li et al. developed a fast Fourier transform (FFT) method for the quantitative analysis of dendrite structures in micrographs, which can determine the dendrite arm spacing (DAS) during directional solidification and enables rapid monitoring and control of the DAS [34]. Monroe et al. investigated a spacing transformed dendrite spacing measurement method. The images were preprocessed using the Otsu thresholding method and morphological methods, and a comparison was made between local and global images [35]. Gawert proposed a method for extracting the secondary dendrite arm spacing (SDAS), which first binarized the microscopic image using the Otsu method, segmented the dendrites using a distance transformation and a watershed algorithm, and, finally, measured the dendrites with clustering [36]. Image processing-based methods for the feature extraction of dendritic images usually require the binarization of the image first, but image quality has a large impact on the results of the Otsu thresholding method, and false segmentation is likely to occur when the contrast of the dendritic image is low.
As mentioned above, there are several problems in the study of primary dendrite arms as follows:
- (1)
- The production of microscopic images requires complex processes such as sampling, polishing, and etching and is, therefore, costly to produce, with the expectation that a small amount of data will be studied to extract dendritic features and reduce costs;
- (2)
- Microscopic image quality is susceptible to sample making techniques and equipment, image contrast is often low, and dendrite image quality needs to be solved;
- (3)
- Ordinary threshold segmentation binarization methods tend to ignore image details, leading to the phenomenon of under-segmentation and the need to address the segmentation of dendritic details.
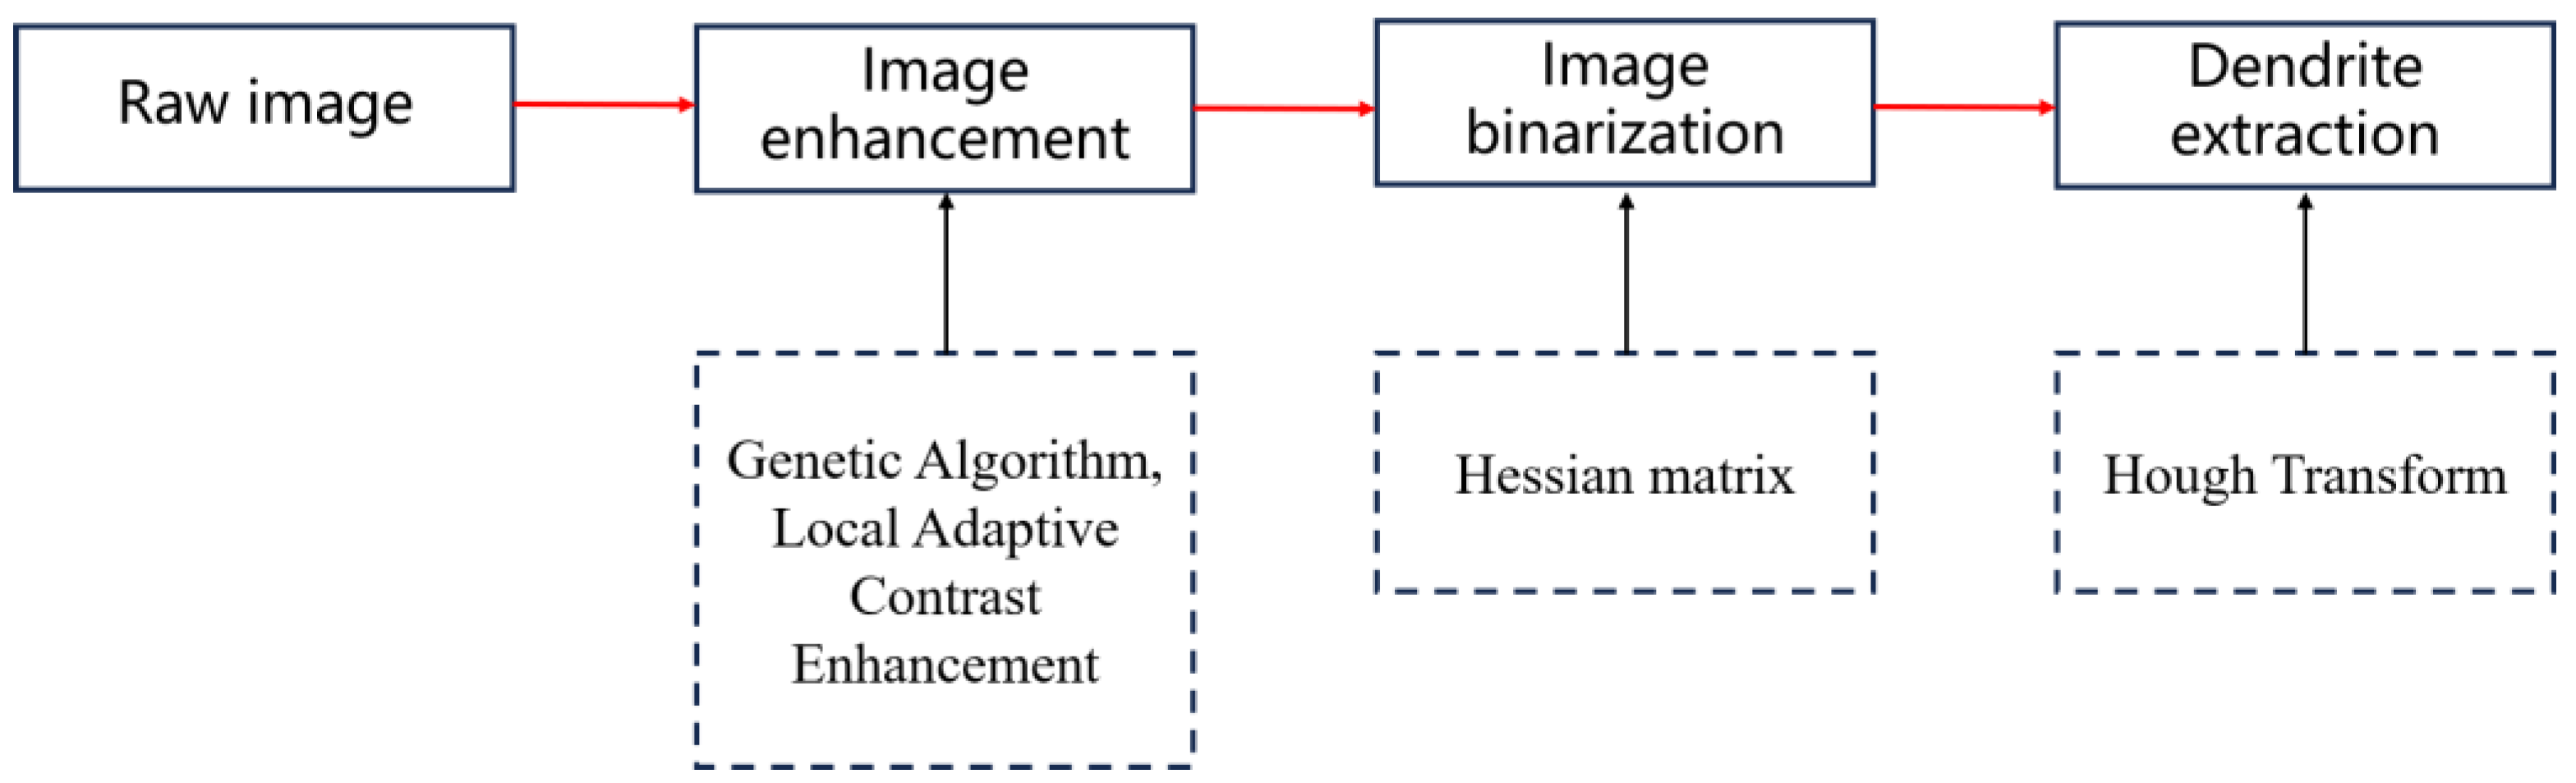
To address the above problems, a dendrite extraction method based on the Hough transform [37] is proposed in this paper. The flowchart of the algorithm is shown in Figure 2, which mainly includes three steps: image contrast enhancement [38], image binarization based on a Hessian matrix [39], and dendrite extraction. The advantages of the proposed method are as follows:
- (1)
- A local adaptive contrast enhancement method based on genetic algorithm is proposed to retain more details of dendrites. Compared with the traditional local adaptive contrast enhancement method, it provides more details via the optimized gain coefficient.
- (2)
- The binarization method based on a Hessian matrix is proposed to segment the dendritic region. We establish the surface model based on a Hessian matrix through the dendrite grayscale features and set the discriminative conditions according to the solidification principle to achieve the binarization effect.
- (3)
- Due to the interference of secondary dendrites and noise, there are many wrong lines in the results of straight line detection with the traditional Hough transform method. The proposed method uses the spatial relationship between consecutive and parallel primary dendrites to efficiently eliminate the detection errors.
2. Materials and Methods
The images for this study were low magnification images of high-carbon steel. We cut the size of 380 mm × 420 mm cast billets into small pieces of 20 mm × 20 mm, then polished the samples to a mirror finish. We generated low magnification images of the samples after corroding them through a mixture of picric acid and hydrochloric solutions.
2.1. Image Enhancement Algorithms
Image enhancement algorithms have a wide range of applications in many industries, especially in the industrial sector. Sample images of continuous casting billet dendrites often have low contrast due to their own and imaging conditions, making it difficult to distinguish between the dendritic areas and the interdendritic region. The local adaptive contrast algorithms based on genetic algorithms can enhance image quality, and traditional adaptive contrast enhancement algorithms have fixed gain coefficients, which are not applicable to global images, so the optimal gain coefficients are searched using genetic algorithms.
2.1.1. Local Adaptive Contrast Enhancement Algorithm
The adaptive contrast enhancement (ACE) algorithm [40] achieves image enhancement by calculating the local standard deviation of the image. The image is divided into low-frequency parts and high-frequency parts. The low-frequency part can be obtained by solving low-pass filtering methods such as mean filtering, and the high-frequency part can be obtained by making a difference between the original image and the low-frequency part. The high-frequency portion is enhanced using a gain factor (i.e., amplification factor) and added to the low-frequency portion to obtain an enhanced image. The enhanced image can be obtained as follows:
where is the grayscale value of the coordinate on the original image, is the local mean centered on x, is the grayscale value of the enhanced image coordinate , and is the gain factor, which can be calculated as follows:
where is the global mean squared deviation, is the local standard deviation centered on pixel , and is the gain factor coefficient, chosen as any fixed value between (0) and (1). is the very small positive constant term, used to avoid errors in the formula due to a zero local standard deviation ( in this paper).
2.1.2. Image Enhancement Based on Genetic Algorithm
- Genetic Algorithm
Genetic algorithms (GA) is a search algorithm proposed by Professor J. Holland of the University of Michigan to simulate biological evolution to find the global optimum [41]. It simulates the natural process of genetic recombination and evolution by performing class selection, crossover, and mutation operations on a randomly generated initial population and iterating through several iterations until the optimal solution is obtained [42]. The solution steps are as follows:
- (a)
- Initialize the population size;
- (b)
- Select excellent individuals and eliminate poor individuals based on the fitness size of individuals in the population;
- (c)
- Recombine part of the structure of two parent individuals to generate new individuals;
- (d)
- Genetic mutation operation;
- (e)
- Terminate the algorithm when the fitness function of chromosomes meets the condition or when the algorithm reaches a preset number of iterations.
- 2.
- Fitness Function
The fitness function is a performance metric that estimates the merit of an individual, and the setting of the function directly affects whether or not the genetic algorithm can find the optimal solution. Dendritic images are limited by production methods and imaging equipment, resulting in low contrast, difficulty in distinguishing between the dendritic and interdendritic regions, and severe loss of detail. Therefore, the contrast-enhanced dendrite images are required to have high contrast and distinct detailed features. In this paper, the gray-scale standard variance and the information entropy of an image are weighted and summed as a function of the fitness of each individual, as shown below in (3):
where and represent the weights of information entropy and standard deviation, respectively, and and are both equal to 1/2, indicating that and have the same weight in the fitness function. represents the information entropy of the image, which is used to measure the amount of information contained in the image, and represents the uncertainty of the image, which can also indicate the distribution of gray values in the image. The greater the information entropy indicates that the gray values in the image are more balanced within a certain range and present a greater contrast effect on the image, and the calculation formula is (4), where represents the proportion of gray values in the image, as shown below:
is the standard deviation of the image, which indicates the uniformity of the grayscale of the image. The larger standard deviation of a local area, the more uneven its grayscale value, and the stronger its contrast; conversely, the smaller standard deviation of a local area, the more uniform its grayscale value, and the weaker its contrast.
The optimal gain coefficient in the local contrast enhancement algorithm is obtained via a genetic algorithm. The two dimensions of information entropy and standard deviation of the image are weighted and summed as the fitness function, so that the selected gain factor coefficients can maximize the amount of information and gray uniformity of the image, enhance the detail part of the dendrite image, and achieve the requirement of improving the contrast of the dendrite image.
- 3.
- Local Contrast Enhancement Algorithm Based on Genetic Algorithm
The dendritic images studied in this paper have low contrast and small grayscale differences between the dendritic and non-dendritic regions, so the global image enhancement method will result in partial loss of dendritic information. A local adaptive contrast enhancement algorithm is used to enhance the detail information in the high-frequency part of the image by searching for the local optimal gain coefficients through a genetic algorithm. The specific algorithmic procedure is as follows:
- (a)
- Input the original dendrite image;
- (b)
- Convert the original image from a three-channel color image to HSV (Hue, Saturation, Value) space, split the image into color information and luminance information, and prevent the color information of the image from being changed when enhancing the brightness of the image;
- (c)
- Initialize the genetic algorithm parameters, including the population size, number of iterations, crossover probability, and variation probability;
- (d)
- Evaluating the gain coefficients by calculating the image information entropy and the grayscale standard variance to obtain the optimal gain coefficients;
- (e)
- Use the optimal gain coefficients to enhance the dendrite image via the ACE algorithm and obtain the enhanced image.
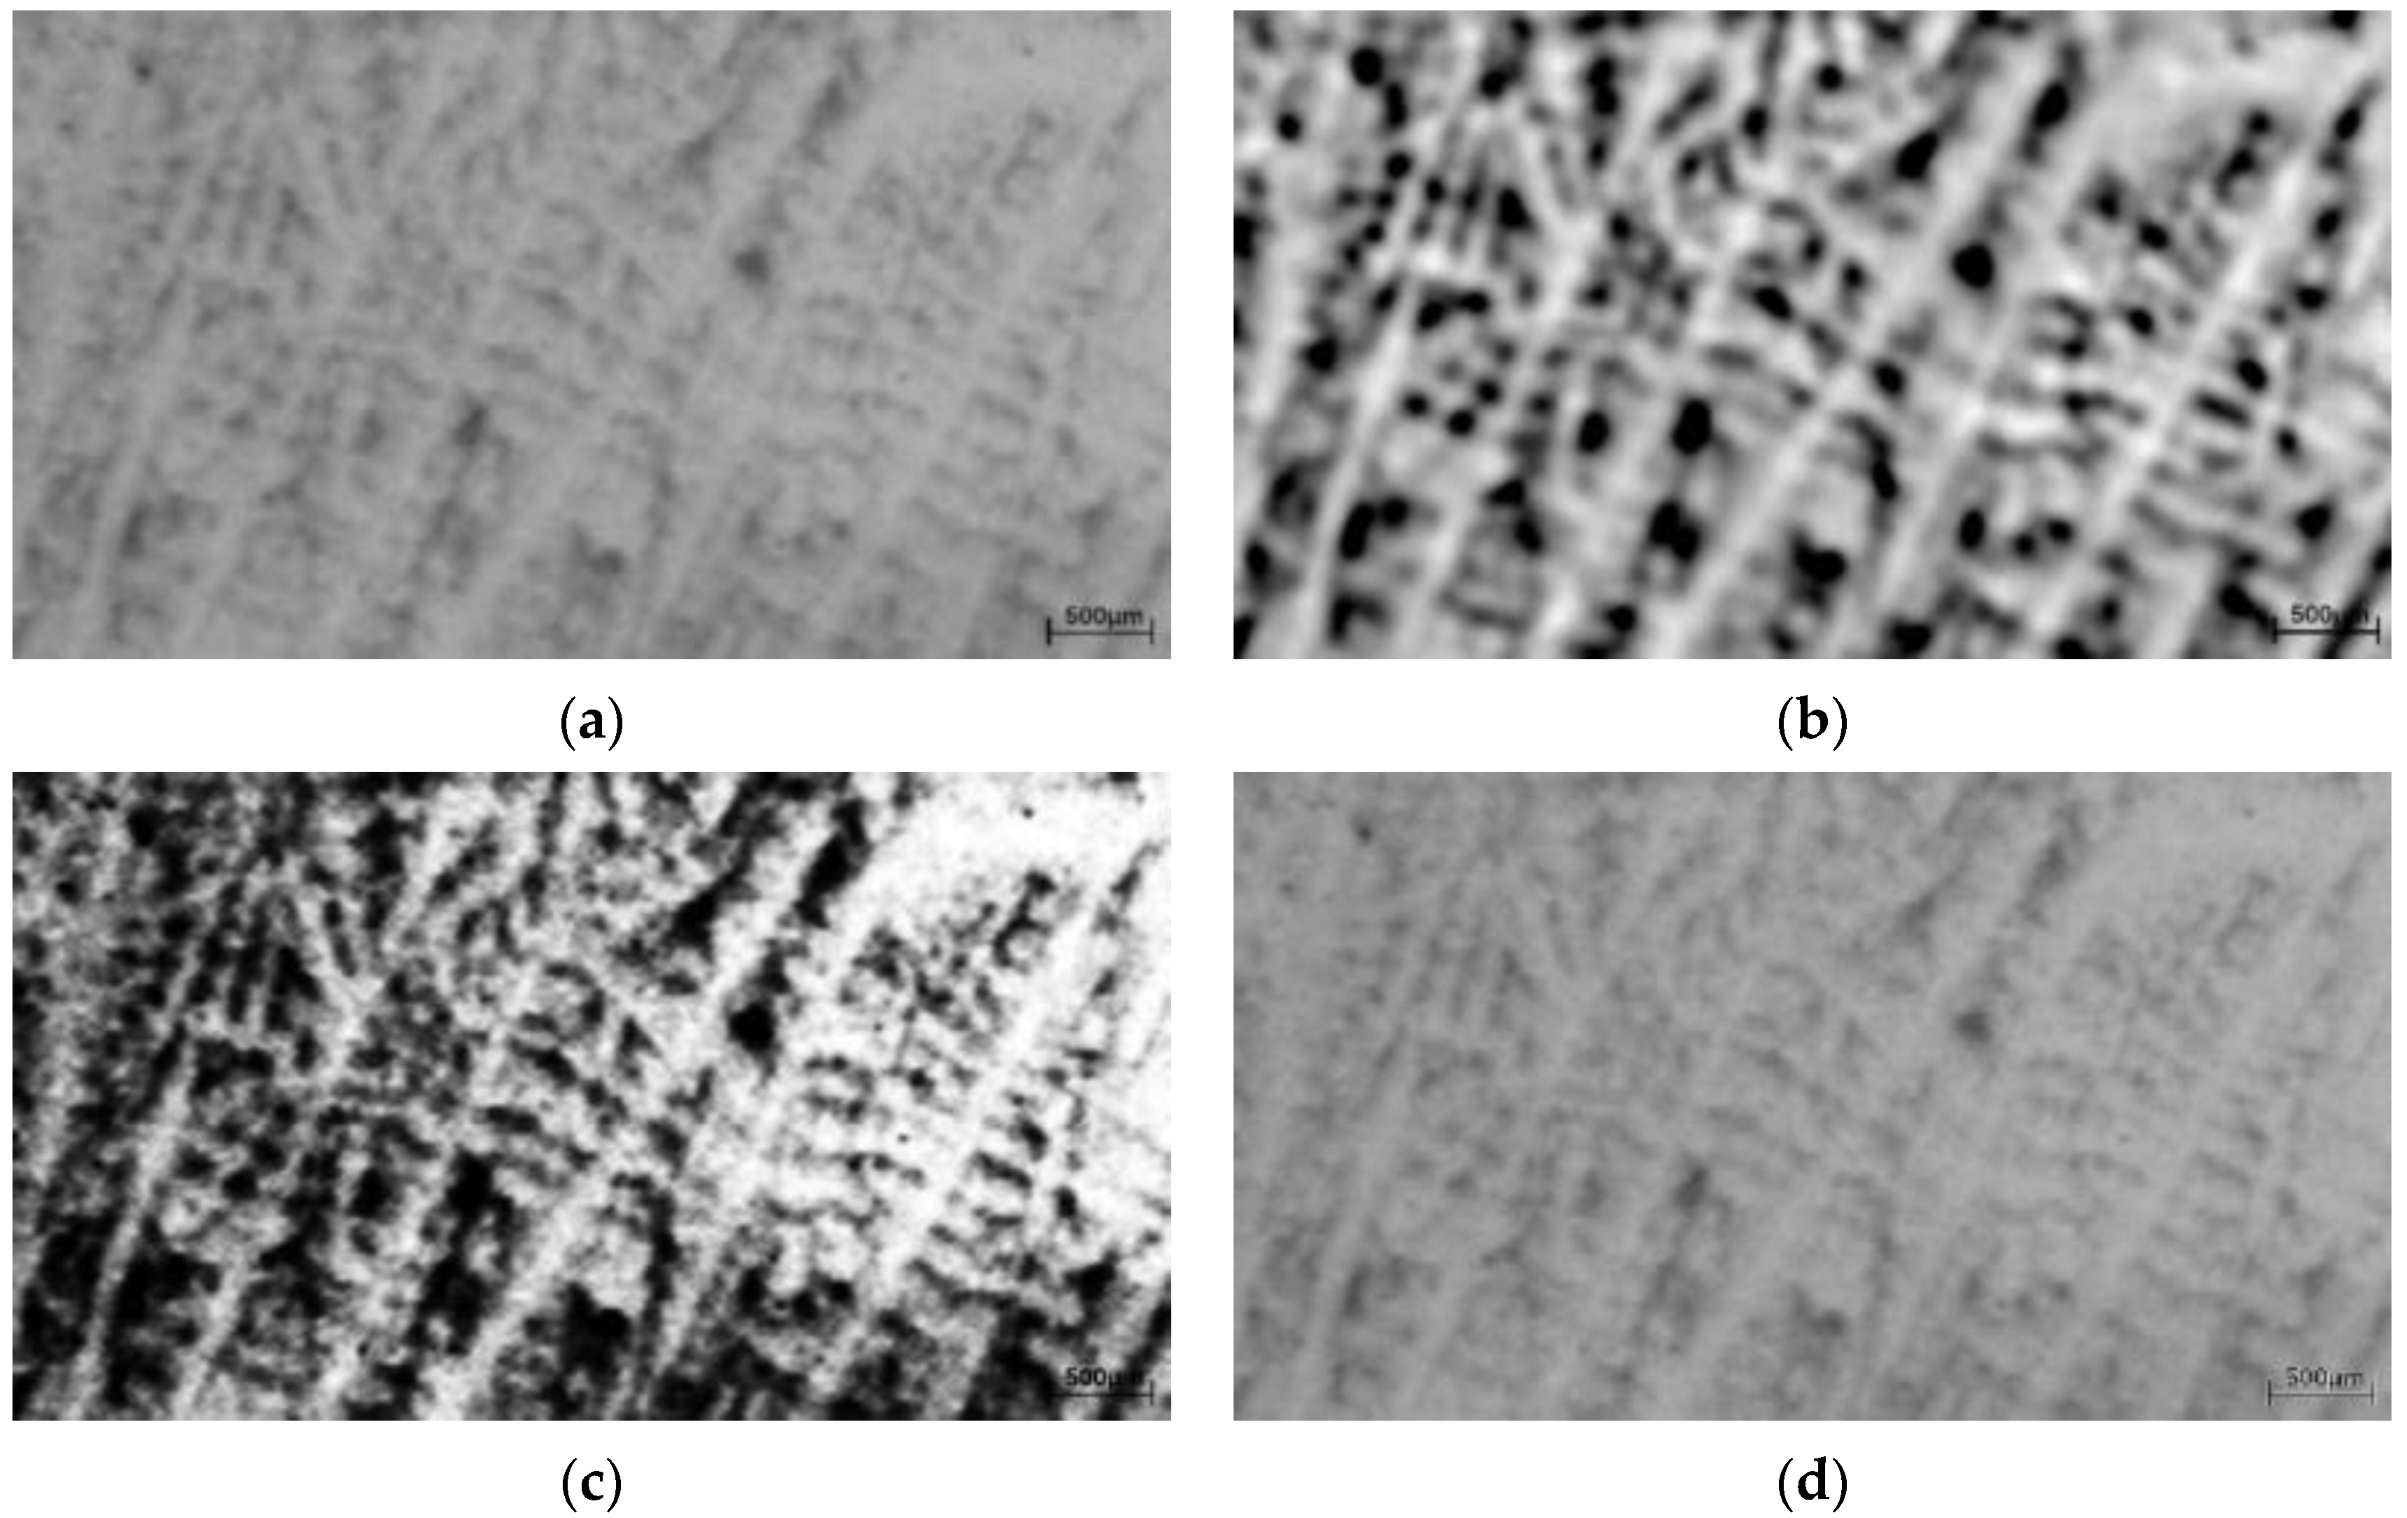
The optimal gain factor coefficients were obtained via the genetic algorithm, and the optimal gain factor coefficients were substituted into the ACE algorithm to enhance the dendritic images; the image enhancement results are shown in Figure 3b. The results of the genetic algorithm-based local contrast enhancement algorithm proposed in this paper are compared with the commonly used histogram equalization method and Laplace enhancement method for image enhancement, and the results are shown in Figure 3c,d. It can be seen from Figure 3 that the histogram equalization method and the Laplace enhancement method can enhance the dendrite image, but the information about the part of the dendrite is lost after enhancement, which directly affects the result of subsequent dendrite detection. The contrast of the images enhanced using the method in this paper is significantly increased, and dendritic features are more visually apparent. The proposed method overcomes the unstable processing effect caused by the traditional ACE algorithm with a fixed gain coefficient, increasing the grayscale difference between the dendrite region and the interdendritic region, enhancing the image details and improving the image quality. To evaluate the quality of the augmented images, the evaluation function is defined as follows:
where is the structural similarity index metric SSIM, which takes into account luminance, contrast, and structure to measure the degree of similarity between the enhanced image and the original image and is computed as follows:
where is the mean of x, is the mean of y, is the variance of x, is the variance of y, is the covariance of x and y, and is a constant. Moreover, in (5) is the enhanced image gray difference, contrast enhancement is believed to improve the original image of the gray value of the larger region of the gray value, and reduce the original image of the smaller gray value of the region, so that the branch crystal region is brighter and the interdendritic region is darker; thus, the calculation formula is as follows:
where is the maximum gray value in the enhanced image, and is the minimum gray value in the enhanced image. The evaluation function values of different methods are calculated according to (5), as shown in Table 1. It can be seen that the proposed method has the largest evaluation function value, and the image enhancement effect is better than those of the other methods, which can achieve the purpose of enhancing dendrite images.
2.2. Image Binarization Method Based on Hessian Matrix
In the dendrite image, the image grayscale values increase gradually from the edge of the dendrite to the center of the dendrite, while the grayscale changes are fewer on the dendrite backbone, so that a single dendrite can be considered a three-dimensional surface. The second-order derivative is smaller in the direction of the dendrite trunk and larger in the direction of the vertical dendrite trunk. The three-dimensional dendrite surface is represented by , where is the gray value of the pixel position coordinate . The center line of the dendrite is the surface ridge, which is the extreme point of the local surface curvature of the surface. Combining the properties of the Hessian matrix to describe the second-order derivative of an image, the curvature at a point on the surface can be expressed in terms of the Hessian matrix as shown below in (8):
where is the second-order derivative of the corresponding pixel coordinates. The matrix is a symmetric matrix, and the second-order derivative of the image can be obtained by convolving the original image with a Gaussian function as follows:
with
where is a Gaussian function with scale . The eigenvalues and eigenvectors of the Hessian matrix characterize important features of a three-dimensional surface, where the larger absolute eigenvalues and corresponding eigenvectors indicate the intensity and direction of the maximum curvature of the surface. Dendrites have less surface curvature in the direction of the main stem and more curvature in the direction perpendicular to the dendrite. The Hessian matrix can be decomposed into two eigenvalues, and , and the corresponding eigenvectors. Let be the maximum eigenvalue and be the corresponding eigenvector. The above analysis shows that the center line of the dendrite corresponds to the extreme point in the direction of maximum curvature, and the direction of the eigenvector is the direction of maximum curvature, so we can determine whether a point on the image is a local maximum or a local minimum by analyzing the positive or negative of . As the gray level of the dendrites in the dendrite image is greater than the gray level between dendrites, the local maximum point needs to be extracted to obtain the dendrite region. The condition for determining the dendrite region is that obtained when as follows:
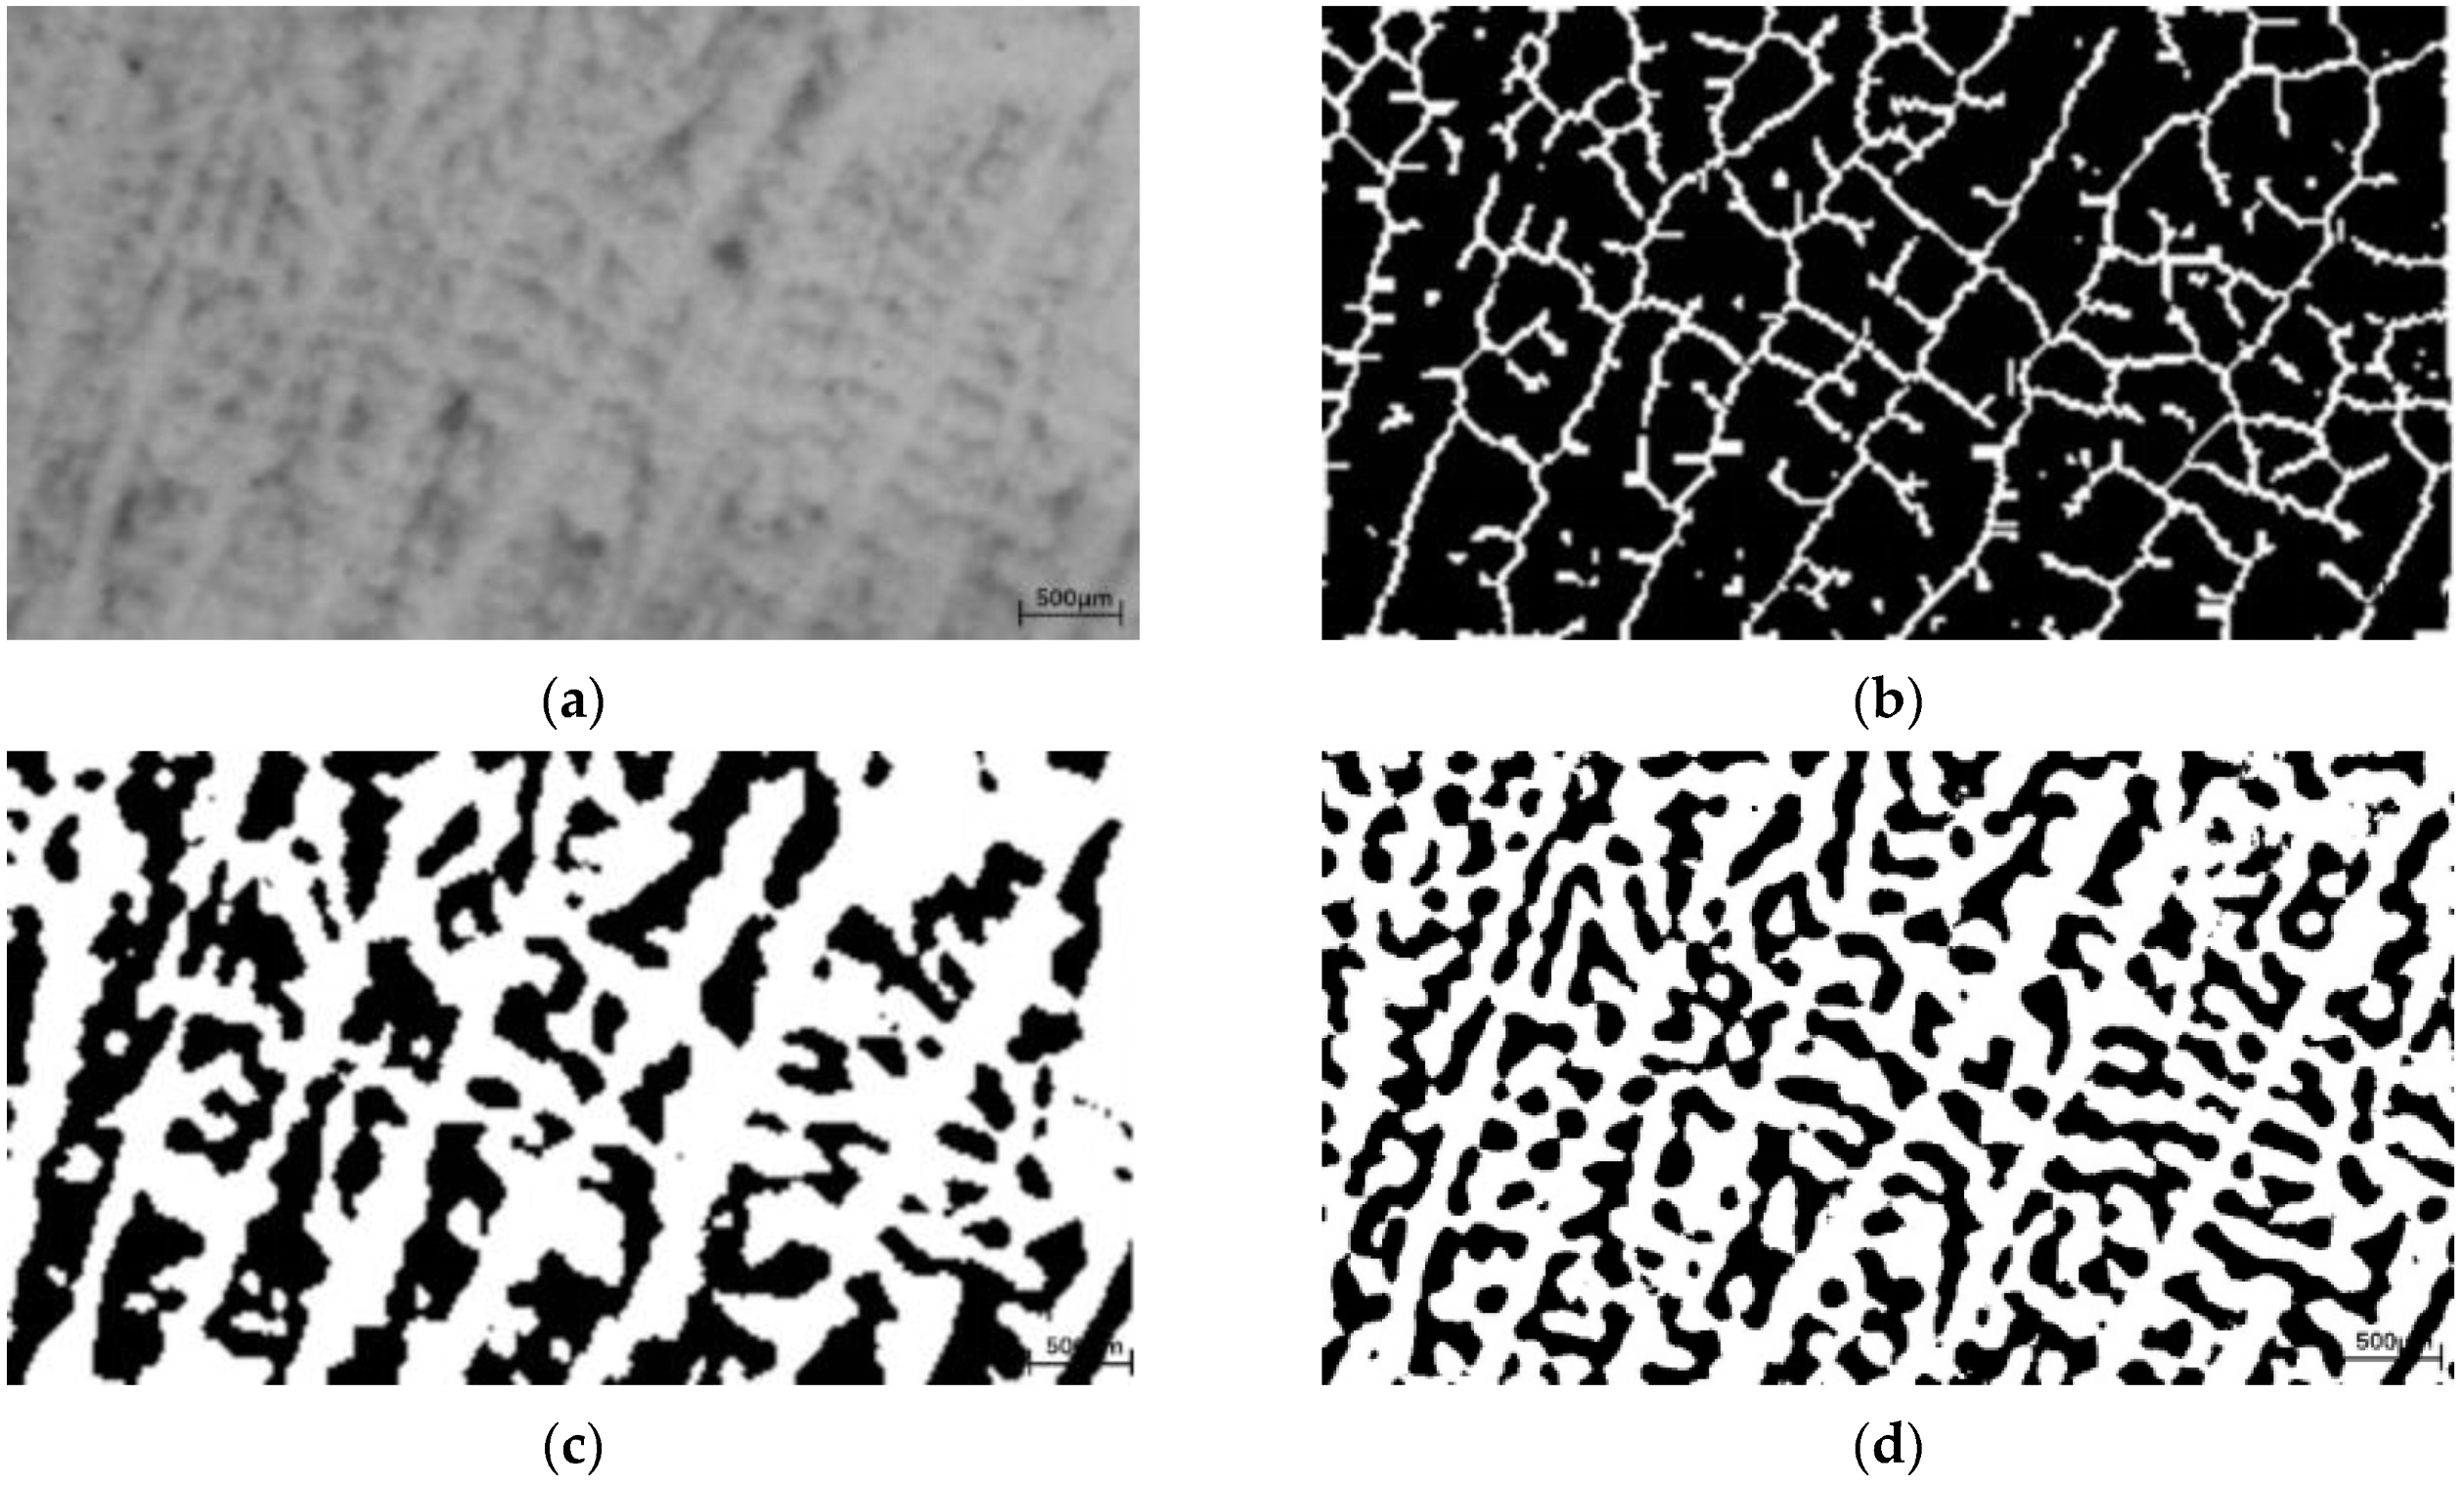
representing the change in grayscale of the left and right sides of the center line of vertical dendrite, and is the gradient vector. The parameter is set to , and the binarization results are shown in Figure 4b.
The results of comparing the proposed method with the commonly used Otsu and adaptive thresholding methods are shown in Figure 4. It can be seen from Figure 4 that the binarization results of the Otsu method and the adaptive binarization method for dendritic images are relatively coarse, and the selection of the threshold value directly affects the binarization results. The binarization results of the proposed method are more detailed, and the information obtained is more comprehensive, which can provide more information for the subsequent dendrite detection work.
2.3. Extraction of Primary Dendrite by Hough Transform
The binarization result is processed via the skeletonization algorithm, which regards the dendrites as line segments, so that the primary dendrite is the longest line segment in the image, and the primary dendrite line segment can be detected via the Hough transform method.
2.3.1. Principle of the Hough Transform
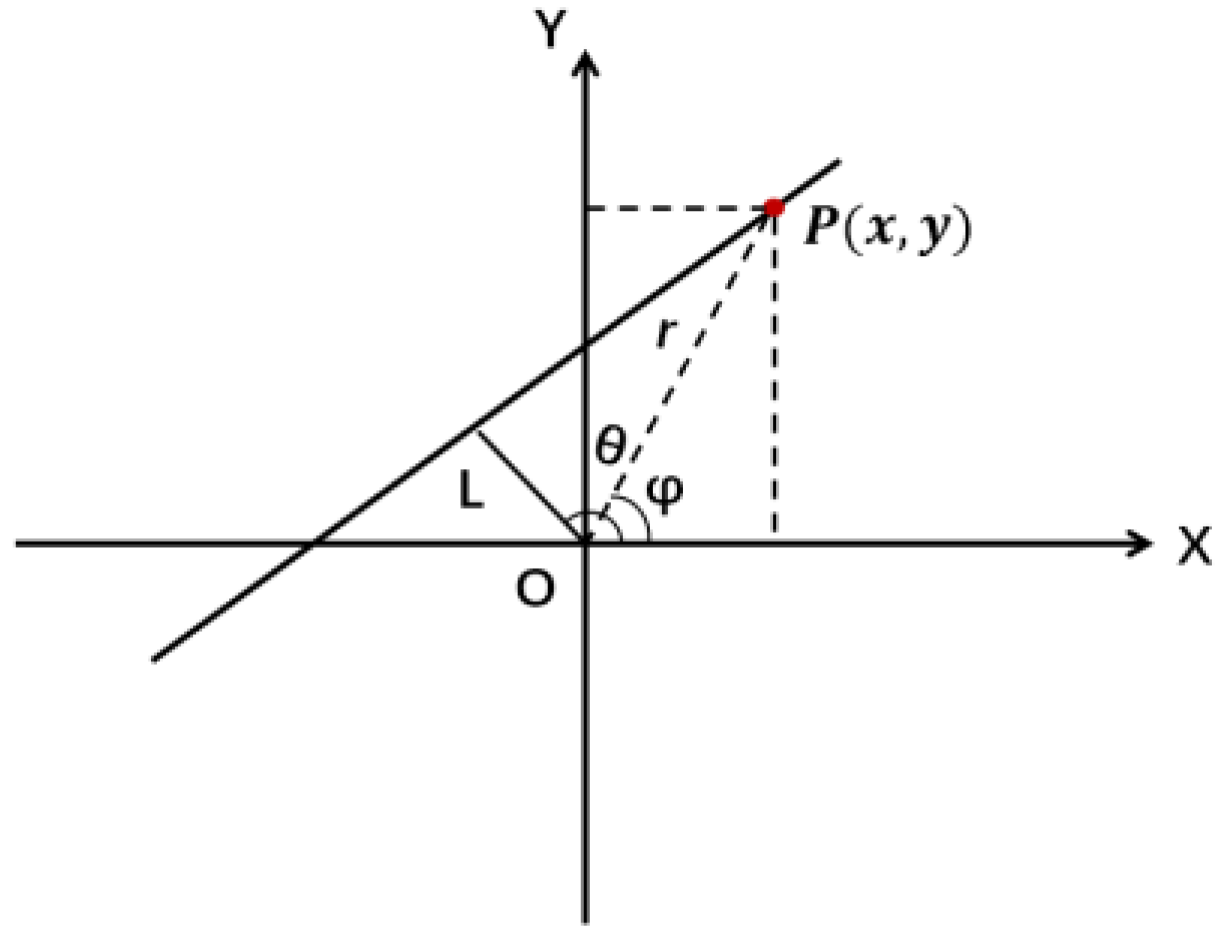
The Hough transform is a process of coordinate transformation, the principle of which is shown in Figure 5, the basic idea of which is to transform a straight line on an image from a right-angle coordinate system to a polar coordinate system for calculation [43]. A straight line under the right-angle coordinate system can be transformed into a point under the polar coordinate system. By counting the number of points under the polar coordinate system, the straight line under the right-angle coordinate system can be detected. is a straight line, and the coordinates of point on are in the right-angle coordinate system and in the polar coordinate system, the distance from the line to the origin in the right-angle coordinate system is , and is the angle between and the horizontal coordinate axis of the right-angle coordinate system. A point in the right-angle coordinate system can be converted into polar coordinates, according to (12), as shown below:
Each set of parameters (the distance from the origin of the coordinates to the line) and (the angle between the vertical line and the horizontal axis of the right-angle coordinate system) in the equation determines a straight line, and that line is unique. It can be seen that a straight line in the Cartesian coordinate system transforms to a point in the polar coordinate system, so a two-dimensional counter can be designed to count the parameters in polar coordinates, and the maximum value of the counter can be found as the straight line in the image.
2.3.2. Primary Dendrite Detection Based on Hough Transform
The pixel points in the processed metallographic image are converted to the polar coordinate system, the angle is empirically divided into 60 parts (π/60), the maximum radius is the diagonal of the image, and the radius interval is 3. We used the pixel point coordinates to vote to the parameter space angle and radius according to (13):
The traditional Hough transform voter is an integer cell, but the radius found in this problem is likely to be a fractional number, so when is found to be a fractional number, the previous cell and the next cell are voted on separately.
After all pixels completed the parameter space poll, the result of the poll was three-dimensional data in terms of the angle, radius, and number of pixel points. The pixel points in the same angle and radius grid indicate that they cross the same line. The pixel points of each grid are projected onto the x-axis, and the number of consecutive pixel points on the same line is counted based on the difference in the vertical direction of the pixel to determine whether the pixel points are consecutive. The straight line with the highest number of pixels points is taken as the primary dendrite.
2.3.3. Optimization of Primary Dendrite Extraction Results
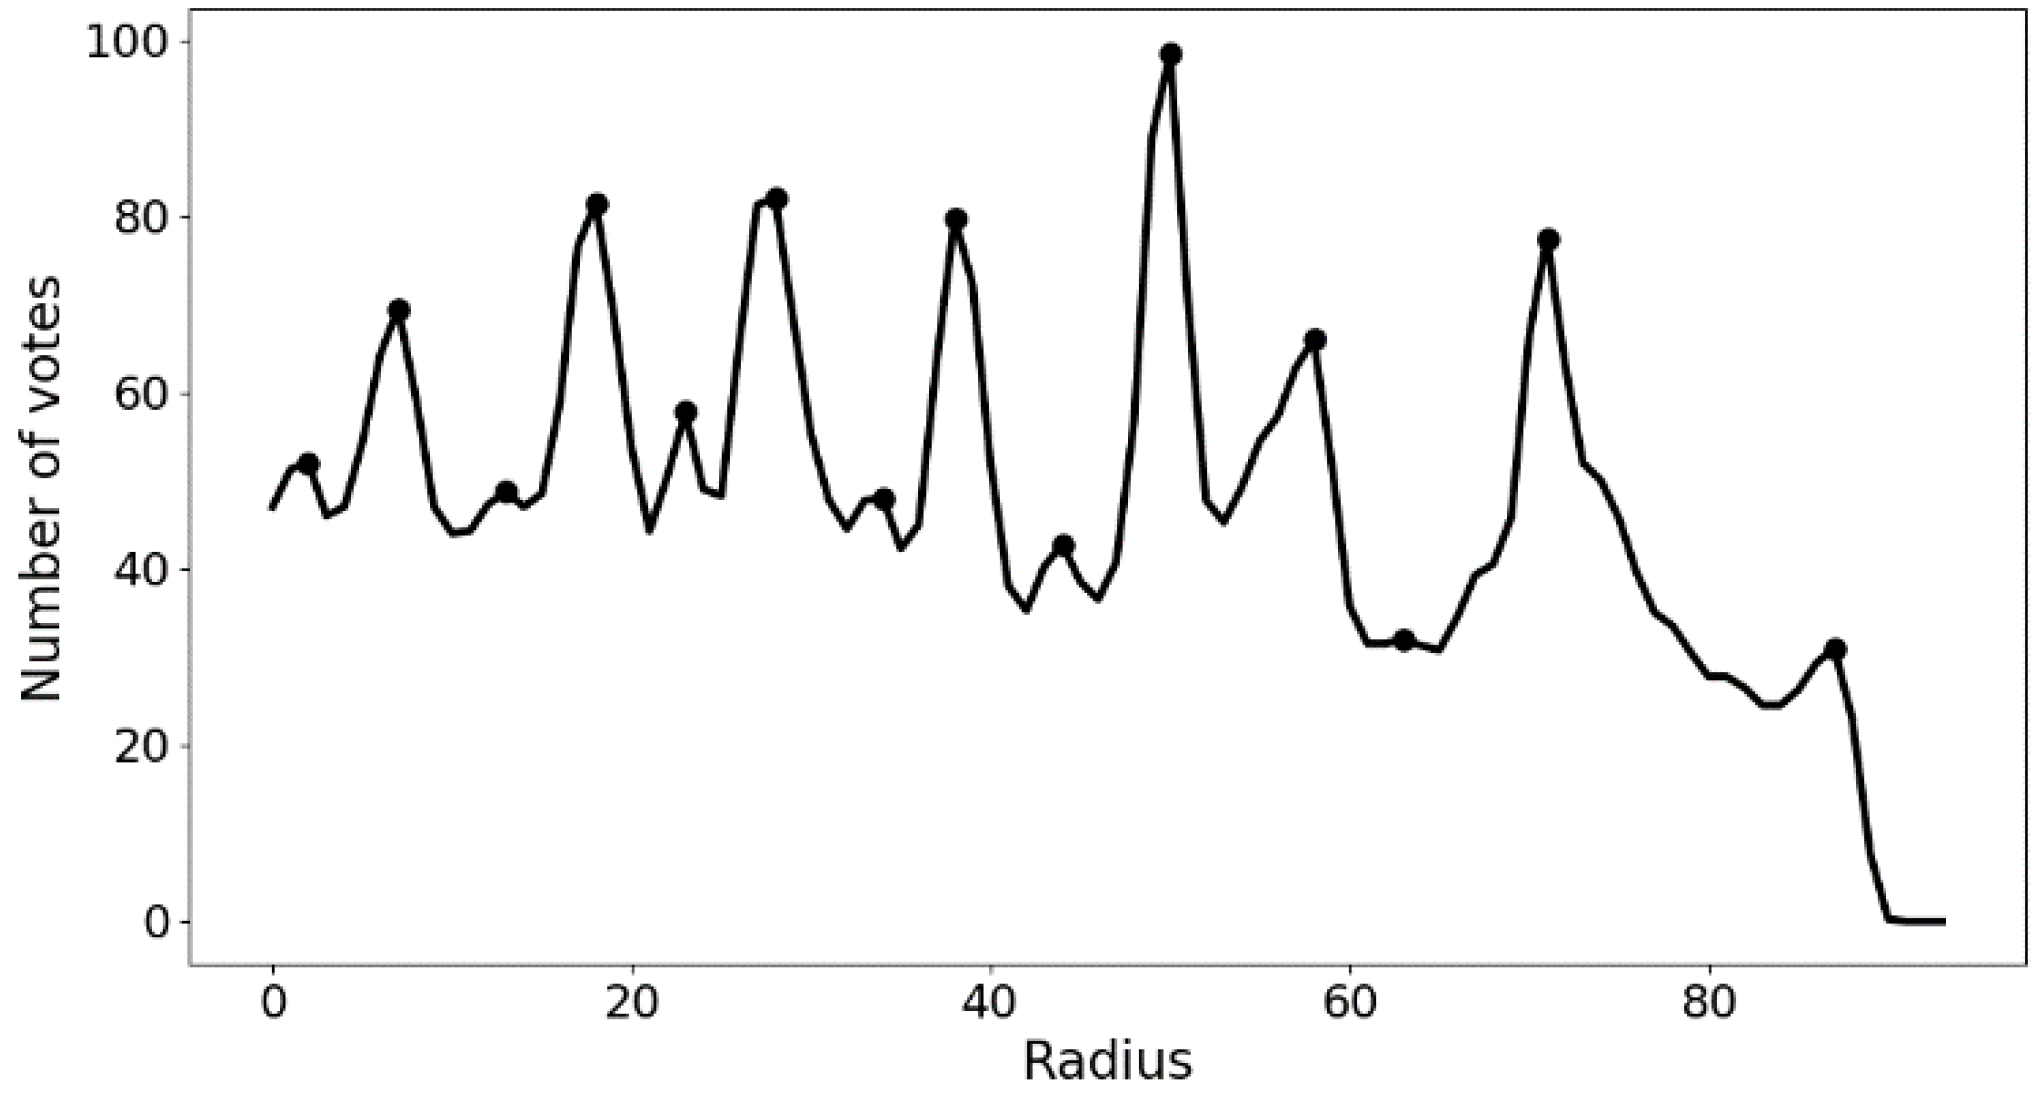
The results of the primary dendrites extracted according to the method in Section 2.2 contain many wrong and duplicated line segments, and, therefore, their results need to be optimized. According to the solidification principle, columnar crystals have a strong orientation and are represented in the image as primary dendrites parallel to each other. Therefore, the data with the highest number of votes under each radius in the Hough transform voting results were taken out separately, and the results are shown in Figure 6. Since a primary dendrite can be seen as the longest line segment on the image, the line segment at the peak position in Figure 6 has the highest probability of being a primary dendrite.
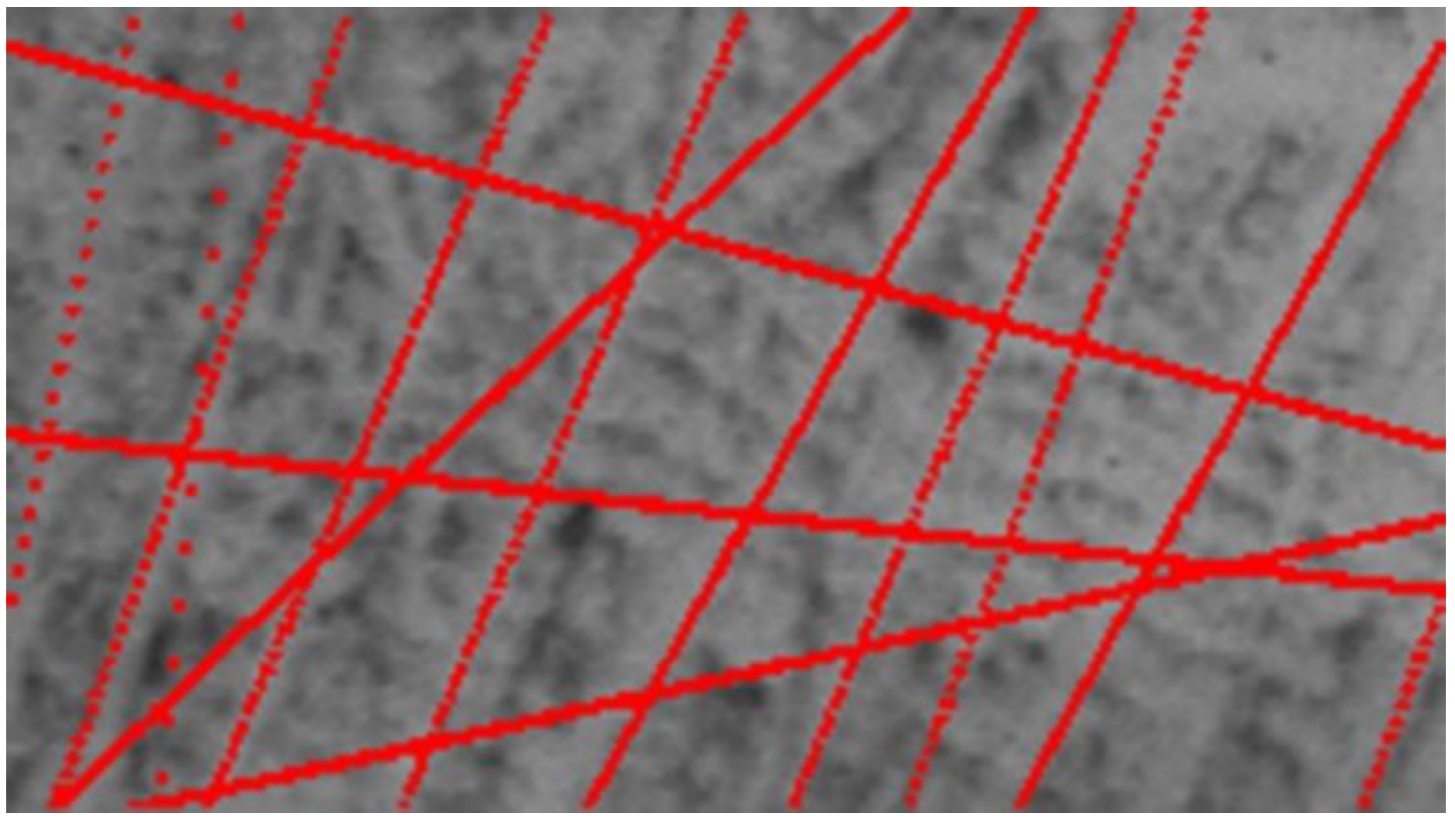
Taking the data of the peaks in Figure 6, is the number of peaks and is regarded as dendrites, so is the set of dendrites. The lines detected at the peak of Figure 6 are shown in Figure 7, where it can be seen that there are a number of error lines in the image that need to be removed. Based on the notion that primary dendrites are parallel to each other, all primary dendrites in the image can be regarded as a set of parallel straight lines, and for any point on the i-th dendrite, there is the following relationship:
where is the slope of the parallel line, and is the intercept of the corresponding line. We rewrote (14) into matrix form, as shown in (15):
where is the number of pixels on the first dendrite, is the number of pixels on the second dendrite, and is the number of pixels on the N-th dendrite. We abbreviated (15) as , and calculate using (16) as follows:
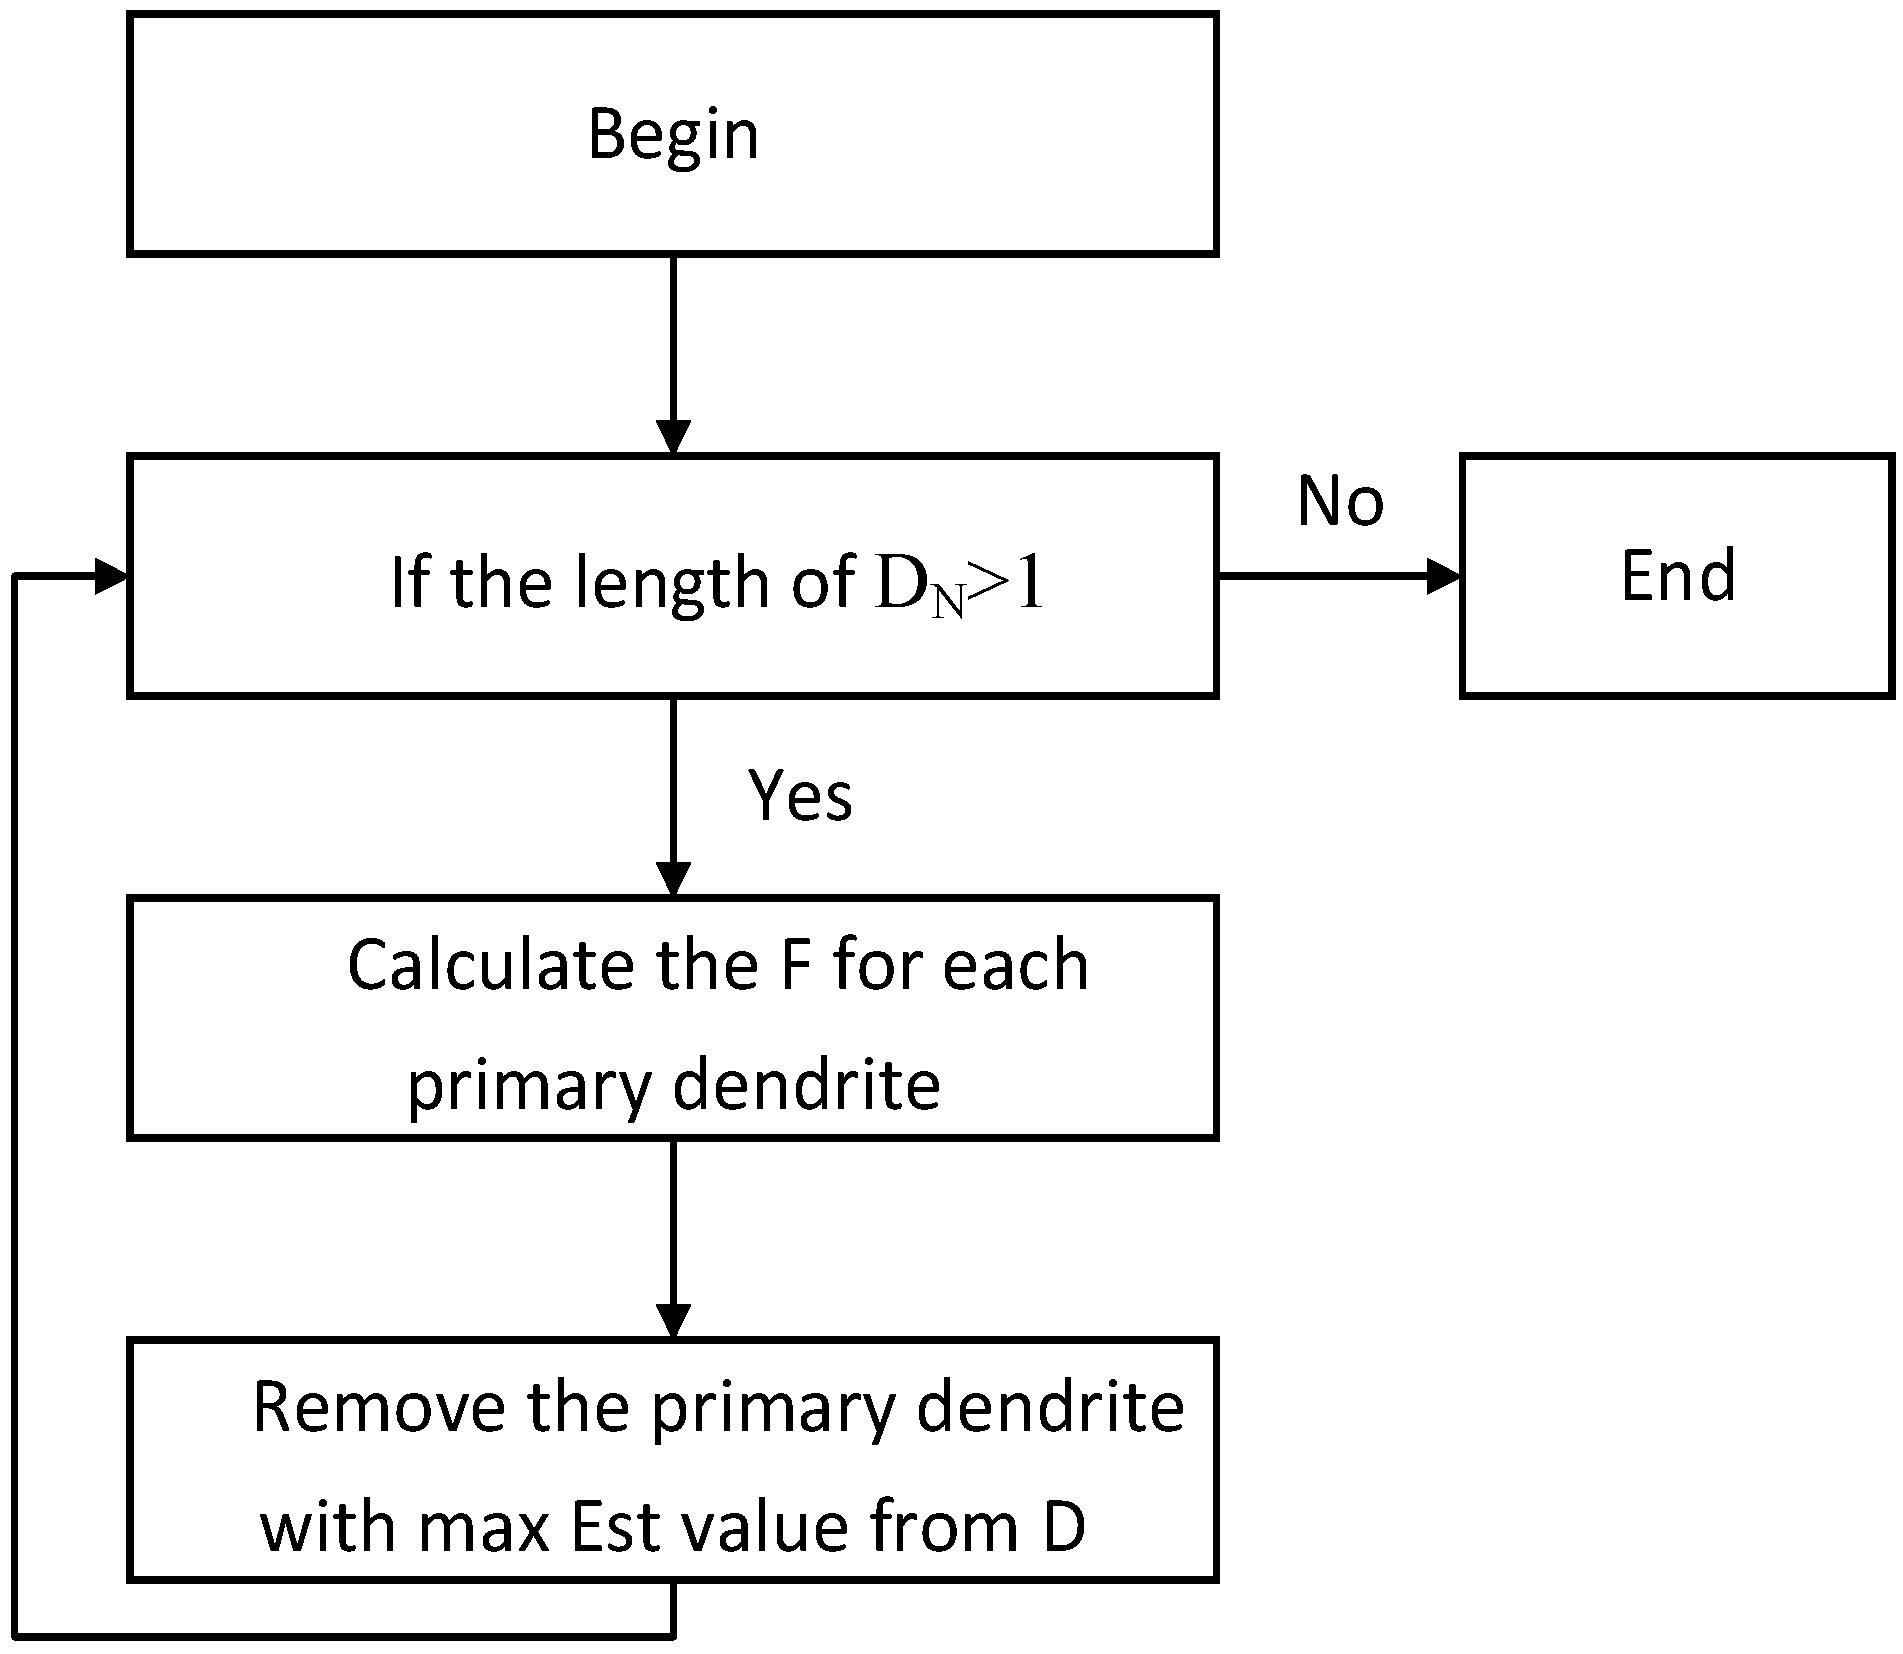
where can be obtained via the least squares method. Since the primary dendrites should appear as continuous line segments on the image, the fractured line segments were removed from the data based on the continuity of the dendrites. The design evaluation function is defined as follows:
The evaluation function consists of the residuals of the least squares method and the projection error. The smaller the evaluation function, the better the extracted primary dendritic results. Here, is the true value of the coordinates, is the predicted value based on , and is the total amount of data. is the projection error of the line segments in each dendrite, which is obtained by projecting the line segments belonging to each dendrite onto a line in the direction of the dendrite and calculating the projection distance of the adjacent line segments. The principle of removing erroneous dendrite line segments is defined as follows: we calculated the value of the evaluation function for each dendrite according to (17), removed the dendrite with the largest evaluation function value in turn, and recalculated the value of the evaluation function for each dendrite until only one dendrite remained in . The flow chart of the algorithm is shown in Figure 8.
We recorded the recalculated evaluation function value after removing the dendrite each time, observing the change in the evaluation function value. According to the characteristics of the primary dendrite parallel to each other and continuously, when there was only primary dendrite data in , the value of the evaluation function should be small and change little, so the maximum change position is the best result of the dendrite extraction, and the final result of primary dendrite extraction is shown in Figure 9.
3. Results
In order to verify the feasibility and generality of the proposed algorithm using these experimental images, many related experiments were performed in this study. The software environment for these experiments was Pycharm2017.2.3, and the computer was a 2.10-GHz Intel® Core™i5-10210U CPU with 16 GB memory.
3.1. Comparison of Different Dendrite Detection Methods
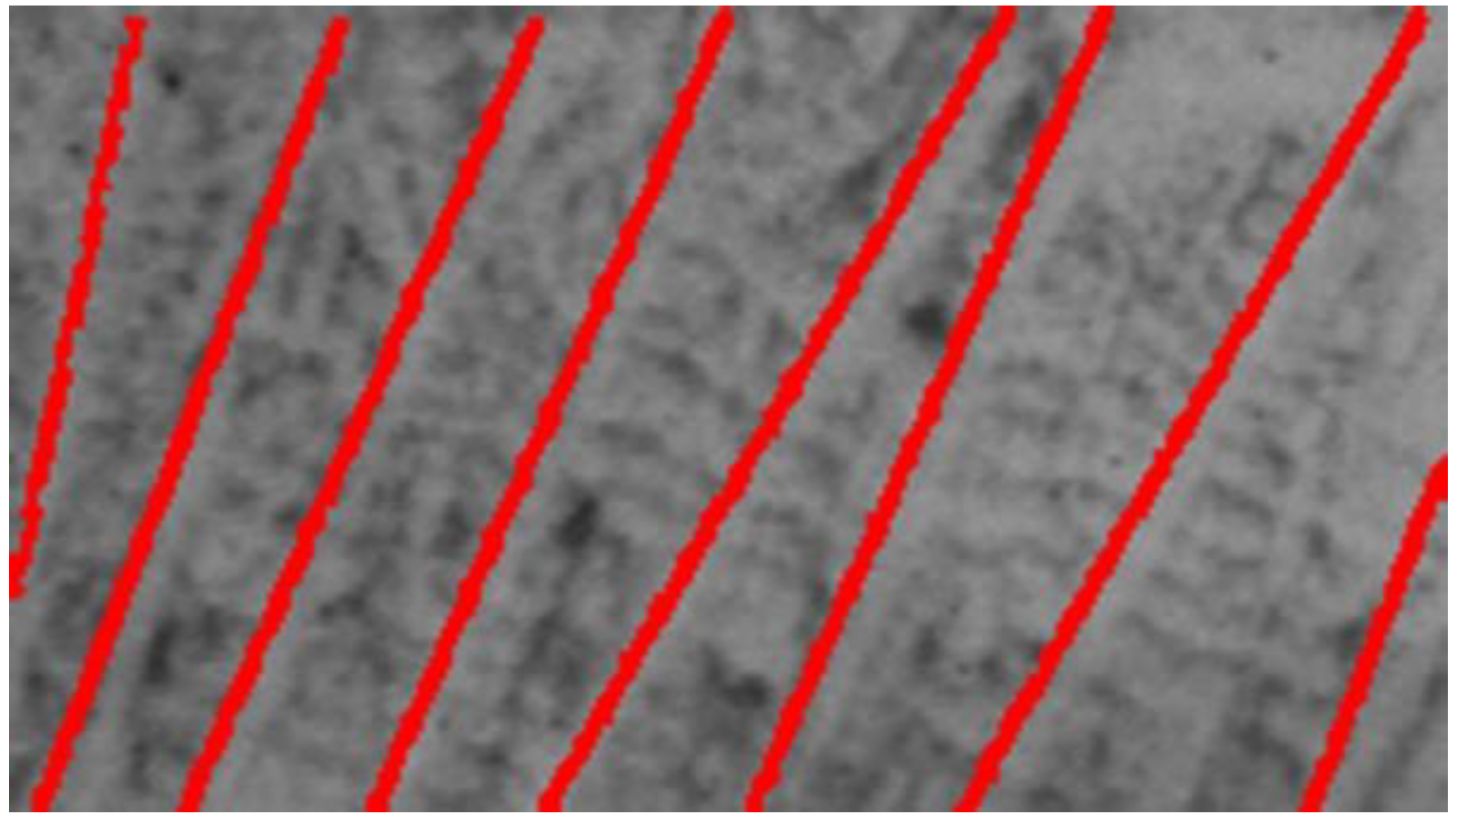
We detected the primary dendrite on the same dendrite image using the methods of reference [19] and reference [36] and the proposed method. The results of manual extraction of dendrites were used as objective criteria. The detection results are shown in Figure 10 and Table 2. It can be seen from Figure 10c that there should be eight primary dendrites on the dendrite image. Experimental results show that all dendrites can be detected via the proposed method.
A total of five dendrites were detected via the method of reference [19], one of which was a misdetection. The reason is that the method mainly uses the template matching technique, the detection results are directly related to the selected template, and the method can only detect the intersection of primary and secondary dendrites, such as the blue dots in Figure 10a, and it requires subsequent human manual extraction to detect primary dendrites. In contrast, the method in reference [36] only detected two dendrites because it used the Otsu method in the binarization process. Due to the low contrast of the dendrite image and the small difference in grayscale between the dendrite part and the interdendrite part, the traditional Otsu method binarization effect was not satisfactory, leading to the missed detection of the final dendrite detection results. The experimental results show that the proposed method for dendrite detection can effectively avoid the problem of missed dendrite detection compared to other methods and can obtain all the dendrite information in the image.
3.2. Comparison of Dendrite Detection Results from Different Dendrite Images
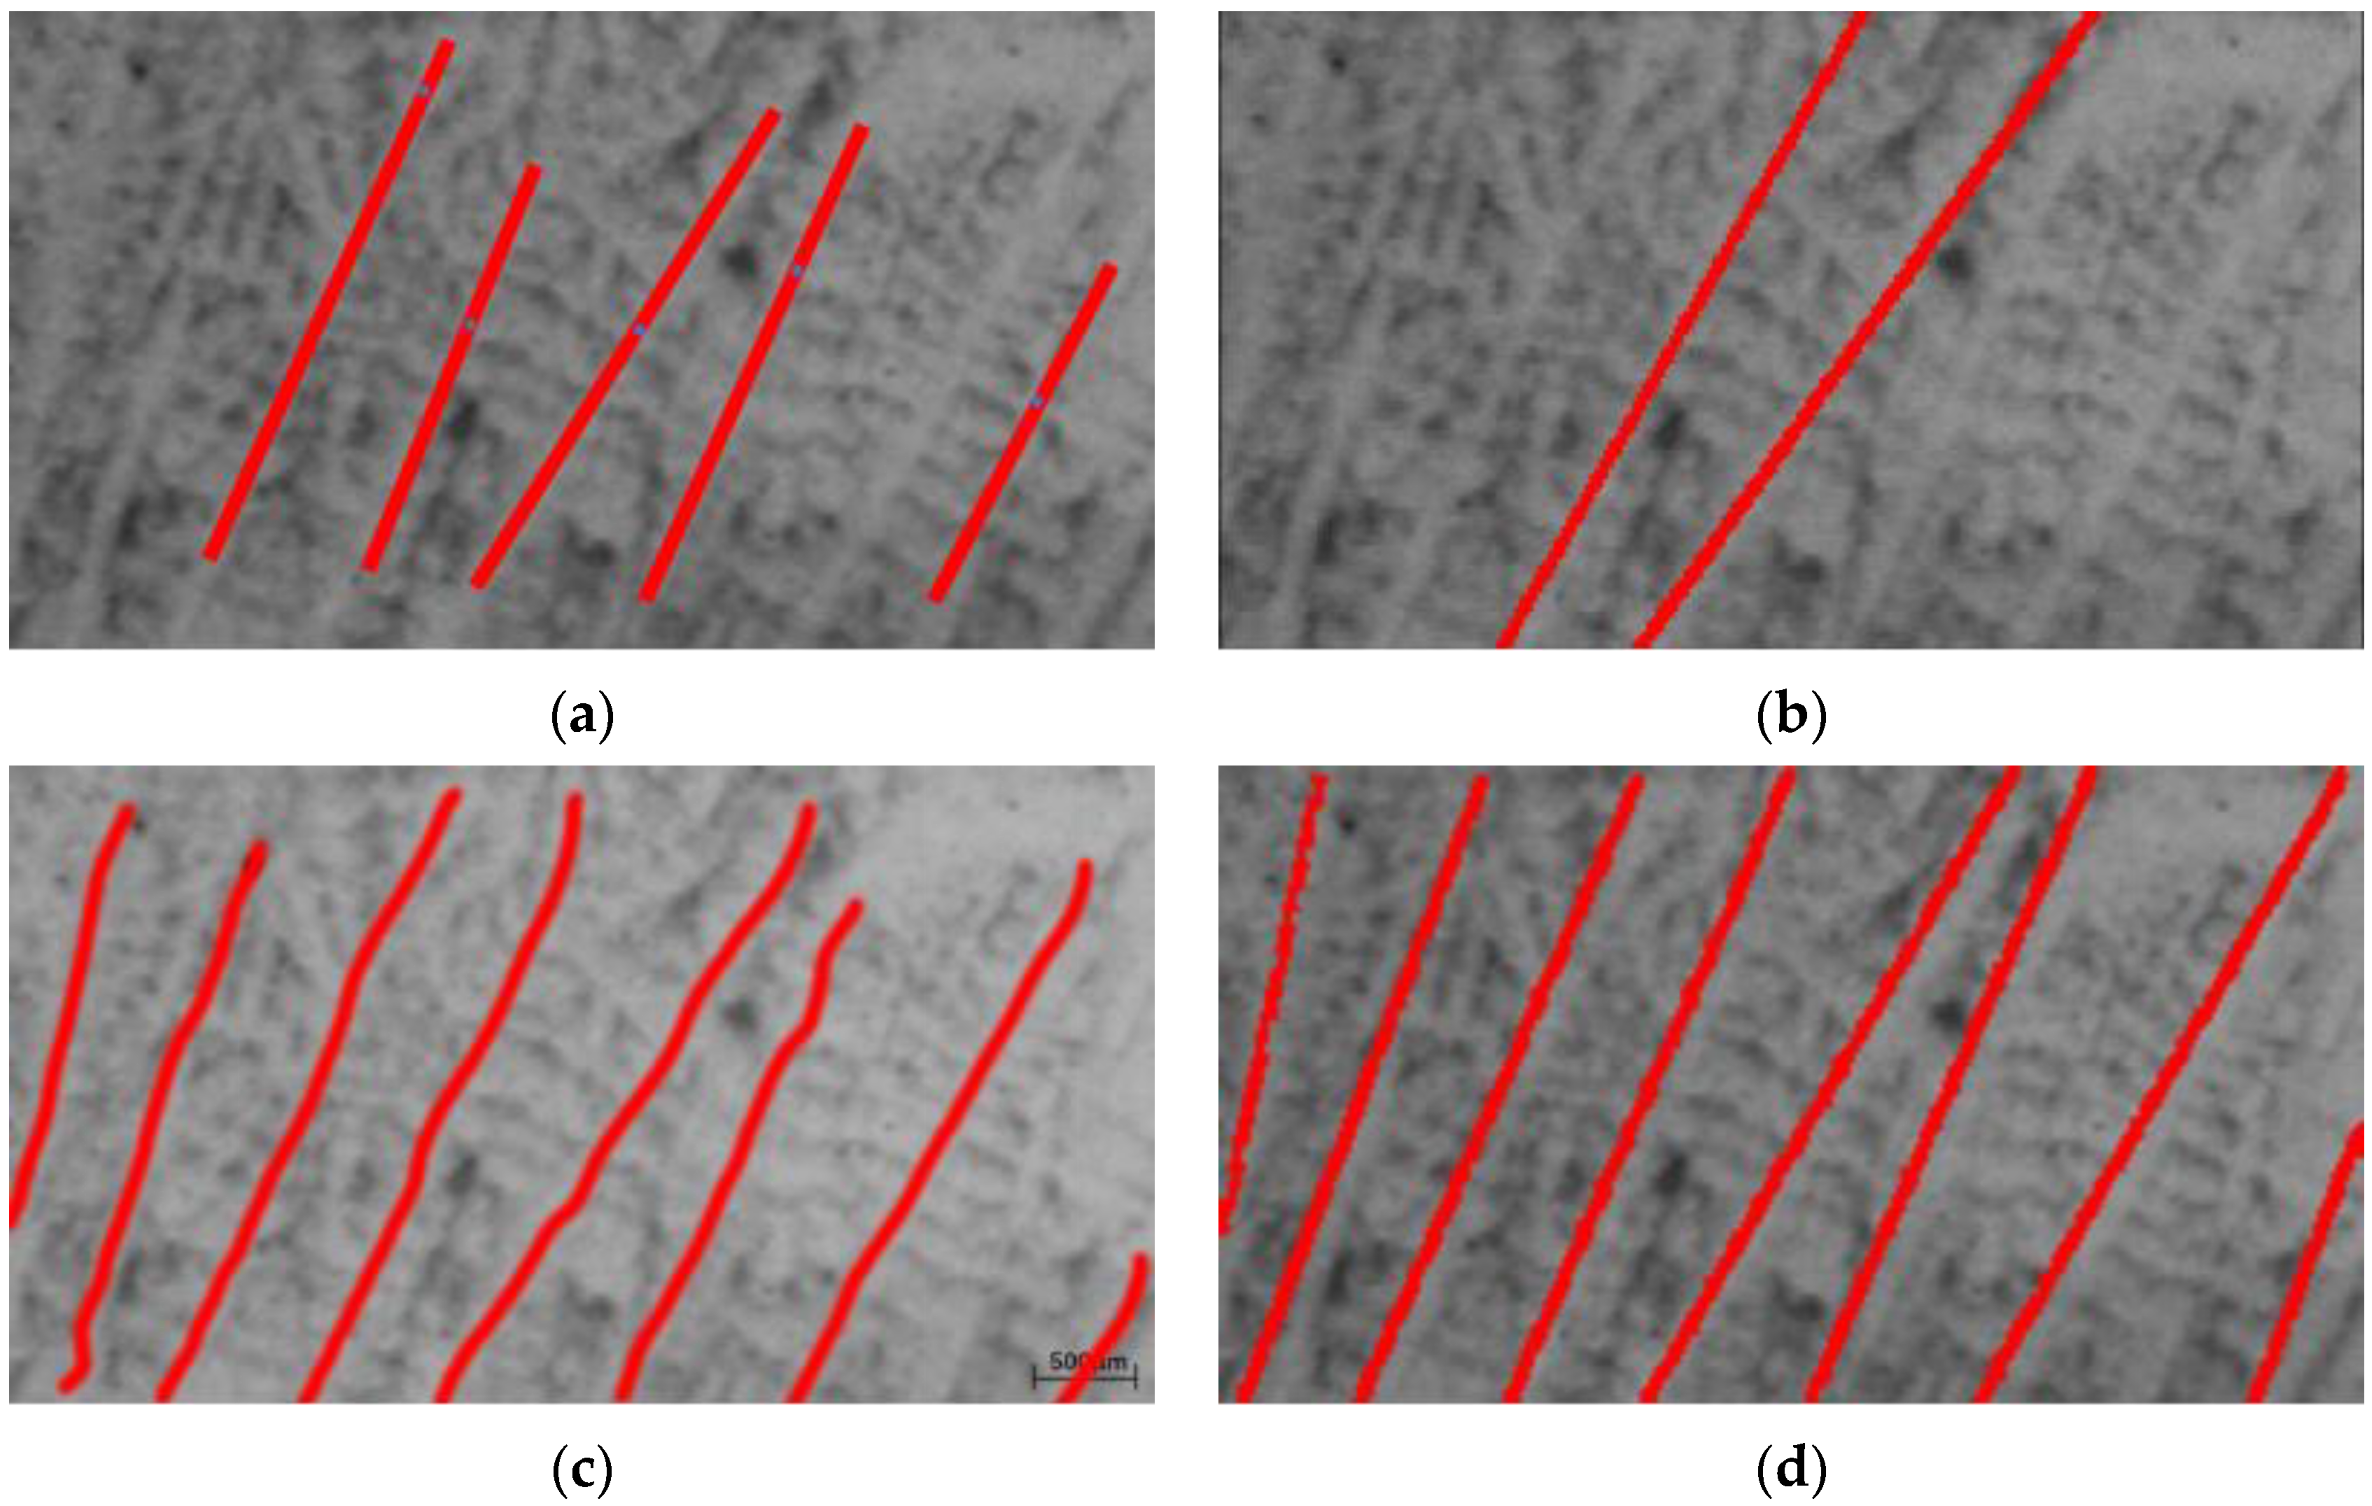
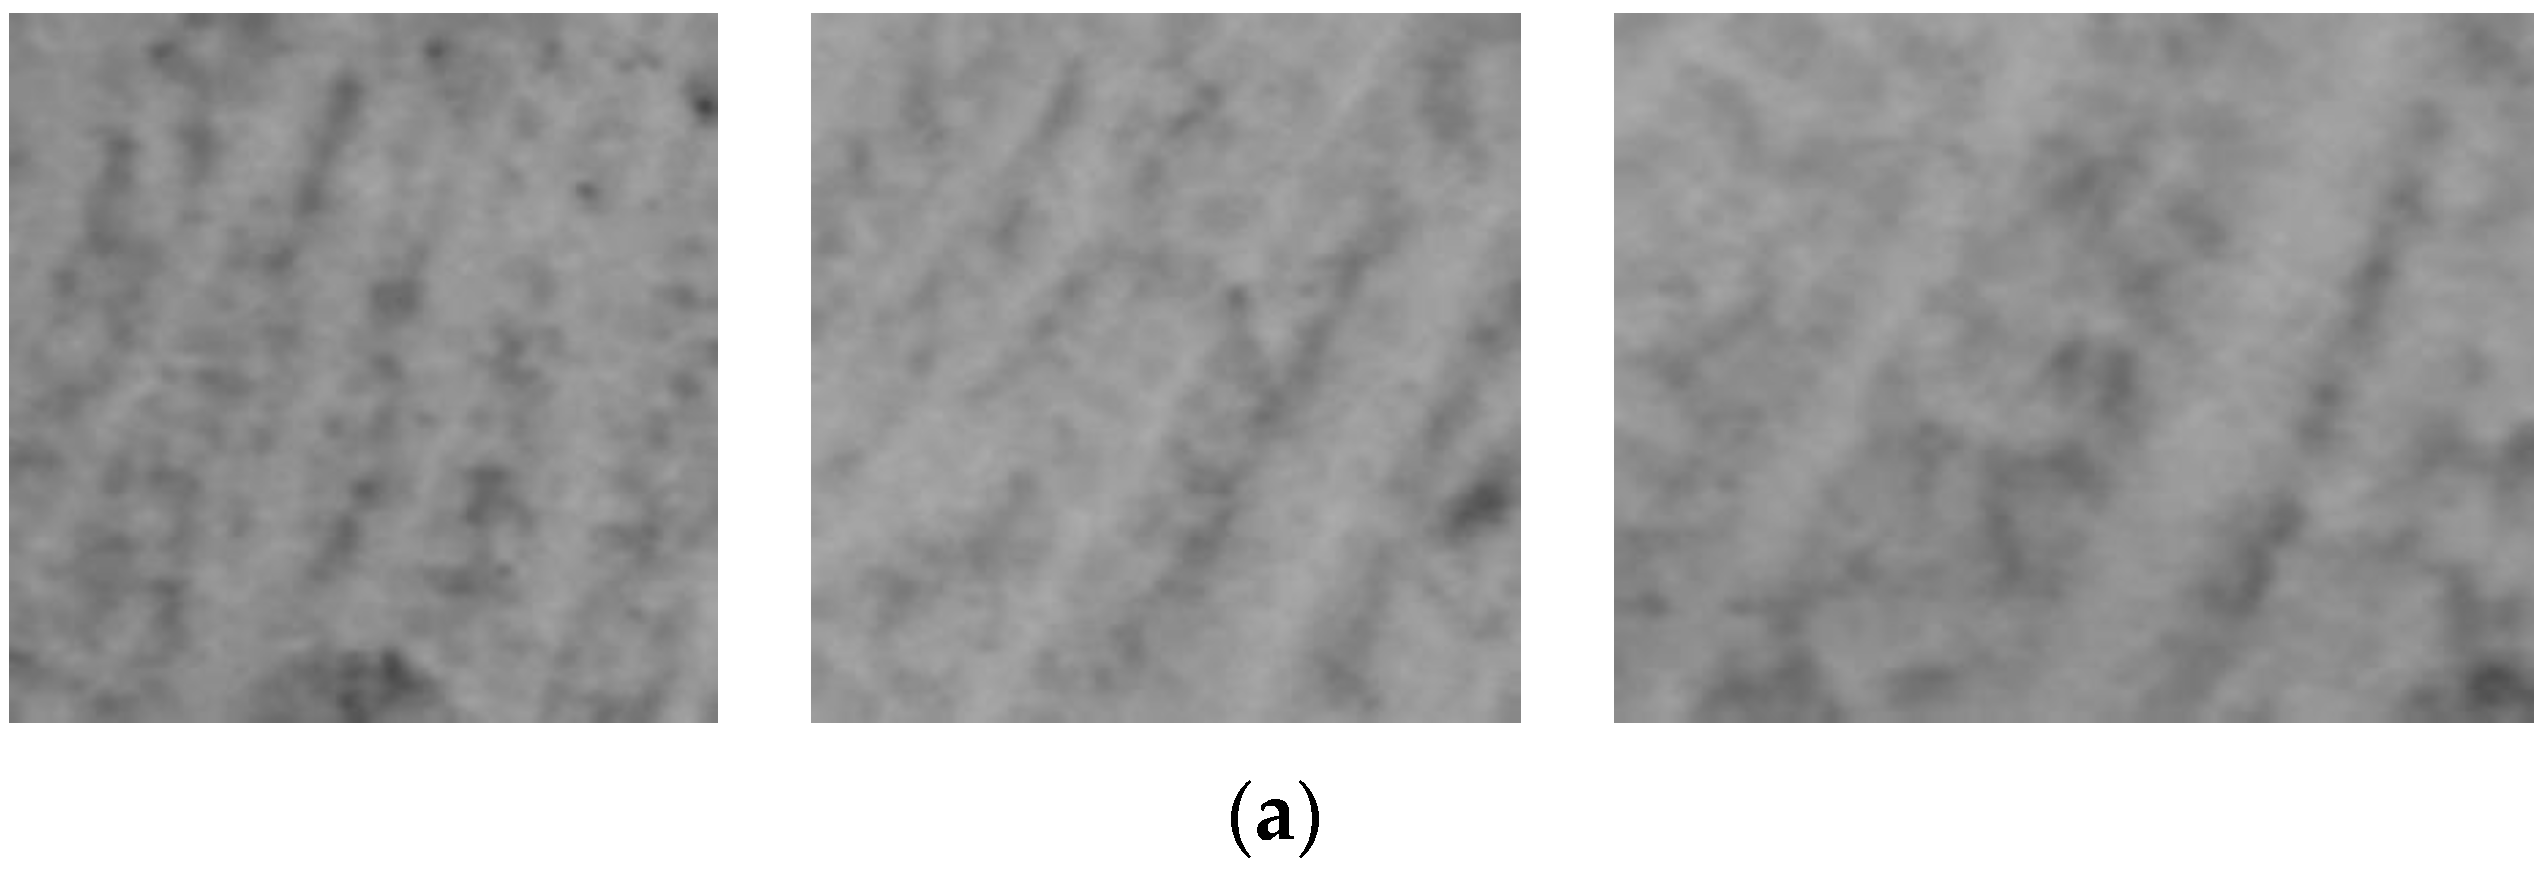
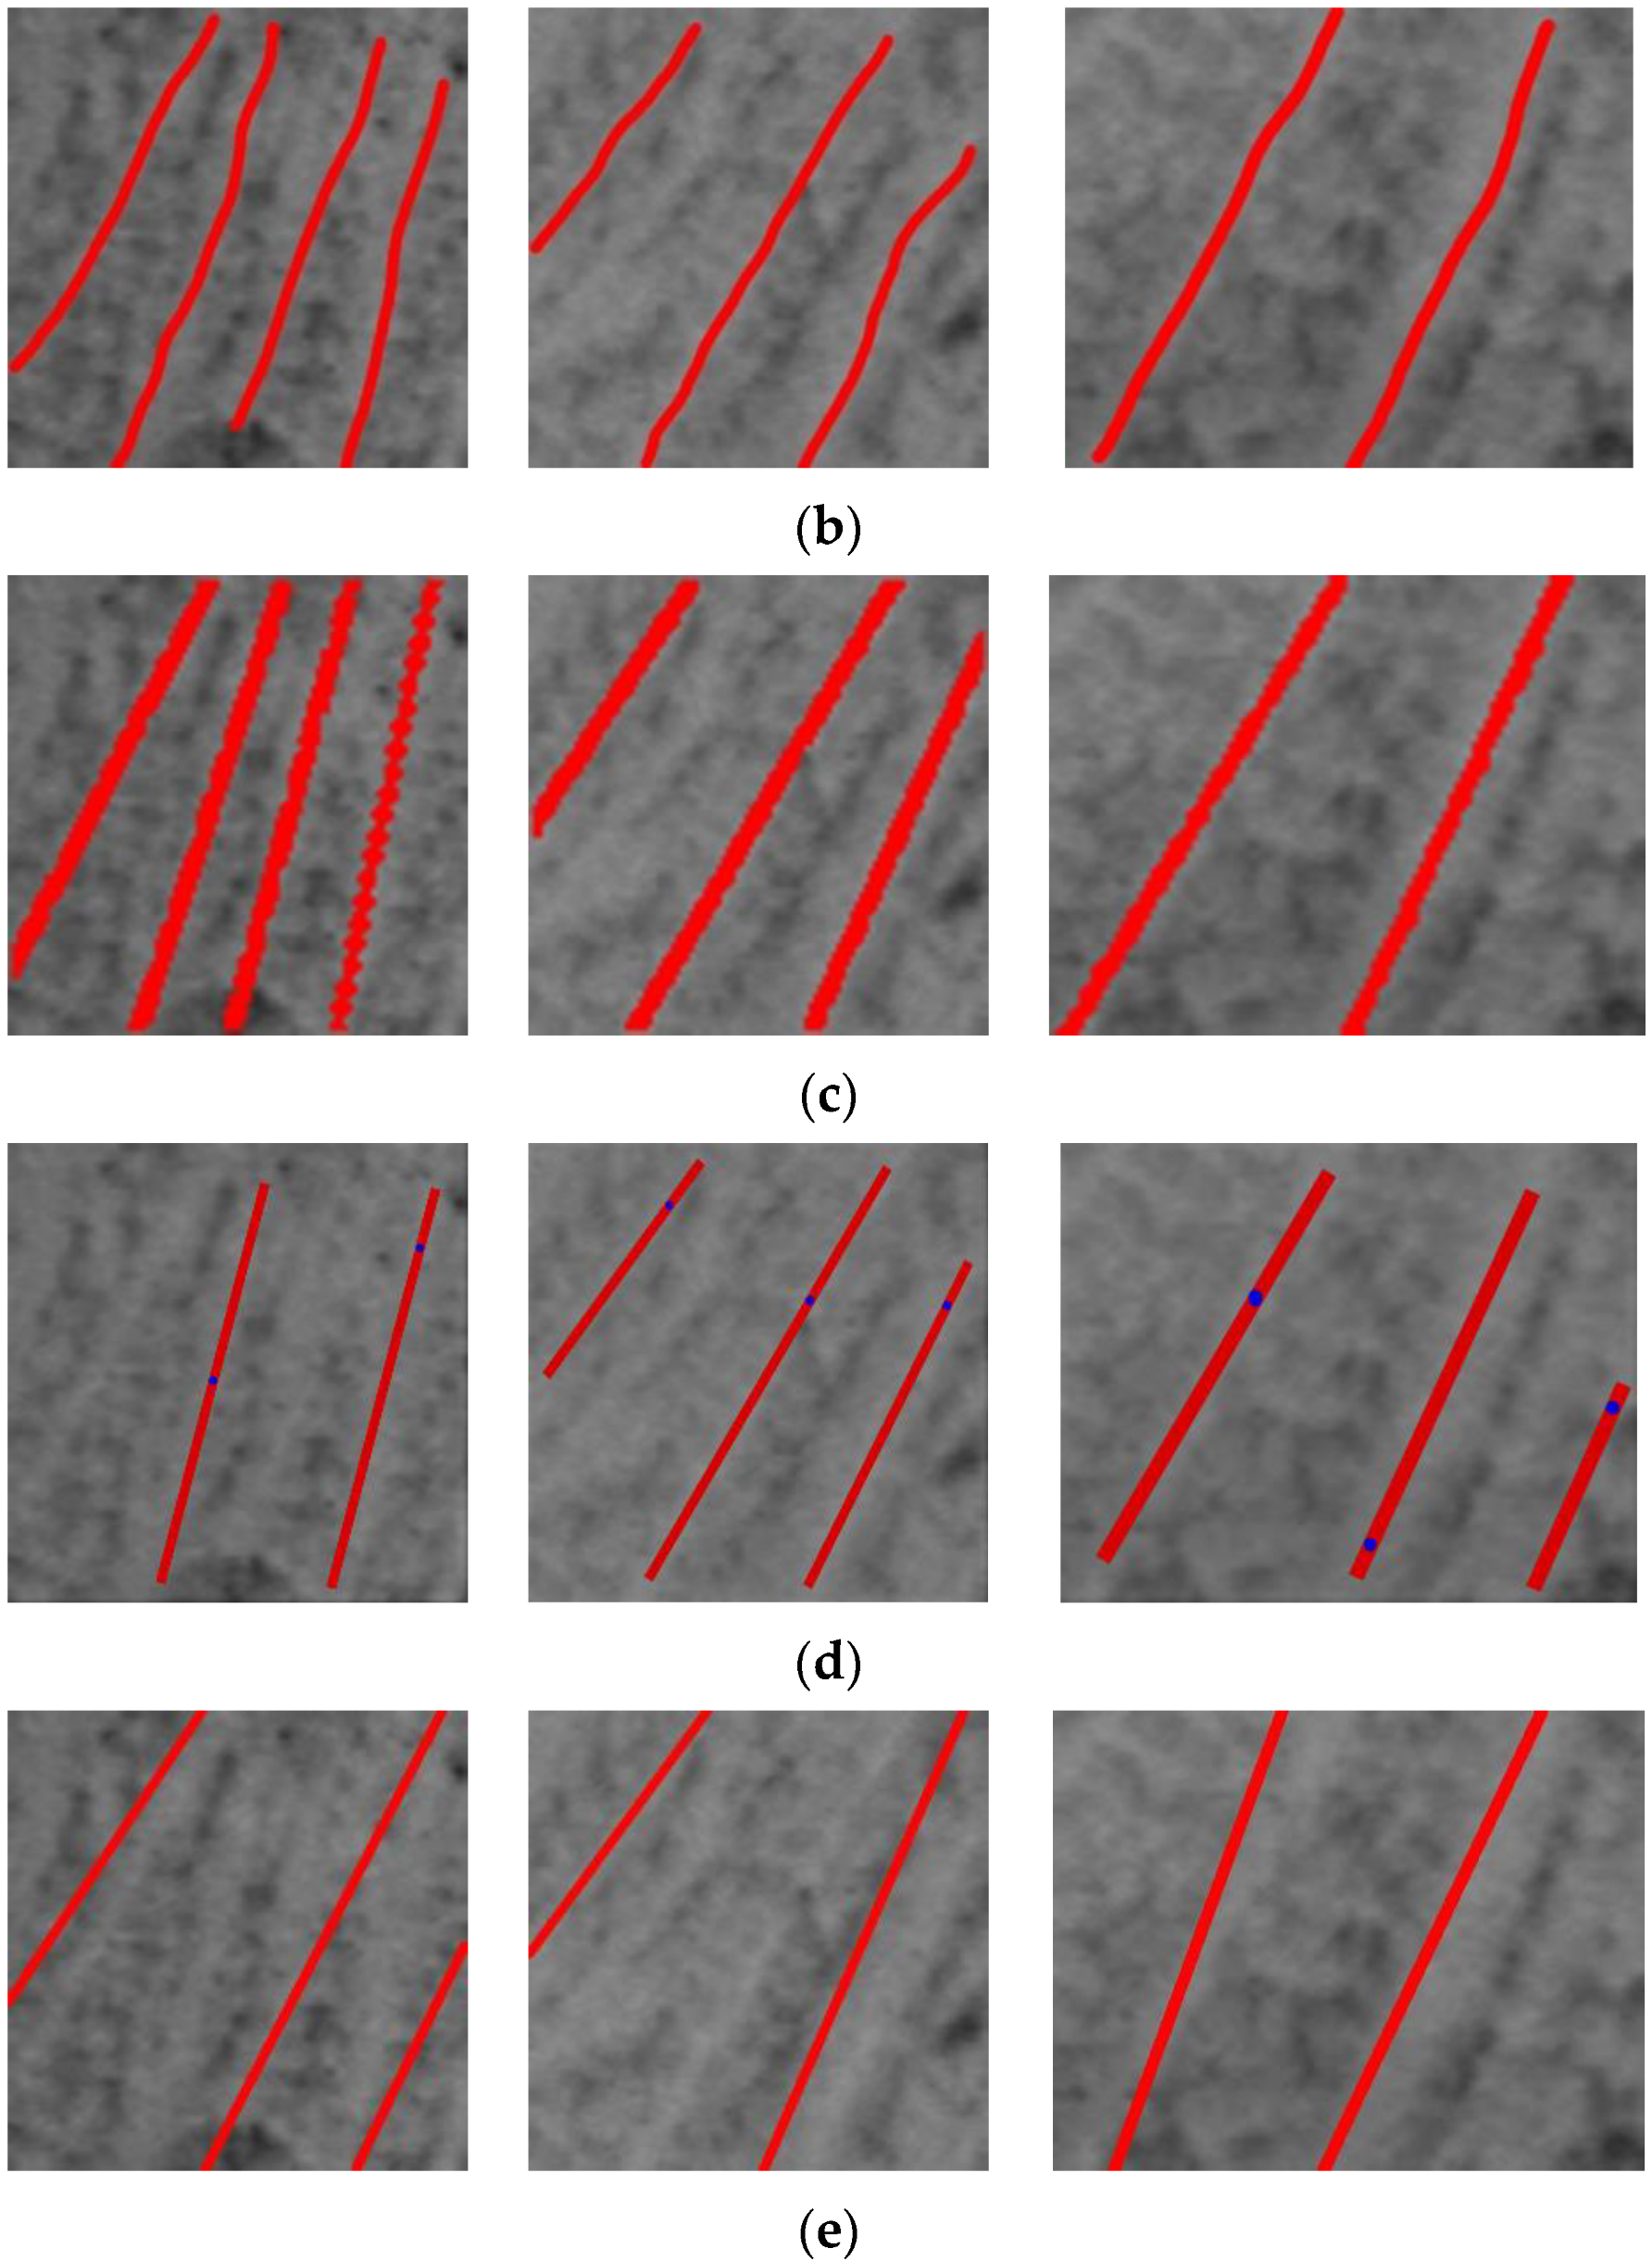
Three different dendrite images with dendrite spacing of 30 pixels, 23 pixels, and 14 pixels were detected using the proposed method for dendrite detection. The smaller the dendrite spacing, the more difficult the detection. The detection of dendrite was conducted in three different images using the methods proposed references [19,36]. The results of the dendrite detection are shown in Figure 11. The first column shows dendrite images with dendrite spacing of 14 pixels, the second column shows dendrite images with dendrite spacing of 23 pixels, and the third column shows dendrite images with dendrite spacing of 30 pixels. From Figure 11, it can be seen that the detection results of the methods of references [19,36] have both under detection and missed detection. The method of this paper can identify good results with one dendrite detection method for different dendrite spacing images, and the number of dendrites detected is the same as the manually annotated results in Figure 11b. The detection results of the methods of references [19,36] have both under detection and missed detection. Our method effectively solves the problem of missed detection of dendrites due to low contrast and a certain universality.
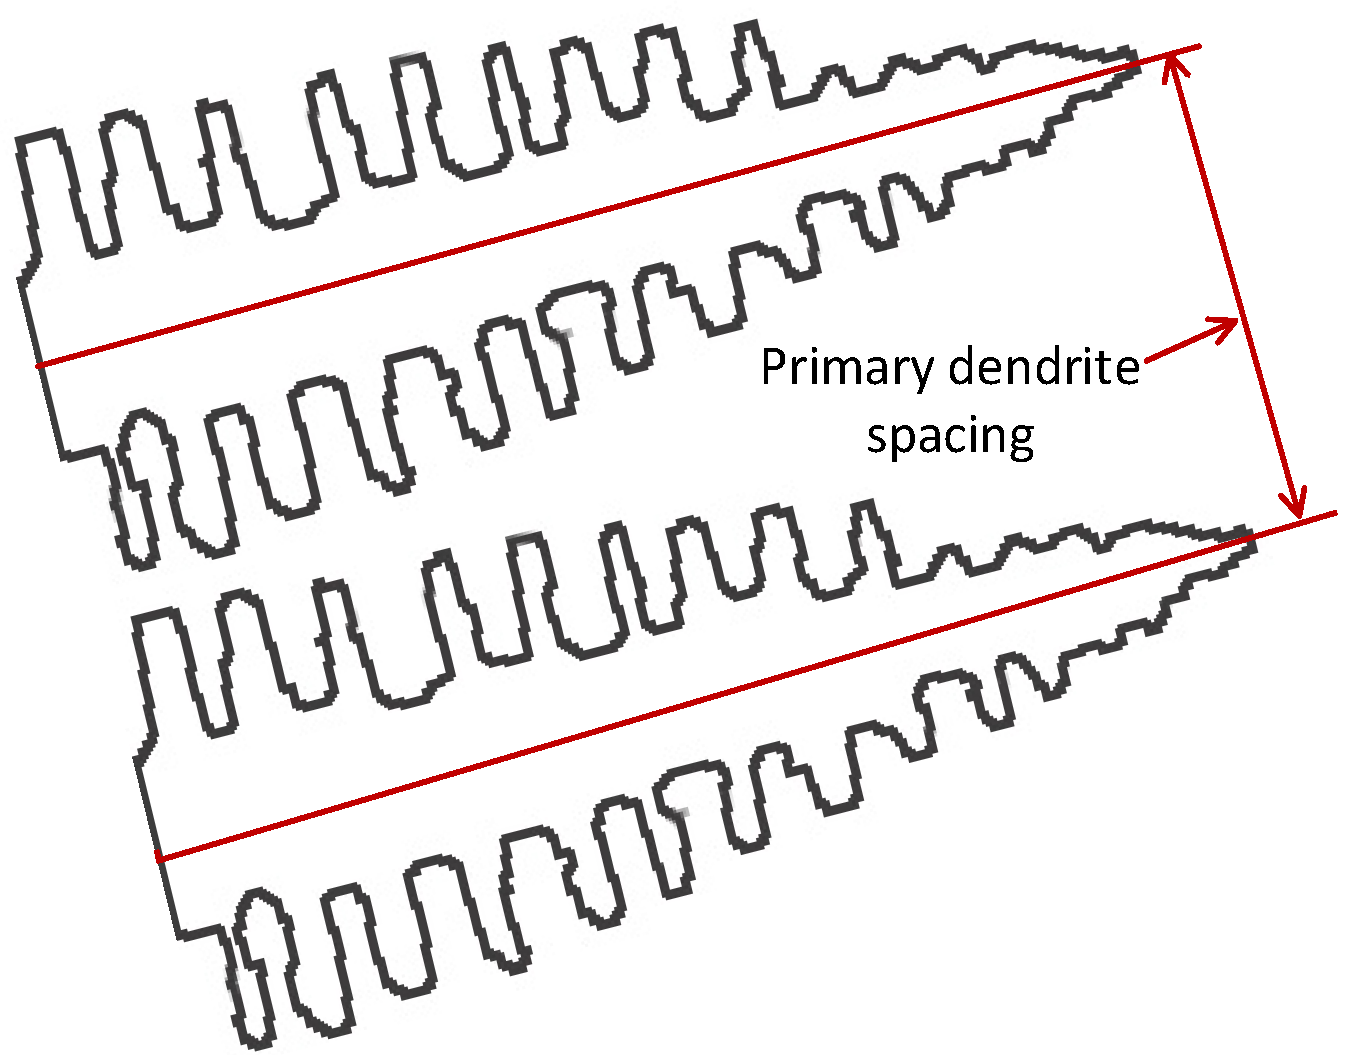
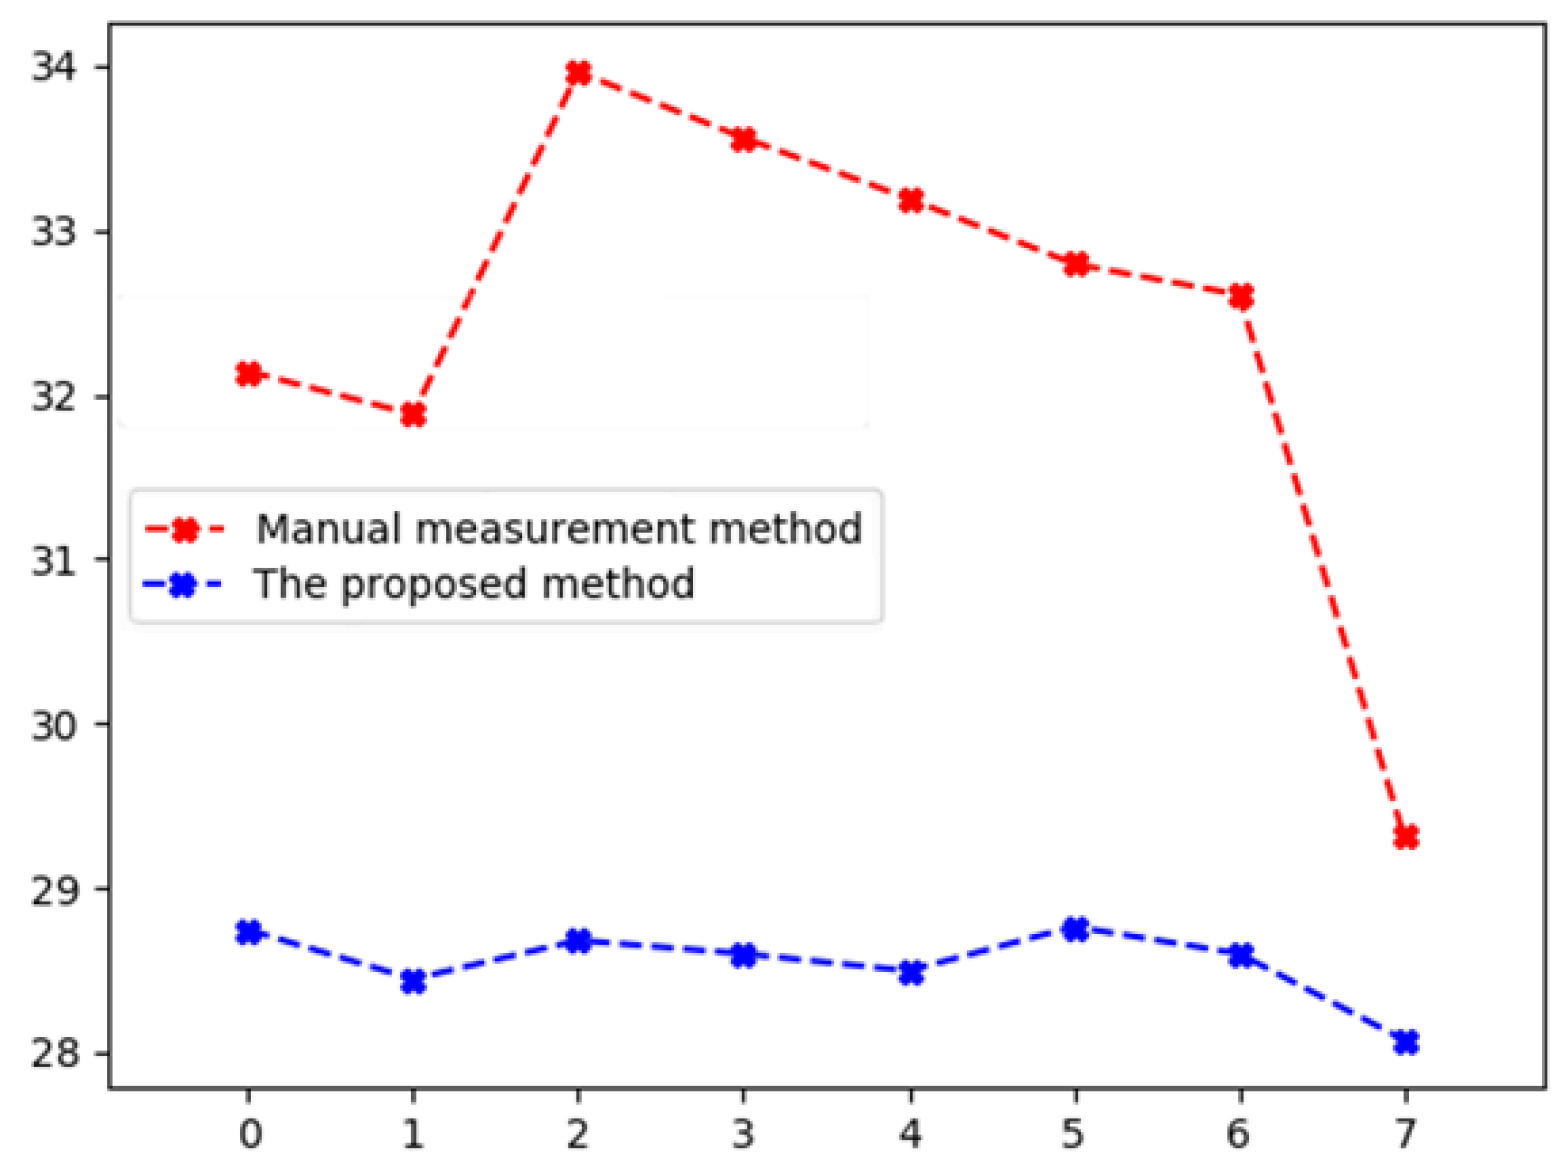
3.3. Analysis of Primary Dendrite Spacing Measurements
The primary dendrite spacing measurement method is drawing several vertical primary dendrite straight lines, and the distance between the line and the primary dendrite intersection point is the primary dendrite spacing, as shown in Figure 12. We measure the dendrite spacing of the dendrites detected via the proposed method and the manually extracted dendrites. We take eight different positions for measurement and take the average value, as shown in Figure 13. The red is the measurement result of manually extracted dendrites, and the blue is the measurement result of automatically detected dendrites via the proposed method. From Figure 13, it can be seen that the measurement result of the manual method fluctuates greatly, and the result is unstable, which is closely related to the experience and working time of the detection personnel. The measurement result of the proposed method is smoother and more stable. Primary dendrite spacing is the average value of the measured values at different positions. The PDAS of the manual measurement is 32 pixels, and the PDAS measured via the proposed method is 28 pixels. According to the dendrite image, the average width of the primary dendrite in the image studied in this paper is 10 pixels. Compared with the manual method, the error of this method is four pixels. This error is within the acceptable range, which proves the effectiveness of this method at detecting dendrites. This paper overlooks the problem of determining the center point of the primary dendrite, as identifying the center of the dendrite is a challenge [44]. The center point of the primary dendrite is the intersection of the centerline of the primary dendrite and the centerline of the secondary dendrite. The subject of this paper is the dendritic images of continuous cast slabs, which have complex compositions that lead to poor quality dendritic images and ambiguous information about secondary dendrites. Therefore, further research will be conducted on the characteristics of the secondary dendrite information to provide more accurate information for measuring the dendrite spacing.
4. Conclusions
Primary dendrite detection is one of the important steps in analysing the quality of continuous casting billets. This paper researched a dendrite detection method based on the improved Hough transform, using computer vision technology instead of the traditional manual detection method, to achieve automated dendrite detection technology and improve the detection efficiency. The following conclusions were finally obtained via this study:
- (1)
- A local contrast enhancement algorithm based on genetic algorithm was proposed, which searched for the optimal gain coefficients by genetic algorithm and established an evaluation function based on the local grayscale, which ensured the improvement of image contrast while retaining more dendrite information.
- (2)
- We proposed an image binarization method based on a Hessian matrix. By considering a dendrite as a three-dimensional surface and setting the criterion to binarize the image, more detailed features of the dendrite can be retained, which provided more comprehensive dendrite information for dendrite detection.
- (3)
- To improve the traditional Hough transform method and use the improved method to perform dendrite detection, the voting mechanism was modified to ensure the continuity of the dendrites, and according to the principle that the dendrites are parallel to each other, the voting were are optimized to reduce the computational effort. Compared to the manual detection results, the error was four pixels, which could provide information for the subsequent calculation of dendrite inclination angle and primary dendrite spacing parameters to measure the quality of casting billet.
Author Contributions
Conceptualization, Z.X.; methodology, Y.W.; software, Y.W.; writing—original draft preparation, Y.W.; writing—review and editing, Y.W.; supervision, Q.H. All authors have read and agreed to the published version of the manuscript.
Funding
This research received no external funding.
Data Availability Statement
The data presented in this study are available on request from the corresponding author. The data are not publicly available because they are still under research.
Conflicts of Interest
The authors declare no conflicts of interest.
References
- Wang, W.; Liang, C.E.; Zeng, J. Mechanism of Tempered Sorbite Formation and Related Enhanced Mechanical Properties for a Typical High Carbon Steel Billet Under Strong Cooling Intensity. Metall. Mater. Trans. B 2021, 52, 4061–4069. [Google Scholar] [CrossRef]
- Yang, J.; Chen, D.; Long, M.; Duan, H. Transient flow and mold flux behavior during ultra-high speed continuous casting of billet. J. Mater. Res. Technol. 2020, 9, 3984–3993. [Google Scholar] [CrossRef]
- Zhao, X.; Liu, L.; Zhang, W.; Yu, Z.; Fu, H. Microstructure and orientation variation during cell/dendrite transition in directional solidification of a single crystal nickel-base superalloy. Mater. Chem. Phys. 2011, 125, 55–58. [Google Scholar] [CrossRef]
- Yuan, L.; Lee, P.D. Dendritic solidification under natural and forced convection in binary alloys: 2d versus 3d simulation. Model. Simul. Mater. Sci. Eng. 2010, 18, 055008. [Google Scholar] [CrossRef]
- Lee, J.; Ohno, M.; Shibuta, Y.; Takaki, T. Uniquely selected primary dendrite arm spacing during competitive growth of columnar grains in Al–Cu alloy. J. Cryst. Growth. 2021, 18, 055008. [Google Scholar] [CrossRef]
- Strickland, J.; Nenchev, B.; Dong, H. On directional dendritic growth and primary spacing—A review. Crystals 2020, 10, 627. [Google Scholar] [CrossRef]
- Zhao, X.; Lin, L.; Yu, Z.; Zhang, W.; Fu, H. Microstructure development of different orientated nickel-base single crystal superalloy in directional solidification. Mater. Charact. 2010, 61, 7–12. [Google Scholar] [CrossRef]
- Krawczyk, J.; Paszkowski, R.; Bogdanowicz, W.; Hanc-Kuczkowska, A.; Sieniawski, J.; Terlecki, B. Defect Creation in the Root of Single-Crystalline Turbine Blades Made of Ni-Based Superalloy. Materials 2019, 12, 870. [Google Scholar] [CrossRef]
- Roskosz, S.; Adamiec, J. Methodology of quantitative evaluation of porosity, dendrite arm spacing and grain size in directionally solidified blades made of CMSX-6 nickel alloy. Mater. Charact. 2009, 60, 1120–1126. [Google Scholar] [CrossRef]
- Hu, W.; Li, S.M.; Chen, W.J.; Gao, S.F.; Liu, L.; Fu, H.Z. Primary dendrite arm spacing during unidirectional solidification of Pb–Bi peritectic alloys. J. Alloys Compd. 2009, 484, 631–636. [Google Scholar] [CrossRef]
- Somboonsuk, K.; Trivedi, R. Dynamical studies of dendritic growth. Acta Metall. 1985, 33, 1051–1060. [Google Scholar] [CrossRef]
- Matache, G.; Stefanescu, D.; Puscasu, C.; Alexandrescu, E. Dendritic segregation and arm spacing in directionally solidified CMSX-4 superalloy. Int. J. Cast Met. Res. 2016, 29, 303–316. [Google Scholar] [CrossRef]
- Wu, H.J.; Ning, W.; Bao, Y.P.; Wang, G.X.; Xiao, C.P.; Liu, J.J. Effect of M-EMS on the solidification structure of a steel billet. Int. J. Miner. Metall. Mater. 2011, 18, 159–164. [Google Scholar] [CrossRef]
- Brundidge, C.L.; Miller, J.D.; Pollock, T.M. Development of Dendritic Structure in the Liquid-Metal-Cooled, Directional-Solidification Process. Metall. Mater. Trans. A 2011, 42, 2723–2732. [Google Scholar] [CrossRef]
- Brundidge, C.L.; Vandrasek, D.; Wang, B.; Pollock, T.M. Structure Refinement by a Liquid Metal Cooling Solidification Process for Single-Crystal Nickel-Base Superalloys. Metall. Mater. Trans. A 2011, 43, 965–976. [Google Scholar] [CrossRef]
- Osório, W.R.; AFreire, C.M.; Garcia, A. Dendritic solidification microstructure affecting mechanical and corrosion properties of a Zn4Al alloy. J. Mater. Sci. 2005, 40, 4493–4499. [Google Scholar] [CrossRef]
- Takaki, T.; Ohno, M.; Shimokawabe, T.; Aoki, T. Two-dimensional phase-field simulations of dendrite competitive growth during the directional solidification of a binary alloy bicrystal. Acta Mater. 2014, 81, 272–283. [Google Scholar] [CrossRef]
- GB/T 14999.7-2010; Test Methods for Grain Sizes, Primary Dendrite Spacing and Microshrinkage of Superalloy Castings. China National Standardization Administration: Beijing, China, 2010.
- Nenchev, B.; Strickland, J.; Tassenberg, K.; Perry, S.; Gill, S.; Dong, H. Automatic Recognition of Dendritic Solidification Structures: DenMap. J. Imaging 2020, 6, 19. [Google Scholar] [CrossRef]
- Wang, J.J.; Meng, H.J.; Yang, J.; Xie, Z. A fast method based on GPU for solidification structure simulation of continuous casting billets. J. Comput. Sci. 2021, 48, 101265. [Google Scholar] [CrossRef]
- Ci, S.; Liang, J.; Li, J.; Wang, H.; Zhou, Y.; Sun, X.; Zhang, H.; Ding, Y.; Zhou, X. Prediction of Primary Dendrite Arm Spacing in Pulsed Laser Surface Melted Single Crystal Superalloy. Acta Metall. Sin. 2020, 34, 483–494. [Google Scholar] [CrossRef]
- Lee, W.; Jeong, Y.; Lee, J.W.; Lee, H.; Kang, S.H.; Kim, Y.M.; Yoon, J. Numerical simulation for dendrite growth in directional solidification using LBM-CA (cellular automata) coupled method. J. Mater. Sci. Technol. 2020, 14, 15–24. [Google Scholar] [CrossRef]
- Yan, X.W.; Guo, X.; Liu, Y.L.; Gong, X.F.; Xu, Q.Y.; Liu, B.C. Numerical simulation of dendrite growth in Ni-based superalloy casting during directional solidification process. Trans. Nonferrous Met. Soc. China 2019, 29, 338–348. [Google Scholar] [CrossRef]
- Xiao, W.; Li, S.; Wang, C.; Shi, Y.; Mazumder, J.; Xing, H.; Song, L. Multi-scale simulation of dendrite growth for direct energy deposition of nickel-based superalloys. Mater. Des. 2019, 164, 107553. [Google Scholar] [CrossRef]
- Xiao, G.; Zhu, B.; Zhang, Y.; Zhang, Y.; Gao, H. FCSNet: A quantitative explanation method for surface scratch defects during belt grinding based on deep learning. Comput. Ind. 2023, 144, 103793. [Google Scholar] [CrossRef]
- Wang, N.; Tang, Y.; Wu, Y.; Zhang, Y.; Dai, Y.; Zhang, J.; Zhang, R.; Xu, Y.; Sun, B. Dynamic evolution of microstructure morphology in thin-sample solidification: Deep learning assisted synchrotron X-ray radiography. Mater. Charact. 2021, 181, 111451. [Google Scholar] [CrossRef]
- Shashank, K.C.; Yang, X.; Vincent, D.A.; Francesco, D.C.; William, S.; Doga, G.; Nikhilesh, C. Automated correlative segmentation of large Transmission X-ray Microscopy (TXM) tomograms using deep learning. Mater. Charact. 2018, 142, 203–210. [Google Scholar] [CrossRef]
- Wan, W.H.; Li, D.L.; Wang, H.Z.; Xiao, C.B. Automatic Identification and Quantitative Characterization of Primary Dendrite Mi- crostructure Based on Machine Learning. Crystals 2021, 11, 1060. [Google Scholar] [CrossRef]
- Ghorai, S.; Mukherjee, A.; Gangadaran, M.; Dutta, P.K. Automatic defect detection on hot-rolled flat steel products. IEEE Trans. Instrum. Meas. 2013, 62, 612–621. [Google Scholar] [CrossRef]
- Liu, K.; Wang, H.; Chen, H.; Qu, E.; Tian, Y.; Sun, H. Steel Surface Defect Detection Using a New Haar-Weibull-Variance Model in Unsupervised Manner. IEEE Trans. Instrum. Meas. 2017, 66, 2585–2596. [Google Scholar] [CrossRef]
- Ye, H.; Zhang, Z.; Dan, Y.; Gan, P.; Deng, J.; Pan, Z. Novel Method for Measurement of Rebar State of Cement Tower. IEEE Trans. Instrum. Meas. 2021, 70. [Google Scholar] [CrossRef]
- Tschopp, M.A.; Miller, J.D.; Oppedal, A.L.; Solanki, K.N. Characterizing the local primary dendrite arm spacing in directionally solidified dendritic microstructures. Metall. Mater. Trans. A 2014, 45, 426–437. [Google Scholar] [CrossRef]
- Tschopp, M.A.; Miller, J.D.; Oppedal, A.L.; Solanki, K.N. Evaluating local primary dendrite arm spacing characterization techniques using synthetic directionally solidified dendritic microstructures. Metall. Mater. Trans. A 2015, 46, 4610–4628. [Google Scholar] [CrossRef]
- Li, Z.Y.; Wang, J.S.; Xing, H.; Jin, K.; Huang, H.B. Determining dendrite arm spacing in directional solidification using a fast Fourier transform method. Comp. Mater. Sci. 2020, 173, 109463. [Google Scholar] [CrossRef]
- Monroe, W.S.; Monroe, C.; Foley, R. The spacing transform: Application and validation. Mater. Charact. 2017, 127, 88–94. [Google Scholar] [CrossRef]
- Gawert, C. Automatic Determination of Secondary Dendrite Arm Spacing in AlSi-Cast Microstructures. Materials 2021, 14, 2827. [Google Scholar] [CrossRef]
- Illingworth, J.; Kittler, J. The Adaptive Hough Transform. IEEE Trans. Pattern Anal. 1987, 9, 690–698. [Google Scholar] [CrossRef] [PubMed]
- Dijk, J. Local adaptive contrast enhancement for color images. Vis. Inf. Process. 2007. [Google Scholar] [CrossRef]
- Byrd, R.H.; Chin, G.M.; Neveitt, W.; Nocedal, J. On the Use of Stochastic Hessian Information in Optimization Methods for Machine Learning. SIAM. J Optim. 2011, 21, 977–995. [Google Scholar] [CrossRef]
- Narendra, P.M.; Fitch, R.C. Real-time adaptive contrast enhancement. IEEE Trans. Pattern Anal. 1981, 3, 655–661. [Google Scholar] [CrossRef]
- Holland, J.H. Genetic algorithms and the optimal allocation of trials. SIAM J. Comput. 1973, 2, 88–105. [Google Scholar] [CrossRef]
- Chentoufi, A.; Fatmi, A.E.; Bekri, A.; Benhlima, S.; Sabbane, M. Genetic algorithms and dynamic weighted sum method for RNA alignment. In Proceedings of the 2017 Intelligent Systems and Computer Vision (ISCV), Fez, Morocco, 17–19 April 2017. [Google Scholar] [CrossRef]
- Liang, X.; Liu, L.; Luo, M.; Yan, Z.; Xin, Y. Robust Infrared Small Target Detection Using Hough Line Suppression and Rank-Hierarchy in Complex Backgrounds. Infrared Phys. Technol. 2022, 120, 103893. [Google Scholar] [CrossRef]
- Warnken, N.; Reed, R.C. On the Characterization of Directionally Solidified Dendritic Microstructures. Metall. Mater. Trans. A 2011, 42, 1675–1683. [Google Scholar] [CrossRef]
Figure 1.
(a) Schematic of a dendrite in a dendrite image; (b) histogram equalization enhanced image; (c) Laplace enhanced image.
Figure 1.
(a) Schematic of a dendrite in a dendrite image; (b) histogram equalization enhanced image; (c) Laplace enhanced image.

Figure 2.
Algorithm flow chart.

Figure 3.
Comparison chart of dendrite image enhancement results via different methods: (a) the original image; (b) result of image enhancement via the proposed method; (c) result of image enhancement via histogram equalization; (d) result of image enhancement via the Laplace method.
Figure 3.
Comparison chart of dendrite image enhancement results via different methods: (a) the original image; (b) result of image enhancement via the proposed method; (c) result of image enhancement via histogram equalization; (d) result of image enhancement via the Laplace method.

Figure 4.
Comparison of the dendrite image binarization results: (a) original image of dendrite; (b) the binarization result of the proposed method; (c) binarization results of the Otsu method; (d) binarization results of the adaptive threshold.
Figure 4.
Comparison of the dendrite image binarization results: (a) original image of dendrite; (b) the binarization result of the proposed method; (c) binarization results of the Otsu method; (d) binarization results of the adaptive threshold.

Figure 5.
The straight line in rectangular coordinate system and polar coordinate system.

Figure 6.
Line chart with the maximum number of votes per radius.

Figure 7.
Image of lines with the largest number of votes per radius.

Figure 8.
Flow chart of the error dendrite removal algorithm.

Figure 9.
Image of primary dendrite extraction results.

Figure 10.
Comparison of the results of dendritic detection via different methods: (a) results of the method of reference [19]; (b) results of the method of reference [36]; (c) results of manual labeling; (d) results of the proposed method.

Figure 11.
Dendrite detection results for different dendrite images: (a) original dendrite image; (b) manual labeling results; (c) the proposed method; (d) the method of reference [19]; (e) the method of reference [36].


Figure 12.
Primary dendrite spacing diagram.

Figure 13.
Comparison of dendrite spacing measurement results identified via different methods.


Table 1.
Evaluation table for different methods of image enhancement.
| Method | Evaluation Function Values |
|---|---|
| Histogram equalization | 0.74 |
| Laplace enhancement | 0.48 |
| Proposed method | 0.79 |
Disclaimer/Publisher’s Note: The statements, opinions and data contained in all publications are solely those of the individual author(s) and contributor(s) and not of MDPI and/or the editor(s). MDPI and/or the editor(s) disclaim responsibility for any injury to people or property resulting from any ideas, methods, instructions or products referred to in the content. |
© 2024 by the authors. Licensee MDPI, Basel, Switzerland. This article is an open access article distributed under the terms and conditions of the Creative Commons Attribution (CC BY) license (https://creativecommons.org/licenses/by/4.0/).
Share and Cite
MDPI and ACS Style
Wang, Y.; He, Q.; Xie, Z. Automatic Detection of Cast Billet Dendrite Based on Improved Hough Transform. Crystals 2024, 14, 265. https://doi.org/10.3390/cryst14030265
AMA Style
Wang Y, He Q, Xie Z. Automatic Detection of Cast Billet Dendrite Based on Improved Hough Transform. Crystals. 2024; 14(3):265. https://doi.org/10.3390/cryst14030265
Chicago/Turabian StyleWang, Yuhan, Qing He, and Zhi Xie. 2024. "Automatic Detection of Cast Billet Dendrite Based on Improved Hough Transform" Crystals 14, no. 3: 265. https://doi.org/10.3390/cryst14030265
Note that from the first issue of 2016, this journal uses article numbers instead of page numbers. See further details here.