
Experimental and Theoretical Insights into a Novel Lightfast Thiophene Azo Dye
by
 , , , ,
Rosita Diana
1,*,
Lucia Sessa
2,* ,
,
Simona Concilio
2 ,
,
Stefano Piotto
2,
Luigi Di Costanzo
1,
Antonio Carella
3 and
Barbara Panunzi
1 1
Department of Agricultural Sciences, University of Naples Federico II, Via Università 100, 80055 Portici, Italy
2
Department of Pharmacy, University of Salerno, Via Giovanni Paolo II 132, 84084 Fisciano, Italy
3
Department of Chemical Sciences, University of Naples Federico II, Strada Comunale Cinthia, 26, 80126 Napoli, Italy
*
Authors to whom correspondence should be addressed.
Crystals 2024, 14(1), 31; https://doi.org/10.3390/cryst14010031
Submission received: 22 November 2023
/
Revised: 20 December 2023
/
Accepted: 23 December 2023
/
Published: 27 December 2023
Abstract
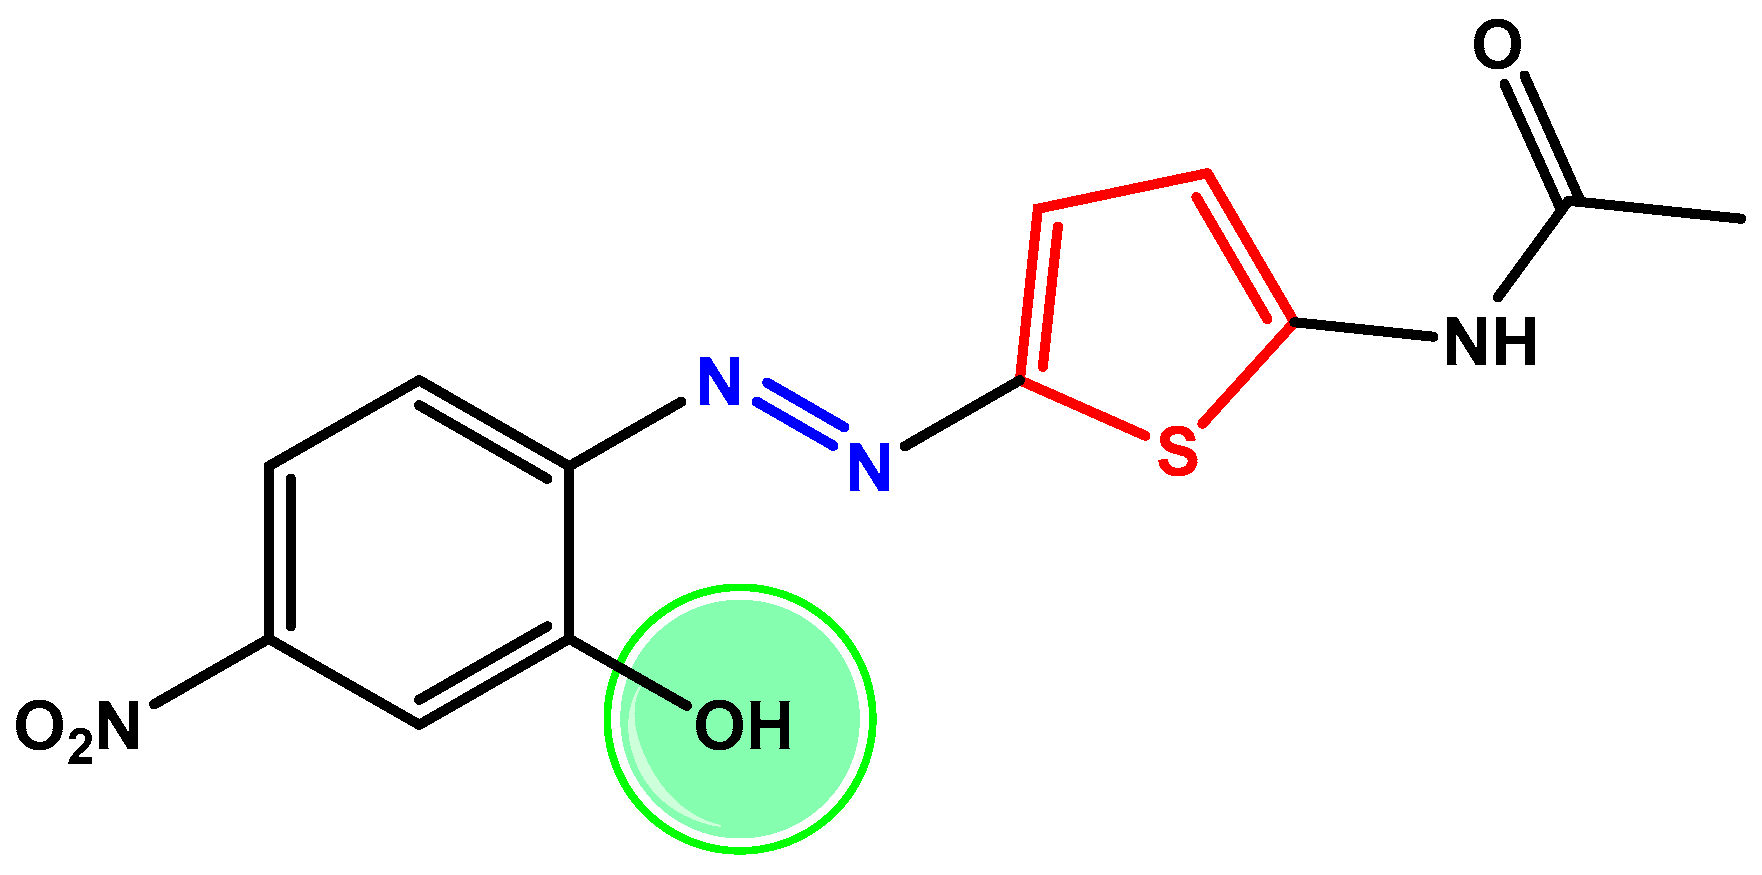
:Thiophene ring-enhancing electron delocalization imparts unique properties to azoic chromophore tools. The novel TA-OH dye contains a push–pull π-electron system, including a thiophene-azo scaffold with a hydroxyl group at the ortho position to the azo bridge. The hydroxyl group is expected to lock the azo bridge in its trans conformation, concurring with the photostability and fastness of the dye. The single crystal analysis identified the molecule’s primary conjugation plane, and the theoretical analysis provided electronic pattern insights. The absorption behavior and the trans-to-cis conversion were examined from both experimental and theoretical perspectives. The effect of solvent polarity and the role of pH on the photophysical properties were explored. The solvent polarity strongly affects the absorbance spectrum of TA-OH, therefore potentially making NLO active. Additionally, TA-OH exhibited pH responsiveness akin to classic dichromatic pH indicators, with a noticeable color shift from red to blue observed as pH transitioned from neutral to alkaline. Absorbance titration experiments, along with experimental/theoretical determination of pKa, defined the pH sensing ability.
1. Introduction
Azo compounds have a long history dating from the turn of the 20th century. Due to their tunable chromatic range, they began to be produced as dyes for leather and textiles or as pigments in the industries of rubber and plastic. More recently, azo compounds have gained interest in cutting-edge applications such as optoelectronics, photomechanics, chemical sensing, and imaging [1,2,3,4,5,6,7]. As azo compounds can exist in the trans (E) and cis (Z) forms, interconverting by light, their photoswitching mechanism has been intensively studied for the selective response to external stimuli (as light, temperature, pH, and chemical analytes). Different substituents affecting intramolecular interactions are expected to block or endorse the trans-to-cis conversion. The two conditions can be requested differently: isomerization blocked for the colorimetric stability of the dye; isomerization allowed for the photochromic responsivity of the sensor.
Despite azobenzene derivatives being archetypical molecular switches [4,8,9], heteroaryl azo compounds have recently attracted attention [10,11,12]. Heteroaryl azo dyes offer a broader structural and spectral diversity [11]. Specifically, five-member hetero-aromatic rings show distinctive photochemical and photophysical properties, characteristic steric profiles, and molecular geometries. However, only a few azo heterocycles have been thoroughly investigated, and interest has focused mainly on the nitrogen-based azo-heterocycles [10,13,14].
Thiophene is an aromatic heterocyclic compound with one sulfur atom linked in a penta-atomic ring structure. Theoretical calculations indicate a lower aromaticity than benzene, with the participation of the lone electron pairs on sulfur atoms in forming the aromatic π cloud. Due to its unique nature, thiophene has been employed as a crucial scaffold for the assembly of conductive materials in optoelectronics, for agrochemicals, pharmaceuticals, and as dye compounds [13,15]. In the specific sub-class of the thiophene azo dyes, the thiophene group enhances electron delocalization and imparts color strength, stability, and solubility [16,17].
In a previous article, we designed a group of azo dyes containing a thiophene ring and highly conjugated scaffolds with donor/acceptor substituents [18]. Their large π-conjugation pattern is combined with excellent nonlinear optic (NLO) properties. Interestingly, replacing a phenyl ring with a thiophene one resulted in an improved push–pull effect and, therefore, in molecular hyperpolarizability values and molar extinction coefficients [2,19,20,21,22,23,24].
This study reports a comprehensive experimental and theoretical analysis of the structure-property relationship of a novel azothiophene chromophore named TA-OH (Figure 1). Based on our study of the functionalization-properties relationship of azo dyes, the molecule could be worthy of interest in many aspects. First, similar thiophene azo dyes are known for their moderate to good light fastness, which is increased compared to the corresponding benzene derivatives [13]. Furthermore, the simple structure of TA-OH promised significant colorimetric performance, both qualitative and quantitative.
The compound TA-OH was obtained by a standard diazotation reaction of the 2-amino-5-nitrophenol diazonium salt with 2-acetamide thiophene and identified by NMR and MS analysis. The novel dye contains a push–pull donor-acceptor electronic pattern with a thiophene-azo scaffold bearing a hydroxyl group at the ortho position to the azo bridge. The hydroxyl group locking the azo bridge in its trans conformation is expected to promote the photostability and fastness of the dye. Single crystal X-ray analysis pointed out the main conjugation plane of the molecule, whose HOMO-LUMO levels were determined by DFT analysis. The absorption behavior and the trans-to-cis conversion were examined from both experimental and theoretical points of view. Solvatochromism was explored, revealing potential NLO activity. A pH response was observed in the manner of classical dichromatic pH indicators. Absorbance titration experiments and experimental/theoretical determination of pKa helped define pH sensing ability.
2. Materials and Methods
Commercially available starting products were purchased from Sigma Aldrich (Milan, Italy).
NMR spectra were recorded in DMSO-d6 with a Bruker Advance II 400 MHz apparatus (Bruker Corporation, Billerica, MA, USA). For 13C NMR spectra (reported in the Supplementary Materials, Figures S4–S6), the experiment was a DEPTQ (Distorsionless Enhancement by Polarization Transfer Including the Detection of Quaternary Nuclei) polarization transfer with decoupling during acquisition using a shaped pulse for a 180-degree pulse on the f1 channel.
For mass spectrometry measurements, the samples were analyzed by direct flow injection using an LTQ Orbitrap XL mass spectrometer (Thermo Scientific, San Jose, CA, USA), operating in positive and/or negative ionization mode. The Orbitrap mass analyzer was calibrated according to the manufacturer’s directions using a mixture of caffeine, methionine-arginine phenylalanine-alanine-acetate (MRFA), sodium dodecyl sulfate, sodium taurocholate, and Ultramark 1621. Data were collected and analyzed using the software provided by the manufacturer.
UV-visible absorption spectra were recorded by a JASCO F-530 spectrometer (scan rate 200 nm min−1, JASCO Inc., Easton, MD, USA) on 10−5 M in commercial buffer solutions. For the UV-vis experiments, stock solutions (1.00 M) of Britton-Robinson buffer (at 3.5, 4.5, 5.5, 6.5, 7.5, 8.5, 9.5, 10.5, and 11.5 pH values) were prepared in bi-distilled water as described in the literature [25]. Stock solutions of TA-OH (10−5 M) were prepared in acetone and bi-distilled water (1:1). Spectra of the molecule were performed by adding 60 µL of the buffer stock solutions to 2.5 mL of the TA-OH stock solution. After mixing for a few seconds, the absorption spectra were recorded at room temperature.
2.1. Synthesis of TA-OH
In 15 mL of water and 37% hydrochloric acid (1:1), 3.5 mg of 2-acetamide thiophene [26] was suspended, and the suspension was kept at 4 °C in an ice-water bath. Simultaneously, 5.0 g of diazonium salt of 2-amino-5-nitrophenol was dissolved in 40 mL of ethanol and then dropped into the 2-acetamide thiophene suspension. The suspension was allowed to react under stirring for about 60 min, and then the product was precipitated by pouring the reaction solution into water and ice. The product was recovered by filtration and washed with water, resulting in a dark red solid. The solid was then crystallized from acetone/hexane into red crystals. Yield: 85%. 1H NMR (DMSO-d6; 400 MHz) δ: 2.16 (s, 3H), 6.81 (d, 1H, J = 4.5), 7.62 (d, 1H, J = 8.8), 7.70 (d, 1H, J = 9.4), 7.76 (s, 1H), 7.84 (d, 1H, J = 4.5) (Hard copies of 1H-NMR and 13C NMR are reported in Supplementary Materials, Figures S1 and S2). MS (m/z) 306.04, found [M-H]–: 305.03. (Hard copy in Figure S3).
2.2. Computational Method
The steepest descent energy minimization for TA-OH and TA (chemical structure in Figure S4) molecules was performed using the AMBER14 force field [27] at pH = 7 with the software Yasara Structure 22.9.24 [28] and the plugin GUIDE [29]. After the energy minimization process, the geometry of the molecule was optimized at a time-dependent DFT level (TD-DFT) [30] by using the B3LYP functional and DEF2-SVP basis set in the information of the ORCA tool, version 5.1 [31]. The optimized geometry of E state structures was further modified to a cis (Z) state by changing the dihedral angle between the azo group to 51°. The modified Z structure was further energy minimized at pH = 7. During the energy minimization process, the azo group was constrained to stabilize the Z conformation. Geometry optimization of the Z structure was performed using the B3LYP functional and DEF2-SVP basis set information at the TD-DFT level [30]. To reconstruct the transition energy profile from E to Z conversion, we applied the nudged elastic band (NEB)-based transition state calculation of TA-OH using the same functional and basis set information [32].
The calculation of the pKa of TA-OH in water was performed with the software Jaguar pKa, Schrödinger, LLC, New York, NY, 2023 [33]. The effect of pH change on the electronic properties of the molecule was investigated in both deprotonated and protonated forms to simulate the effect at high and low pH values. The UV-vis spectroscopy analysis was performed for the protonated and deprotonated forms of TA-OH in acetone solvent. We used the IboView program [34] to visualize the frontier orbitals. To generate the absorption spectra, we employed a Python script utilizing Gaussian functions to convert the transition lines detailed in Table 4 into bands.
The calculation of the dipole moment of TA-OH was performed by the ORCA tool, version 5.1 [31].
The NLO properties like first (β) and second hyperpolarizability (γ) were calculated by the PM7 model with a time-dependent Hartree Fock (TDHF) level using the MOPAC 2016 program [35]. The Hirshfeld surface calculations have been performed with the program Crystal Explorer [36].
DFT calculation of the crystal has been performed with the software CASTEP [37].
2.3. Single Crystal X-ray Analysis
Large crystals for compound TA-OH obtained by slow evaporation in acetone were collected from the XRD2 beamline at the Elettra Synchrotron Light Source, Trieste, Italy. By using a small loop of fine rayon fiber, the selected crystal was dipped in the cryoprotectant paratone oil and flash-frozen in a stream of nitrogen at 100 K. Several crystals were scanned, and a completed data set was obtained by merging data sets from two crystals for a total of 180 images (360°). Data were processed using XPrep and ShelxT, resulting in the data collection statistics reported in Section 3.6 [38].
The structure solution was found by direct methods using SIR2019 [39] and revealed the expected atom connectivity. Structure was anisotropically refined using full-matrix least-squares methods on F2 against all independently measured reflections using SHELXL [40] run under the WinGX suite [41]. All hydrogen atoms were identified in the Fourier residual map and introduced and refined in calculated positions in agreement with a riding model implemented in SHELXL. Restraints were not introduced since they did not further improve the model.
The figures were generated using Mercury CSD 3.6 [42]. Crystallographic data for TA-OH were deposited with the Cambridge Crystallographic Data Centre and can be obtained via https://www.ccdc.cam.ac.uk/structures/ (accessed on 13 May 2023).
2.4. Lightfastness
The UNI EN ISO 105-B02:2014 test was used for color fastness assessment. Light fastness was evaluated by exposing a dyed fabric to high-energy radiation (Q-SUN Xenon Test Chamber, Q-LAB, Westlake, OH, USA) in a fade-o-meter for 24 h and compared with unexposed fabric. The apparatus consists of a light source: a Xenon arc lamp with a color temperature between 5500 and 6550 K placed in a ventilated exposure chamber. Light filters reduce ultraviolet radiation. Heat filter to reduce infrared radiation. The AATCC Test method was used for evaluation (scale: 1 for poor and 8 for outstanding). In short, this method determines the color resistance of dyed fabrics to the action of an artificial light representative of natural daylight by the accelerated aging route, simulating the damage suffered by materials (and therefore the dyes contained) after continuous exposure to sunlight. Effective humidity and maximum temperature are among the parameters to be controlled. In the experiment, the sample of TA-OH adsorbed on wool was placed together with a series of blue wool samples and exposed to artificial light. At the end of the exposure, color fastness was evaluated by comparing the dyed sample to the reference blue wool samples for evaluating discoloration/fading.
3. Results and Discussion
3.1. Synthesis, Solvatochromism, Trans-to-Cis Isomerization
Our scaffold consists of a π-delocalized azo bridge bearing a thiophene ring. The amidic group as the electron donor substituent and the nitro group as the electron-withdrawing substituent are expected to cause the push–pull electronic effect.
In literature, analogous molecules without the hydroxyl group were used both as dyes and as NLO materials. In some cases, they have been investigated from a theoretical point of view regarding conformations and tautomeric equilibria [43]. On the other hand, similar structures with hydroxyl substituents are rare and mostly concern dyes and pigments. Due to the strong interest in textile applications, related literature is often reported in the form of patents, the most relevant result being from good to excellent lightfastness [44].
An efficient charge-transfer (donor-to-acceptor) in a D-A chromophore is responsible for the manifestation of NLO properties [45,46].
The push–pull conjugated structure of TA-OH is associated with a large dipole moment. The calculated value is µ = 9.04 Debye. As relevant solvatochromic shifts are characteristic of a large dipole moment and frequently suggestive of a large hyperpolarizability, we checked the effect of the solvent polarity on the absorbance spectrum of TA-OH in five solvents of different polarity. The solvatochromic trend, depending on solvent polarity, shows clearly. As detected in Table 1, the UV-vis absorption maxima of TA-OH in different solvents undergo a relevant red shift upon increasing solvent polarity. In Section 3.5, there are theoretically quantified β and γ values.
The main isomeric form of TA-OH is the trans form, due to the hydroxyl group in the ortho position to the azo bridge, which prevents isomerization in cis as it forms a hydrogen bond with a nitrogen of the azo group. We tested the isomerization of TA-OH by prolonged irradiation at 490 nm in solution, but without obtaining the cis form. Under the same experimental conditions, we could obtain the isomerization of a molecule similar to TA-OH but lacking the hydroxyl group named TA (Figures S4 and S5, Supplementary Materials). The experimental results demonstrated the role of the OH group in blocking the trans configuration. To confirm the experimental results, we also calculated the transition state energies for the trans and cis forms, collecting compliant data (see Section 3.5).
While the trans-cis photo-responsiveness of TA-OH is inhibited, the intramolecular bond ensures notable photostability, akin to the lightfastness qualities observed in numerous azo dyes [47]. Different aspects of fastness, including light, wash, and sublimation, can be assessed [48]. In our instance, the red-colored compound TA-OH, exhibiting substantial color strength, demonstrates a commendable lightfastness index: 6 (good-very good) as per UNI EN ISO 105-B02:2014.
3.2. pH Colorimetric Response
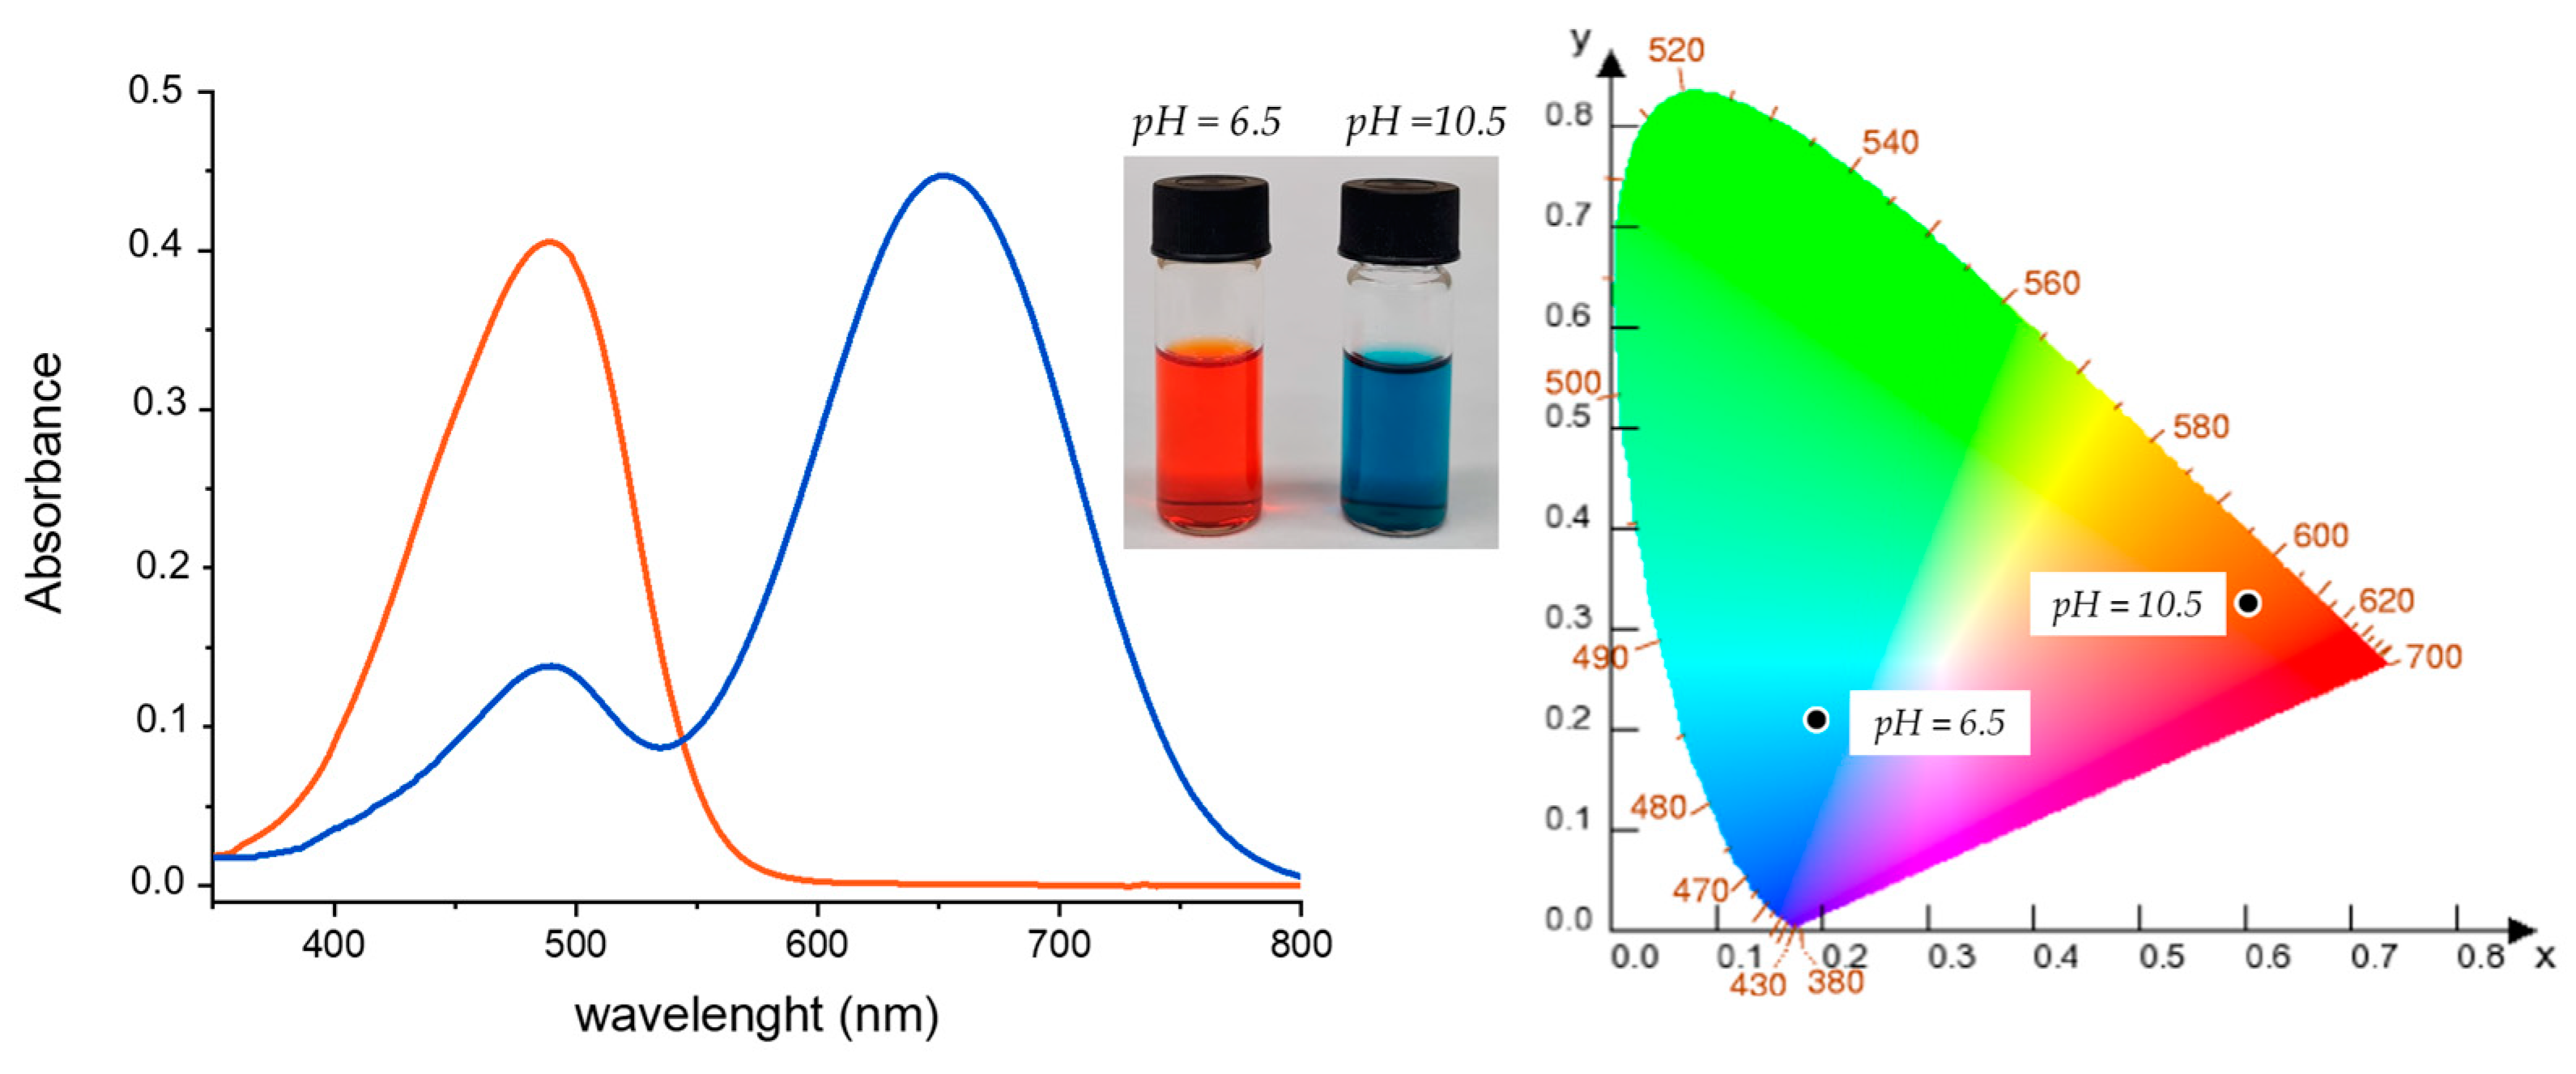
Colorimetric pH-sensitive dyes have applications as indicators and visible ratiometric sensors [3,49,50]. The hydroxyl substituent in TA-OH, as well as preventing isomerization, is expected to make the chromophore potentially pH-responsive. The highly colored solutions of TA-OH producing a strong absorption band in the visible spectrum show a distinct color change from red to blue as pH goes from almost neutral to neat alkaline. The value for pKa calculated with the software Jaguar was 8.5. The experimental UV-vis absorption spectra in acetone/water (5:1) at two different pH ranges (pH = 6.5 and 10.5 represent the fully perceivable different colors), the CIE space color diagrams, and the related colored solutions are shown in Figure 2. The experimental maximum absorption wavelengths are reported in Table 2. Buffer solutions were employed to fix pH in an acetone/water-mixed solvent [51,52].
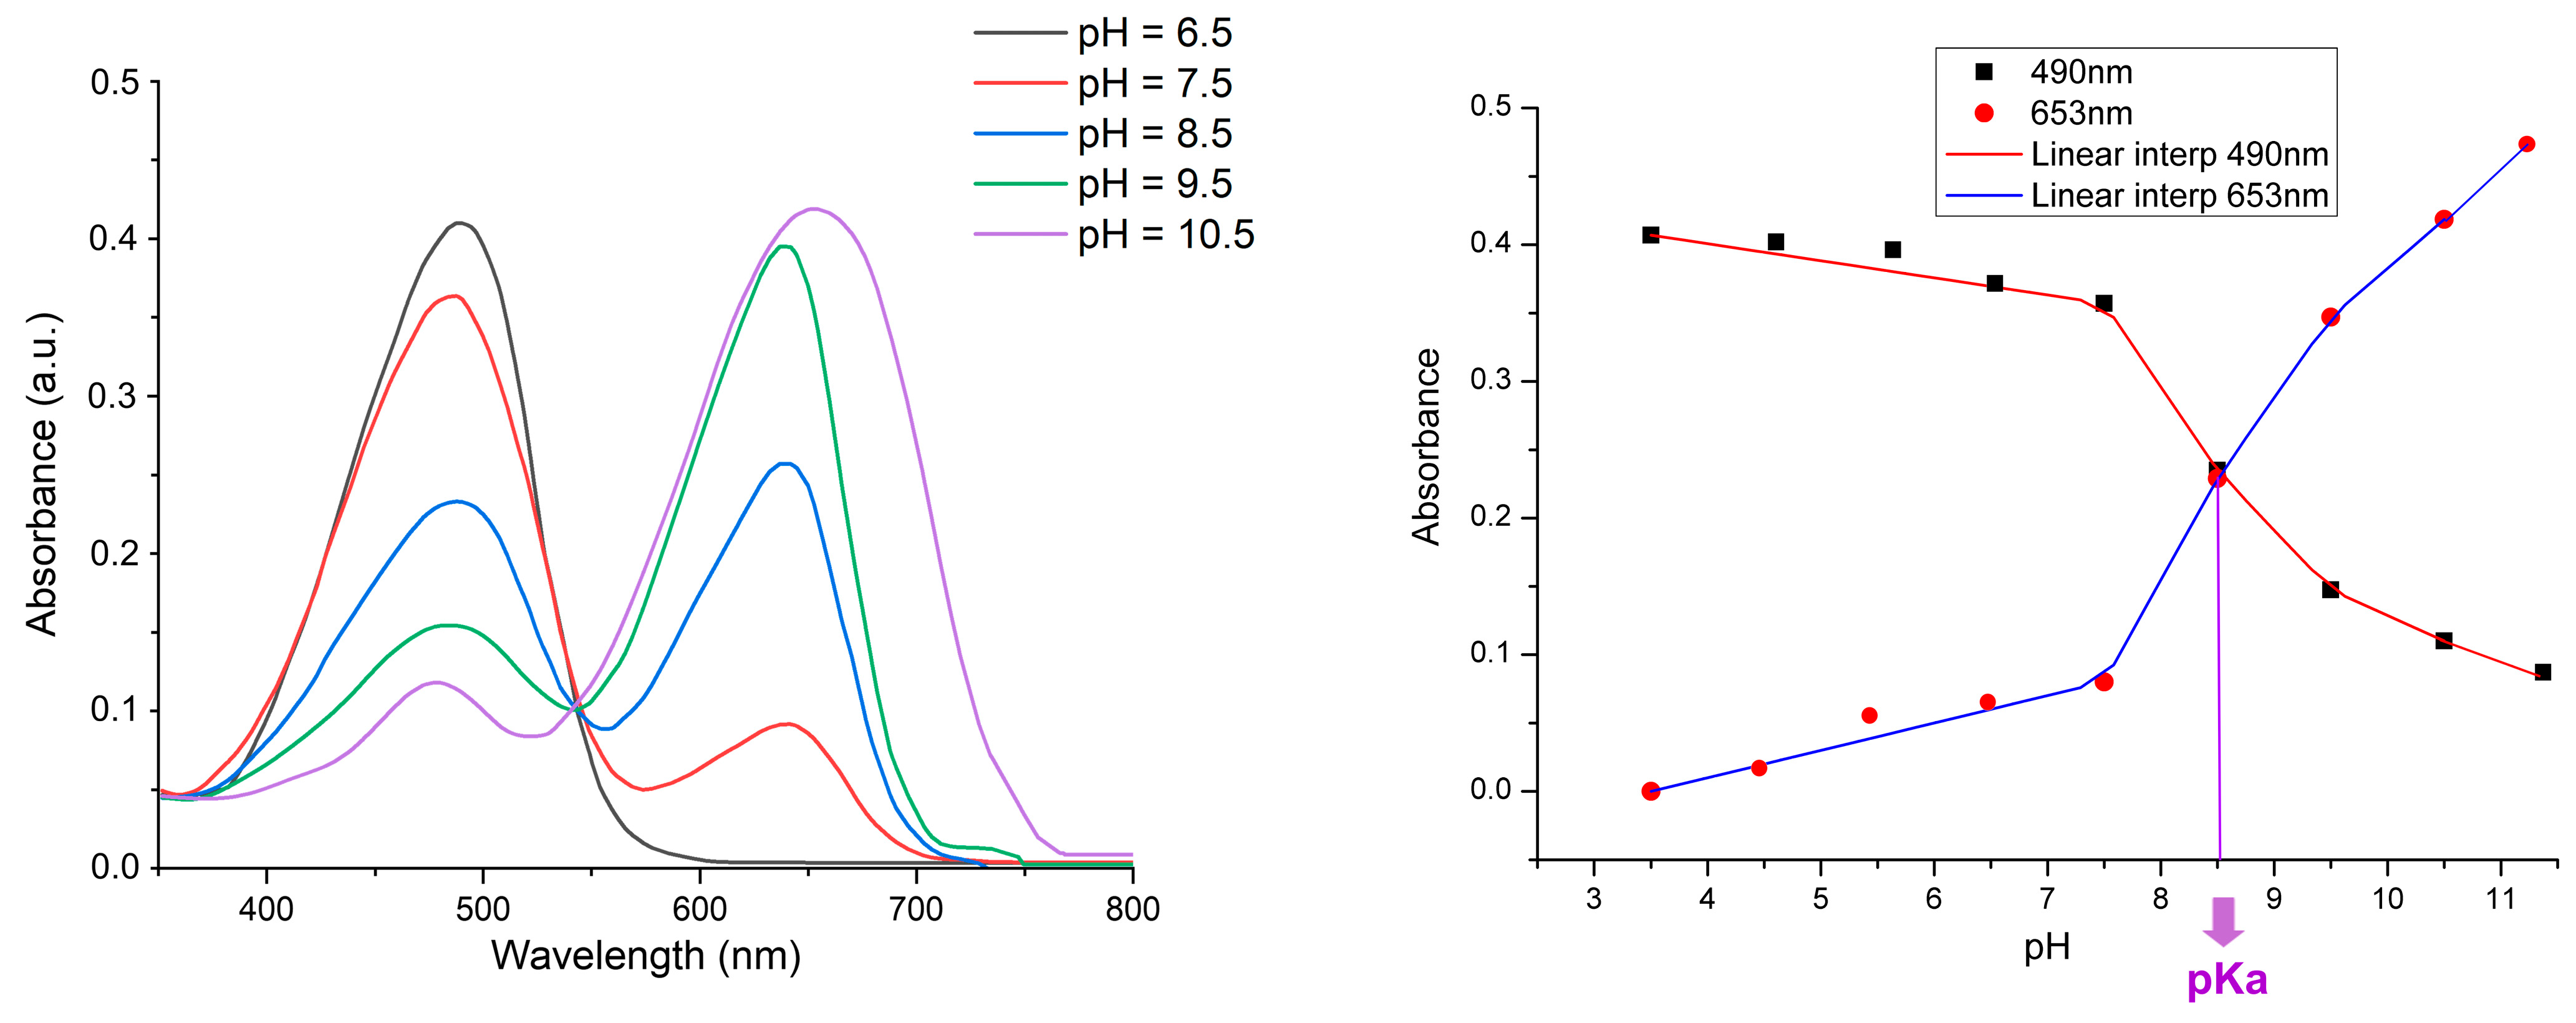
UV-vis spectral titration of TA-OH in acetone/water (5:1) buffered solutions was obtained by recording the absorbance spectrum from pH = 3.5 to pH = 11.5. In this range, the color change (red-to-blue or blue-to-red) is reversible by increasing and decreasing pH. The absorption bands drastically change in the range from pH = 6.5 to 10.5 (see Figure 2). Below pH = 6.5, the curves recorded in an acidic environment almost overlap, and the same applies above pH = 10.5. Two characteristic bands can be detected in the titration experiment, with the formation of an isosbestic point around pH = 8.5. Therefore, compound TA-OH behaves like most dichromatic pH indicators. The colorimetric switch occurs at about two pH units around pKa, as detectable in Figure 3: the band’s collapse between pH = 7.5 and 9.5 on the left and the change in slope of the two curves in the plot on the right.
The two bands detected in the titration experiment (around 490 nm and around 650 nm) can be ascribed to the formation of the deprotonated form from the protonated one. By plotting absorption intensity vs. pH, the intercept between the first band maxima suggests a pKa = 8.55, coinciding with the calculated pKa value of 8.5 (see Section 2.2). The potential for azo-hydrazone tautomerism in the dye has been duly investigated. In the protonated state, the calculated spectrum of the enolic form closely aligns with the experimental spectrum. In contrast, the spectrum of the ketone form exhibits significant disparities, leading to the conclusion that the enolic tautomer predominates at low pH. While both tautomers were considered at very high pH, the experimental data do not exhibit substantial agreement. Consequently, emphasis was placed on presenting data for a more stable tautomer.
3.3. Single-Crystal X-ray Structure
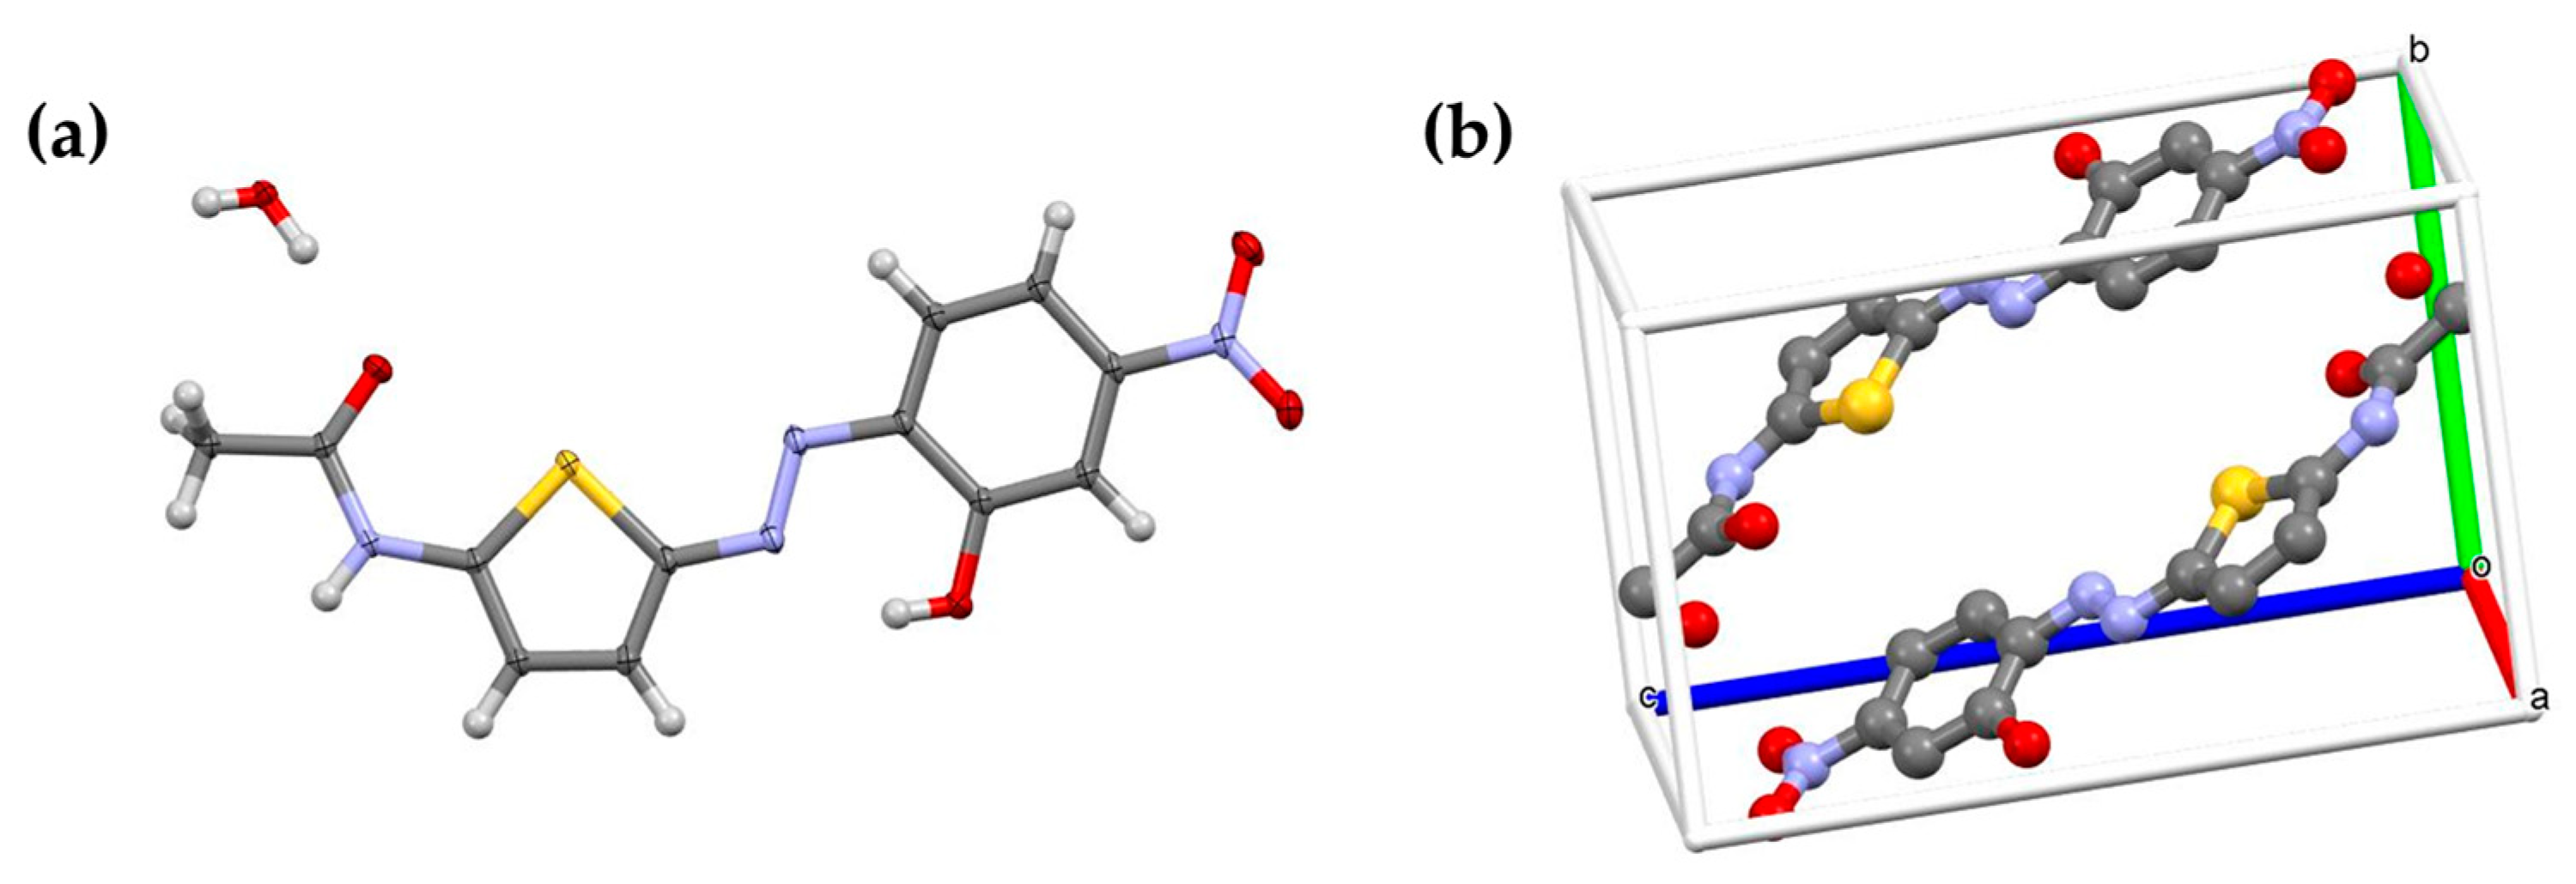
The single crystal structure of TA-OH was determined to visualize the main conjugation plane and to support theoretical assumptions. The analysis reveals a linear molecule with a central core around the thiophene group that is overall planar and has a bent shape (Figure 4). The core’s flat shape results from the electronic conjugation of the aromatic rings involved. The N=N bond on the thiophene ring adopts an E geometry and exhibits a mutual syn arrangement. Only very slight deviations are observed for the terminal nitro and acetyl groups with respect to the phenyl ring and the N=N bond. The crystal packing is stabilized by intermolecular Van der Waals interactions and self-assembled into π-stacked columns along the crystal a-b diagonal and arranged around the center of symmetry. A water molecule was identified in the crystal packing. Refinement parameters are summarized in Table 3.
3.4. Crystal Computational Analysis
The electronic band structure (EBS) and density of states (DOS) were calculated to understand the electronic structure of the molecules. The EBS provided insights into the energy levels of the valence and conduction bands, and the DOS analysis revealed the distribution of energy states. These calculations were performed to assess the conductive and electronic properties of the molecules. The calculated band gap (see Figure S6) is 0.99 eV, which places the material among semiconductors with a value intermediate to the band gaps of Si (1.14 eV) and Ge (0.67 eV). The structure of the bands is similar to that observed for other crystals with P-1 symmetry [53,54]. It was observed that the HOMO-LUMO gap of the isolated molecule undergoes a reduction from 2.67 eV to 0.99 eV in the crystal state. The crystalline organization introduces intermolecular interactions, including hydrogen bonds or van der Waals forces, impacting the spatial configuration of atomic orbitals. These interactions result in a modification of the electron gap within the crystal compared to the isolated molecular phase. Hirshfeld’s plot of the crystallographic structure illustrates the closer proximity of molecules, culminating in enhanced stabilization.
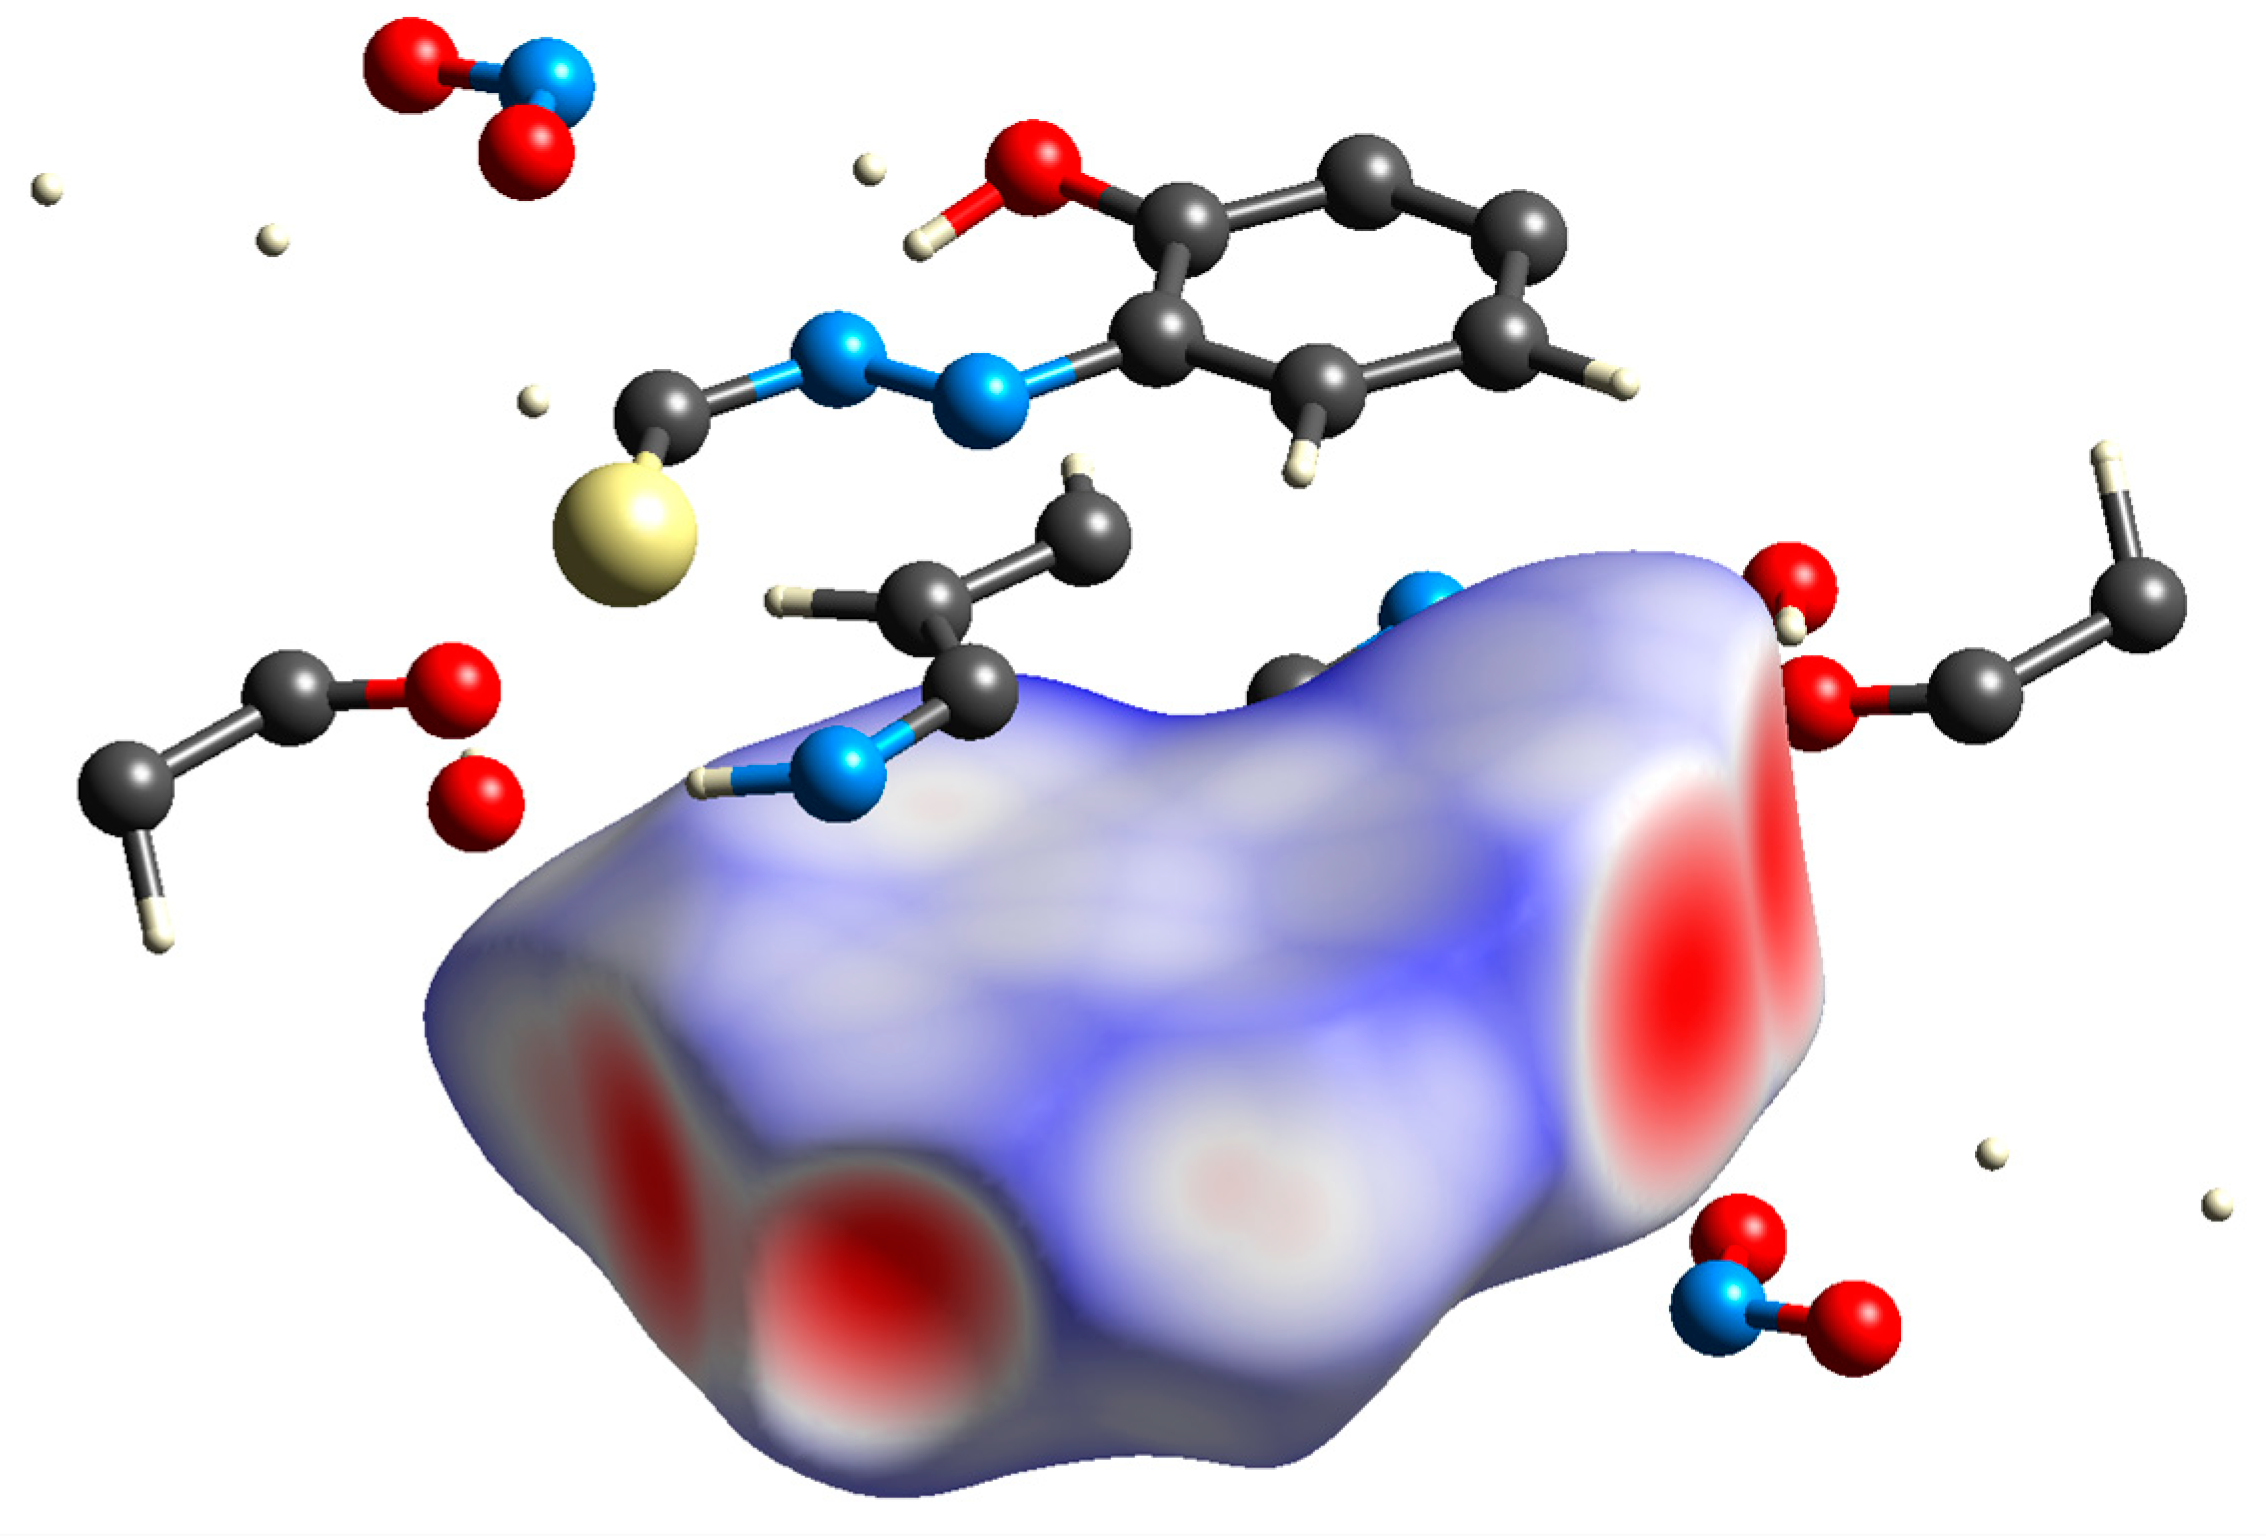
Hirshfeld surface (HS) and two-dimensional fingerprint plots are simple graphical representations to understand the crystal packing and can quantify and visualize the intermolecular interactions in the crystal structure. Each molecule in the crystal is enclosed by a Hirshfeld surface such that at any point within it, half or more of the electron density comes from the atoms of this molecule. Topological properties of this surface, like distances from the surface to the nearest nucleus external (de) and internal (di) to it and percentages of the surface area corresponding to different types of contacts (i.e., H∙∙∙H, C∙∙∙C), can reveal important packing features. In Figure 5, the Hirshfeld surface for the TA-OH crystal structure is reported.
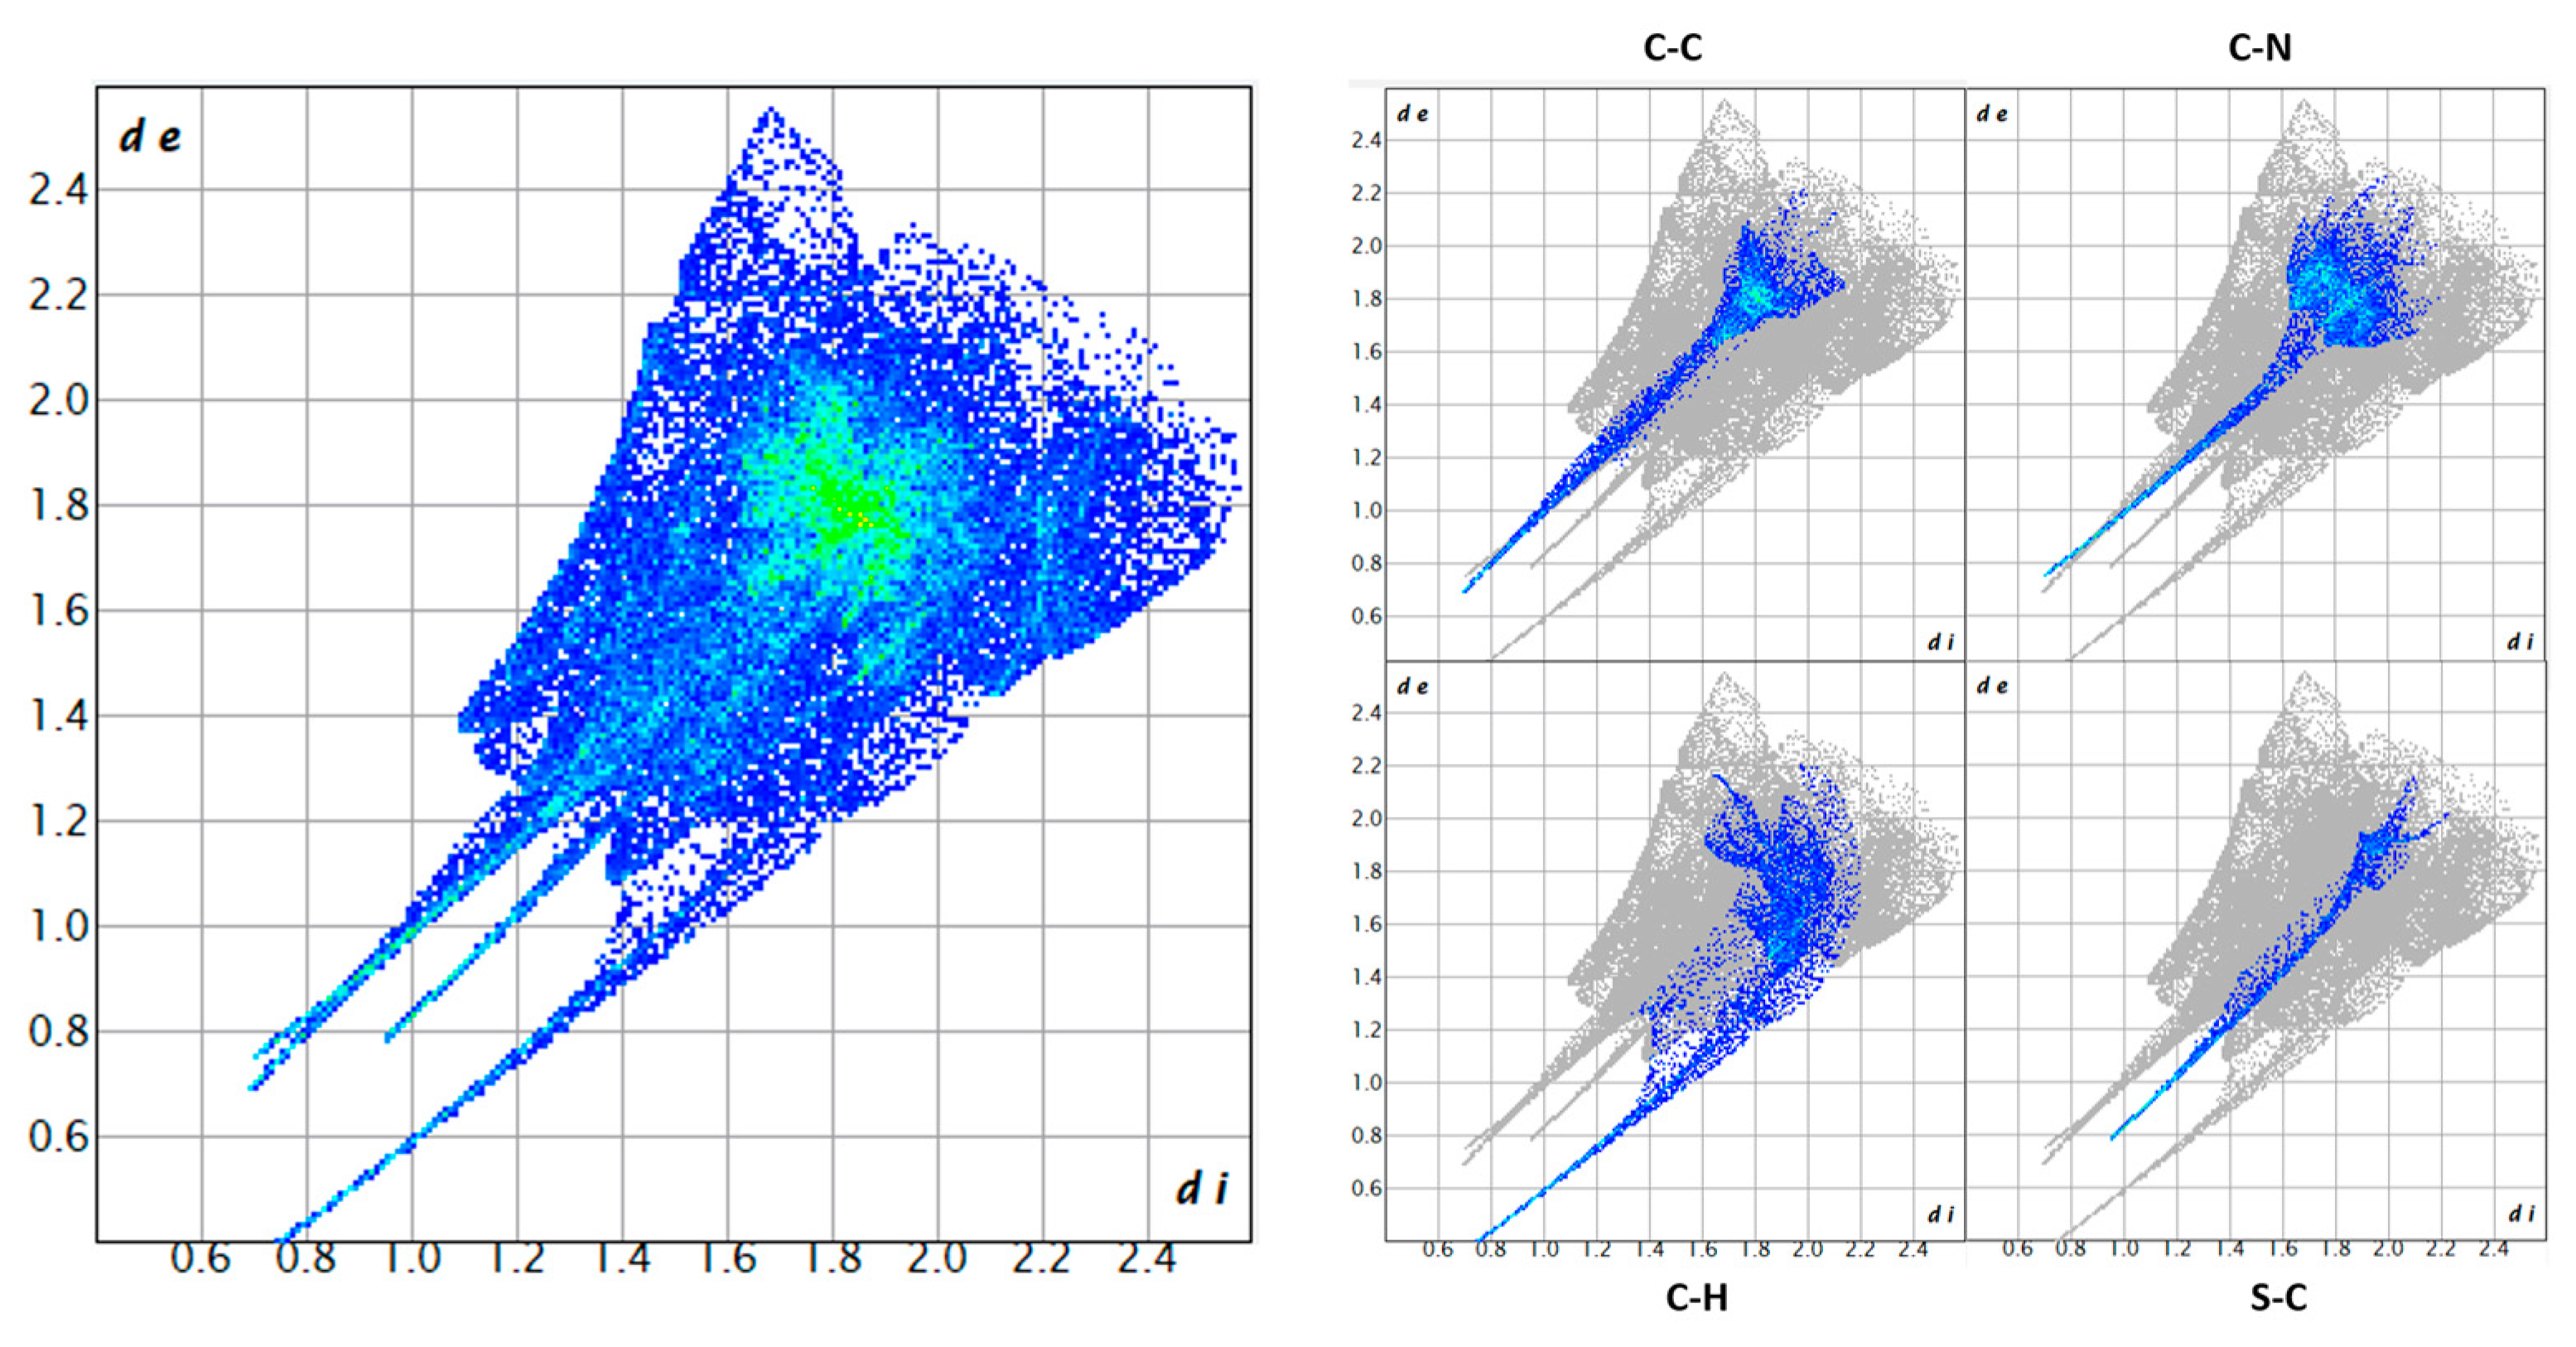
In the crystal, there is a predominance of antiparallel slipped face-to-face contact points between molecules. This is clearly evident in the plots in Figure 6, showing a green area centered at di + de = 3.6 Å. There are several edge-to-face contacts, and those visible in the “wings” are mainly due to carbon to carbon, nitrogen, and hydrogen (contributing to the total contacts for C-C 11.4%, C-N 16.1%, and C-H 13.0%, respectively). The closest contacts are at 1.3 Å. The sulfur atom is getting as close as 1.7 Å to a carbon atom (contributing only 5.2% to the total contacts), as shown in Figure 6, bottom right.
3.5. Molecular Computational Analysis
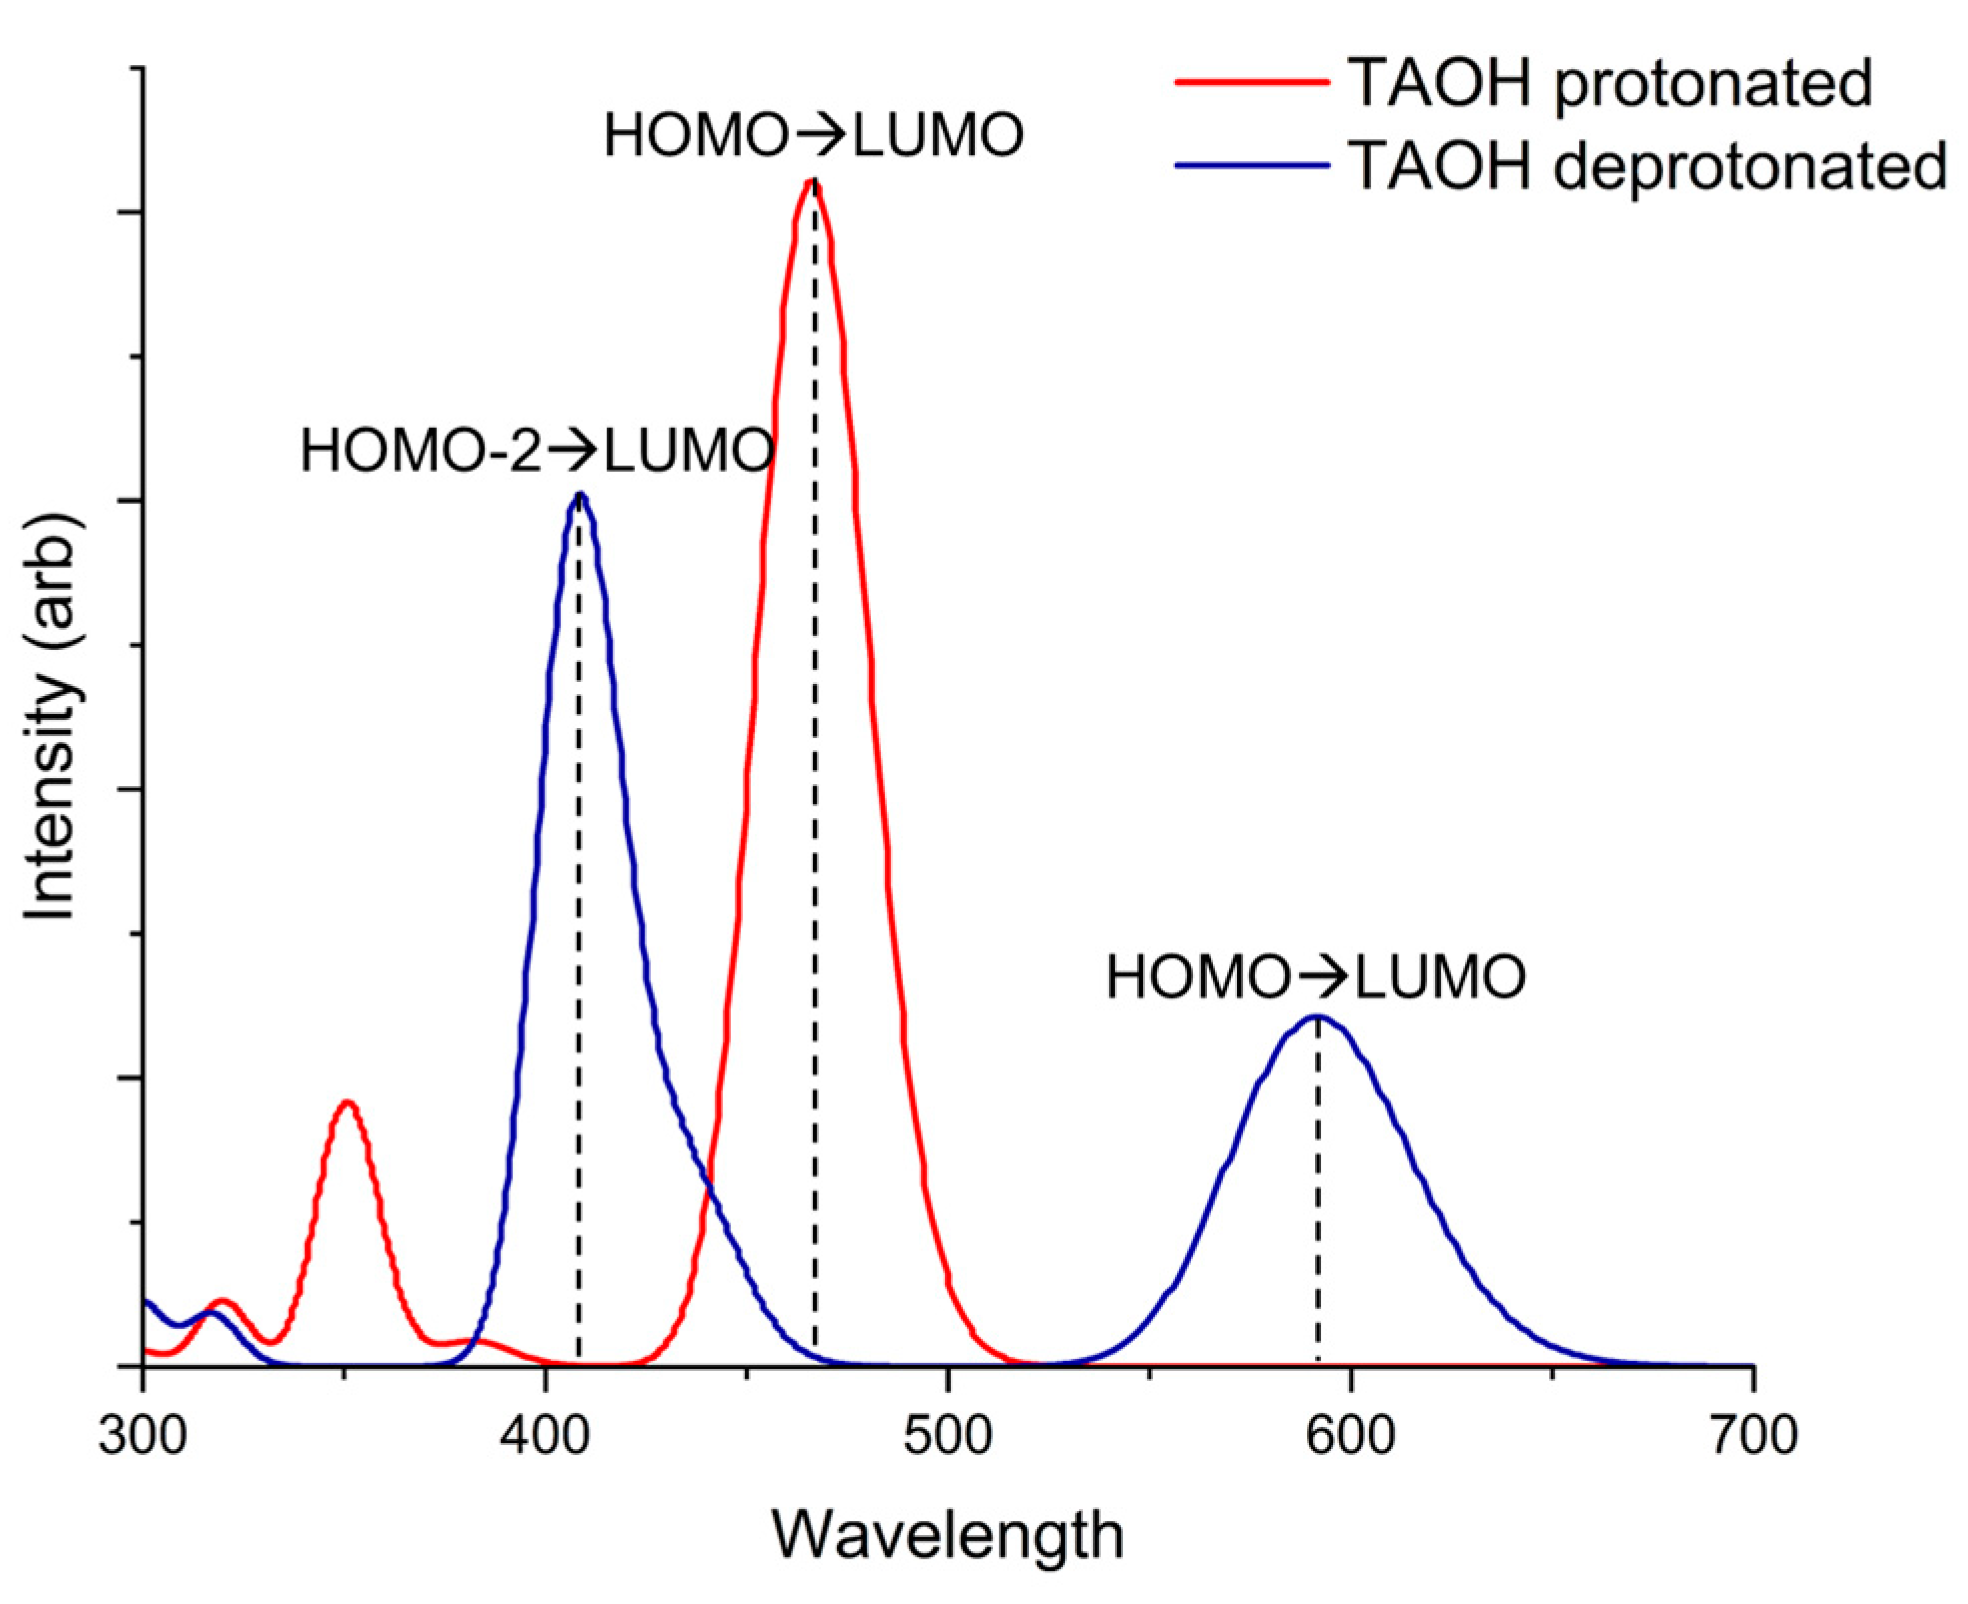
In this section, we provide the predicted absorption spectra, which are crucial for understanding the optical properties of the TA-OH molecule in solution. Since the calculated pKa of TA-OH was 8.5, we performed the calculation on the protonated and unprotonated forms corresponding to pH levels lower and higher than 8.5. The theoretical UV-vis spectral analysis of TA-OH showed that the molecule exhibited a maximum absorption wavelength of 466 nm ascribed to the HOMO → LUMO transition and a second peak at 351 nm for the HOMO → LUMO+1 (Figure 7, red line). Also, when deprotonated, the same molecule showed in the visible region of the spectrum a maximum wavelength of 408 nm assigned to the HOMO-2 → LUMO transition and a second peak at 592 nm for the HOMO → LUMO transition (Figure 7, blue line).
The results indicated that TA-OH changes its absorbance properties in the deprotonated state compared to the protonated form, leading to a net visible change in color. The experimental absorption spectrum and observation with the naked eye confirm this. There is an evident color change from red to blue around pH = 8.5.
Table 4 provides information related to electronic energy levels and transitions in TA-OH protonated and deprotonated. The transitions reported in column three describe the rearrangement of electrons in the system as it moves from one energy state to another. The last column specifies the wavelength of light that corresponds to the electronic transition in nanometers (nm).
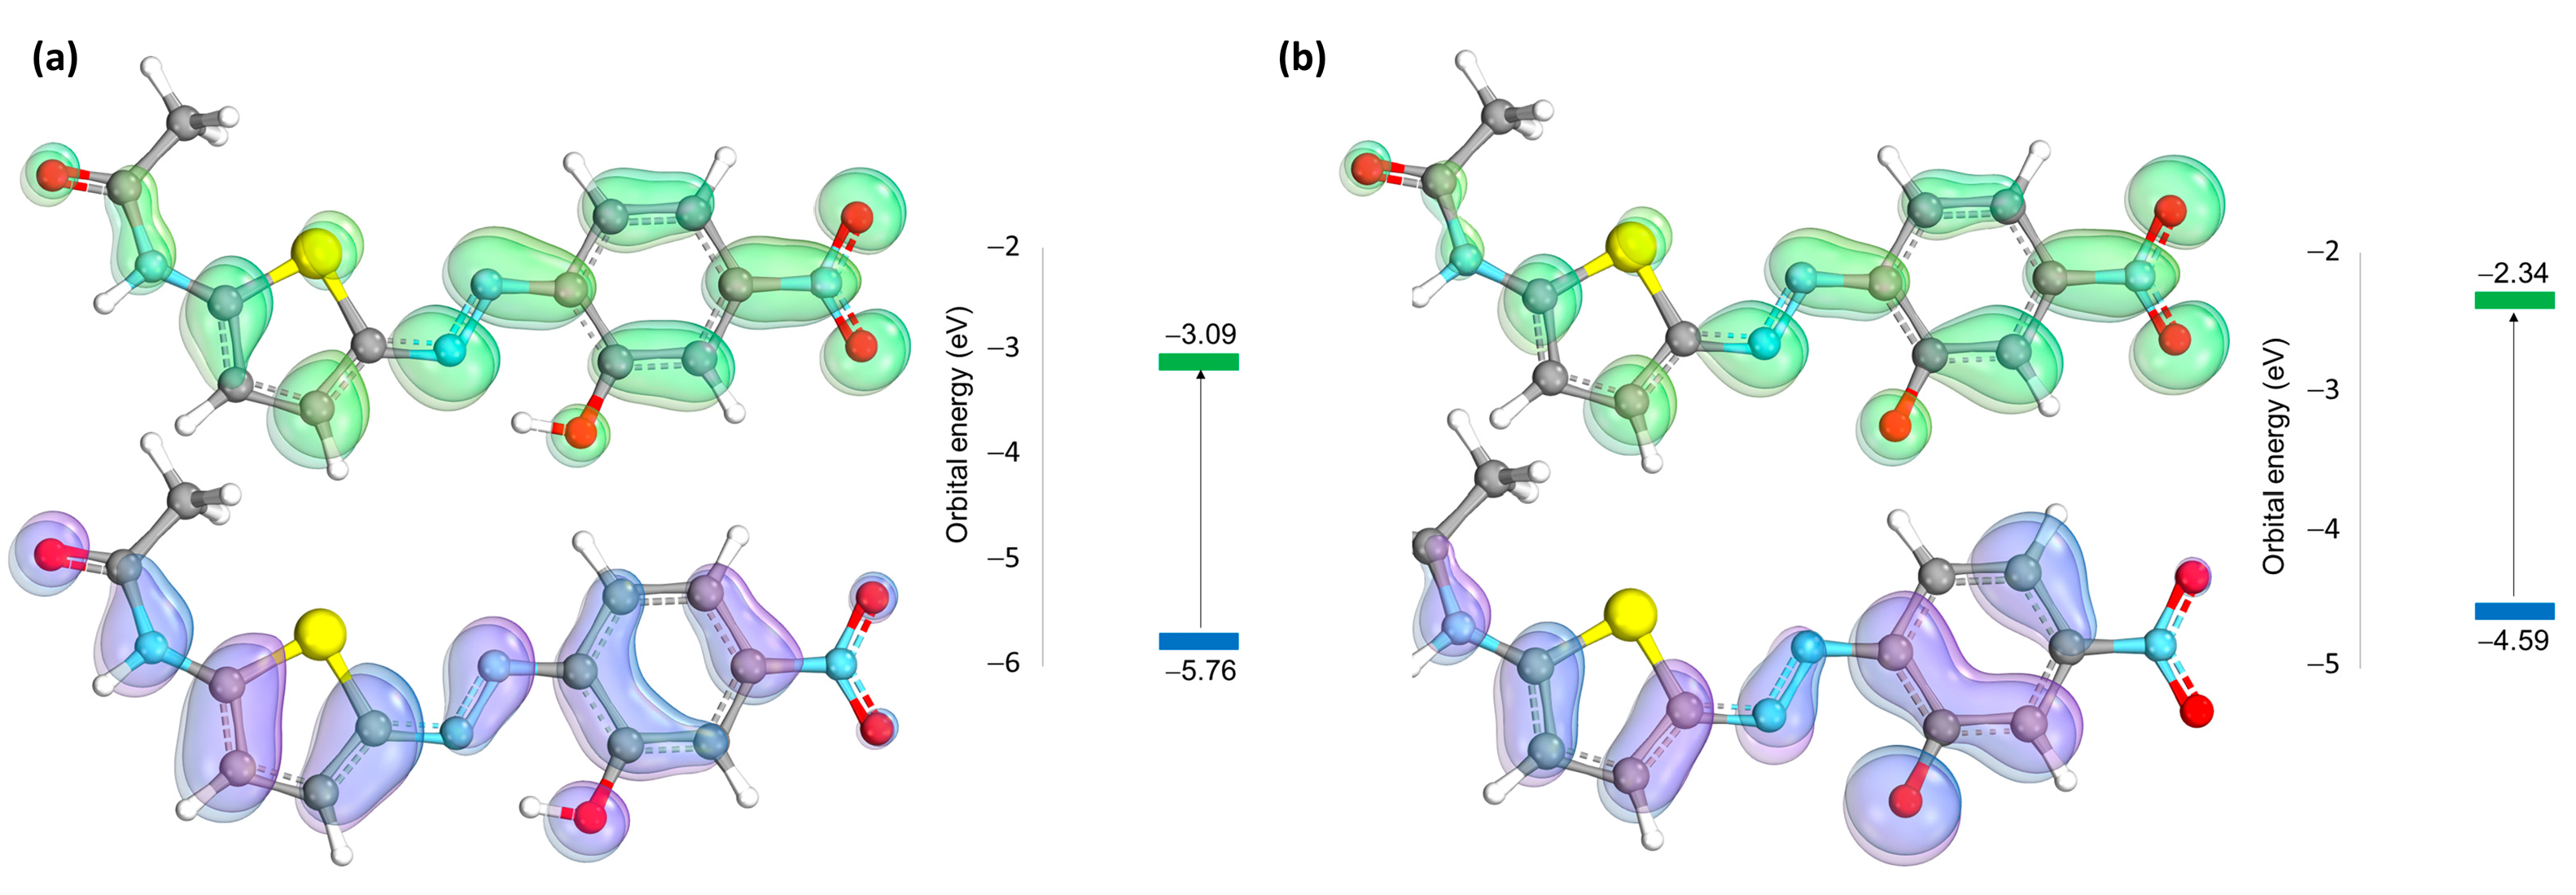
In Table S1 (Supplementary Materials), a detailed breakdown of electronic orbitals within the TA-OH protonated and deprotonated systems, their occupation status, and their associated energy values in atomic units (Eh) and electron volts (eV) are reported. In Figure 8a,b, the HOMO and LUMO orbitals of TA-OH in both protonated and unprotonated forms are reported. The deprotonated form exhibits a substantial elevation in the energy of the HOMO, consequently resulting in a pronounced bathochromic shift.
Highlighting the impact of an ortho-hydroxyl group near the azo moiety, a substantial increase in molecular hyperpolarizability coefficients (β and γ) is evident compared to similar azobenzene molecules [55,56,57]. Specifically, molecule TA-OH demonstrates a computed average β value of 3.568 · 10−28 electrostatic units (esu) and an average γ value of 2.056 · 10−25 esu, both measured at E = 0.00 eV. Significantly, the presence of the ortho-hydroxyl group significantly amplifies these hyperpolarizability parameters by a factor of two.
3.6. Transition State (TS) Calculation
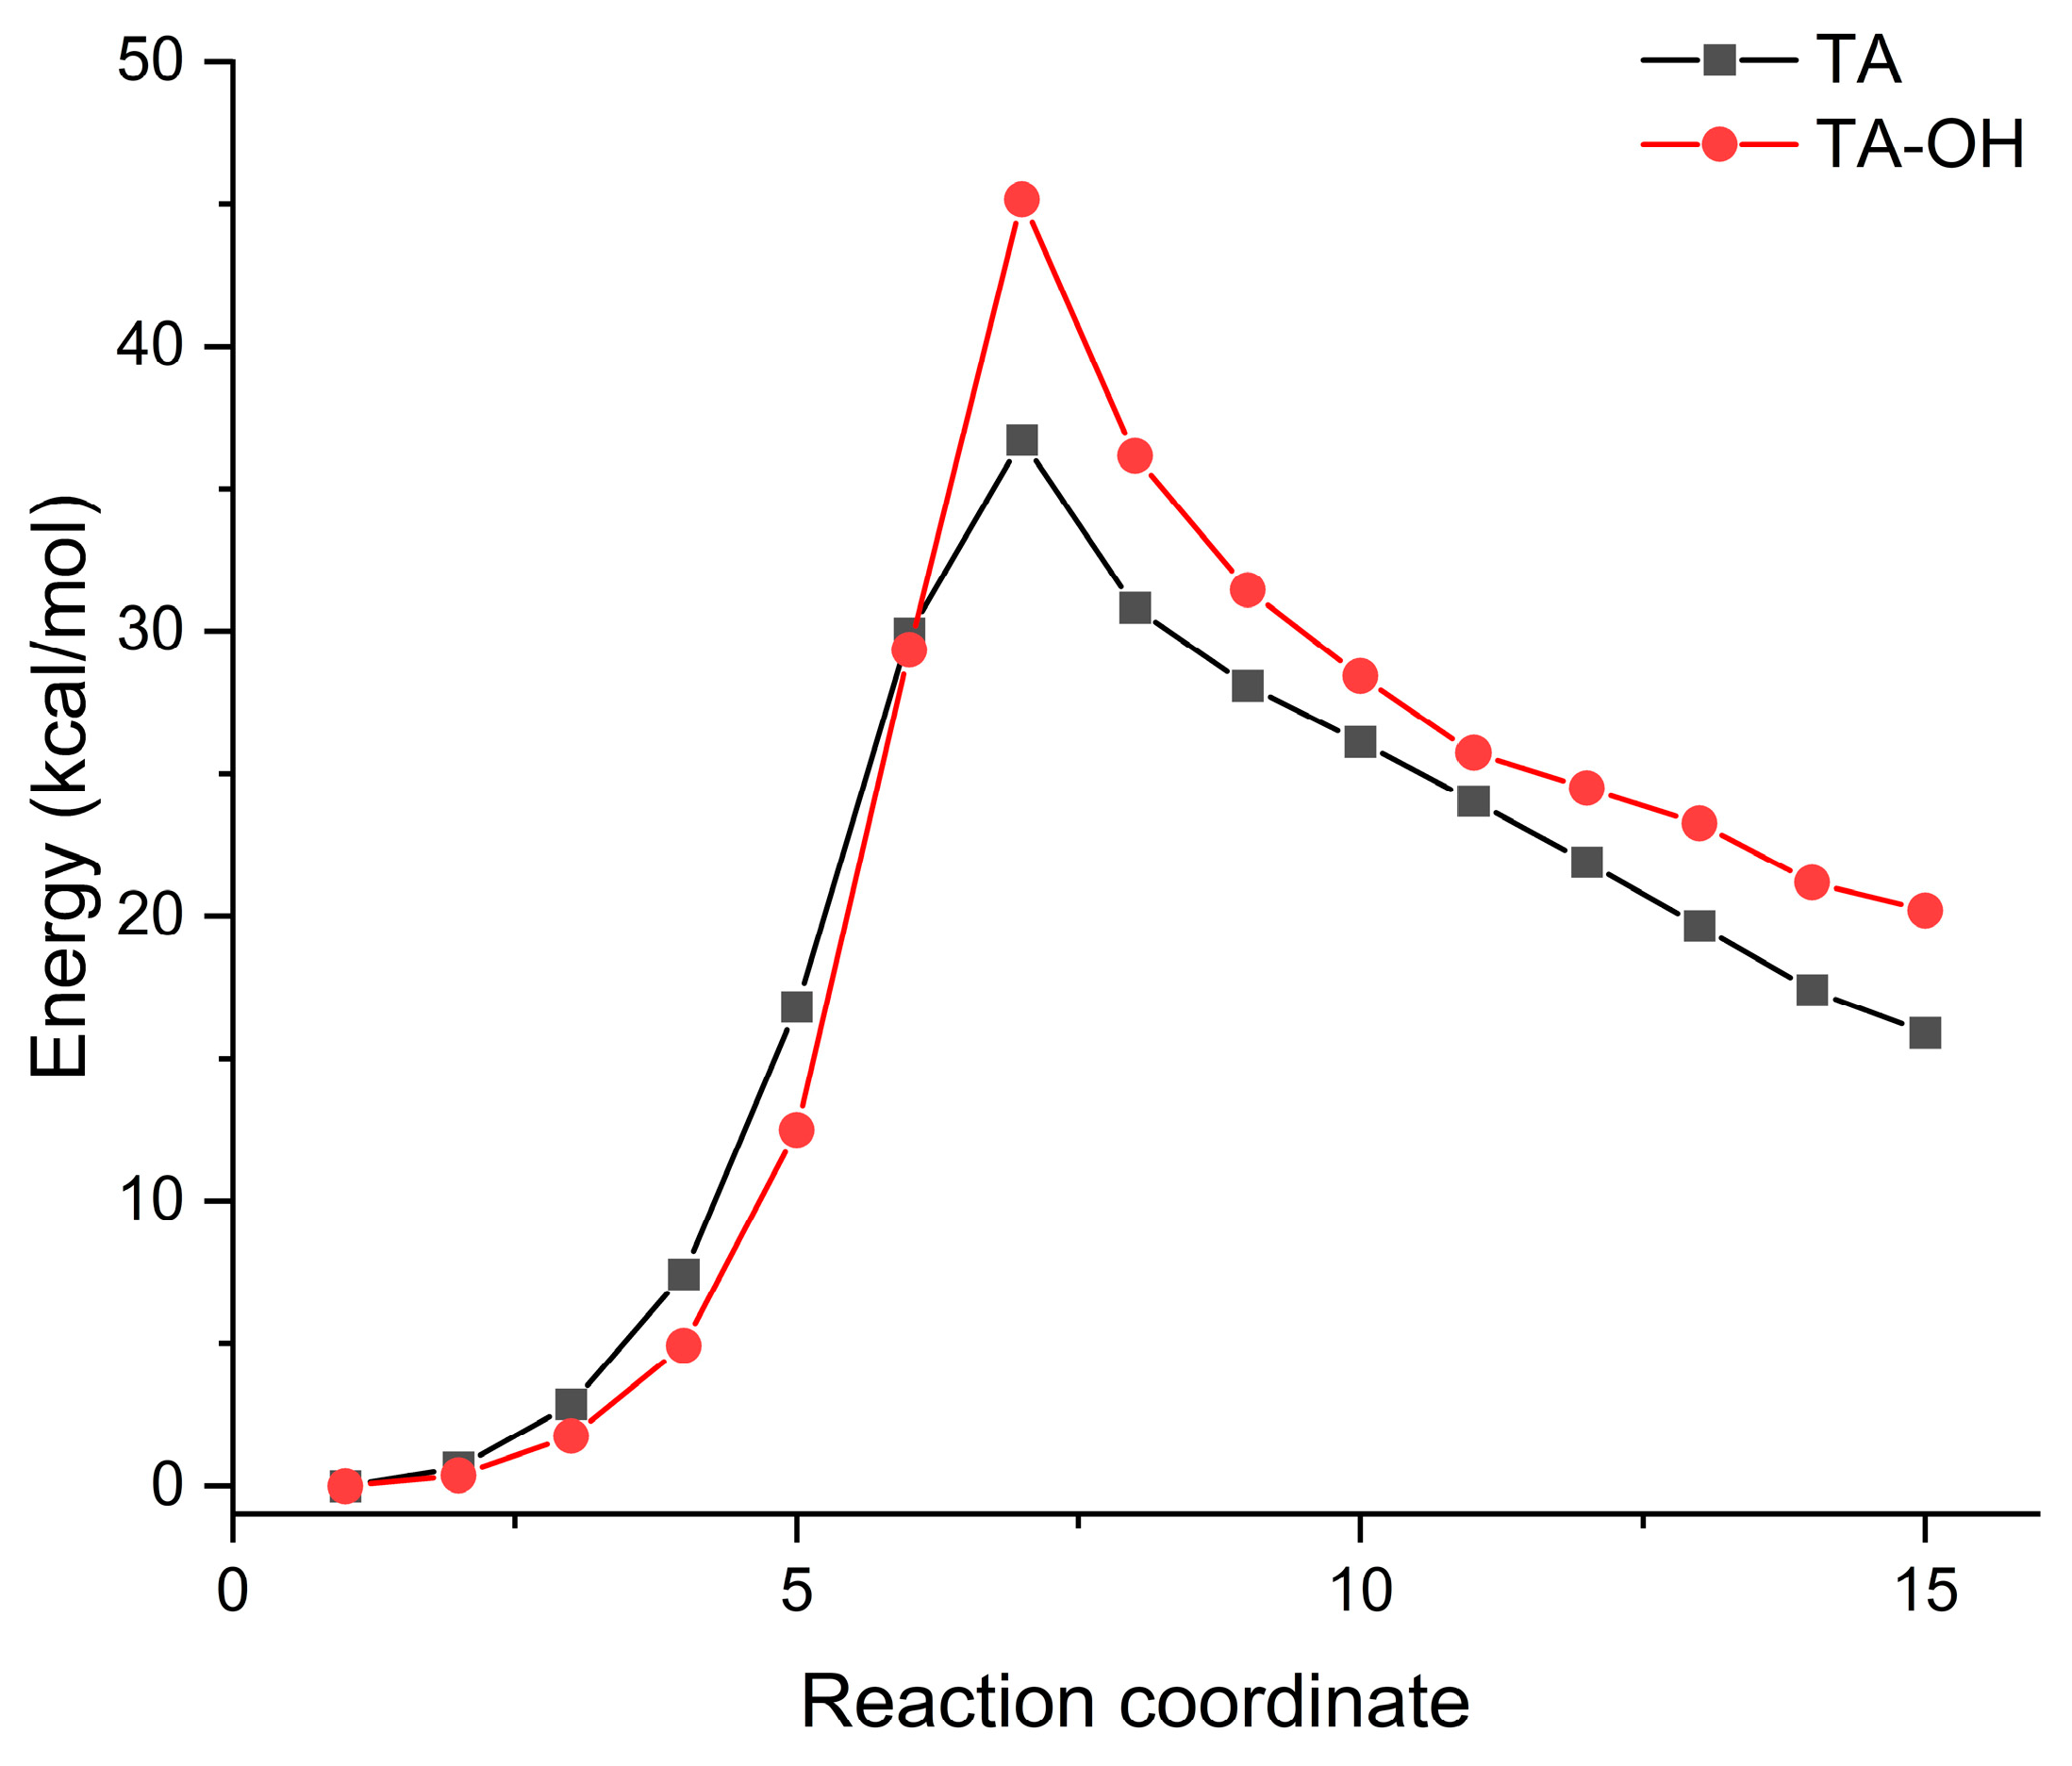
The trans-to-cis transition was expected in the absence of bulky substituents on the aromatic ring in the ortho position to the azo bond. To investigate the minimum energy pathway (MEP) for trans-to-cis conversion, a B3LYP level TS calculation was performed on both molecules TA-OH (Figure 1) and TA (Figure S4). The energy profile of the reaction is plotted in Figure 9.
The energy of the trans conformer was arbitrarily assigned a value of zero. Analysis of the transition state yields significant insights. The hydroxylated trans conformer experiences enhanced stabilization due to the ortho-positioned hydroxyl group, facilitating the formation of a hydrogen bond with the nitrogen of the azo group. The calculated stabilization at the B3LYP level is approximately 5 kcal/mol. Notably, the activated complex exhibits even greater stabilization, reaching approximately 8 kcal/mol. This heightened stability contributes to a discernible reduction in the rate of interconversion in both directions. It is noteworthy that the incorporation of an ortho group emerges as the most efficacious strategy for conformer stabilization.
4. Conclusions
The spectroscopic properties of the push–pull chromophore TA-OH were thoroughly investigated through a combination of experimental and theoretical approaches. Single crystal X-ray analysis revealed the primary conjugation plane of the dye, and the HO-MO-LUMO levels were determined via DFT analysis. The UV-vis spectra, both experimental and predicted, showed excellent agreement between the two. The observed solvatochromic effect highlighted the non-linear optical (NLO) potential activity of TA-OH, and this was quantified through the prediction of high β and γ values. The pH-dependent response, attributed to the hydroxyl functional group, was further explored using UV-vis spectroscopy and supported by theoretical calculations. Insights into the trans-to-cis conversion of the compound were gained through DFT calculations, providing an energetic quantification that explained the non-occurring experimental pattern. This mechanistic understanding also shed light on the high photostability of TA-OH, as measured with the official method UNI EN ISO 105-B02:2014. This synergistic approach positions the chromophore TA-OH as an optically active colorimetric tool with promising applications in optoelectronic technology and the textile industry. Specifically, TA-OH could serve as the active molecule in higher-order harmonic generators, adaptive optics devices, spatial light modulators, and other optically controlled photonic devices. Its high molar absorbance coefficient and good lightfastness also make TA-OH an excellent candidate for pigments in fabrics or polymers. Moreover, its reversible responses to pH make it a compelling option for novel printing and coating techniques in the fabrication of polymeric sensors.
Supplementary Materials
The following supporting information can be downloaded at: https://www.mdpi.com/article/10.3390/cryst14010031/s1. Figure S1. 1H NMR of TA-OH (DMSO-d6; 400 MHz). Figure S2. 13C NMR of TA-OH (DMSO-d6; 400 MHz). DEPTQ polarization transfer with decoupling during acquisition, shaped pulse for 180-degree pulse on f1 channel. Figure S3. Mass spectrum of TA-OH. Formula [M-H]– C12H9O4N4S. Found m/z: 305.03. Figure S4. Chemical structure of the model molecule TA. The model TA is entirely analogous to TA-OH, but without the hydroxyl group on the phenyl ring. Figure S5. UV-Vis photoisomerization of model TA. The experimental UV-vis spectra under excitation at 405 nm show the possibility of photoswitching from the trans to the cis form. Figure S6. Band structure and density of states of the TA-OH crystal. Table S1. Vertical transition energies of protonated TA-OH and deprotonated TA-OH.
Author Contributions
Conceptualization, R.D. and L.S.; methodology, R.D., L.D.C., S.C. and L.S.; investigation, R.D., S.P., A.C. and L.S.; writing—original draft preparation, R.D., S.C. and B.P.; writing—review and editing, S.P. and B.P.; funding acquisition, S.C. and S.P. All authors have read and agreed to the published version of the manuscript.
Funding
This research was funded by the project NEWROAD, Grant Agreement No 101080024—Co-funded by the European Union, EU4Health Programme (EU4H).
Institutional Review Board Statement
Not applicable.
Informed Consent Statement
Not applicable.
Data Availability Statement
Data are contained within the article and Supplementary Materials.
Conflicts of Interest
The authors declare no conflict of interest.
References
- Mahimwalla, Z.; Yager, K.G.; Mamiya, J.-I.; Shishido, A.; Priimagi, A.; Barrett, C.J. Azobenzene photomechanics: Prospects and potential applications. Polym. Bull. 2012, 69, 967–1006. [Google Scholar] [CrossRef]
- Coelho, P.J.; Castro, M.C.R.; Fernandes, S.S.M.; Fonseca, A.M.C.; Raposo, M.M.M. Enhancement of the photochromic switching speed of bithiophene azo dyes. Tetrahedron Lett. 2012, 53, 4502–4506. [Google Scholar] [CrossRef]
- Diana, R.; Panunzi, B.; Tuzi, A.; Piotto, S.; Concilio, S.; Caruso, U. An Amphiphilic Pyridinoyl-hydrazone Probe for Colorimetric and Fluorescence pH Sensing. Molecules 2019, 24, 3833. [Google Scholar] [CrossRef] [PubMed]
- Acierno, D.; Amendola, E.; Bugatti, V.; Concilio, S.; Giorgini, L.; Iannelli, P.; Piotto, S.P. Synthesis and characterization of segmented liquid crystalline polymers with the azo group in the main chain. Macromolecules 2004, 37, 6418–6423. [Google Scholar] [CrossRef]
- Thapaliya, E.R.; Zhao, J.; Ellis-Davies, G.C. Locked-azobenzene: Testing the scope of a unique photoswitchable scaffold for cell physiology. ACS Chem. Neurosci. 2019, 10, 2481–2488. [Google Scholar] [CrossRef] [PubMed]
- Akram, D.; Elhaty, I.A.; AlNeyadi, S.S. Synthesis and spectroscopic characterization of rhodanine azo dyes as selective chemosensors for detection of iron(III). Chem. Data Collect. 2020, 28, 100456. [Google Scholar] [CrossRef]
- Coelho, F.L.; Braga, C.d.Á.; Zanotto, G.M.; Gil, E.S.; Campo, L.F.; Gonçalves, P.F.B.; Rodembusch, F.S.; Santos, F.d.S. Low pH optical sensor based on benzothiazole azo dyes. Sens. Actuators B Chem. 2018, 259, 514–525. [Google Scholar] [CrossRef]
- Diana, R.; Caruso, U.; Piotto, S.; Concilio, S.; Shikler, R.; Panunzi, B. Spectroscopic Behaviour of Two Novel Azobenzene Fluorescent Dyes and Their Polymeric Blends. Molecules 2020, 25, 1368. [Google Scholar] [CrossRef]
- Diana, R.; Panunzi, B.; Piotto, S.; Caruso, T.; Caruso, U. Solid-state fluorescence of two zinc coordination polymers from bulky dicyano-phenylenevinylene and bis-azobenzene cores. Inorg. Chem. Commun. 2019, 110, 107602. [Google Scholar] [CrossRef]
- Ren, H.; Yang, P.; Winnik, F.M. Azopyridine: A smart photo-and chemo-responsive substituent for polymers and supramolecular assemblies. Polym. Chem. 2020, 11, 5955–5961. [Google Scholar] [CrossRef]
- Crespi, S.; Simeth, N.A.; König, B. Heteroaryl azo dyes as molecular photoswitches. Nat. Rev. Chem. 2019, 3, 133–146. [Google Scholar] [CrossRef]
- Eltaboni, F.; Bader, N.; El-Kailany, R.; Elsharif, N.; Ahmida, A. Chemistry and Applications of Azo Dyes: A Comprehensive Review. J. Chem. Rev. 2022, 4, 313–330. [Google Scholar]
- Singh, M.V.; Tiwari, A.K.; Sharma, Y.K.; Chauhan, M.S.; Sethi, M.; Guo, Z. Synthetic Procedures, Properties, and Applications of Thiophene-based Azo Scaffolds. ES Food Agrofor. 2023, 12, 887. [Google Scholar] [CrossRef]
- Ullah, F.; Ullah, S.; Khan, M.F.A.; Mustaqeem, M.; Paracha, R.N.; Rehman, M.F.U.; Kanwal, F.; Hassan, S.S.U.; Bungau, S. Fluorescent and Phosphorescent Nitrogen-Containing Heterocycles and Crown Ethers: Biological and Pharmaceutical Applications. Molecules 2022, 27, 6631. [Google Scholar] [CrossRef]
- da Cruz, R.M.D.; Mendonça-Junior, F.J.B.; de Mélo, N.B.; Scotti, L.; de Araújo, R.S.A.; de Almeida, R.N.; de Moura, R.O. Thiophene-Based Compounds with Potential Anti-Inflammatory Activity. Pharmaceuticals 2021, 14, 692. [Google Scholar] [CrossRef]
- Raposo, M.M.M.; Ferreira, A.M.F.P.; Belsley, M.; Moura, J.C.V.P. 5′-Alkoxy-2,2′-bithiophene azo dyes: A novel promising series of NLO-chromophores. Tetrahedron 2008, 64, 5878–5884. [Google Scholar] [CrossRef]
- Raposo, M.M.M.; Castro, M.C.R.; Belsley, M.; Fonseca, A.M.C. Push–pull bithiophene azo-chromophores bearing thiazole and benzothiazole acceptor moieties: Synthesis and evaluation of their redox and nonlinear optical properties. Dye. Pigment. 2011, 91, 454–465. [Google Scholar] [CrossRef]
- Borbone, F.; Caruso, U.; Diana, R.; Panunzi, B.; Roviello, A.; Tingoli, M.; Tuzi, A. Second order nonlinear optical networks with excellent poling stability from a new trifunctional thiophene based chromophore. Org. Electron. 2009, 10, 53–60. [Google Scholar] [CrossRef]
- Raposo, M.M.M.; Sousa, A.M.; Fonseca, A.M.C.; Kirsch, G. Thienylpyrrole azo dyes: Synthesis, solvatochromic and electrochemical properties. Tetrahedron 2005, 61, 8249–8256. [Google Scholar] [CrossRef]
- Raposo, M.M.M.; Fonseca, A.M.C.; Castro, M.C.R.; Belsley, M.; Cardoso, M.F.S.; Carvalho, L.M.; Coelho, P.J. Synthesis and characterization of novel diazenes bearing pyrrole, thiophene and thiazole heterocycles as efficient photochromic and nonlinear optical (NLO) materials. Dye. Pigment. 2011, 91, 62–73. [Google Scholar] [CrossRef]
- Garcia-Amorós, J.; Reig, M.; Castro, M.C.R.; Cuadrado, A.; Raposo, M.M.M.; Velasco, D. Molecular photo-oscillators based on highly accelerated heterocyclic azo dyes in nematic liquid crystals. Chem. Commun. 2014, 50, 6704–6706. [Google Scholar] [CrossRef] [PubMed]
- Coelho, P.J.; Carvalho, L.M.; Moura, J.C.; Raposo, M.M.M. Novel photochromic 2, 2′-bithiophene azo dyes. Dye. Pigment. 2009, 82, 130–133. [Google Scholar] [CrossRef]
- Ghanavatkar, C.W.; Mishra, V.R.; Sekar, N. Review of NLOphoric azo dyes–Developments in hyperpolarizabilities in last two decades. Dye. Pigment. 2021, 191, 109367. [Google Scholar] [CrossRef]
- Moylan, C.R.; McNelis, B.J.; Nathan, L.C.; Marques, M.A.; Hermstad, E.L.; Brichler, B.A. Challenging the Auxiliary Donor Effect on Molecular Hyperpolarizability in Thiophene-Containing Nonlinear Chromophores: X-ray Crystallographic and Optical Measurements on Two New Isomeric Chromophores. J. Org. Chem. 2004, 69, 8239–8243. [Google Scholar] [CrossRef] [PubMed]
- Fernández, C.M.; Martin, V.C. Preparation d’un tampon universel de force ionique 0.3 M. Talanta 1977, 24, 747–748. [Google Scholar] [CrossRef] [PubMed]
- Yuxia, Z.; Zhao, L.; Ling, Q.; Jianfen, Z.; Jiayun, Z.; Yuquan, S.; Gang, X.; Peixian, Y. Synthesis and characterization of a novel nonlinear optical polyurethane polymer. Eur. Polym. J. 2001, 37, 445–449. [Google Scholar] [CrossRef]
- Maier, J.A.; Martinez, C.; Kasavajhala, K.; Wickstrom, L.; Hauser, K.E.; Simmerling, C. ff14SB: Improving the accuracy of protein side chain and backbone parameters from ff99SB. J. Chem. Theory Comput. 2015, 11, 3696–3713. [Google Scholar] [CrossRef]
- Land, H.; Humble, M.S. YASARA: A tool to obtain structural guidance in biocatalytic investigations. In Protein Engineering; Methods and protocols; Bornscheuer, U., Höhne, M., Eds.; Humana Press; Totowa, NJ, USA, 2018; pp. 43–67. [Google Scholar]
- Sarkar, A.; Sessa, L.; Marrafino, F.; Piotto, S. GUIDE: A GUI for automated quantum chemistry calculations. J. Comput. Chem. 2023, 44, 2030–2036. [Google Scholar] [CrossRef]
- Shukla, M.; Leszczynski, J. Electronic transitions of thiouracils in the gas phase and in solutions: Time-dependent density functional theory (TD-DFT) study. J. Phys. Chem. A 2004, 108, 10367–10375. [Google Scholar] [CrossRef]
- Neese, F. The ORCA program system. Wiley Interdiscip. Rev. Comput. Mol. Sci. 2012, 2, 73–78. [Google Scholar] [CrossRef]
- Bannwarth, C.; Ehlert, S.; Grimme, S. GFN2-xTB—An accurate and broadly parametrized self-consistent tight-binding quantum chemical method with multipole electrostatics and density-dependent dispersion contributions. J. Chem. Theory Comput. 2019, 15, 1652–1671. [Google Scholar] [CrossRef] [PubMed]
- Yu, H.S.; Watson, M.A.; Bochevarov, A.D. Weighted averaging scheme and local atomic descriptor for pKa prediction based on density functional theory. J. Chem. Inf. Model. 2018, 58, 271–286. [Google Scholar] [CrossRef] [PubMed]
- Knizia, G. Intrinsic Atomic Orbitals: An Unbiased Bridge between Quantum Theory and Chemical Concepts. J. Chem. Theory Comput. 2013, 9, 4834–4843. [Google Scholar] [CrossRef]
- Stewart, J.J. Stewart Computational Chemistry. 2007. Available online: http://openmopac.net/ (accessed on 1 September 2023).
- Spackman, P.R.; Turner, M.J.; McKinnon, J.J.; Wolff, S.K.; Grimwood, D.J.; Jayatilaka, D.; Spackman, M.A. CrystalExplorer: A program for Hirshfeld surface analysis, visualization and quantitative analysis of molecular crystals. J. Appl. Crystallogr. 2021, 54, 1006–1011. [Google Scholar] [CrossRef] [PubMed]
- Clark, S.J.; Segall, M.D.; Pickard, C.J.; Hasnip, P.J.; Probert, M.I.; Refson, K.; Payne, M.C. First principles methods using CASTEP. Z. Krist.-Cryst. Mater. 2005, 220, 567–570. [Google Scholar] [CrossRef]
- Kabsch, W. Integration, scaling, space-group assignment and post-refinement. Acta Crystallogr. Sect. D Biol. Crystallogr. 2010, 66, 133–144. [Google Scholar] [CrossRef] [PubMed]
- Burla, M.C.; Carrozzini, B.; Cascarano, G.L.; Polidori, G. Solving proteins at non-atomic resolution by direct methods: Update. J. Appl. Crystallogr. 2017, 50, 1048–1055. [Google Scholar] [CrossRef]
- Sheldrick, G.M. Crystal structure refinement with SHELXL. Acta Crystallogr. Sect. C Struct. Chem. 2015, 71, 3–8. [Google Scholar] [CrossRef]
- Farrugia, L.J. WinGX and ORTEP for Windows: An update. J. Appl. Crystallogr. 2012, 45, 849–854. [Google Scholar] [CrossRef]
- Macrae, C.F.; Sovago, I.; Cottrell, S.J.; Galek, P.T.; McCabe, P.; Pidcock, E.; Platings, M.; Shields, G.P.; Stevens, J.S.; Towler, M. Mercury 4.0: From visualization to analysis, design and prediction. J. Appl. Crystallogr. 2020, 53, 226–235. [Google Scholar] [CrossRef]
- Morley, J.O. Theoretical Investigation of the Conformations, Tautomeric Forms, and Spectra of Donor-Acceptor (Phenylazo)arenes. J. Phys. Chem. 1994, 98, 13177–13181. [Google Scholar] [CrossRef]
- TsuTsunoda, M.; Yamamoto, N.; Imai, H. Disazo Compound And Dyeing Method Using The Same. J.P. Patent 62246965 A, 28 October 1987. [Google Scholar]
- Katariya, S.B.; Patil, D.; Rhyman, L.; Alswaidan, I.A.; Ramasami, P.; Sekar, N. Triphenylamine-based fluorescent NLO phores with ICT characteristics: Solvatochromic and theoretical study. J. Mol. Struct. 2017, 1150, 493–506. [Google Scholar] [CrossRef]
- Warde, U.; Sekar, N. NLOphoric mono-azo dyes with negative solvatochromism and in-built ESIPT unit from ethyl 1,3-dihydroxy-2-naphthoate: Estimation of excited state dipole moment and pH study. Dye. Pigment. 2017, 137, 384–394. [Google Scholar] [CrossRef]
- Mecke, R.; Schmähl, D. Einfluß von Wasserstoffbrücken auf die Spaltungsgeschwindigkeit von Azofarbstoffen. Naturwissenschaften 1955, 42, 153–154. [Google Scholar] [CrossRef]
- El Harfi, S.; El Harfi, A. Classifications, properties and applications of textile dyes: A review. Appl. J. Environ. Eng. Sci. 2017, 3, 311–320. [Google Scholar]
- Diana, R.; Caruso, U.; Di Costanzo, L.; Gentile, F.S.; Panunzi, B. Colorimetric recognition of multiple first-row transition metals: A single water-soluble chemosensor in acidic and basic conditions. Dye. Pigment. 2021, 184, 108832. [Google Scholar] [CrossRef]
- Jose, M.; Mylavarapu, S.K.; Bikkarolla, S.K.; Machiels, J.; KJ, S.; McLaughlin, J.; Hardy, A.; Thoelen, R.; Deferme, W. Printed pH Sensors for Textile-Based Wearables: A Conceptual and Experimental Study on Materials, Deposition Technology, and Sensing Principles. Adv. Eng. Mater. 2022, 24, 2101087. [Google Scholar] [CrossRef]
- Chu, W.; Tsui, S.-M. Photo-sensitization of diazo disperse dye in aqueous acetone. Chemosphere 1999, 39, 1667–1677. [Google Scholar] [CrossRef]
- Muedas-Taipe, G.; Mejía, I.M.M.; Santillán, F.A.; Velásquez, C.J.; Asencios, Y.J. Removal of azo dyes in aqueous solutions using magnetized and chemically modified chitosan beads. Mater. Chem. Phys. 2020, 256, 123595. [Google Scholar] [CrossRef]
- Decken, A.; Mailman, A.; Passmore, J.; Rautiainen, J.M.; Scherer, W.; Scheidt, E.W. A prototype hybrid 7π quinone-fused 1,3,2-dithiazolyl radical. Dalton Trans. 2011, 40, 868–879. [Google Scholar] [CrossRef]
- Rusu, E.; Shova, S.; Rusu, G. 1-[(E)-4-(Phenyl-diazen-yl)phen-yl]-3-pyrroline-2,5-dione. Acta Crystallogr. Sect. E Struct. Rep. Online 2011, 67 Pt 9, o2333. [Google Scholar] [CrossRef] [PubMed]
- Zaleśny, R.; Bulik, I.W.; Bartkowiak, W.; Luis, J.M.; Avramopoulos, A.; Papadopoulos, M.G.; Krawczyk, P. Electronic and vibrational contributions to first hyperpolarizability of donor–acceptor-substituted azobenzene. J. Chem. Phys. 2010, 133, 244308. [Google Scholar] [CrossRef] [PubMed]
- Smitha, P.; Asha, S.K.; Pillai, C.K.S. Synthesis, characterization, and hyperpolarizability measurements of main-chain azobenzene molecules. J. Polym. Sci. Part A Polym. Chem. 2005, 43, 4455–4468. [Google Scholar] [CrossRef]
- Shalin, N.I.; Fominykh, O.D.; Balakina, M.Y. Effect of acceptor moieties on static and dynamic first hyperpolarizability of azobenzene chromophores. Chem. Phys. Lett. 2019, 717, 21–28. [Google Scholar] [CrossRef]
Figure 1.
Chemical structures of the chromophore TA-OH. In the push–pull electronic system, distinctive functional groups are evidenced (azo group in blue, thiophene group in red, and the hydroxyl group in the green sphere).
Figure 1.
Chemical structures of the chromophore TA-OH. In the push–pull electronic system, distinctive functional groups are evidenced (azo group in blue, thiophene group in red, and the hydroxyl group in the green sphere).

Figure 2.
Experimental UV-vis absorption spectra in buffered acetone solutions at pH = 6.5 (orange line) and pH = 10.5 (blue line), pictures of the solutions (inset), and CIE diagrams for TA-OH, data collected at different pH values, are reported.
Figure 2.
Experimental UV-vis absorption spectra in buffered acetone solutions at pH = 6.5 (orange line) and pH = 10.5 (blue line), pictures of the solutions (inset), and CIE diagrams for TA-OH, data collected at different pH values, are reported.

Figure 3.
Experimental UV-vis absorption spectral titration data of TA-OH in buffered acetone/water solution, using Britton-Robinson buffer. On the left: absorbance curves in the most significant pH range (from 6.5 to 10.5). On the right: spectral determination of pKa from the absorbance data. from pH = 3.5 to pH = 11.5.

Figure 4.
(a) Molecular structure of TA-OH from X-ray single crystal analysis is represented as thermal ellipsoids drawn at a 50% probability level. The central core adopts a planar conformation around the central thiophene group. (b) Crystal packing along the a-b diagonal direction forms an anti-parallel arrangement of the π-stacked core of TA-OH.

Figure 5.
Representation of the intermolecular contacts in the crystal by the Hirshfeld surface. The contacts with distances equal to the sum of the van der Waals radius are indicated as white, and the contacts with distances shorter than and longer than van der Waals radii are represented as red and blue, respectively.

Figure 6.
Predominant antiparallel slipped face-to-face contacts in the crystal, evident in the green area at di + de = 3.6 Å. Noteworthy edge-to-face interactions, with C-C (11.4%), C-N (16.1%), and C-H (13.0%) contributions. Closest contact at 1.3 Å, with a sulfur atom approaching a carbon atom at 1.7 Å (5.2% of total contacts).

Figure 7.
Simulated absorption spectra of TA-OH protonated (red line) and TA-OH deprotonated (blue line) using TD-DFT/TDA method in acetone solvent.
Figure 7.
Simulated absorption spectra of TA-OH protonated (red line) and TA-OH deprotonated (blue line) using TD-DFT/TDA method in acetone solvent.

Figure 8.
The highest occupied molecular orbital (HOMO) and lowest unoccupied molecular orbital (LUMO) for TA-OH in protonated form (a) and deprotonated form (b).
Figure 8.
The highest occupied molecular orbital (HOMO) and lowest unoccupied molecular orbital (LUMO) for TA-OH in protonated form (a) and deprotonated form (b).

Figure 9.
Minimum energy pathway (MEP) at neutral pH of TA-OH and TA.


Table 1.
UV-vis data for TA-OH in different solvents.
| µ(D) a | λmax (nm) b | ε∙10−3 (L cm−1 mol−1) c | |
|---|---|---|---|
| Dioxan | 1.02 | 460 | 27 |
| Chloroform | 1.15 | 475 | 25 |
| Ethyl acetate | 1.54 | 480 | 25 |
| Acetone | 2.88 | 490 | 28 |
| DMSO | 3.96 | 495 | 32 |
a Solvent dipole moment by Handbook of Chemistry and Physics, 59th ed., CRC Press, Inc.; b Wavelength of UV-vis absorbance maximum. c Molar extinction coefficient in solution.
Table 2.
Experimental absorption wavelengths (nm), at different pH values, in acetone/water (5:1) solution.
Table 2.
Experimental absorption wavelengths (nm), at different pH values, in acetone/water (5:1) solution.
| Sample | pH | CIE a | λabs (nm) b | ɛ∙10−3 (L mol−1 cm−1) c |
|---|---|---|---|---|
| TA-OH protonated | 6.5 | 0.593; 0.329 | 490 | 28 |
| TA-OH deprotonated | 10.5 | 0.192; 0.212 | 653 (490) | 30 |
a Absorption CIE coordinates of the samples in solution. b Absorption maxima of the solutions, with relative maxima in brackets. c Molar extinction coefficient in solution.
Table 3.
Crystal data and structure refinement details.
| TA-OH | |
|---|---|
| CCDC number | 2262786 |
| Formula probe and solvent | C12H10N4SO4·H2O |
| Temperature (K) | 100 |
| Wavelength (Å) | 0.6200 |
| Crystal system | Triclinic |
| Space group | P-1 |
| a (Å) | 6.7860 (14) |
| b (Å) | 8.3210 (17) |
| c (Å) | 13.496 (3) |
| α (°) | 91.43 (3) |
| β (°) | 97.86 (3) |
| γ (°) | 113.86 (3) |
| R-merge (last shell) | 0.017 (0.023) |
| Last resolution shell | 0.71–0.67 Å |
| CC (1/2) | 100.0 (99.9) |
| I/σ (I) | 49.6 (36.3) |
| Completeness (%) | 91.9 (87.4) |
| Estimated mosaicity (°) | 0.26 |
| Volume | 687.7 (3) Å3 |
| Z | 2 |
| Calculated density | 1.566 g/cm3 |
| θ range for data collection (°) | 1.334 to 27.669 |
| Reflections collected/unique | 14,582/4428 |
| Data/restraints/parameters | 4428/0/149 |
| R1 indices (I > 2σ(I)) | 0.0422 (0.047, all data) |
| wR2 | 0.222 |
| F(000) | 336 |
| Largest diff. peak and hole | 0.82 and −0.38 e-/Å3 |
| Goodness-of-fit on F2 | 1.15 |
Table 4.
Energetic and spectral properties of TA-OH in both protonated and deprotonated forms.
| Energy a (eV) | Relevant Transition Orbitals b | Wavelength c (nm) | |
|---|---|---|---|
| TA-OH protonated | 2.660 | HOMO → LUMO | 466 |
| 3.534 | HOMO → LUMO+1 | 351 | |
| TA-OH deprotonated | 2.096 | HOMO → LUMO | 592 |
| 2.847 | HOMO → LUMO+1 | 436 | |
| 3.036 | HOMO-2 → LUMO | 408 |
a Energy levels in electron volts (eV); b molecular orbitals involved in electronic transition; c wavelength of absorption that corresponds to the electronic transition.
Disclaimer/Publisher’s Note: The statements, opinions and data contained in all publications are solely those of the individual author(s) and contributor(s) and not of MDPI and/or the editor(s). MDPI and/or the editor(s) disclaim responsibility for any injury to people or property resulting from any ideas, methods, instructions or products referred to in the content. |
© 2023 by the authors. Licensee MDPI, Basel, Switzerland. This article is an open access article distributed under the terms and conditions of the Creative Commons Attribution (CC BY) license (https://creativecommons.org/licenses/by/4.0/).
Share and Cite
MDPI and ACS Style
Diana, R.; Sessa, L.; Concilio, S.; Piotto, S.; Di Costanzo, L.; Carella, A.; Panunzi, B. Experimental and Theoretical Insights into a Novel Lightfast Thiophene Azo Dye. Crystals 2024, 14, 31. https://doi.org/10.3390/cryst14010031
AMA Style
Diana R, Sessa L, Concilio S, Piotto S, Di Costanzo L, Carella A, Panunzi B. Experimental and Theoretical Insights into a Novel Lightfast Thiophene Azo Dye. Crystals. 2024; 14(1):31. https://doi.org/10.3390/cryst14010031
Chicago/Turabian StyleDiana, Rosita, Lucia Sessa, Simona Concilio, Stefano Piotto, Luigi Di Costanzo, Antonio Carella, and Barbara Panunzi. 2024. "Experimental and Theoretical Insights into a Novel Lightfast Thiophene Azo Dye" Crystals 14, no. 1: 31. https://doi.org/10.3390/cryst14010031
Note that from the first issue of 2016, this journal uses article numbers instead of page numbers. See further details here.