Article

Crystals of 4,7-Di-2-thienyl-2,1,3-benzothiadiazole and Its Derivative with Terminal Trimethylsilyl Substituents: Synthesis, Growth, Structure, and Optical-Fluorescent Properties

by
Valery A. Postnikov
1,2,*,
Georgy A. Yurasik
1,2,
Artem A. Kulishov
1,2,
Timofei A. Sorokin
1,2,
Maria S. Lyasnikova
1,
Nataliya I. Sorokina
1,
Maxim S. Skorotetcky
2,
Vlada V. Popova
2,
Lev L. Levkov
2,
Oleg V. Borshchev
2,
Evgeniya A. Svidchenko
2,
Nikolay M. Surin
2 and
Sergey A. Ponomarenko
2
1
Shubnikov Institute of Crystallography, FSRC “Crystallography and Photonics” of Russian Academy of Sciences, Moscow 119333, Russia
2
Enikolopov Institute of Synthetic Polymeric Materials of Russian Academy of Sciences, Moscow 117393, Russia
*
Author to whom correspondence should be addressed.
Crystals 2023, 13(12), 1697; https://doi.org/10.3390/cryst13121697
Submission received: 26 November 2023 / Revised: 11 December 2023 / Accepted: 15 December 2023 / Published: 18 December 2023

Abstract

:
Among short donor–acceptor molecules with a central benzothiadiazole fragment, 4,7-di-2-thienyl-2,1,3-benzothiadiazole (T-BTD) is one of the most well-known compounds, valued for its photophysical and semiconductor properties. We have synthesized a derivative of 4,7-di-2-thienyl-2,1,3-benzothiadiazole with trimethylsilyl end-substituents, 4,7-bis(5-(trimethylsilyl)thiophen-2-yl)benzothiadiazole (TMS-T-BTD). The phase transition parameters and thermal stability of T-BTD and TMS-T-BTD were investigated using DSC and TGA methods. The presence of the trimethylsilyl end-groups in TMS-T-BTD significantly enhances solubility, increases the melting temperature, and improves the resistance of TMS-T-BTD to evaporation in the liquid state. Single crystals of T-BTD and TMS-T-BTD were grown from solutions, with the largest sizes being 7 × 2 × 0.5 mm3 and 8 × 1 × 0.45 mm3, respectively. Using single-crystal X-ray diffraction at 293 K, the crystal structure of T-BTD was refined in the rhombic system (sp.gr. Pcab, Z = 8), while for TMS-T-BTD, it was determined for the first time in the monoclinic system (sp.gr. P21/c, Z = 4). The relationship between observed growth anisotropy and molecular packing in the crystals was analyzed. The results of investigations into the spectral-fluorescent properties of solutions in hexane and THF are presented. The solvatochromic effect was studied in a series of solvents, including hexane, THF, dichloromethane, and acetonitrile. The photostability of the compounds in hexane solutions was examined. It was found that the quantum yield of photodestruction for T-BTD is 13 times higher than that of TMS-T-BTD. The fluorescent properties of T-BTD and TMS-T-BTD crystals were investigated.

1. Introduction

Linear conjugated molecules with a central benzo[c][1,2,3]thiadiazole (BTD) fragment and a symmetric arrangement of peripheral aromatic groups constitute a young family of organic semiconducting luminophores. The BTD group is a commonly used heterocyclic acceptor for developing donor–acceptor materials for organic electronics and photonics [1,2,3,4,5,6,7,8,9]. Solutions and crystals based on these materials often exhibit high efficiency in optoelectronic fluorescence and high thermal stability and photostability [7,10].
With rare exceptions, the crystallization of non-centrosymmetric molecules with a central BTD fragment remains poorly explored or almost unexplored [10,11,12]. To obtain large single-crystalline samples for practical applications in photonics (such as scintillators, nonlinear optical crystals, etc.), it is necessary to consider the use of shorter molecules that exhibit good crystallizability and excellent solubility in common solvents.
Among short conjugated linear molecules with a central BTD fragment, one of the most well-known compounds is 4,7-di-2-thienyl-2,1,3-benzothiadiazole (T-BTD). T-BTD is a donor–acceptor molecule with a ground state energy level of −5.4 to −5.3 eV, and the energy transition from the ground to the nearest excited state is ΔE = 2.4–2.7 eV [8,13,14]. This compound is used as an individual substance or as a monomeric unit to obtain low-bandgap conjugated polymers for photovoltaics [1,15,16,17,18,19]. A supramolecular polymer composition called “host-guest” has been reported, where T-BTD molecules are organized into highly ordered structures within a polymer matrix, leading to reduced fluorescence quenching and significantly enhancing solid-state emission efficiency [20]. Studies on the photophysical and semiconducting properties of T-BTD-based crystalline materials have been presented in [21,22,23,24]. Information on the crystal structure of T-BTD has been reported in several papers. The data on the rhombic symmetry (space group Pbca) of T-BTD crystals at room temperature are given in [22,23,24], while at 173 K in [25]. There is information about a polymorphic form with monoclinic symmetry (sp.gr. P21/n), which was established at 100 K [26]. In these works, the researchers did not aim to investigate the crystal growth of T-BTD. Nevertheless, considering its good solubility and relatively low cost, obtaining large single-crystalline samples of T-BTD remains an important scientific challenge.
The crystalline structure of certain derivatives of T-BTD with various terminal substituent groups has been investigated in prior studies. The presence of terminal substituent groups leads to alterations in the physicochemical characteristics of the compounds in both crystals and solutions. Often, the presence of different substituent groups (-CN, -F, etc.) results in changes in the conformational structure of molecules, which significantly impact the photophysical properties of substances [25,27,28,29,30,31,32,33,34]. The crystal structure of T-BTD derivatives with terminal trimethylsilyl groups and hydrogen atoms substituted with fluorine atoms in the BTD group has been described in [32,33]. However, the growth, structure, and properties of crystals of the T-BTD derivative with terminal trimethylsilyl (TMS) groups (TMS-T-BTD) have not been studied before.
The present work is dedicated to the investigation of the growth from solutions, structure, and thermal stability of crystals of 4,7-di(thiophen-2-yl)benzothiadiazole (T-BTD) and its derivative with terminal trimethylsilyl substituent groups, 4,7-bis(5-(trimethylsilyl)thiophen-2-yl)benzothiadiazole (TMS-T-BTD) [35] (Figure 1), as well as their optical-fluorescent properties in hexane and tetrahydrofuran (THF) solutions and in the crystalline state.

2. Materials and Methods

2.1. Materials

Sodium carbonate (Acros), tetrakis(triphenylphosphine)palladium(0) Pd(PPh3)4 (Sigma Aldrich, Burlington, MA, USA) were used as received. 4,4,5,5-tetramethyl-2-[5-(trimethylsilyl)-2-thienyl]-1,3,2-dioxaborolane (1) [36], 4,7-dibromo-2,1,3-benzothiadiazole (2) [37], and 4,7-di-2-thienyl-2,1,3-benzothiadiazole (T-BTD) [38] were synthesized according to the literature. THF was dried and distilled over calcium hydride; toluene and ethanol were degassed to avoid the presence of oxygen. To study the optical-fluorescent properties of solutions, spectral-pure hexane, THF, dichloromethane (DCM), and acetonitrile (ACN) were used. Spectrally pure hexane was used in the photostability experiments. Highly pure methanol, acetone, hexane, and THF were used for crystal growth experiments.

2.2. Characterization

The 1H NMR spectra were recorded on a Bruker WP250 SY spectrometer (250.13 MHz) (Bruker, Billerica, MA, USA) using the residual signal of CDCl3 (δ 7.27 ppm) as the internal standard. The 13C and 29Si NMR spectra were recorded on a Bruker Advance II 300 spectrometer (Bruker, Billerica, MA, USA) at the working frequencies 75 MHz and 60 MHz, respectively. The spectra were then processed on the computer using the ACD Labs 12.0 SpecManager software (Advanced Chemistry Development Inc., Toronto, Ontario, Canada).
The elemental analysis of C, H, N elements was carried out using a CHN automatic analyzer CE1106 (Carlo-Erba Strumentazione, Milan, Italy). The experimental error is 0.30−0.50%. The burning was carried out in the Sheninger flask using alkaline solution of hydrogen peroxide as an absorbent. The spectrophotometry technique was used for the Si analysis.

2.3. Synthesis of 4,7-Bis[5-(trimethylsilyl)-2-thienyl]-2,1,3-benzothiadiazole (TMS-T-BTD)

The synthesis scheme for TMS-T-BTD is presented in Figure 2. The reaction was carried out under argon atmosphere. 4,4,5,5-tetramethyl-2-[5-(trimethylsilyl)-2-thienyl]-1,3,2-dioxaborolane (1) (2.42 g, 8.6 mmol), 4,7-dibromo-2,1,3-benzothiadiazole (2) (1.20 g, 4.1 mmol), Pd(PPh3)4 (0.10 g, 0.09 mmol), and aqueous 2 M solution of sodium carbonate (6.5 mL) were placed in a flask and dissolved in a toluene–ethanol mixture (30/7 mL). The reaction mixture was stirred under boiling for 45 h. When the reaction was complete, the mixture was cooled to room temperature. The aqueous layer was removed, and the organic phase was passed through a layer of silica gel in toluene. The toluene solution was then evaporated using a rotary evaporator and dried under vacuum. The product was purified by column chromatography on silica gel in a hexane–toluene mixture (3:1) to give 1.66 g of orange solid (92 %). 1H NMR (250 MHz, CDCl3): δ [ppm]-8.13 (d, J = 3.5 Hz, 2H), 7.84 (s, 2H), 7.33 (d, J = 3.6 Hz, 2H), 0.40 (s, 18H). 13C NMR (75 MHz, CDCl3): δ [ppm]-152.63, 144.43, 142.32, 134.99, 128.68, 125.97, 0.01. 29Si NMR (60 MHz, CDCl3): δ [ppm]-6.22. Anal. Calcd. (%) for C20H24N2S3Si2: C, 54.01; H, 5.44; N, 6.30; S, 21.63%; Si, 12.63. Found: C, 54.91; H, 5.82; N, 6.22; Si, 12.29.

2.4. Differential Scanning Calorimetry (DSC) and Thermogravimetry (TG)

The thermal properties of the compounds were investigated in the temperature range from 293 to 770 K in aluminum crucibles by the method of simultaneous thermal analysis. The heat flux (DSC) and mass loss (TGA) were simultaneously measured on the STA 449 F1 Jupiter (Netzsch, Germany) thermoanalytical complex. The experiments were carried out on the samples of polycrystalline powders in a dry nitrogen flow of 70 mL/min and at a heating and cooling rate of 10 K/min.

2.5. Crystal Growth and Analysis

The solubility of the compounds was analyzed by a weighting method. Crystal growth was carried out by the slow isothermal evaporation of the solvent at 22 °C [39]. The surface morphology and thickness of the crystals were studied using a BX 61 fluorescence microscope (Olympus, Tokyo, Japan) and a LEXT OLS 3100 confocal microscope (Olympus, Tokyo, Japan).

2.6. X-ray Diffraction

The structure of T-BTD and TMS-T-BTD single crystals was investigated by single-crystal X-ray diffraction on an XtaLAB Synergy-R DW system X-ray diffractometer equipped with a HyPixArc 150 detector (Rigaku Oxford Diffraction, Rigaku, Tokyo, Shibuya) at room temperature. The experimental data were processed using CrysAlisPro software [40]. Crystallographic calculations (correction for anomalous scattering, allowance for absorption, averaging of symmetry-equivalent reflections) were performed using the JANA2006 software package [41]. The carbon atomic coordinates were found using the charge-flipping method with the Superflip program. The coordinates of non-hydrogen atoms of the structure and the parameters of their thermal displacements were specified using the least-squares method in the full matrix version. It was not possible to localize hydrogen atoms on maps of difference electron density syntheses constructed from the experimental data obtained at 293 K. The coordinates of the hydrogen atoms were fixed in the model structure. Visualization and analysis of the crystal structure were performed using the Mercury software package (The Cambridge Crystallographic Data Centre: Cambridge, UK) [42]. Calculating the potentials of pair interactions between the nearest molecules in the crystal was performed on the basis of the force field using the ”UNI Intermolecular Potentials” component in Mercury software 2.0 [43]. Crystal morphology reconstruction was performed using WinXMorph version 1.54 software (University of Washington, Seattle, Washington, USA) [44].
A pattern of X-ray diffraction reflection from the developed face of the largest T-BTD lamellar single crystal was also obtained at room temperature on an X-ray powder diffractometer TDM-20 (Tongda, Dandong, China) (CuKα radiation, λ = 1.54178 Å, collection rate of 1 deg/min).

2.7. Absorption and Fluorescence Spectra

The absorption spectra of molecular solutions were measured on a UV-2501PC spectrophotometer (Shimadzu, Kyoto, Japan). Fluorescence spectra were measured on a spectrophotometer-spectrofluorimeter FLUORAN-2 (VNIIOFI, Russia). When measuring the fluorescence spectra of solutions, standard 10 × 10 mm quartz cells were used. The fluorescence quantum yield of solutions was determined by comparison with the known quantum yield of standards using the method of measuring the fluorescence of optically diluted solutions [45]. Solutions of rhodamine 6G in ethanol (ФF = 0.95) with optical density ε × c × l ≤ 0.1 were used as the standard for measuring the fluorescence quantum yield of luminophores [46]. Measurements of the quantum yield and fluorescence spectra of crystalline films deposited on quartz substrates were carried out in an integrating sphere made of highly reflective polytetrafluoroethylene. To calibrate the sphere, we used the fluorescence of a microcrystalline layer of tetraphenylbutadiene, which is characterized by a high fluorescence quantum yield (ФF = 0.95) and low reabsorption losses (kreabs = 0.88).

2.8. Photodurability Measurements

Photostability was studied in hexane solutions with a concentration of 5·10−5 mol/L when irradiated with unfiltered light from a DKsSh-150 xenon arc ball lamp (power 150 W). Irradiation was carried out in tightly closed quartz cuvettes with a ground stopper with an optical path length of 1 cm.

2.9. Fluorescence Lifetime Measurements

The fluorescence decay kinetics of the solutions and crystals was studied using a FluoTime 300 time-correlated photon-counting spectrofluorimeter (PicoQuant, Berlin, Germany). The fluorescence was excited at a wavelength λex = 440 ± 3 nm using a laser diode source LDH 440. The signal was recorded near the maximum of the fluorescence spectra.

3. Results and Discussion
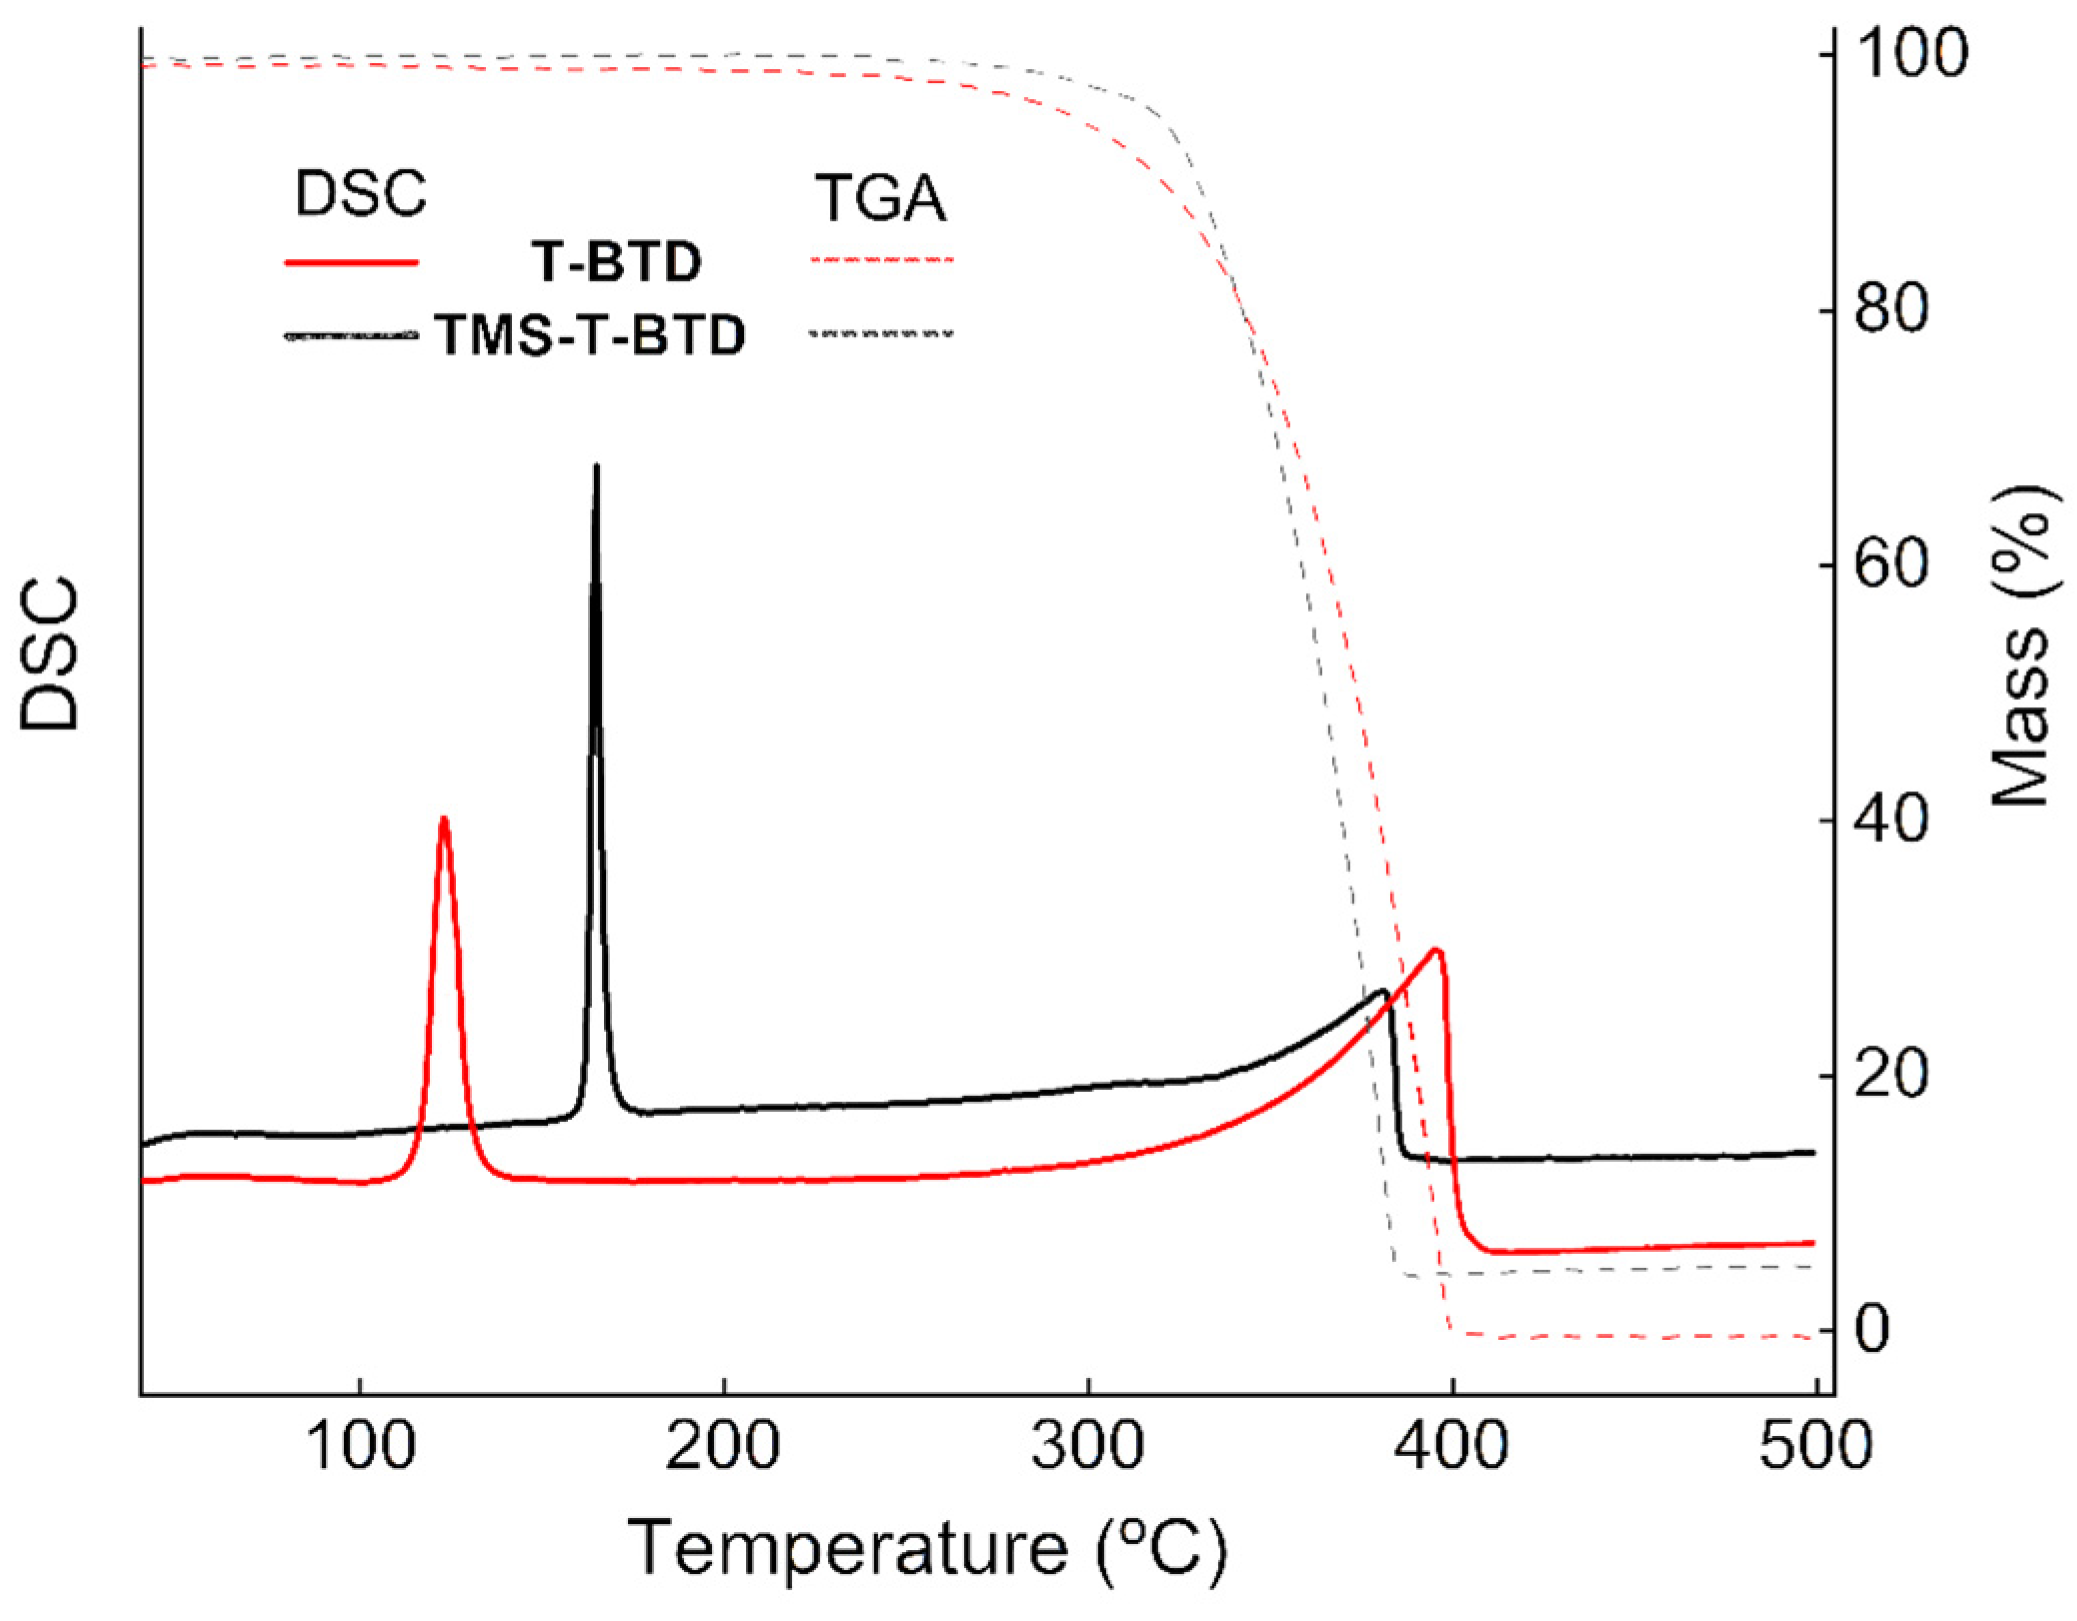
3.1. DSC and TGA

DSC and TGA curves for the samples of both compounds investigated are presented in Figure 3 and Figure S1. The melting and thermal stability parameters of the compounds are presented in Table 1.
According to the literature, T-BTD melts at approximately 110–115 °C [22] or 118 °C [1]. In [25], it was reported that this compound melts at 120 °C with a thermal effect of 23.0 kJ/mol. In our experimental conditions, T-BTD melts around 117 °C with an average enthalpy of 22 kJ/mol, which is in good agreement with the findings reported earlier. During the initial heating of the sample near the melting temperature, an endothermic effect consisting of two peaks is observed. The first peak corresponds to the onset temperature of the process at 117 °C, while the second (higher) peak is separated at 123 °C (Supplementary Figure S1, blue curve). Upon subsequent heating cycles, only one endothermic peak is observed, indicating the onset of melting at 117 °C (Figure S1, black dashed curve). Interestingly, during the cooling phase and crystallization of the supercooled melt below the melting temperature, both in the first cycle and subsequent cycles, an exothermic effect consisting of two peaks is observed (Figure S1). This characteristic feature may be attributed to the presence of a high-temperature polymorphic phase.
The melting temperature of TMS-T-BTD is 45 degrees higher and the heat effect of melting is 1.5 times larger than that of T-BTD. It is worth noting that for both compounds under consideration, the enthalpy of melting is proportional to the molar mass. Upon heating in consecutive thermo-cycles, the melting behavior of TMS-T-BTD is well reproduced, and no features associated with the presence of polymorphic or liquid crystalline transitions are observed.
Table 1 presents the values of the temperature T5%, at which the sample loses 5% of its initial mass, for the investigated compounds. As seen in Figure 3, in the solid state, both T-BTD and TMS-T-BTD are resistant to volatilization, and significant substance loss due to evaporation begins at the temperatures significantly higher than the melting point. The substituted with TMS group compound, under identical conditions, loses 5% of its mass at a temperature 20 degrees higher than T-BTD. Under the considered temperature regime, T-BTD completely evaporates at 400 °C, while the evaporation of TMS-T-BTD is completed at 386 °C. However, for TMS-T-BTD, the residual substance remains in the amount of 4–5% of the initial sample weight after the completion of evaporation in the heating cycle, presumably related to a thermal decomposition of the compound.

3.2. Crystal Growth and Characterization

The solubility of the compounds in hexane is presented in Table 1. In comparison with T-BTD, the concentration of saturated solution is almost two times higher for TMS-T-BTD. Thus, the terminal trimethylsilyl substituents in the compound significantly improve the solvation compared to the unsubstituted compound.
Figure 4a illustrates T-BTD crystals obtained in one of the experiments by growing them from a hexane solution with a slight addition of THF (8:1 vol.) over a period of 30 days. As can be seen, T-BTD crystals exhibit a preferred orientation along which they linearly grow, reaching lengths of over 10 mm, with well-developed facets. The largest crystal obtained had dimensions of 7 × 2 × 0.5 mm3 (indicated by an arrow in Figure 4a). Thus, under conditions of slow growth, T-BTD crystals are formed as prisms or elongated plates, often assuming a rectangular shape (Figure 4b and Figure S2a). Under conditions of fast crystal growth, the linear anisotropy of their shape is more pronounced. As an example, needle-like T-BTD crystals reaching a length of 10 mm, obtained by evaporating the solution in acetone for a period from 2 to 7 days, are presented in Figure S2b.
The surface of the developed face of T-BTD crystals is typically non-uniform and abundant in macro-steps (Figure 4b) and dislocation-driven growth hillocks in the form of pyramids (Figure 4c and Figure S2c). Some crystals exhibit rectangular etch pits, with a concentration reaching ~1010 m−2 (Figure S2d).
The crystals of TMS-T-BTD in the form of rods and thin needles, shown in Figure 5a and Figure S3a in Supplementary Materials, were obtained from a hexane solution within 24 days. The largest rod-shaped sample measures 8 × 1 × 0.45 mm3, while the thin needle-shaped crystals easily grow in length up to 15 mm (Figure S3a). These crystals exhibit a texture on the surface in the form of stripes aligned along the main axis (Figure 5b and Figure S3b in Supplementary Materials). Under UV illumination, the lateral surface of the TMS-T-BTD crystals exhibits yellow-green luminescence, while the ends emit a bright light, indicating the presence of a waveguide effect (Figure 5b).
When grown from a methanol solution with a small addition of THF (15:1 vol.) under the same conditions, TMS-T-BTD crystals formed more slowly, but with better surface quality. The crystals grown under these conditions for 48 days are shown in Figure 5c. As an example, Figure 5d shows an enlarged image of the smooth surface of the developed face of one of the crystals.
Thus, the compounds investigated exhibit a 1D (T-BTD, TMS-T-BTD) and 2D (T-BTD) anisotropic crystal growth pattern when crystallized from solutions under identical conditions. We will attempt to understand the observed anisotropic growth motifs of the crystals of the substances through thorough analysis of their crystal structure.

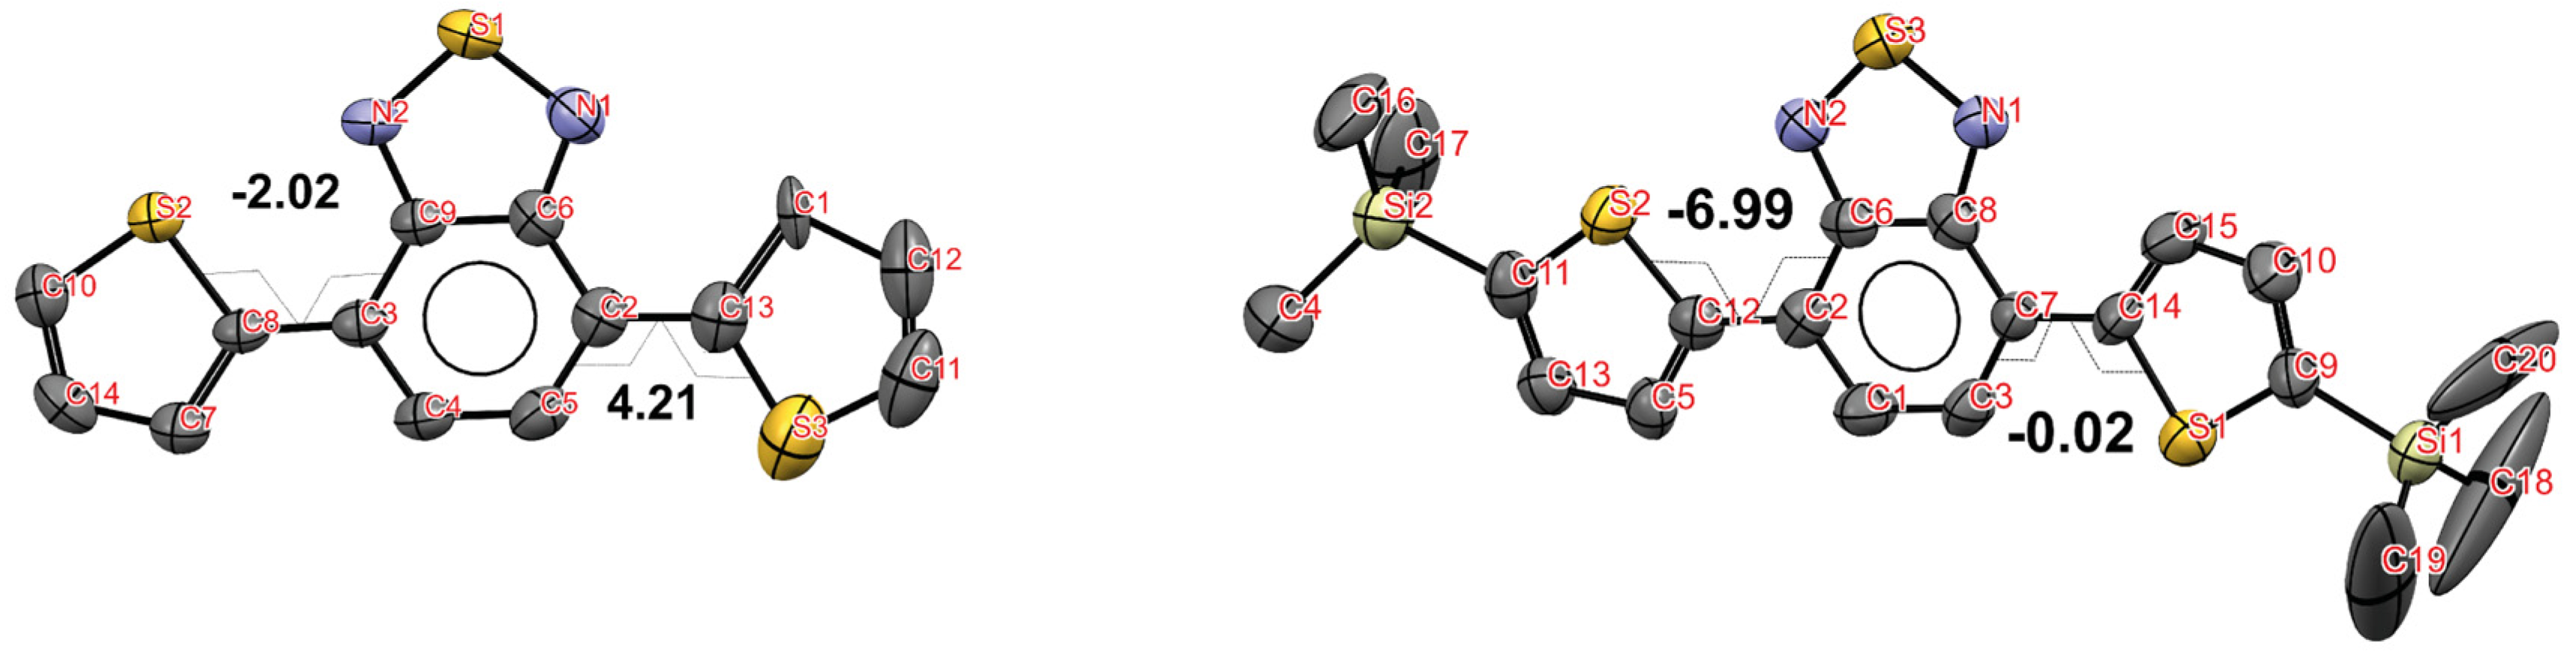
3.3. Crystal Structure

The search for a unit cell in the single crystals of T-BTD and TMS-T-BTD investigated resulted in the selection of rhombic and monoclinic cells, respectively, with the parameters listed in Table 2. The obtained results regarding the crystal structure of T-BTD are in good agreement with the findings presented in [23]. During the analysis of the experimental data array obtained at room temperature, the Superflip program automatically proposed the centrosymmetric space group Pcab and a model consisting of 19 non-hydrogen atoms for the T-BTD monocrystal. For the TMS-T-BTD monocrystal, the program suggested the centrosymmetric space group P21/c and a model comprising 27 non-hydrogen atoms. The chemical formulas of the compounds based on the obtained coordinate sets at room temperature are C14H0N2S3 and C20H0N2S3Si2, respectively. After refining the structural parameters of the non-hydrogen atoms using the least-squares method in the full-matrix version with the experimental data obtained at room temperature, differential electron density synthesis maps around the carbon atoms were constructed and analyzed. Information about the structures investigated was deposited in the Cambridge Structural Database (CCDC ## 2300065, 2295957).
The conformational structures of the molecules in the crystals are presented in Figure 6. As can be seen, the conjugated core of the molecules adopts a nearly planar conformation. The average values of the torsion angles between the thiophene and BTD groups are −2.0° and 4.2° for T-BTD, and −7.0° and 0.0° for TMS-T-BTD. In the case of the T-BTD molecules, there is a broadening of the thermal ellipsoids of the carbon atoms (C11, C12) and sulfur atom (S3) in one of the thiophene groups. For the TMS-T-BTD molecules, significant broadening of the carbons in the terminal trimethylsilyl groups is observed, particularly on one side (C18, C19, C20), indicating a tendency towards disorder in the crystal in regions where the terminal groups of the molecules are localized.
The projection of the unit cell of the T-BTD crystal onto the (0 1 0) plane is shown in Figure 7a (the view of the unit cell is provided in Figure S4a in Supplementary Materials). In Figure 7, molecules of the same color are symmetrically equivalent within the unit cell. The crystal is composed of densely packed monomolecular layers that are parallel to the (0 1 0) plane. The thickness of the monolayers is half of the parameter b (Figure 7b). The densest molecular rows within these monolayers are oriented along the a-axis. If the molecular planes in one row are parallel to the (1 0 2) plane, then in the adjacent rows, the molecular planes are parallel to the ( 1 ¯ 0 2) plane. In other words, the angle of the packing arrangement is determined by the angle between these planes and is approximately 89 degrees (Figure 7a). It is also worth noting that within the dense [100] rows, adjacent molecules are not equivalent in terms of translational symmetry, but they are oriented almost antiparallel to each other with respect to the orientation of the BTD group (Figure 7b). The planes of the BTD groups in neighboring molecules are oriented at an angle of 3.91 degrees.
Figure 7c,d depict, in different projections, the schematic representation of the strongest intermolecular pairwise van der Waals interactions between nearest neighbors in the crystal. The black numbers indicate the values of the model pair potentials of van der Waals interactions (in units kJ/mol), as well as the distances between the centers of the corresponding molecules. The central molecule is denoted by the index ‘0’, while the indices ‘1’, ‘2’, and ‘3’ represent the nearest neighbors in order of decreasing bond strength (the prime mark on the index represents a molecule that is symmetric to the non-primed molecule with respect to the central ‘0’).
Within the densest [1 0 0] rows, the centers of the closest molecules are situated closest to each other in the crystal at a distance of 5.031 Å. Consequently, the pairwise interaction potentials between neighbors have the greatest depth and amount to −79.9 kJ/mol. Since the molecules within the densest [1 0 0] rows are shifted relative to each other by an angle δ = 135.76° − 90° = 45.76° (Figure 7d), the distances between the planes of neighboring molecules are even closer, averaging 3.5 Å. Thus, a π…π stacking interaction (C6…C8, 3.473 Å) between the aromatic systems of the thiophene and BTD groups of adjacent molecules occurs in the densely packed rows (Figure S4b,c in Supplementary Materials).
The interaction between the central molecule ‘0’ and the molecules in positions ‘2’ and ‘3/3’ is noticeably weaker. The distances between the centers of these molecules decrease to 8.212 Å (02) and 7.909 Å (03), while the magnitude of the pairwise potential decreases by more than four times in absolute value. Therefore, pronounced bond anisotropy is observed among the nearest neighbors, with the strongest interaction occurring along the [1 0 0] direction. This structural feature determines the observed tendency of crystals to exhibit anisotropic linear growth along the a-axis (Figure 4 and Figures S2b and S6a in Supplementary Materials).
Among the contacts with nearest neighbors, C-H…π interactions predominate, with hydrogen, carbon, and sulfur atoms exhibiting contact distances ranging from 2.814 Å (C12…H1c10) to 2.998 Å (C5…H1c14) (Figure S4c in Supplementary Materials).
The structure of the TMS-T-BTD crystal unit cell is shown in Figure 8a and Figure S5a in Supplementary Materials. In this case, dense rows of molecules stacked in pairs, oriented along the [1 0 0] direction, are observed in the crystal. (Figure 8b). Within these rows, the nearest neighbor molecules are equivalent due to translational symmetry. In the cross-section of the (1 0 0) plane, the packed rows of molecules align in pairs, with their long axes parallel to either the (0 1 1) or (0 1 1 ¯ ) planes (Figure 8b). The BTD molecule group is aligned parallel to the (1 4 2) or (1 4 2 ¯ ) planes, which intersect at an almost right angle of 89.34° (Figure S5a in Supplementary Materials).
The scheme of pairwise van der Waals interactions between nearest neighbors in the crystal is presented in Figure 8c. The centers of adjacent molecules (‘202’) in the densely packed rows [1 0 0] are positioned at a distance of 6.550 Å with significant displacement (Figure 8d and Figure S5b). The potential for pairwise interaction between the nearest neighbor molecules within this row has a value of -64.9 kJ/mol (Figure 8c). Figure 8d shows the arrangement of the closest molecules (‘0’ and ‘2’) in projection onto the (1 4 2) plane and the magnitudes of their relative displacements horizontally (3.28 Å) and vertically (4.42 Å) within this plane (the distance between the planes in which these molecules lie is 3.684 Å). Yet the strongest interaction of molecule ‘0’ occurs with molecule ‘1’ (−88.5 kJ/mol), located at a distance of 6.175 Å in the same plane as molecule ‘2’ (Figure 8c). The interaction of the central molecule with molecules in position ‘3’ and its symmetric counterpart in position ‘3’ (not shown in the figure) is significantly weaker. In absolute terms, the interaction potential between the molecule pair ‘03’ is approximately four and three times weaker compared to the interaction potentials in pairs ‘01’ and ‘02’, respectively (Figure 8c). As depicted in Figure 8b, the dimers ‘01’ with the strongest intermolecular interaction in the crystal connect the densely packed rows of molecules in pairs. Thus, the linear anisotropy of the TMS-T-BTD crystal growth is determined by the presence of a specific direction [1 0 0], along which the twinned dense rows of molecules are oriented (Figure S6c).
As apparent from Figure 8d and Figure S5b, π…π stacking interactions between the closest molecules ‘0’, ‘1’, and ‘2’ that are aligned parallel to each other occur between the aromatic systems of thiophene and the BTD group (S1…S3, 3.697 Å; C13…S3, 3.561 Å; C5…S3, 3.513 Å). The shortest C-H…π contacts are observed as follows: H3c17…C3, 2.994 Å; H1c10…S3, 3.018 Å. Thus, the distance between the centers of the nearest molecules in the TMS-T-BTD crystal (6.180 Å) is longer compared to the T-BTD crystal (5.031 Å), i.e., the structure appears to be more loose. The π…π stacking interactions between the aromatic systems of thiophene and the BTD group in the TMS-T-BTD crystal occur at slightly larger distances (0.04–0.2 Å). However, in the TMS-T-BTD crystal, the π…π stacking between the most strongly interacting molecules is accompanied by more significant displacements of the aromatic group planes (Figures S4b and S5b). Regarding the C-H…π interactions, the lengths of the shortest contact distances in the TMS-T-BTD crystal are generally about 0.3 Å longer compared to the T-BTD crystal (Figures S4c and S5c).
The total energy of the crystal packing calculated in the force field approximation for T-BTD is Ec = −178.8 kJ/mol, for TMS-T-BTD − Ec = −212.9 kJ/mol. Since the energy of crystal packing characterizes the enthalpy of sublimation, the noticeably higher modulus value of Ec for TMS-T-BTD indicates the greater stability of the crystals of this compound relative to sublimation processes in comparison with T-BTD.
Thus, the presence of densely packed monolayers parallel to the (0 1 0) plane in the crystal structure of T-BTD leads to the formation of a developed face in the orientation of this plane. Furthermore, the existence of densely packed rows oriented along the a-axis, with the strongest intermolecular interactions among nearest neighbors, explains the observed maximum growth rate of crystals along this direction. Figure 9a depicts an image of the elongated plate-like T-BTD crystal, indicating the facet indices and the direction along which crystal growth occurs at the highest speed. The crystal presented exhibits a typical flat shape with angles between the lateral facets measuring 128 and 142 degrees. The indexing was performed by comparing the actual crystal shape with the data from a single-crystal X-ray diffraction experiment (Figure S6a) and an X-ray diffraction pattern acquired by reflecting off the developed crystal facet using a powder diffractometer (Figure S6b). Figure 9b displays a reconstruction of the T-BTD crystal morphology.
Unlike the T-BTD crystal, the TMS-T-BTD crystal lacks densely packed monomolecular layers relative to which growth at the highest rate could take place. In this case, the crystal structure of TMS-T-BTD consists of dense paired molecular rows along the [1 0 0] direction, along which the crystal growth rate significantly exceeds the increment rate in the other directions (Figure 9c). A reconstruction of the TMS-T-BTD crystal morphology, incorporating the data from a single-crystal X-ray diffraction experiment (Figure S6c), is depicted in Figure 9d.

3.4. Absorption and Fluorescent Properties of T-BTD and TMS-T-BTD

3.4.1. Solutions

The structure of electronic transitions in a free molecule (gas) is most closely resembled by the structure of electronic transitions in a molecule placed in a transparent solvent. The influence of the solvent on the energy of electronic states can be assessed by comparing the absorption and fluorescence characteristics of solutions of the investigated molecules in different solvents. It is advisable to use the solvents with varying degrees of polarity for this purpose. The compounds T-BTD and TMS-T-BTD are well soluble in both THF (polar solvent) and hexane (nonpolar solvent). Therefore, hexane and THF were chosen for investigating the absorption and fluorescence properties of the solutions. The spectral distributions of the molar extinction coefficient of T-BTD and TMS-T-BTD in hexane and THF are shown in Figure 10a. The extinction coefficient values corresponding to the maxima of the two most intense bands in the absorption spectra are given in Table 3.
It is evident that polarity of the solvent has a negligible effect on the absorption spectra of T-BTD and TMS-T-BTD. The position of the absorption band maxima in the spectrum of T-BTD remains the same for both the hexane and THF solutions. In the absorption spectrum of TMS-T-BTD, the transition from hexane to THF is accompanied by a slight hypsochromic shift of the long-wavelength band (−2 nm, ~100 cm−1) and an equally insignificant bathochromic shift of the short-wavelength band (+2 nm, ~200 cm−1).
The attachment of TMS groups to the conjugated chromophore T-BTD cannot lead to the appearance of new absorption bands in the TMS-T-BTD spectrum, as the TMS fragment does not absorb light in the UV-VIS range. Changes in the absorption spectrum of the conjugated chromophore resulting from the attachment of such end-groups are typically explained by the direct influence of the substituent potential field on π-electrons of the conjugated chromophore. This influence is usually insignificant. However, the spectral distributions of the extinction coefficients of the T-BTD and TMS-T-BTD compounds, as shown in Figure 10a, differ significantly. The long-wavelength absorption band in the TMS-T-BTD spectrum is bathochromically shifted by 500–600 cm−1, and the short-wavelength band is shifted by 1100–1300 cm−1 compared to the corresponding absorption bands of T-BTD. The extinction coefficient in the maximum of the long-wavelength absorption band in the TMS-T-BTD spectrum is 39–32% higher and in the short-wavelength band it is 36–33% higher than those in the T-BTD compound.
These differences are due to the fact that, in addition to the inductive effect on π-electrons of the conjugated core, the introduction of TMS groups slightly alters the conformation of the T-BTD chromophore. The conformational change involves a torsional angle between the thiophene and benzothiadiazole fragments. Unlike the T-BTD molecule, where each thiophene fragment is only attached to the benzothiadiazole through a -C-C- bond, in the TMS-T-BTD molecule, the thiophene fragment is attached to the central benzothiadiazole through a -C-C- bond and to the bulky trimethylsilyl group through a -C-Si- bond. Therefore, in the TMS-T-BTD molecule, rotation of the thiophene fragment along the -C-C- bond is more hindered compared to the T-BTD molecule. As a result, different torsional angles correspond to the equilibrium conformations (optimal geometry) of T-BTD and TMS-T-BTD. The absorption spectra corresponding to different chromophore conformations can significantly differ from each other, as observed for the T-BTD and TMS-T-BTD molecules.
The interaction of the solvation shell with molecules can lead to a change in the equilibrium conformation of the molecule in its free state. When transitioning from a polar to a nonpolar solvent, the configuration of the solvation shell changes, which can also cause a change in the equilibrium conformation of the molecule. The transition from hexane to THF solutions does not alter the absorption properties of the T-BTD and TMS-T-BTD molecules, indicating that their equilibrium conformations are independent of the solvent polarity.
The fluorescence spectra of T-BTD and TMS-T-BTD solutions in hexane and THF, shown in Figure 10b, consist of a single structureless band, which is mirror-symmetric to the long-wavelength absorption band. When transitioning from hexane to THF solutions, the maximum positions of the fluorescence bands of T-BTD and TMS-T-BTD shift towards the lower frequencies by 1000 ÷ 700 cm−1, while the maxima of their long-wavelength absorption bands shift by only 100 ÷ 200 cm−1. The values of the quantum yield and fluorescence decay time of the T-BTD and TMS-T-BTD solutions in hexane and THF are provided in Table 3. The calculated values of the rate constants for radiative (fluorescence) and nonradiative (singlet–triplet conversion) processes are also presented in Table 3. The rates of radiative and nonradiative processes in the T-BTD and TMS-T-BTD compounds depend significantly on the solvent. In the unsubstituted compound, the ratio in hexane is 5.38, while in THF it is 36.5. In the substituted compound, the ratio in hexane is 17.5, while in THF it is 10.5. The probability of singlet–singlet and singlet–triplet transitions is determined by the relative arrangement of the corresponding energy levels, which, in turn, largely depend on the conformation of the molecule. The equilibrium conformations of the ground states of T-BTD and TMS-T-BTD remain unchanged when transitioning from hexane to THF; therefore, the dependency of the ratio on the solvent is determined by the conformational change of the excited molecule. The conformational change after the molecule excitation occurs during the solvate transition (dissolved molecule + solvent molecules) to a new equilibrium state. Since the lifetime of the first excited state of both the T-BTD and TMS-T-BTD compounds is long (9 ÷ 13 ns), while the intermolecular relaxation time constant is small (~0.1 ÷ 1 ns), fluorescence occurs from the new equilibrium state of the solvate. The different influence of solvent polarity on the conformation of the ground and excited states is largely determined by the change in the static dipole moment and molecular polarizability upon excitation.
To estimate the values of the static dipole moments corresponding to the ground and first excited states of the T-BTD and TMS-T-BTD compounds, their absorption and fluorescence spectra were investigated in a series of solvents: hexane, THF, dichloromethane, and acetonitrile (Figure S7 in Supplementary Materials). Figure S8 shows the dependence of the difference ν ˜ a b s ν ˜ e m (a, b) and the sum ν ˜ a b s + ν ˜ e m (c, d) of the absorption and fluorescence band maxima on the empirical functions of the polarity of solvent f ( ε D , n ) and ϕ ( ε D ) . From these dependencies, using the Lippert–Mataga equations, we obtained the values of static dipole moments in the ground μ e and excited μ e states [47,48]. The calculation results are shown in Table 3. As we can see, the static dipole moment of the compounds under investigation increases sharply upon transition to the first excited state: for T-BTD from 1.3 D to 9.7 D, and for TMS-T-BTD from 4 D to 15 D. The molecule with a large dipole moment of the excited state interacts with polar and nonpolar molecules of the solvation shell in different ways, which leads to different conformations of the molecule in polar and nonpolar environments.

3.4.2. Photostability of T-BTD and TMS-T-BTD in Hexane

The photostability of the T-BTD and TMS-T-BTD compounds was studied using an inert, nonpolar, oxygen-free hexane as the solvent, which is not prone to the formation of peroxides (unlike THF). The initial concentration of the compounds investigated was 5 × 10⁻⁵ mol/L. The test solution was placed in tightly sealed quartz cuvettes with ground stoppers and with an optical path length of 1 cm. It was then exposed to unfiltered light from a xenon arc lamp DKsH-150, the spectrum of which is close to solar light.
Figure S9 shows the absorption and fluorescence spectra taken at equal time intervals during the irradiation process. A decrease in the intensity of both absorption and fluorescence spectra is observed during the irradiation, with a faster decrease for the T-BTD and a slower decrease for the TMS-T-BTD solutions. From the absorption spectra, the concentrations of the undecomposed T-BTD and TMS-T-BTD compounds were obtained for each irradiation time period (Figure 11). The calculated values of the quantum yield of photodestruction for the T-BTD and TMS-T-BTD compounds are presented in Table 3 and Table S1 in Supplementary Materials. The quantum yield of photodestruction for T-BTD is 13 times higher than that for TMS-T-BTD. The faster photodestruction of T-BTD compared to TMS-T-BTD is attributed to the intercombination conversion rate of T-BTD molecules in hexane, which is 2.7 times higher than that of TMS-T-BTD (0.016 ns−1 vs. 0.006 ns−1). The integrated fluorescence intensity for T-BTD also decreases faster than that for TMS-T-BTD (Figure S10 in Supplementary Materials).

3.4.3. Crystals

The fluorescent properties were investigated on bulk crystals of T-BTD and TMS-T-BTD with linear dimensions of 1–3 mm. Figure 12a,b show the fluorescence and fluorescence excitation spectra of the crystals, as well as the fluorescence and absorption spectra of the T-BTD and TMS-T-BTD solutions in hexane for comparison purposes. From these data, it can be concluded that the fluorescence excitation spectrum of the T-BTD crystal is shifted by 1300–1400 cm−1 towards the lower frequencies compared to TMS-T-BTD. Conversely, the absorption spectrum of the T-BTD solution in hexane is shifted by 500–600 cm−1 towards the higher frequencies compared to the TMS-T-BTD solution in hexane. Comparison of the fluorescence spectra leads to the same conclusion: the peak of the T-BTD crystal fluorescence spectrum is shifted by 1200–1300 cm−1 towards the lower frequencies compared to the peak of the TMS-T-BTD crystal fluorescence spectrum. At the same time, the peak of the fluorescence spectrum of the T-BTD solution in hexane is shifted by 300–400 cm−1 towards the higher frequencies compared to the TMS-T-BTD solution in hexane.
The maximum of the fluorescence spectrum of the TMS-T-BTD crystal is located between the maxima of its fluorescence in hexane and THF (Table 3). The maximum of the fluorescence spectrum of the T-BTD crystal is shifted by 2200 cm−1 and 1200 cm−1 towards the lower frequencies compared to its spectra in hexane and THF, respectively (Table 3). The quantum yield of fluorescence of the TMS-T-BTD crystal is 15–20% lower than its quantum yield in solutions, while the quantum yield of fluorescence of the T-BTD crystal is twice as low as the quantum yield in solutions (Table 3). The results obtained suggest that the conformation of the molecules, which act as fluorescent centers in the TMS-T-BTD crystal, is close to the average conformation of the TMS-T-BTD molecules in solutions. The conformation of the molecules responsible for the fluorescence of the T-BTD crystal are likely significantly different from the conformation of the T-BTD molecules in solutions.

4. Conclusions

Thus, the luminophores investigated are highly soluble and prone to forming large single crystals from solutions. It has been established that at room temperature, the solubility of the trimethylsilyl substituted derivative TMS-T-BTD in nonpolar hexane is almost twice as high as that of T-BTD. High thermal stability and relatively moderate melting temperatures are favorable factors for using melt techniques to obtain large crystals of these compounds. The crystal structures of T-BTD in the rhombic system (sp. gr. Pcab, Z = 8) have been refined using single-crystal X-ray diffraction at room temperature, while the crystal structure of TMS-T-BTD has been determined for the first time in the monoclinic system (sp. gr. P21/c, Z = 4). T-BTD crystals grow in the form of needles or elongated plates along the [1 0 0] direction and have a developed (0 1 0) face. In the same conditions, TMS-T-BTD crystals grow well as thin needles or rods, exhibiting preferential 1D anisotropic growth along the [1 0 0] direction. The observed growth anisotropy of the luminescent crystals investigated is associated with the features of their crystal structure. In T-BTD crystals, direction of the fastest growth [1 0 0] corresponds to the direction of densely packed rows of molecules. Within these rows, the interaction between the nearest neighbors is several times stronger than with the neighbors in the other directions. Moreover, the crystal structure of T-BTD exhibits monomolecular layers with a thickness of ~6.4 Å (b/2) oriented in the (0 1 0) plane and packed in a herringbone-like manner, which determines the 1–2D anisotropic growth of the crystals. However, in the crystal structure of TMS-T-BTD, there is no layered packing motif. Here, only parallel rows of closely packed molecules are present, oriented along the direction of preferential growth [1 0 0]. The interaction between the nearest molecules within these rows is several times stronger than with the neighbors in the other directions, thereby defining the preferential 1D anisotropic growth of crystals in this compound. Compared to the crystal structure of T-BTD, the structure of the TMS-T-BTD crystals appears to be more loosely packed. In the TMS-T-BTD crystals, the π…π stacking interaction between the most strongly interacting molecules is weaker than in the T-BTD crystals due to more significant displacement of the aromatic group planes relative to each other, resulting in a weaker overlap. It has been established that the attachment of TMS groups leads to a change in the equilibrium conformation of the conjugated core, which accounts for the difference between the absorption spectra of TMS-T-BTD and T-BTD. It has been demonstrated that the equilibrium conformations of the compounds investigated are practically independent of the solvent. It has been discovered that the ratio of fluorescence rates to intersystem crossing conversion ( k r / k n r ) in both compounds significantly changes when transitioning from hexane to THF and is associated with a sharp increase in the static dipole moment upon excitation. The correlation between the photostability of the TMS-T-BTD and T-BTD compounds and the intersystem crossing conversion rate has been established. It was shown that the fluorescent properties of TMS-T-BTD crystals are close to the fluorescent properties of solutions, while the fluorescent properties of T-BTD crystals are sharply different from the properties of solutions.

Supplementary Materials

The following supporting information can be downloaded at: https://www.mdpi.com/article/10.3390/cryst13121697/s1, Figure S1: DSC curves characterizing the melting and crystallization of the T-BDT sample in two consecutive heating and cooling cycles; Figure S2: crystals of T-BTD: (a) crystals grown from a solution in hexane with a small addition of THF (growth period 30 days); (b) crystals grown from a solution in acetone (growth period 7 days); (c), (d) images of the surface of the developed face of crystals grown from solution in hexane; Figure S3: crystals of TMS-T-BTD grown from a hexane solution (a) and enlarged image of the bottom crystal surface (b); Figure S4: crystal structure of T-BTD at 293 K: (a) view of unit cell; (b) projection of three neighboring molecules from a close-packed row [1 0 0] onto the (1 0 2) plane; (c) scheme of shortest contacts of a molecule with atoms of nearest neighbors; Figure S5: crystal structure of TMS-T-BTD at 293 K: (a) view of unit cell; (b) projection of four neighboring molecules onto the (1 4 2) plane; (c) scheme of shortest contacts of a molecule with atoms of nearest neighbors; Figure S6: (a) photographic image of a T-BTD single crystal with face indices determined in the X-ray diffraction experiment; (b) XRD pattern obtained by reflection from a developed face of a flat T-BTD crystal (photo in the insert); (c) photographic image of a TMS-T-BTD single crystal with face indices determined in the X-ray diffraction experiment.; Figure S7: normalized absorption (right axis) and fluorescence (left axis) spectra of solutions of T-BTD (a) and TMS-T-BTD (b) in hexane, THF, dichloromethane (DCM), and acetonitrile (ACN). Excitation was carried out at the maximum of the long-wave absorption band; Figure S8: the calculation of the dipole moments of T-BTD (a,c) and TMS-T-BTD (b,d) molecules: dependence of the difference (a,b) and sum (c,d) of the absorption and fluorescence band maxima on the solvent functions f ε D , n and φ ε D . The points are experimental data and the lines are linear regression (the equations of dependencies and the linear regression coefficient are given); Figure S9: changes in the absorption (a,b) and fluorescence (c,d) spectra of solutions of T-BTD (a,c) and TMS-T-BTD (b,d) in hexane upon irradiation. The initial concentration was 5·10−5 mol/L and the cuvette thickness was 1 cm. Excitation was carried out with light with a wavelength of 446 nm (T-BTD) and 457 nm (TMS-T-BTD); Figure S10: change in the relative integral fluorescence of solutions of T-BTD and TMS-T-BTD in hexane upon irradiation. The points are experimental data and the lines are approximations. Excitation was carried out with light at wavelengths of 446 nm (T-BTD) and 457 nm (TMS-T-BTD); Table S1: photoirradiation of T-BTD and TMS-T-BTD solutions in hexane.

Author Contributions

Conceptualization and writing—original draft preparation, V.A.P. and N.M.S.; methodology, all authors; synthesis, O.V.B., M.S.S., L.L.L. and V.V.P.; crystal growth and optical microscopy, A.A.K. and V.A.P.; DSC/TG, M.S.L.; SCXRD, T.A.S. and N.I.S.; PRXD, A.A.K.; optical spectroscopy, G.A.Y., E.A.S. and N.M.S.; writing—review and editing, V.A.P., G.A.Y., N.I.S., O.V.B., N.M.S., and S.A.P.; supervision, S.A.P.; project administration, O.V.B. All authors have read and agreed to the published version of the manuscript.

Funding

The research was supported by the Russian Science Foundation grant No. 22-13-00255.

Data Availability Statement

The data presented in this study are available in the article.

Acknowledgments

The research was carried out using the scientific equipment of the Shared Research Center “Structural Diagnostics of Materials” of the FSRC “Crystallography and Photonics” RAS and the Shared Research Center “Polymer Research Center” of the ISPM RAS.

Conflicts of Interest

The authors declare no conflict of interest.

References

  1. Van Mullekom, H.A.M.; Vekemans, J.A.J.M.; Meijer, E.W. Band-Gap Engineering of Donor—Acceptor-Substituted π-Conjugated Polymers. Chem. Eur. J. 1998, 4, 1235–1243. [Google Scholar] [CrossRef]
  2. Neto, B.A.D.; Lapis, A.A.M.; Da Silva Júnior, E.N.; Dupont, J. 2,1,3-Benzothiadiazole and Derivatives: Synthesis, Properties, Reactions, and Applications in Light Technology of Small Molecules. Eur. J. Org. Chem. 2013, 2013, 228–255. [Google Scholar] [CrossRef]
  3. Martins da Costa, R.G.; de Queiroz Garcia, R.; da Mazzoli, R.; Fiuza, R.; Maqueira, L.; Pazini, A.; de Boni, L.; Limberger, J. Synthesis, Photophysical Properties and Aggregation-Induced Enhanced Emission of Bischalcone-Benzothiadiazole and Chalcone-Benzothiadiazole Hybrids. J. Lumin. 2021, 239, 118367. [Google Scholar] [CrossRef]
  4. Boehme, S.C.; Tchamba Yimga, N.; Frick, A.; Gunst, S.; Untenecker, H.; Kennis, J.T.M.; van Stokkum, I.H.M.; Kirsch, P.; von Hauff, E. Correlating Ultrafast Dynamics, Liquid Crystalline Phases, and Ambipolar Transport in Fluorinated Benzothiadiazole Dyes. Adv. Electron. Mater. 2021, 7, 2100186. [Google Scholar] [CrossRef]
  5. Watanabe, N.; He, W.; Nozaki, N.; Matsumoto, H.; Michinobu, T. Benzothiadiazole versus Thiazolobenzotriazole: A Structural Study of Electron Acceptors in Solution-Processable Organic Semiconductors. Chem. Asian J. 2022, 17, e202200768. [Google Scholar] [CrossRef]
  6. Squeo, B.M.; Bertini, F.; Scavia, G.; Uslenghi, M.; Fois, E.S.; Pasini, M.; Botta, C. Polarized Emission and Mechanofluorochromism of Benzothiadiazole Based Chromophores Oriented by Rubbing. Dye. Pigment. 2022, 204, 110473. [Google Scholar] [CrossRef]
  7. Skorotetcky, M.S.; Krivtsova, E.D.; Borshchev, O.V.; Surin, N.M.; Svidchenko, E.A.; Fedorov, Y.V.; Pisarev, S.A.; Ponomarenko, S.A. Influence of the Structure of Electron-Donating Aromatic Units in Organosilicon Luminophores Based on 2,1,3-Benzothiadiazole Electron-Withdrawing Core on Their Absorption-Luminescent Properties. Dye. Pigment. 2018, 155, 284–291. [Google Scholar] [CrossRef]
  8. Gudim, N.S.; Knyazeva, E.A.; Mihalchenko, L.V.; Golovanov, I.S.; Popov, V.V.; Obruchnikova, N.V.; Rakitin, O.A. Benzothiadiazole vs. Iso-Benzothiadiazole: Synthesis, Electrochemical and Optical Properties of d–a–d Conjugated Molecules Based on Them. Molecules 2021, 26, 4931. [Google Scholar] [CrossRef]
  9. Zając, D.; Honisz, D.; Łapkowski, M.; Sołoducho, J. 2,1,3-Benzothiadiazole Small Donor Molecules: A DFT Study, Synthesis, and Optoelectronic Properties. Molecules 2021, 26, 1216. [Google Scholar] [CrossRef]
  10. Postnikov, V.A.; Sorokina, N.I.; Kulishov, A.A.; Lyasnikova, M.S.; Grebenev, V.V.; Voloshin, A.E.; Borshchev, O.V.; Skorotetcky, M.S.; Surin, N.M.; Svidchenko, E.A.; et al. Highly Luminescent Crystals of a Novel Linear π-Conjugated Thiophene-Phenylene Co-Oligomer with a Benzothiadiazole Fragment. Acta Cryst. B 2019, 75, 1076–1085. [Google Scholar] [CrossRef]
  11. Postnikov, V.A.; Kulishov, A.A.; Lyasnikova, M.S.; Grebenev, V.V.; Skorotetcky, M.S.; Borshchev, O.V.; Ponomarenko, S.A. Crystals of Phenylene–Oxazole Oligomer with a Central Benzothiadiazole Fragment. J. Surf. Investig. 2020, 14, 540–543. [Google Scholar] [CrossRef]
  12. Postnikov, V.A.; Sorokina, N.I.; Kulishov, A.A.; Lyasnikova, M.S.; Sorokin, T.A.; Freidzon, A.Y.; Stepko, A.S.; Borshchev, O.V.; Skorotetsky, M.S.; Surin, N.M.; et al. A New Linear Phenyloxazole–Benzothiadiazole Luminophore: Crystal Growth, Structure and Fluorescence Properties. Acta Cryst. B 2022, 78, 261–269. [Google Scholar] [CrossRef] [PubMed]
  13. Sifuentes-Vázquez, L.D.; Martínez-González, E.; Toscano, R.A.; Gaviño, R.; Cárdenas, J.; Rius-Alonso, C.A.; Amador-Bedolla, C.; García de la Mora, G.A.; Ugalde-Saldivar, V.M. Experimental and Theoretical Exploration of Aryl Substituent Effects on the Electronic Properties of Asymmetric 4,7-Di(Thiophene-2-Yl)-Benzo[c][2,1,5]Thiadiazole Compounds. Polycycl. Aromat. Compd. 2022, 42, 1563–5333. [Google Scholar] [CrossRef]
  14. Merlin, B.F.; Amrutha, R. Spectroscopic and HLCT Analysis on 4,7-Di(2-Thienyl)-2,1,3-Benzothiadiazole and Its Di-Substituted Derivatives for Development of Potent Hole Transport Material: DFT Approach. Acta Phys. Pol. A 2022, 141, 445–460. [Google Scholar] [CrossRef]
  15. Lee, U.R.; Lee, T.W.; Hoang, M.H.; Kang, N.S.; Yu, J.W.; Kim, K.H.; Lim, K.G.; Lee, T.W.; Jin, J.-I.; Choi, D.H. Photoreactive Low-Bandgap 4H-Cyclopenta[2,1-b:3,4-B′]Dithiophene and 4,7-Di(Thiophen-2-Yl)Benzo[c][1,2,5]Thiadiazole-Based Alternating Copolymer for Polymer Solar Cell. Org. Electron. 2011, 12, 269–278. [Google Scholar] [CrossRef]
  16. Ding, P.; Chu, C.C.; Zou, Y.; Xiao, D.; Pan, C.; Hsu, C.S. New Low Bandgap Conjugated Polymer Derived from 2, 7-Carbazole and 5, 6-Bis(Octyloxy)-4, 7-Di(Thiophen-2-Yl) Benzothiadiazole: Synthesis and Photovoltaic Properties. J. Appl. Polym. Sci. 2012, 123, 99–107. [Google Scholar] [CrossRef]
  17. Wang, L.; Qing, F.; Sun, Y.; Li, X.; Wang, H. Synthesis and Photovoltaic Properties of Poly(5,6-Bis(Octyloxy)-4,7-Di(Thiophen-2-Yl)Benzo-[c][1,2,5]-Thiadiazole-9,9-Dioctylfluorene). J. Mater. Sci. Technol. 2013, 29, 1214–1218. [Google Scholar] [CrossRef]
  18. Liu, B.; Qiu, B.; Chen, X.; Xiao, L.; Li, Y.; He, Y.; Jiang, L.; Zou, Y. High Performance Polymer Solar Cells Based on a Two Dimensional Conjugated Polymer from Alkylthienyl-Substituted Benzodifuran and Benzothiadiazole. Polym. Chem. 2014, 5, 5002–5008. [Google Scholar] [CrossRef]
  19. Çelik, K.; Kivrak, A.; Bezgin Çarbaş, B. A New Electrochromic Copolymer Composed of 4, 7-Di(Thiophen-2-Yl)Benzo[c] [1, 2, 5] Thiadiazole and 3, 4-Ethylenedioxythiophene. Turkish J. Chem. 2022, 46, 1516–1523. [Google Scholar] [CrossRef]
  20. Hua, B.; Zhang, C.; Zhou, W.; Shao, L.; Wang, Z.; Wang, L.; Zhu, H.; Huang, F. Pillar[5]Arene-Based Solid-State Supramolecular Polymers with Suppressed Aggregation-Caused Quenching Effects and Two-Photon Excited Emission. J. Am. Chem. Soc. 2020, 142, 16557–16561. [Google Scholar] [CrossRef]
  21. D’Alessandro, M.; Amadei, A.; Daidone, I.; Po’, R.; Alessi, A.; Aschi, M. Toward a Realistic Modeling of the Photophysics of Molecular Building Blocks for Energy Harvesting: The Charge-Transfer State in 4,7-Dithien-2-Yl-2,1, 3-Benzothiadiazole as a Case Study. J. Phys. Chem. C 2013, 117, 13785–13797. [Google Scholar] [CrossRef]
  22. Pati, P.B.; Senanayak, S.P.; Narayan, K.S.; Zade, S.S. Solution Processable Benzooxadiazole and Benzothiadiazole Based D-A-D Molecules with Chalcogenophene: Field Effect Transistor Study and Structure Property Relationship. ACS Appl. Mater. Interfaces 2013, 5, 12460–12468. [Google Scholar] [CrossRef] [PubMed]
  23. Iagatti, A.; Patrizi, B.; Basagni, A.; Marcelli, A.; Alessi, A.; Zanardi, S.; Fusco, R.; Salvalaggio, M.; Bussotti, L.; Foggi, P. Photophysical Properties and Excited State Dynamics of 4,7-Dithien-2-Yl-2,1,3-Benzothiadiazole. Phys. Chem. Chem. Phys. 2017, 19, 13604–13613. [Google Scholar] [CrossRef] [PubMed]
  24. He, G.; Du, L.; Gong, Y.; Liu, Y.; Yu, C.; Wei, C.; Yuan, W.Z. Crystallization-Induced Red Phosphorescence and Grinding-Induced Blue-Shifted Emission of a Benzobis(1,2,5-Thiadiazole)-Thiophene Conjugate. ACS Omega 2019, 4, 344–351. [Google Scholar] [CrossRef] [PubMed]
  25. Nielsen, C.B.; White, A.J.P.; McCulloch, I. Effect of Fluorination of 2,1,3-Benzothiadiazole. J. Org. Chem. 2015, 80, 5045–5048. [Google Scholar] [CrossRef] [PubMed]
  26. Bulumulla, C.; Gunawardhana, R.; Kularatne, R.N.; Hill, M.E.; McCandless, G.T.; Biewer, M.C.; Stefan, M.C. Thieno[3,2- b] Pyrrole-Benzothiadiazole Banana-Shaped Small Molecules for Organic Field-Effect Transistors. ACS Appl. Mater. Interfaces 2018, 10, 11818–11825. [Google Scholar] [CrossRef] [PubMed]
  27. Huang, C.F.; Chang, J.Y.; Huang, S.H.; Wu, K.Y.; Jheng, J.F.; Chuang, W.T.; Hsu, C.S.; Wang, C.L. Polymorphisms and Morphological Studies of a Difluorobenzothiadiazole Conjugated Copolymer with 7.8% Polymer Solar Cell Efficiency. J. Mater. Chem. A 2015, 3, 3968–3974. [Google Scholar] [CrossRef]
  28. Stuart, A.C.; Tumbleston, J.R.; Zhou, H.; Li, W.; Liu, S.; Ade, H.; You, W. Fluorine Substituents Reduce Charge Recombination and Drive Structure and Morphology Development in Polymer Solar Cells. J. Am. Chem. Soc. 2013, 135, 1806–1815. [Google Scholar] [CrossRef]
  29. Casey, A.; Han, Y.; Fei, Z.; White, A.J.P.; Anthopoulos, T.D.; Heeney, M. Cyano Substituted Benzothiadiazole: A Novel Acceptor Inducing n-Type Behaviour in Conjugated Polymers. J. Mater. Chem. C 2015, 3, 265–275. [Google Scholar] [CrossRef]
  30. Wudarczyk, J.; Papamokos, G.; Marszalek, T.; Nevolianis, T.; Schollmeyer, D.; Pisula, W.; Floudas, G.; Baumgarten, M.; Müllen, K. Dicyanobenzothiadiazole Derivatives Possessing Switchable Dielectric Permittivities. ACS Appl. Mater. Interfaces 2017, 9, 20527–20535. [Google Scholar] [CrossRef]
  31. Roy, C.; Bura, T.; Beaupré, S.; Légaré, M.A.; Sun, J.P.; Hill, I.G.; Leclerc, M. Fluorinated Thiophene-Based Synthons: Polymerization of 1,4-Dialkoxybenzene and Fluorinated Dithieno-2,1,3-Benzothiadiazole by Direct Heteroarylation. Macromolecules 2017, 50, 4658–4667. [Google Scholar] [CrossRef]
  32. Zhang, J.; Chen, W.; Rojas, A.J.; Jucov, E.V.; Timofeeva, T.V.; Parker, T.C.; Barlow, S.; Marder, S.R. Controllable Direct Arylation: Fast Route to Symmetrical and Unsymmetrical 4,7-Diaryl-5,6-Difluoro-2,1,3-Benzothiadiazole Derivatives for Organic Optoelectronic Materials. J. Am. Chem. Soc. 2013, 135, 16376–16379. [Google Scholar] [CrossRef] [PubMed]
  33. Zhang, J.; Parker, T.C.; Chen, W.; Williams, L.R.; Khrustalev, V.N.; Jucov, E.V.; Barlow, S.; Timofeeva, T.V.; Marder, S.R. C-H-Activated Direct Arylation of Strong Benzothiadiazole and Quinoxaline-Based Electron Acceptors. J. Org. Chem. 2016, 81, 360–370. [Google Scholar] [CrossRef] [PubMed]
  34. Osaka, I.; Shimawaki, M.; Mori, H.; Doi, I.; Miyazaki, E.; Koganezawa, T.; Takimiya, K. Synthesis, Characterization, and Transistor and Solar Cell Applications of a Naphthobisthiadiazole-Based Semiconducting Polymer. J. Am. Chem. Soc. 2012, 134, 3498–3507. [Google Scholar] [CrossRef] [PubMed]
  35. Ohshita, J.; Kaneko, F.; Tanaka, D.; Ooyama, Y. Preparation and Photoinduced Energy and Electron Transfer of Donor-Silicon-Acceptor Polymers. Asian J. Org. Chem. 2014, 3, 170–175. [Google Scholar] [CrossRef]
  36. Wonneberger, H.; Ma, C.Q.; Gatys, M.A.; Li, C.; Bäuerle, P.; Müllen, K. Terthiophene-Perylene Diimides: Color Tuning via Architecture Variation. J. Phys. Chem. B 2010, 114, 14343–14347. [Google Scholar] [CrossRef]
  37. DaSilveira Neto, B.A.; Lopes, A.S.A.; Ebeling, G.; Gonçalves, R.S.; Costa, V.E.U.; Quina, F.H.; Dupont, J. Photophysical and Electrochemical Properties of π-Extended Molecular 2,1,3-Benzothiadiazoles. Tetrahedron 2005, 61, 10975–10982. [Google Scholar] [CrossRef]
  38. Shin, W.; Jo, M.Y.; You, D.S.; Jeong, Y.S.; Yoon, D.Y.; Kang, J.W.; Cho, J.H.; Lee, G.D.; Hong, S.S.; Kim, J.H. Improvement of Efficiency of Polymer Solar Cell by Incorporation of the Planar Shaped Monomer in Low Band Gap Polymer. Synth. Met. 2012, 162, 768–774. [Google Scholar] [CrossRef]
  39. Postnikov, V.A.; Sorokina, N.I.; Kulishov, A.A.; Yurasik, G.A.; Lyasnikova, M.S.; Sorokin, T.A. Growth, Structure, and Phase Behavior of Di-tert-butyl-para-terphenyl Crystals. Crystallogr. Rep. 2023, 68, 137–146. [Google Scholar] [CrossRef]
  40. CrysAlisPro, version 171.41_64.88a. Software for Single Crystal X-ray Diffraction. Rigaku Corporation: Tokyo, Japan, 2018.
  41. Petrícek, V.; Dušek, M.; Palatinus, L. Crystallographic Computing System JANA2006: General Features. Z. Krist. 2014, 229, 345–352. [Google Scholar]
  42. Mercury, version 2022.2.0. Software for Crystal Structure Visualization, Exploration and Analysis. The Cambridge Crystallographic Data Centre: Cambridge, UK, 2022.
  43. Gavezzotti, A. Are Crystal Structures Predictable? Acc. Chem. Res. 1994, 27, 309–314. [Google Scholar] [CrossRef]
  44. Kaminsky, W. From CIF to Virtual Morphology Using the WinXMorph Program. J. Appl. Crystallogr. 2007, 40, 382–385. [Google Scholar] [CrossRef]
  45. Demas, J.N.; Crosby, G.A. The Measurement of Photolumineseence Quantum Yields. A Review. J. Phys. Chem. 1971, 75, 991–1024. [Google Scholar] [CrossRef]
  46. Berlman, I.B. Handbook of Florescence Spectra of Aromatic Molecules; Academic Press: New York, NY, USA; London, UK, 1971; ISBN 9780323161671. [Google Scholar]
  47. Lippert, E. Spektroskopische Bestimmung Des Dipolmomentes Aromatischer Verbindungen Im Ersten Angeregten Singulettzustand. Z. Elektrochem. Berichte Bunsenges. Phys. Chem. 1957, 61, 962–975. [Google Scholar] [CrossRef]
  48. McRae, E.G. Theory of Solvent Effects on Molecular Electronic Spectra. Frequency Shifts. J. Phys. Chem. 1957, 61, 562–572. [Google Scholar] [CrossRef]
Figure 1. Structural formulas of the luminophores investigated and their designations.
Crystals 13 01697 g001
Figure 2. Scheme for the synthesis of TMS-T-BTD.
Crystals 13 01697 g002
Figure 3. DSC and TGA curves of the investigated compounds.
Crystals 13 01697 g003
Figure 4. Crystals of T-BTD grown from a hexane solution with a small addition of THF (a) and their enlarged images in reflected (b) and transmitted (c) light.
Crystals 13 01697 g004
Figure 5. Crystals of TMS-T-BTD: (a) crystals grown from a hexane solution; (b) magnified image of the crystal grown from hexane in reflected light and its luminescent image under UV illumination; (c) crystals grown from a methanol solution; (d) magnified image of a section of the crystal surface in reflected light grown from a methanol solution.
Crystals 13 01697 g005
Figure 6. Conformational structures of the T-BTD (above) and TMS-T-BTD molecules in ORTEP view (thermal ellipsoids with a probability of 50%).
Crystals 13 01697 g006
Figure 7. Crystal structure of T-BTD: (a) projection of the unit cell onto the plane (0 1 0); (b) projection of the structure onto the plane (1 0 0); (c,d) diagrams of pairwise interactions for a molecule with four nearest neighbors (the values of the corresponding pairwise potentials in kJ/mol are indicated in black numbers).
Crystals 13 01697 g007
Figure 8. Crystal structure of TMS-T-BTD: (a) unit cell view; (b) projection of the structure onto the plane (1 0 0); (c) diagram of pairwise interactions for a molecule with four nearest neighbors (the values of the corresponding pairwise potentials in kJ/mol are indicated in black numbers); (d) location of nearest neighbors in the densest row [1 0 0] in the projection on the plane (1 4 2).
Crystals 13 01697 g008
Figure 9. (a) Image of a T-BTD crystal indicating the face indices and orientation of the major axis; (b) T-BTD crystal morphology; (c) luminescent image of a TMS-T-BTD crystal indicating the orientation of the major axis; (d) TMS-T-BTD crystal morphology.
Crystals 13 01697 g009
Figure 10. Spectral distribution of the molar extinction coefficient (a) and fluorescence spectra (b) of T-BTD and TMS-T-BTD in hexane and THF solutions. Excitation was carried out at the maximum of the long-wave absorption band.
Crystals 13 01697 g010
Figure 11. Change in the concentration of T-BTD and TMS-T-BTD solutions in hexane during irradiation. Points: experimental data; lines: approximation.
Crystals 13 01697 g011
Figure 12. Fluorescence excitation (a) and emission (b) spectra of T-BTD and TMS-T-BTD crystals. Excitation spectra were recorded at a wavelength of 670 nm for T-BTD and 620 nm for TMS-T-BTD. For comparison, the absorption and fluorescence spectra of solutions of T-BTD and TMS-T-BTD in hexane are shown.
Crystals 13 01697 g012
Table 1. Melting parameters (Tm and ΔHm), thermal stability (T5%), and molar solubility of the compounds (S) in hexane at 22 °C.
CompoundM
(g/mol)
Tm
(°C)
ΔHm
(kJ/mol)
T5%
(°C)
S
(mM∙L−1)
T-BTD300.4117223016.1 ± 0.5
TMS-T-BTD444.81623432111.8 ± 0.5
Note. T5% is the temperature at which the sample loses 5% of its mass.
Table 2. Crystallographic characteristics, experimental data, and refinement of the structures of T-BTD and TMS-T-BTD.
CompoundT-BTDTMS-T-BTD
FormulaC14H8N2S3 C20H24N2S3Si2
T (K)293
Sp. gr.PcabP21/c
Z/Z′8/14/1
a (Å)9.9571(2)6.5497(2)
b (Å)12.7688(2)20.9594(10)
c (Å)20.2639(3)17.2242(8)
α (deg)9090
β (deg)9091.751(3)
γ (deg)9090
V03)2576.36(8)2364.3(2)
D0 (g∙cm−3)1.5491.2495
No. of measured, independent, and observed
[I > 3σ(I)] reflections
165461/
2104/4.13/
1873
22584/
2612/10.35/
928
R/wR4.260/4.8600.039/0.035
S3.341.02
Δρmin/Δρmax (e∙Å−3)−0.27/0.29−0.40/0.45
Table 3. Photophysical properties of T-BTD and TMS-T-BTD in solutions of hexane, THF, and in the crystalline state.
T-BTDTMS-T-BTD
HexaneTHFCrystalHexaneTHFCrystal
λ a b s max 1 (nm/cm−1)446/22,400446/22,400-457/21,900455/22,000-
ε max 1 (M−1 cm−1)13,70014,800-19,10019,500-
λ a b s max 2 (nm/cm−1)304/32,900304/32,900-314/31,800316/31,600-
ε max 2 (M−1 cm−1)25,00027,000-33,90035,900-
λ f l u o r (nm/cm−1)541/18,500570/17,500613/16,300552/18,100576/17,400568/17,600
Stokes shift (cm−1)39004900-38004600-
Q Y f l u o r (%)849745959177
τ f l u o r (ns)9.813.3-9.110.8-
k r (ns−1)0.0860.073-0.1050.084-
k n r (ns−1)0.0160.002-0.0060.008-
Q Y P h D 4·10−5--3·10−6--
μ g (D)1.3-4-
μ e (D)9.7-15-
Disclaimer/Publisher’s Note: The statements, opinions and data contained in all publications are solely those of the individual author(s) and contributor(s) and not of MDPI and/or the editor(s). MDPI and/or the editor(s) disclaim responsibility for any injury to people or property resulting from any ideas, methods, instructions or products referred to in the content.

