Article

Effect of Geometrical Confinement on Ordering of Thermoplastic Polyurethanes with Crystallizable Hard and Soft Blocks

Laboratory of Structural Methods of Materials Investigation, National University of Science and Technology MISIS, Leninskiy Prospekt 4, 119049 Moscow, Russia
*
Author to whom correspondence should be addressed.
Crystals 2023, 13(12), 1662; https://doi.org/10.3390/cryst13121662
Submission received: 19 November 2023 / Revised: 30 November 2023 / Accepted: 2 December 2023 / Published: 5 December 2023
(This article belongs to the Section Organic Crystalline Materials)

Abstract

:
A series of multi-block thermoplastic polyurethanes incorporating different soft block structures was synthesized. This was achieved using a poly(butylene adipate) oligomer combined with its macrodiols of both an aromatic and aliphatic nature. The composition of the hard block included 1,6-hexamethylene diisocyanate, 4,4′-diphenylmethane diisocyanate, and 1,4-butanediol. For the first time, the structural evolution and phase composition of both the hard and soft segments were analyzed during in situ thermal treatments. A combination of synchrotron small- and wide-angle X-ray scattering, differential scanning calorimetry, thermogravimetric analysis, and Fourier transform infrared spectroscopy was used to determine the influence of the macrodiol’s nature and crystallization conditions on the polymorphic behavior of poly(butylene adipate). Using a new synthesis scheme, a relatively high degree of crystallinity for urethane blocks was achieved, which depended on the diisocyanate type in the structure of the soft segment. The hard segment domains imposed geometrical constraints on poly(butylene adipate), thereby altering its crystallization process compared to the neat oligomer. Thus, crystallization after annealing at a low temperature (80 °C) was fast, predominantly yielding a metastable β-phase. When heated to 180 °C, which was higher than the hard segment’s melting temperature, a phase-separated structure was observed. Subsequent crystallization was slower, favoring the formation of the stable α-PBA modification. The phase separation could be observed even after the hard block melting. Notably slow crystallization from an isotropic melt was documented after the disruption of phase separation at 230 °C.

1. Introduction

Thermoplastic polyurethanes (TPU) belong to adaptive polymers due their responses to external factors such as temperature [1,2], humidity [3], light [4], or pH [5,6]. They represent multi-block copolymers containing soft polyester (SS) and hard polyurethane (HS) segments. TPUs exhibit a shape memory effect, characterized by their ability to revert from a temporary form to a stable configuration. This phenomenon can be conceptualized within the framework of a double-network model, wherein the networks are systematically constituted by the domains of soft and hard blocks, respectively, as detailed in [7]. The switching of mechanical properties can be achieved through the melting of soft segment crystals. The transition temperature of a polyester is influenced by various factors, including the crystallization conditions, thermal history, and chemical composition, as evidenced in references [8,9,10,11,12,13]. Consequently, varying these parameters enables control over the type and relative fraction of the crystalline phase, thereby facilitating the synthesis of materials with predetermined mechanical and thermodynamic properties. These thermally sensitive ‘smart’ TPUs can find application as protective biocoatings for metal and alloy scaffolds, as well as adaptive materials for orthodontic parts.
Poly(butylene adipate) (PBA), a biodegradable polyester known for its rapid crystallization at room temperature (RT), ranks among the most prevalent materials in the fabrication of TPUs. This polymer is noted for its robust mechanical properties and is capable of forming two distinct polymorphic modifications, the thermodynamically stable monoclinic α-phase and the metastable orthorhombic β-phase, as documented in references [14,15]. The α/β ratio in PBA-based polymers is defined by the crystallization temperature [16], thermal history [17], epitaxy on ordered substrates [18], and mechanical stretching [19].
Typically, the formation of a metastable phase occurs under conditions far from equilibrium. When stored at RT, a phase transition from the β-phase to the α-phase is observed, characterized by the development of thick crystals, as indicated in reference [20]. Furthermore, the results of differential scanning calorimetry reveal complex thermal behavior dependent on the heating rate. This behavior is associated with the melting and recrystallization of the beta phase, followed by the melting of the alpha phase [21]. The presence of geometrical confinement, such as crystallization within anodic aluminum oxide templates featuring pore diameters of up to 100 nm, can also shift the equilibrium in favor of the beta phase.
As for the hard segments, aromatic 4,4′-diphenylmethane diisocyanate (MDI) and linear 1,6-hexamethylene diisocyanate (HMDI) linked with chain extender 1,4-butanediol (BD) are widely used in TPU synthesis [22,23,24]. Such hard segments in multi-block TPUs form a partially ordered mesophase stabilized by H-bonding [10]. The efficiency of the H-bonding is influenced by the chemical nature of the diisocyanates. Consequently, HMDI-BD, characterized by linear quasi-extended segments, forms a denser network compared to the aromatic MDI-BD, which impacts the Young’s modulus. The mutual influence on the ordering of SS and HS in TPUs can be attributed to the microphase separation of thermodynamically incompatible polyester and polyurethane blocks. The efficiency and rate of phase separation strongly depend on the nature and flexibility of the segments. For TPUs based on PCL and MDI, variation in the hard block composition results in the formation of interconnected, isolated, and free domains of the hard blocks [25].
The influence of aliphatic (derived from HMDI) and cycloaliphatic (originating from IPDI) characteristics on the crystallization capabilities of polycaprolactone (PCL) blocks with varying molecular weights, as well as on the morphology of phase separation, was explored [26]. It was shown that a TPU based on IPDI exhibited a phase-compatible structure with a one-phase transition above 0 °C, characterized by a single-phase transition above 0 °C. Additionally, the material demonstrated thermosensitive deformation at a temperature of 45 °C. In contrast, a TPU based on HMDI exhibited superior shape memory properties, attributable to the phase-separated structure of the melt-crystallized soft and hard blocks. Generally, the formation of small crystals, constrained by the size of nanodomains within a physical network, provides good mechanical strength and elastic properties. Since the crystallization of HS markedly enhances the phase separation of incompatible blocks, as noted in [27], it also occurs in an amorphous–amorphous state [28]. In our prior research [29,30], we investigated the crystal structure, supramolecular organization, and mechanical properties of TPUs based on PBA and PCL diols, focusing particularly on their evolution during extended storage periods. We emphasized the significance of physical aging and slow crystallization rates in influencing the behavior of these materials. Using ultra-fast calorimetry, we elucidated the influence of the HS composition and microphase separation on the crystallization kinetics and polymorphism of PBA in the diblock TPUs [31]. Notably, the effective phase separation of HMDI-based urethane and PBA facilitates the formation of a mesophase of HS and the rapid crystallization of SS into the thermodynamically stable α-modification.
It should be noted that in all the publications discussed above, the SS of TPUs consist of a homopolymer of either polyester or polyether diol. In this paper, we investigate the structure formation of a novel series of multi-block TPUs, whose soft segments are composed of one, two, or three blocks, synthesized for the first time. The study employs a combination of small- and wide-angle X-ray scattering (SAXS/WAXS), differential scanning calorimetry (DSC), and Fourier transform infrared spectroscopy (FTIR), to examine ordering in these materials. We focus on elucidating the influence of phase separation within the TPU melt on the crystallization kinetics of both the HS and the SS, as well as on the phase composition of PBA.

2. Materials and Methods

2.1. Materials

Poly(butylene adipate) diol (PBA) (Huakai Resin Co., Ltd., Qingdao, China) was dried in a vacuum at 80 °C for 4 h. The hydroxyl group content, determined through a chemical method [32], was found to be 1.7 wt.%. 4,4′-Diphenylmethane diisocyanate (MDI) sourced from Alfa Aesar (Darmstadt, Germany) was utilized without further purification. 1,6-Hexamethylene diisocyanate (HMDI) from Merck (Darmstadt, Germany) underwent vacuum distillation at 50–55 °C/12 mm Hg and was subsequently stored in sealed ampoules. The chain extender, 1,4-butanediol (BD), also purchased from Merck (Darmstadt, Germany), was distilled over freshly powdered calcium hydride under reduced pressure. The dibutyltin dilaurate catalyst, acquired from Merck (Darmstadt, Germany), was used as received.

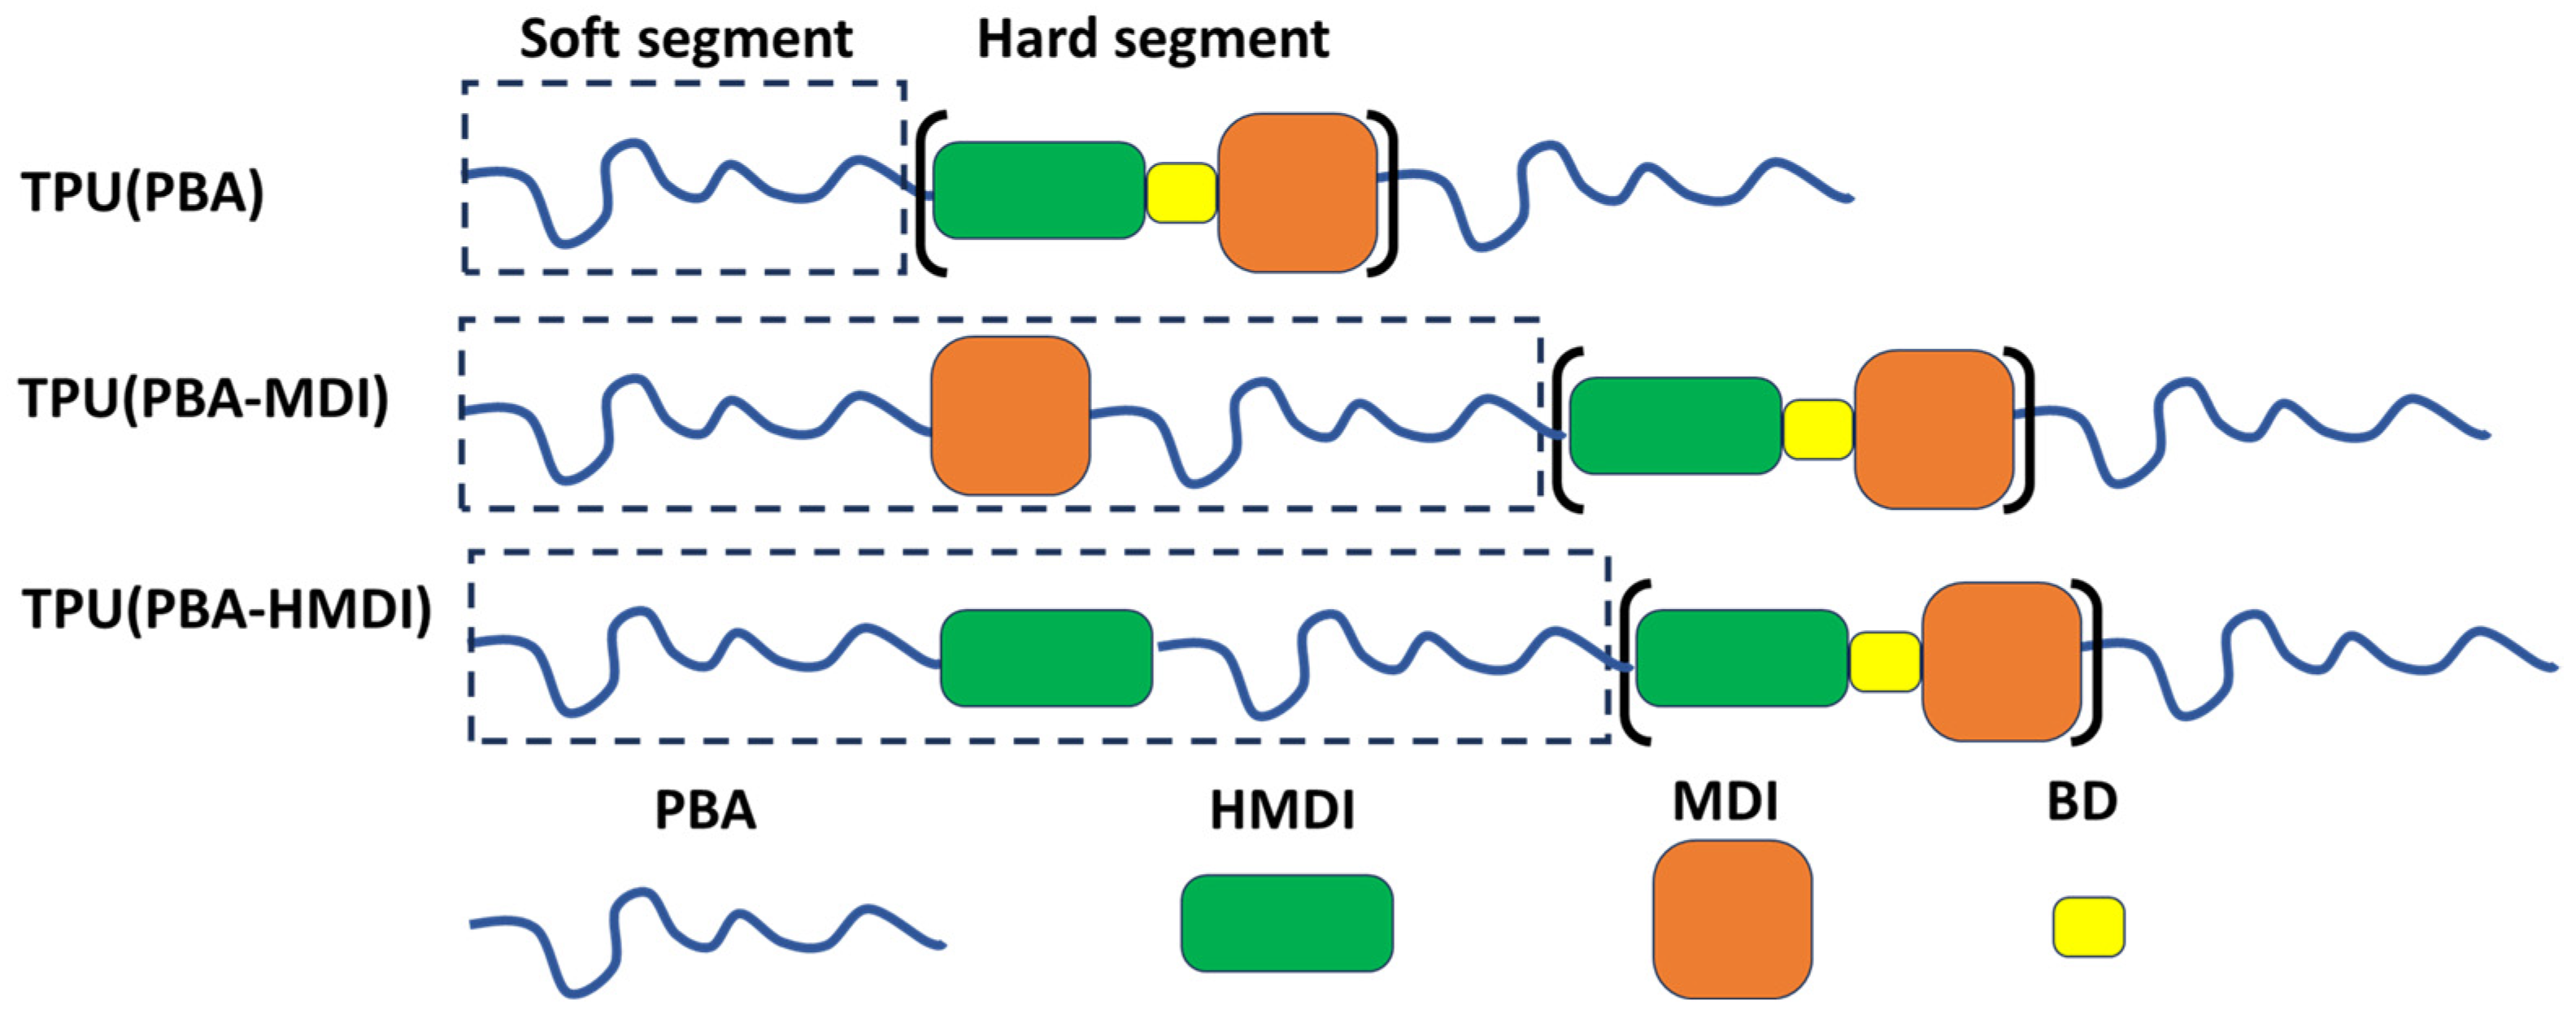
2.2. Synthesis of Multi-Block Thermoplastic Polyurethane (TPU)

Multi-block TPUs were obtained through the formation of macrodiisocyanate (MDC) in a solution of dichloromethane at RT in the presence of a catalyst from both the oligomer and macrodiols of PBA, diisocyanates of an aliphatic HMDI and aromatic MDI nature, as well as BD as a chain extender (Table 1). Firstly, PBA macrodiols containing two PBA oligomers and a diisocyanate were obtained in two stages. At the first stage, a diisocyanate of an aliphatic (HMDI) or aromatic (MDI) nature was added to the PBA oligomer to obtain terminal NCO groups, which, then, at the second stage, reacted with the OH groups of the PBA oligomer to produce PBA macrodiols of aliphatic and aromatic nature. Secondly, TPUs were synthesized by the reaction of HMDI with a PBA oligomer (TPU(PBA)) or with macrodiols based on HDMI (TPU(PBA-HMDI)) and MDI (TPU(PBA-MDI)) at [NCO]/[OH] = 2 to form MDC; then, a chain extender was added (BD) with aromatic diisocyanate MDI to achieve the stoichiometric ratio of functional groups ([NCO]MDI+HMDI/[OH]PBA+BD = 1). The mass fractions of the reagent were the following: polydiol (69%), diisocyanate (23%), and chain extender (8%). The SS/HS ratio was 2.2 for all samples. Polyurethane films were prepared from solution by drying at 40 °C for 24 h. The mass fraction of the hard segment (based on HMDI, MDI, and BD) was kept constant at 35%. Prior to conducting experiments, the native samples were stored at RT for two months.
The hard segment content (HS, %) was calculated as follows:
H S % = 1 + n   M M D I + H M D I + n M B D 1 + n   M M D I + H M D I + n M B D + M ( p o l y d i o l ) × 100 %
where M(polydiol), M(MDI + HMDI) and M(BD) are the molecular weights of the PBA, diisocyanate, and chain extender, respectively; n is the number of moles of BD. The chemical structure of the synthesized TPUs is presented in Scheme 1.
The reaction scheme is shown in Scheme S1 and stoichiometry of the designed TPU is shown in Table S1.

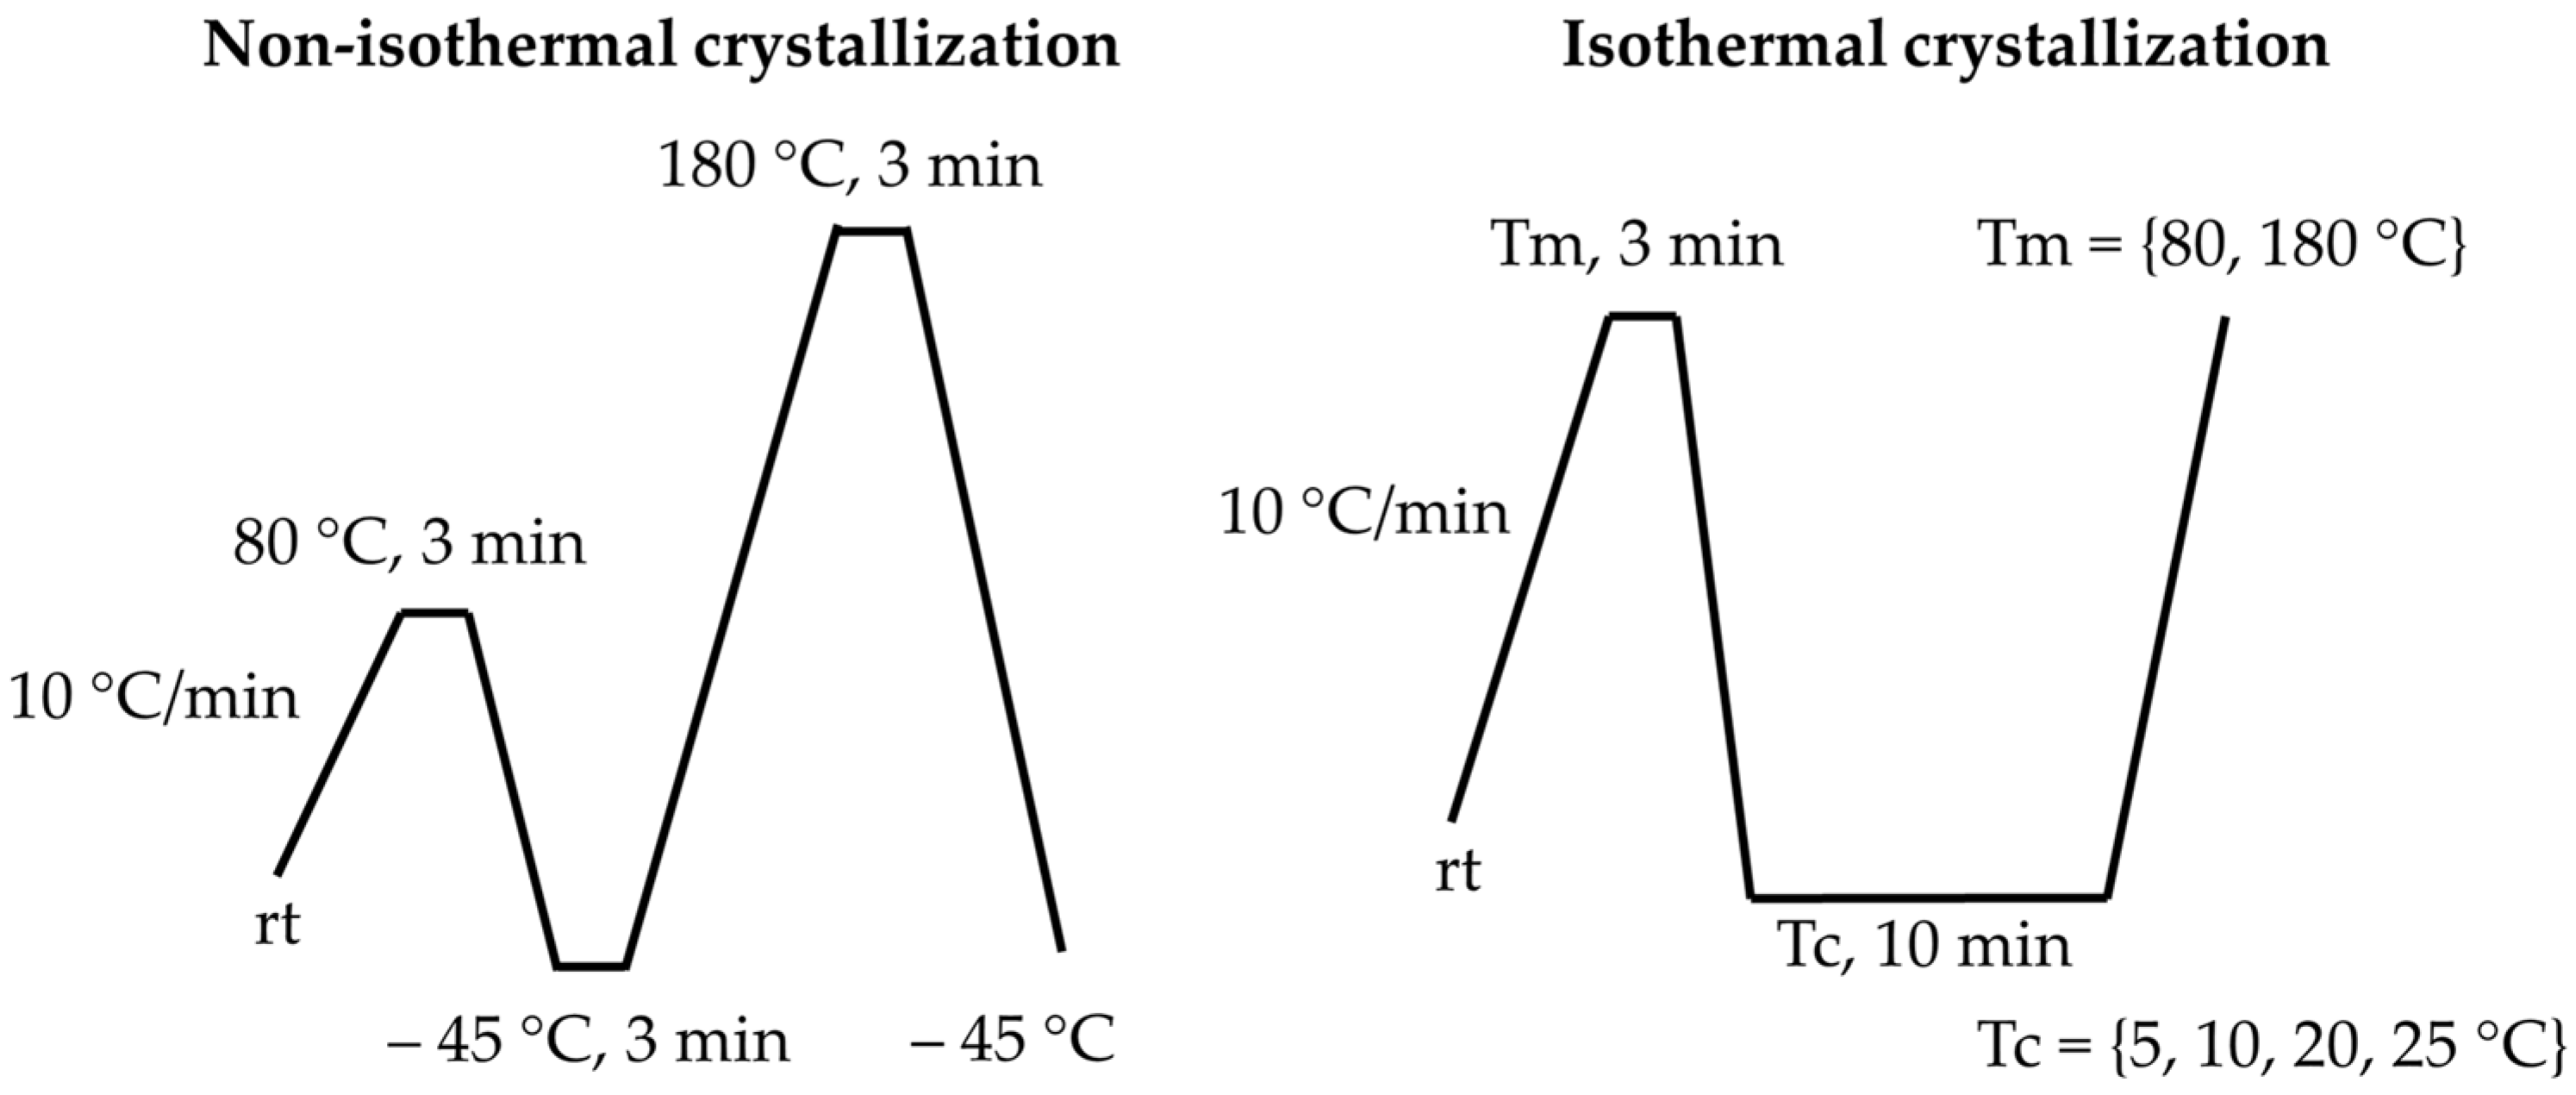
2.3. Characterization

The thermal degradation behavior of the samples was investigated using a TGA/STDTA851e (Mettler-Toledo, Greifensee, Switzerland) thermogravimetric analyzer (TGA). The analyses were conducted at a standard heating rate (10 °C/min) from room temperature to 550 °C under a nitrogen flow of 20 mL/min. The sample masses used were approximately 5 mg each.
The thermal behavior of the samples was investigated with a DSC 3+ (Mettler Toledo, Greifensee, Switzerland) differential scanning calorimeter using standard (10 °C/min) heating and cooling rates. Thermal programs for non-isothermal (left) and isothermal (right) crystallization are shown in Scheme 2. Multiple endothermic events were separated by fitting with several Gaussian peaks. The ∆Hm (melting enthalpy) and Tmax (maximum temperature) were determined as the area and maximum of the respective Gaussian peak. The onset temperature (Tonset) was defined as the point ∆Hm intersection between the tangent line at the half-width position and the baseline.
The duration of isothermal crystallization was 10 min for Tc. The degree of crystallinity (χc) was calculated from the total melting enthalpy of PBA (Δm = 95 J/g) as reported in [33]:
χ c = Δ H m Δ H ° m
The structure and phase composition of TPUs at different temperatures were analyzed by the SAXS/WAXS technique at the BM26 beamline of the European Synchrotron Radiation Facility (ESRF) in Grenoble (France) using a wavelength of 1.03 Å. The X-ray scattering patterns were captured with 10-s exposures, utilizing two-dimensional Dectris Pilatus 1 M and 300 k detectors for SAXS and WAXS, respectively. Temperature control was provided by a Linkam DSC600 heating stage. The modulus of the scattering vector s was calibrated using several diffraction orders of silver behenate. The 1D reduction of two-dimensional scattering patterns, background subtraction, and curve fitting were carried out with home-built software. The crystallinity index (χWAXS) was calculated as follows:
χ W A X S = I c r s 2 d s ( I c r + I a m o r ) s 2 d s
where Icr and Iamor are the total intensities of all crystalline reflections and the amorphous halo on 1D-reduced curves. The maximum of the SAXS peaks was calculated on the Lorentz-corrected curves after performing background subtraction.
The chemical structure and hydrogen bonding were investigated by Fourier transform infrared (FTIR) spectroscopy with a Bruker Alpha (Bruker Daltonics GmbH & Co. KG, Bremen, Germany) spectrometer using a multiple attenuated total reflection (ATR) module under the following conditions: a measurement range of 4000–500 cm−1, a measurement step of 2 cm−1, and a number of scans per spectrum of 56.

3. Results

3.1. Thermal Analysis

The thermal stability of the synthesized TPUs was studied by the TGA technique (Figure S1), and the corresponding degradation temperatures are shown in Table 2. The initial degradation stage was detected in the range of 287–297 °C with 5% weight loss, which corresponded to the initial breakdown of urethane and ester bonds. The main degradation occurred in three stages, 358–361 °C (T1) 395–495 °C (T2), and 450–470 °C (T3), which may be associated with the degradation of C-C bonds in the bulky rigid blocks.
The thermal transitions and crystal phase content were analyzed by DSC. In the first heating ramp to 80 °C, the native TPU samples (stored after synthesis for 2 months at RT) were brought above the melting temperature of SS (Table 3, Figure 1a). All the native samples exhibited similar endothermic melting peaks, with their onset approximately at 40–41 °C, indicating the formation of a thermodynamically stable crystal phase of PBA. However, the chemical composition of the macrodiols influenced the total degree of crystallinity. The inclusion of MDI and HMDI in SS raised the crystallinity index (χ) from 14% to 21% and 27%, respectively, due to the formation of a denser physical network of hydrogen bonds (Table 3).
During the first cooling from 80 °C to −45 °C, the DSC curves of all samples exhibited exothermic peaks corresponding to the SS crystallization with an onset at 10.6–12.7 °C (Table 3, Figure 1a). Interestingly, TPU(PBA) and TPU(PBA-HMDI) demonstrated a significant increase in the degree of crystallinity following recrystallization, likely due to enhanced phase separation at Tm. In contrast, the non-isothermal crystallization of TPU(PBA-MDI) resulted in a decrease in χDSC from 21 to 15%, revealing the lower crystallization rate of this sample across all temperature ranges.
The DSC traces of the second heating to 180 °C reveal the melting of HS in addition to endothermic peaks related to the melting of SS (Table 3, Figure 1b). For TPU(PBA) and TPU(PBA-MDI), the broad endothermic peak with Tonset = 84 °C, Tpeak = 93 °C, and ΔH = −8 J/g corresponds to the melting of the MDI-rich domains. For TPU(PBA-HMDI), the melting peak of the HDMI domain is narrower and more intense (Tonset = 125 °C, Tpeak = 148 °C, and ΔH = −15 J/g), indicating the formation of regular crystalline regions of HS. The second cooling from 180 °C displays the crystallization of HS only for TPU(PBA-HMDI). As a result, the HMDI crystal phase fully recovers following melting. Consequently, the crystallization of the soft segments (SS) occurs within the same geometrical confinements of the physical network established by the hard segments (HS), as it does after cooling from 80 °C, as indicated in Table 3. In contrast, the crystallization temperature and final degree of crystallinity of TPU(PBA) and TPU(PBA-MDI) significantly decrease during cooling from Tm = 180 °C. This corresponds to the situation of the soft confinement of amorphous HS domains or to partial mixing of HS and SS at 180 °C (Table 3, Figure 1b).
The details of the PBA crystal phase formation were explored during isothermal DSC experiments (Figure 1c,d). After heating to Tm = 80 °C and subsequent crystallization at Tc < 10 °C, all the samples demonstrate PBA melting peaks similar to those detected in the non-isothermal crystallization experiments (Figure 1c). The increase in Tm to 180 °C results in a decrease in the crystallinity of TPU(PBA) and TPU(PBA-MDI) due to the disturbed phase separation discussed above. In turn, the DSC curve of TPU(PBA-HMDI) demonstrates a double melting peak that indicates the formation of a mixture of the α- and β-polymorphs of PBA during the crystallization of the TPU at Tc ≤ 10 °C. The interpretation of the multiple melting events correlates with the polymorphic behavior of PBA [34]. The authors showed that the defect crystals of the monoclinic α-modification melted prior to the orthorhombic β-PBA. However, both phases can transform into the α-PBA with thicker crystals that melt at a higher temperature. The β-to-α-phase transformation is dependent on the heating rate; however, at a rate of 10 °C/min, this transformation was not detected, as noted in reference [35].
For TPU(PBA) and TPU(PBA-MDI) crystallized at Tc = 10 °C, the critical role is played by the highest previous annealing temperature (Figure 1c). After annealing at 80 °C, both samples show relatively high indices of crystallinity χDSC, whereas the formation of the crystalline phase was not detected after cooling from 180 °C. A more complex behavior was observed after the crystallization of SS at Tc = 25 °C (Figure 1c). The crystallization rate of TPU(PBA) is very low and subsequent heating curves do not show any melting peaks of PBA. After annealing at 80 °C, TPU(PBA-MDI) and TPU(PBA-HMDI) demonstrate similar double melting peaks corresponding to the formation of two PBA polymorphs. In addition, a small endothermic peak with an onset slightly higher than the previous isothermal crystallization temperature is observed. It is likely to be related to the melting of small metastable crystals and cannot be identified as a particular PBA polymorph [36].
After annealing at 180 °C and isothermal crystallization at 25 °C, the melting behavior of TPU(PBA-HMDI) is similar to that discussed above. However, for TPU(PBA-MDI), the SS crystal phase is not formed since the physical network of HS does not recover during cooling and subsequent annealing at 25 °C. Thus, TPU(PBA-MDI) demonstrates the most pronounced dependence of the crystallization kinetics on the previous highest melt temperature. The polymorphic behavior of SS as a function of the composition and geometrical confinement was further studied by in-situ temperature-resolved SAXS/WAXS.

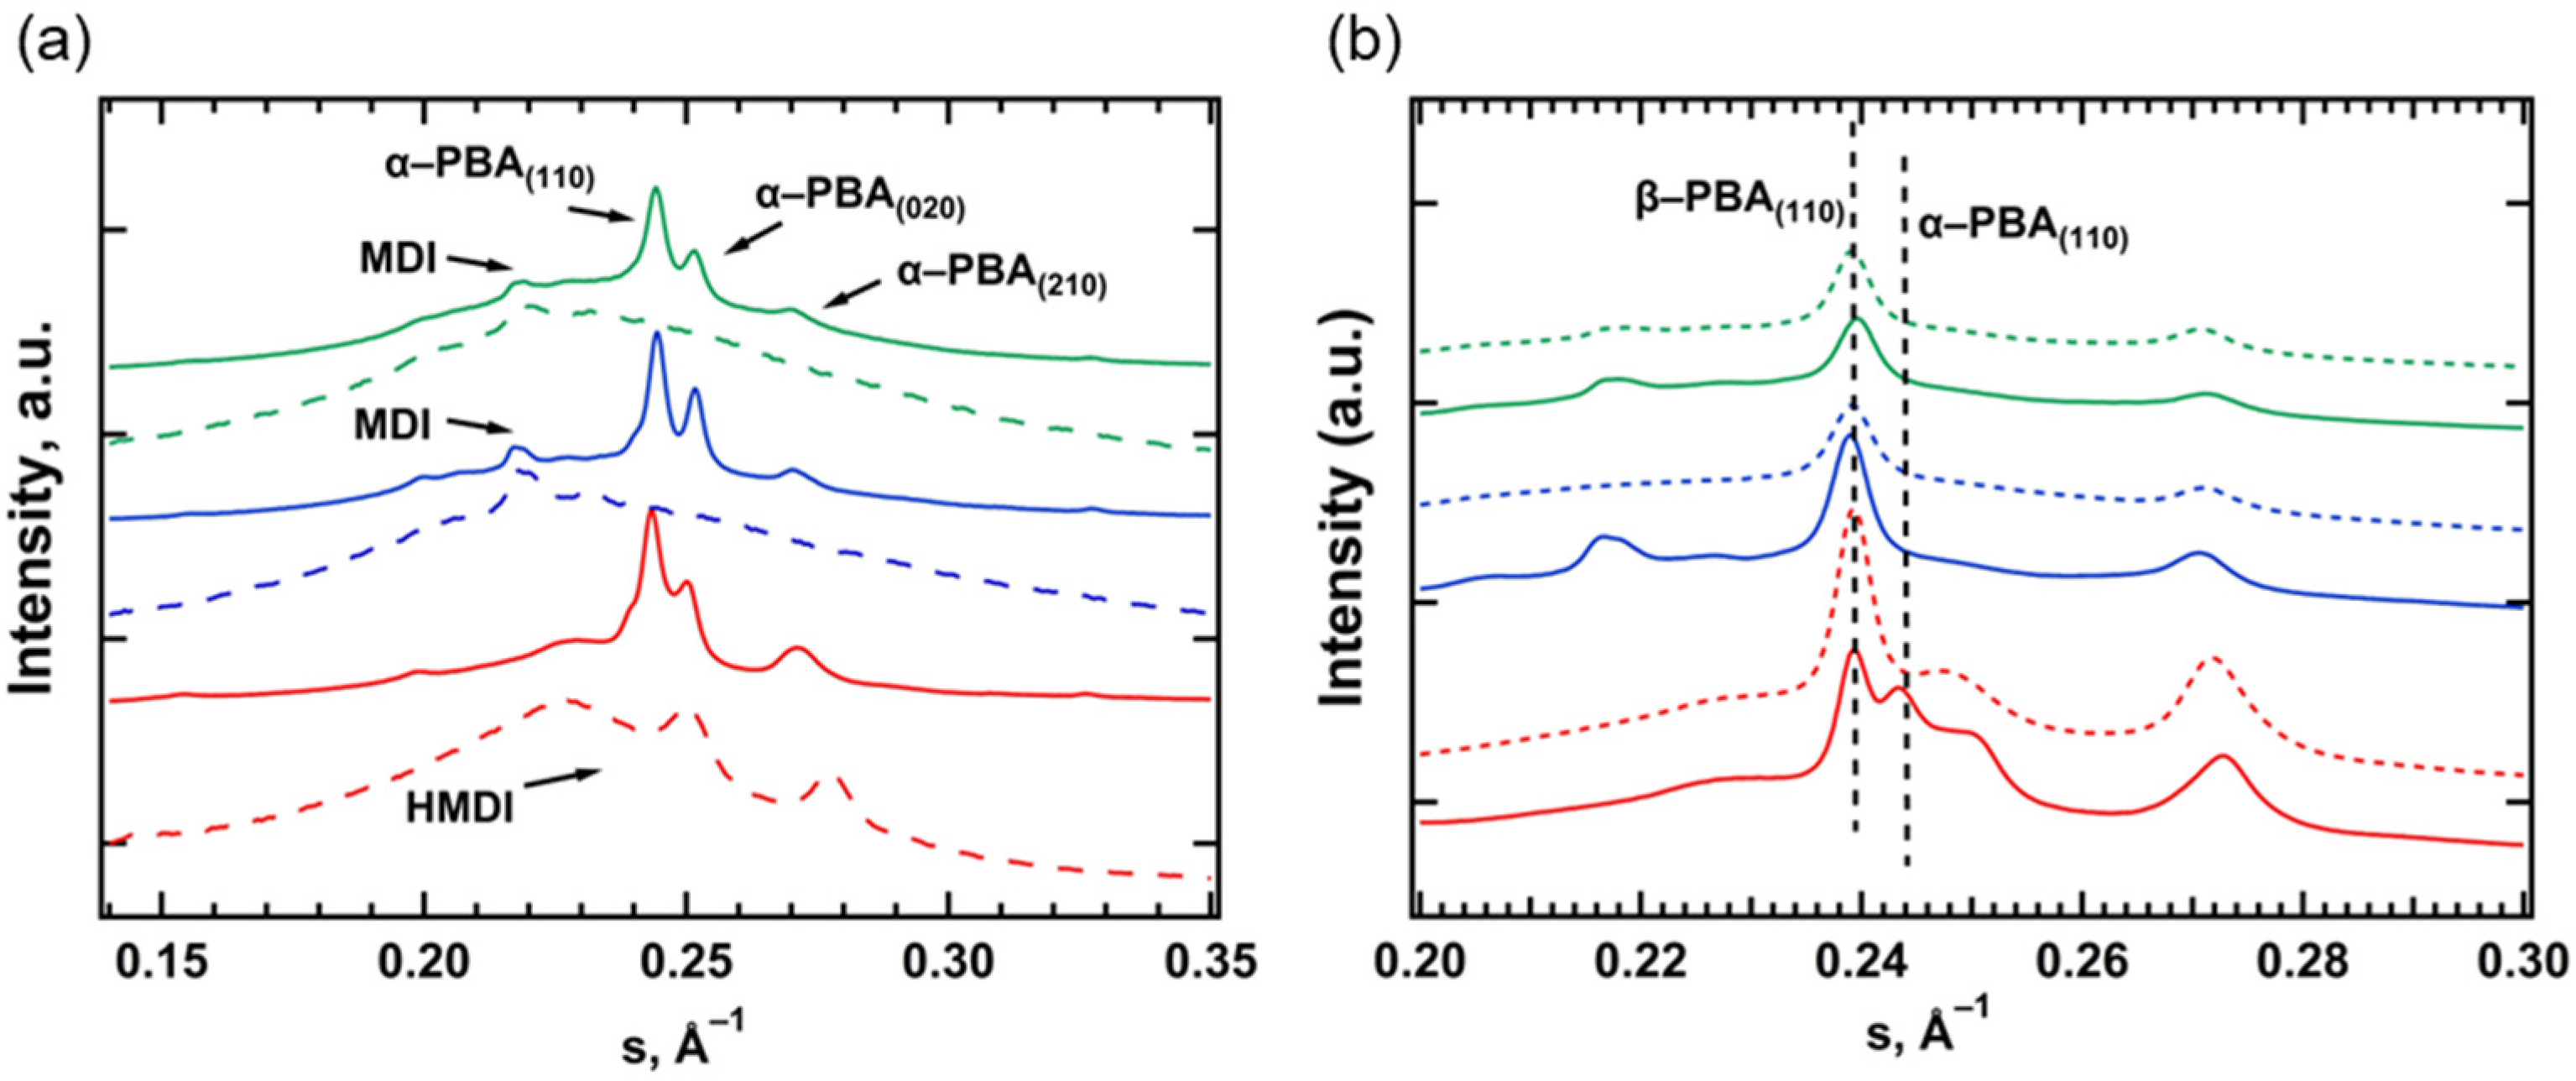
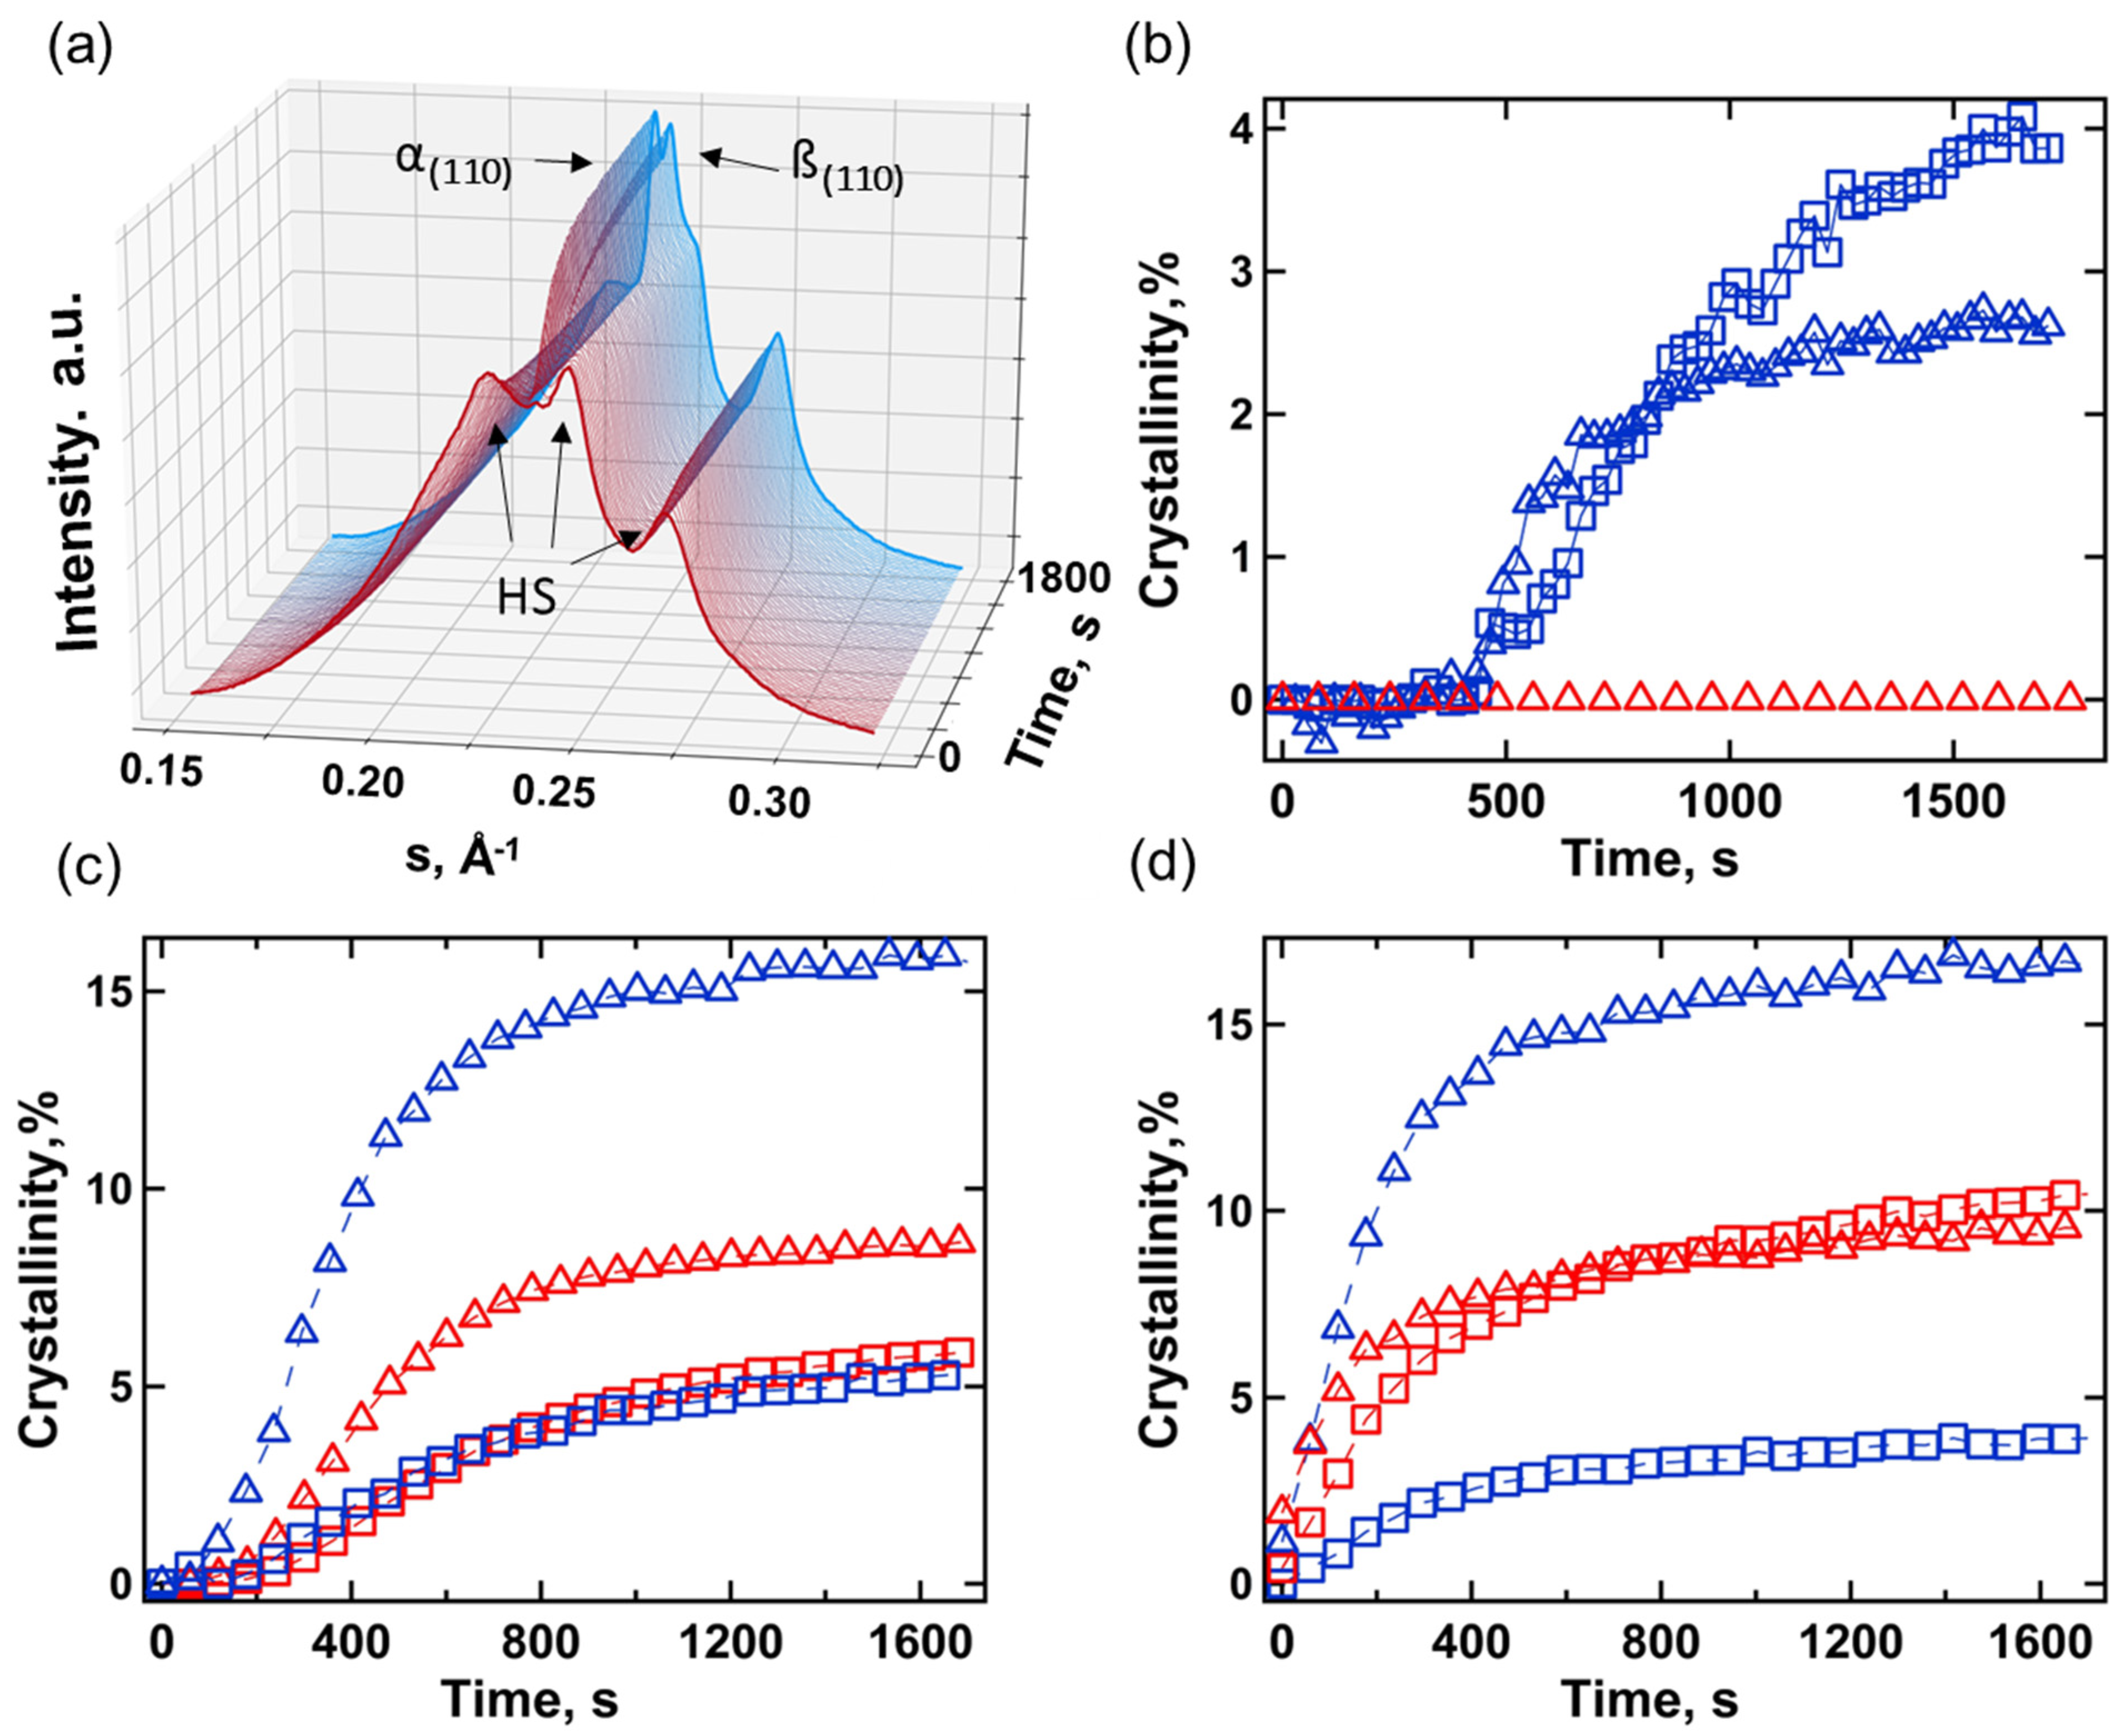
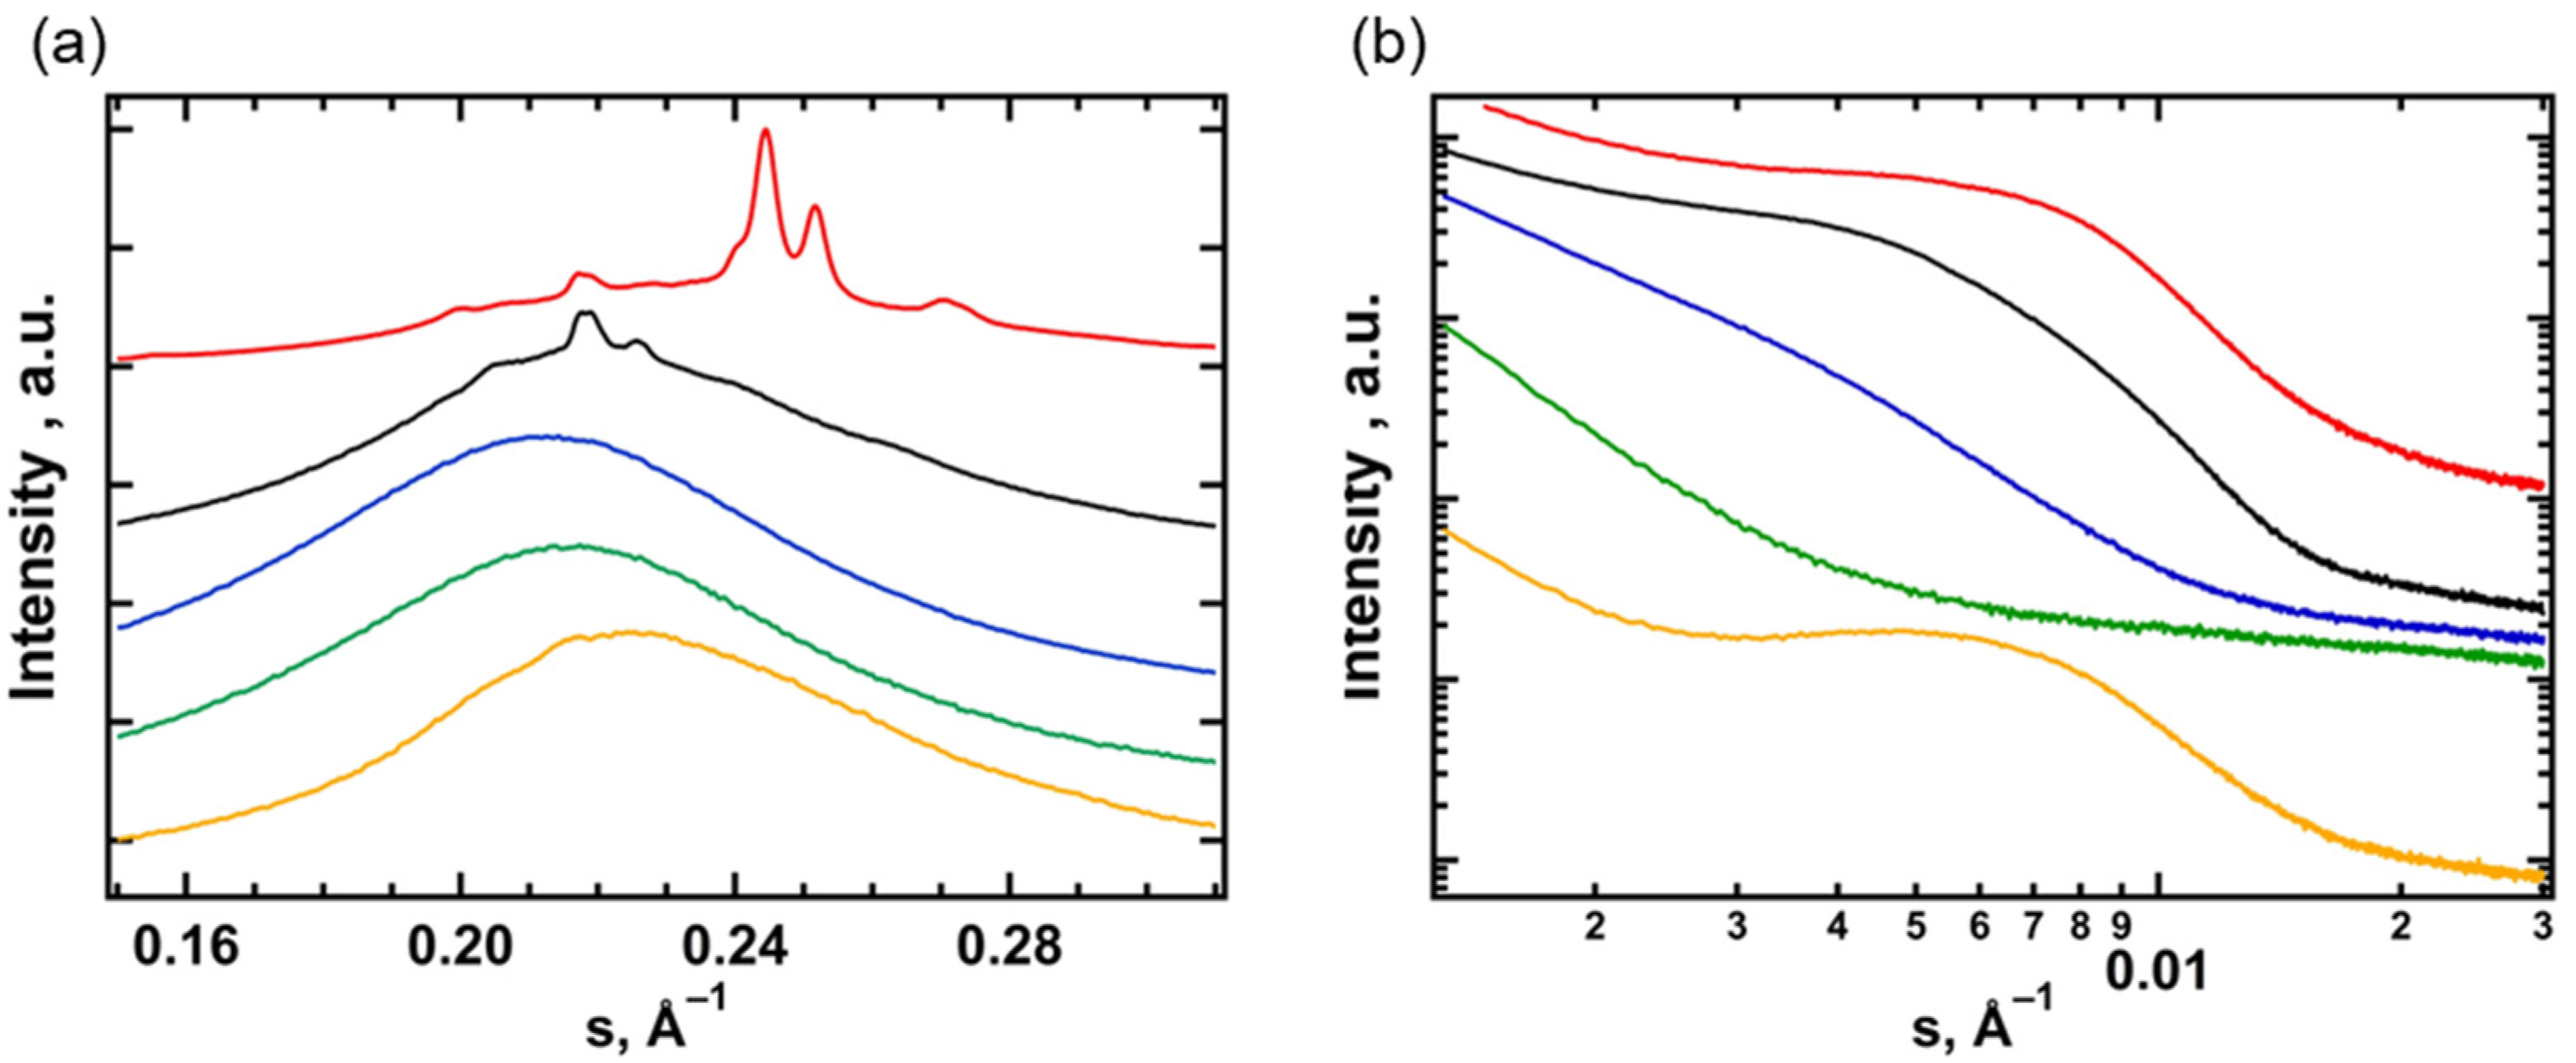
3.2. Small- and Wide-Angle X-ray Scattering

After long-term storage at RT, the WAXS diffractograms of all TPU samples exhibit the stable α-form of PBA and several additional reflections (Figure 2a). The latter are preserved after heating above the melting point of PBA and attributed to the crystal phase of HS (Figure 2a). One can see that for TPU(PBA-HMDI), the crystals are formed by the HMDI blocks, while TPU(PBA) and TPU(PBA-MDI) exhibit MDI crystals [37,38]. The WAXS pattern of the HS based on HMDI consists of three peaks with d-spacings of 3.48, 3.97, 4.50 Å that point to the formation of two crystalline polymorphs observed in the DSC cooling curves. After the crystallization at RT of the samples that were pre-heated to 80 and 180 °C, one can see the predominant formation of the metastable β-phase (Figure 2b). Interestingly, for TPU(PBA-HMDI), the pre-melting of the HS crystal phase at 180 °C shifts the α/β ratio to the more stable α-form of PBA due to the slower crystallization rate at RT.
The analysis of the crystallization kinetics of the TPUs at RT was performed with in-situ SAXS/WAXS by employing intense synchrotron radiation. The amount of the orthorhombic and monoclinic phases of PBA was estimated from the relative intensity of the reflections at s = 0.240 and 0.244 Å−1, respectively (Figure 3a). One can see that the growth rate and relative fraction of each polymorph depend on the composition of HS and the previous highest melt temperature (Figure 3b–d). The final crystallinity index and phase composition are shown in Table 4.
TPU(PBA) shows the lowest crystallization rates. Thus, upon 30 min crystallization at RT after cooling from 80 °C, the WAXS crystallinity index (χWAXS) reaches only 6.5% with α/β = 60/40. If, before the experiment, the sample was brought to 180 °C, the crystallization of SS did not occur even after 1 h (Figure 3b). After annealing at 80 °C, the TPU(PBA-HMDI) sample based on highly crystalline HMDI crystallized faster at RT, demonstrating a high fraction of β-PBA (Figure 3c). Upon melting of the HDMI block, the α-PBA forms more rapidly, but the total degree of crystallinity stays almost the same (Figure 3d). It is interesting to note that HMDI crystallizes during cooling in the range of 120–40 °C and its highest crystallinity is approximately 7%. For TPU(PBA-MDI), the MDI segment surrounded by PBA oligomers also crystallizes during cooling from 180 °C, resulting in a twofold decrease in the β-PBA fraction compared to cooling from 80 °C. In contrast, the crystallization kinetics of α-PBA are independent of the melt temperature, indicating that the nuclei of β-PBA are mainly formed from the phase-separated SS domains, whereas the α-nuclei are developed via β-to-α transition during crystallization. To understand the role of the phase separation of the blocks and geometrical confinement in the crystallization of PBA, the SAXS patterns were analyzed.
Based on the SAXS peak positions, the supramolecular structure can be described with three characteristic distances (Figure S2): the period between the semi-crystalline SS and HS domains (L1), the period between semicrystalline HS and molten SS (L2), and the period between the phase-separated amorphous HS and SS domains (L3). The values of the small-angle maxima and their attributions (Figure S2) are given in Table 5.
For all samples, heating to 80 °C is paralleled by an increase in the long period by approximately 3 nm, attributable to the L1–L2 transition. This process is reversible upon cooling to RT. The TPU samples heated to 180 °C demonstrate a phase-separated morphology with large periodicity L3, reaching up to 26.3 nm (Table 5). Upon returning to RT, TPU(PBA-HMDI) displays the formation of HMDI crystals with L2 = 15.2 nm immediately after cooling, followed by the crystallization of soft segments (SS) and the emergence of a peak L1 = 14.3 nm. In the case of TPU(PBA), the SS does not crystallize after cooling, with its SAXS maximum located at 20.1 nm, possibly representing the superposition of L2 and L3—a phase-separated morphology with the limited crystallization of hard segments (HS). The situation is similar for TPU(PBA-MDI) immediately after cooling with the presence of the L2 and L3 distances. However, after 30 min at RT, a shift in the SAXS maximum to wider angles is indicative of PBA crystallization.
According to WAXS and SAXS, heating slightly above 230 °C, which is below the onset of decomposition, results in the isotropization of TPU with the formation of a mixed state of HS and SS. The cooling of TPU(PBA-HMDI) to RT demonstrates behavior similar to cooling from the phase-separated state at 180 °C, with the subsequent emergence of the L2 and L1 distances (Figure 4). In contrast, for TPU(PBA) and TPU(PBA-MDI) samples, the crystal phases of SS and HS do not recover after cooling and remaining for 30 min at RT, with the gradual development of the phase-separated morphology (L3 is 11 and 15 nm, respectively). After one week at RT, TPU(PBA) still demonstrates only an amorphous phase-separated state, whereas the PBA block of TPU(PBA-MDI) slowly crystallizes up to χWAXS = 4%, with the absence of HS crystals (Figure S3).
The complex interplay between the formation of a phase-separated morphology and the crystallization of both types of segments can be illustrated via the example of the PBA-MDI sample (Figure 5). At RT, both segments are in the crystalline state (Figure 5a, red curve). On heating the sample to 80 °C, one observes the melting of the SS accompanied by a shift in the SAXS peak position from 12.3 to 15.6 nm. This evolution corresponds to a change in the microstructure from the HS crystal/SS crystal state (Figure 4a) to the HS crystal/SS liquid state (Figure 4b), with a corresponding change in the characteristic SAXS distance from L1 to L2 (Figure 5b, black curve). At 180 °C, when the HS fully melts (Figure 5a,b, blue curves), the peak’s intensity significantly decreases, while the characteristic SAXS distance increases to 25.2 nm. This situation corresponds to a structure with SS-liquid/HS-liquid phase separation (Figure 4c). A further increase in temperature to 230 °C leads to the isotropization of the melt, with the disappearance of the SAXS signal pertinent to the phase-separated morphology (Figure 5b, blue curve). Upon cooling back to RT, the intensity of the SAXS signal increases again, indicating the recovery of the phase-separated morphology (L3 = 15 nm). Notably, this occurs without any indications of crystallization (Figure 5a,b, orange curves). It is noteworthy that crystallization was not detected for both SS and HS even after remaining for 30 min at RT.
These observations lead to the conclusion that the phase separation of SS and HS plays a critical role in the crystallization of the polyester, a finding corroborated by the Fourier transform infrared (FTIR) spectroscopy measurements.

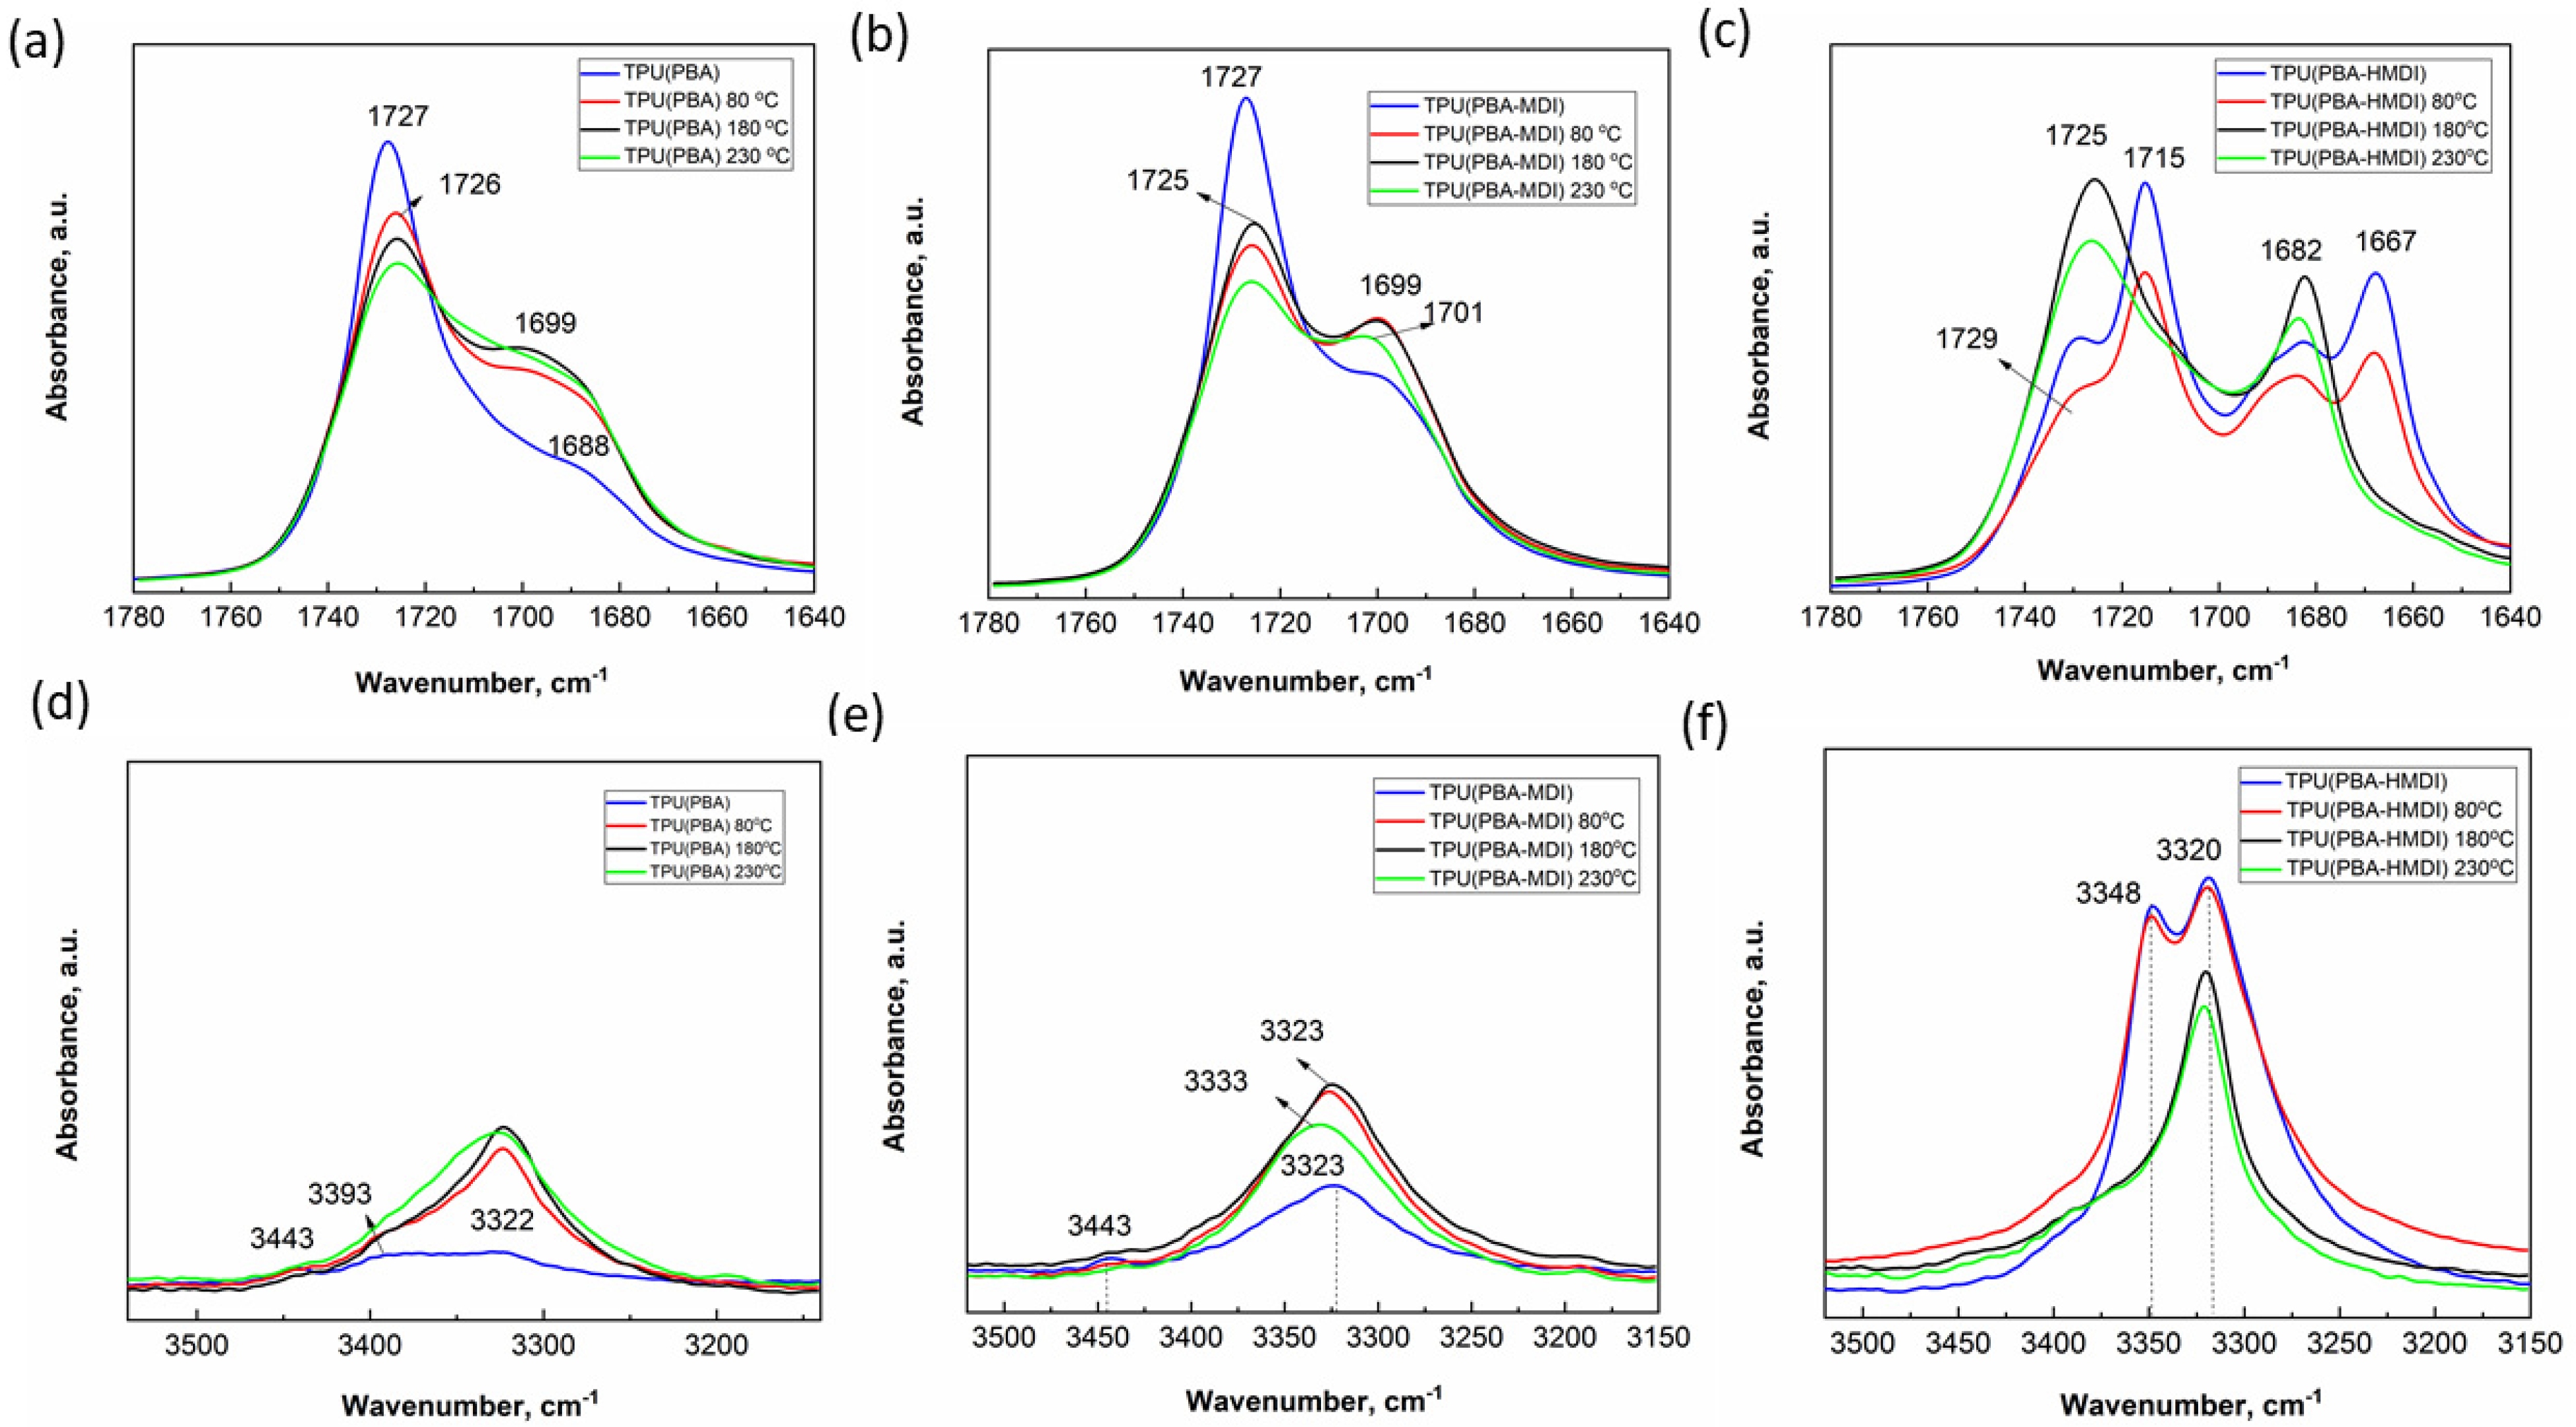
3.3. Study of Morphology of TPUs with FTIR
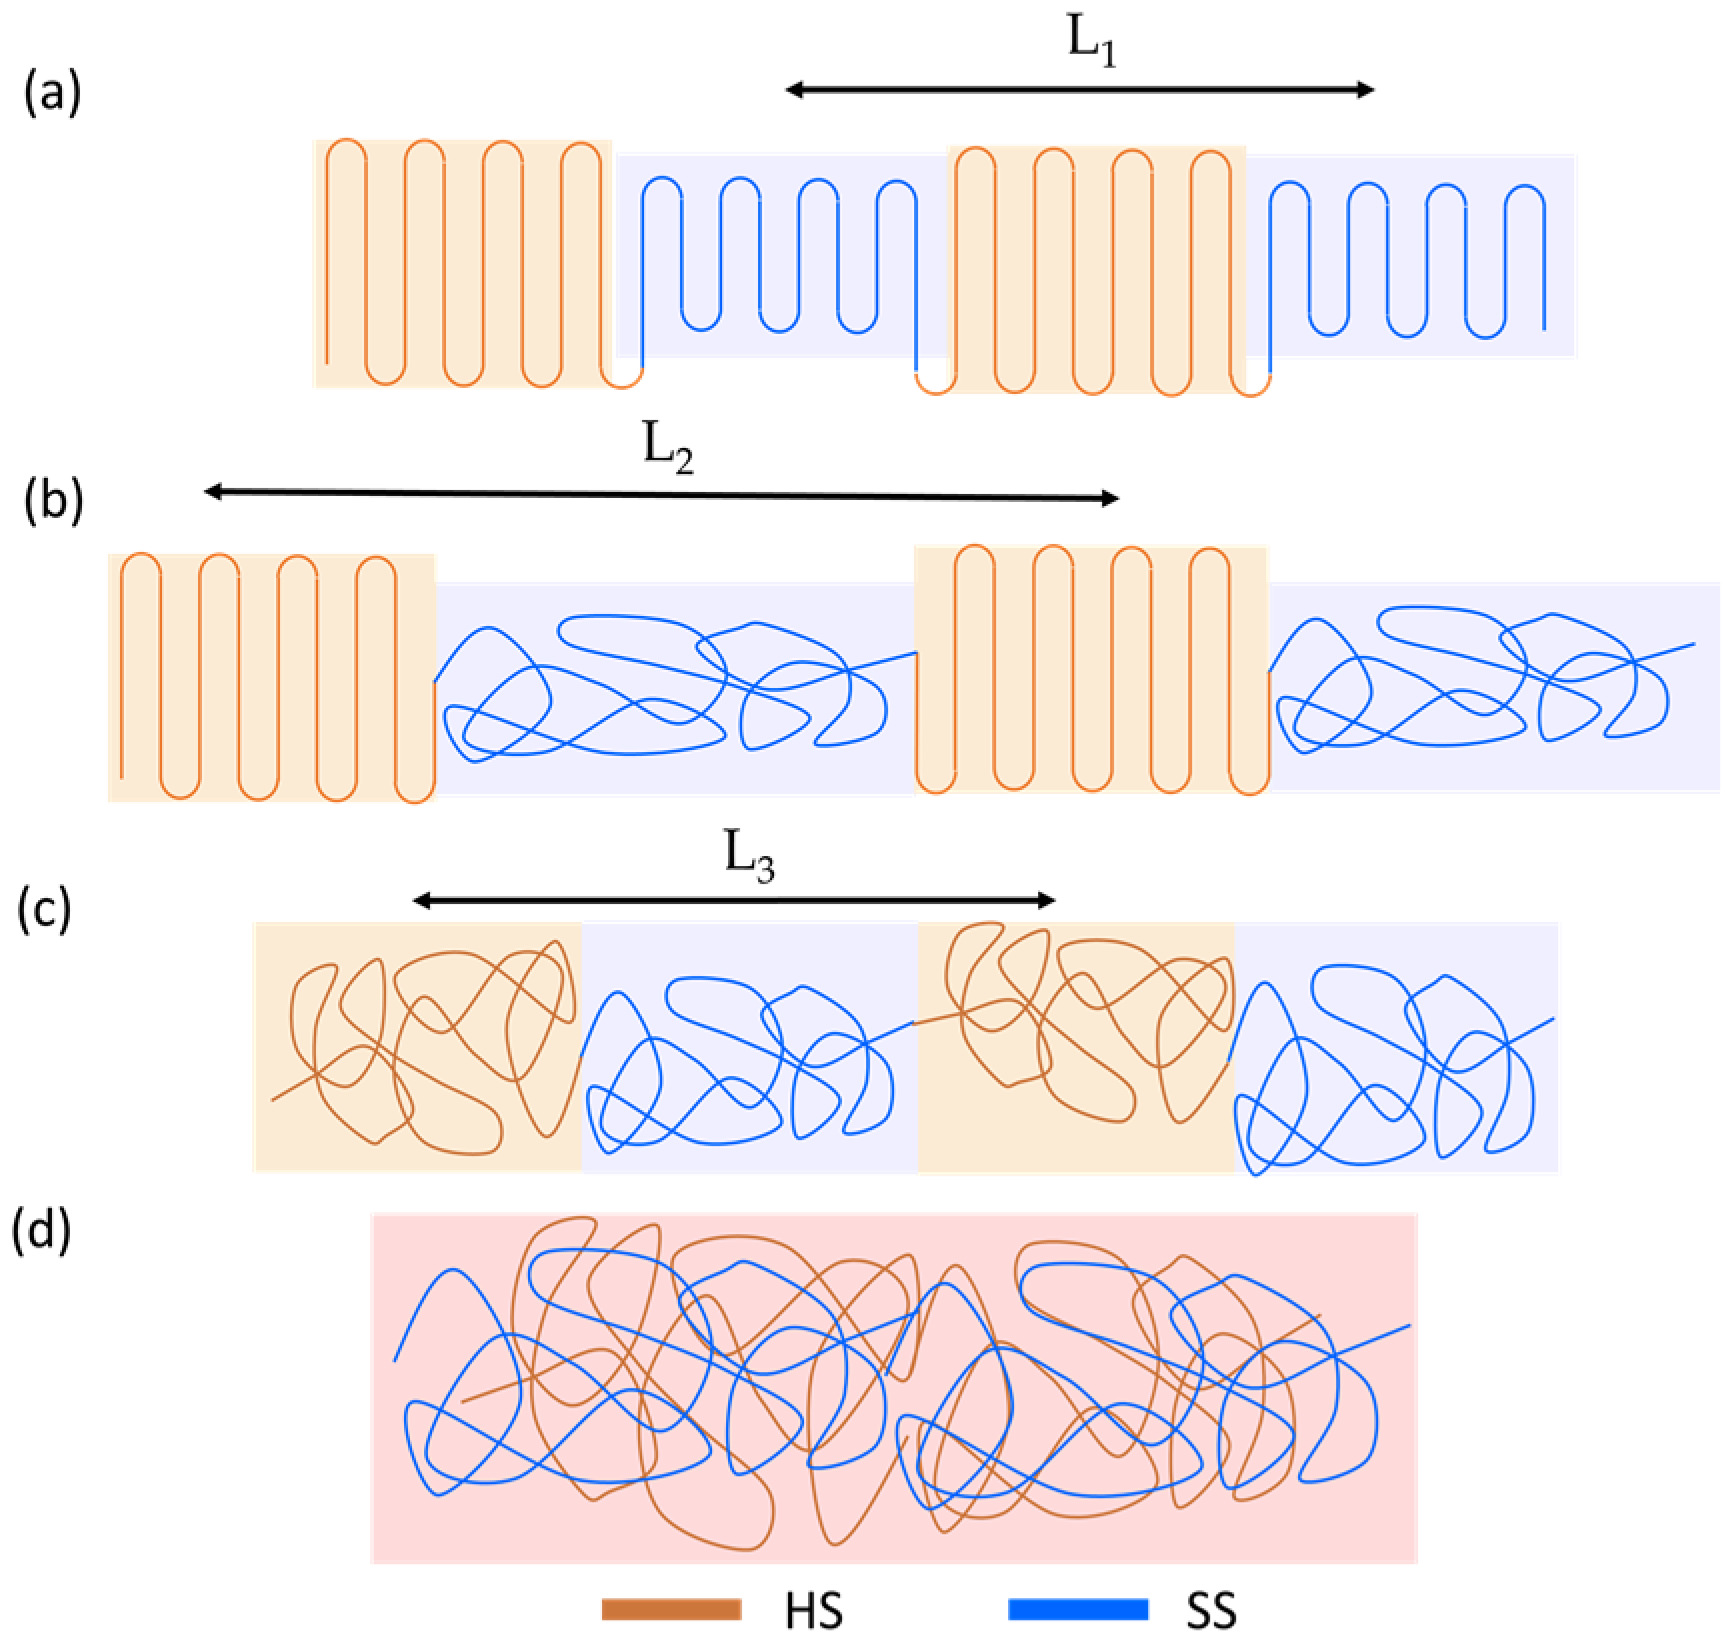
The analysis of the FTIR spectra of native samples, as well as those recrystallized after 80, 180, and 230 °C, reveals a specific phase-separated morphology. The differences are observed in the region of the absorption bands of amide (3500–3200 cm−1) and carbonyl (1750–1650 cm−1) groups (Figure 6).
For the native TPU(PBA) with the PBA oligomer as SS, the FTIR spectra display low-intensity bands of amide groups at 3393 and 3322 cm−1, along with bands of carbonyl groups peaking at 1727 cm−1 and a shoulder spanning the range of 1700–1680 cm−1, as seen in Figure 6a,d (blue curve). The presence of a minor low-intensity peak at 3443 cm−1, corresponding to free amide groups of the urethane bond, as well as low-intensity peaks at 3322 and 3393 cm−1 and a shoulder in the 1700–1680 cm−1 region, suggests that most amide groups are in a weakly ordered state. The coexistence of these bands implies the relatively weak phase separation of blocks in amorphous regions. We hypothesize that this leads to increased polymer chain mobility and lower crystallinity compared to other samples. The recrystallization of the samples following annealing at 80 and 180 °C leads to an increase in H-bonding density. This change is manifested by the enhanced intensity of the bands corresponding to amide groups at 3500–3200 cm−1 and the band of H-bonded carbonyl groups of HS at 1700–1682 cm−1, as depicted in Figure 6a,d (red and black curves). However, a reduction in the peak at 1726 cm−1 suggests a decrease in the number of dipole–dipole interactions in the crystal phase of PBA, likely due to slower crystallization (Figure 6a, black curves).
The incorporation of MDI into the PBA polymer chain (PBA-MDI) improves the phase-separated structure. This is evidenced by an increase in the shoulder of the H-bonded urethane segments at 1699 cm−1 for the native sample, as shown in Figure 6b (blue curve). This is further confirmed by the increase in the peak of hydrogen-bonded amide groups (3322 cm−1). However, the peak at 3443 cm−1 is still observed (Figure 6e, black curve). Analogous to TPU(PBA), heating to temperatures of 80 and 180 °C improves the phase separation in TPU(PBA-MDI), as displayed in Figure 6b,e (red and black curves).
Distinct spectral patterns are observed for the TPU(PBA-HMDI) sample, which is based on a soft block of PBA with an aliphatic HMDI linker, as shown in Figure 6c,f. The native sample’s spectrum exhibits pronounced peaks of C=O groups in the range of 1650–1683 cm−1 and N-H groups at 3322 and 3393 cm−1, suggesting that HMDI forms an ordered network that effectively immobilizes the PBA chains (Figure 6c,f, blue curves). The increased number of peaks is associated with HMDI surrounded by PBA.
Crystallization following heating to 80 °C slightly disturbs the supramolecular structure (Figure 6c,f, red curves). However, heating to 180 °C destroys the geometrical confinement of HS domains, significantly reducing the crystallization rate of PBA. The spectra of the sample after cooling to RT are similar to those of TPU(PBA) and TPU(PBA-MDI). However, there is a higher fraction of H-bonded carbonyl and urethane groups characteristic of the phase-separated morphology. This is attributed to the enhanced mobility of aliphatic diisocyanate (Figure 6c,f, black curves). The analysis of the FTIR spectra reveals that integrating diisocyanate linkers into the polymer chain of the soft block increases the density of the hydrogen-bonding networks of urethane groups and leads to improved phase separation between the urethane groups of the soft and hard blocks, especially for samples where the soft block possesses an aliphatic nature.
The FTIR spectra of TPUs annealed at 230 °C corroborate the earlier TGA findings, demonstrating the chemical stability of the samples at this temperature (Figure S4). A certain decrease in the intensity of the bands characterizing phase separation was found for all samples (Figure 6a–c, green curves). The second derivatives of the FTIR spectra in the region 1750–1650 cm−1 reveal the presence of a large fraction of a mixed phase of SS and HS (Figure S5). The mixed phase could be responsible for the previously discussed decrease in the crystallization rate for TPU(PBA) and TPU(PBA-MDI). In general, the FTIR data are consistent with results obtained from DSC and WAXS/SAXS analyses. The chemical composition of the TPUs and their thermal history enable the regulation of the efficiency of phase separation and crystallization kinetics.

4. Discussion

Thermoplastic polyurethanes with crystallizable hard and soft segments, based on aliphatic 1,6-hexamethylene diisocyanate and aromatic 4,4′-diphenylmethane diisocyanate, and soft segments containing oligomer poly(butylene adipate) diol and its macrodiols of an aliphatic and aromatic nature, were synthesized and characterized. The introduction of a diisocyanate segment between PBA blocks was observed to promote the crystallization of HS, which, in turn, strongly affected the crystallization of SS. Using a range of characterization techniques, including small- and wide-angle X-ray scattering, differential scanning calorimetry, thermogravimetric analysis, and FTIR spectroscopy, the study addressed the role of HS crystallites in geometrical confinement, influencing the efficiency of phase separation, the crystallization kinetics, and the final phase composition of TPUs. The thermal analysis identified three characteristic temperatures responsible for the ordering of the studied TPUs: the melting temperatures of the soft and hard segments and the isotropization temperature. Accordingly, by heating to specific temperatures, one can stimulate the mobility of different segments and/or promote their crystallization. This enables the crystallization of PBA from isotropic, phase-separated, or geometrically confined states, which is crucial in determining the total crystallinity and polymorphic composition of the material.
TPU(PBA-HMDI) with HMDI linkers showed the highest crystallization rate and degree of crystallinity of SS, attributed to well-defined phase-separated domains stabilized by hydrogen bonding between linear urethane segments. The strong incompatibility between blocks enables the rapid recovery of the phase-separated morphology following the melting of both SS and HS, and even after isotropization. This leads to the fast crystallization of both HS and SS upon cooling, with the crystallization of PBA favoring a large fraction of the metastable β-form. TPU(PBA-MDI) containing MDI bonded with PBA demonstrates lower crystallinity because of the lower mobility of the aromatic diisocyanate. The slower crystallization of HS upon cooling does not provide the formation of tight geometrical confinement, thereby reducing the rate of subsequent crystallization of PBA and favoring the formation of the more thermodynamically stable α-phase. TPU(PBA), which consists solely of a PBA oligomer in its SS, demonstrates the slow crystallization of the polyester. The total crystallinity of this composition increases over several months, predominantly forming the α-modification. The melting of HS domains leads to a loss of phase separation and a consequent decrease in the crystallization rate of PBA. Isotropization at 230 °C totally suppresses the crystallization of the sample due to the low mobility of the segments in the mixed phase.
In situ studies of the crystallization kinetics have shown that TPU(PBA) exhibits the lowest rate of crystallization, yet it leads to the formation of a significant fraction of the stable α-polymorph. When the sample is heated above the melting temperature of the hard segment, the crystallization of PBA is completely suppressed. The crystallization rate of TPU(PBA-HMDI) is the highest and remains unaffected by the melt temperature. Owing to the rapid crystallization of the HMDI block upon cooling, this sample exhibits reduced sensitivity to the melting temperature and predominantly forms the metastable β-polymorph at room temperature. For TPU(PBA-MDI), the influence of geometrical confinement is most pronounced. In the presence of crystalline domains of hard segments, the soft segment demonstrates a high crystallization rate at room temperature, primarily leading to the formation of the β-phase of PBA. However, following the melting of MDI crystals at 180 °C, there is a significant decrease in the crystallization rate of PBA, resulting in the formation of the more stable α-phase of PBA.
The examination of the FTIR spectra reveals that the introduction of diisocyanate linkers into the soft segment enhances the density of the hydrogen-bonding networks of urethane groups. This leads to more pronounced phase separation between the urethane groups of the soft and hard blocks, especially in samples with an aliphatic soft block.

5. Conclusions

Thermoplastic polyurethanes synthesized from aliphatic 1,6-hexamethylene diisocyanate, aromatic 4,4′-diphenylmethane diisocyanate, and soft segments containing oligomer poly(butylene adipate) diol, along with its macrodiols of an aliphatic and aromatic nature, have been effectively synthesized and characterized. The use of a macrodiol containing two or three blocks facilitates the crystallization of both the soft and hard segments, offering an additional means to control the microstructure and characteristics of smart materials. Notably, the melting of the soft segment leads to the transition of the material into an elastic state. Conversely, heating above the melting point of the hard segment induces a viscous state, crucial for the fabrication and recycling of polymeric materials.
Overall, our research highlights the importance of in situ analysis at each stage of ordering in the design of thermoplastic polyurethanes with specific thermal and relaxation properties. These insights provide a more thorough understanding of the behavior of multi-block semi-crystalline TPUs with melting points near the human body temperature, positioning them as promising candidates for the development of innovative medical materials.

Supplementary Materials

The following supporting information can be downloaded at: https://www.mdpi.com/article/10.3390/cryst13121662/s1, Table S1: Stoichiometry of the designed TPU; Scheme S1: The reaction scheme of the designed TPUs; Figure S1: TGA curves for the TPU samples measured at a rate of 10 °C/min in nitrogen atmosphere; Figure S2: SAXS curves of TPU(PBA-HMDI) (a,d), TPU(PBA) (b,e), TPU(PBA-MDI) (c,f): initial (red), after SS melting (black), at maximum temperature (blue), immediately after cooling (green), and after isothermal crystallization (yellow): Tm = 80 °C (a–c) and Tm = 180 °C (d–f); Figure S3: WAXS (a) and SAXS (b) curves for TPUs after cooling from 230 °C and crystallization for 1 week at RT: TPU(PBA) (green), TPU(PBA-MDI) (blue), TPU(PBA-HMDI) (red); Figure S4: IR spectra for the native samples (black curve) and samples crystallized after heating to 230 °C (color curves); Figure S5: The second derivative IR spectra for TPU(PBA) (a), TPU(PBA-MDI) (b), and TPU(PBA-HMDI) (c) native samples (blue lines) and crystallized after 80 °C (red lines), 180 °C (black lines), and 230 °C (green lines).

Author Contributions

Conceptualization, M.A.G. and A.F.A.; data curation, D.A.I. and M.A.G.; investigation, M.A.G. and A.F.A.; formal analysis—FTIR, M.A.G.; formal analysis—WAXS and DSC, A.F.A.; methodology, M.A.G.; supervision, D.V.A. and D.A.I.; writing—original draft preparation, A.F.A. and M.A.G.; writing—review and editing, D.V.A. and D.A.I. All authors have read and agreed to the published version of the manuscript.

Funding

This research was funded by state support with the K1-2022-035 project in the framework of the strategic academic leadership program “Priority 2030”.

Data Availability Statement

The data presented in this study are available in the article.

Acknowledgments

The authors acknowledge the staff of the BM26 beamline at the European Synchrotron Radiation Facility (ESRF) in Grenoble (France) for their exceptional technical support.

Conflicts of Interest

The authors declare no conflict of interest.

References

  1. Lendlein, A.; Langer, R. Biodegradable, elastic shape-memory polymers for potential biomedical applications. Science 2002, 296, 1673–1676. [Google Scholar] [CrossRef] [PubMed]
  2. Takahashi, T.; Hayashi, N.; Hayashi, S. Structure and properties of shape-memory polyurethane block copolymers. J. Appl. Polym. Sci. 1996, 60, 1061–1069. [Google Scholar] [CrossRef]
  3. Wang, Y.; Cheng, Z.; Liu, Z.; Kang, H.; Liu, Y. Cellulose nanofibers/polyurethane shape memory composites with fast water-responsivity. J. Mater. Chem. B 2018, 6, 1668–1677. [Google Scholar] [CrossRef] [PubMed]
  4. Ji, S.; Fan, F.; Sun, C.; Yu, Y.; Xu, H. Visible light-induced plasticity of shape memory polymers. ACS Appl. Mater. Interfaces 2017, 9, 33169–33175. [Google Scholar] [CrossRef] [PubMed]
  5. Lendlein, A.; Jiang, H.; Junger, O.; Langer, R. Light-induced shape-memory polymers. Nature 2005, 434, 879–882. [Google Scholar] [CrossRef] [PubMed]
  6. Song, Q.; Chen, H.; Zhou, S.; Zhao, K.; Wang, B.; Hu, P. Thermo- and pH-sensitive shape memory polyurethane containing carboxyl groups. Polym. Chem. 2016, 7, 1739–1746. [Google Scholar] [CrossRef]
  7. Li, J.; Viveros, J.A.; Wrue, M.H.; Anthamatten, M. Shape-Memory Effects in Polymer Networks Containing Reversibly Associating Side-Groups. Adv. Mater. 2007, 19, 2851–2855. [Google Scholar] [CrossRef]
  8. Liu, W.; Zhang, R.; Huang, M.; Dong, X.; Xu, W.; Wang, Y.; Hu, G.H.; Zhu, J. Synthesis and shape memory property of segmented poly(ester urethane) with poly(butylene 1,4-cyclohexanedicarboxylate) as the soft segment. RSC Adv. 2016, 6, 95527–95534. [Google Scholar] [CrossRef]
  9. Ahmad, M.; Xu, B.; Purnawali, H.; Fu, Y.; Huang, W.; Miraftab, M.; Luo, J. High Performance Shape Memory Polyurethane Synthesized with High Molecular Weight Polyol as the Soft Segment. Appl. Sci. 2012, 2, 535–548. [Google Scholar] [CrossRef]
  10. Yuan, X.; Sang, Z.; Zhao, J.; Zhang, Z.; Zhang, J.; Cheng, J. Synthesis and properties of non-isocyanate aliphatic thermoplastic polyurethane elastomers with polycaprolactone soft segments. J. Polym. Res. 2017, 24, 88. [Google Scholar] [CrossRef]
  11. Sabahi, N.; Roohani, I.; Wang, C.H.; Farajzadeh, E.; Li, X. Thermoplastic polyurethane-based shape memory polymers with potential biomedical application: The effect of TPU soft-segment on shape memory effect and cytocompatibility. Polymer 2023, 283, 121689. [Google Scholar] [CrossRef]
  12. Wang, H.; Zhang, L.; Peh, K.W.E.; Yu, Q.; Lu, Y.; Hua, W.; Men, Y. Effect of Phase Separation and Crystallization on Enthalpy Relaxation in Thermoplastic Polyurethane. Macromolecules 2022, 55, 8566–8576. [Google Scholar] [CrossRef]
  13. Frick, A.; Rochman, A. Characterization of TPU-elastomers by thermal analysis (DSC). Polym. Test. 2004, 23, 413–417. [Google Scholar] [CrossRef]
  14. Minke, R.; Blackwell, J. Polymorphic Structures of Poly(tetramet hylene Adipate). J. Macromol. Sci.-Phys. B 1979, 16, 407–417. [Google Scholar] [CrossRef]
  15. Zheng, Y.; Pan, P. Crystallization of biodegradable and biobased polyesters: Polymorphism, cocrystallization, and structure-property relationship. Prog. Polym. Sci. 2020, 109, 101291. [Google Scholar] [CrossRef]
  16. Lotz, B.; Miyoshi, T.; Cheng, S. 50th anniversary perspective: Polymer crystals and crystallization: Personal journeys in a challenging research field. Macromolecules 2017, 50, 5995–6025. [Google Scholar] [CrossRef]
  17. Prasannan, A.; Bichtram, T.; Hsu, D.-Y.; Hong, P.-D.; Pan, G.-R. Nucleation effects of α-cyclodextrin inclusion complexes on the crystallization behavior of biodegradable poly(1,4-butylene adipate). Cryst. Eng. Comm. 2013, 15, 5119–5126. [Google Scholar] [CrossRef]
  18. Wang, H.; Gao, Z.; Yang, X.; Liu, K.; Zhang, M.; Qiang, X.; Wang, X. Epitaxial Crystallization Behavior of Poly(butylene adipate) on Orientated Poly(butylene succinate) Substrate. Polymer 2018, 10, 110. [Google Scholar] [CrossRef]
  19. Song, Y.; Ye, H.; Xu, J.; Hou, K.; Zhou, Q.; Lu, G. Stretch-induced bidirectional polymorphic transformation of crystals in poly(butylene adipate). Polymer 2014, 55, 3054–3061. [Google Scholar] [CrossRef]
  20. Bothe, M.; Emmerling, F.; Pretsch, T. Poly(ester urethane) with Vary-ing Polyester Chain Length: Polymorphism and Shape-Memory Behavior. Macromol. Chem. Phys. 2013, 214, 2683–2693. [Google Scholar] [CrossRef]
  21. Sun, X.; Fang, Q.; Li, H.; Ren, Z.; Yan, S. Effect of Anodic Alumina Oxide Pore Diameter on the Crystallization of Poly(butylene adipate). Langmuir 2016, 32, 3269–3275. [Google Scholar] [CrossRef] [PubMed]
  22. Chan-Chan, L.; Chan-Chan, L.; Solis-Correa, R.; Vargas-Coronado, R.; Cervantes-U, J.; Cauich-Rodríguez, J.; Quintana, P.; Bartolo-Pérez, P. Degradation studies on segmented polyurethanes prepared with HMDI, PCL and different chain extenders. Acta Biomater. 2010, 6, 2035–2044. [Google Scholar] [CrossRef] [PubMed]
  23. Pielichowski, K.; Słotwińska, D.; Dziwiński, E. Segmented MDI/HMDI-based polyurethanes with lowered flammability. J. Appl. Polym. Sci. 2004, 91, 3214–3224. [Google Scholar] [CrossRef]
  24. Herrera, M.; Matuschek, G.; Kettrup, A. Thermal degradation of thermoplastic polyurethane elastomers (TPU) based on MDI. Polym. Degrad. Stab. 2002, 78, 323–331. [Google Scholar] [CrossRef]
  25. Ji, F.; Hu, J.; Li, T.; Wong, Y. Morphology and shape memory effect of segmented polyurethanes. Part I: With crystalline reversible phase. Polymer 2007, 48, 5133–5145. [Google Scholar] [CrossRef]
  26. Wang, Y.; Wang, L.; Liu, H.; He, S.; Lui, X.; Li, W.; Huang, M.; Chen, Z. Polyurethane as smart biocoatings: Effects of hard segments on phase structures and properties. Prog. Org. Coat. 2021, 150, 106000. [Google Scholar] [CrossRef]
  27. Quiram, D.J.; Register, R.A.; Marchand, G.R.; Adamson, D.H. Chain Orientation in Block Copolymers Exhibiting Cylindrically Confined Crystallization. Macromolecules 1998, 31, 4891–4898. [Google Scholar] [CrossRef]
  28. Li, Y.J.; Ren, Z.Y.; Zhao, M.; Yang, H.C.; Chu, B. Multiphase structure of segmented polyurethanes—Effects of hard-segment flexibility. Macromolecules 1993, 26, 612–622. [Google Scholar] [CrossRef]
  29. Gorbunova, M.; Anokhin, D.V.; Abukaev, A.; Ivanov, D. The Influence of Long-Time Storage on the Structure and Properties of Multi-Block Thermoplastic Polyurethanes Based on Poly(butylene adipate) Diol and Polycaprolactone Diol. Materials 2023, 16, 818. [Google Scholar] [CrossRef]
  30. Gorbunova, M.A.; Anokhin, D.V.; Abukaev, A.F.; Ivanov, D.A. Impact of Soft Segment Composition on Phase Separation and Crystallization of Multi-Block Thermoplastic Polyurethanes Based on Poly(butylene adipate) Diol and Polycaprolactone Diol. Crystals 2023, 13, 1447. [Google Scholar] [CrossRef]
  31. Gorbunova, M.A.; Komov, E.V.; Grunin, L.Y.; Ivanova, M.S.; Abukaev, A.F.; Imamutdinova, A.M.; Ivanov, D.A.; Anokhin, D.V. Effect of separation of blocks on crystallization kinetics and phase composition of poly(butylene adipate) in multi-block thermoplastic polyurethanes. Phys. Chem. Chem. Phys. 2022, 24, 902–913. [Google Scholar] [CrossRef]
  32. Tarasov, A.E.; Lodygina, V.P.; Komratova, V.V.; Gorbunova, M.A.; Badamshina, E.R. New IR-Spectroscopic Methods for Determining the Hydroxyl Content in Oligomers. J. Appl. Spectrosc. 2017, 84, 211–216. [Google Scholar] [CrossRef]
  33. He, Y.; Xie, D.; Zhang, X. The Structure, Microphase-Separated Morphology, and Property of Polyurethanes and Polyureas. J. Mater. Sci. 2014, 49, 7339–7352. [Google Scholar] [CrossRef]
  34. Gan, Z.; Kuwabara, K.; Abe, H.; Iwata, H.; Doi, Y. Metastability and Transformation of Polymorphic Crystals in Biodegradable Poly(butylene adipate). Biomacromolecules 2004, 5, 371–378. [Google Scholar] [CrossRef]
  35. Gan, Z.; Abe, H.; Doi, Y. Temperature-Induced Polymorphic Crystals of Poly(butylene adipate). Macromol. Chem. Phys. 2002, 203, 2369–2374. [Google Scholar] [CrossRef]
  36. Mukhametzyanov, T.; Schmelzer, J.; Yarko, E.; Abdullin, A.; Ziganshin, M.; Sedov, I.; Schick, C. Crystal Nucleation and Growth in Cross-Linked Poly(ε-caprolactone) (PCL). Polymers 2021, 13, 3617. [Google Scholar] [CrossRef]
  37. D’hollander, S.; Gommes, C.J.; Mens, R.; Adriaensens, P.; Goderis, B.; Prez, F.D. Modeling the morphology and mechanical behavior of shape memory polyurethanes based on solid-state NMR and synchrotron SAXS/WAXD. J. Mater. Chem. 2010, 20, 3475–3486. [Google Scholar] [CrossRef]
  38. Koberstein, J.T.; Galambos, A.F. Multiple Melting in Segmented Polyurethane Block Copolymers. Macromolecules 1992, 25, 5618–5624. [Google Scholar] [CrossRef]
Scheme 1. Chemical structure of the synthesized TPUs.
Crystals 13 01662 sch001
Scheme 2. DSC thermal programs for non-isothermal (left) and isothermal (right) crystallization.
Crystals 13 01662 sch002
Figure 1. DSC curves TPU(PBA) (green), TPU(PBA-MDI) (blue), and TPU(PBA-HMDI) (red): (a) first heating to 80 °C (solid lines) and cooling to −45 °C (dashed lines); (b) second heating to 180 °C (solid lines) and cooling to −45 °C (dashed lines); (c) heatings after cooling from 80 °C and isothermal crystallization at Tc = 5, 10, and 25 °C; (d) heatings after cooling from 180 °C and isothermal crystallization at Tc = 5, 10, and 25 °C. The arrows indicate melting of the α- or β-polymorph of PBA.
Crystals 13 01662 g001
Figure 2. WAXS of TPU(PBA) (green), TPU(PBA-MDI) (blue), TPU(PBA-HMDI) (red): (a) native at RT (solid) and at 80 °C (dashed); (b) at RT after cooling from 80 °C (solid) and 180 °C (dashed). Vertical lines indicate positions of characteristic peaks of β- and α-phase of PBA.
Crystals 13 01662 g002
Figure 3. Evolution of WAXS diffractograms (TPU(PBA-HMDI)) during crystallization at RT after annealing at 80 °C (a); time dependence of the fractions of the α (squares) and β (triangles) phase of PBA during crystallization at RT after annealing at 80 °C (blue) and 180 °C (red) of TPU(PBA) (b), TPU(PBA-MDI) (c), TPU(PBA-HMDI) (d).
Crystals 13 01662 g003
Figure 4. Schematic representation of the morphologies of the TPUs: HS crystal/SS crystal (a), structure after SS melting (b), amorphous phase-separated state (c), and amorphous isotropic state (d).
Crystals 13 01662 g004
Figure 5. WAXS (a) and SAXS (b) curves for TPU(PBA-MDI) measured at RT (red), 80 °C (black), 180 °C (blue), 230 °C (green), and immediately after cooling from 230 °C to RT (orange).
Crystals 13 01662 g005
Figure 6. IR spectra in the absorption ranges 1780–1640 cm−1 (ac) and 3500–3150 cm−1 (df) for the native samples and samples crystallized after heating to 80, 180, and 230 °C.
Crystals 13 01662 g006
Table 1. Chemical composition of studied TPUs.
SamplePolydiolDiisocyanateChain
Extender
1TPU(PBA)PBAHMDI, MDIBD
2TPU(PBA-MDI)PBA-MDI-PBA
3TPU(PBA-HMDI)PBA-HMDI-PBA
Table 2. Thermogravimetric analysis results.
SampleT(onset),
°C
T(50%),
°C
T(endset),
°C
T2,
°C
T2,
°C
T3,
°C
TPU(PBA)297385487361395478
TPU(PBA-MDI)283385494358495470
TPU(PBA-HMDI)296380488361409450
Table 3. Thermal properties of the TPU soft segment extracted from DSC measurements.
SampleFirst HeatingFirst CoolingSecond HeatingSecond Cooling
Tonset, °CTmaxc, °CχDSC, %Tonset, °CTmaxc, °CχDSC, %Tonset, °CTmaxc, °CχDSC, %Tonset, °CTmaxc, °CχDSC, %
TPU-PBA40.746.61411.24.62530.747.1372.6−4.918
TPU-PBA-MDI41.045.52110.62.61524.846.128−4.5−13.411
TPU-PBA-HMDI40.444.52712.76.63329.724.23615.68.733
Table 4. Crystallinity index and phase composition reached in the course of isothermal crystallization at RT.
SampleMelt Temperature,
°C
χWAXS, %
Totalα-PBAβ-PBA
TPU(PBA)native31283
80743
180Amorphous
230Amorphous
TPU(PBA-MDI)native21201
8021516
1801569
230Amorphous
TPU(PBA-HMDI)native11110
8021417
18020119
2301055
Table 5. Results of SAXS analysis of TPU at different temperatures.
TemperatureSAXS Distance, nm
TPU(PBA)TPU(PBA-MDI)TPU(PBA-HMDI)
25 °C11.5 (L1)12.3 (L1)12.1 (L1)
80 °C14.6 (L2)15.6 (L2)15.2 (L2)
25 °C
30 min after cooling from 80 °C
12.6 (L1)13.1 (L1)12.4 (L1)
180 °C26.3 (L3)25.2 (L3)22.6 (L3)
25 °C
after cooling from 180 °C
21.3 (L2/L3)15.2 (L2)
25 °C
30 min after cooling from 180 °C
20.1 (L2/L3)16.1 (L1/L2)14.2 (L1)
Disclaimer/Publisher’s Note: The statements, opinions and data contained in all publications are solely those of the individual author(s) and contributor(s) and not of MDPI and/or the editor(s). MDPI and/or the editor(s) disclaim responsibility for any injury to people or property resulting from any ideas, methods, instructions or products referred to in the content.

