Article

Kinetic Optimization of the Batch Crystallization of an Active Pharmaceutical Ingredient in the Presence of a Low-Solubility, Precipitating Impurity

1
Department of Chemical Engineering, Rowan University, Glassboro, NJ 08028, USA
2
Indatech, Chauvin Arnoux Group, 34830 Clapiers, France
*
Author to whom correspondence should be addressed.
Crystals 2023, 13(11), 1569; https://doi.org/10.3390/cryst13111569
Submission received: 11 October 2023 / Revised: 27 October 2023 / Accepted: 30 October 2023 / Published: 3 November 2023

Abstract

:
The presence of impurities above regulatory thresholds has been responsible for recent recalls of pharmaceutical drugs. Crystallization is one of the most used separation processes to control impurities in the final drug. A particular issue emerges when impurities are poorly soluble in the crystallization solvent and simultaneously precipitate with the product. This publication reports the development of a population balance model to investigate if the impurity crystallization kinetics can be selectively inhibited in a seeded batch crystallization system containing acetaminophen (ACM), a commonly used small-molecule active pharmaceutical ingredient (API), and curcumin (CUR), a simulated low-solubility/co-precipitating impurity. Raman spectroscopy was used in combination with a partial least squares (PLS) model for in situ monitoring of the crystallization process. The Raman data were integrated to calibrate a population balance model in gPROMS FormulatedProducts, to predict the evolution of the product’s purity throughout the process. Process optimization demonstrated that a high purity close to equilibrium is feasible within the first 2 h of crystallization, with ACM seed purity being the primary factor controlling this phenomenon. The optimal approach for kinetically rejecting impurities requires a low nucleation rate for the impurity, high product seed purities, and an adjustable crystallization time so the process can be stopped before equilibrium without allowing the impurity to nucleate. Overall, an improvement in product purity before equilibrium is attainable if there is enough difference in growth kinetics between the product and impurity, and if one can generate relatively pure seed crystals.

1. Introduction

Crystallization has received growing attention in the pharmaceutical industry, especially since >90% of pharmaceutical products contain drug substances that have a crystalline solid form [1,2]. The synthesis of Active Pharmaceutical Ingredients (APIs) often generates structurally similar impurities [3,4,5], which can lead to changes in solubility, kinetics [6,7,8], and crystal morphology [9,10]. Moreover, the presence of potentially toxic impurities in the final product can cause unintended side effects for the patient. The presence of impurities above regulatory thresholds has been responsible for recent drug recalls [11], such as ranitidine (Zantac) [12,13]. Despite the potential issues impurities pose for pharmaceuticals, and the fact that both crystallization and drug manufacturing have been around for many years, there are few reports available in the literature studying crystallization as a purification process.
A recent publication reported an analysis of impurity retention mechanisms for common industrial purification challenges. Of the 52 reported examples, impurities were found to precipitate during crystallization in 27% of the cases [14]. The majority of these cases related to when the impurity was immiscible in the solid state with the product. A particularly challenging mechanism is when the precipitating impurity is poorly soluble in the crystallization solvent, becoming enriched in the solid phase at equilibrium. This is sometimes referred to as a Solubility-Limited Impurity Purge type 2 (SLIP 2) mechanism [14,15]. In this mechanism, two crystallization events occur: one for the product and one for the impurity. From this, a physical mixture is obtained of the final material where the impurity is less soluble than the product. Thermodynamically, this difference in solubilities implies that no purification can be achieved during crystallization and subsequent washing processes. However, the two solutes may exhibit different crystallization kinetics leading to different degrees of purification over time, before reaching equilibrium. With proper control of the seeding conditions, one may be able to selectively enhance the API crystallization while inhibiting the impurity crystallization. This could lead to a point in the process where the API purity is higher than that predicted at equilibrium, without significant losses in yield.
For our system, acetaminophen (ACM) was used as the API and curcumin (CUR) was used as the impurity, while the crystallization solvents used were ethanol (EtOH) and water (H2O). This system is known to generate a SLIP 2 scenario [14], and it presents an extreme case where the impurity’s solubility is 100 times smaller than the API’s, with potentially slower kinetics owing to its more complex structure. The molecular structures are illustrated in Figure 1.
ACM is a small-molecule organic chemical that is commonly used in the pharmaceutical industry (active ingredient in Tylenol). CUR is an orange-yellow powder that is easily detected visually. Initial studies have showed that CUR has very little incorporation in the ACM crystal lattice (0.01–0.1 wt. % CUR) [14], so for this system ACM and CUR are assumed to be essentially immiscible in the solid state. ACM has a higher solubility in a 75% EtOH/25% H2O (vol%) mixed solvent than in either pure H2O or pure EtOH due to a co-solvent effect [16]. CUR is very poorly soluble in water, and only slightly soluble in ethanol [17,18,19]. In this context, antisolvent crystallization was used because of our system’s sensitivity to heat, and degradation and decomposition can lead to unnecessary error [20,21,22].
The goal of this publication is to explore whether a poorly soluble impurity can be rejected kinetically by using an appropriate crystallization model. Raman spectroscopy in conjunction with high-performance liquid chromatography (HPLC) was used to calibrate a partial least squares (PLS) regression model, in order to measure the liquid phase concentrations of the ACM and CUR in situ. Raman is a process analytical technology (PAT) tool that has been used in determining the presence of cocrystals [23] and polymorphs [24,25,26,27], and for improving purity in biopharmaceuticals [28,29]. The predicted values from the PLS model for the ACM and CUR crystallization experiments were then integrated into a population balance model developed in gPROMS FormulatedProducts for parameter estimation. The process was optimized using Python to determine the extent to which process conditions (seed amount, seed purity and total crude concentration) affect ACM product purity, and to determine how feasibly ACM can be purified kinetically before the process reaches thermodynamic equilibrium.

2. Materials and Methodology
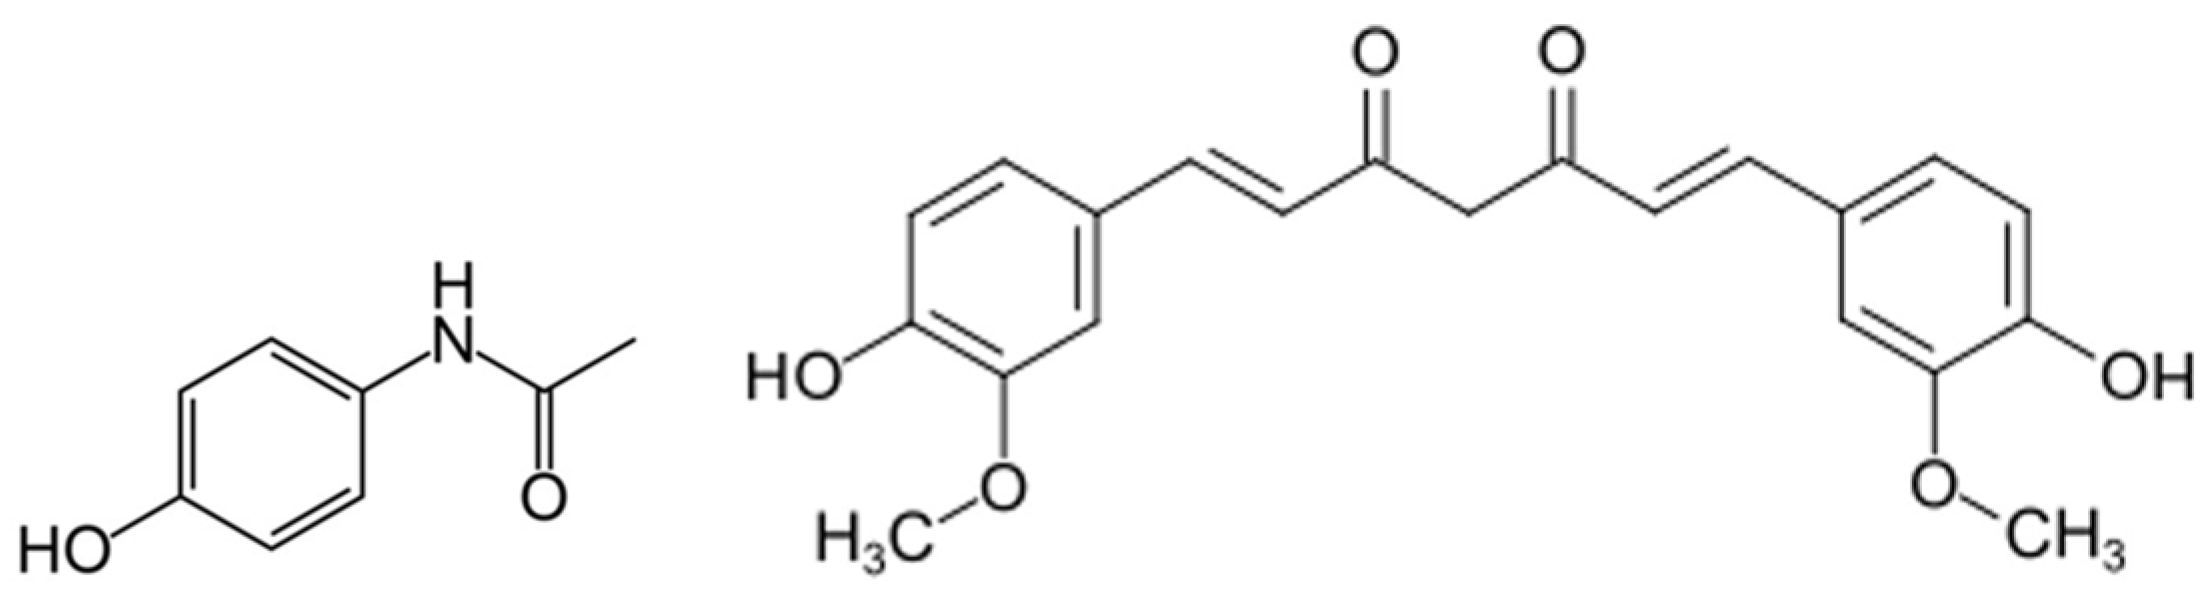
2.1. Materials

ACM (paracetamol, >98.0%) and CUR (Natural) were purchased from TCI America. Ethanol (EtOH, absolute) was purchased from VWR. Methanol (MeOH, ≥99.9%) was purchased from J.T. Baker. Deionized water (H2O) was produced in-house.

2.2. Solubility Measurements

Solubilities for ACM and CUR in 75% EtOH/25% H2O and in 25% EtOH/75% H2O (both vol%) were obtained by suspending both compounds separately at 20.0 °C for 24 h, under stirring. The samples were then syringe filtered (PTFE membrane, 0.45 µm) and diluted for HPLC analysis. The solubilities were determined on a total solution basis. The resulting solubilities for 75% EtOH/25% H2O were 215.1 mg/mL for ACM and 3.82 mg/mL for CUR, both in total solution basis. In 25% EtOH/75% H2O, the solubilities were 34.3 mg/mL for ACM and 0.033 mg/mL for CUR.

2.3. Seeded Batch Crystallization Experiments

Four crystallization experiments (E1–E4, Table 1) were conducted to provide experimental data to calibrate the population balance model. Those experiments were followed by a validation experiment (E5, Table 1) at intermediate conditions within the design space. The main parameter that was varied between experiments was the concentration of each of the two solutes pre-seeding, following the values listed in Table 1. The initial supersaturations before seeding (Table 1) were calculated by taking the natural logarithm of the feed concentration with the solubilities in the 25%/75% EtOH/H2O solvent from the previous subsection. More details on the supersaturation calculation can be found in Section 3.3.
The feed solutions of ACM and CUR were prepared by dissolving both solutes in 200 mL of a 75% EtOH/25% H2O solvent. The solutions were mixed using magnetic stirring with a stir bar and left to equilibrate for 18–24 h at room temperature to ensure that all the solids fully dissolved. These ACM/CUR feed solutions were then fed into a jacketed glass reactor (700 mL working volume, 100 mm diameter) at a temperature of 20.0 °C. The mixture was stirred using a PTFE-coated overhead propeller (four blades, down-pumping, and 40 mm diameter) at an agitation speed of 300 rpm. A volume of 400 mL of H2O was then added to the feed solution as antisolvent, resulting in a metastable, supersaturated solution with a 25% EtOH/75% H2O solvent composition. A mass of 1 g of seeds were then added to commence the crystallization process. The seeds utilized were prepared from a physical powder mixture of ACM and CUR that was crystallized via antisolvent crystallization and filtered via vacuum filtration. The seeds were then ground up and a sample was measured on the HPLC. Purity of the seeds used for all experiments was 98.5 wt. % ACM/1.5 wt. % CUR.

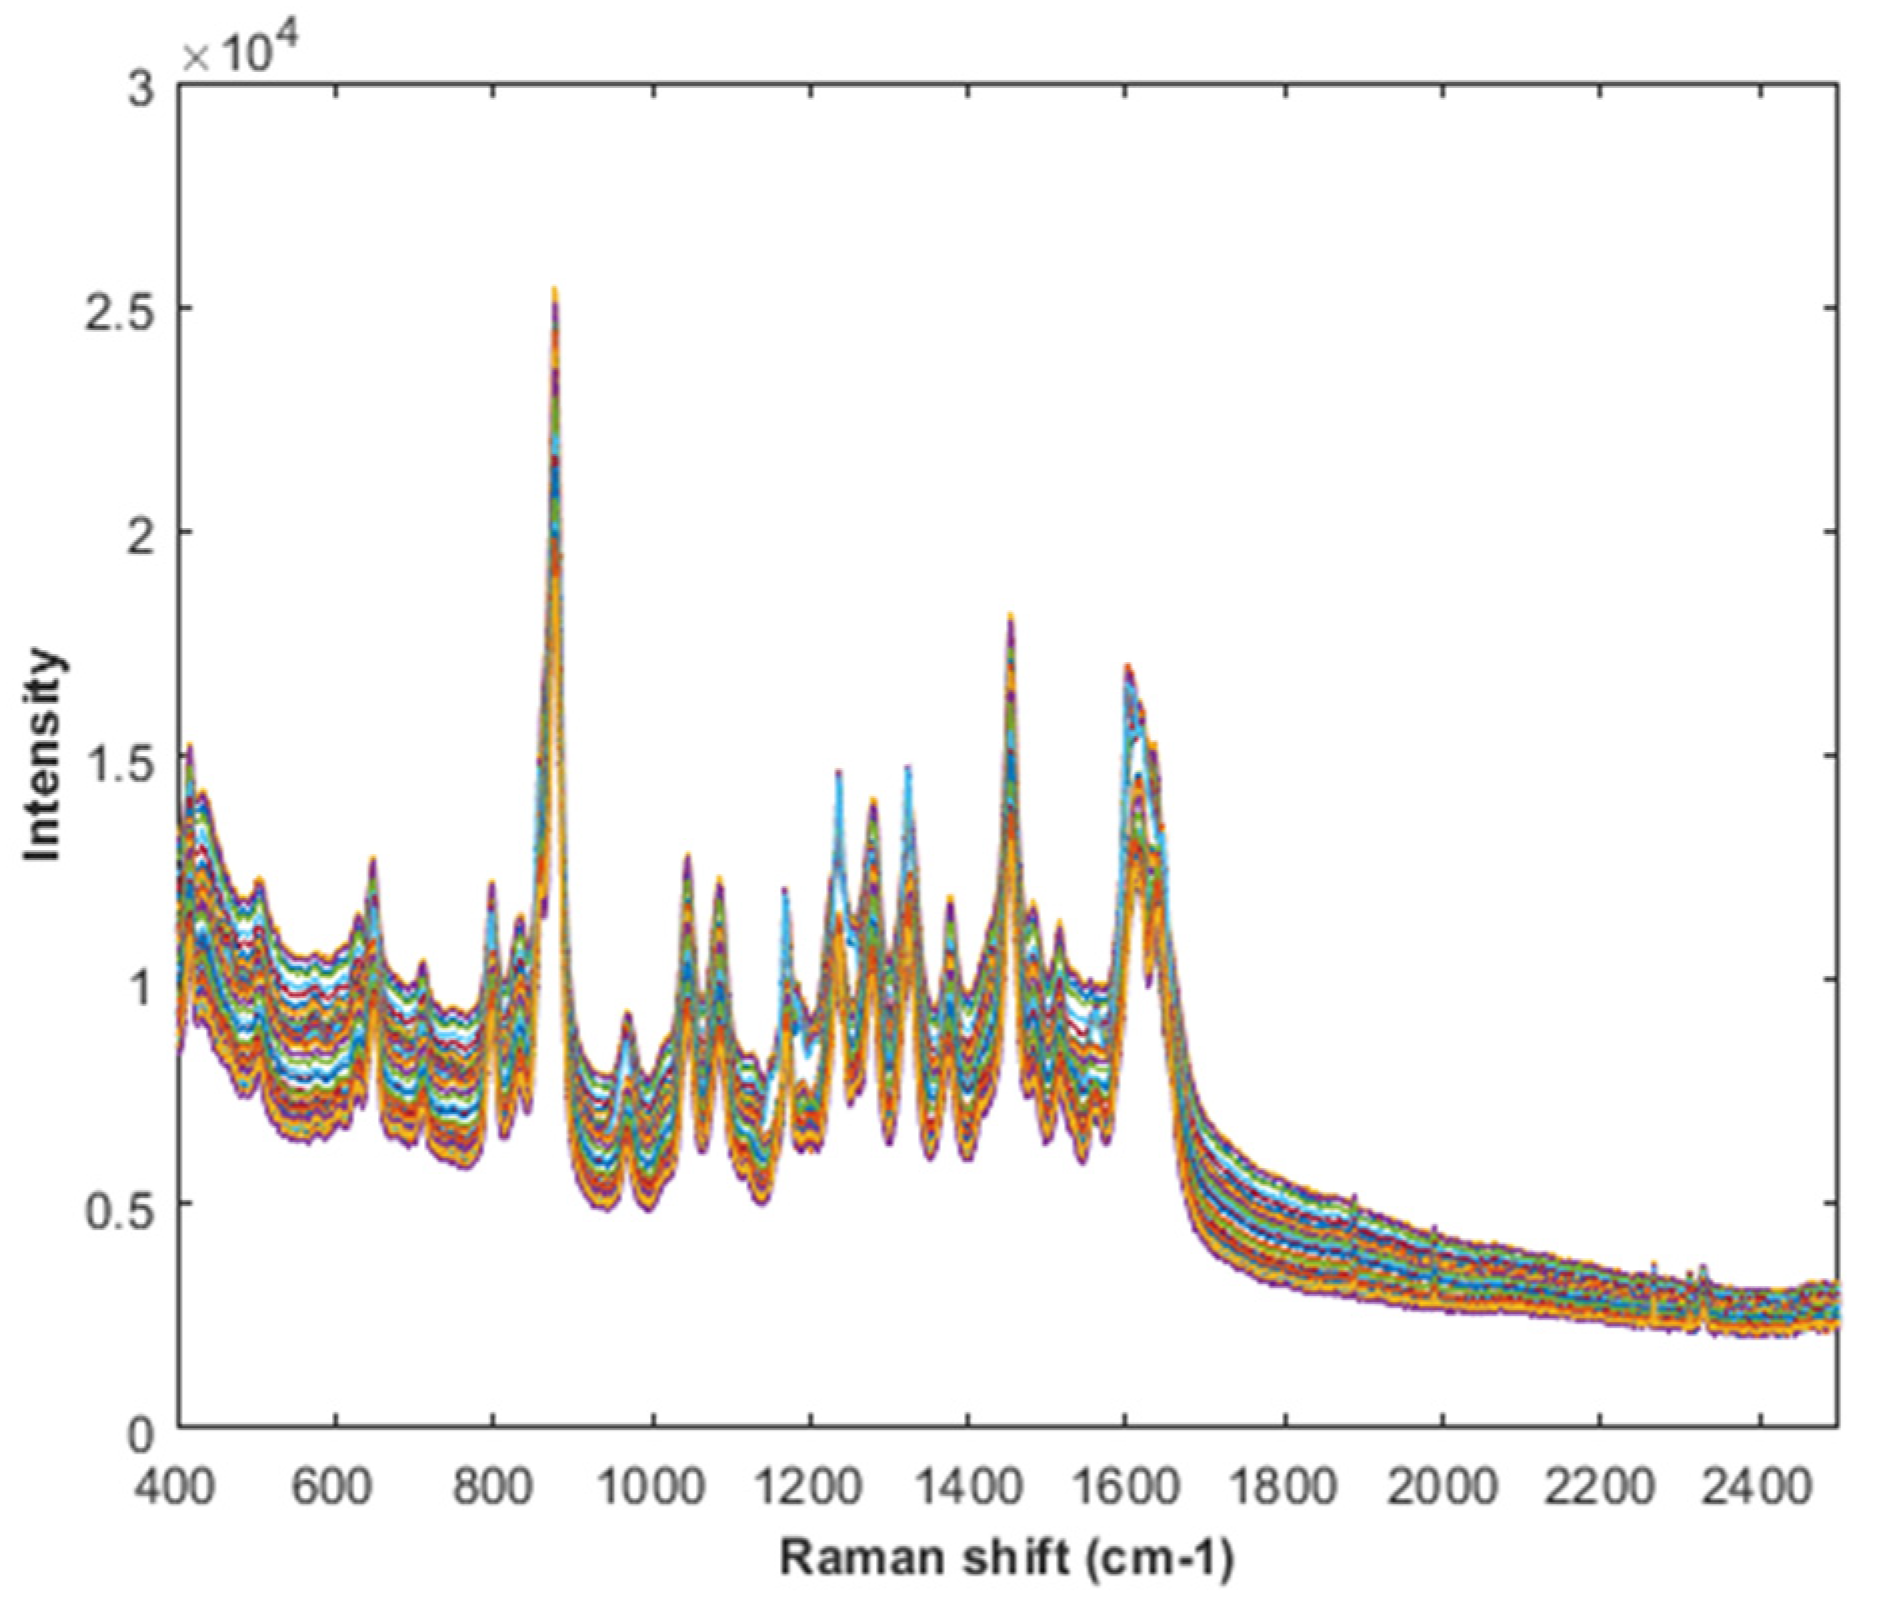
2.4. Raman Spectroscopy

During the crystallization experiments, Raman spectra were taken every 15.5 s to track the liquid-phase concentration of both ACM and CUR simultaneously. This was performed in-line using a single channel Viserion® 785 nm Analyzer (Indatech Chauvin-Arnoux, Clapiers, France). Each spectrum consists of 2100 data points, covering the wavenumber region from 400 to 2500 cm−1, with a resolution of 9 cm−1. The Raman Analyzer was connected to a probe with a GMP 12 mm immersion pipe (Indatech Chauvin-Arnoux, Clapiers, France) through optic fibers. Real-time monitoring of the crystallization process of ACM and CUR was achieved by measuring the liquid-phase concentration of both solutes as they crystallized, utilizing the probe immersed in the reactor. Raman spectra were acquired with an integration time of 5 s and using 3 scans per measurement. Performing at least 3 scans allowed for automatic cosmic spike filtering in the spectra, which is a built-in feature of the Viserion® software. All Raman data analysis was performed using MATLAB R2022b (MathWorks, Natick, MA, USA) and PLS_Toolbox 9.1 (EigenvectorResearch Inc., Manson, WA, USA).

2.5. HPLC Method

For HPLC analysis, samples were periodically taken from the crystallizing suspension, filtered out via syringe filtration (PTFE membrane, 0.45 µm) and then diluted. Since the Raman recorded the time each spectra was taken, we were able to match the samples taken for HPLC with the Raman timestamp. HPLC measurement data was collected using a Thermofisher Vanquish HPLC at a flow rate of 1.5 mL/min, a column temperature of 25 °C, an injection volume of 10 μL and at detection wavelengths of 220 and 260 nm for the ACM and CUR, respectively. The HPLC stationary phase consisted of a BioBasic-18 column (250 × 4.6 mm, 5 µm). The mobile phase was a gradient of MeOH/H2O, where the water was adjusted to pH 2.0 using o-phosphoric acid.

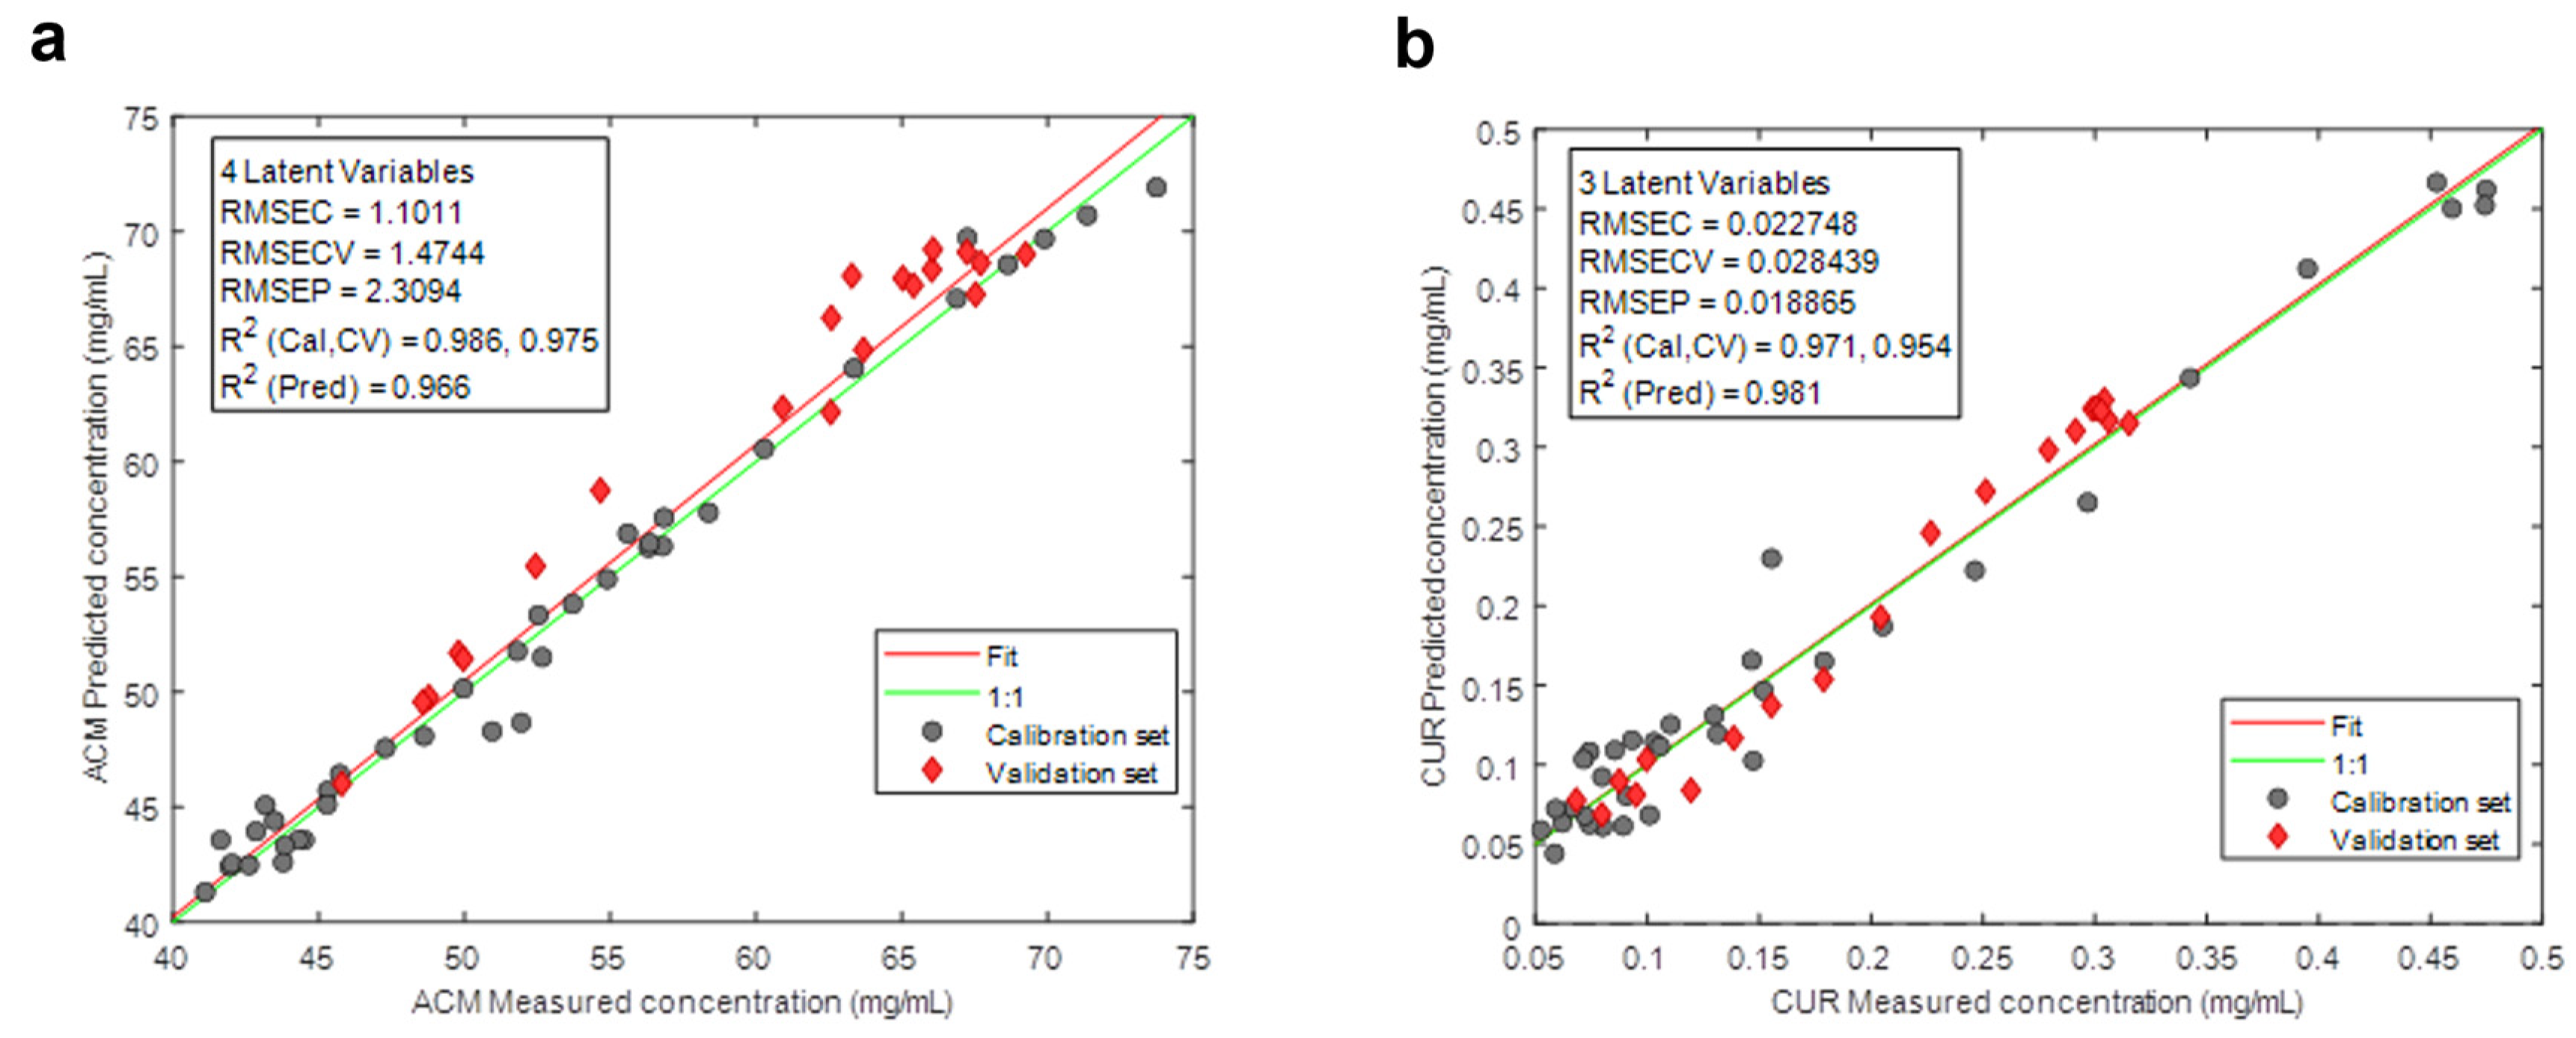
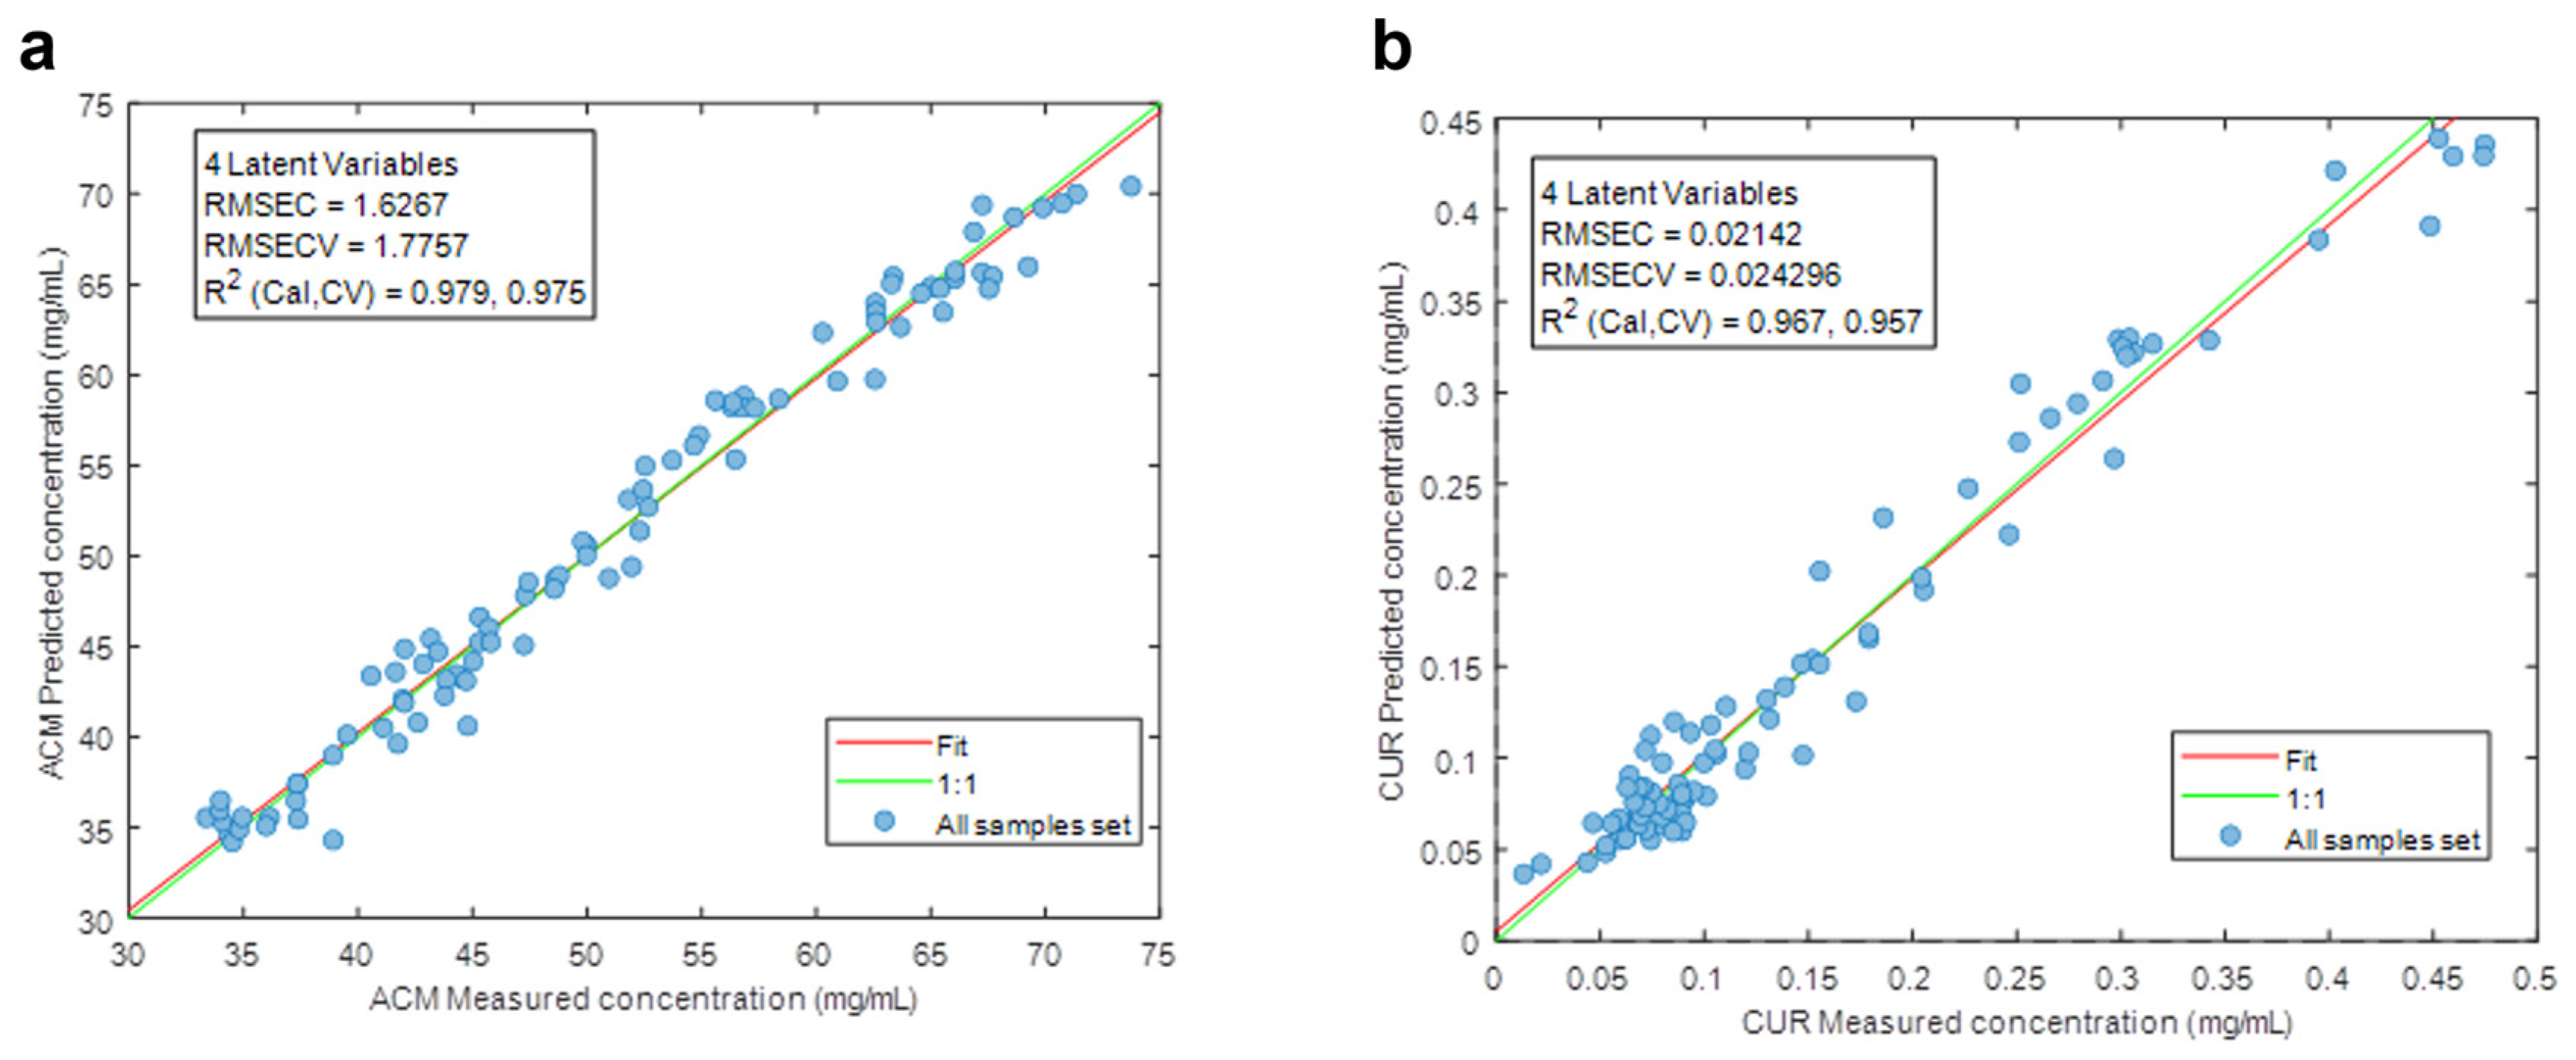
2.6. PLS Calibration

The PLS model was calibrated using the liquid-phase concentrations yielded by the HPLC with the corresponding Raman spectra from three crystallization batches. Two of these batches were used to construct separate PLS models, one for ACM and another for CUR. Raman measurements were also conducted on pure ACM and CUR suspended in the 25/75 EtOH/H2O solvent, as well as the solvent itself, to identify their spectral signatures (Supporting Information, Figure S1). The third remaining batch, comprising 20 measurements, was used for model validation.

2.7. Parameter Estimation in gPROMS

The parameter estimation (crystallization growth rates, kg), based on the desupersaturation results for ACM and CUR in E1–E4, were generated using gPROMS FormulatedProducts (Siemens Process Systems Engineering). These parameters were estimated by fitting the experimental data with the best-fit values calculated from the population balance model. The model was then validated in gPROMS to predict the ACM and CUR liquid-phase concentrations and those predictions were compared to the experimental results from E5. Tables for the model equations, parameters, and variables used in gPROMS can be found in the Supporting Information.

3. Crystallization Model

3.1. Phase Balances

The concentration of a crude solution containing an API and impurity as solutes can be calculated using phase balances. Assuming neither the API nor impurity form solvates or hydrates with the crystallization solvents, and for dilute suspensions (i.e., L solution ≈ L total suspension), the phase balance for the crystallizer is described in Equation (1):
C t o t , i = C m l , i + M T , i
where the total concentration (Ctot,i, g/L suspension) of each solute in the crystallizer is the sum of its concentration in the liquid phase (CmL,i, g/L solution) and its solids concentration, or suspension density (MT,i, g/L suspension). Knowing that the total concentration of a solute comes from the contributions of both the crude feed and the added seeds, the total concentration of each solute i can also be calculated in Equation (2) using the total concentration of solutes (product + impurity) in the crude (CC, g/L), and the relative purity of a solute i in said crude (PC,i, g/g), together with the equivalent values for concentration (CS, g/L) and purity in the seeds (PS,i, g/g).
C t o t , i = C c P c , i + C s P s , i
Here, the crude and seed concentrations contain the sum of all solutes in the system, while the purities are for a specific solute (i). The initial suspension density of a compound i, as provided by the seeds (Ms,i, g/L), can be obtained using Equation (3).
M s , i = C s P s , i

3.2. Yield and Purity

Under the assumptions that neither the solute product nor impurities are able to form solvates or hydrates with the solvent or antisolvent, nor do either ACM or CUR form solid solutions (or forms solid solutions with only trace amounts of incorporated impurity) with each other, product purity (Pp,i, g/g) at any given point in time can be calculated from the fraction of suspension densities for the product and impurity, as provided by Equation (4):
P p , i = M T , i j = #   o f   s o l u t e s M T , j
The subscript j accounts for the number of solutes in the system. For this system, the denominator is the sum of the suspension densities of ACM and CUR.
While conditions in this work were exploratory and not designed with commercialization in mind, crystallization yield for a solute i (Yi, %) at any given point in time can be calculated using Equation (5). Here, note that the contribution of the seeds to suspension density has been excluded, to account only for newly crystallized material in the calculation of yield.
Y i = M T , i M s , i C t o t , i M s , i 100
A more relevant parameter for this work is the progress to equilibrium (Ei, %). This is sometimes called thermodynamic yield, and it represents how far the process is, at a given point in time, from its maximum crystallization yield. This is relevant for both ACM and CUR and expressed in Equation (6):
E i = M T , i M s , i C t o t , i M s , i C s a t , i 100
where Csat,i (g/L) is the solubility of the solute i at the operating conditions of temperature and solvent composition.

3.3. Supersaturation

By its definition, supersaturation (σi) depends on the difference in chemical potentials between a solution in its supersaturated state and its equivalent equilibrium state, and it is thermodynamically expressed as a logarithmic ratio of activities [1,30]. In its least assumptive form, it follows Equation (7):
σ i = l n γ i x i γ i s a t x i s a t
In Equation (7), xi and xisat are the mole fractions of the solute in the supersaturated solution and in its saturated (equilibrium) solution, respectively. The variables γi and γisat are the corresponding activity coefficients.
The accurate estimation of activity coefficients in non-equilibrium conditions remains a challenge [30,31], which often leads to simplifications of this expression. One of those assumptions is to take the ratio of activity coefficients at the saturated and supersaturated state and assume unity. In addition, assuming that the average molar mass of the supersaturated solution is similar to that of the saturated solution (reasonable, as described in prior work [30]), supersaturation can be expressed as a logarithmic ratio between mother liquor concentration and solubility using Equation (8) [1,32]:
σ i = l n C m l , i C s a t , i

3.4. Batch Crystallization Kinetics

Crystallization occurs via two kinetic mechanisms: nucleation (Bi, L−1s−1) and growth (Gi, µm/s). The equations for these mechanisms are most commonly expressed as semi-empirical power law models [33,34,35]. The power law equations, listed as Equations (9) and (10), enable the model to be fit using experimental data to estimate the kinetic parameters (kb, b, j, kg, g):
B i = k b , i σ b , i M T , i j , i
G i = k g , i σ g , i
At low supersaturations, growth becomes the primary kinetic mechanism [36,37]. For this work and as discussed further in the results section, secondary nucleation was considered negligible, and only growth (Equation (10)) was modeled, thus allowing the calibration to be based on the four conditions in Table 1.

3.5. Population Balance

Assuming size-independent growth, negligible agglomeration and breakage, and that the crystals have a similar shape or habit (kv), the population balance for a batch crystallizer can be tracked from its moments using Equation (11).
d μ i , j d t = 0 j B i + j G i μ i , j 1
The variable μi,j (µmj/L suspension) is the population moment, the subscript i represents the solute, and the subscript j indicates the # of the population moment (usually zeroth through fourth). Initial conditions for the population moments can be obtained from the seed suspension densities (Ms,i) and a volume-based crystal size (L, µm) distribution for those seeds (vol(L)), usually obtained using in situ particle imaging. For this work, we took a common approach of estimating vol(L) from the square-weighted particle size distribution of the seed crystals across discrete channels (ΔL, µm) using a Mettler Toledo EasyViewer 400 probe [8,38]. For this system, the particle widths of the seed crystals were used as the dimension for the particle size distribution. The relationship between vol(L), Ms,i, and the crystal population (n(L), L−1µm−1) is described in Equation (12):
n i ( L ) = v o l i ( L ) M s , i ρ i k v , i L 3 L
where ρ i (kg/m3) represents the density of the crystalline product i. The moments can be calculated from the crystal population (n(L)) following Equation (13), where the subscript j represents the jth moment of the distribution.
μ i , j = n i L j d L
At any given time, the suspension density of a product i in the crystallizer can be calculated from its third moment, using Equation (14) and the appropriate unit conversions.
M T , i = k v , i ρ i μ i , 3
The desupersaturation rate, expressed as how the mother liquor concentration for a solute i decreases over time, can be calculated by combining Equations (11) and (14), taking the assumption that the secondary nucleation rate is negligible (Bi = 0), and that for a constant total concentration, the increase in suspension density is equivalent to the decrease in mother liquor concentration (Equation (1)). This leads to Equation (15), which can be fitted directly into mother liquor concentration data as collected in situ by the Raman probe. In combination with Equation (10), this can be used to study the growth parameters for both solutes.
d C m l , i d t = 3 k v , i ρ i G i μ 2 , i

3.6. PLS Equations

PLS regression was used to calculate Cml,i for ACM and CUR from Raman spectra, separating the contributions of the solvent and the two solutes on the overall spectra. PLS is a multivariate chemometric technique used to model the relationship between a set of predictor variables and a response variable. In a PLS regression, the latent variables, or components, are constructed as linear combinations of the original predictors [39,40]. The equation for PLS regression is expressed in Equation (16):
Y = X b + E
Y is the response variable, X is the matrix of predictor variables, b consists of the vector of regression coefficients, and E is the residual error term.
The goal of PLS regression is to find the optimal weights, scores, loadings, and regression coefficients that maximize the covariance between the predictors (X) and the response variable (Y). By iteratively constructing these components, PLS regression captures the maximum shared information between the predictor variables and the response variable.
In order to evaluate the predictive performance of the PLS model, the commonly used metrics are the Root Mean Square Error of Cross-Validation (RMSECV) and the Root Mean Square Error of Prediction (RMSEP). These metrics provide a quantitative measure of the prediction accuracy of the model [39,40]. The RMSECV and RMSEP can be calculated using Equations (17) and (18):
RMSECV = 1 n × ( ( y i ŷ i 2 ) )
RMSEP = 1 m × ( ( y i ŷ i 2 ) )
The yi and ŷi variables are, respectively, the observed and predicted value of the response variable for the i-th observation. The variables n and m are the total number of observations in the cross-validation process for RMSECV and in the validation or test dataset for RMSEP. By utilizing RMSECV and RMSEP, one can assess the accuracy and reliability of the PLS model’s predictions and make informed decisions about its performance in predicting new, unseen data.

4. Results and Discussion

4.1. PLS Results

The collected Raman spectra from the three crystallizations (60 total measurements) used to calibrate the PLS model were first preprocessed using Standard Normal Variate (SNV) normalization to reduce variability caused by light scattering from solid formed crystals and differences between batches. Variable selection was then employed to isolate specific peaks of ACM and CUR, which are illustrated in Figure 2.
The selected spectral ranges for ACM were 695–752 cm−1, 850–901 cm−1, and 1648–1763 cm−1. For CUR, the chosen spectral ranges were 753–799 cm−1 and 1100–1199 cm−1. The PLS quantification models are provided in Figure 3.
The PLS models developed for ACM and CUR exhibited a high predictive accuracy with errors at the order of 3.1% and 5.9%, respectively. The RMSECV for ACM was calculated to be 1.83, while the RMSEP value was slightly higher at 2.13. Likewise, for CUR, the RMSECV and RMSEP values were found to be 0.028 and 0.019, respectively.
Four additional batch crystallizations were conducted after the initial PLS model calibration, using the developed PLS model, to measure the liquid concentrations for ACM and CUR in situ. This refinement aimed to improve the models’ resilience against variations in the concentration ranges of ACM and CUR, thereby enhancing their effectiveness for predictive purposes that would be used for the experiments in Table 1. Several samples were collected and analyzed using HPLC to verify that the Raman predictions continued to be accurate. Subsequently, the PLS models were updated by incorporating the newly acquired data points, totaling 33 new samples. The updated PLS quantification models are illustrated in Figure 4. The relative error calculations improved to 2.4% for ACM and 4.2% for CUR. The Root-Mean-Square Error of Calibration (RMSEC) for ACM and CUR were, respectively, 1.63 and 0.02, and RMSECV was 1.78 for ACM and 0.024 for CUR. The updated PLS models in Figure 4 were then used for measuring the liquid-phase concentrations of E1–E5 completely inline.

4.2. Particle Imaging

To investigate the assumption of negligible nucleation, batch crystallizations were conducted simulating the experiments in Table 1, but keeping one of the solutes (ACM or CUR) undersaturated, to allow for independent crystallization of just that solute. Those experiments were imaged with a Mettler Toledo EasyViewer 400 probe, with the aim to investigate the change in crystal count throughout the experiment. In both cases, the particle size distribution did not vary significantly from the seed size distribution (Supporting Information, Figure S2), and the increase in crystal counts was negligible. This can be pictured with images at the start of the crystallization and at equilibrium, as shown in Figure 5. This observation led to the assumption that the nucleation rate is negligible for our model, and that desupersaturation occurs primarily via the growth of seed crystals, not on new nuclei. This is a common occurrence in seeded batch crystallizers within the metastable region, which makes the simultaneous estimation of nucleation and growth kinetics from seeded batch experiments a difficult task. As shown in similar works by Xiouras, Schöll, and Mitchell, this typically leads to the implementation of a growth-only model for the system [36,37,41,42].

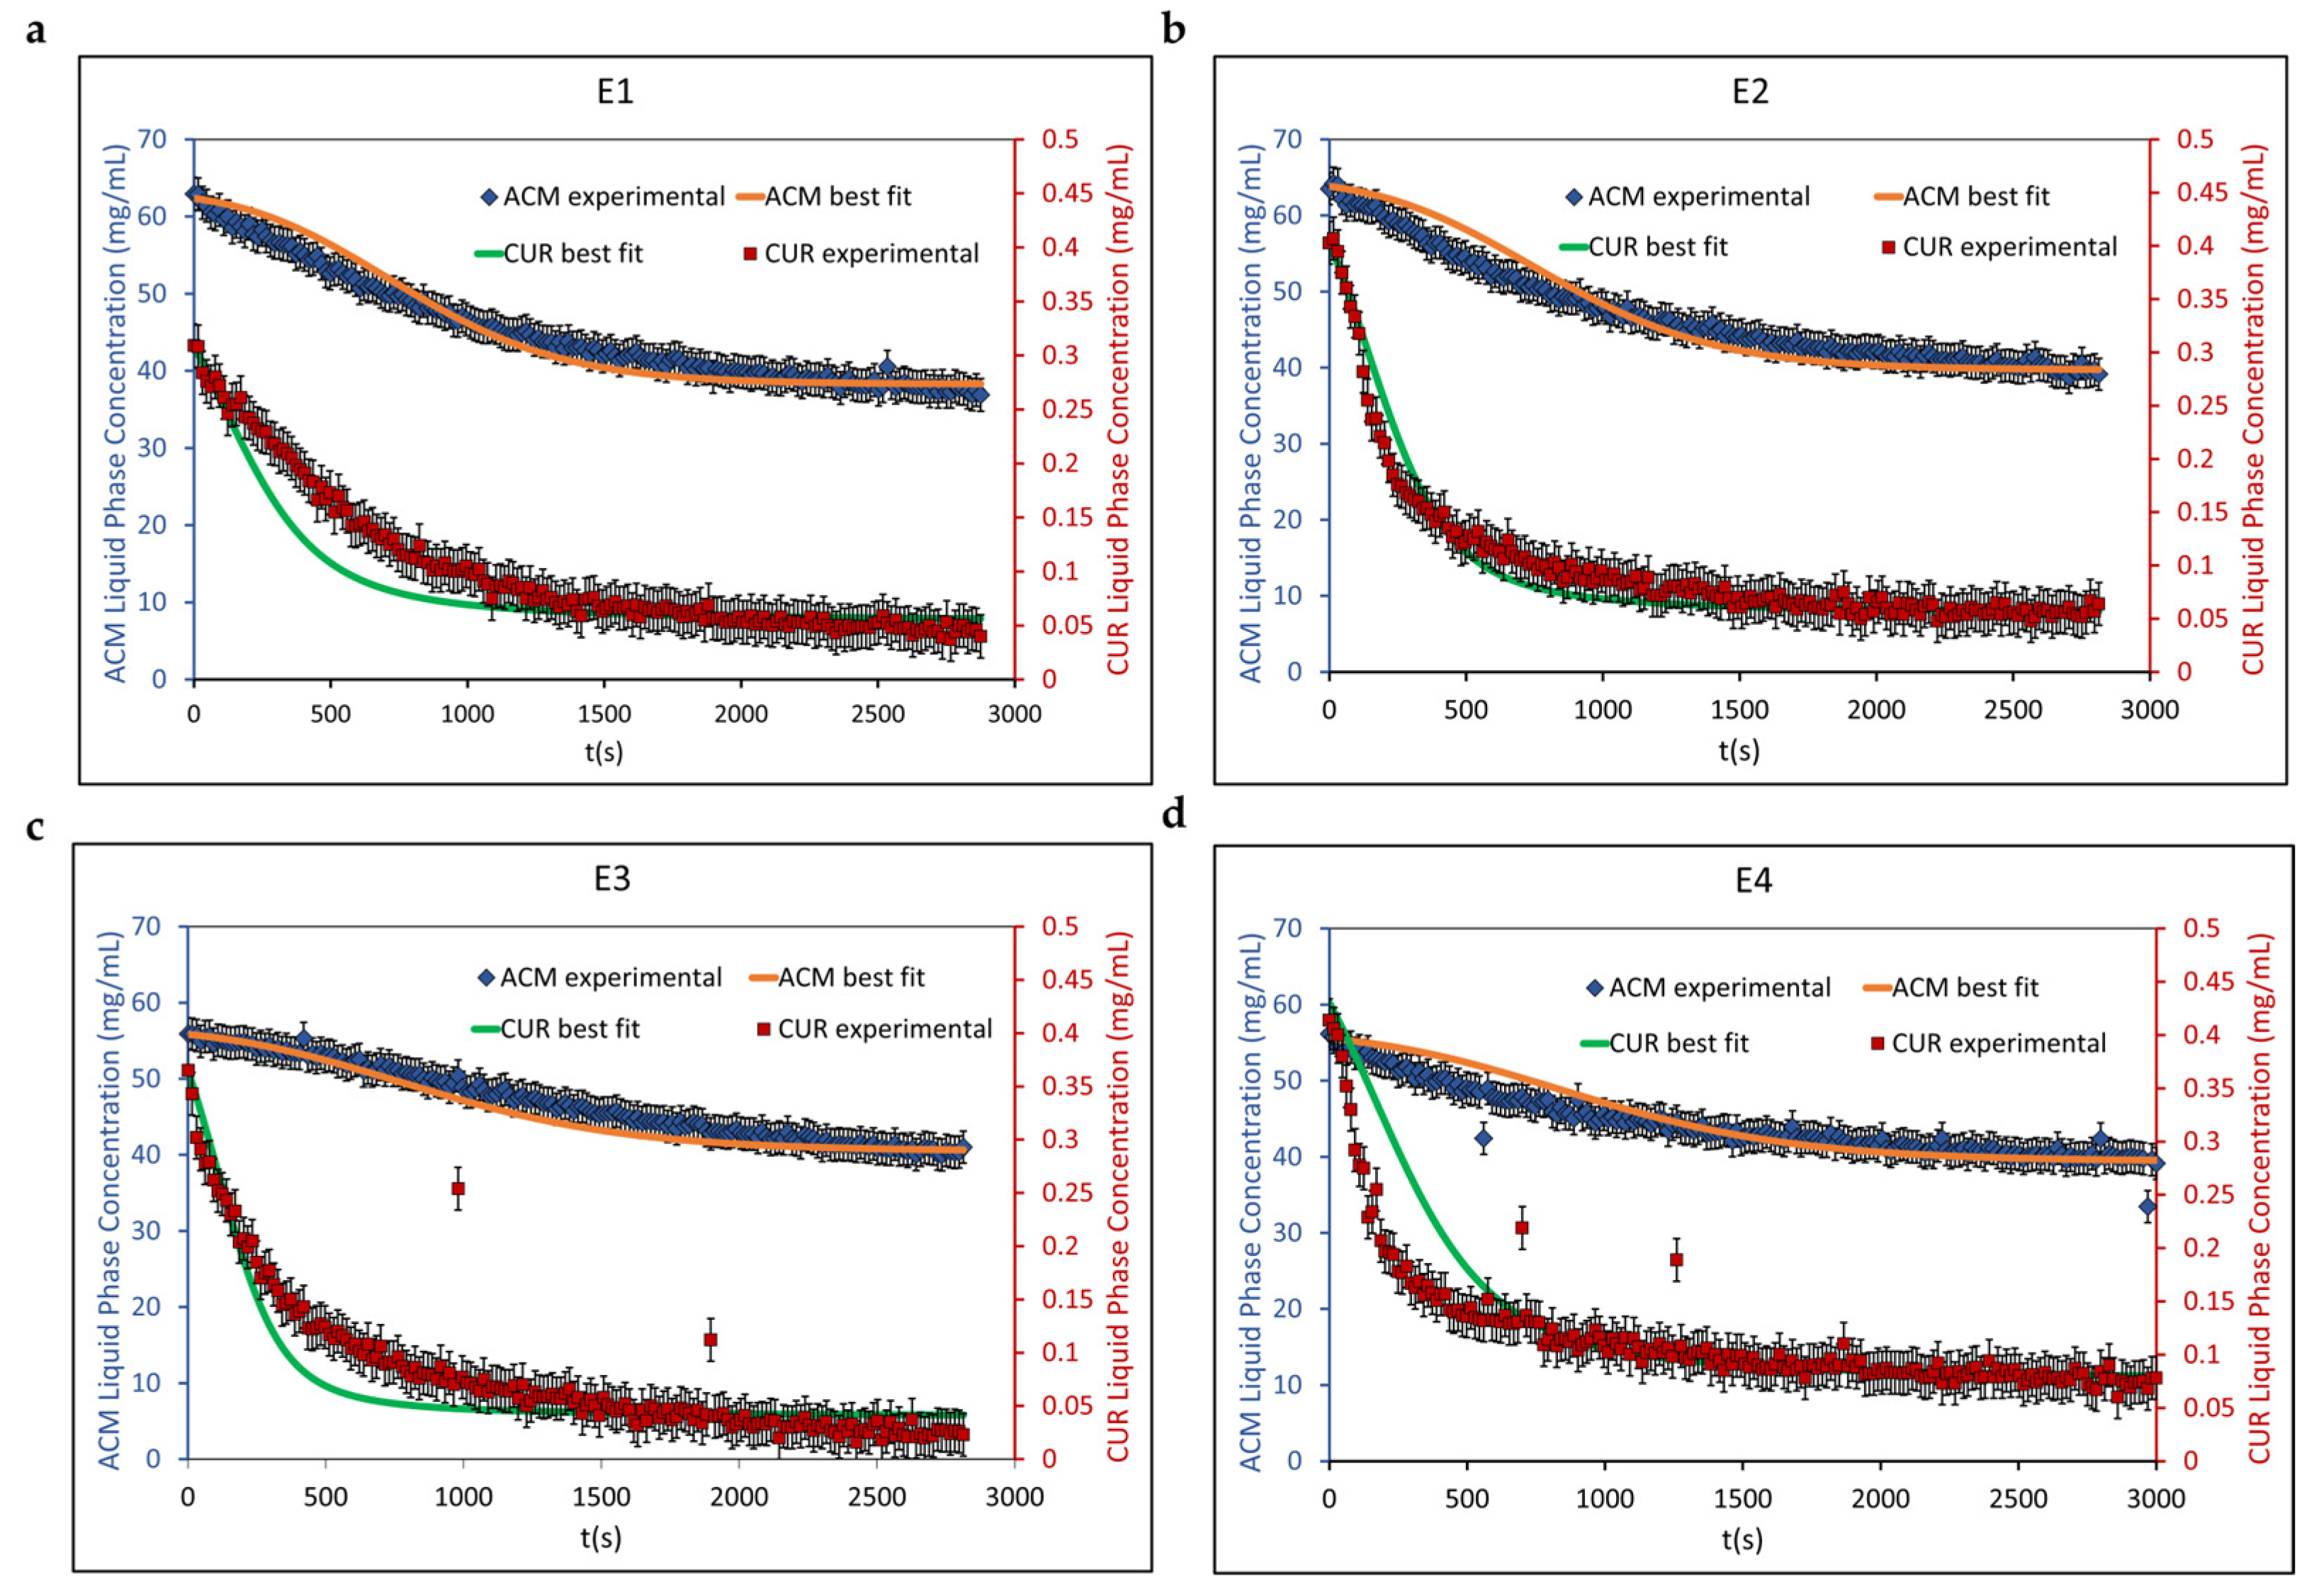
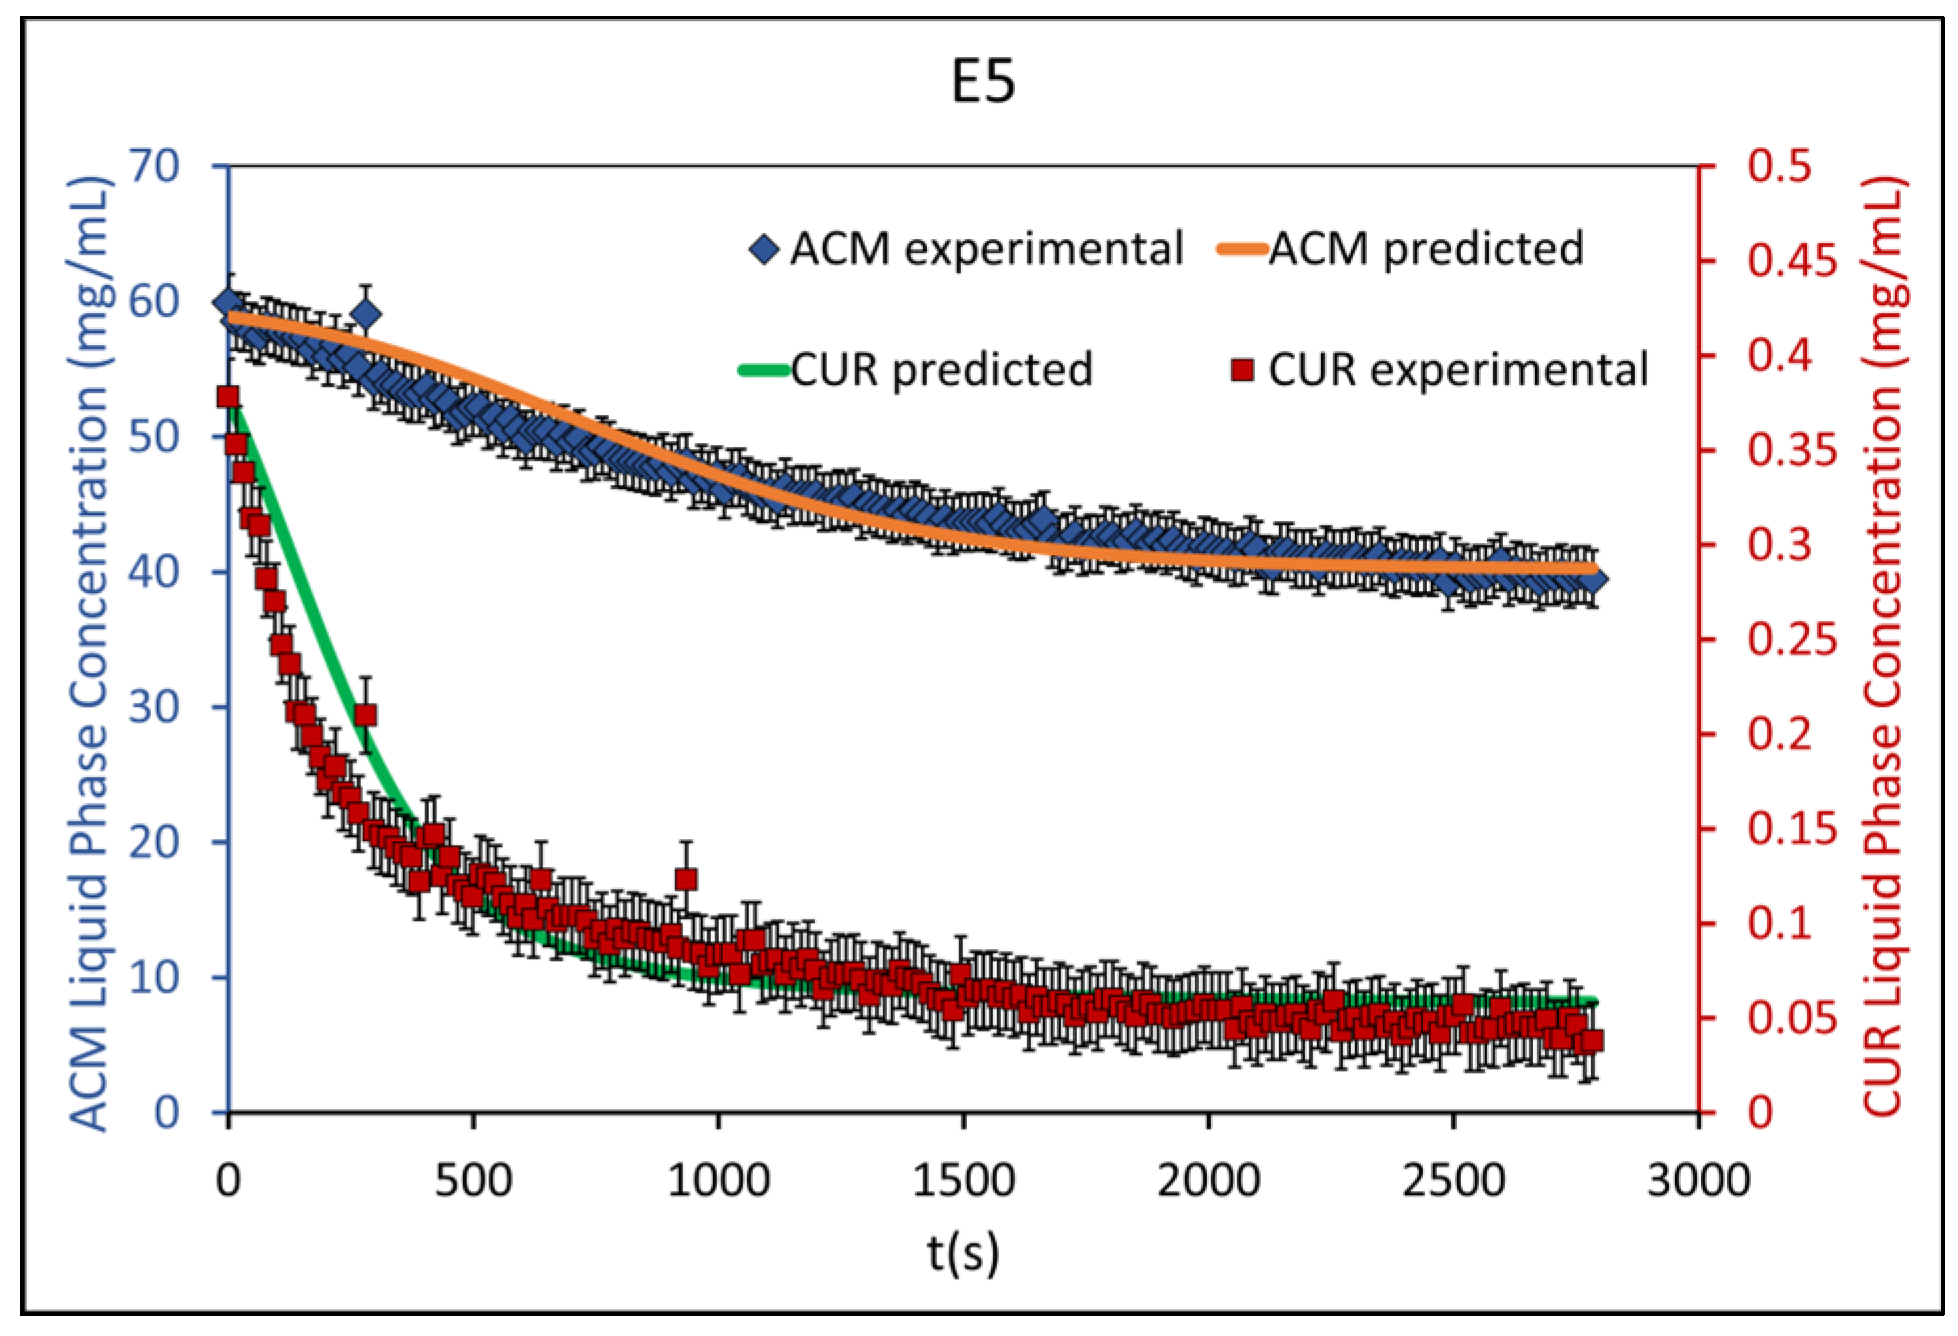
4.3. Population Balance Model Calibration and Validation Results

Calibration of the population balance model was based on E1–E4 in Table 1 and validated with E5. During the experiments, the ACM and CUR liquid-phase concentrations were measured in situ using Raman spectroscopy and the PLS model. Values for Cc, Pc,ACM, and Pc,CUR were obtained in situ from the solute concentrations before seeding and compared with the expected values from sample preparation. For Cs, Ps,ACM, and Ps,CUR, we used the weighted amounts of ACM and CUR in the seeds, normalized by the crystallization operating volume for Cs. Ps,ACM was 98.5% and Ps,CUR was 1.5% for all five experiments. The initial moments for the seeds were obtained from their particle width distribution, using Equations (12) and (13). A summary of the values for each experiment is provided in Table 2.
These values were added to the model as inputs to calculate the best fit to the desupersaturation rate (Equation (15)) for both ACM and CUR to the experimentally determined liquid concentrations from E1–E4 to calibrate the model. E5 was used to validate the model. The results for the desupersaturation of ACM and CUR for E1–E4 were generated using gPROMS FormulatedProducts and are illustrated in Figure 6.
The experimental data from E1–E3 exhibited a good fit to the population balance model. In E4, the population balance model was observed to overestimate the liquid-phase concentration for both ACM and CUR, within the first 10 min and 15 min after seeding, respectively. This may be due to the data collection starting late. The error bars in Figure 6 are based on the RMSEP from the PLS models (2.1 g/L for ACM and 0.02 g/L for CUR).
The desupersaturation profile for the validation experiment (E5, Figure 7) shows a good prediction of the population balance model for the ACM and CUR based on the experimental results. The growth supersaturation order (gi) gave a best fit at 1 for ACM and at 2 for CUR, which is within the typical range of values in which g is typically found (1.0–2.0, depending on the growth mechanism) [1,43]. The crystal growth rate constants (kg,i) for ACM and CUR were found to be 3.46 ± 0.08 µm/min and 0.45 ± 0.02 µm/min, respectively, based on a 95% confidence interval.

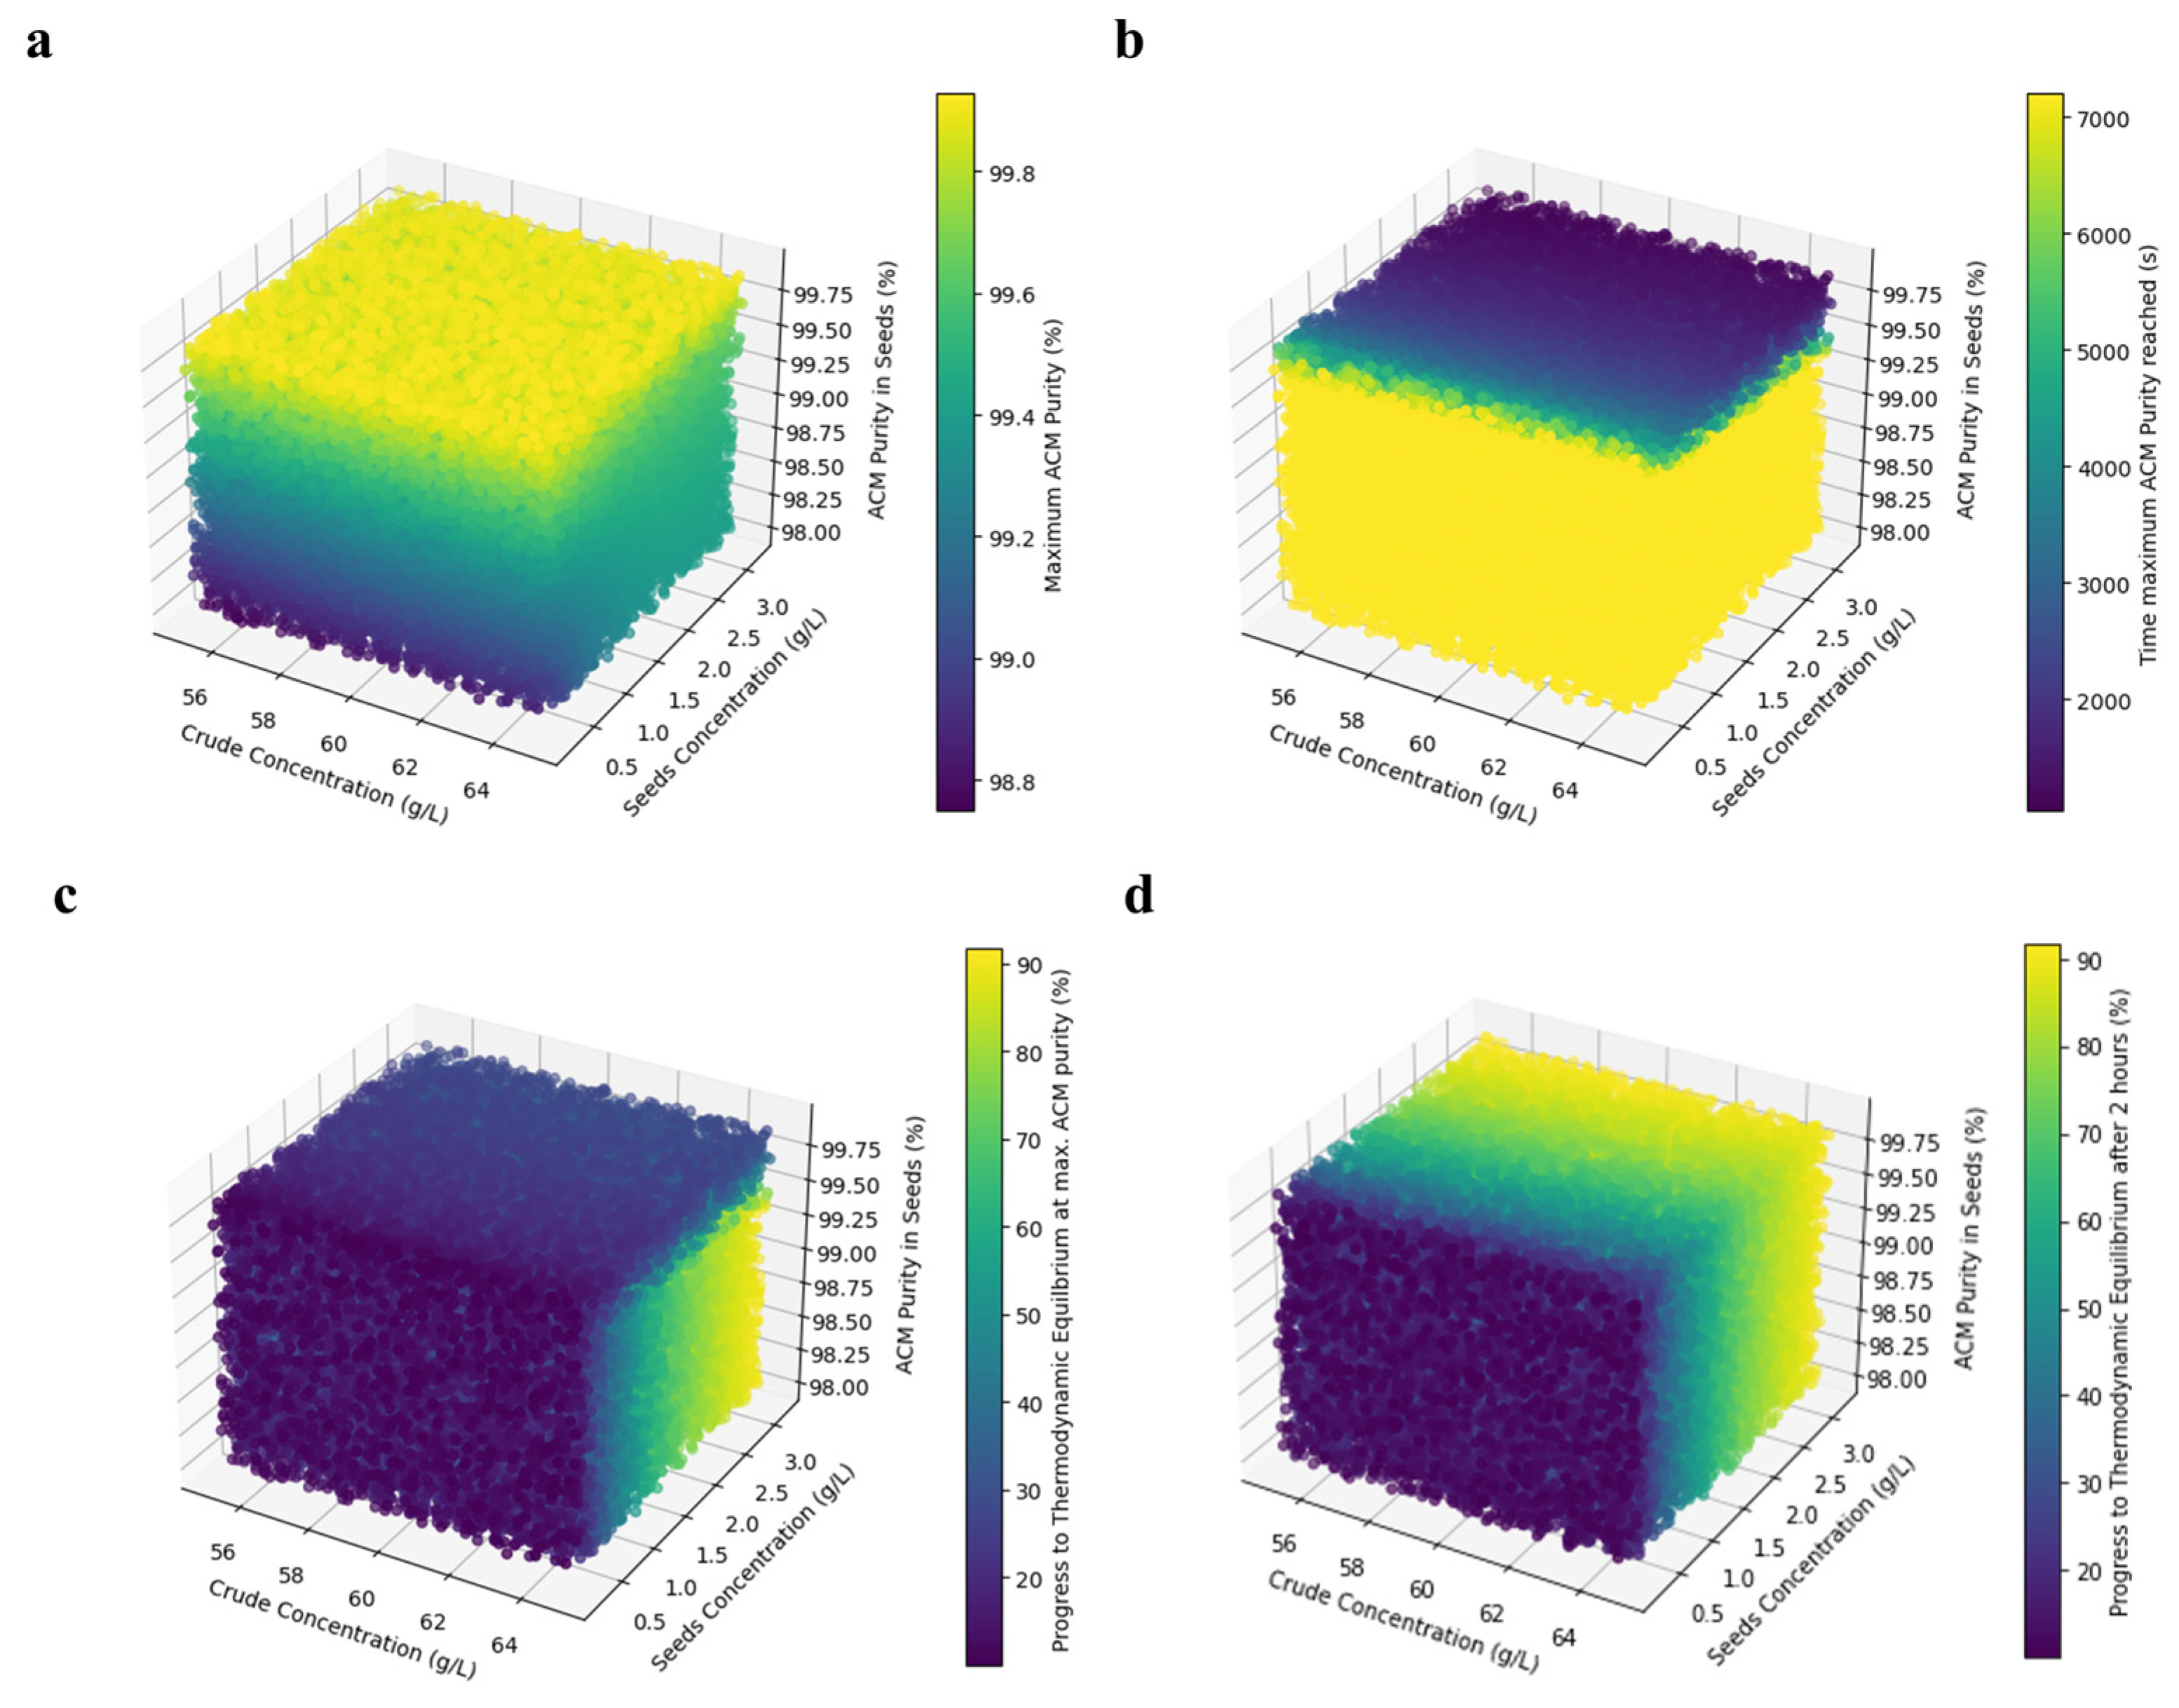
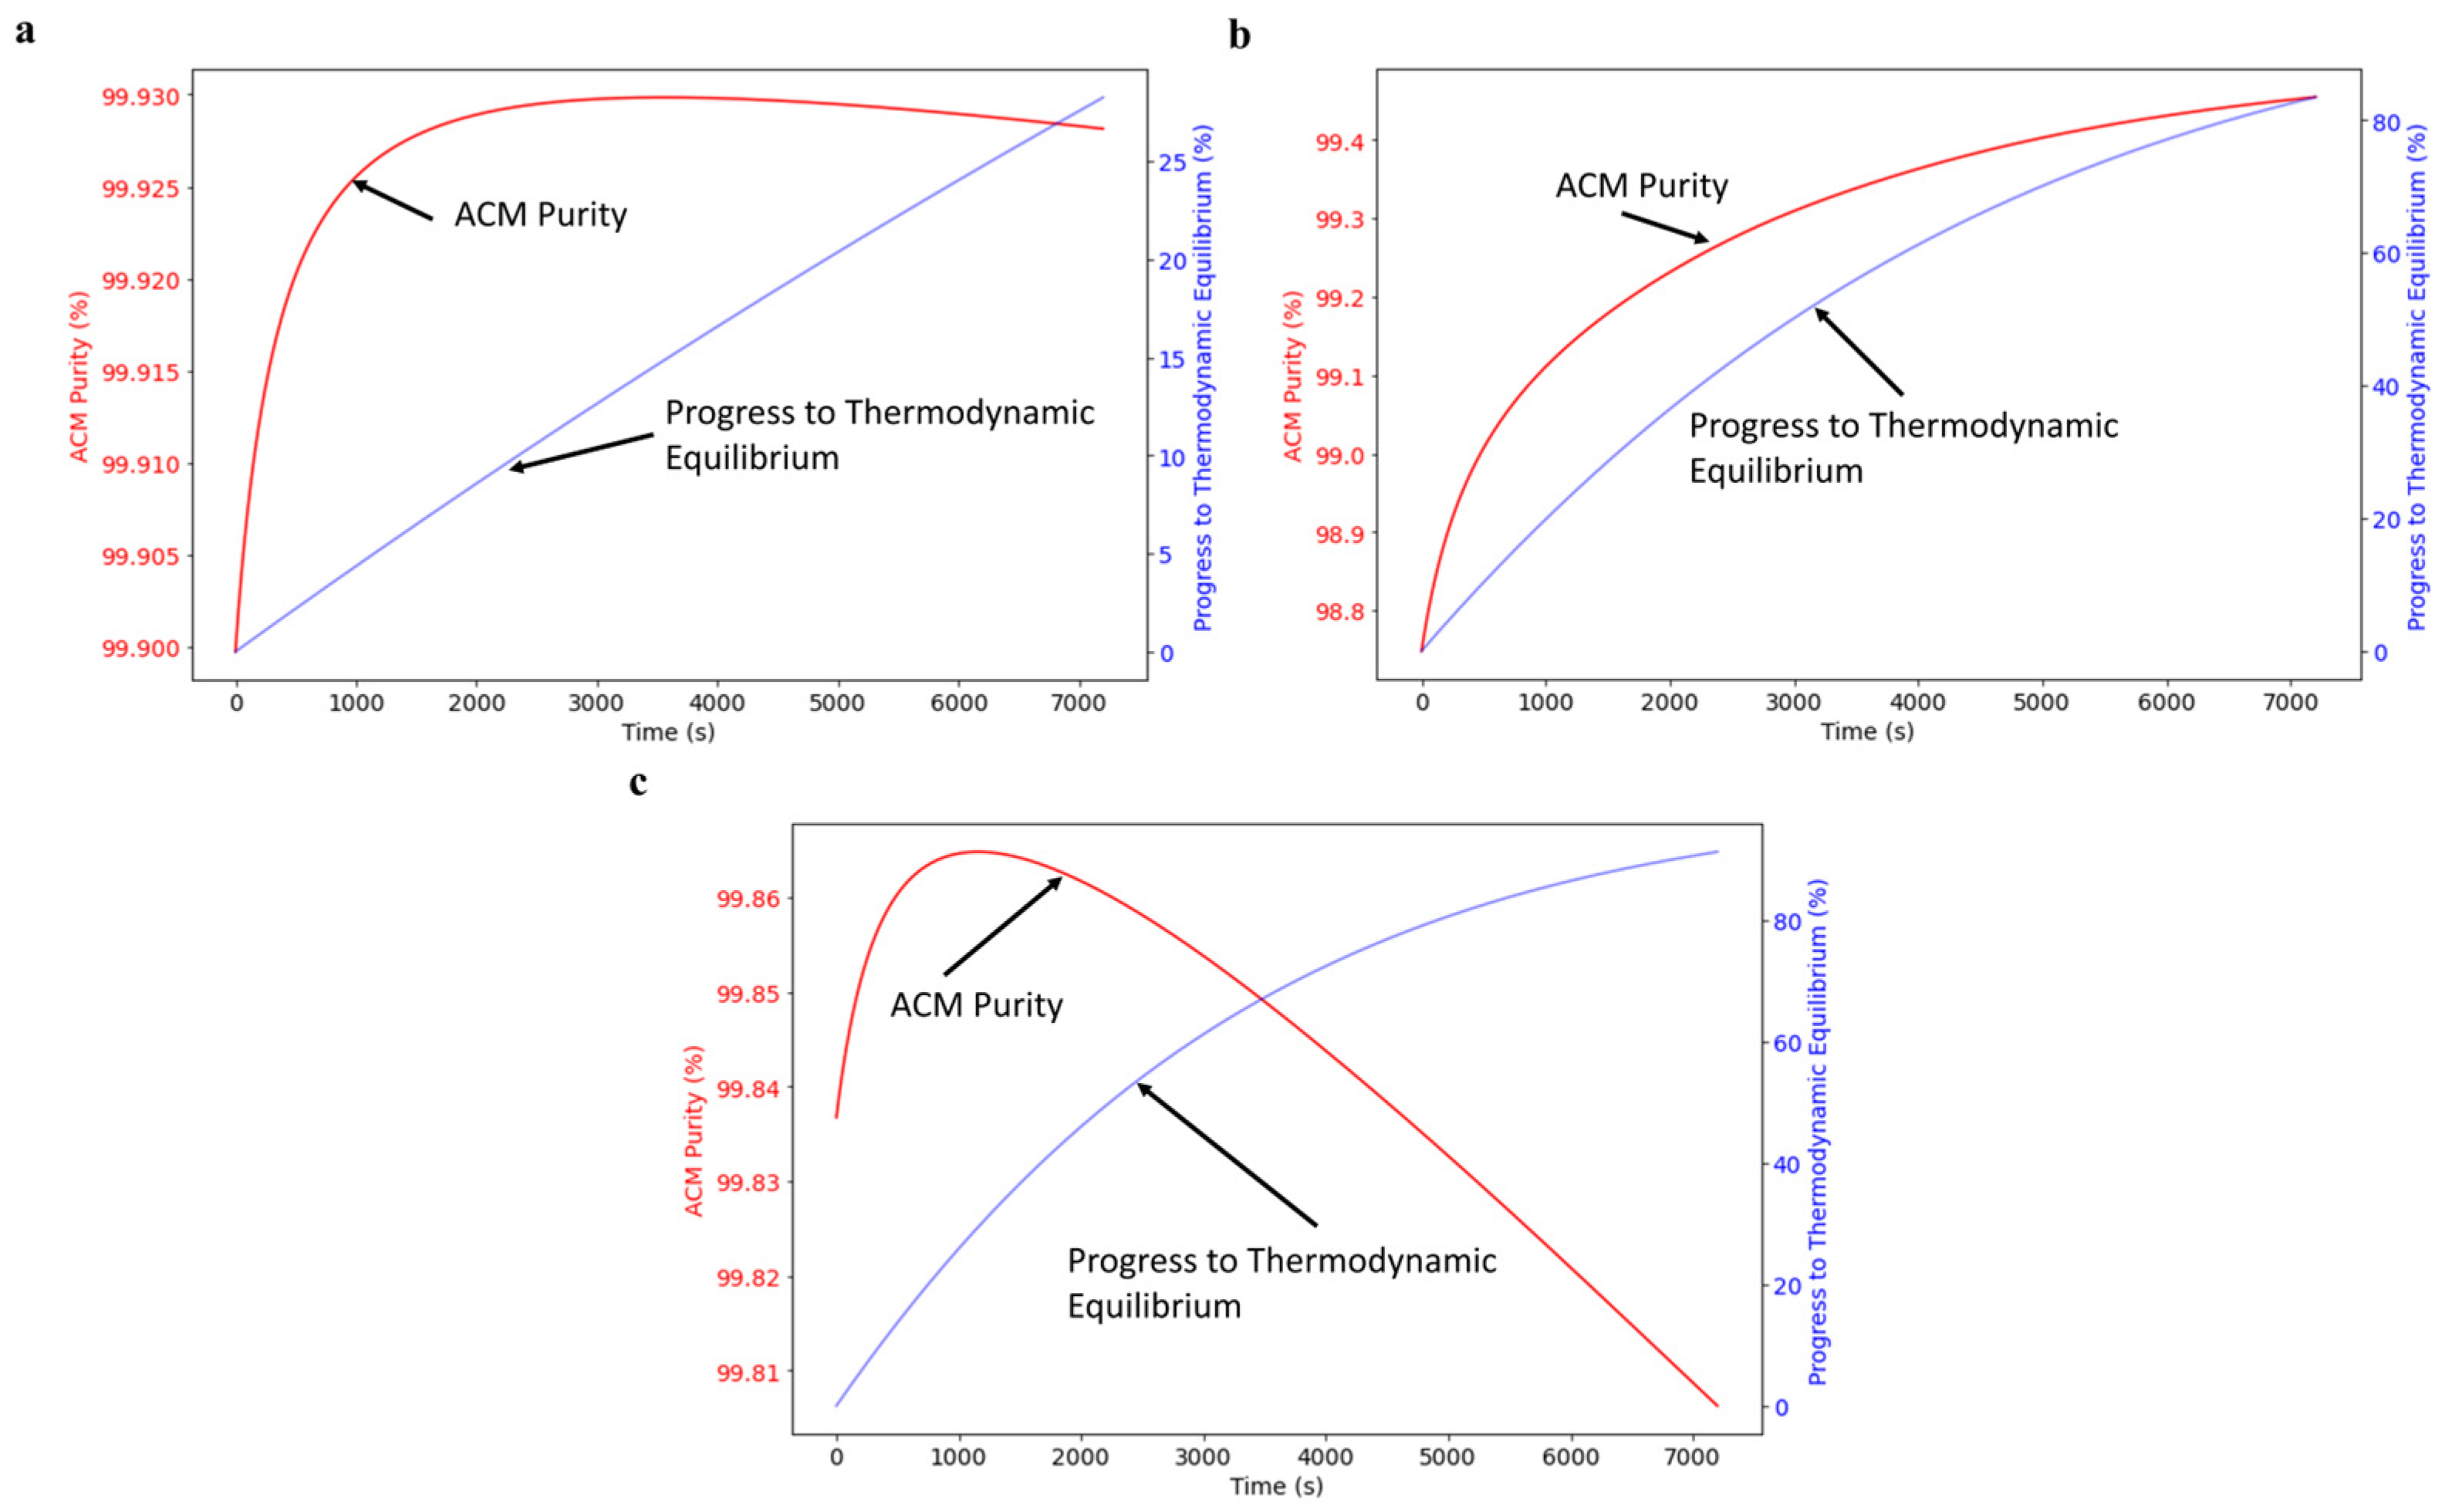
4.4. Process Optimization and Simulations

An optimization program was developed in Python with the purpose of determining the degree to which the maximum Pp,acm is affected by Cs, Ps,acm or Cc. The boundaries were set under the assumption that kinetic parameters are not affected by crystal surface area (i.e., they are independent of Cs and Ps), and using Cc that were not higher than those used for parameter estimation. Bounds for those variables were then set as follows:
0.08 g/L < Cs < 3.2 g/L
98.0% < Ps,acm < 99.9%
55 g/L < Cc < 65 g/L
Pc,acm was kept constant (in this case, Pc,acm of 99.75% was used) to reflect that industrially, the crude purity cannot be easily controlled. The crude concentration can be adjusted by evaporating the solvent or diluting the feed stock. The optimization code started with listing the model parameters and inputs, such as kg,i, gi, and Csat,i determined in Section 2.2. The inputs can be summarized in Table 3 below.
The simulations were run over a process time of 7200 s (2 h) to provide a feasible time for an industrial batch crystallization (typical times were 3000 s in Figure 6 and Figure 7). Next, the optimization was started by running a Monte Carlo simulation to initially generate 50,000 random values for Cc, Cs, and Ps,acm. The results of the Monte Carlo were used to calculate the Cml,i and MT,i for both ACM and CUR, which were then used to calculate Pp,acm and E,acm. In addition, the Eacm at which the maximum attainable Pp,acm was achieved for each simulation was also calculated.
Simulations that calculated the maximum Pp,acm as occurring when Eacm was less than 10% (max. Pp,acm is primarily an indication of seed purity) or greater than 99% (approaching thermodynamic equilibrium) were excluded from the analysis. These exclusions reduced the number of simulations from 50,000 to about 48,700.
Cc, Cs, and Ps,acm for the 48,700 simulations were plotted as 3D scatter plots to illustrate the degree to which each variable affects the maximum Pp,acm and the time this optimal point is reached. In addition, the time maximum Pp,acm was attained; the corresponding Eacm to the maximum Pp,acm, and Eacm at the end of the 2 h batch time were also plotted. The purpose of plotting the times was to examine the feasibility of the simulations in a batch process. The results of the 3D plots are illustrated in Figure 8.
Figure 8a shows that the maximum Pp,acm was affected most by Ps,acm, and purer seeds were also seen to have the lowest times to reach the optimal Pp,acm (Figure 8b). In addition, Figure 8b shows that the maximum Pp,acm is attainable within a reasonable batch time (<2 h). Cc and Cs did not have as noticeable an effect on the maximum Pp,acm, so using cleaner seeds is the best option for inhibiting the crystallization of the impurity in a SLIP 2 scenario. This behavior is to be expected as long as one can keep the impurity within the metastable zone (requires short crystallization times), with a negligible nucleation rate. If the impurity does not nucleate, the surface area available for growth is limited to the one provided by the seeds which, realistically, will never be completely pure in an industrial process. By keeping their ACM purity high, we’re selectively providing more surface area for ACM to grow, thus enhancing its kinetics over CUR’s. This can be performed via re-crystallization of the seed product (e.g., in the lab scale) before it is used in the industrial process. The total concentration of seeds (Cs) had a minor effect on the maximum attainable purity, as the latter is a function of the relative growth kinetics between ACM and CUR. By increasing seed concentrations, we’re offering more surface area for CUR to grow, but we’re doing the same for ACM. Overall, Figure 8 demonstrates the importance of seed purity over seed quantity, when it comes to the kinetic control of product purity.
Eacm was found to be the smallest (furthest away from equilibrium) at higher Ps,acm as well as at lower Cs (Figure 8c,d). Cc did not have a noticeable effect on Eacm. The figure also shows that even if more seeds are used, if they have a lower Ps,acm, then the maximum Pp,acm is not achieved until much further in the crystallization process. This is important to consider as more seeds means more surface area available for crystallization [44], for both the product and impurity. In addition, the combination of more seeds, dirtier seeds and more time could potentially lead to secondary nucleation of the impurity, so care must be taken to minimize crystallization time. Essentially, there is a tradeoff between Ps,acm and Cs in how far towards equilibrium the maximum Pp,acm is attained.
As a metric to determine the improvement in Pp,acm from when the maximum is reached to the Pp,acm at thermodynamic equilibrium, the ratio of the maximum Pp,acm determined over the Pp,acm achieved at equilibrium calculated from the mass balance (where Cml,i ≈ Csat,i) was taken. Most of the simulations attained their maximum Pp,acm at thermodynamic equilibrium (ratio = 1). However, some cases had a modest improvement in Pp,acm earlier in the process. The ratios were found to be between 1 and 1.004, corresponding to an improvement of up to 0.4%.
The simulations were also plotted in Python to examine the Pp,acm and Eacm over the batch time, as well as the time when the maximum Pp,acm was reached, the Eacm corresponding to when the maximum Pp,acm was attained, and the Cc, Cs, and Ps,acm that correspond to that simulation. Three simulations are plotted in Figure 9 for a case where the ACM seeds are very pure (Figure 9a), a case showing that maximum Pp,acm is not attained until thermodynamic equilibrium is reached (Figure 9b), and a case of worsening Pp,acm that can be seen earlier in the batch after the maximum is attained (Figure 9c).
The simulation process conditions (Ps,acm, Cs, and Cc), as well as the results for the maximum Pp,acm (t, Eacm, and Pp,acm at equilibrium), are listed in Table 4.
The highest Pp,acm attained among the simulations was 99.93%. The simulation with this maximum also had a Pp,acm that was 99.58% at equilibrium (Eq.). This simulation is illustrated in Figure 9a and will be called S1. In S1, the maximum Pp,acm was achieved in ~1 h and at ~13% towards reaching thermodynamic equilibrium. S1 can be seen as a scenario in which a very pure product can be obtained within a relatively short batch time, but it can also fall out of specifications if the crystallization goes on long enough. Thus, prolonging the crystallization step risks losing product purity over time.
S2 (Figure 9b) is a case where the maximum Pp,acm is not attained until the process reaches thermodynamic equilibrium, which is not ideal for kinetic control. S2 also has a high Cs and dirtier seeds than S1, so the process moves toward equilibrium faster. However, since there is more CUR in the seeds, there is more CUR enriched in the solid phase. However, since there is more CUR in the seeds, more CUR is enriched in the solid phase [14,15]. The ACM product only attains its optimum purity once the solution reaches equilibrium.
S3 is another case where purity can worsen as the process progresses towards equilibrium, though this is observed sooner than in S1. In this case, S3 attains its maximum Pp,acm 20 min after seeding, but then more CUR than ACM crystallizes out past this point as ACM crystallization slows down, resulting in Pp,acm decreasing from 99.87% to 99.55%. S3 has the largest Cs of the three cases, and since the seeds are very pure with ACM in both S1 and S3, the ACM crystallizes out quickly but then slows down. At this point, CUR is the predominantly crystallizing solute and the solids become dirtier. This case demonstrates the CUR impurity growth can only be controlled temporarily once the maximum Pp,acm is achieved, otherwise purity can decrease as more CUR crystallizes. A possible mitigation strategy for a scenario like this can be to stop the crystallization shortly after the optimal Pp,acm is reached before too much CUR is present in the solid phase, at the expense of yield.
In order to visualize the trade-off between yield and purity beyond the three presented simulations, attainable regions of Pp,acm and Eacm over Ps,acm were generated by plotting all values of product purity and progress to equilibrium, including purities outside the value for the maximum observed purity on a given experiment. Results are provided in Figure 10. This figure shows that the highest product purities are predominantly found in crystallizations starting with very pure seeds (high Ps,acm). Figure 10 illustrates that it is possible kinetically to attain a higher Pp,acm than that which is attainable at equilibrium (99.48 to 99.58%, based on the mass balance for the simulated feed concentrations and the provided solubilities), though unless sufficiently clean seeds are used, the optimal Pp,acm is only attained once the process reaches thermodynamic equilibrium.
Based on the optimization results and observations, the crystallization kinetics of an API with a precipitating, low-solubility impurity can be temporarily controlled by seeding with cleaner API seeds. However, it is difficult to maintain kinetic control in a system where a low-solubility impurity precipitates with an API, especially since pharmaceutical processes result in the formation of structurally similar impurities that can have similar kinetics or solubilities to the API [45]. In this context, the ACM and CUR system should be viewed as a best-case scenario where the impurity grows nearly ten times slower than the product. This is partially offset by the fact that the starting impurity supersaturation is much higher than the product’s. Based on our observations, the optimal approach to kinetically reject impurities requires (1) a low nucleation rate for the impurity, so that it is within the metastable zone throughout the process, (2) high seed purities, to selectively enhance the product’s mass deposition rate, and (3) a crystallization time that is adjusted so that the process can be stopped before equilibrium, without extending crystallization time to the point that the impurity will nucleate. The latter can be partially controlled with the total amount of seeds.

5. Conclusions

In this study, a population balance model for the concomitant crystallization of a product in the presence of a crystallizing impurity was developed. ACM and CUR were used as model compounds for a case where an API is paired with a poorly soluble, precipitating impurity. Four seeded antisolvent batch crystallization experiments were conducted utilizing Raman spectroscopy to track concentrations in situ, and then to calibrate the population balance model. A validation experiment then validated the model with a good fit between experimental data and predicted values.
The optimization demonstrated that controlling ACM seed purity had the strongest impact on the attainable maximum product purities. Most of the simulations reached the maximum product purity at thermodynamic equilibrium. However, there were cases where this maximum was attained earlier in the process (30 min–1 h after seeding). The population balance model demonstrated that a high product purity and near-equilibrium yields were both attainable within the first 2 h of crystallization, with appropriate control of seed purities. In addition, seed concentrations played a minor role in purity, despite their role accelerating the overall process. Overall, it is possible to control the crystallization kinetics of the impurity with seeding, allowing for a cleaner product before reaching thermodynamic equilibrium. However, this can only be performed temporarily and requires stopping the process early, taking some losses in yield.

Supplementary Materials

The following supporting information can be downloaded at: https://www.mdpi.com/article/10.3390/cryst13111569/s1, Figure S1: Raman spectra for pure ACM (a), pure CUR (b) and the 25/75 EtOH/H2O solvent (c); Figure S2: particle width distributions for ACM (a) and CUR (b) indicate little change in the number of small particles between the start of the crystallization and at equilibrium. These observations led to the assumption that secondary nucleation of ACM and CUR is negligible, and the primary kinetic mechanism is growth on the seed crystals; Table S1: model equations for parameter estimation, including equation size for gPROMS FormulatedProducts; Table S2: model parameters for the equations in Table S1, as they would be implemented to gPROMS FormulatedProducts; Table S3: model variables for the equations in Table S1, as they would be implemented to gPROMS FormulatedProducts.

Author Contributions

Conceptualization, M.P. and G.C.; methodology, M.P., I.B. and G.C.; software, I.B., M.F. and D.Y.; validation, M.P. and I.B.; formal analysis, M.P., I.B. and G.C.; investigation, M.P. and G.C.; resources, I.B., M.F., D.Y. and G.C.; data curation, M.P., I.B. and G.C.; writing—original draft preparation, M.P.; writing—review and editing, I.B., D.B. and G.C.; supervision, G.C.; project administration, G.C.; funding acquisition, G.C. All authors have read and agreed to the published version of the manuscript.

Funding

This research received no external funding.

Data Availability Statement

The data presented in this study are available upon request from the corresponding author.

Acknowledgments

We would like to thank Mettler Toledo for providing an EasyViewer 400 with prototype optics module for experimental use. Mitchell Paolello is grateful to Fredrik Nordstrom from Boehringer-Ingelheim for valuable discussions and feedback.

Conflicts of Interest

The authors declare no conflict of interest.

References

  1. Myerson, A.S.; Erdemir, D.; Lee, A.Y. Handbook of Industrial Crystallization, 3rd ed.; Cambridge University Press: Cambridge, UK, 2019. [Google Scholar]
  2. Erdemir, D.; Lee, A.Y.; Myerson, A.S. Nucleation of Crystals from Solution: Classical and Two-Step Models. Acc. Chem. Res. 2009, 42, 621–629. [Google Scholar] [CrossRef] [PubMed]
  3. Moynihan, H.; Horgan, D. Impurity Occurrence and Removal in Crystalline Products from Process Reactions. Org. Process Res. Dev. 2017, 21, 689–704. [Google Scholar] [CrossRef]
  4. Li, J.; Lai, T.C.; Trout, B.L.; Myerson, A.S. Continuous Crystallization of Cyclosporine: Effect of Operating Conditions on Yield and Purity. Cryst. Growth Des. 2017, 17, 1000–1007. [Google Scholar] [CrossRef]
  5. Rogers, L.; Briggs, N.; Achermann, R.; Adamo, A.; Azad, M.; Brnacazio, D.; Capellades, G.; Hammersmith, G.; Hart, T.; Imbrogno, J.; et al. Continuous Production of Five Active Pharmaceutical Ingredients in Flexible Plug-and-Play Modules: A Demonstration Campaign. Org. Process Res. Dev. 2020, 24, 2183–2196. [Google Scholar] [CrossRef]
  6. Kubota, N. Effect of Impurities on the Growth Kinetics of Crystals. Cryst. Res. Technol. 2001, 36, 749–769. [Google Scholar] [CrossRef]
  7. Capellades, G.; Bonsu, J.O.; Myerson, A.S. Impurity incorporation in solution crystallization: Diagnosis, prevention, and control. CrystEngComm 2022, 24, 1989–2001. [Google Scholar] [CrossRef]
  8. Capellades, G.; Wiemeyer, H.; Myerson, A.S. Mixed-Suspension, Mixed-Product Removal Studies of Ciprofloxacin from Pure and Crude Active Pharmaceutical Ingredients: The Role of Impurities on Solubility and Kinetics. Cryst. Growth Des. 2019, 19, 4008–4018. [Google Scholar] [CrossRef]
  9. Berkovitch-Yellin, Z.; Addadi, L.; Idelson, M.; Lahav, M.; Leiserowitz, L. Controlled Modification of Crystal Habit by “Tailor-Made” Impurities: Application to Benzamide. Angew. Chem. Int. Ed. Engl. 1982, 21, 631–632. [Google Scholar] [CrossRef]
  10. Addadi, L.; Berkovitch-Yellin, Z.; Weissbuch, I.; Van Mil, J.; Shimon, L.J.W.; Lahav, M.; Leiserowitz, L. Growth and Dissolution of Organic Crystals with “Tailor-Made” Inhibitors- Implications in Stereochemistry and Materials Science. Angew. Chem. Int. Ed. Engl. 1985, 24, 466–485. [Google Scholar] [CrossRef]
  11. Görög, S. The importance and the challenges of impurity profiling in modern pharmaceutical analysis. TrAC Trends Anal. Chem. 2006, 25, 755–757. [Google Scholar]
  12. Statement Alerting Patients and Health Care Professionals of NDMA Found in Samples of Ranitidine. Available online: https://www.fda.gov/news-events/press-announcements/statement-alerting-patients-and-health-care-professionals-ndma-found-samples-ranitidine (accessed on 13 September 2019).
  13. FDA Requests Removal of All Ranitidine Products (Zantac) from the Market. Available online: https://www.fda.gov/news-events/press-announcements/fda-requests-removal-all-ranitidine-products-zantac-market (accessed on 1 April 2020).
  14. Nordstrom, F.L.; Sirota, E.; Hartmanshenn, C.; Kwok, T.T.; Paolello, M.; Li, H.; Abeyta, V.; Bramante, T.; Madrigal, E.; Behre, T.; et al. Prevalence of Impurity Retention Mechanisms in Pharmaceutical Crystallizations. Org. Process Res. Dev. 2023, 27, 723–741. [Google Scholar] [CrossRef]
  15. Nordstrom, F.L.; Linehan, B.; Teerakapibal, R.; Li, H. Solubility-Limited Impurity Purge in Crystallization. Cryst. Growth Des. 2019, 19, 1336–1346. [Google Scholar] [CrossRef]
  16. Tung, H.-H.; Paul, E.L.; Midler, M.; McCauley, J.A. Crystallization of Organic Compounds: An Industrial Perspective, 1st ed.; John Wiley & Sons: Hoboken, NJ, USA, 2009. [Google Scholar]
  17. Heffernan, C.; Soto, R.; Hodnett, B.K.; Rasmuson, A.C. Growth Kinetics of curcumin form I. CrystEngComm 2020, 22, 3505–3518. [Google Scholar] [CrossRef]
  18. Gornicka, J.; Mika, M.; Wroblewska, O.; Siudem, P.; Paradowska, K. Methods to Improve the Solubility of Curcumin from Turmeric. Life 2023, 13, 207. [Google Scholar] [CrossRef] [PubMed]
  19. Liu, J.; Svärd, M.; Hippen, P.; Rasmuson, A.C. Solubility and Crystal Nucleation in Organic Solvents of Two Polymorphs of Curcumin. J. Pharm. Sci. 2015, 104, 2183–2189. [Google Scholar] [CrossRef]
  20. Gao, Y.; Zhang, T.; Ma, Y.; Xue, F.; Gao, Z.; Hou, B.; Gong, J. Application of PAT-Based Feedback Control Approaches in Pharmaceutical Crystallization. Crystals 2021, 11, 221. [Google Scholar] [CrossRef]
  21. Simone, E.; Zhang, W.; Nagy, Z.K. Application of Process Analytical Technology-Based Feedback Control Strategies To Improve Purity and Size Distribution in Biopharmaceutical Crystallization. Cryst. Growth Des. 2015, 15, 2908–2919. [Google Scholar] [CrossRef]
  22. Howard, K.S.; Nagy, Z.K.; Saha, B.; Robertson, A.L.; Steele, G.; Martin, D. A Process Analytical Technology Based Investigation of the Polymorphic Transformations during the Antisolvent Crystallization of Sodium Benzoate from IPA/Water Mixture. Cryst. Growth Des. 2009, 9, 3964–3975. [Google Scholar] [CrossRef]
  23. Sheng, F.; Chow, P.S.; Yu, Z.Q.; Tan, R.B.H. Online Classification of Mixed Co-Crystal and Solute Suspensions using Raman Spectroscopy. Org. Process Res. Dev. 2016, 20, 1068–1074. [Google Scholar] [CrossRef]
  24. Nicoud, L.; Licordari, F.; Myerson, A.S. Polymorph control in batch seeded crystallizers. A case study with paracetamol. CrystEngComm 2019, 21, 2105–2118. [Google Scholar] [CrossRef]
  25. Kachrimanis, K.; Braun, D.E.; Griesser, U.J. Quantitative analysis of paracetamol polymorphs in powder mixtures by FT-Raman spectroscopy and PLS regression. J. Pharm. Biomed. Anal. 2007, 43, 407–412. [Google Scholar] [CrossRef]
  26. Simone, E.; Saleemi, A.N.; Nagy, Z.K. Application of quantitative Raman spectroscopy for the monitoring of polymorphic transformation in crystallization processes using a good calibration practice procedure. Chem. Eng. Res. Des. 2014, 92, 594–611. [Google Scholar] [CrossRef]
  27. Hu, Y.; Liang, J.K.; Myerson, A.S.; Taylor, L.S. Crystallization Monitoring by Raman Spectroscopy:  Simultaneous Measurement of Desupersaturation Profile and Polymorphic Form in Flufenamic Acid Systems. Ind. Eng. Chem. Res. 2005, 44, 1233–1240. [Google Scholar] [CrossRef]
  28. Simone, E.; Saleemi, A.N.; Tonnon, N.; Nagy, Z.K. Active Polymorphic Feedback Control of Crystallization Processes Using a Combined Raman and ATR-UV/Vis Spectroscopy Approach. Cryst. Growth Des. 2014, 14, 1839–1850. [Google Scholar] [CrossRef]
  29. Ündey, C.; Ertunc, S.; Mistretta, T.; Looze, B. Applied advanced process analytics in biopharmaceutical manufacturing: Challenges and prospects in real-time monitoring and control. J. Process Control 2010, 20, 1009–1018. [Google Scholar] [CrossRef]
  30. Schall, J.M.; Capellades, G.; Myerson, A.S. Methods for estimating supersaturation in antisolvent crystallization systems. CrystEngComm 2019, 21, 5811–5817. [Google Scholar] [CrossRef]
  31. Na, H.-S.; Arnold, S.; Myerson, A.S. Water activity in supersaturated aqueous solutions of organic solutes. J. Cryst. Growth 1995, 149, 229–235. [Google Scholar] [CrossRef]
  32. Schall, J.M.; Mandur, J.S.; Braatz, R.D.; Myerson, A.S. Nucleation and Growth Kinetics for Combined Cooling and Antisolvent Crystallization in a Mixed-Suspension, Mixed-Product Removal System: Estimating Solvent Dependency. Cryst. Growth Des. 2018, 18, 1560–1570. [Google Scholar] [CrossRef]
  33. Omar, H.M.; Rohani, S. Crystal Population Balance Formulation and Solution Methods: A Review. Cryst. Growth Des. 2017, 17, 4028–4041. [Google Scholar] [CrossRef]
  34. Borsos, Á.; Lakatos, B.G. Investigation and simulation of crystallization of high aspect ratio crystals with fragmentation. Chem. Eng. Res. Des. 2014, 92, 1133–1141. [Google Scholar] [CrossRef]
  35. Szilágy, B.; Lakatos, B.G. Model-based analysis of stirred cooling crystallizer of high aspect ratio crystals with linwar and nonlinear breakage. Comput. Chem. Eng. 2017, 98, 180–196. [Google Scholar] [CrossRef]
  36. Fytopoulos, A.A.; Kavousanakis, M.E.; Van Gerven, T.; Boudouvis, A.G.; Stefanidis, G.D.; Xiouras, C. Crystal Growth, Dissolution, and Agglomeration Kinetics of Sodium Chlorate. Ind. Eng. Chem. Res. 2021, 60, 7367–7384. [Google Scholar] [CrossRef]
  37. Schöll, J.; Lindenberg, C.; Vicum, L.; Borzio, J.; Mazzotti, M. Precipitation of α-glutamic acid: Determination of growth kinetics. Faraday Discuss. 2007, 136, 247–264. [Google Scholar] [CrossRef] [PubMed]
  38. Capellades, G.; Joshi, P.U.; Dam-Johansen, K.; Mealy, M.J.; Christensen, T.V.; Kiil, S. Characterization of a Multistage Continuous MSMPR Crystallization Process Assisted by Image Analysis of Elongated Crystals. Cryst. Growth Des. 2018, 18, 6455–6469. [Google Scholar] [CrossRef]
  39. Geladi, P.; Kowalski, B.R. Partial least-squares regression: A tutorial. Anal. Chim. Acta 1986, 185, 1–17. [Google Scholar] [CrossRef]
  40. Rosipal, R.; Krämer, N. Overview and recent advances in partial least squares. In Subspace, Latent Structure and Feature Selection; Springer: Berlin/Heidelberg, Germany, 2006; pp. 34–51. [Google Scholar]
  41. Quillo, G.L.; Bhonsdale, S.; Gielen, B.; Van Impe, J.F.; Collas, A.; Xiouras, C. Crystal Growth Kinetics of an Industrial Active Pharmaceutical Ingredient: Implications of Different Representations of Supersaturation and Simultaneous Growth Mechanisms. Cryst. Growth Des. 2021, 21, 5403–5420. [Google Scholar] [CrossRef]
  42. Mitchell, N.A.; Ó’Ciardhá, C.T.; Frawley, P.J. Estimation of the growth kinetics for the cooling crystallization of paracetamol and ethanol solutions. J. Cryst. Growth 2011, 328, 39–49. [Google Scholar] [CrossRef]
  43. Soto, R.; Rasmuson, A.C. Crystal Growth Kinetics of Piracetam Polymorphs in Ethanol and Isopropanol. Cryst. Growth Des. 2019, 19, 4273–4286. [Google Scholar] [CrossRef]
  44. Parambil, J.V.; Heng, J.Y.Y. Seeding in Crystallisation. In Engineering Crystallography: From Molecule to Crystal to Functional Form. NATO Science for Peace and Security Series A: Chemistry and Biology; Roberts, K., Docherty, R., Tamura, R., Eds.; Springer: Dordrecht, The Netherlands, 2017. [Google Scholar] [CrossRef]
  45. Teerakapibal, R.; Li, H.; Linehan, B.; Nordstrom, F.L. Material Impurity Distribution of Lattice-Incorporated Impurities in Salicylic Acid. Cryst. Growth Des. 2020, 20, 1716–1728. [Google Scholar] [CrossRef]
Figure 1. Molecular structures of acetaminophen (left) and curcumin (right).
Crystals 13 01569 g001
Figure 2. Raw Raman spectra of 60 samples (identified by color) during a batch crystallization process.
Crystals 13 01569 g002
Figure 3. PLS quantification models for ACM (a) and CUR (b) liquid concentrations, together with their “Fit” lines, which model the entire set of points (both calibration and cross-validation), and the 1:1 lines, which serve as a visual aid to determine the linearity of the results.
Crystals 13 01569 g003
Figure 4. Updated PLS quantification models for ACM (a) and CUR (b) liquid concentrations. The “Fit” lines model the entire set of points (both calibration and cross-validation), and the 1:1 lines serve as a visual aid to determine the linearity of the results. The blue dots are the fit for all the samples used to update the model.
Crystals 13 01569 g004
Figure 5. EasyViewer 400—back-lighting images showing negligible change in crystal size distributions for both ACM (a) and CUR (b), leading to the assumption that nucleation is negligible at these conditions.
Crystals 13 01569 g005
Figure 6. Best fits from the population balance model to experimental data for the four experiments involved in model calibration (E1–E4, as plots ad).
Crystals 13 01569 g006
Figure 7. Experimental mother liquor concentration data for ACM and CUR in the validation experiment (E5, Table 1), plotted against the model prediction.
Crystals 13 01569 g007
Figure 8. Three-dimensional plots over the boundary ranges of crude concentration, seed concentration and ACM purity in the seeds, examining the max. ACM purity (a), the time when the maximum ACM purity is reached (b), the progress to thermodynamic equilibrium when the max. purity is obtained (c), and the progress to equilibrium after the 2 h batch time (d).
Crystals 13 01569 g008
Figure 9. The plots show a simulation with very pure ACM seeds (a), the maximum Pp,acm not attained until equilibrium (b), and an initial improvement and later worsening in purity over time (c).
Crystals 13 01569 g009
Figure 10. Attainable region for all values of Pp,acm and Eacm across Ps,acm in the simulations.
Crystals 13 01569 g010
Table 1. Model calibration (Exp 1–4) and validation (Exp 5) experimental settings.
Exp SettingSoluteE1E2E3E4E5
Feed Concentration, pre seed
(g/L)
ACM60.960.954.054.057.5
CUR0.290.430.290.360.36
Initial supersaturation, pre seed (t = 0)ACM0.570.570.450.450.52
CUR2.172.572.172.392.39
Table 2. Provided variables from experiments used for model calibration and validation.
Provided VariableSoluteE1E2E3E4E5
Cc (g/L)-63.3764.2356.2155.9760.24
Cs (g/L)-1.591.591.601.601.59
Pc (wt. %)ACM99.5199.3799.3999.2399.36
CUR0.490.630.610.770.64
Table 3. Input parameters and variables used as assumptions for the optimization simulations.
Input (Units)Variable
kg,ACM (μm/min)3.46
kg,CUR (μm/min)0.45
gACM1
gCUR2
kv,ACM1
kv,CUR1
ρACM (g/mL)1.293
ρCUR (g/mL)1.293
Csat,ACM (g/L)34.3
Csat,CUR (g/L)0.033
Table 4. Simulation process conditions and results.
Process ConditionsResults for Max. Purity
VariablePs,acmCsCcMax. Pp,acmt, Max. Pp,acm AttainedE,acm at Max. Pp,acmPp,acm at Eq.
Units (%)(g/L)(g/L)(%)(s)(%)(%)
S199.900.5164.9199.93355712.599.58
S2 98.752.4561.4699.49Eq.Eq.99.49
S399.843.1256.4399.87115729.499.55
Disclaimer/Publisher’s Note: The statements, opinions and data contained in all publications are solely those of the individual author(s) and contributor(s) and not of MDPI and/or the editor(s). MDPI and/or the editor(s) disclaim responsibility for any injury to people or property resulting from any ideas, methods, instructions or products referred to in the content.

