1. Introduction
Currently, ferrimagnetic materials with a compensation temperature are well known [
1]. The magnetic compensation temperature T
m is a special point on the temperature dependence of the magnetization of a ferrimagnet at which the magnetizations of oppositely directed magnetic sublattices fully compensate one other and the total spontaneous magnetization of the material becomes zero. The theoretical analysis of the behavior of a multi-sublattice ferrimagnet in an external magnetic field allows the prediction of the existence of three magnetic phases that exist in certain temperature ranges [
2]. At low temperatures, the magnetizations of non-equivalent sublattices are antiparallel to each other and collinear with the magnetic field; the resulting magnetization decreases with increasing temperature. At temperatures above T
m, a collinear magnetic structure is realized, with magnetization directions of the sublattices inverted with respect to the low-temperature interval.
In the vicinity of the compensation point, the occurrence of a non-collinear (canted) phase is predicted. In this case, the sublattice magnetizations are non-collinear to each other as well as to the external magnetic field.
Thin films of compensated ferrimagnets based on the combination of rare-earth and transition metals having alloy or multilayer forms are currently considered key materials for spintronics and other modern technology [
3]. Thin films of Mn
4N also demonstrate non-collinear ferrimagnetism and are interesting materials for spintronics applications [
4]. Modern investigations of great interest for fundamental physics and applications relate to ultrafast magnetism and optical switching. The prospective materials to explore these phenomena in the non-collinear phase near the magnetization compensation point are thin ferrimagnetic films based on a combination of rare-earth and transition metals [
5], such as on cation-substituted iron garnets [
6,
7,
8].
According to molecular field theory, the temperature range of the existence of the non-collinear magnetic structure expands with increasing magnetic field up to the disappearance of collinear magnetic structures [
2,
9,
10]. However, as far as the authors are aware, this finding has not been experimentally confirmed.
The aim of this work was to experimentally detect and investigate various magnetic phases near the spin-reorientation transition caused by temperature. We studied thin magnetic films of cation-substituted iron garnet using by two types of samples. The samples of the first type had three magnetic sublattices related to iron ions in octahedral garnet positions, iron in tetrahedral positions, and rare-earth gadolinium ions in dodecahedral positions. The second type of samples had two magnetic sublattices represented by octahedral and tetrahedral iron, while all other cations, including rare-earth metals in dodecahedral positions, were non-magnetic ones. To visualize the magnetic phases, we applied the magneto-optical Faraday effect, following the approach proposed in [
11]. In order to enhance the Faraday rotation, we selected samples of bismuth-containing garnets. To produce different magnetic phases, we applied the lateral temperature gradient in the film plane. The controlled temperature gradient provides the possibility of observing different magnetic phases in the same sample at the same external magnetic field values.
2. Samples
Two series of 5 µm thick and 10 × 10 mm bismuth iron garnet films were prepared for experiments using liquid-phase epitaxy [
12]. The first type of film, (BiGd)
3(FeGa)
5O
12, contained magnetic Gd
3+ (spin I = 5/2) ions in the dodecahedral garnets’ positions and magnetic ions Fe
3+ (spin I = 3/2) in both the tetrahedral and octahedral positions. As a result, there were three magnetic sublattices. The second type film, (BiYLu)
3(FeGa)
5O
12, had only two magnetic sublattices caused by iron ions.
In both compositions, a small amount of the diamagnetic Ga
3+ ions substituted the magnetic iron ions. Gallium ions have a preference to occupy tetrahedral positions and dilute the largest iron sublattice. Such diamagnetic dilutions play a primary role in precise tuning the compensation temperature in the second type of samples where the dodecahedral sublattice remained completely non-magnetic. The content of magnetic Gd
3+ ions in dodecahedral positions was the main contributor to the compensation temperature for the first type of sample. Bismuth, in both compositions, enhances the Faraday rotation, which has achieved record values in ferrites based on it [
12,
13,
14].
A monocrystalline plate of (GdCa)3(GaMgZr)5O12 garnet was used as the substrate for the epitaxial synthesis of the bismuth gadolinium iron garnet (first type sample). For the second-type film, a plate of Gd3Ga5O12 garnet crystal was used as the substrate. Both substrates were plates oriented in the (111) crystal plane.
The magnetic state of the epitaxial films of iron garnet significantly depends on the mismatch between film and substrate lattice parameters. The parameters of the crystal structure of the film, aF, and of the substrate, aS, give the mismatch parameter Δa = aF − aS. Large values of the mismatch parameter Δa lead to the appearance of large magnetoelastic stresses and a change in the magnetic anisotropy. We minimized this parameter by choosing the type of substrate and the concentration of ions with the required values of ionic radii. Thus, to synthesize the films of the first type of garnet having elements of a large ionic radius, we used a (GdCa)3(GaMgZr)5O12 substrate with a large cell parameter a = 1.2495 nm. Gadolinium gallium garnet Gd3Ga5O12 with a smaller cell parameter, a = 1.2373 nm, was the substrate for the second type of film having the minimum number of big ions.
To measure the mismatch parameter Δa for the studied samples, we applied the X-ray diffraction method, which resulted in Δa
1 = 0.0006 nm for the first type of sample and Δa
2 = 0.0003 nm for the second type of sample. To estimate crystalline quality, we utilized X-ray rocking curves, which broaden the diffraction peaks. The half-width of the rocking curves did not exceed 15.0″–15.5″ for the used films. Some synthesis condition details and the XRD crystal quality assessment are provided in the
Supplementary Materials (Tables S1 and S2, Figure S1).
The ferromagnetic resonance measurements show that both magnetic films demonstrated magnetic anisotropy of the “easy–axis” type at room temperature so that the direction of the easy axis was perpendicular to the film plane. This result is in good agreement with the shape of the domain structure observed by means of the Faraday effect at room temperature too.
The chemical composition of the magnetic films (
Table 1 and
Table 2) was determined via electron probe microanalysis using a Jeol JSM-6480LV (Tokyo, Japan) scanning electron microscope with an INCA X-Maxn energy-dispersive spectrometer. The analysis was carried out at an accelerating voltage of 10 kV and electric current of 1.4 nA. Standardization of the emission lines was carried out using the standards of GdPO
4, ScPO
4, Fe, YPO
4, Pt, and BiTe
2 for the elements O and Gd, Sc, Fe, Y, Pt, and Bi, respectively. Standard deviations for the elements with concentrations larger than 10% in mass did not exceed 2%. Averaging over six points on each sample was applied.
As a first approach, we assumed that the chemical composition of the studied iron garnets contained 12 oxygen ions per formula unit. Using this assumption, we obtained the cation content per formula unit too (
Table 1 and
Table 2). By combining these data together with known molecular field coefficients [
15], we estimated the temperature of magnetic compensation and found a good agreement between molecular field theory and the experimental results.
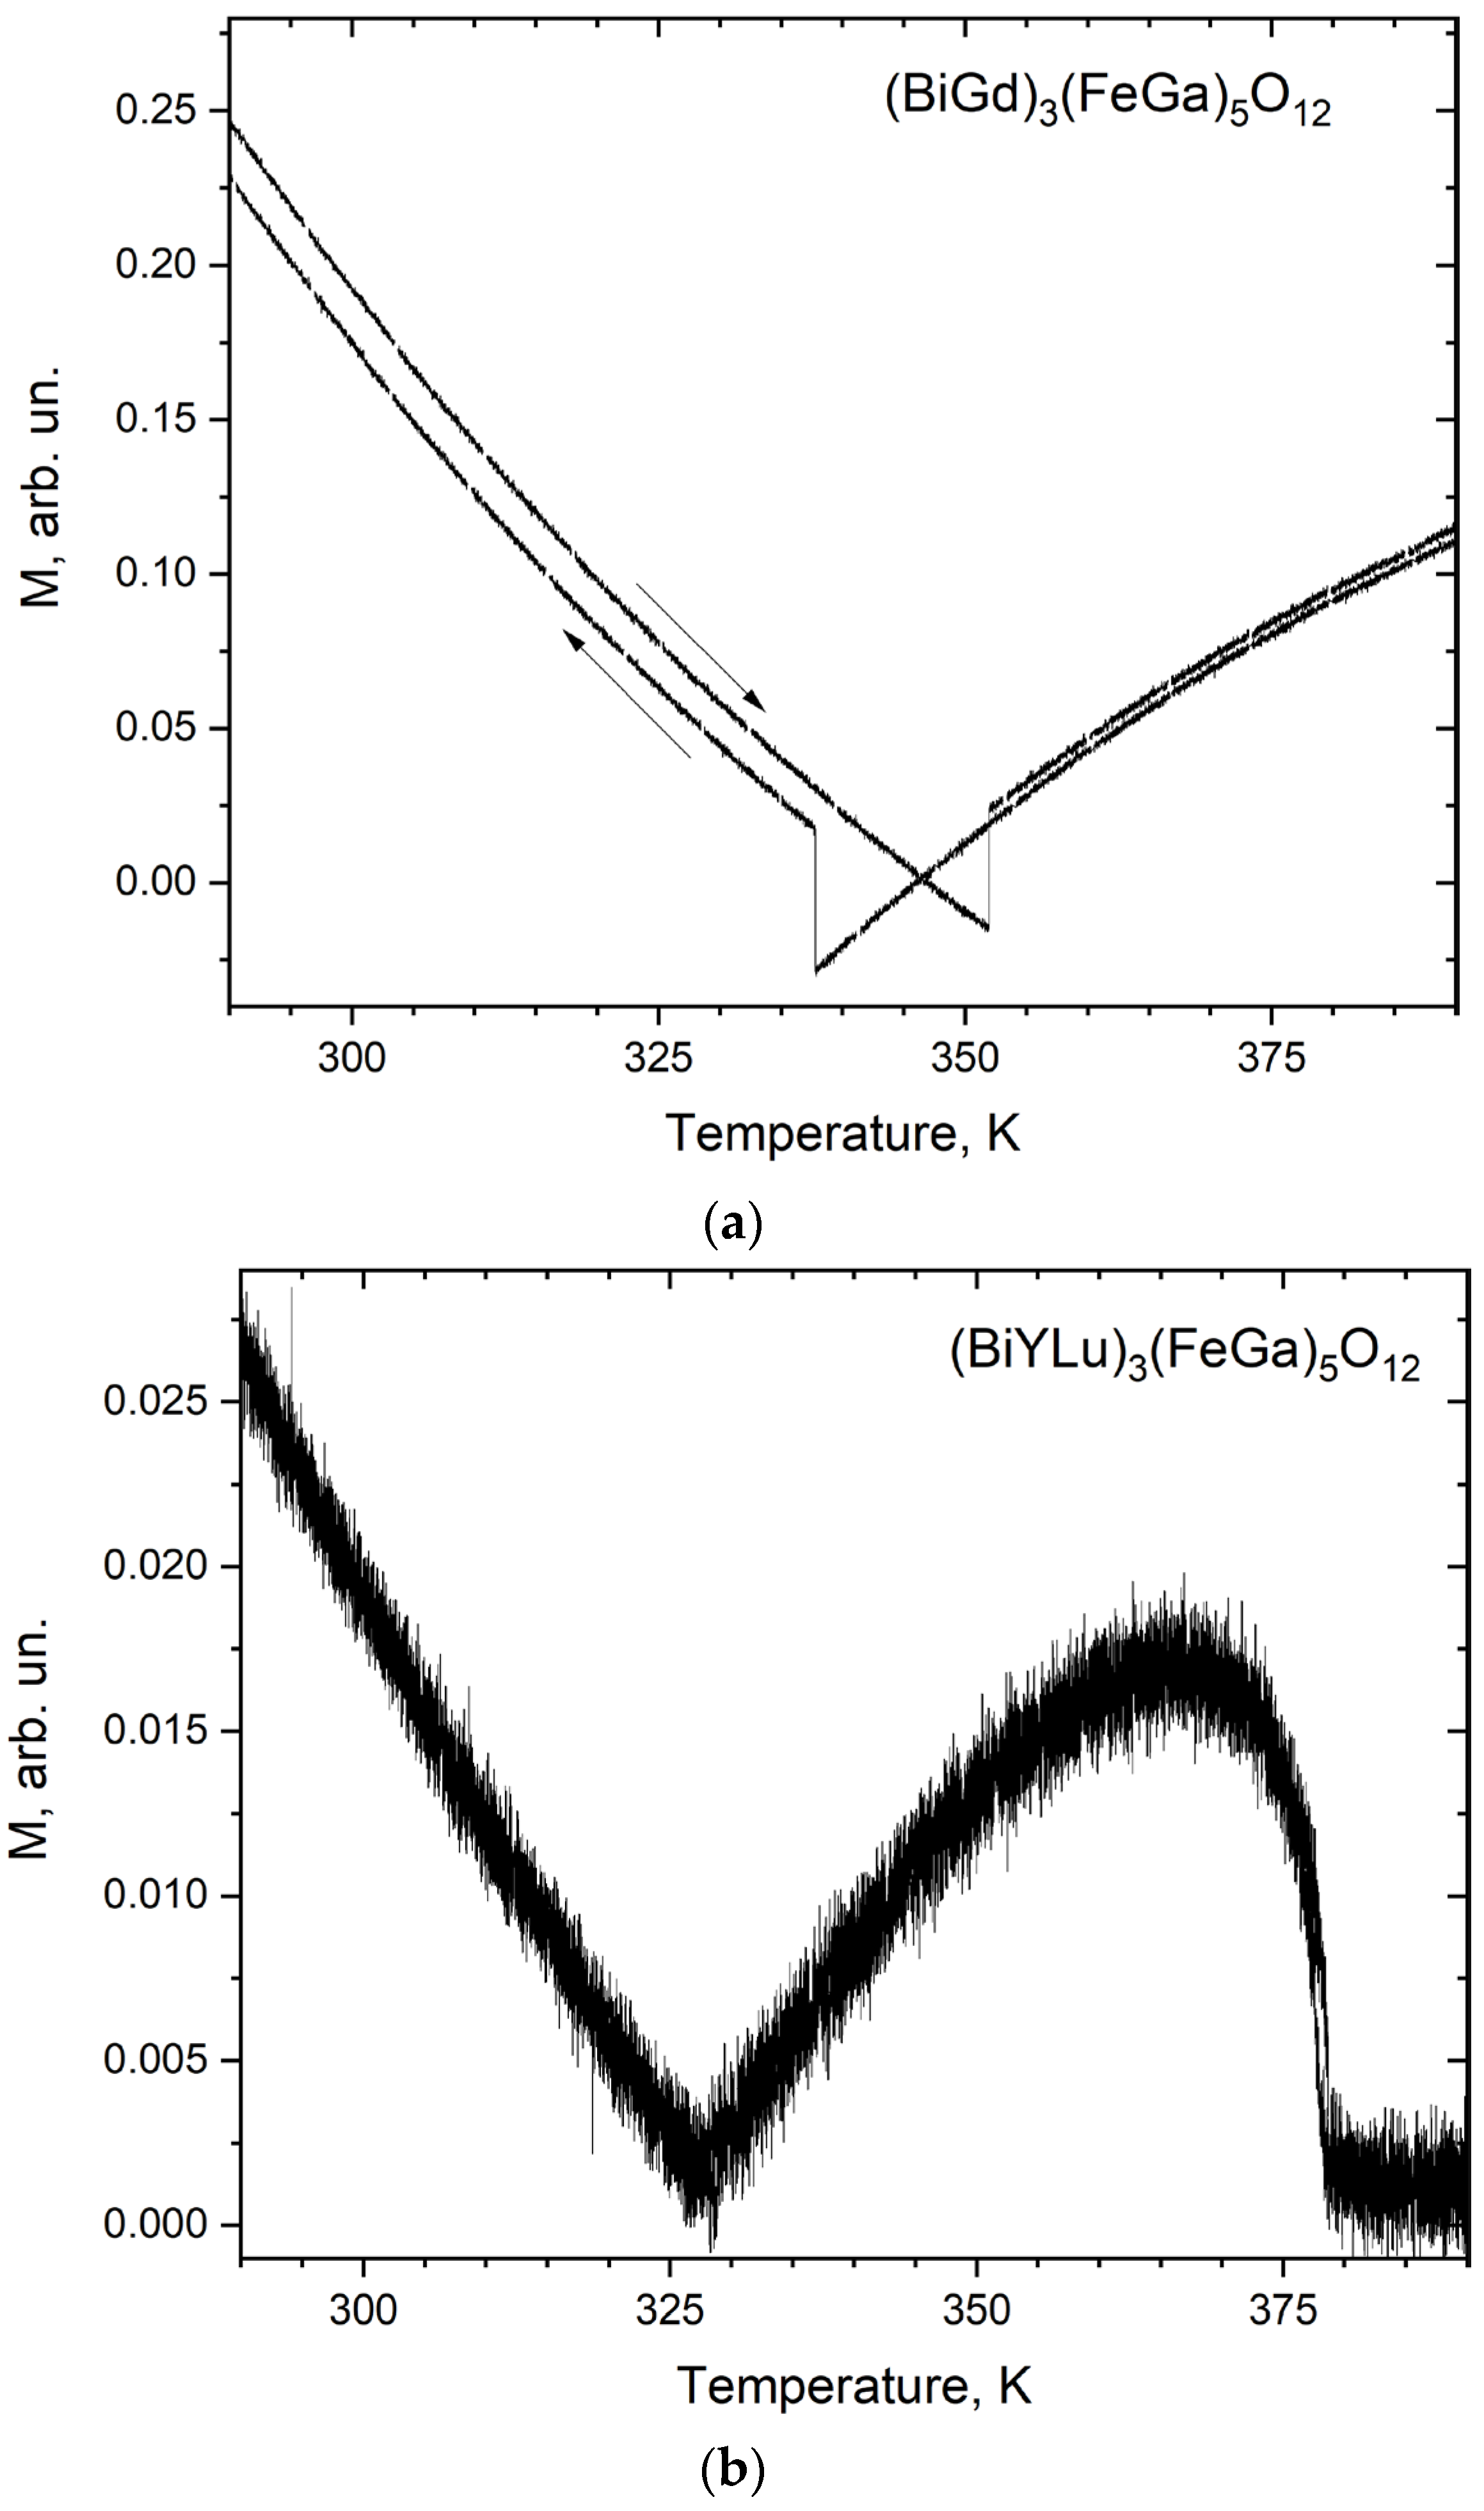
To define the temperature of magnetic compensation, we used the temperature dependence of magnetization measured using vibrating magnetometry.
Figure 1 gives the dependences obtained by using a Versa Lab setup (Quantum Design, Sao Paolo, Brazil) for both samples in a weak magnetic field of 10 mT applied perpendicular to the film plane. Both dependencies (
Figure 1) had a qualitatively similar characteristic, which is typical for a ferrimagnetic material with a magnetic compensation temperature. The temperature of magnetic compensation is a temperature that results the deep minimum of the magnetization dependence below the Neel temperature. The absolute magnetization value is an unimportant feature in finding the temperature of magnetic compensation. This allowed us to ignore the normalization of the measured magnetic moment on the film volume and to present magnetization in the arbitrary units.
The special measurements of the substrate magnetization indicate the absence of any features that can affect the accuracy of finding the compensation temperature. The substrate paramagnetic magnetization decreases 1/T as the temperature T grows, and paramagnetic contribution is excluded from the samples’ magnetization in
Figure 1. As a result, we found a compensation temperature T
m = 346.5 K for the first type of sample (bismuth gadolinium iron garnet having three magnetic sublattices) and T
m = 327.5 K for the second type of sample (bismuth iron garnet having two magnetic sublattices).
3. Experiment
The experimental method used in this study is based on the gradient in-plane method proposed in [
16,
17] for observing phase transitions. In contrast to [
16,
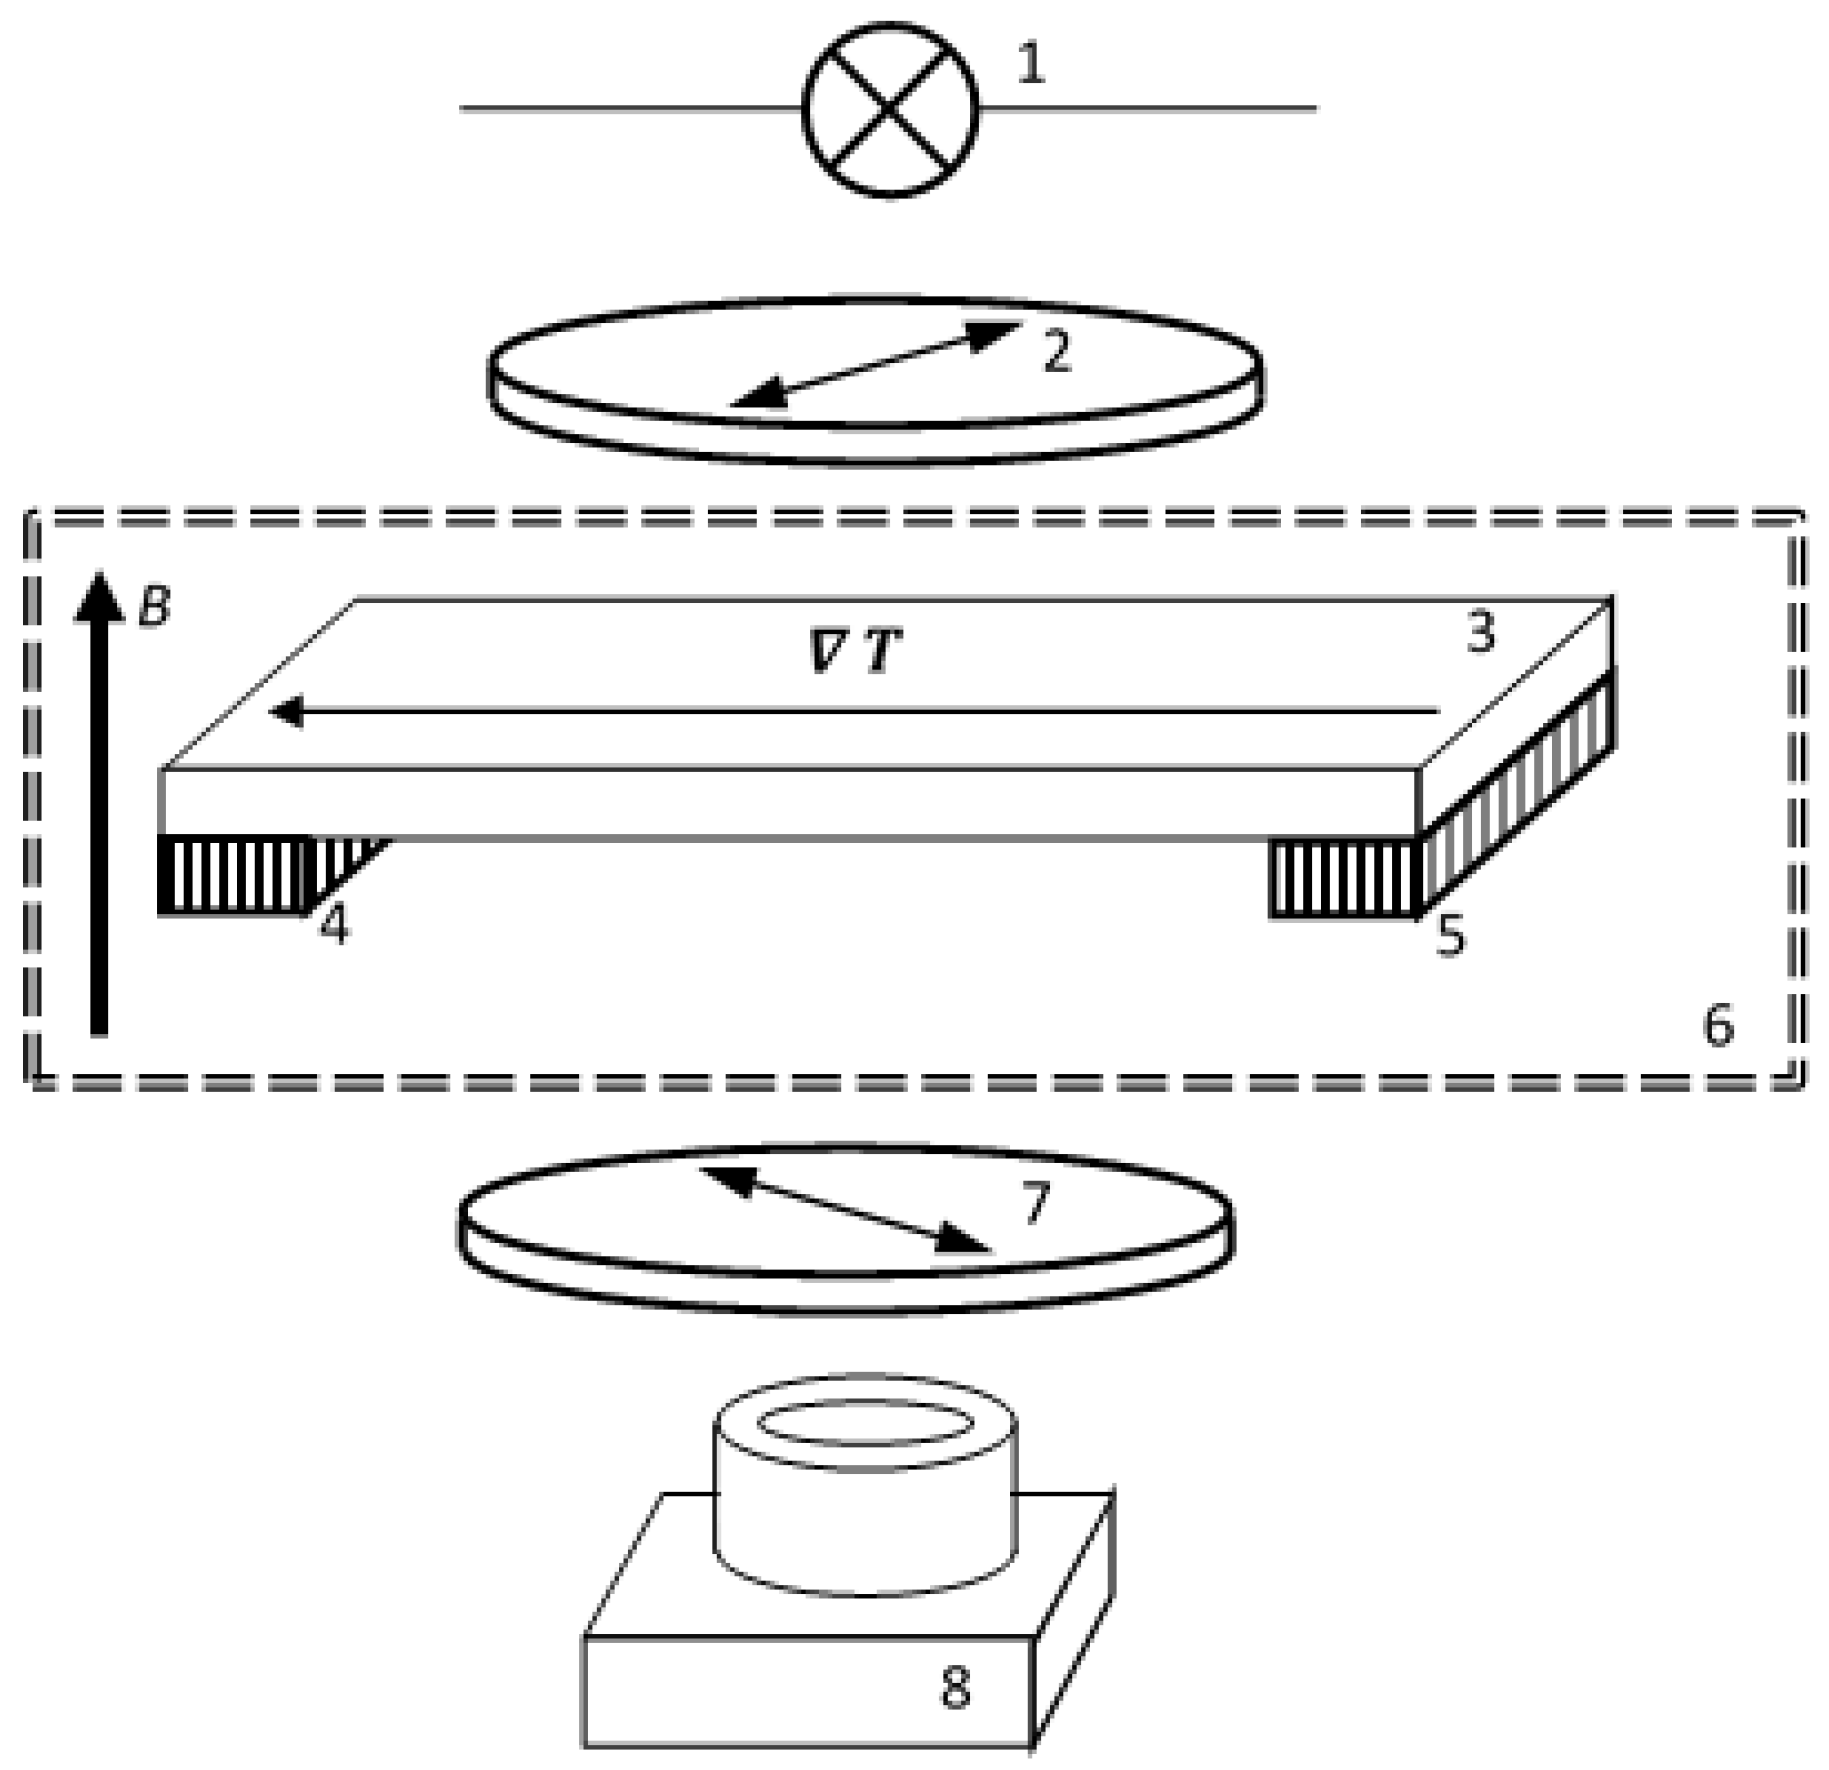
17], we used a temperature gradient instead of the gradient of the composition in the film plane. The general scheme of the experiment is shown in
Figure 2.
Polarized light was used to observe the magnetic phases. Passing through the magnetic film of the sample, the polarized light entered the digital camera through the analyzer. The angle between the polarizer and the analyzer was adjusted to achieve the maximum image. This provided some middle intensity of light if polarization remained unchanged between the polarizer and analyzer.
Due to the Faraday effect, polarization rotation is possible in magnetic materials that influence the intensity of the light passing through a film. The Faraday rotation in our samples provided the dominant contribution from the magnetic sublattice of the tetrahedral iron ions. The diamagnetic bismuth ions only enhanced this effect. The contribution of the octahedral sublattice was always less than that of the tetrahedral one. The angle of Faraday rotation depends on the projection of the tetrahedral magnetization onto the direction of the light beam and reaches the maximum value when magnetization is collinear to the beam, while the orthogonal direction results in unchanged polarization. As a result, the sample areas having different tetrahedral magnetization along the film normal should demonstrate different brightness in the image obtained with the digital camera.
In the experiments, a digital video camera was used together with a 550× magnification microscope. The observed area of the sample was a circle with a diameter of about 3 mm. A special holder made of non-magnetic materials was made for both the video camera and the microscope.
To create a lateral temperature gradient
in the sample plane, two Peltier elements connected in opposite directions were used. Both Peltier elements, model TB–7–06–08 KryoTherm (St. Petersburg, Rusia) with a size of 4 × 4 mm, were located at the edges of the observation area at a distance of 3 mm. A temperature-controlled sample holder with Peltier elements was used to stabilize the temperature during measurements. The sample temperature monitoring and control system also included service elements, such as a temperature sensor and a differential thermocouple for monitoring the temperature gradient, not shown in
Figure 2. The specially designed holder that held the optical system together, described above, temperature control equipment, and the test sample were placed in the working area of a superconducting magnet. The magnet provided a field
B up to 10 T directed along the normal to the film plane. The cryogenic system for the superconducting magnet was a GFSG-510-2K-SCM10T-VTI29 (CryoTrade Engineering LLC, Moscow, Russia).
To automate the experiment, a computer, a temperature control system, measuring instruments, and a magnet power supply were networked. A computer managed the network utilizing the specially developed software. The developed system automatically stored into a file the measured values of magnetic field, temperature, and temperature gradient and displayed them on a monitor.
The magnetization redistribution due to the changing magnetic field resulted in the changing image registered with polarized light. The dynamically changing image together with the above-mentioned parameters were recorded as a video file. The proposed optical system along with the temperature and magnetic field management systems allowed the visualization of the magnetization behavior during the temperature-phase transition in high-quality, homogeneous films.
4. Results and Discussion
To identify the conditions for the existence of a non-collinear phase, measurements were carried out in magnetic fields ranging from 0 to 10 T. The sample temperature was maintained in the compensation temperature region.
Visually, both types of samples qualitatively demonstrated the same behavior, differing only in numerical values. The images for the (BiYLu)
3(FeGa)
5O
12 sample looked more contrasted than those for the first type sample, because the concentration of Bi ions in the second type of sample was significantly higher (
Table 1 and
Table 2). The experimental results for the second type of sample are given in
Figure 3 and
Figure 4.
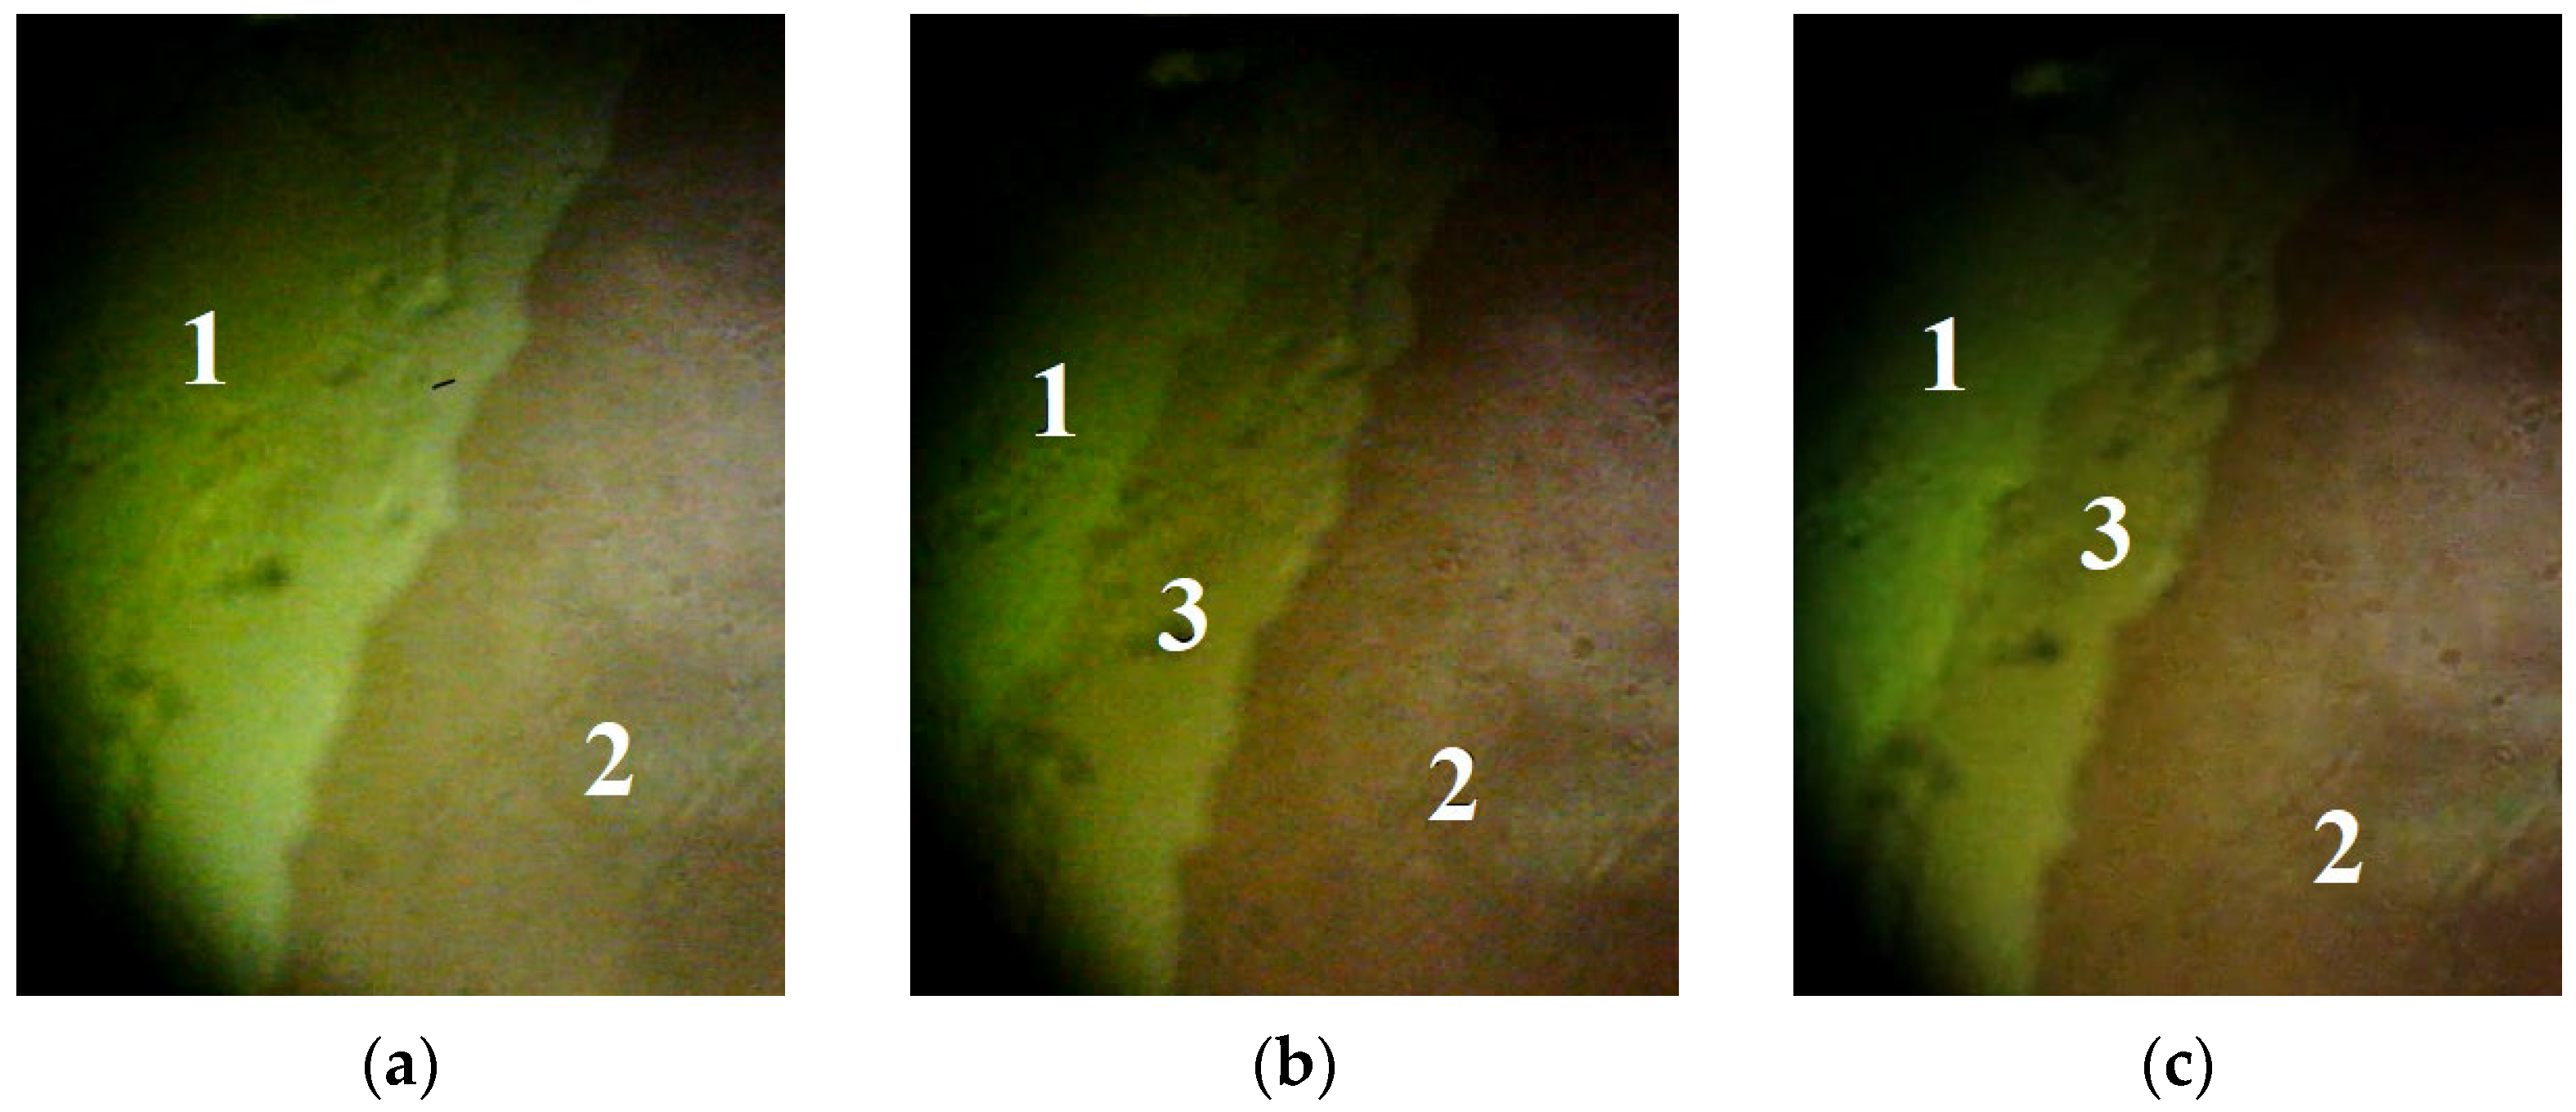
In the absence of an external magnetic field, a large-block domain structure was observed at room temperature, and the temperature variations changed this structure. In magnetic fields exceeding the coercivity threshold, the sample was in saturation, and a monodomain state was observed.
To conduct experiments near the compensation point, we started from room temperature and gradually heated the sample up to the compensation point. The rate of temperature changes did not exceed 1 degree per minute.
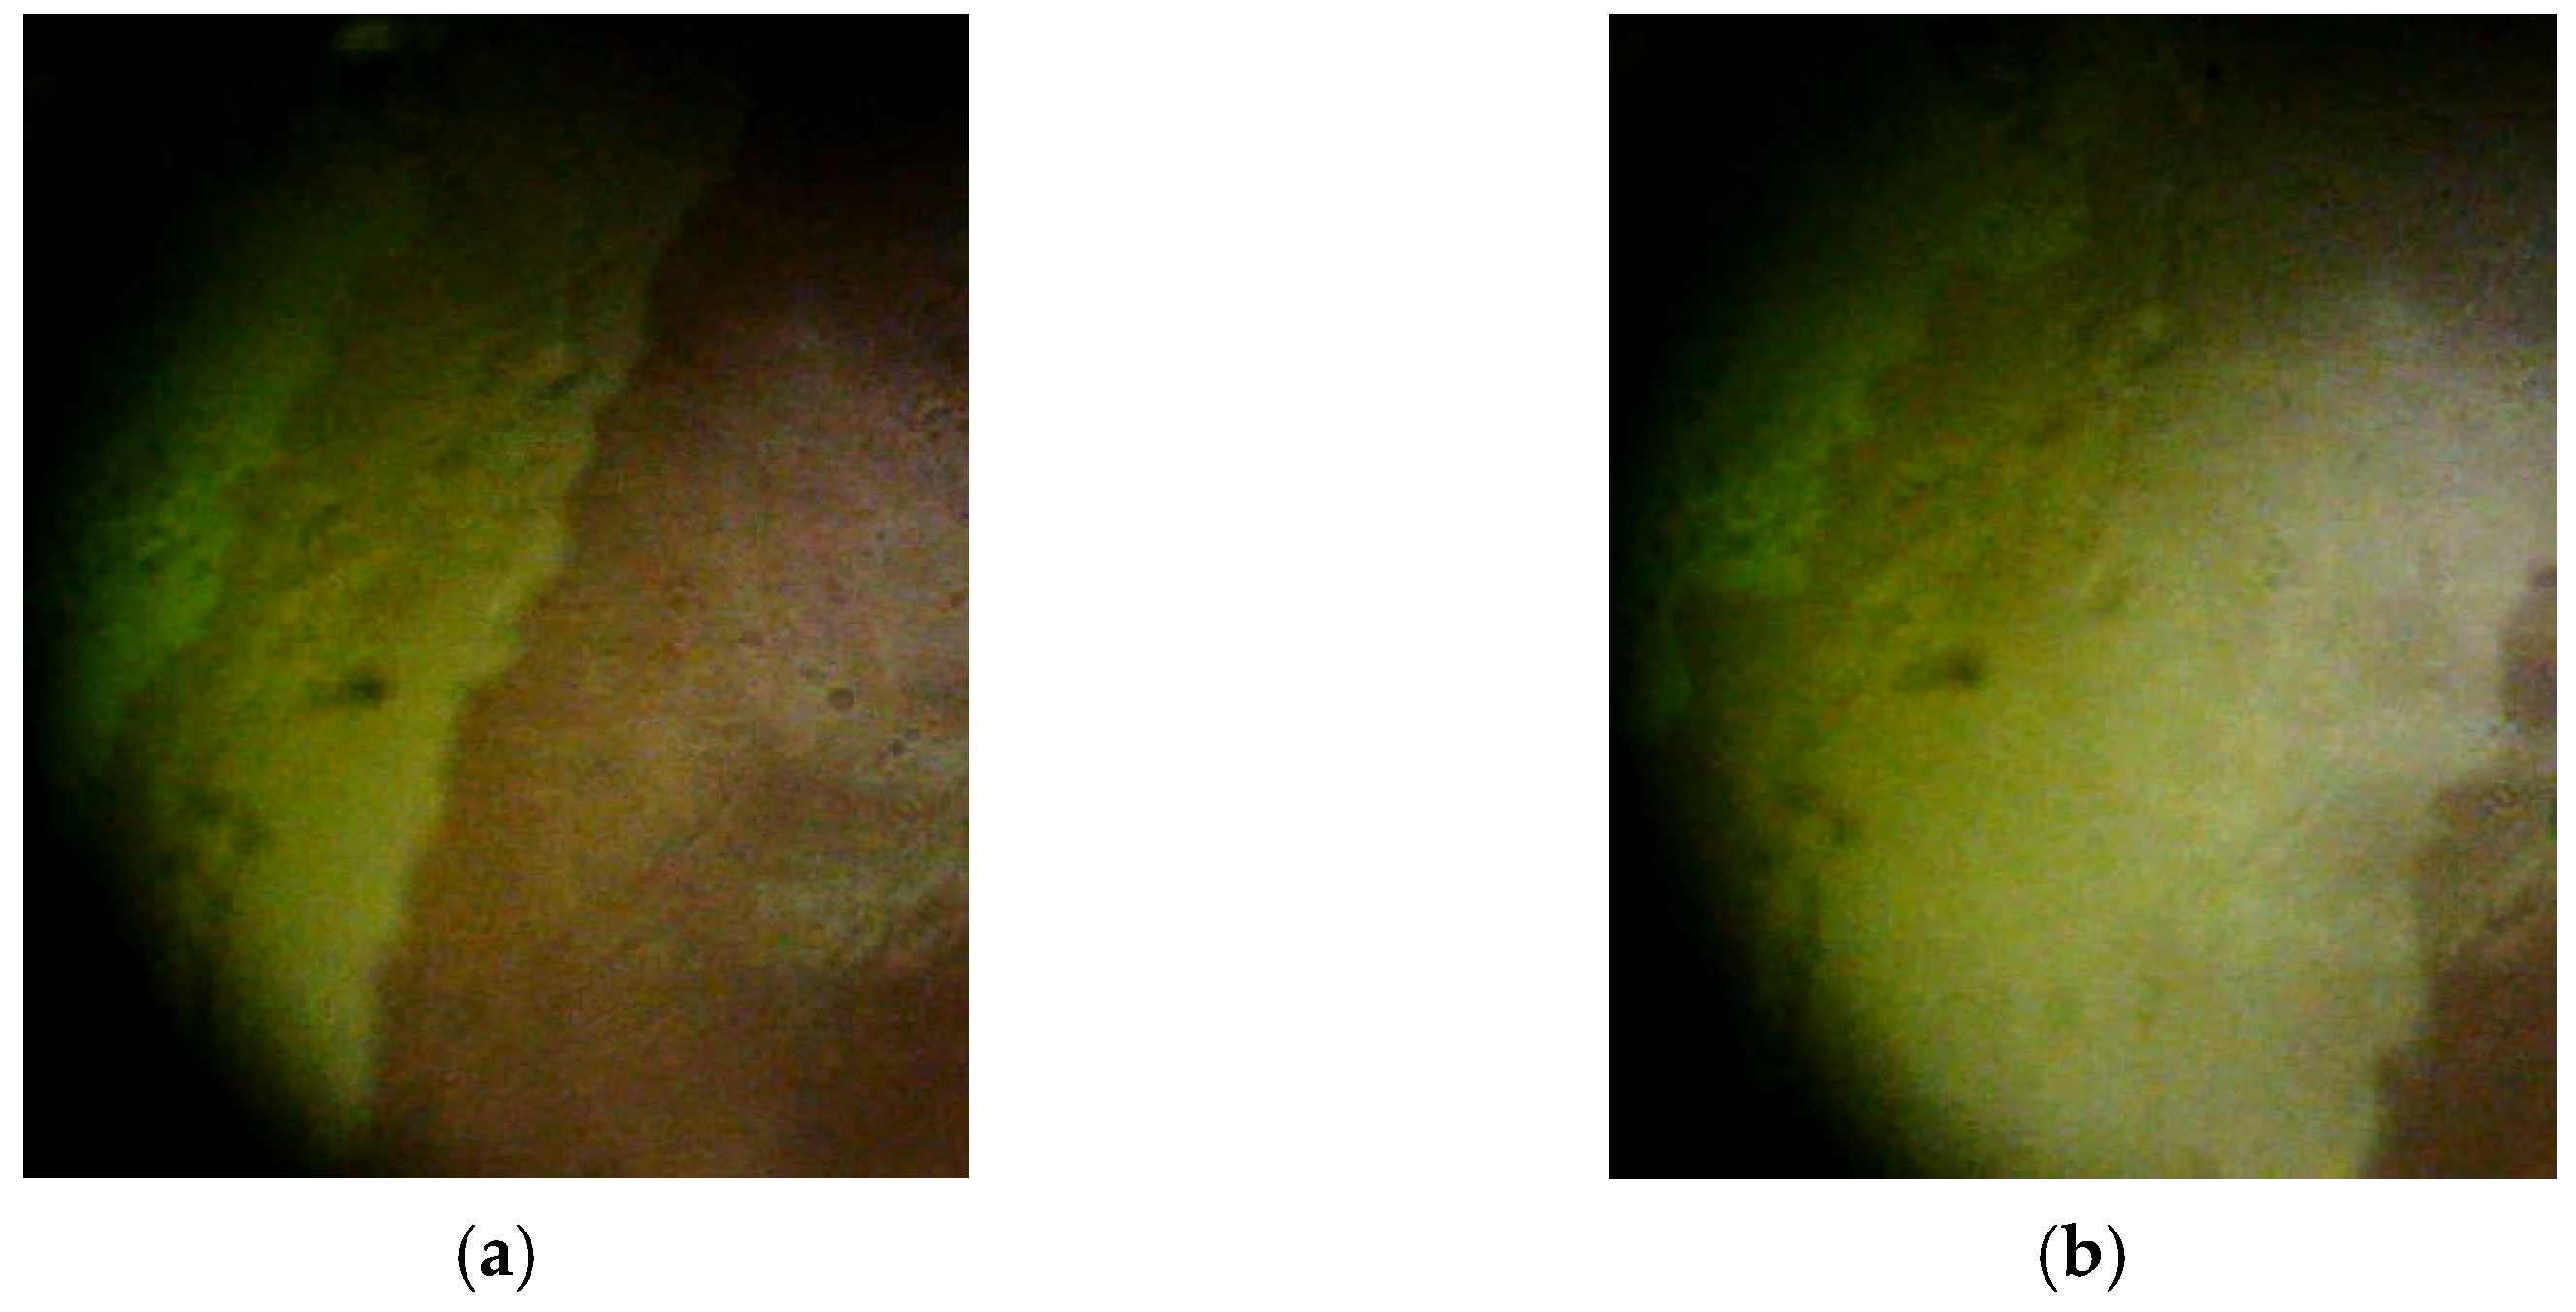
Near the compensation temperature, the observed pattern consists of two areas of different brightness when the magnetic field is below the first critical value H
c1 (
Figure 3a). We attribute these areas to collinear phases of different magnetization directions perpendicular to the film plane. The observed behavior agreed with expectations because the theoretical temperature range for the canted phase existence is sufficient in low fields [
2,
10]. The other argument is that the “easy-axis” magnetic anisotropy crushes the canted phase in low fields. This anisotropy also responds to the temperature hysteresis in the magnetization near the compensation point (
Figure 1a). Similar hysteresis took place for the second type of sample in the 1 mT field.
Let us note that the visualized magnetic phases differed from one other in the direction of the magnetization of tetrahedral iron, while the direction of the total magnetization was the same for both phases and laid along the magnetic field. A boundary between areas of the different phases is the 180-degree compensation wall. This compensation wall is similar to the compensation wall that has been reported in [
17,
18]. Unlike the temperature gradient reported here, the authors of [
17,
18] used samples that had a compensation point gradient due to the gradient of the chemical composition in a sample.
Starting from the first critical value H
c1, the field increase brought the extra features into the observed pattern. A transition region of intermediate brightness appears between regions that represent collinear phases (
Figure 3b). The field growth up to the second critical value H
c2 increased the width of the transition region.
The new region appeared due to the canted phase, which gave a weaker Faraday rotation. In reality, the directions of the sublattices magnetization do not match the external magnetic field in the non-collinear (canted) phase. At the temperature of magnetic compensation, the sublattices’ magnetizations are practically orthogonal to the external field and, as a result, provide a vanishingly small contribution to the Faraday rotation. The temperature offset from the compensation point results in out-of-plane magnetization. The angle between the magnetization and a perpendicular to the film plane should change smoothly in the canted phase [
2].
This theoretical expectation contradicts the experimental results, which showed a sharp boundary between the canted and collinear phases. However, the sharp boundary occurred in the region of fields and temperatures where the coexistence of both collinear and canted phases was possible. A similar pattern was observed by magneto-optical method in experimental work [
17].
With an increase in the magnetic field strength, the area corresponding to the non-collinear phase initially increased, and then, starting from the second critical field H
c2, it decreased. It can be seen that the canted phase region in the external field of 1.03 T (
Figure 3c) was smaller than in the field of 1.0 T (
Figure 3b). At external magnetic field strengths above a certain critical value, H
c3, the non-collinear phase completely disappeared, and two opposite collinear phases with maximum contrast were observed again (
Figure 3e). A further increase in the intensity of the external magnetic field did not change anything in the observed picture (
Figure 3f).
This experimental result conflicts with known theories [
2,
10]. According to theory, an increase in a magnetic field should only increase the width of the temperature region where a canted phase exists. The other problem relates to the maximum width of the temperature range for the canted phase. This region is too small, contrary to expectations.
On the other hand, we obtained preliminary results in the scope of molecular field theory. We found an extra magnetization in the collinear phase due to the paraprocess. This can narrow the temperature region of the canted phase and contribute to a decrease in the collinear phase energy in strong magnetic fields. As mentioned above, for a fixed magnetic field, the magnetization direction depends on the temperature in the canted phase. The temperature gradient induces an inhomogeneity in the magnetization direction for the canted phase. As a result, this can contribute to an increase in canted phase energy. These results will be discussed in detail in the next publication.
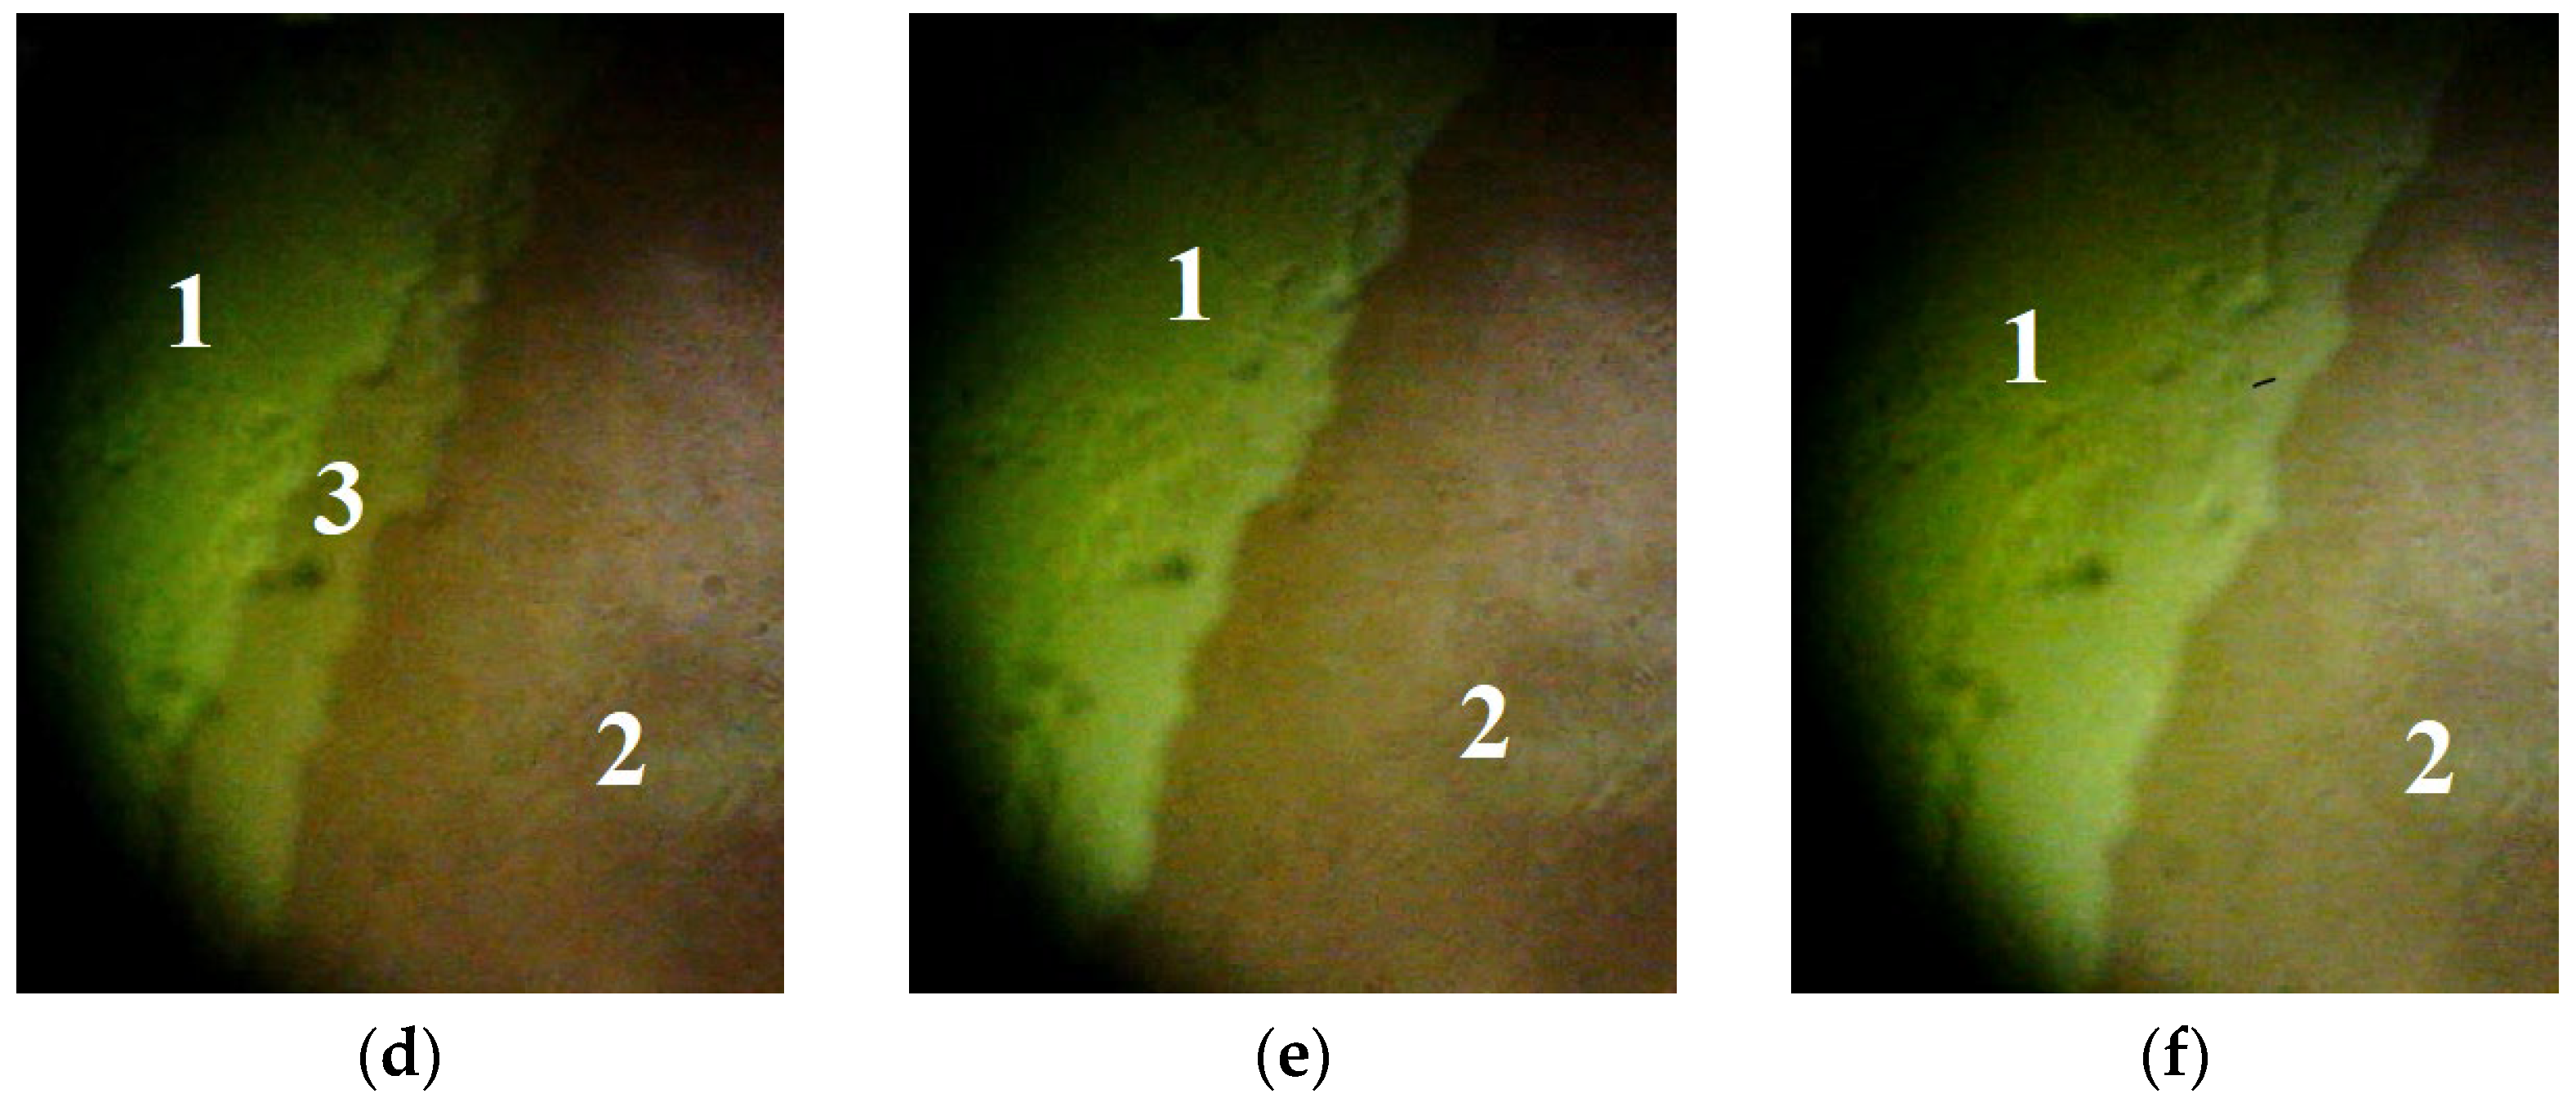
For the temperature gradient used for the magneto-optical visualization, we could tune it in the range from 0 K per cm to 12 K per cm. The most effective influence on the magnetic phase images was exerted by a temperature gradient in the range from 1.5 K per cm to 2.5 K per cm. Further gradient increases had little effect on the visualization quality but had a general temperature effect on the sample, moving the phase boundary out of the observation area. The data in
Figure 4 demonstrate the influence of the lateral temperature gradient. The lateral gradient for the image in
Figure 4b is approximately twice as large as that for the image in
Figure 4a, while the sample temperature and external magnetic field are approximately the same for both cases.
The experiments showed that the value of the third critical field HC3 = 3.2 T for a three-sublattice bismuth gadolinium iron garnet having Neel temperature TN = 450 K was almost three times higher than that for a two-sublattice (BiYLu)3(FeGa)5O12 garnet that had a Neel temperature TN = 380 K and HC3 = 1.1 T.
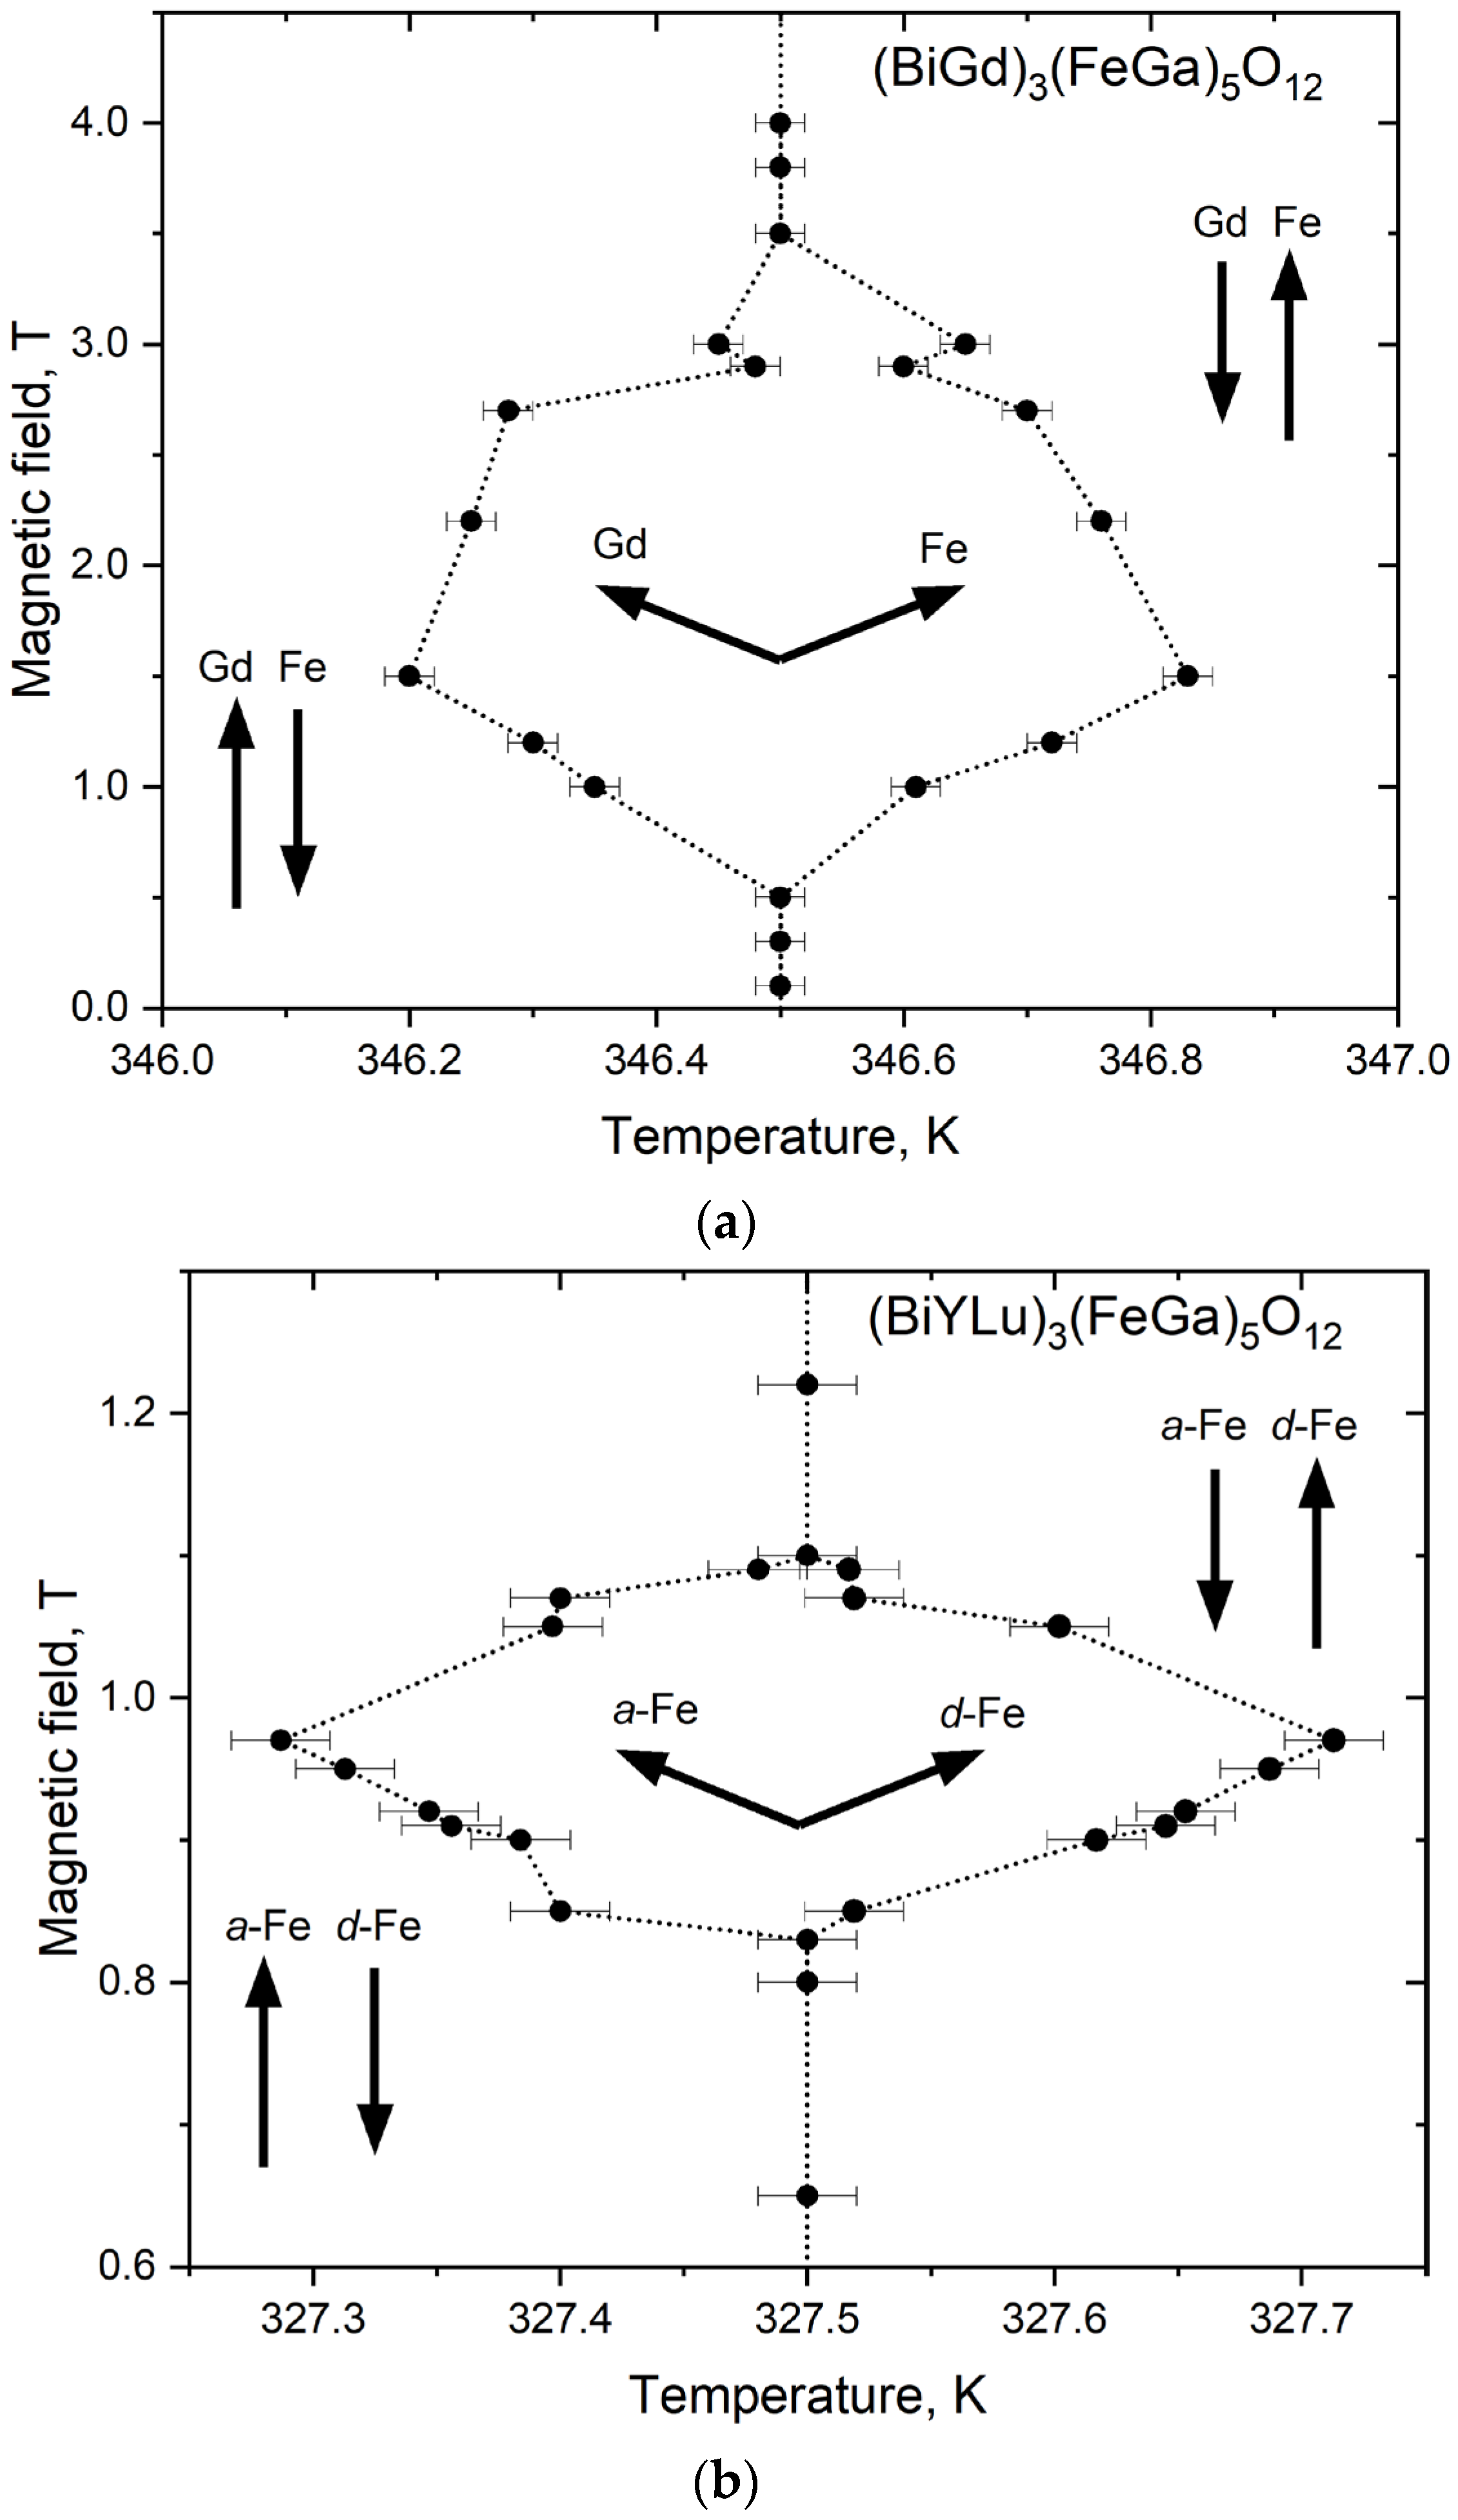
Determined experimentally, phase diagrams in the coordinate system of magnetic field vs. temperature for samples of both types are given in
Figure 5 and
Table 3. The arrows (
Figure 5) schematically represent the sublattices’ magnetizations.
Below the compensation temperature in the second type of sample (
Figure 5b) dominated the octahedral magnetization, and it was directed along the magnetic field in the collinear phase. Above the compensation temperature, vice versa, it was dominated by the tetrahedral sublattice. In the canted phase, the deviation from the antiparallel magnetization arrangement was small, in the order of several degrees (our estimations using molecular field theory). A change in temperature primarily changed the angle between the magnetizations and the field, so that the magnetizations remained almost antiparallel to one other. Although the bismuth gadolinium garnet had three magnetic sublattices, the net iron magnetization could be considered as a single one. As a result, we could consider the first type of sample as a ferrimagnet of two magnetic sublattices, where one sublattice was gadolinium, and the other sublattice was iron (
Figure 5a).
It can be seen that the magnetic field interval dH = HC3 − HC1 and temperature interval dT = Tmax − Tmin, that define the area of a non-collinear phase near the compensation point had different values for the studied samples. The field interval dH1 = 3 T and temperature range dT1 = 1 K for the three-sublattice garnets were visibly larger than dH2 = 0.5 T, dT2 = 0.7 K for the two-sublattice garnet. The difference in behavior between the two types of structures is related to the difference in exchange interactions between them, as well as to the possible influence of magnetic anisotropy, the role of which in the formation of phase diagrams for iron garnet films near the compensation point requires more detailed theoretical consideration.


 ,
, 


