


Green Synthesis of ZnO Nanostructures Using Pyrus pyrifolia: Antimicrobial, Photocatalytic and Dielectric Properties
 , , and
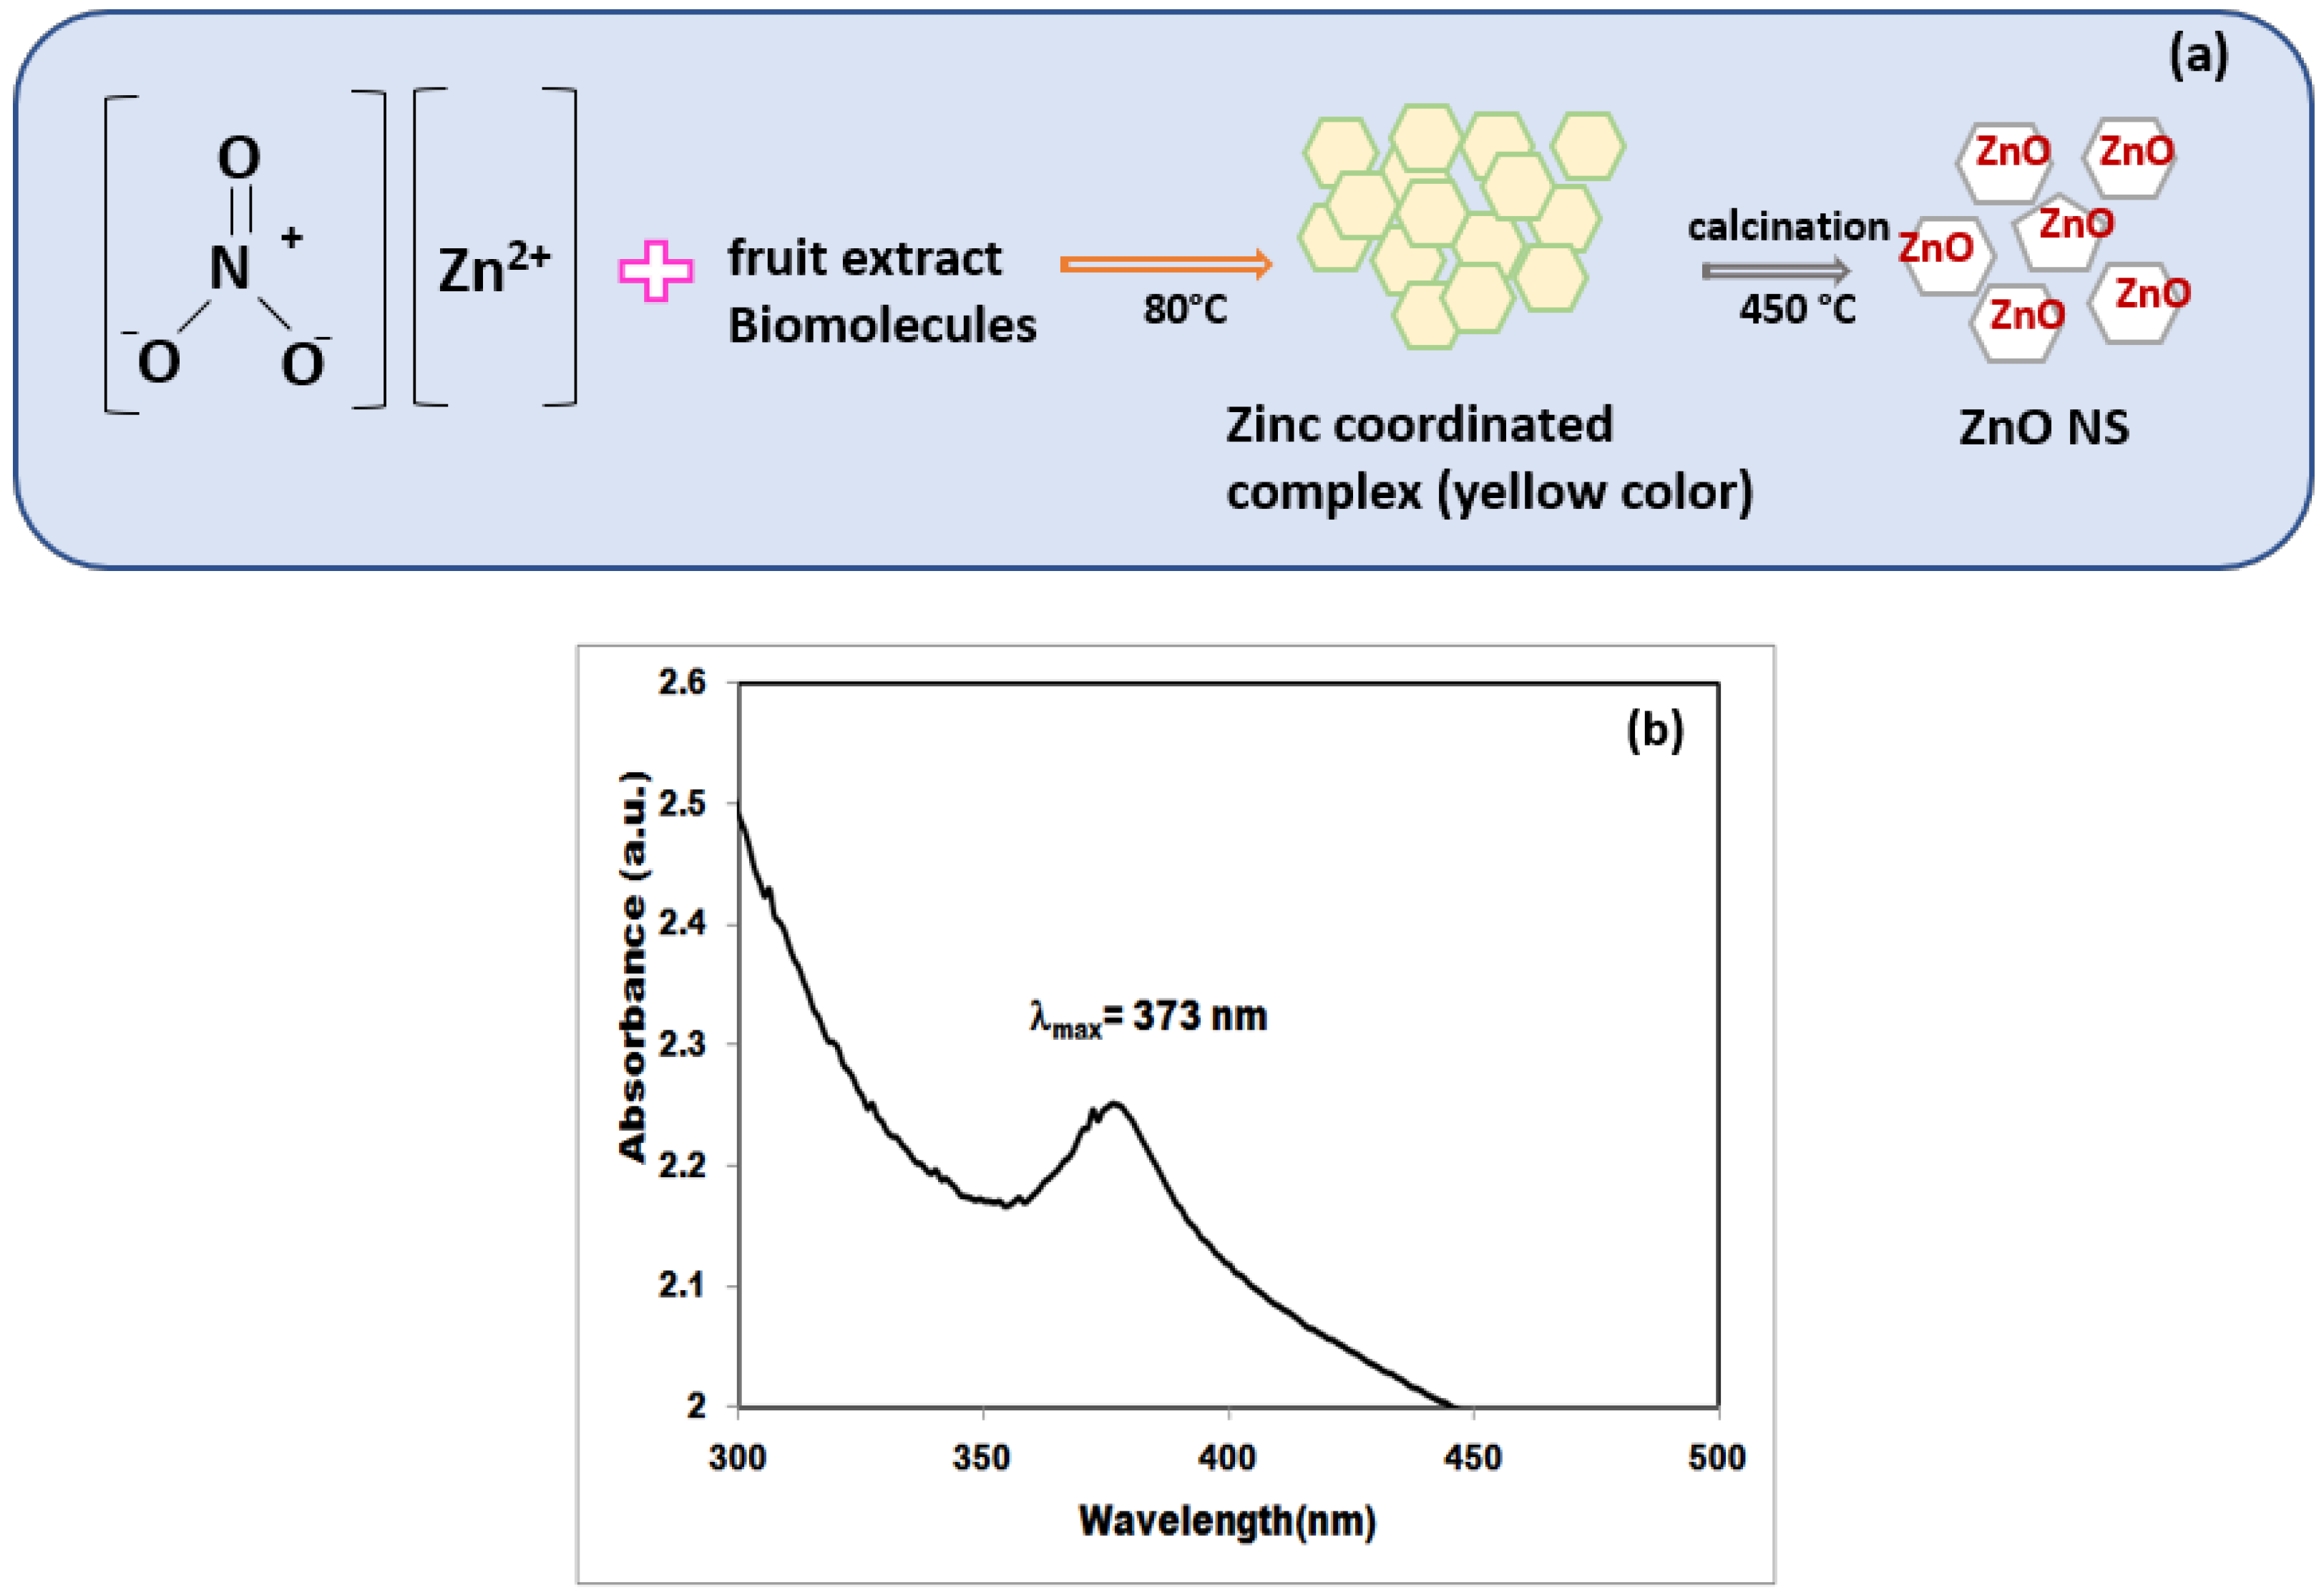
Abstract
:1. Introduction
2. Materials and Methods
2.1. Chemicals and Reagents
2.2. Preparation of Extracts
2.3. Synthesis of ZnO Nanostructures
2.4. Characterization of the ZnO
2.5. Dielectric Studies
2.6. Photocatalytic Decolorization of Methylene Blue
2.7. Antimicrobial Assay of ZnO NS
2.7.1. Disc Diffusion Assay
2.7.2. Resazurin Assay Based Minimum Inhibitory Concentration (MIC) Determination
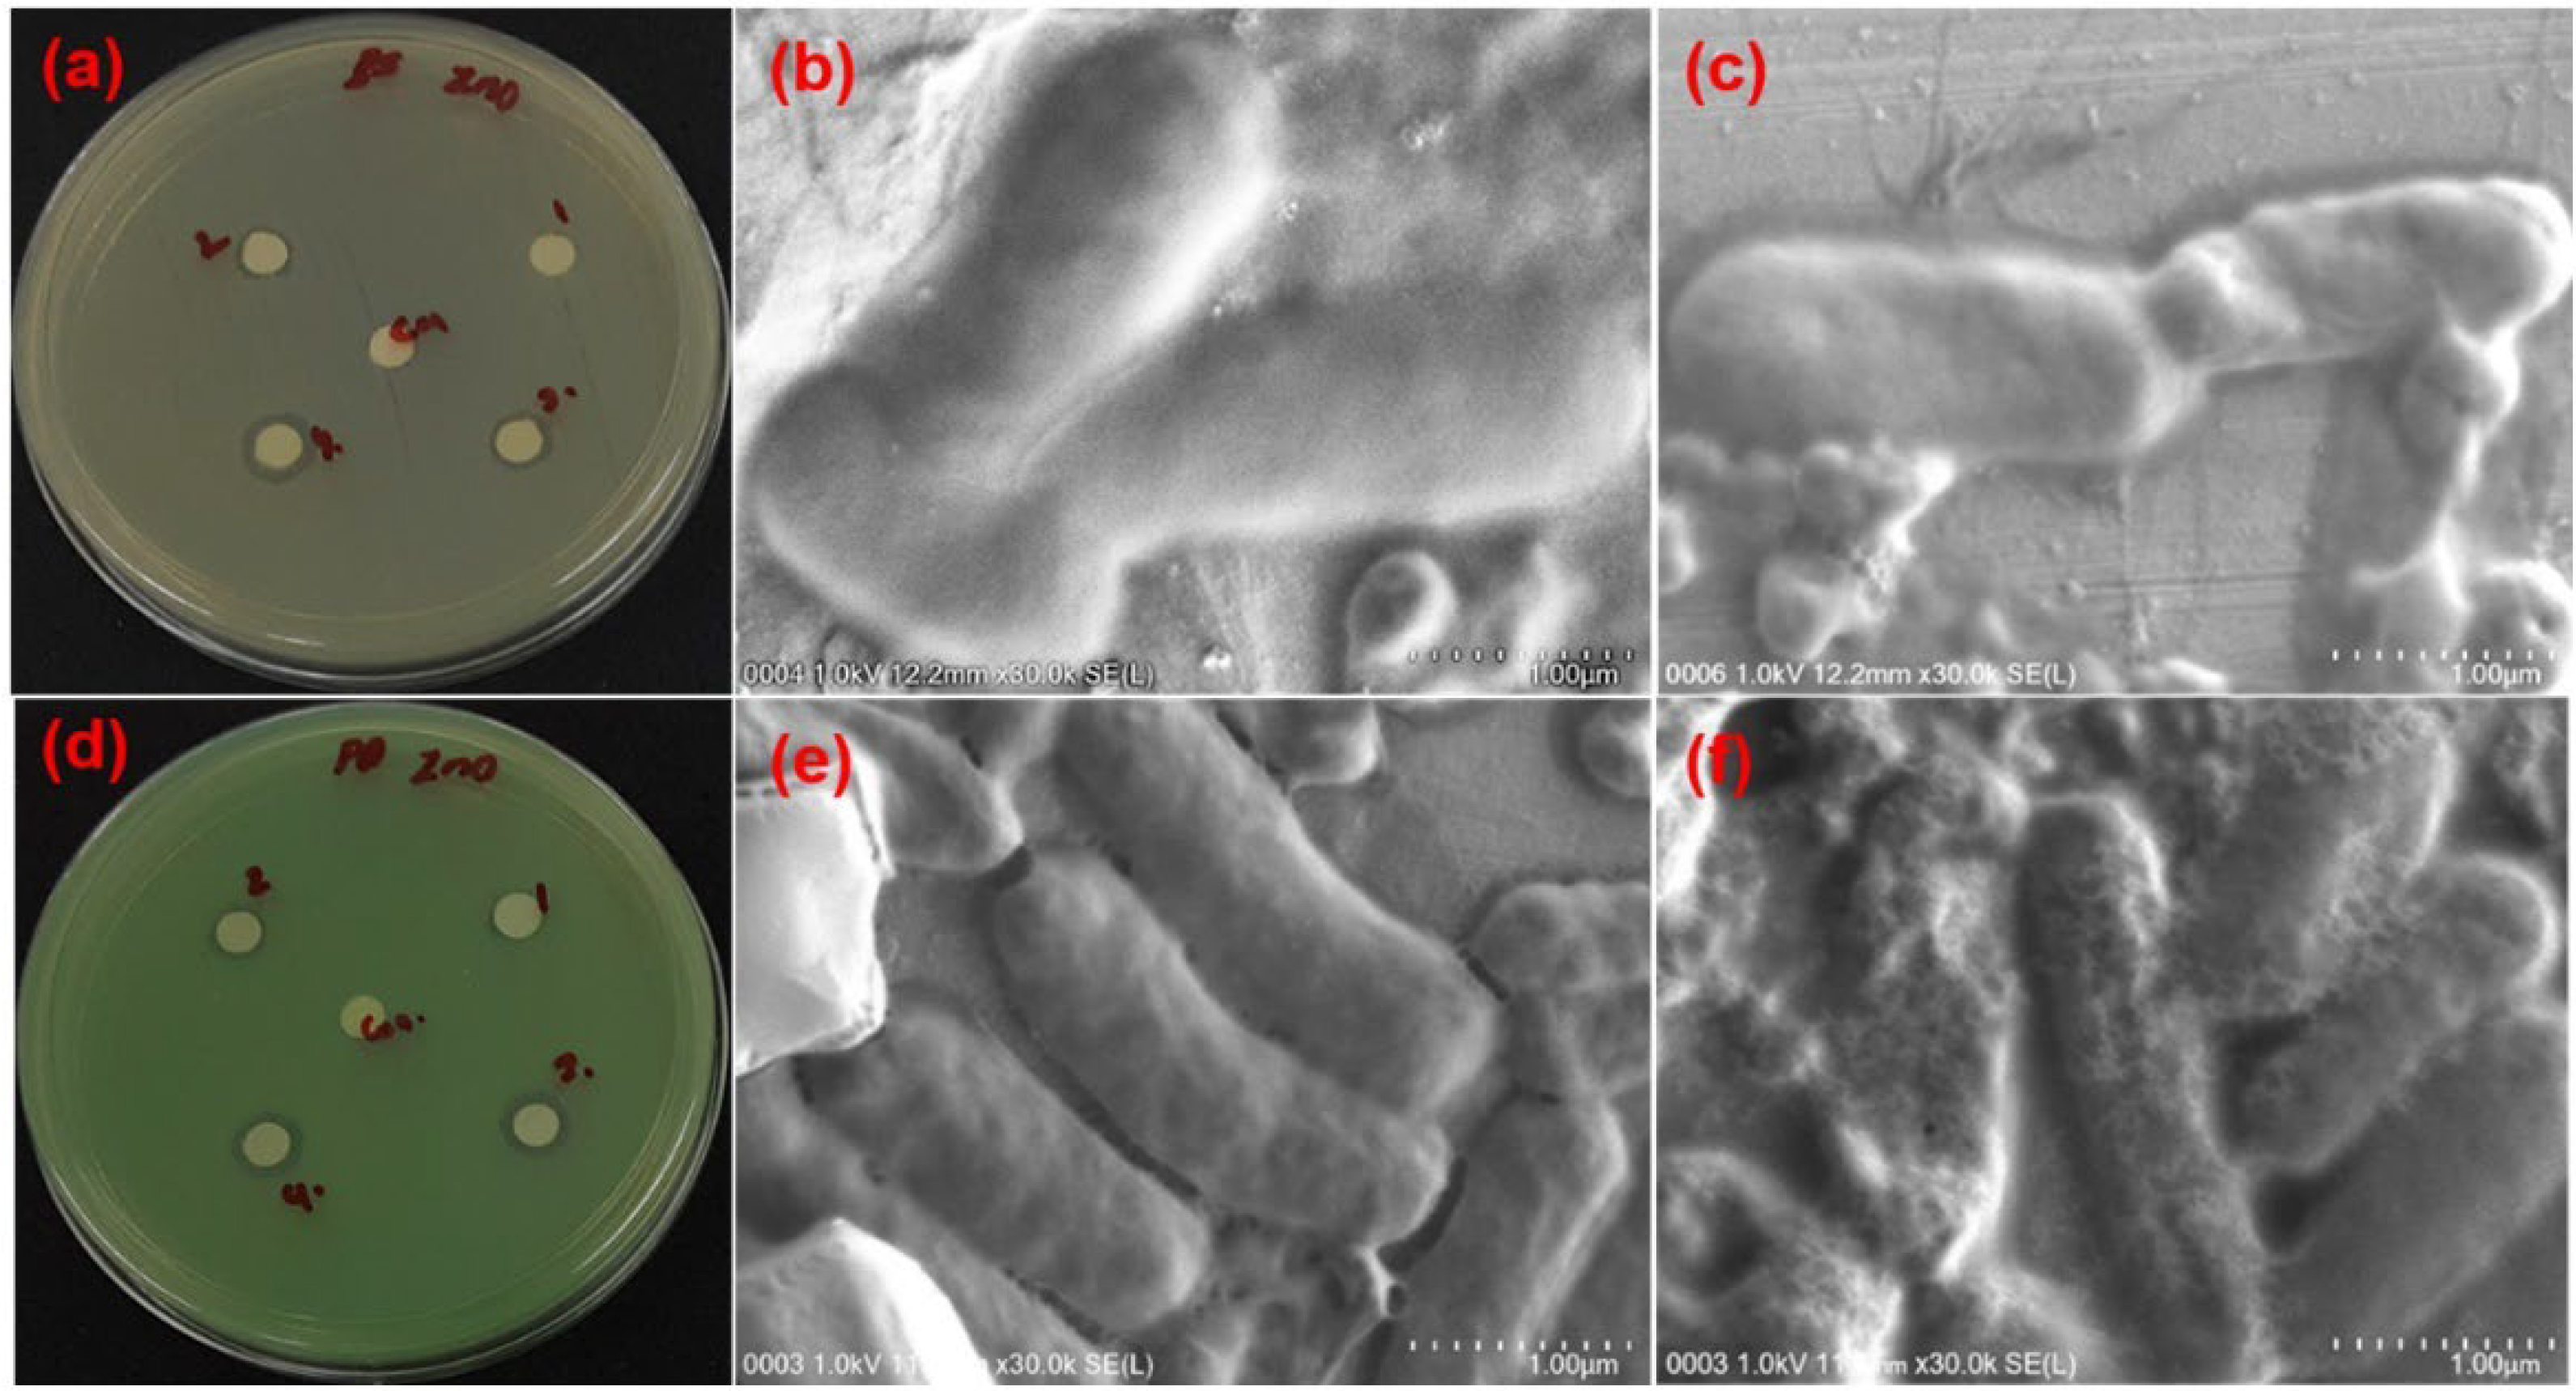
2.7.3. Analysis of Bacterial Morphological Changes
3. Results and Discussion
3.1. ZnO NS Synthesis and UV-Vis Spectrum
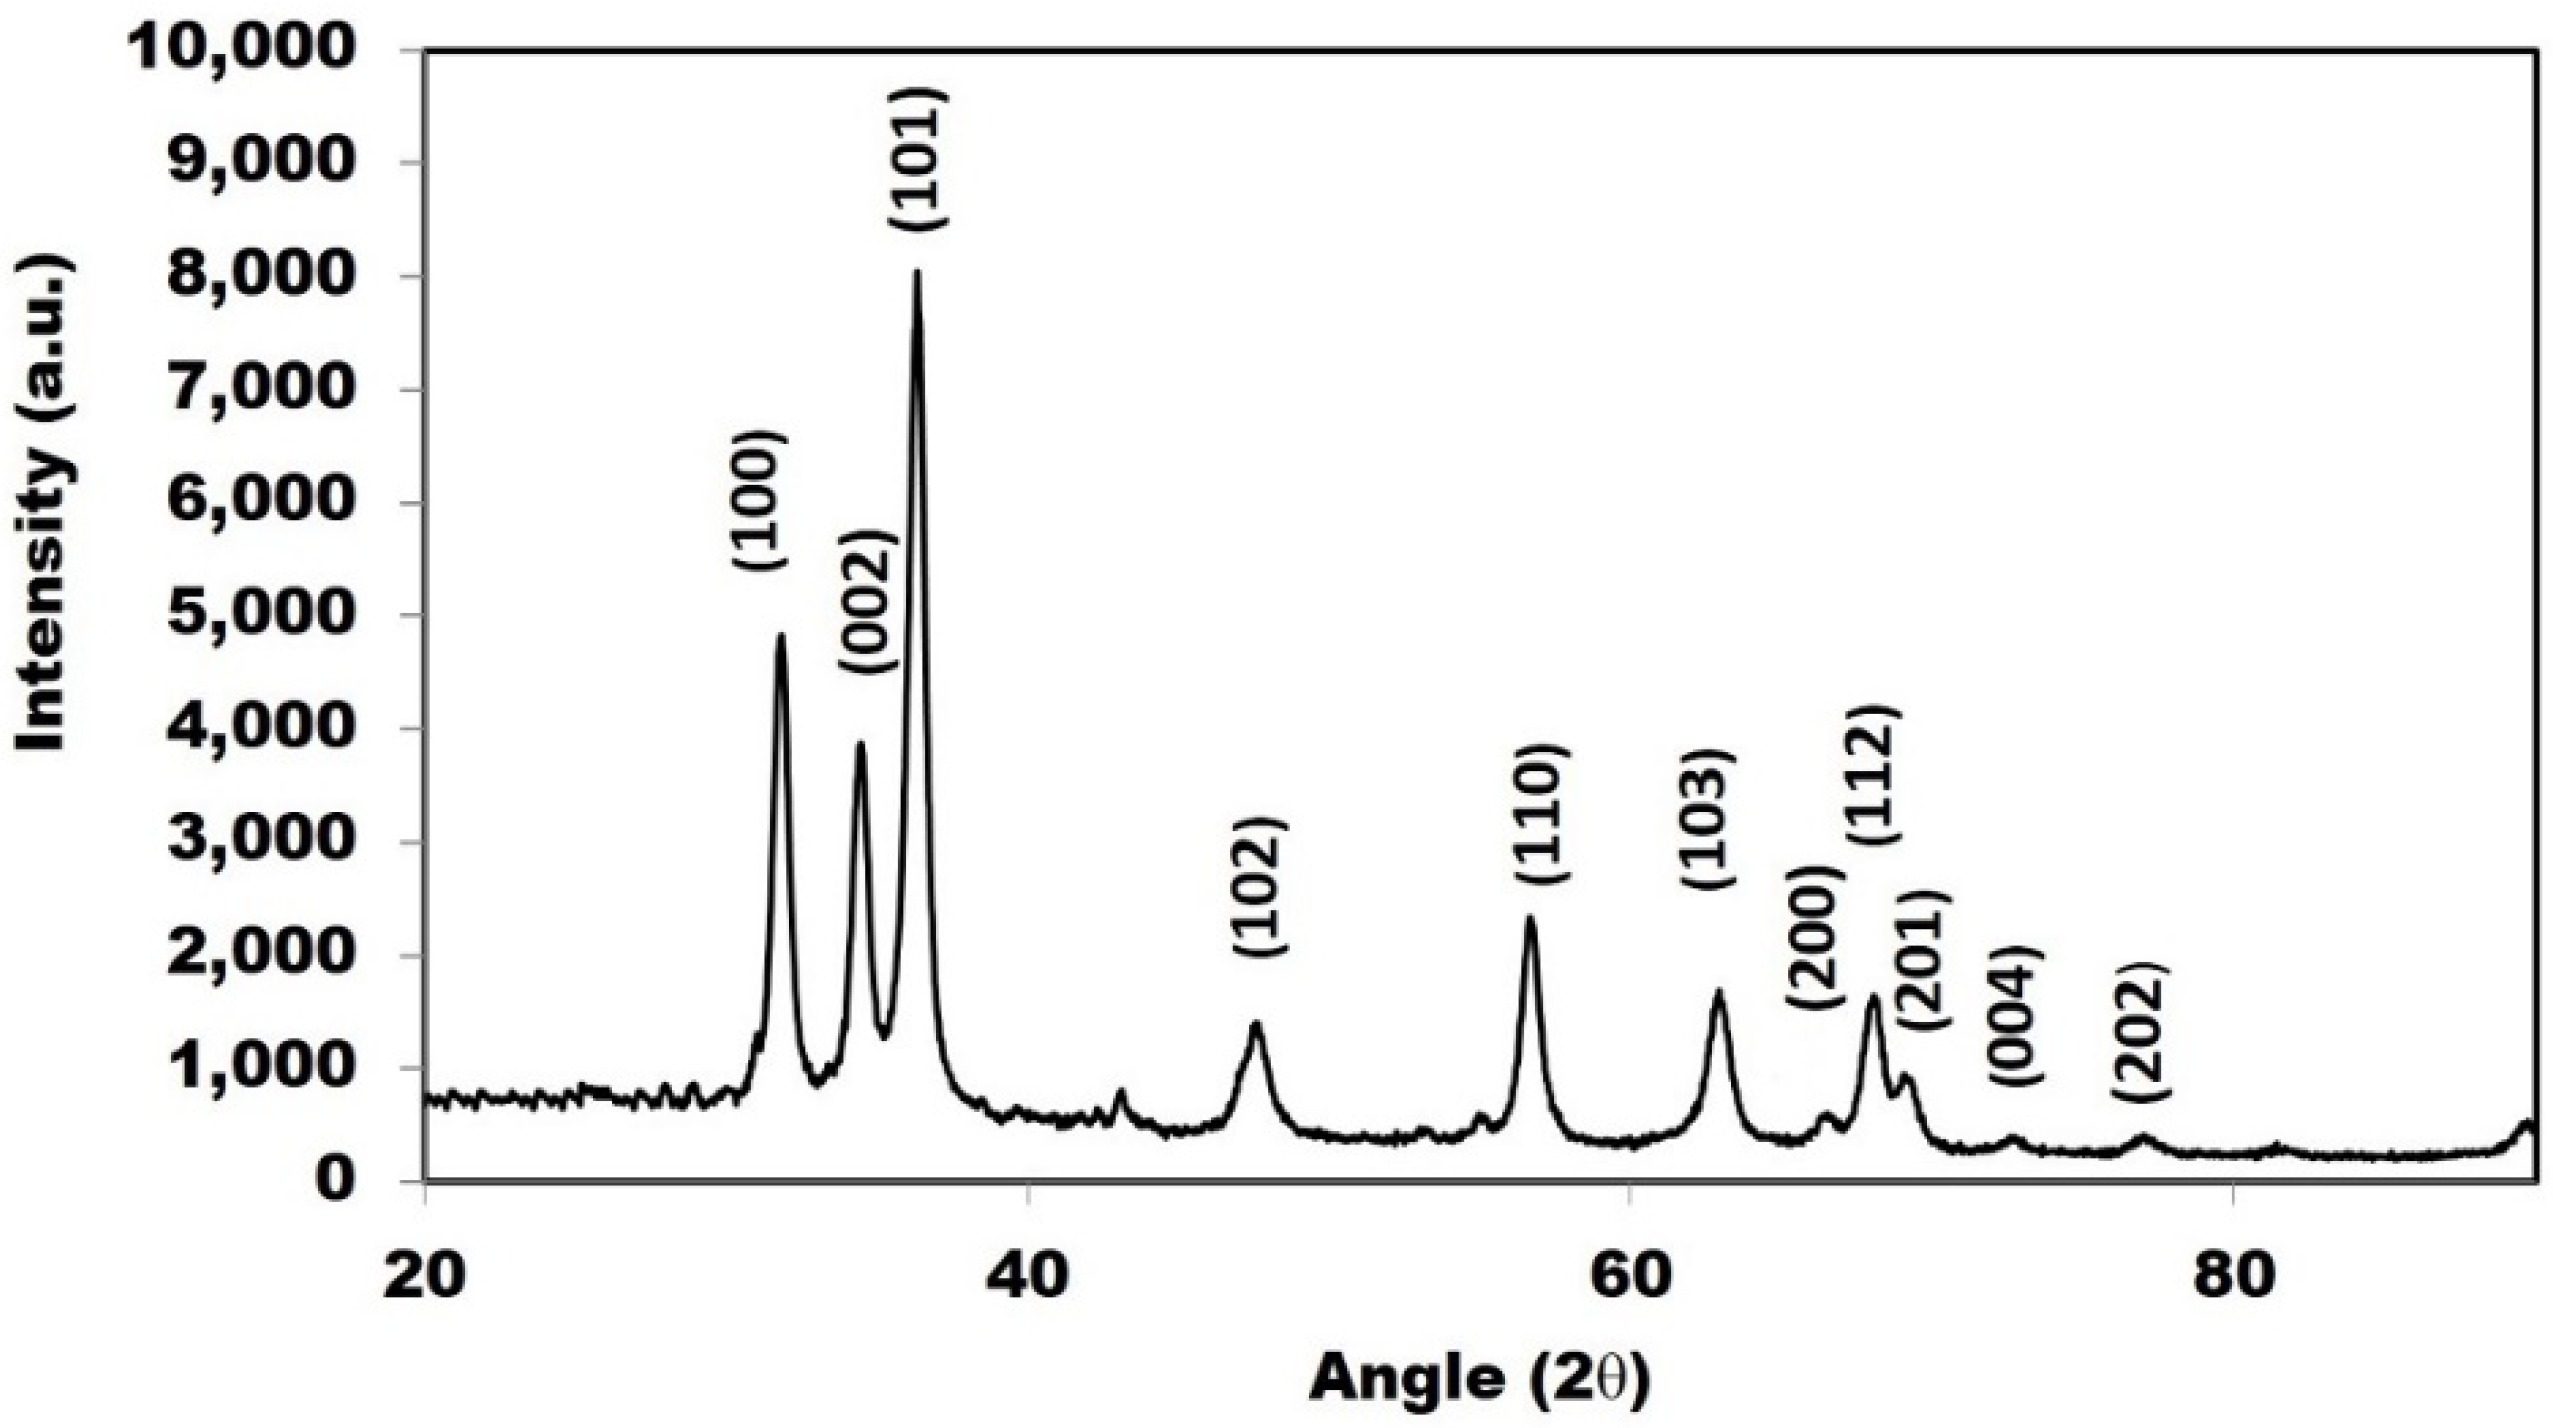
3.2. X-ray Diffraction Analysis of ZnO NS
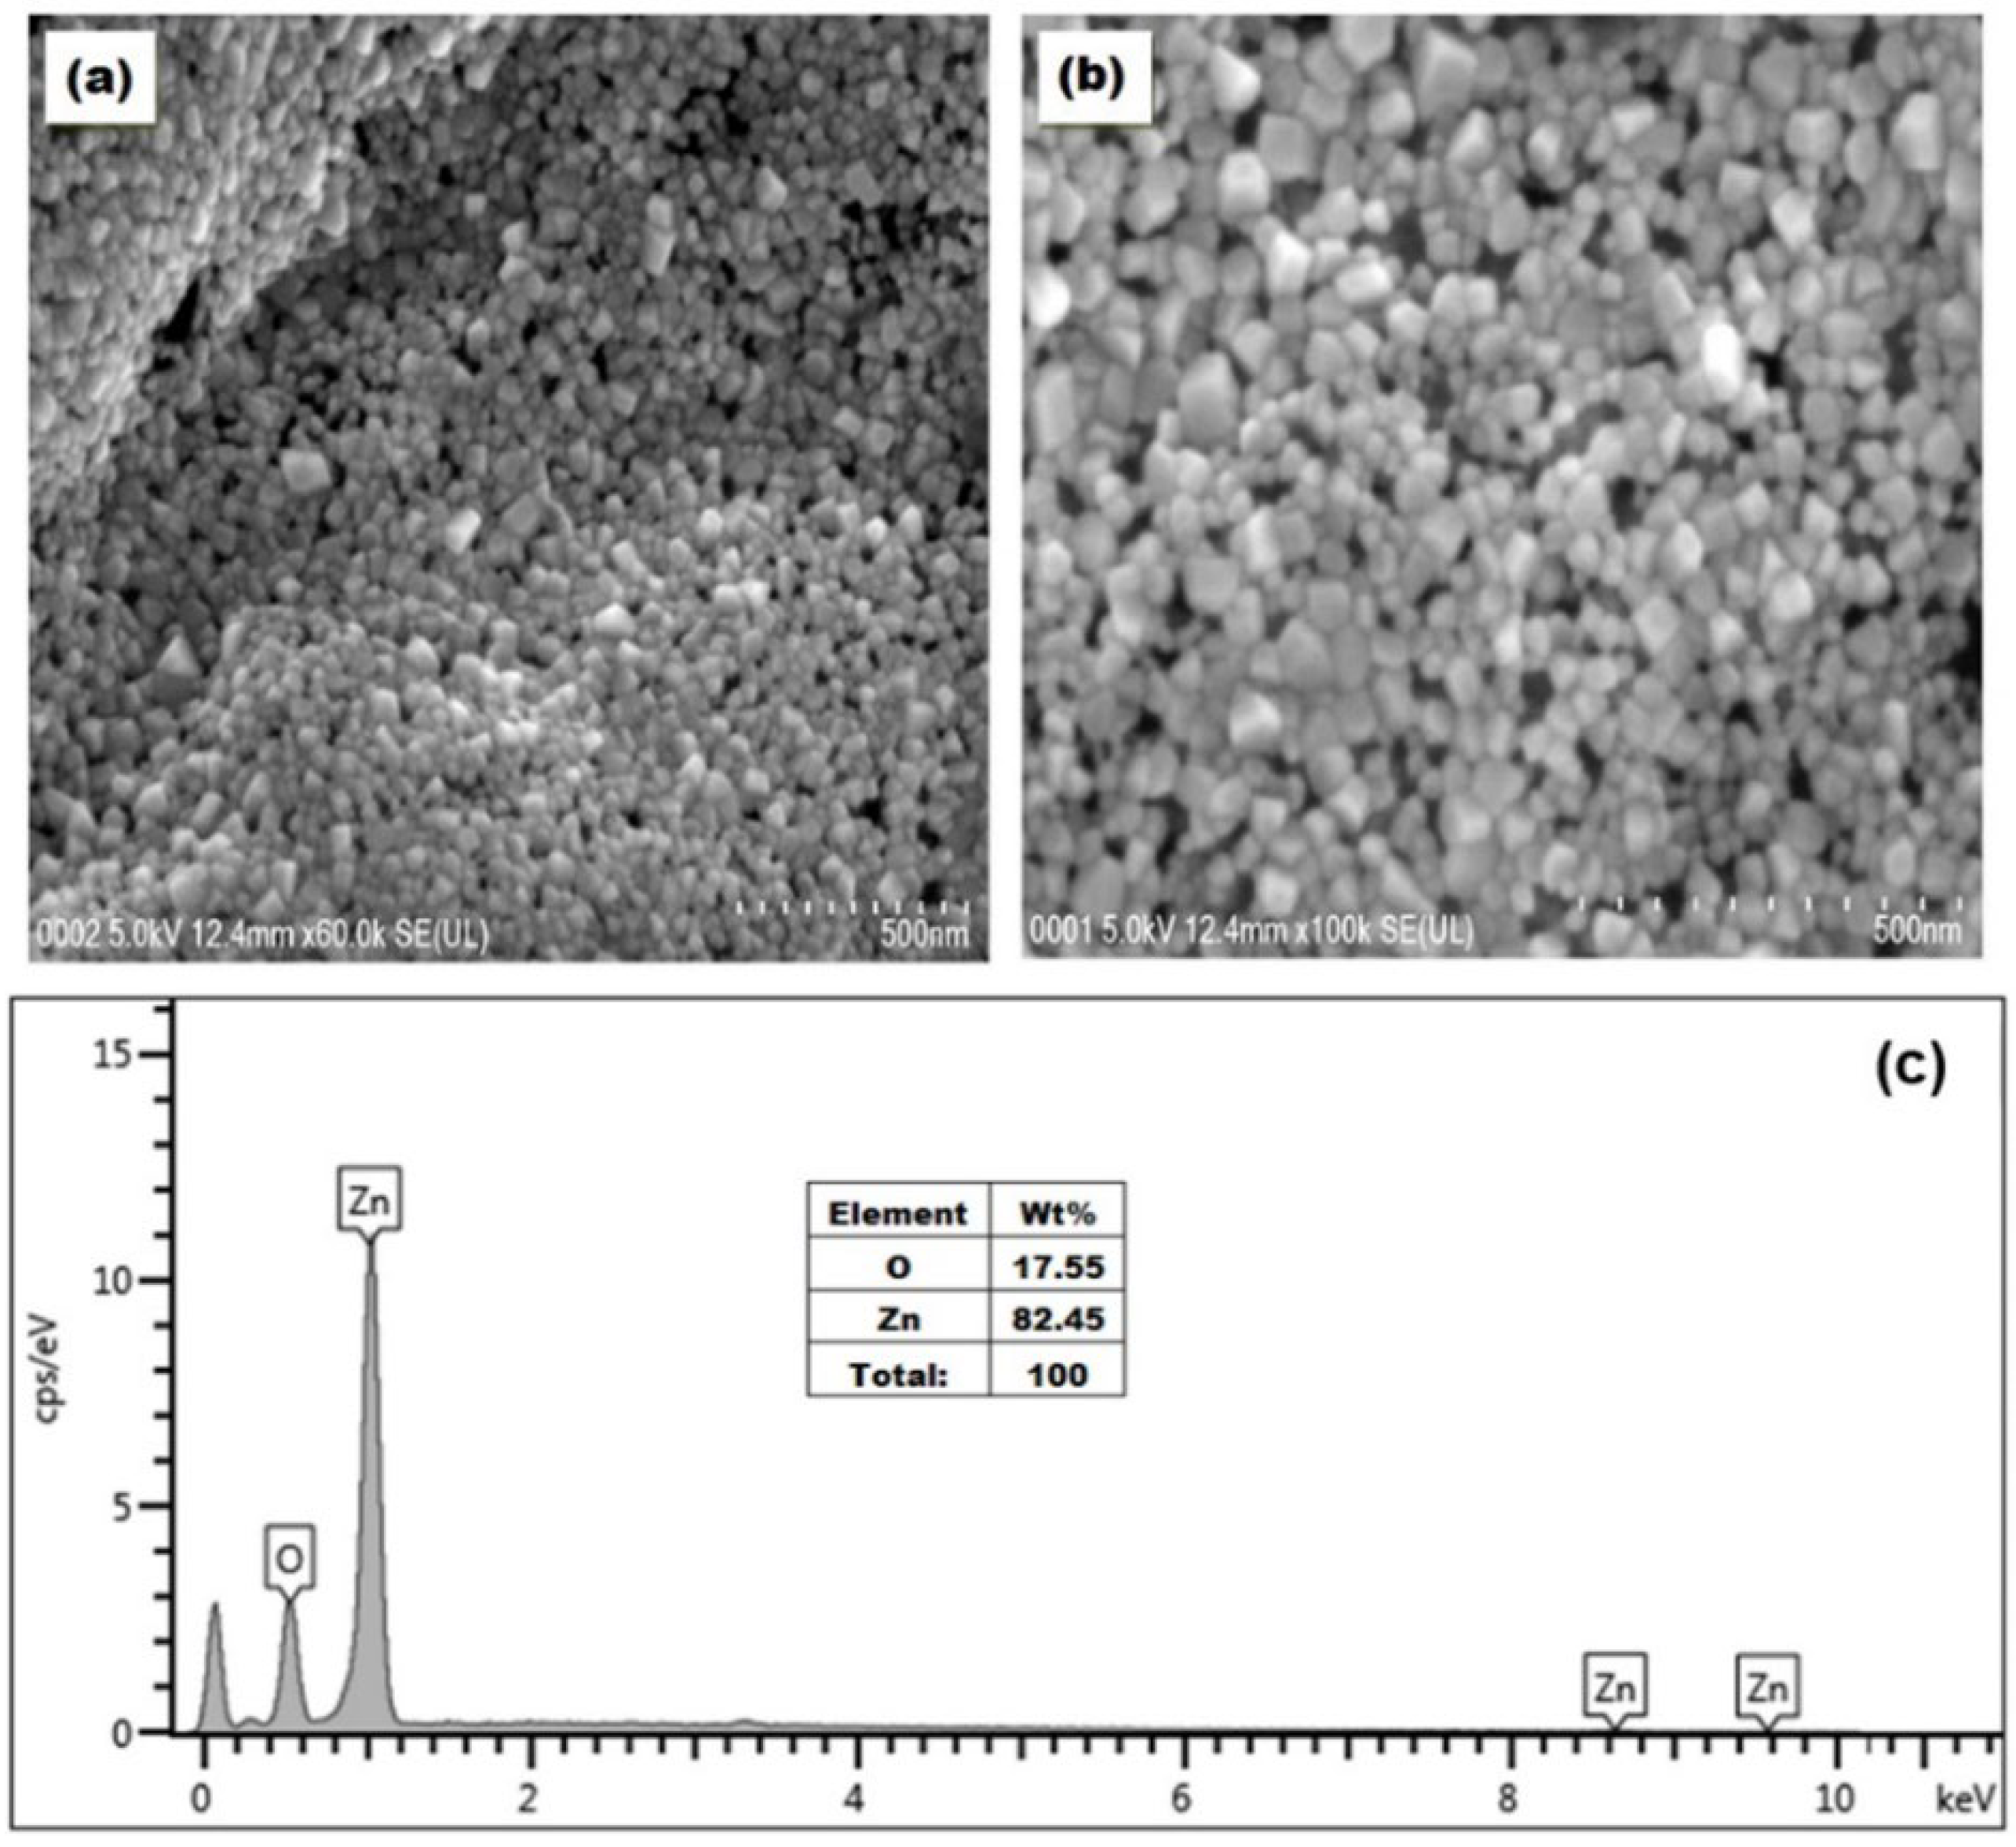
3.3. FESEM and EDX Pattern of ZnO NS
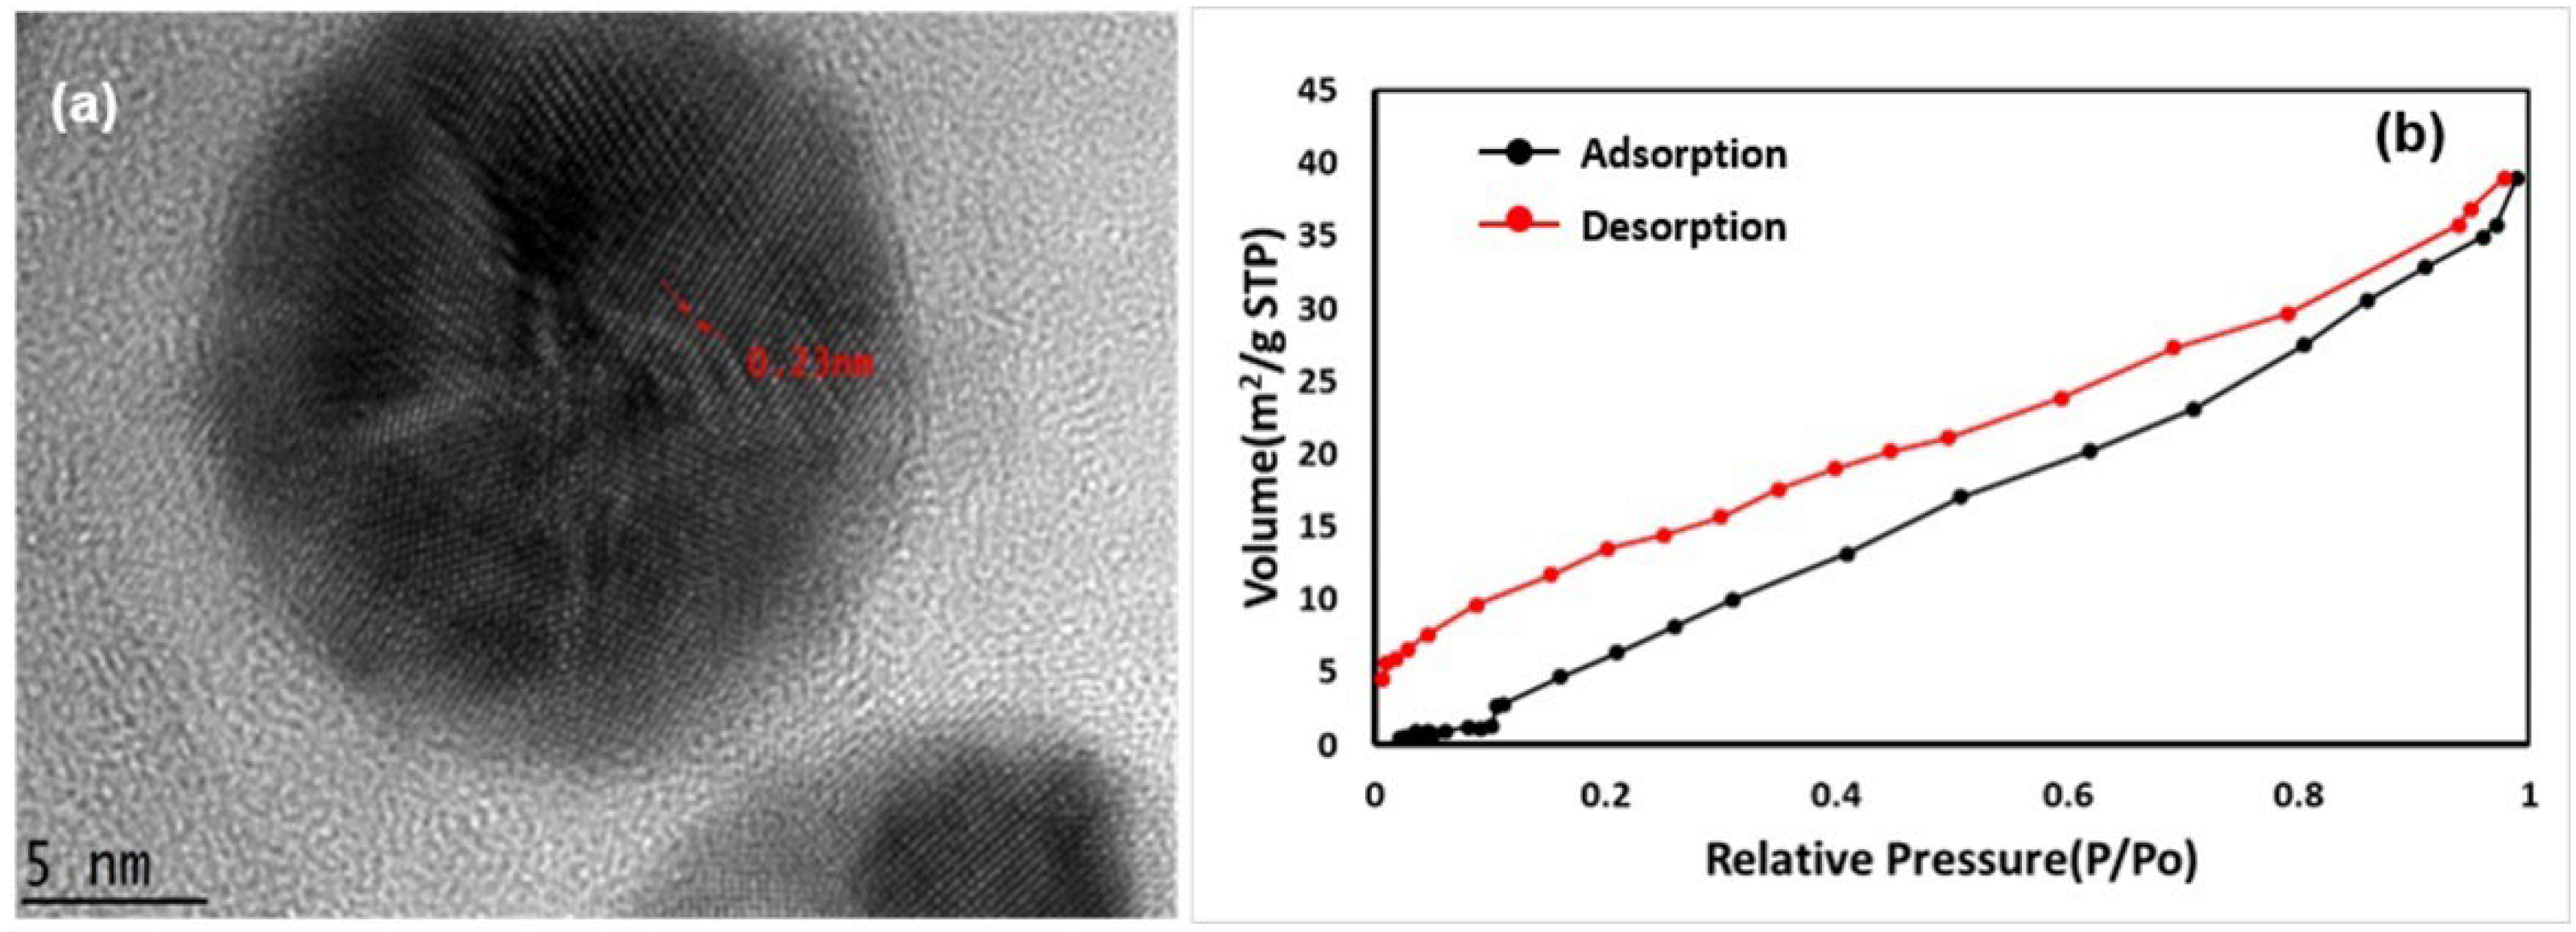
3.4. TEM and BET Measurement of Resultant Nanomaterials
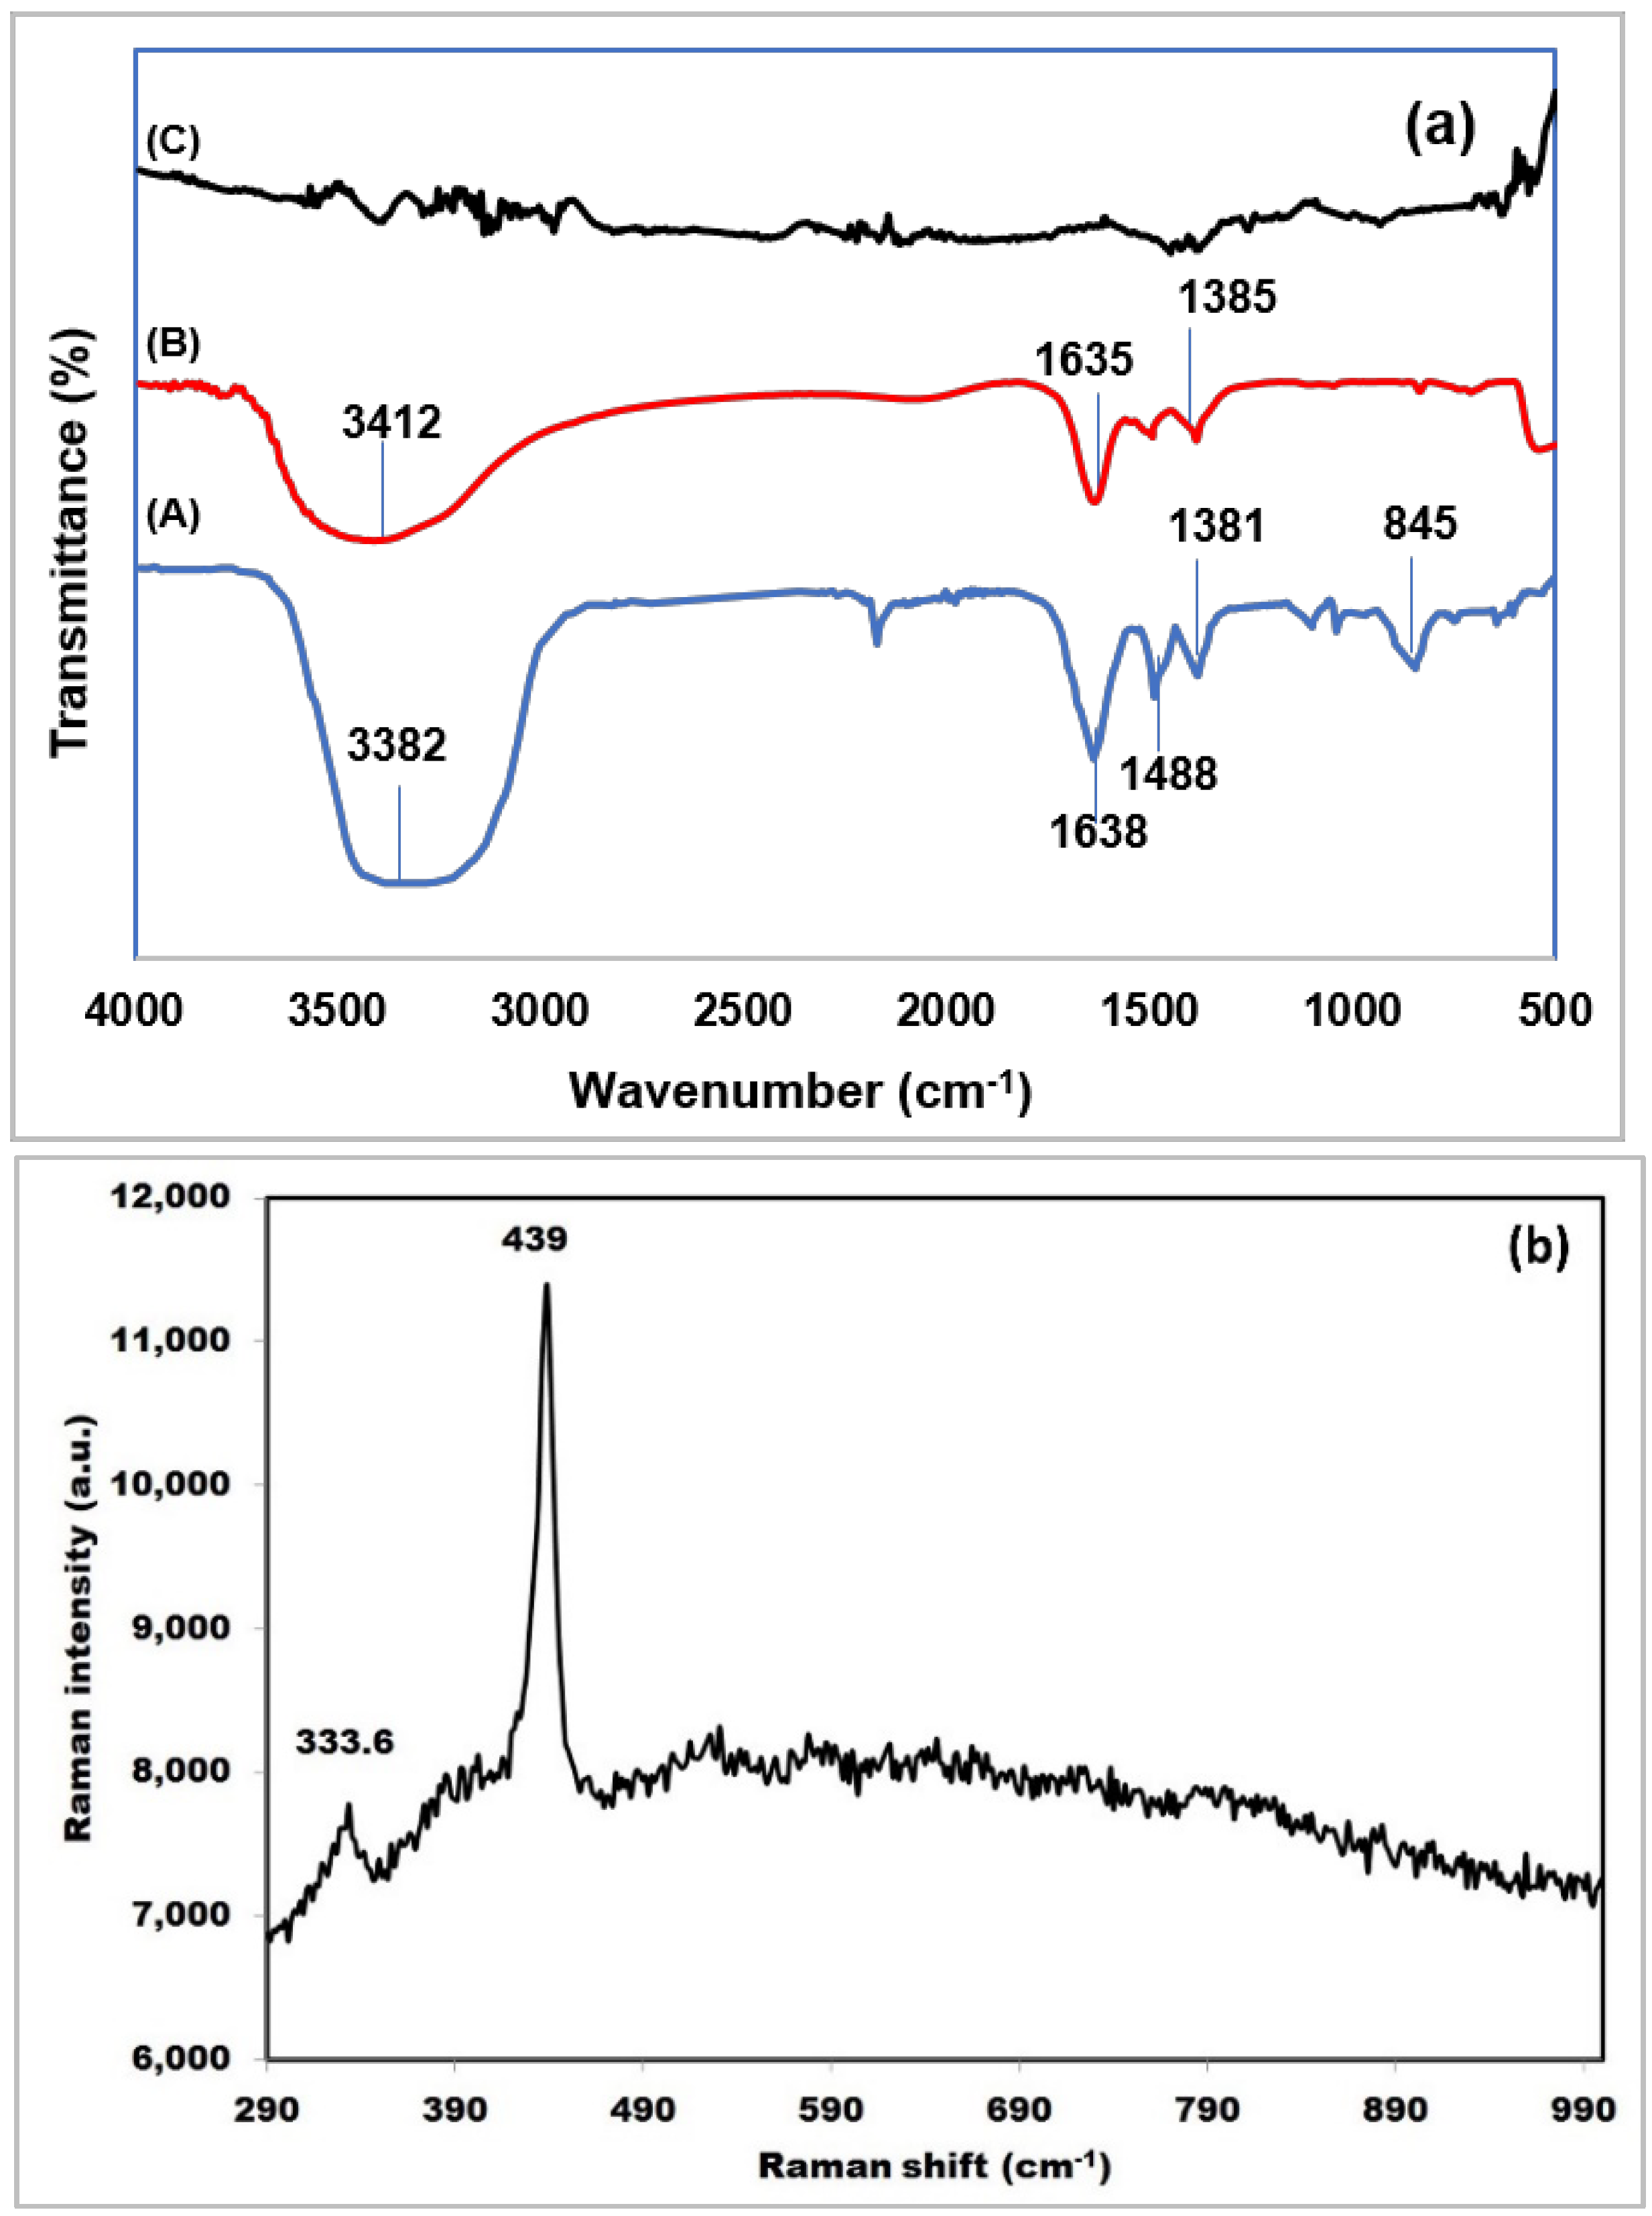
3.5. FTIR and Raman Measurement of ZnO NS
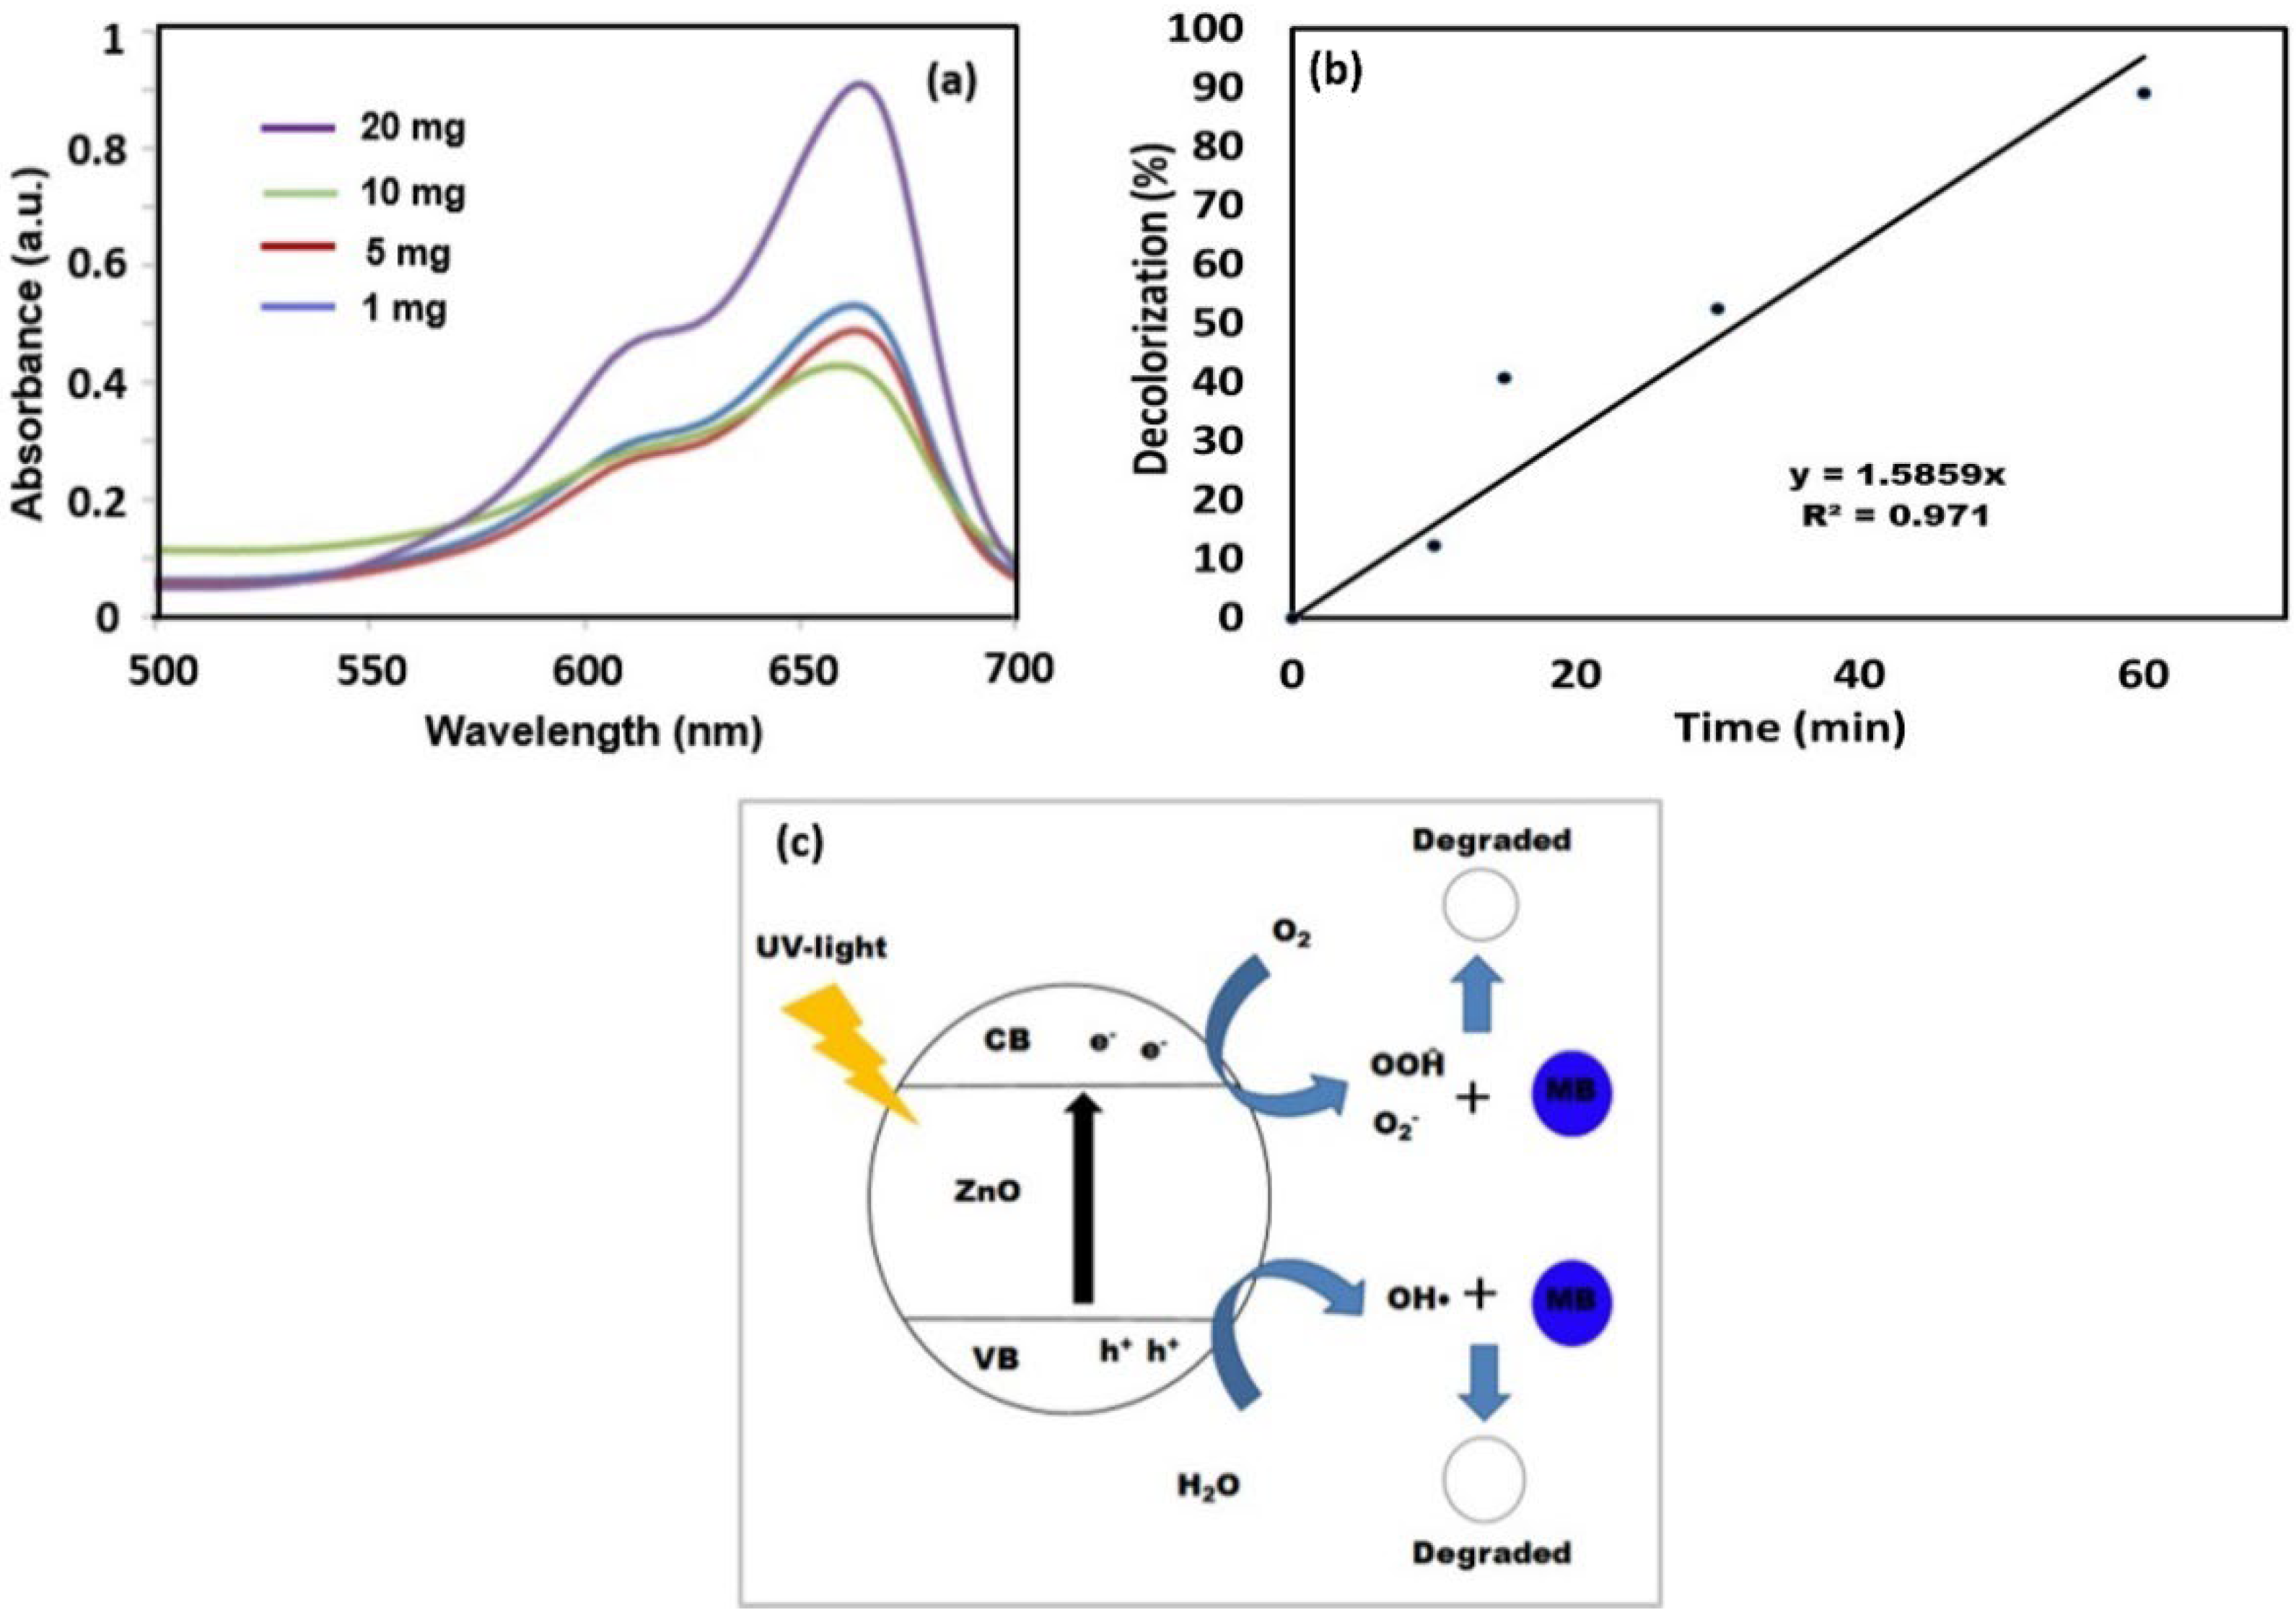
3.6. ZnO NS Photocatalytic Decolorization of Methylene Blue
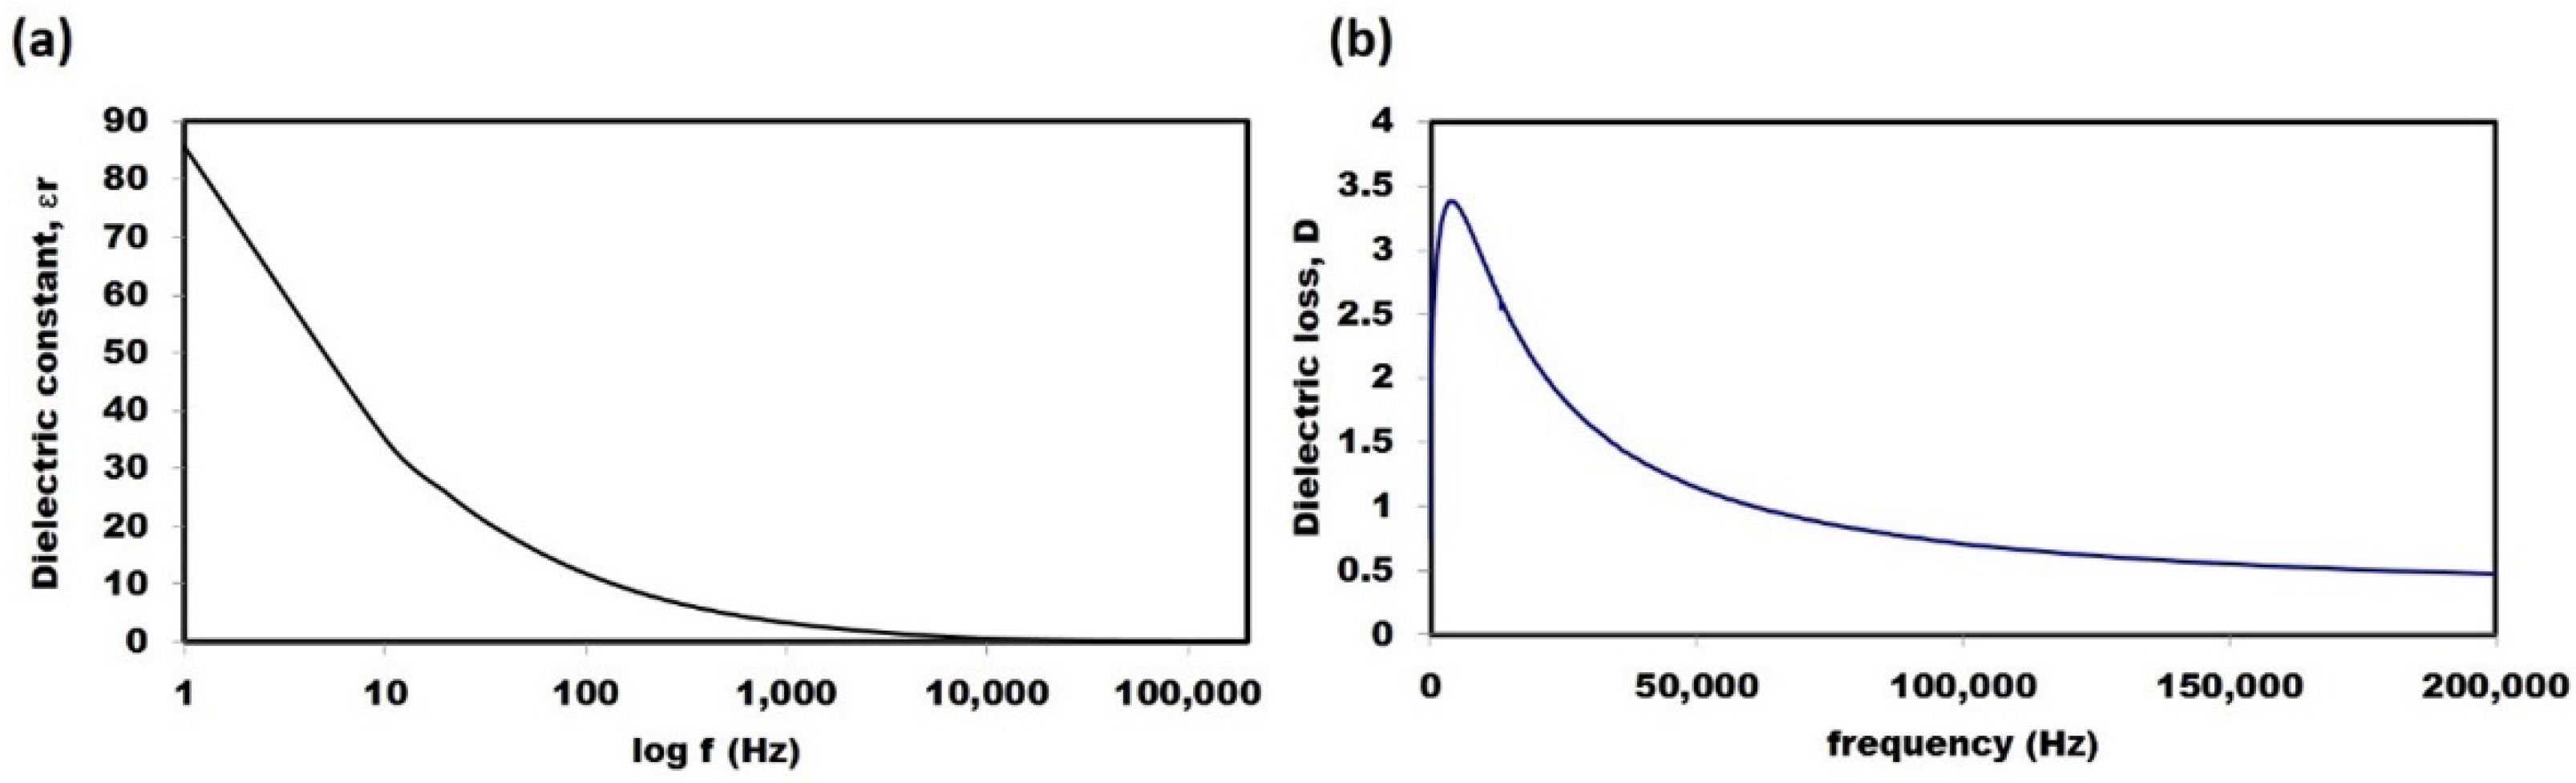
3.7. Dielectric Studies
3.8. Antibacterial Activity of ZnO NS
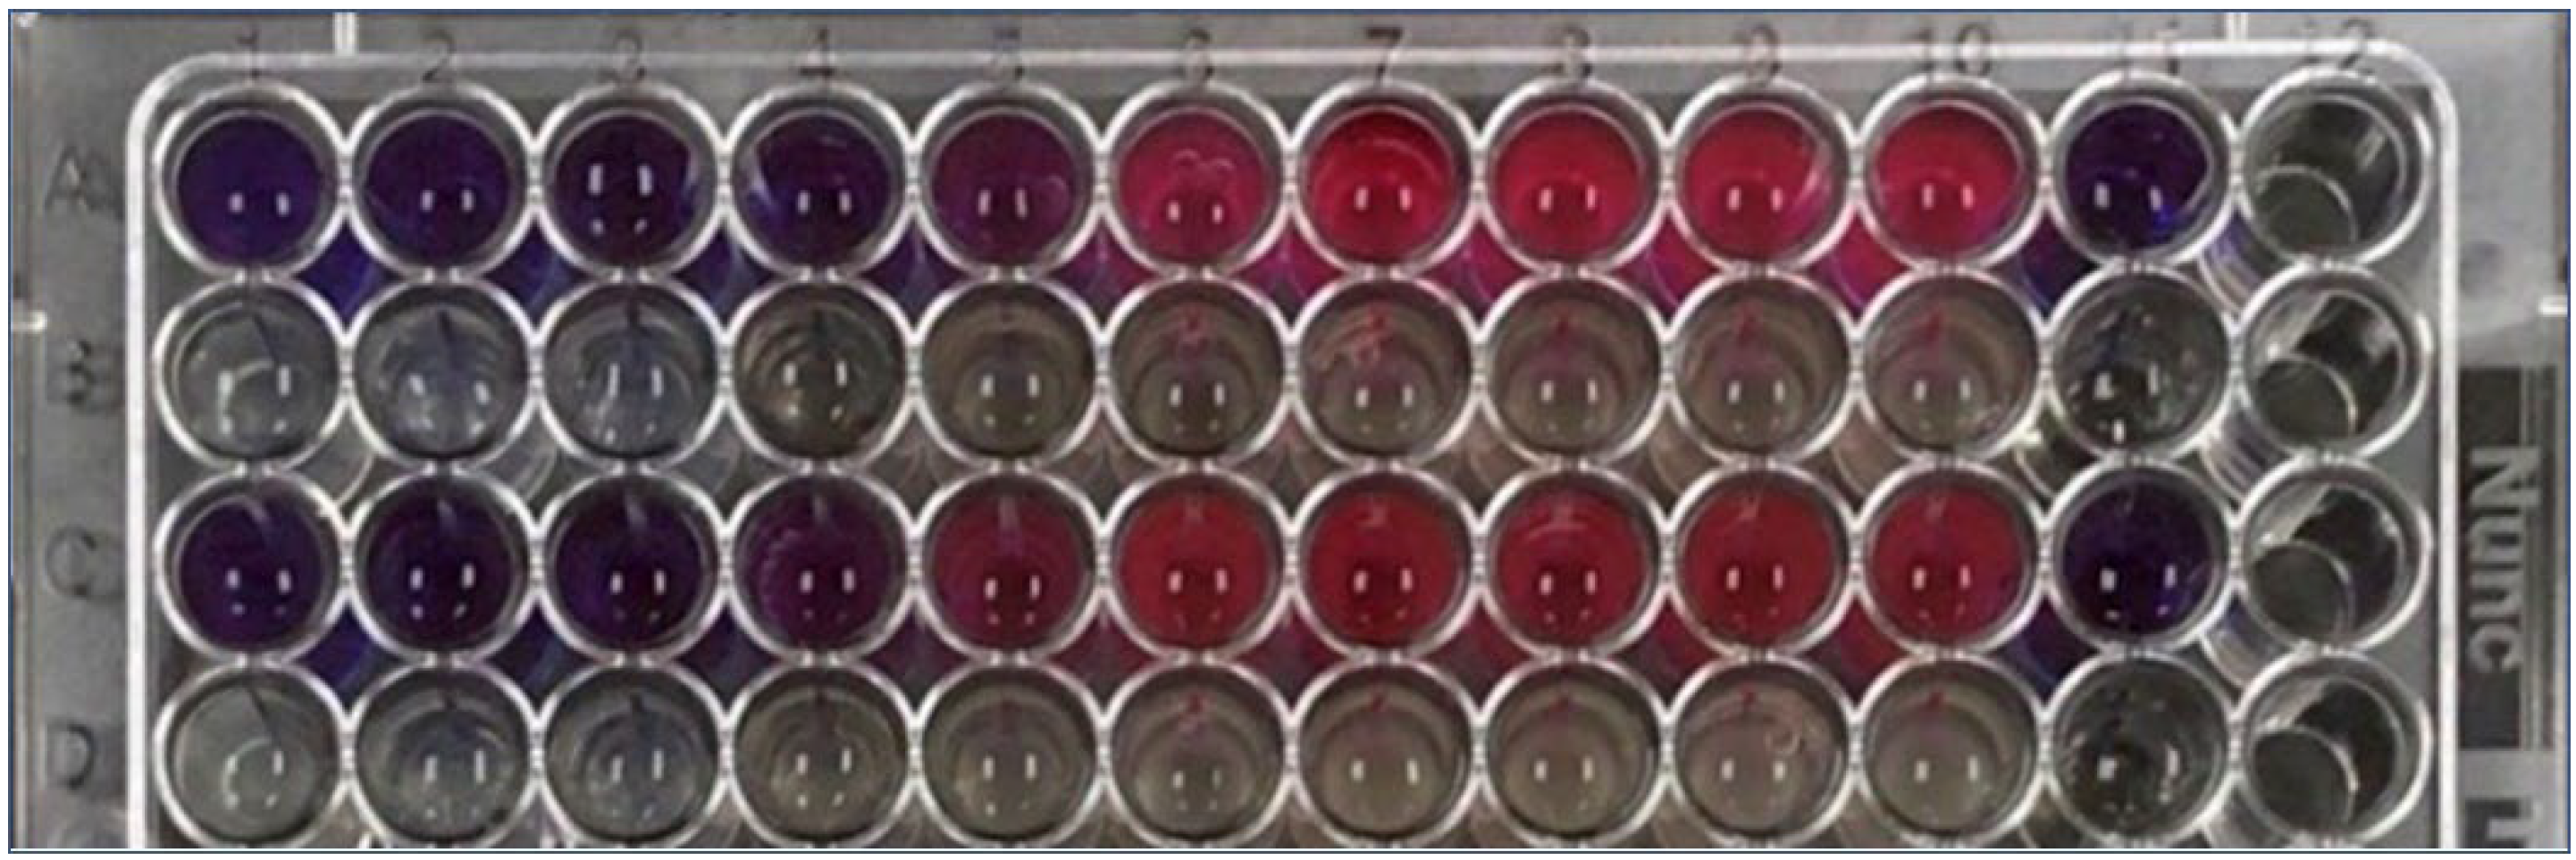
3.8.1. MIC Determination and Metabolic Activity
3.8.2. Disc Diffusion Assay
4. Conclusions
Author Contributions
Funding
Institutional Review Board Statement
Informed Consent Statement
Data Availability Statement
Acknowledgments
Conflicts of Interest
References
- Asmatulu, R.; Claus, R.; Mecham, J.; Corcoran, S. Nanotechnology-associated coatings for aircrafts. Mater. Sci. 2007, 43, 415–422. [Google Scholar] [CrossRef]
- Kalantar-zadeh, K.; Fry, B. Nanotechnology-Enabled Sensors; Springer Science & Business Media: Berlin/Heidelberg, Germany, 2007. [Google Scholar]
- Im, J.-H.; Jang, I.-H.; Pellet, N.; Grätzel, M.; Park, N.-G. Growth of CH3NH3PbI3 cuboids with controlled size for high-efficiency perovskite solar cells. Nat. Nanotechnol. 2014, 9, 927–932. [Google Scholar] [CrossRef] [PubMed]
- Lee, S.W.; Yabuuchi, N.; Gallant, B.M.; Chen, S.; Kim, B.-S.; Hammond, P.T.; Shao-Horn, Y. High-power lithium batteries from functionalized carbon-nanotube electrodes. Nat. Nanotechnol. 2010, 5, 531. [Google Scholar] [CrossRef] [PubMed]
- Sakthi Mohan, P.; Sonsuddin, F.; Mainal, A.B.; Yahya, R.; Venkatraman, G.; Vadivelu, J.; Al-Farraj, D.A.; Al-Mohaimeed, A.M.; Alarjani, K.M. Facile In-Situ Fabrication of a Ternary ZnO/TiO2/Ag Nanocomposite for Enhanced Bactericidal and Biocompatibility Properties. Antibiotics 2021, 10, 86. [Google Scholar] [CrossRef] [PubMed]
- Gopinath, V.; MubarakAli, D.; Vadivelu, J.; Manjunath Kamath, S.; Syed, A.; Elgorban, A.M. Synthesis of biocompatible chitosan decorated silver nanoparticles biocomposites for enhanced antimicrobial and anticancer property. Process Biochem. 2020, 99, 348–356. [Google Scholar] [CrossRef]
- Mani, V.M.; Nivetha, S.; Sabarathinam, S.; Barath, S.; Das, M.P.A.; Basha, S.; Elfasakhany, A.; Pugazhendhi, A. Multifunctionalities of mycosynthesized zinc oxide nanoparticles (ZnONPs) from Cladosporium tenuissimum FCBGr: Antimicrobial additives for paints coating, functionalized fabrics and biomedical properties. Prog. Org. Coat. 2022, 163, 106650. [Google Scholar] [CrossRef]
- Gopinath, V.; Kamath, S.M.; Priyadarshini, S.; Chik, Z.; Alarfaj, A.A.; Hirad, A.H. Multifunctional applications of natural polysaccharide starch and cellulose: An update on recent advances. Biomed. Pharmacother. 2022, 146, 112492. [Google Scholar] [CrossRef]
- Prasad, K.S.; Prasad, S.K.; Veerapur, R.; Lamraoui, G.; Prasad, A.; Prasad, M.N.N.; Singh, S.K.; Marraiki, N.; Syed, A.; Shivamallu, C. Antitumor Potential of Green Synthesized ZnONPs Using Root Extract of Withania somnifera against Human Breast Cancer Cell Line. Separations 2021, 8, 8. [Google Scholar] [CrossRef]
- Lu, P.-J.; Huang, S.-C.; Chen, Y.-P.; Chiueh, L.-C.; Shih, D.Y.-C. Analysis of titanium dioxide and zinc oxide nanoparticles in cosmetics. J. Food Drug Anal. 2015, 23, 587–594. [Google Scholar] [CrossRef] [Green Version]
- Suresh, D.; Nethravathi, P.C.; Udayabhanu; Rajanaika, H.; Nagabhushana, H.; Sharma, S.C. Green synthesis of multifunctional zinc oxide (ZnO) nanoparticles using Cassia fistula plant extract and their photodegradative, antioxidant and antibacterial activities. Mater. Sci. Semicond. Process. 2015, 31, 446–454. [Google Scholar] [CrossRef]
- Özgür, Ü.; Alivov, Y.I.; Liu, C.; Teke, A.; Reshchikov, M.; Doğan, S.; Avrutin, V.; Cho, S.-J.; Morkoc, H. A comprehensive review of ZnO materials and devices. J. Appl. Phys. 2005, 98, 11. [Google Scholar] [CrossRef] [Green Version]
- Fanun, M. The Role of Colloidal Systems in Environmental Protection; Elsevier: Amsterdam, The Netherlands, 2014. [Google Scholar]
- Foroutan, R.; Peighambardoust, S.J.; Boffito, D.C.; Ramavandi, B. Sono-Photocatalytic Activity of Cloisite 30B/ZnO/Ag2O Nanocomposite for the Simultaneous Degradation of Crystal Violet and Methylene Blue Dyes in Aqueous Media. Nanomaterials 2022, 12, 3103. [Google Scholar] [CrossRef]
- Wei, X.; Chen, D.; Wang, L.; Ma, Y.; Yang, W. Carboxylate-functionalized hollow polymer particles modified polyurethane foam for facile and selective removal of cationic dye. Appl. Surf. Sci. 2022, 579, 152153. [Google Scholar] [CrossRef]
- Siripireddy, B.; Mandal, B.K. Facile green synthesis of zinc oxide nanoparticles by Eucalyptus globulus and their photocatalytic and antioxidant activity. Adv. Powder Technol. 2017, 28, 785–797. [Google Scholar] [CrossRef]
- Marquez, J.R.; Rodríguez, C.M.B.; Herrera, C.M.; Rosas, E.R.; Angel, O.Z.; Pozos, O.T. Effect of surface morphology of ZnO electrodeposited on photocatalytic oxidation of methylene blue dye part I: Analytical study. Int. J. Electrochem. Sci. 2011, 6, 4059–4069. [Google Scholar]
- Mclaren, A.; Valdes-Solis, T.; Li, G.; Tsang, S.C. Shape and size effects of ZnO nanocrystals on photocatalytic activity. J. Am. Chem. Soc. 2009, 131, 12540–12541. [Google Scholar] [CrossRef]
- Barnes, R.J.; Molina, R.; Xu, J.; Dobson, P.J.; Thompson, I.P. Comparison of TiO2 and ZnO nanoparticles for photocatalytic degradation of methylene blue and the correlated inactivation of gram-positive and gram-negative bacteria. J. Nanopart. Res. 2013, 15, 1432. [Google Scholar] [CrossRef]
- Ramesh, M.; Anbuvannan, M.; Viruthagiri, G. Green synthesis of ZnO nanoparticles using Solanum nigrum leaf extract and their antibacterial activity. Spectrochim. Acta Part A Mol. Biomol. Spectrosc. 2015, 136, 864–870. [Google Scholar] [CrossRef]
- Suresh, D.; Shobharani, R.; Nethravathi, P.; Kumar, M.P.; Nagabhushana, H.; Sharma, S. Artocarpus gomezianus aided green synthesis of ZnO nanoparticles: Luminescence, photocatalytic and antioxidant properties. Spectrochim. Acta Part A Mol. Biomol. Spectrosc. 2015, 141, 128–134. [Google Scholar] [CrossRef]
- Sangeetha, G.; Rajeshwari, S.; Venckatesh, R. Green synthesis of zinc oxide nanoparticles by aloe barbadensis miller leaf extract: Structure and optical properties. Mater. Res. Bull. 2011, 46, 2560–2566. [Google Scholar] [CrossRef]
- Philip, D. Green synthesis of gold and silver nanoparticles using Hibiscus rosa sinensis. Phys. E Low-Dimens. Syst. Nanostruct. 2010, 42, 1417–1424. [Google Scholar] [CrossRef]
- Kora, A.J.; Sashidhar, R.; Arunachalam, J. Gum kondagogu (Cochlospermum gossypium): A template for the green synthesis and stabilization of silver nanoparticles with antibacterial application. Carbohydr. Polym. 2010, 82, 670–679. [Google Scholar] [CrossRef]
- Kumar, V.; Yadav, S.K. Plant-mediated synthesis of silver and gold nanoparticles and their applications. J. Chem. Technol. Biotechnol. 2009, 84, 151–157. [Google Scholar] [CrossRef]
- Chittibabu, S.K.; Chintagumpala, K.; Chandrasekhar, A. Porous dielectric materials based wearable capacitance pressure sensors for vital signs monitoring: A review. Mater. Sci. Semicond. Process. 2022, 151, 106976. [Google Scholar] [CrossRef]
- Zamiri, R.; Singh, B.; Belsley, M.S.; Ferreira, J. Structural and dielectric properties of Al-doped ZnO nanostructures. Ceram. Int. 2014, 40, 6031–6036. [Google Scholar] [CrossRef]
- Lanje, A.S.; Sharma, S.J.; Ningthoujam, R.S.; Ahn, J.-S.; Pode, R.B. Low temperature dielectric studies of zinc oxide (ZnO) nanoparticles prepared by precipitation method. Adv. Powder Technol. 2013, 24, 331–335. [Google Scholar] [CrossRef]
- Jayachandran, A.; Aswathy, T.R.; Nair, A.S. Green synthesis and characterization of zinc oxide nanoparticles using Cayratia pedata leaf extract. Biochem. Biophys. Rep. 2021, 26, 100995. [Google Scholar] [CrossRef]
- Cullity, B.D. Elements of X-ray Diffraction; Addison-Wesley Publishing: Boston, MA, USA, 1956. [Google Scholar]
- Karnan, T.; Selvakumar, S.A.S. Biosynthesis of ZnO nanoparticles using rambutan (Nephelium lappaceum L.) peel extract and their photocatalytic activity on methyl orange dye. J. Mol. Struct. 2016, 1125, 358–365. [Google Scholar] [CrossRef]
- Khan, M.S.; Ranjani, S.; Hemalatha, S. Synthesis and characterization of Kappaphycus alvarezii derived silver nanoparticles and determination of antibacterial activity. Mater. Chem. Phys. 2022, 282, 125985. [Google Scholar] [CrossRef]
- Chakansin, C.; Yostaworakul, J.; Warin, C.; Kulthong, K.; Boonrungsiman, S. Resazurin rapid screening for antibacterial activities of organic and inorganic nanoparticles: Potential, limitations and precautions. Anal. Biochem. 2022, 637, 114449. [Google Scholar] [CrossRef]
- Selvanathan, V.; Aminuzzaman, M.; Tan, L.X.; Win, Y.F.; Cheah, E.S.G.; Heng, M.H.; Tey, L.-H.; Arullappan, S.; Algethami, N.; Alharthi, S.S.; et al. Synthesis, characterization, and preliminary in vitro antibacterial evaluation of ZnO nanoparticles derived from soursop (Annona muricata L.) leaf extract as a green reducing agent. J. Mater. Res. Technol. 2022, 20, 2931–2941. [Google Scholar] [CrossRef]
- Sadiq, H.; Sher, F.; Sehar, S.; Lima, E.C.; Zhang, S.; Iqbal, H.M.N.; Zafar, F.; Nuhanović, M. Green synthesis of ZnO nanoparticles from Syzygium Cumini leaves extract with robust photocatalysis applications. J. Mol. Liq. 2021, 335, 116567. [Google Scholar] [CrossRef]
- Vijayakumar, S.; Vaseeharan, B.; Malaikozhundan, B.; Shobiya, M. Laurus nobilis leaf extract mediated green synthesis of ZnO nanoparticles: Characterization and biomedical applications. Biomed. Pharmacother. 2016, 84, 1213–1222. [Google Scholar] [CrossRef]
- Bayrami, A.; Alioghli, S.; Rahim Pouran, S.; Habibi-Yangjeh, A.; Khataee, A.; Ramesh, S. A facile ultrasonic-aided biosynthesis of ZnO nanoparticles using Vaccinium arctostaphylos L. leaf extract and its antidiabetic, antibacterial, and oxidative activity evaluation. Ultrason. Sonochem. 2019, 55, 57–66. [Google Scholar] [CrossRef]
- Zhou, R.; Wu, X.-Y.; Zhao, Q.; Liu, K.-K.; Dong, L.; Shan, C.-X. One-step synthesis of multi-colored ZnO nanoparticles for white light-emitting diodes. J. Lumin. 2022, 252, 119425. [Google Scholar] [CrossRef]
- Li, W.; Yang, H.; Jiang, X.; Liu, Q. Highly selective CO2 adsorption of ZnO based N-doped reduced graphene oxide porous nanomaterial. Appl. Surf. Sci. 2016, 360, 143–147. [Google Scholar] [CrossRef]
- Prerna; Agarwal, H.; Goyal, D. Photocatalytic degradation of textile dyes using phycosynthesised ZnO nanoparticles. Inorg. Chem. Commun. 2022, 142, 109676. [Google Scholar] [CrossRef]
- Kusiak-Nejman, E.; Wojnarowicz, J.; Morawski, A.W.; Narkiewicz, U.; Sobczak, K.; Gierlotka, S.; Lojkowski, W. Size-dependent effects of ZnO nanoparticles on the photocatalytic degradation of phenol in a water solution. Appl. Surf. Sci. 2021, 541, 148416. [Google Scholar] [CrossRef]
- Kuang, D.; Liu, L.; Mead, J.L.; Deng, L.; Luo, H.; Wang, S. Facile synthesis and excellent microwave absorption performance of ultra-small ZnO-doped onion-like carbon nanoparticles. Mater. Res. Bull. 2023, 157, 112007. [Google Scholar] [CrossRef]
- Gnanasangeetha, D.; Thambavani, D.S. Biogenic production of zinc oxide nanoparticles using Acalypha indica. J. Chem. Biol. Phys. Sci. 2013, 4, 238. [Google Scholar]
- Nasrollahzadeh, M.; Sajadi, S.M.; Rostami-Vartooni, A.; Hussin, S.M. Green synthesis of CuO nanoparticles using aqueous extract of Thymus vulgaris L. leaves and their catalytic performance for N-arylation of indoles and amines. J. Colloid Interface Sci. 2016, 466, 113–119. [Google Scholar] [CrossRef] [PubMed]
- Vankudoth, S.; Dharavath, S.; Veera, S.; Maduru, N.; Chada, R.; Chirumamilla, P.; Gopu, C.; Taduri, S. Green synthesis, characterization, photoluminescence and biological studies of silver nanoparticles from the leaf extract of Muntingia calabura. Biochem. Biophys. Res. Commun. 2022, 630, 143–150. [Google Scholar] [CrossRef] [PubMed]
- Momeni, S.S.; Nasrollahzadeh, M.; Rustaiyan, A. Green synthesis of the Cu/ZnO nanoparticles mediated by Euphorbia prolifera leaf extract and investigation of their catalytic activity. J. Colloid Interface Sci. 2016, 472, 173–179. [Google Scholar] [CrossRef] [PubMed]
- Ojha, A.K.; Srivastava, M.; Kumar, S.; Hassanein, R.; Singh, J.; Singh, M.K.; Materny, A. Influence of crystal size on the electron–phonon coupling in ZnO nanocrystals investigated by Raman spectroscopy. Vib. Spectrosc. 2014, 72, 90–96. [Google Scholar] [CrossRef]
- Procek, M.; Pustelny, T.; Stolarczyk, A. Influence of External Gaseous Environments on the Electrical Properties of ZnO Nanostructures Obtained by a Hydrothermal Method. Nanomaterials 2016, 6, 227. [Google Scholar] [CrossRef] [Green Version]
- Arguello, C.; Rousseau, D.; Porto, S.; Cheesman, L.; Scott, J. Rayleigh scattering of linearly polarized light from optically active quartz. Appl. Opt. 1968, 7, 1913–1915. [Google Scholar] [CrossRef]
- Mohamed, R.; Mkhalid, I.; Baeissa, E.; Al-Rayyani, M. Photocatalytic degradation of methylene blue by Fe/ZnO/SiO2 nanoparticles under visiblelight. J. Nanotechnol. 2012, 2012, 329082. [Google Scholar] [CrossRef] [Green Version]
- Maness, P.-C.; Smolinski, S.; Blake, D.M.; Huang, Z.; Wolfrum, E.J.; Jacoby, W.A. Bactericidal activity of photocatalytic TiO2 reaction: Toward an understanding of its killing mechanism. Appl. Environ. Microbiol. 1999, 65, 4094–4098. [Google Scholar] [CrossRef] [Green Version]
- Hayat, K.; Gondal, M.A.; Khaled, M.M.; Ahmed, S. Kinetic study of laser-induced photocatalytic degradation of dye (alizarin yellow) from wastewater using nanostructured ZnO. J. Environ. Sci. Health Part A 2010, 45, 1413–1420. [Google Scholar] [CrossRef]
- Irani, M.; Mohammadi, T.; Mohebbi, S. Photocatalytic Degradation of Methylene Blue with ZnO Nanoparticles; a Joint Experimental and Theoretical Study. J. Mex. Chem. Soc. 2016, 60, 218–225. [Google Scholar] [CrossRef]
- Nosaka, Y.; Nosaka, A. Understanding Hydroxyl Radical (·OH) Generation Processes in Photocatalysis. ACS Energy Lett. 2016, 1, 356–359. [Google Scholar] [CrossRef] [Green Version]
- Ashokkumar, M.; Muthukumaran, S. Electrical, dielectric, photoluminescence and magnetic properties of ZnO nanoparticles co-doped with Co and Cu. J. Magn. Magn. Mater. 2015, 374, 61–66. [Google Scholar] [CrossRef]
- Mote, V.; Purushotham, Y.; Dole, B. Structural, morphological, physical and dielectric properties of Mn doped ZnO nanocrystals synthesized by sol–gel method. Mater. Des. 2016, 96, 99–105. [Google Scholar] [CrossRef]
- Omar, K.; Ooi, M.J.; Hassin, M. Investigation on dielectric constant of zinc oxide. Mod. Appl. Sci. 2009, 3, 110. [Google Scholar] [CrossRef] [Green Version]
- Gul, I.; Abbasi, A.; Amin, F.; Anis-ur-Rehman, M.; Maqsood, A. Structural, magnetic and electrical properties of Co1−xZnxFe2O4 synthesized by co-precipitation method. J. Magn. Magn. Mater. 2007, 311, 494–499. [Google Scholar] [CrossRef]
- Sasi, S.; Fathima Fasna, P.H.; Bindu Sharmila, T.K.; Julie Chandra, C.S.; Antony, J.V.; Raman, V.; Nair, A.B.; Ramanathan, H.N. Green synthesis of ZnO nanoparticles with enhanced photocatalytic and antibacterial activity. J. Alloys Compd. 2022, 924, 166431. [Google Scholar] [CrossRef]
- Liu, J.; Huang, J.; Hu, Z.; Li, G.; Hu, L.; Chen, X.; Hu, Y. Chitosan-based films with antioxidant of bamboo leaves and ZnO nanoparticles for application in active food packaging. Int. J. Biol. Macromol. 2021, 189, 363–369. [Google Scholar] [CrossRef]
- Şahin, B.; Aydin, R.; Soylu, S.; Türkmen, M.; Kara, M.; Akkaya, A.; Çetin, H.; Ayyıldız, E. The effect of thymus syriacus plant extract on the main physical and antibacterial activities of ZnO nanoparticles synthesized by SILAR method. Inorg. Chem. Commun. 2022, 135, 109088. [Google Scholar] [CrossRef]
- Naserian, F.; Mesgar, A.S. Development of antibacterial and superabsorbent wound composite sponges containing carboxymethyl cellulose/gelatin/Cu-doped ZnO nanoparticles. Colloids Surf. B Biointerfaces 2022, 218, 112729. [Google Scholar] [CrossRef]
- Godoy-Gallardo, M.; Eckhard, U.; Delgado, L.M.; De Roo Puente, Y.J.; Hoyos-Nogués, M.; Gil, F.J.; Perez, R.A. Antibacterial approaches in tissue engineering using metal ions and nanoparticles: From mechanisms to applications. Bioact. Mater. 2021, 6, 4470–4490. [Google Scholar] [CrossRef]


Publisher’s Note: MDPI stays neutral with regard to jurisdictional claims in published maps and institutional affiliations. |
© 2022 by the authors. Licensee MDPI, Basel, Switzerland. This article is an open access article distributed under the terms and conditions of the Creative Commons Attribution (CC BY) license (https://creativecommons.org/licenses/by/4.0/).
Share and Cite
Ali, Z.A.; Shudirman, I.; Yahya, R.; Venkatraman, G.; Hirad, A.H.; Ansari, S.A. Green Synthesis of ZnO Nanostructures Using Pyrus pyrifolia: Antimicrobial, Photocatalytic and Dielectric Properties. Crystals 2022, 12, 1808. https://doi.org/10.3390/cryst12121808
Ali ZA, Shudirman I, Yahya R, Venkatraman G, Hirad AH, Ansari SA. Green Synthesis of ZnO Nanostructures Using Pyrus pyrifolia: Antimicrobial, Photocatalytic and Dielectric Properties. Crystals. 2022; 12(12):1808. https://doi.org/10.3390/cryst12121808
Chicago/Turabian StyleAli, Zainal Abidin, Iqabiha Shudirman, Rosiyah Yahya, Gopinath Venkatraman, Abdurahman Hajinur Hirad, and Siddique Akber Ansari. 2022. "Green Synthesis of ZnO Nanostructures Using Pyrus pyrifolia: Antimicrobial, Photocatalytic and Dielectric Properties" Crystals 12, no. 12: 1808. https://doi.org/10.3390/cryst12121808