
Feature Fusion Deep Learning Model for Defects Prediction in Crystal Structures

Department of Computer Sciences, College of Computer and Information Sciences, Princess Nourah Bint Abdulrahman University, P.O. Box 84428, Riyadh 11671, Saudi Arabia
*
Author to whom correspondence should be addressed.
Crystals 2022, 12(9), 1324; https://doi.org/10.3390/cryst12091324
Submission received: 25 August 2022
/
Revised: 6 September 2022
/
Accepted: 15 September 2022
/
Published: 19 September 2022
Abstract
:Detection of defective crystal structures can help in refute such defective structures to decrease industrial defects. In our research, we are concerned with Silicon nitride crystals. There are four types of crystal structure classes, namely no-defect structures, pristine crystal structures, defective random displacement crystal structures, and defective 25% vacancies crystal structures. This paper proposes a deep learning model to detect the four types of crystal structures with high accuracy and precision. The proposed model consists of both classification and regression models with a new loss function definition. After training both models, the features extracted are fused and utilized as an input to a perceptron classifier to identify the four types of crystal structures. A novel dense neural network (DNN) is proposed with a multitasking tactic. The developed multitask tactic is validated using a dataset of 16,000 crystal structures, with 30% highly defective crystals. Crystal structure images are captured under cobalt blue light. The multitask DNN model achieves an accuracy and precision of 97% and 96% respectively. Also, the average area under the curve (AUC) is 0.96 on average, which outperforms existing detection methods for crystal structures. The experiments depict the computational time comparison of a single training epoch of our model versus state-of-the-art models. the training computational time is performed using crystal structures diffraction image database of twelve image batches. It can be realized that the prediction computational time of our multitasking model is the least time of 21 s.
1. Introduction
Crystal structure erosions in Silicon nitride can yield defect products in many areas such as drugs and chemical industrial products. Defect crystal structures that are caused by the erosion of the surface can be detected from diffraction images. Detection of crystal structures at their early industrial stages decrease the risk of defective products greatly. With the development of cobalt blue light photography, crystal structures can be detected at their early industrial stages in a low-cost method [1,2,3,4].
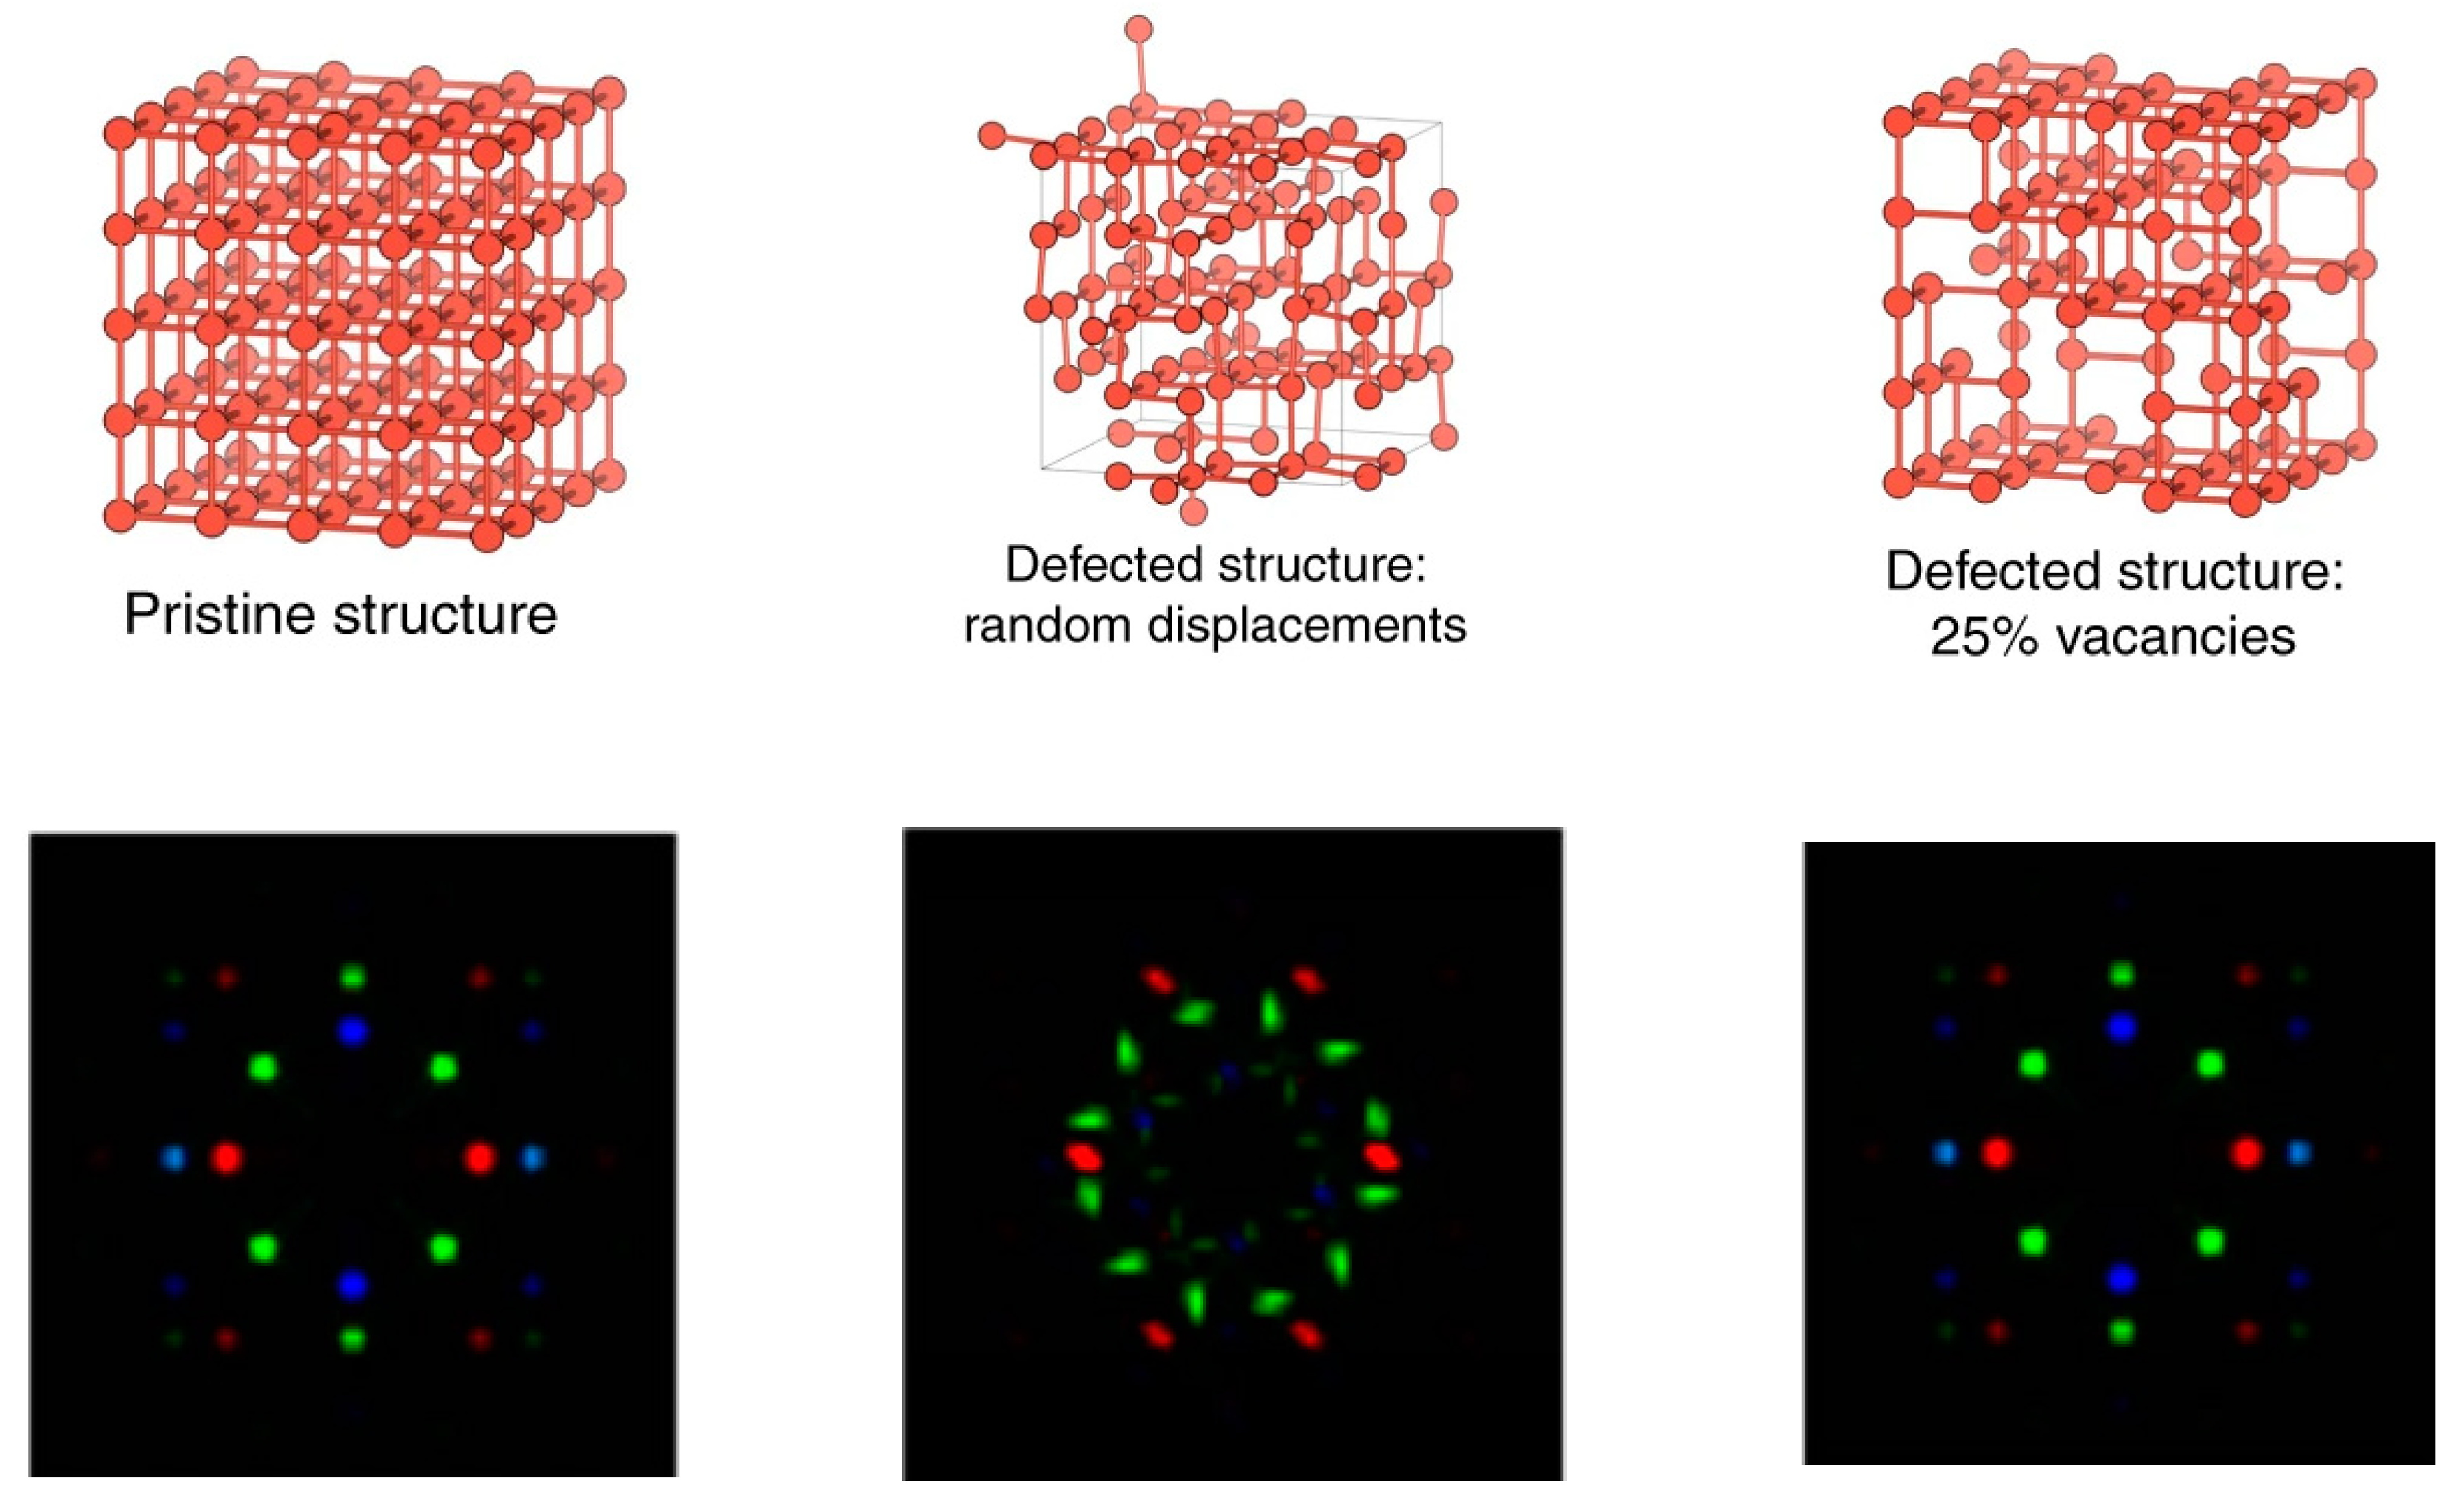
Most cases of crystal structures, especially the defective 25% vacancies one, need to be detected for getting rid of them. There are two major types or classes of crystal structures: non-proliferating basal crystal structures (NP-crystal structures) and proliferating basal crystal structures (P-crystal structures) [2]. NP-crystal structures are classified into three types: (i) pristine NP-crystal structures, which appear very early, and defective random NP-crystal structures. P-crystal structures are the defective 25% vacancies phase of crystal structures. Thus, crystal structures are ranked into four types, namely: No-defect structures, pristine crystal structures, defective random displacement crystal structures, and defective 25% vacancies crystal structures [5,6].
Figure 1 shows images of the normal surface and different severity of defected cases of crystal structures. The main issue of crystal structure defects includes the difficulty of recognizing light-defect types. There are lots of similarities among pristine and sometimes defective random displacement cases in the diffraction images. If crystal structures are left to proceed to the defective 25% vacancy types, industrial defects can occur [7].
Many models have been proposed in the literature for the computerized classification of crystal structures. In the previous models, automatic identification of defects of crystal structure surfaces have been proposed. Detection of irregularities and rupture of crystals in images was presented in [6,7]. In incidents of micro-defect recognition, computerized image processing techniques were presented in [8,9,10,11]. Several models for vacancy classes in phosphorus light images were proposed in [12,13,14,15,16], and the detection of crystal structures lesions was accomplished for the crystal structures image dataset in [17].
Deep learning architectures and image processing were used for crystal structure automated detection [17,18,19,20]. In [17], a region convolutional network (R-CNN) for crystal structure detection and classifying into binary cases was established. In [18], a fusion deep learning model was developed to detect damage in images from the dataset in [21].
Previous works developed the detection and classification of crystal structure types. These types of work introduce classification as a conventional image processing architecture where experts selected features are deliberated [22,23,24,25,26]. In [27], the authors proposed a technique using random forest on selected handcrafted features to detect the severity of defects in crystal structures. In [28], a crystal structures taxonomy was implemented utilizing BossaNova vector mid-level that represents the Bags of Visual features. In [29], a dual-stage handcrafted feature selection was used: one stage for identifying the existence of defects in the crystal structures and then detecting the severity phase. A bag of features method was established for crystal structure classes by using the orientated histogram gradients in. In [30], both dual and multi-classification were attained by using multiresolution Horlick features.
Deep learning methods and neural networks have produced much success in the classification challenge due to their learning abilities without prior feature knowledge [31,32,33]. In [31], a CNN model was used for the dual classification of crystal structures from diffraction surface images, that focus on binary crystal structures output as yes or no defect-existence. In [32], the Efficient-B5 CNN was utilized for classification, and binocular images for both surfaces (up and down surfaces) were used as inputs to the transfer learning architecture. In [33], a Deep CNN for distinguishing two cases of normal crystal structures and No-defect structures was perceived. In [34], the surface images were entered into two Deep CNN architectures with each one performing a binary grouping of crystal structures. In [35], a CNN smartphone model was built for the classification of crystal structures at enhanced speed.
Identification of several cases of crystal structures was employed in [36,37,38,39,40]. In [40], a Deep-CNN for four-cases identification of crystal structures was employed. A hyper-parameter was performed in the V4 model to acquire four cases of crystal structures in [36]. A deep CNN was employed to detect the four cases of crystal structures in [37], where a Feed Forward CNN and a deep CNN were employed in the CrysPACS database for crystal structure identification. In [38], deep learning models (AleXNet and ResNet) were matched for crystal structure grouping using the Kaggle database with VggNet for the highest accuracy. A transfer learning app using a pre-trained model was constructed to identify four cases of crystal structures in [39]. This app executes in real-time using crystal structures images that are taken via special lenses that are attached to the cameras.
Recent research utilized the fusion of two deep learning stages for the crystal structures classification. In [39,40], the incorporation of two deep learning stages was utilized to identify the presence or absence of crystal structures, referable crystal structures, and crystal structures-sight-threatening crystal structures. In [39], a fusion of two pre-trained deep CNNs, namely Resnet50 and Dense121, were employed for crystal structure classification. All of this research considered the fusion of more than one classification CNN models, but none of them employ regression techniques that can determine which features have the higher impact on the classification process. It should be noted that the stated crystal structures classification research reported defective random displacement accuracy. Other papers suggested multitasking CNN for image analysis with lesion industrial tasks. In [40], a semi-supervised CNN is proposed for multitasking segmentation with the simultaneous splitting of red abrasions in surface images. In [41], an area multitask detection model was presented to detect various defects of the crystal structure types.
In this research, we proposed a multitasking fusion deep CNN for classifying diffraction images into the four-crystal structure types from no-defect structures to defective 25% vacancies crystal structures. There is a dependency across the four crystal structure types. This dependency across the types can be computed using a regression model in the direction of accurate classifying. We proposed a multitasking fusion model comprising a regression computational model and a classification model to detect the four crystal structure types. The classifier differentiates between the crystal structure classes utilizing a sole loss function. Our deep model utilizes a twofold loss function, the first fold is utilized in the classifier and the other fold is used in the regression model which increases accuracy to a great extent.
The contribution of this paper is as follows:
- A densely connected CNN accompanied by a squeeze layer is proposed to build a multitasking fusion model.
- The squeeze layers have the advantage of differentiating channel dependencies.
- A Perceptron layer is utilized at the end to perceive the four crystal structure types of crystal structures from the features selected by a classifier and the regression phase.
- We also incorporate transfer learning and a public dataset to assess the performance of the proposed model.
2. Methods and Materials
In this section, we are proposing a crystal structures classification model. The next subsections will represent the types of the proposed technique.
2.1. The Multitasking Classification Model
Crystal structures develop from lower to higher severity levels yielding a dependency between progressive types. Regression can investigate the dependency between the types. Therefore, we propose a multitasking classification model with regression to classify the four types of crystal structures.
The multitasking classifier can differentiate between the four types, while the regression learns the interrelation among the four types. The classifier performs its job using one or more loss functions [14]. Our proposed model utilizes two loss functions namely the entropy and the square error (SEF) functions the first one is used for the classification while the latter is used for the regression. The regression technique is trained on the crystal structures image dataset utilizing a linear activation and the classifier is trained individually by using a Softmax function [1,2,3,4], as depicted by the following equations:
where, pi and ti are the predicted true values, respectively. N is the number of different classes.
where m is the number of classes, and α is the output of the final connected layer. The probability of the classifier output is between zero and one.
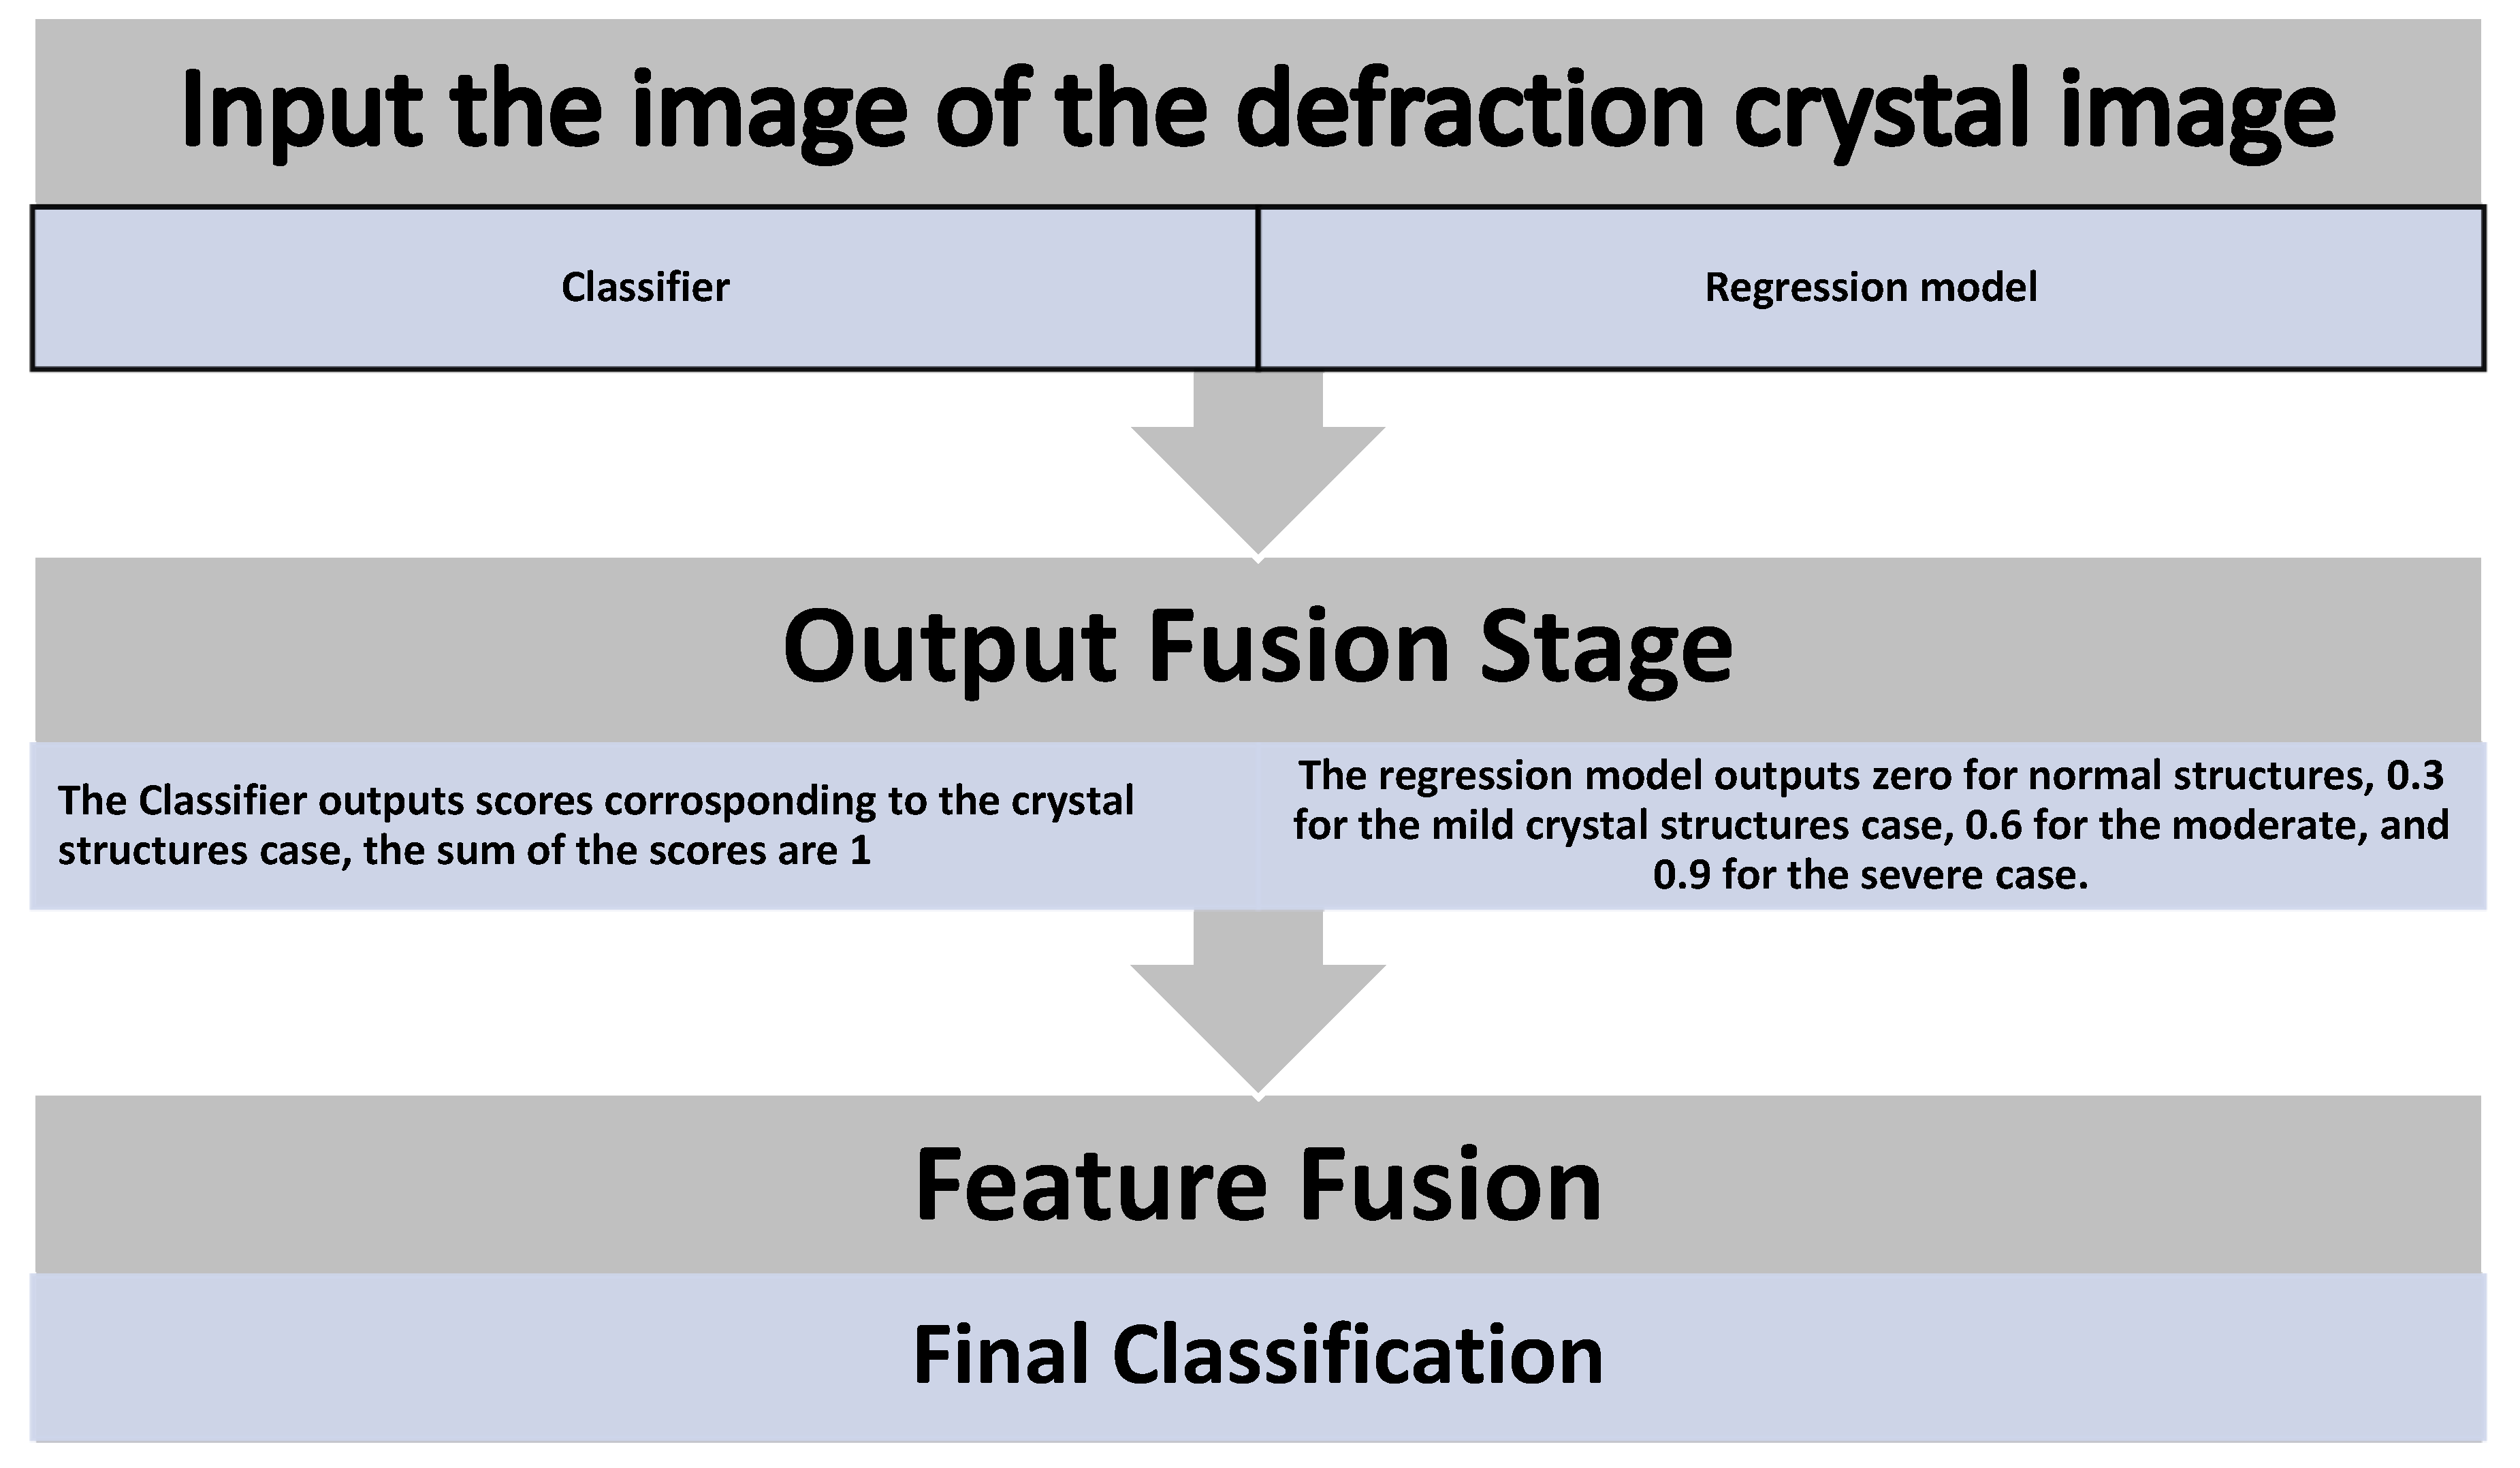
The classifier generates four scores that are added to one equivalent to the four classes of crystal structures. The regression has only one output concerning the defect severity of the crystal structures case. The regression is trained with the outputs zero for No-defect structures, 0.3 for the pristine crystal structures case, 0.6 for the defective random displacement, and 0.9 for the defective 25% vacancies case. Therefore, the regression algorithm outputs only one value indicating one of four crystal structure types. Features extracted by the classifier and the regressor are fused and fed into the final perceptron layer for the concluding classification. The proposed model is depicted in Figure 2.
2.2. Implementation of the Deep Learning Model
2.2.1. The Multitasking Network (Mtask)
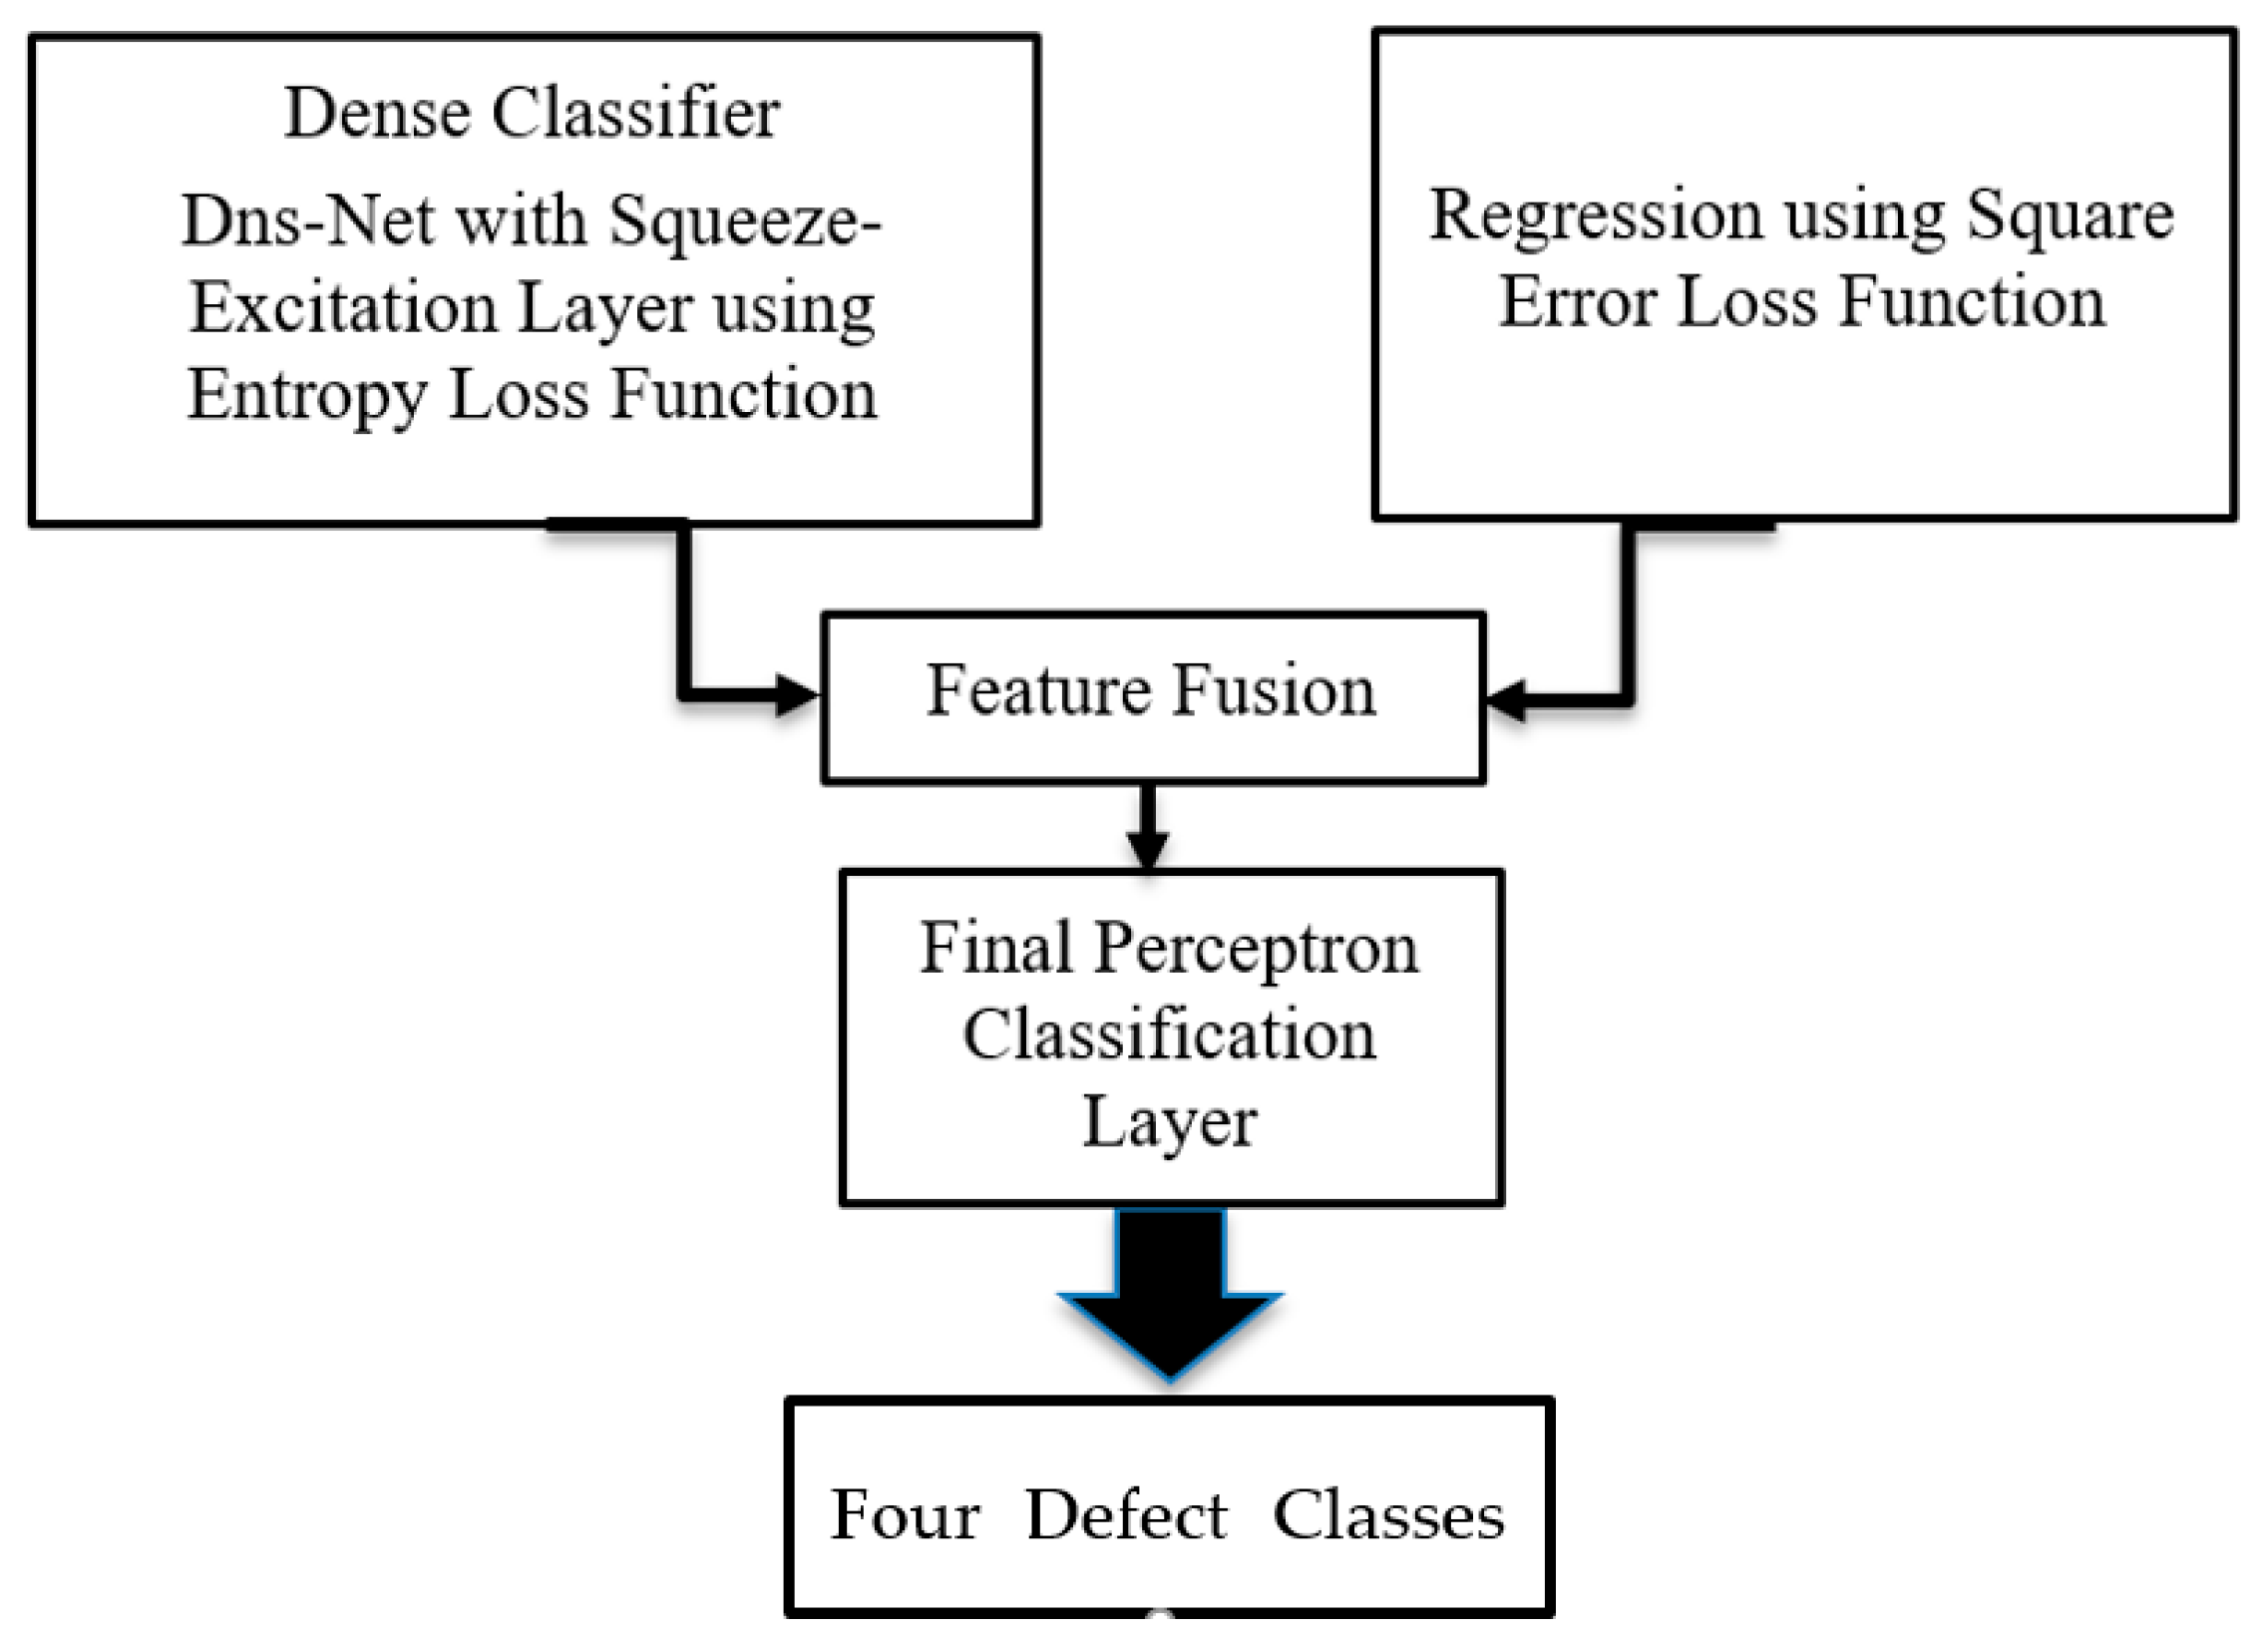
An improved dense CNN (Dns-Net) is employed for the multitasking model. A Dns-Net is combined with a squeeze-excitation (SQE) [11]. The SQE architecture has a block for interdependencies improvements to enhance performance.
The Multitasking Connected Network (Mtask) consists of dense classification and regression models, and a multitask classifier. The architecture of the developed Mtask is depicted in Figure 3.
2.2.2. Architecture
Dns-Net consists of seven dense layers and six transition layers in between the dense layers. In each dense layer, the SQE module is continual for 8 times. An SQE module has a normalization layer, a 3 × 3 convolution layer, and a ReLU activation function. An SQE model has average pooling, and excitation layers with two convolution layers, where the first layer is tailed by a ReLU and the second layer is tailed by a sigmoid activation function. Channels in the SQE are downsized to one value utilizing average pooling. The SQE input is scaled utilizing the weight computed from the SQE. Down-sizing is attained by the in-between layers. A transition layer is made of normalization, ReLU, and average pooling. And an SQE layer. The final fully connected layer is replaced with a 3 × 3 convolution layer to lessen the parameters.
The growth of the Dns-Net is set to 184 and 15, respectively. There are two × growth filters for the initial convolution layer, while the number of filters is two × growth × compression for the dense and transition blocks. The compression ratio is set to 0.6.
In the multitasking model, classification regression models are pooled to enhance the fused features. Figure 4 demonstrates the fusion of the regression and the classifier outputs. Outputs from the final pooling layer of the classifier are fused with the outputs of the final regression. The CNN finishes with a fully connected layer and has a Sofomax output layer.
2.2.3. Training
The Dns-Net model is trained using 280 epochs and gradient descent optimization techniques utilizing an entropy loss function. For the initial 180 epochs, the learning rate is set to 0.0015 and the batch size is set to 3. For the following 50 epochs, the learning rate is set to 0.0002. For the final epochs, the learning rate is further reduced to 0.00001. The accuracy is computed in each epoch, and we stored the model with the maximum accuracy using checkpoint callback. The output layer is a convolution with the activation function Softmax that produces four scores corresponding to the four classes of crystal structures.
The proposed Dns-Net regression underwent 50 epochs of training. The adaptive moment optimization technique with a 0.001 learning rate and mean square error function are utilized in the learning phase. The output layer of the Dns-Net has a linear activation score function of one output describing the severity of the crystal structures case.
After the fusion of the features from the classifier and the Dns-Net, a normalization function is added to normalize the batch data. A normalization function is utilized to increase the training speed and decrease the sensitivity. The entropy loss and the optimization functions with a learning rate of 0.002 are used in the training phase of 60 epochs. The learning rate is decreased by 0.1 every time the loss function is not decreased for four epochs. The model with the best validation accuracy is selected.
The L2 regularization is used for the fully connected layers of the Dns-Net. The kernel regularization guards the model from the overfitting problem.
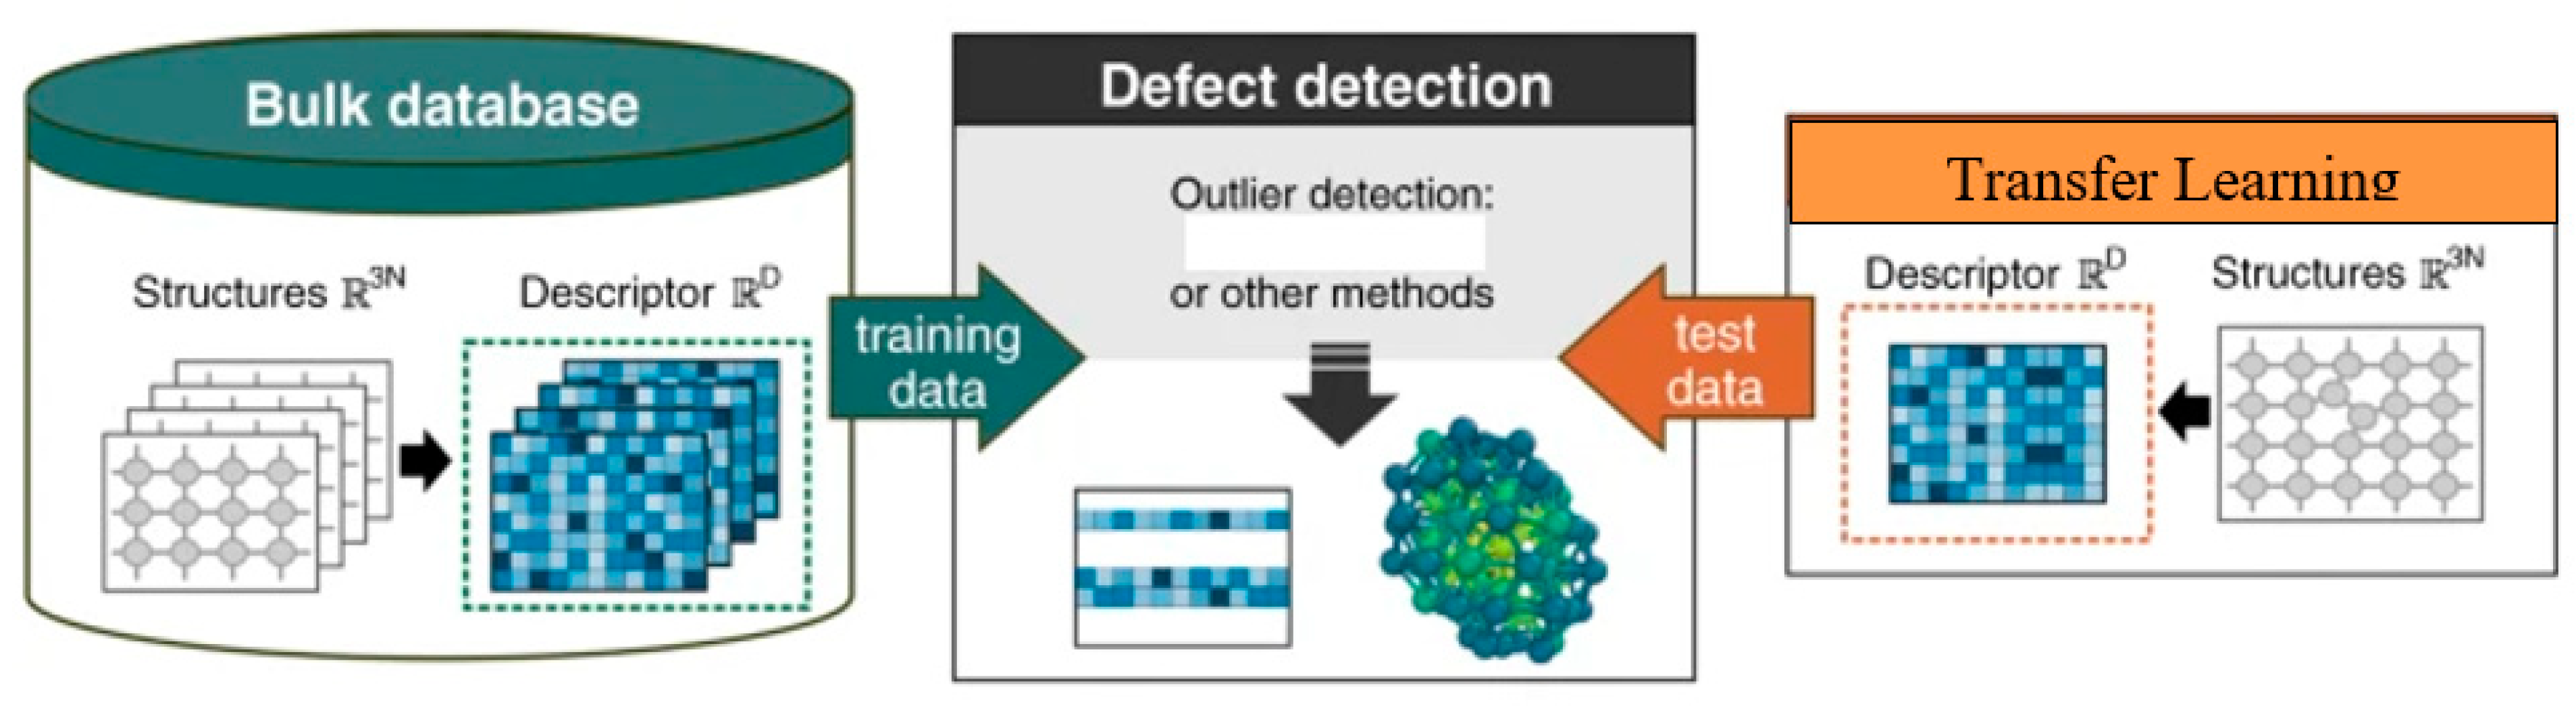
2.2.4. Transfer Learning Model (TLM)
Due to the size of available training for deep learning, we incorporated transfer learning in the model. The ImageNet neural network is tuned to employ the proposed multitasking model to classify crystal structure severity.
The architecture of the TLM is built using depth convolutional separable learning layers and encompasses entry, middle, and exit flows. Figure 4 depicts the TLM architecture. Image data are used as input to the entry flow, then move to the middle flow of nine layers, and the exiting through the exit flow, tailed with the batch normalization process. This model has 42 feature extraction convolutional. The TLM model is trained with ImageNet data set for 2000 classes with an accuracy of 82%.
In the model tuning, the TLM ImageNet stage is pre-trained and tuned for the regression phase with a single output class. The architecture of the TLM is depicted in Figure 4. The last connected layer of the TLM is split and an additional pooling layer is used with linear activation. The optimization algorithm with a 0.002 learning rate and mean square error function is utilized to train the model for 30 epochs. The dataset is divided into smaller batches for training.
A second pre-trained TLM is tuned with images to classify the four cases of crystal structures. The final connected layer is substituted by a pooling layer and a Softmax layer. A dropout regularize layer is used prior to the output with a 0.75% keep rate. The loss function and optimization with a 0.002 decay rate are utilized for training. The model with the best accuracy was selected. The model is tuned for 35 epochs with a batch of size 16. If the loss function is not decreased for five epochs, the learning rate is decreased by 0.2.
Features produces from the final pooling layer of the TLM model and regression model are fused and used in the PL classifier. In the Dns-Net, the PL classifier in the multitasking TLM network includes two fully connected Softmax layers at the final stage to produce four scores for the cases of the crystal structures. Both the TLM network and the PL classifier of Dns-Net use the same training parameter. The model with the highest accuracy will be selected.
3. Experiments
The experiments were implemented on an NVIDIA Quadro workstation [42] with twenty 3.3GHZ cores and RAM with a size of 64 GBs. The software used to program the models was Python 3.7 with the deep learning Keras package, H5PY, and Scikit-Learn [43]. In the following sections, we will discuss the performance and the experimental results.
3.1. Performance
Performance was evaluated using five commonly used performance metrics of Precision, Accuracy, AUC curve, Recall, and F1 Score [18]. We also utilized the Weighted Kappa coefficient for quality measure [19]. Precision and Recall are calculated for the four crystal structure cases separately and then the average was used for the classification. For the Kappa Score coefficient, the weight is defined as follows:
where, A is the actual number of observations and E is the expected number, i and j are the indices of the true and the predicted class, and N is the number of classes.
3.2. The Dataset
We utilized a public database of crystal diffraction images from the dataset in [21] total of 16,000 images. All the images are frontal and backward diffraction of the surface. 3500 are No-Defect cases, 4500 of the images are pristine cases, 4000 images are of random defects of crystal structures and 4000 of the attained images are defective of type 25% vacancies. All the images are labeled by chemists for supervised learning. The dataset includes images of resolution 1024 × 1024 for each surface.
3.3. Experimental Results
Three experiments are performed each experiment uses 80% of the images for training and 20% for testing. The images are selected randomly for each experiment. Performance metrics are depicted as confusion matrices for the first experiment (Exper-1) utilizing the Dns-Net with and without TLM are depicted in Table 1 and Table 2. The Precision, F1 Score, Accuracy, Recall, and Kappa coefficient for Exper-1 are depicted in Table 3. As can be drawn from these metrics, the TLM model upgraded the performance by nearly 4%.
The true positive and true negative cases of the second experiment (Exper-2) using both models (Dsn-Net + regression model) with and without transfer learning are also depicted in Table 4 and Table 5. Whereas, the performance results of all cases are depicted in Table 5. This experiment also demonstrates an increase in the performance of the regression classifier model as depicted in Table 6.
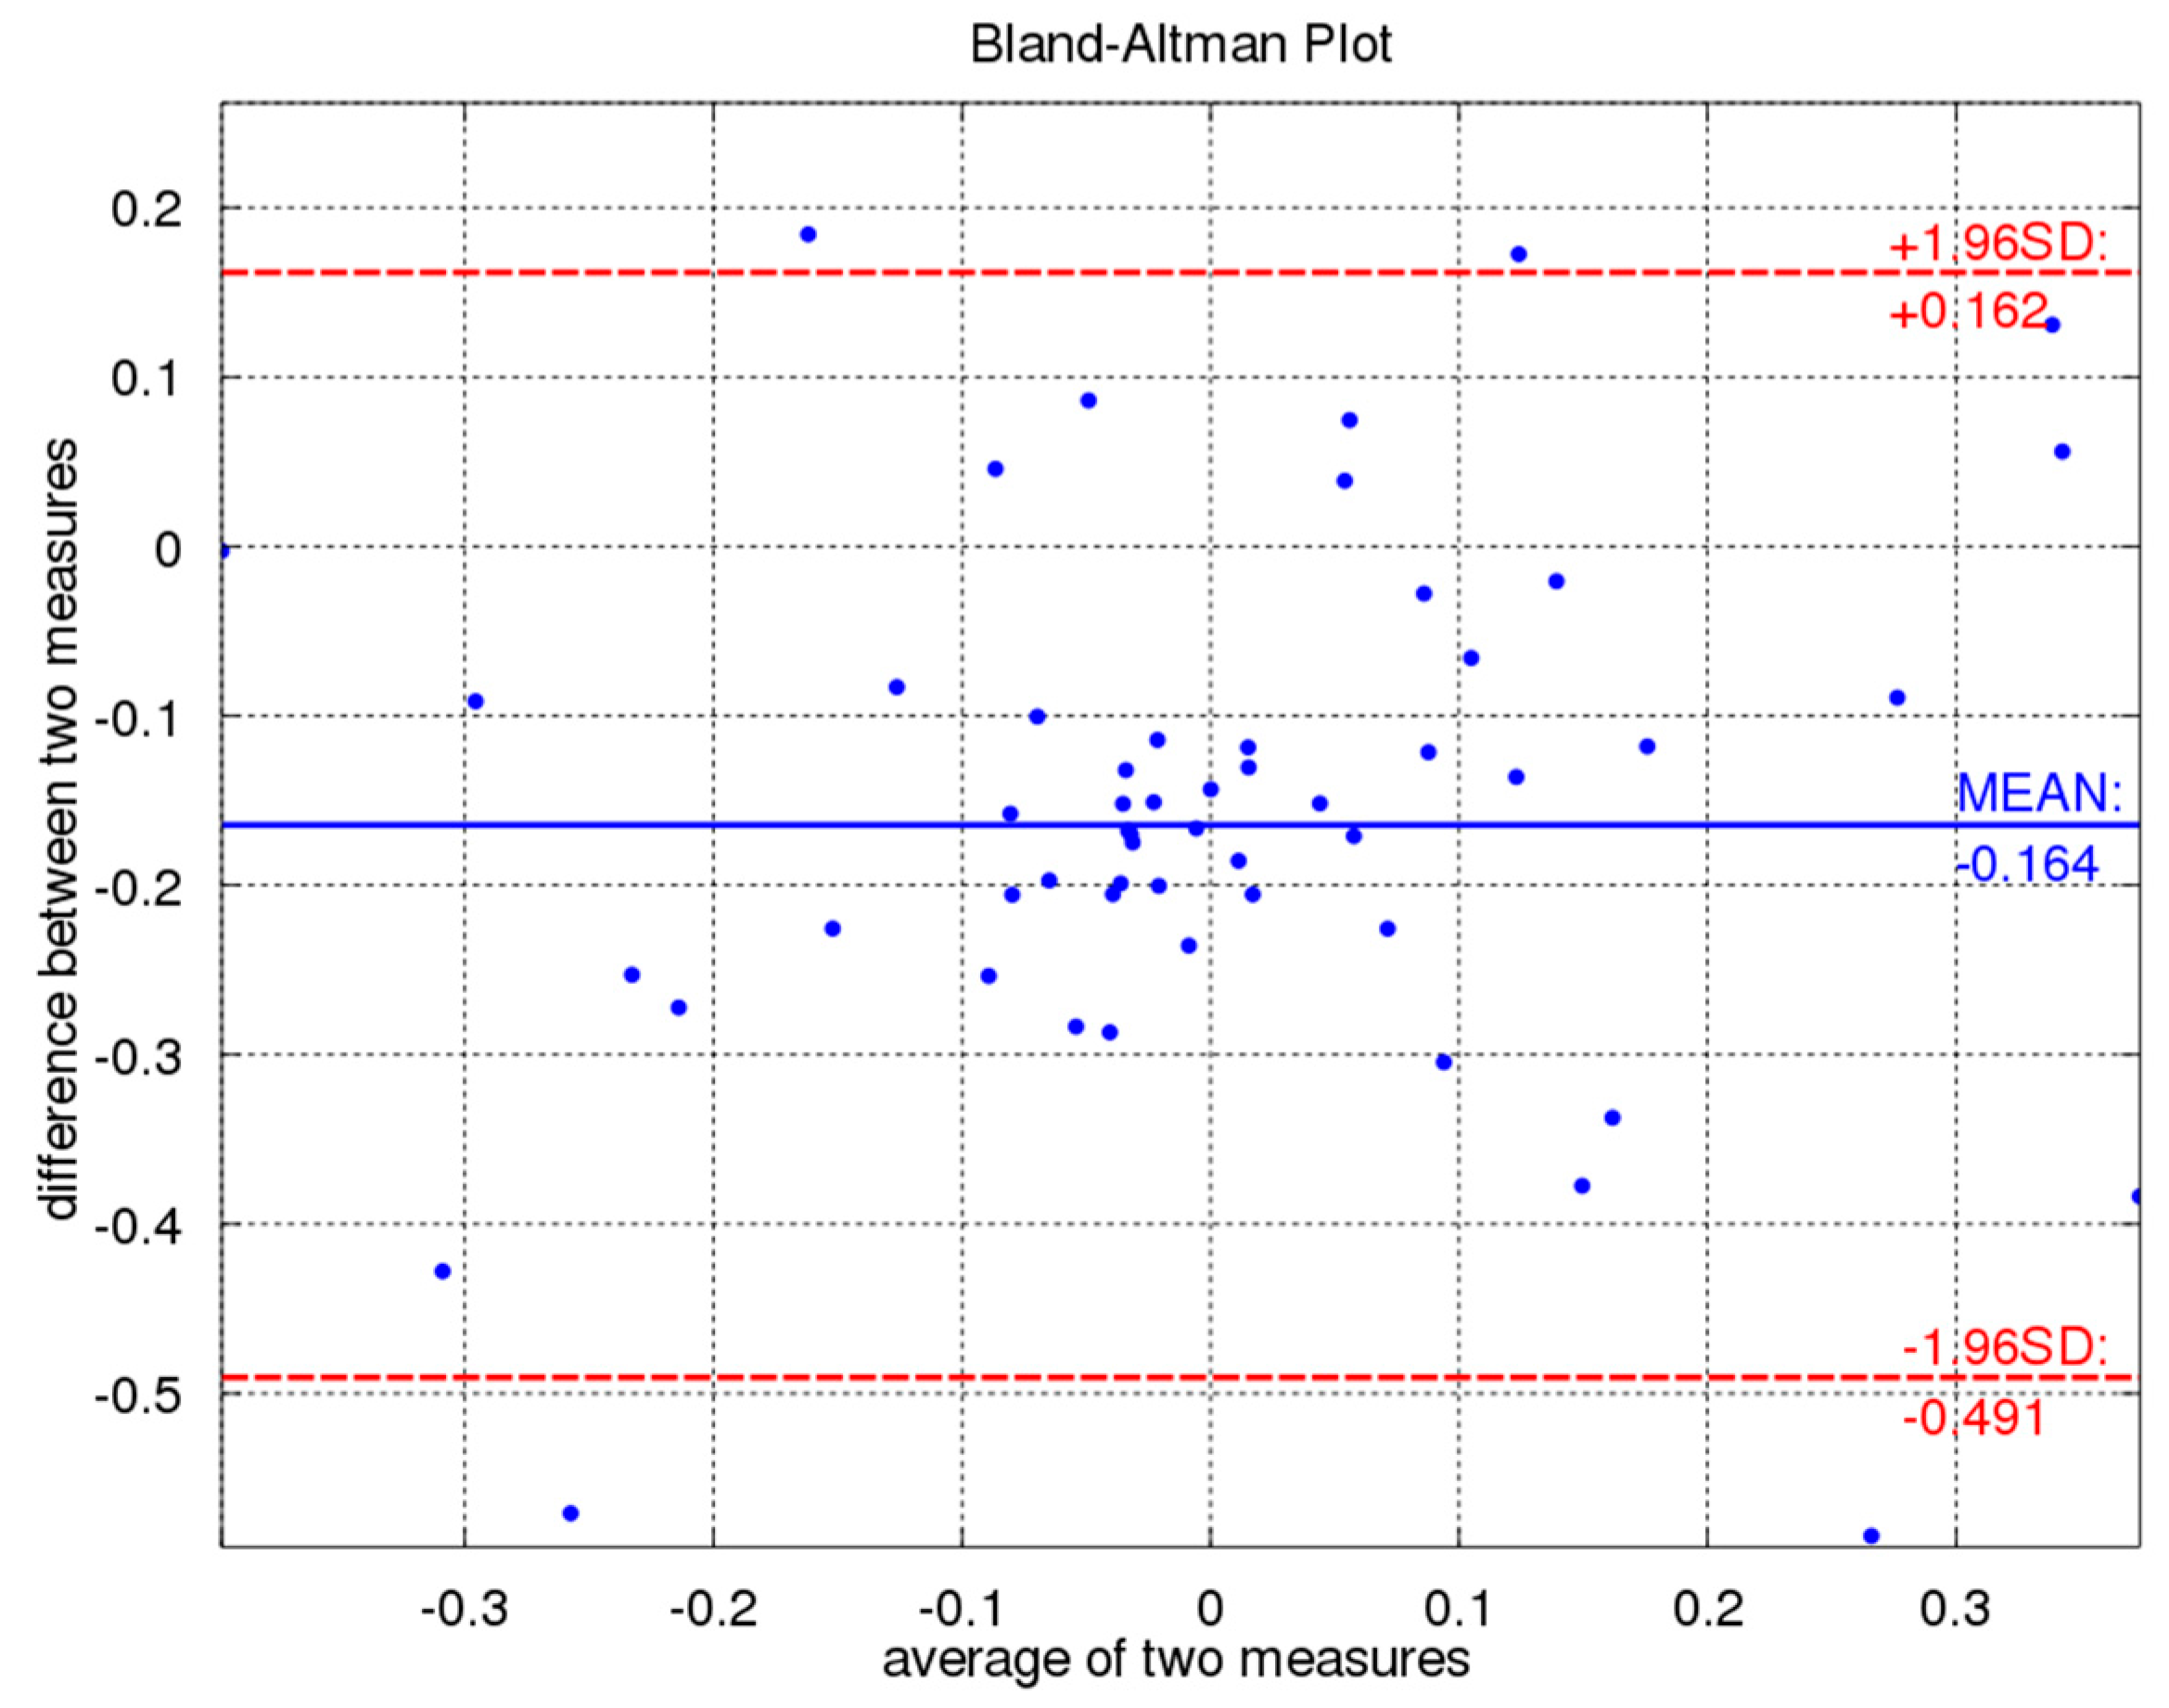
The correlation between the severity of the actual and predicted cases of crystal structures from diffraction photography of the surface is measured using Bland-Altman Plot as depicted in Figure 5. Bland-Altman signifies the linear correlation between actual and predicted amounts [43]. The following metric between actual and predicted crystal structure classes show high similarity [44].
The experiment results, in Figure 5, portray a linear correlation between the actual and predicted classes by our proposed model. Bland-Altman denotes the high correlation of two detects. The plotted Bland-Altman between the actual and predicted cases are greatly similar.
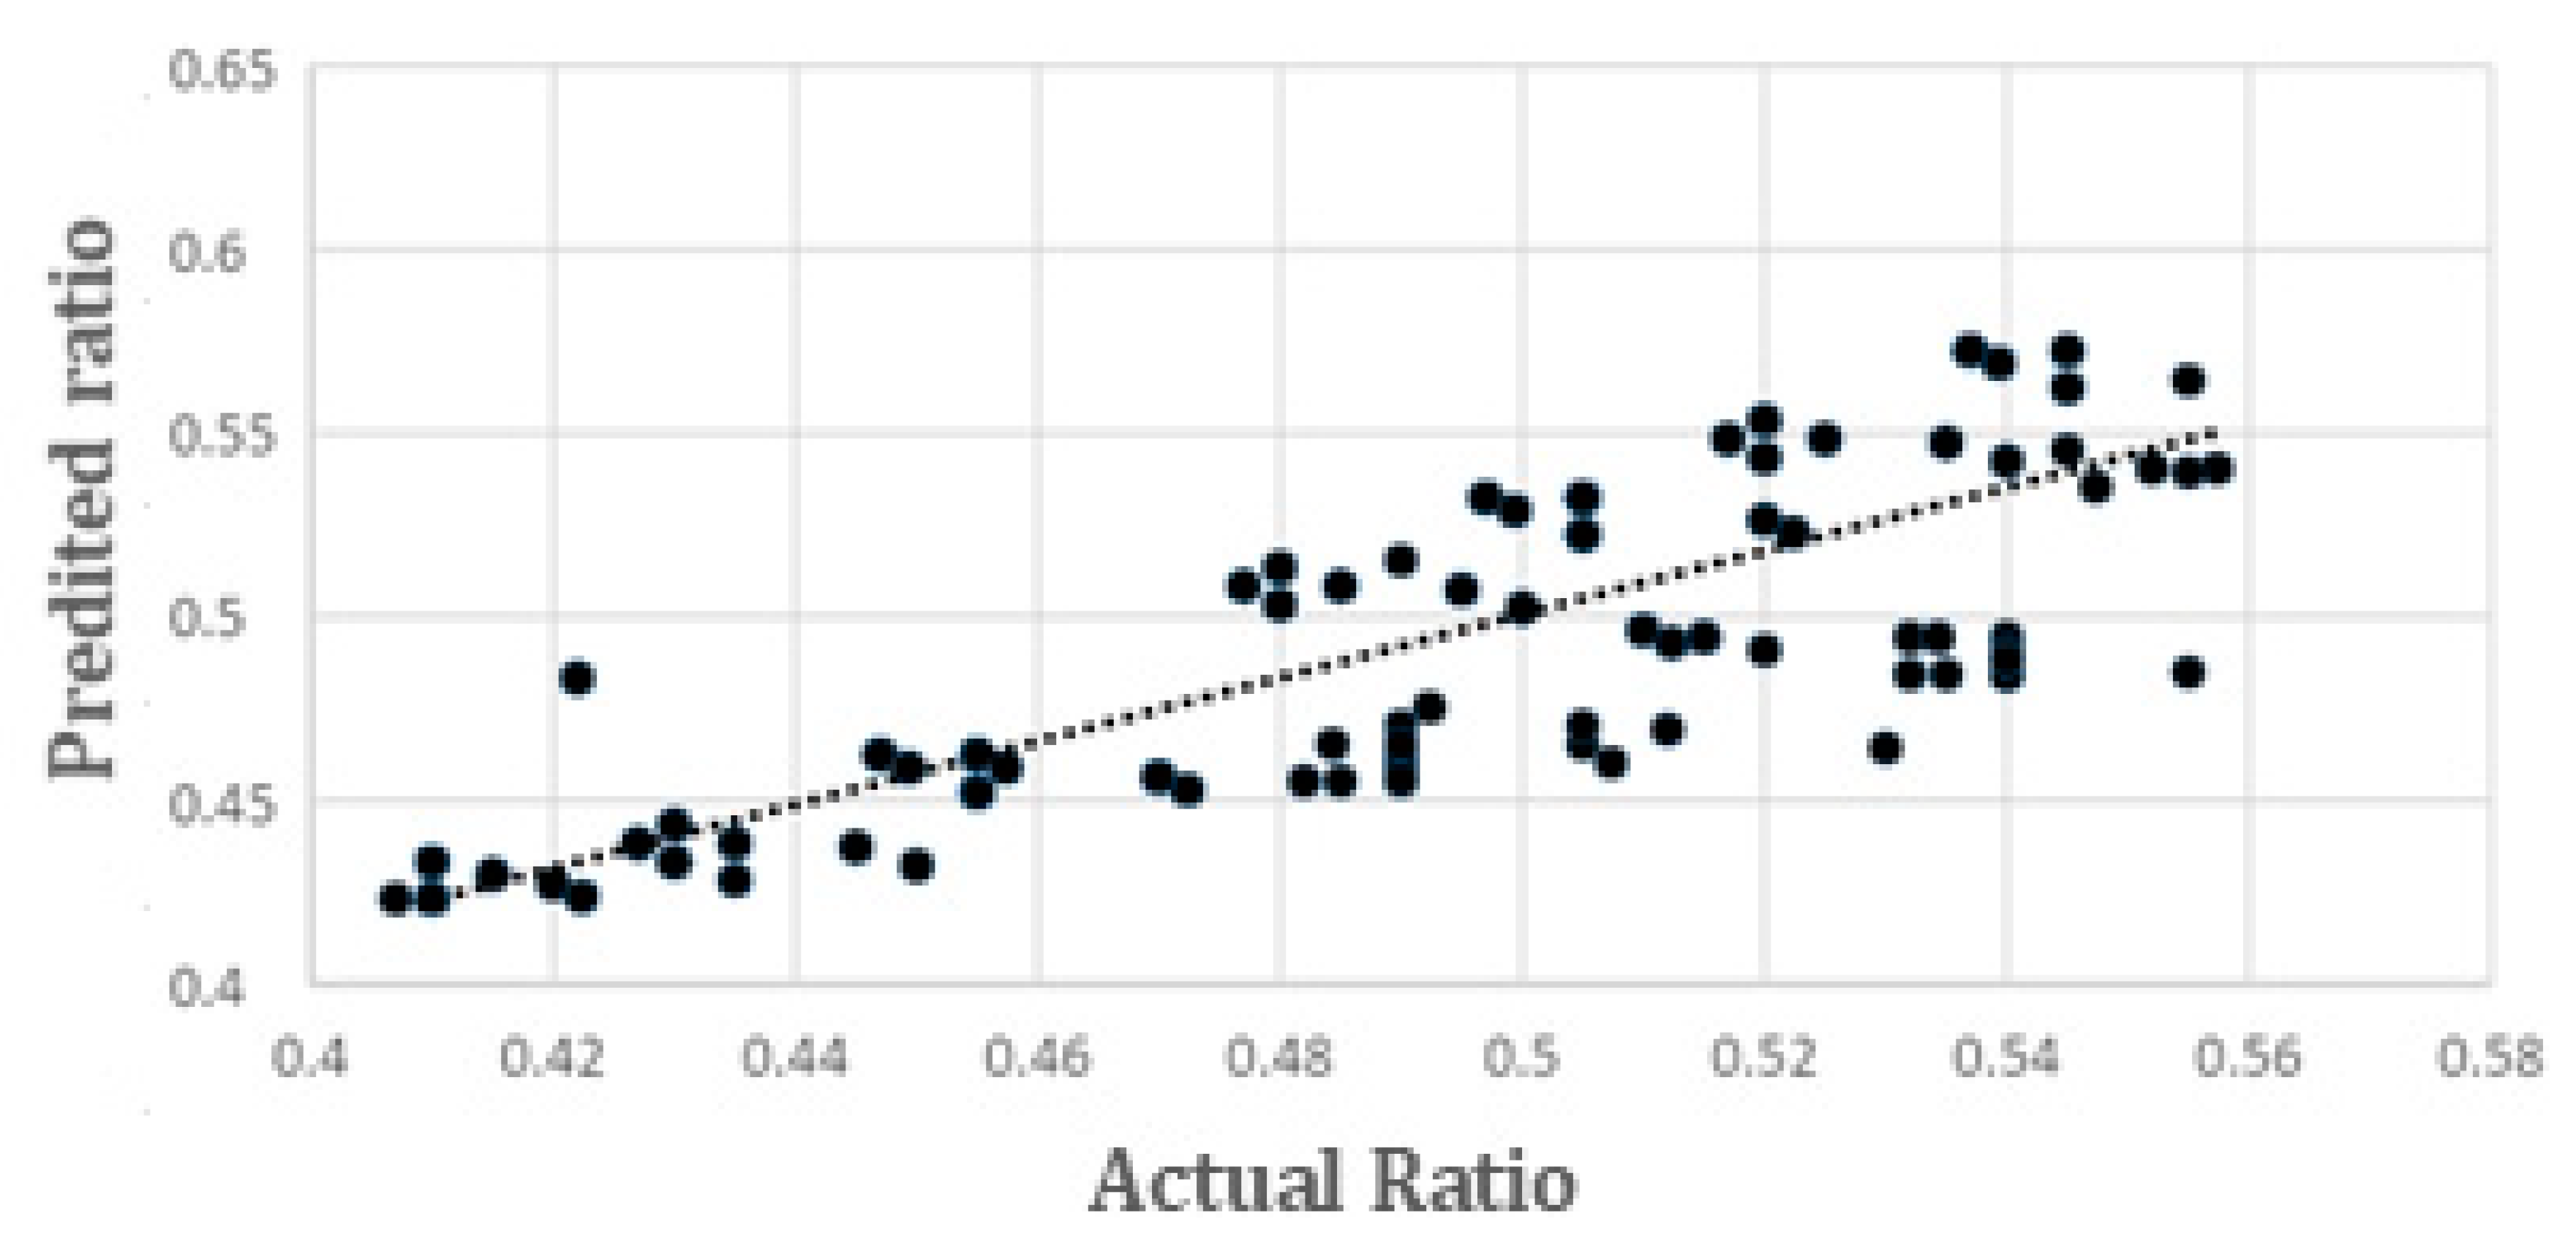
Figure 6 denotes the correlation between the computational ratio of the crystal structures severity of the predicted classes using the Dns-Net + regression with transfer learning versus the actual ratio detected by experts.
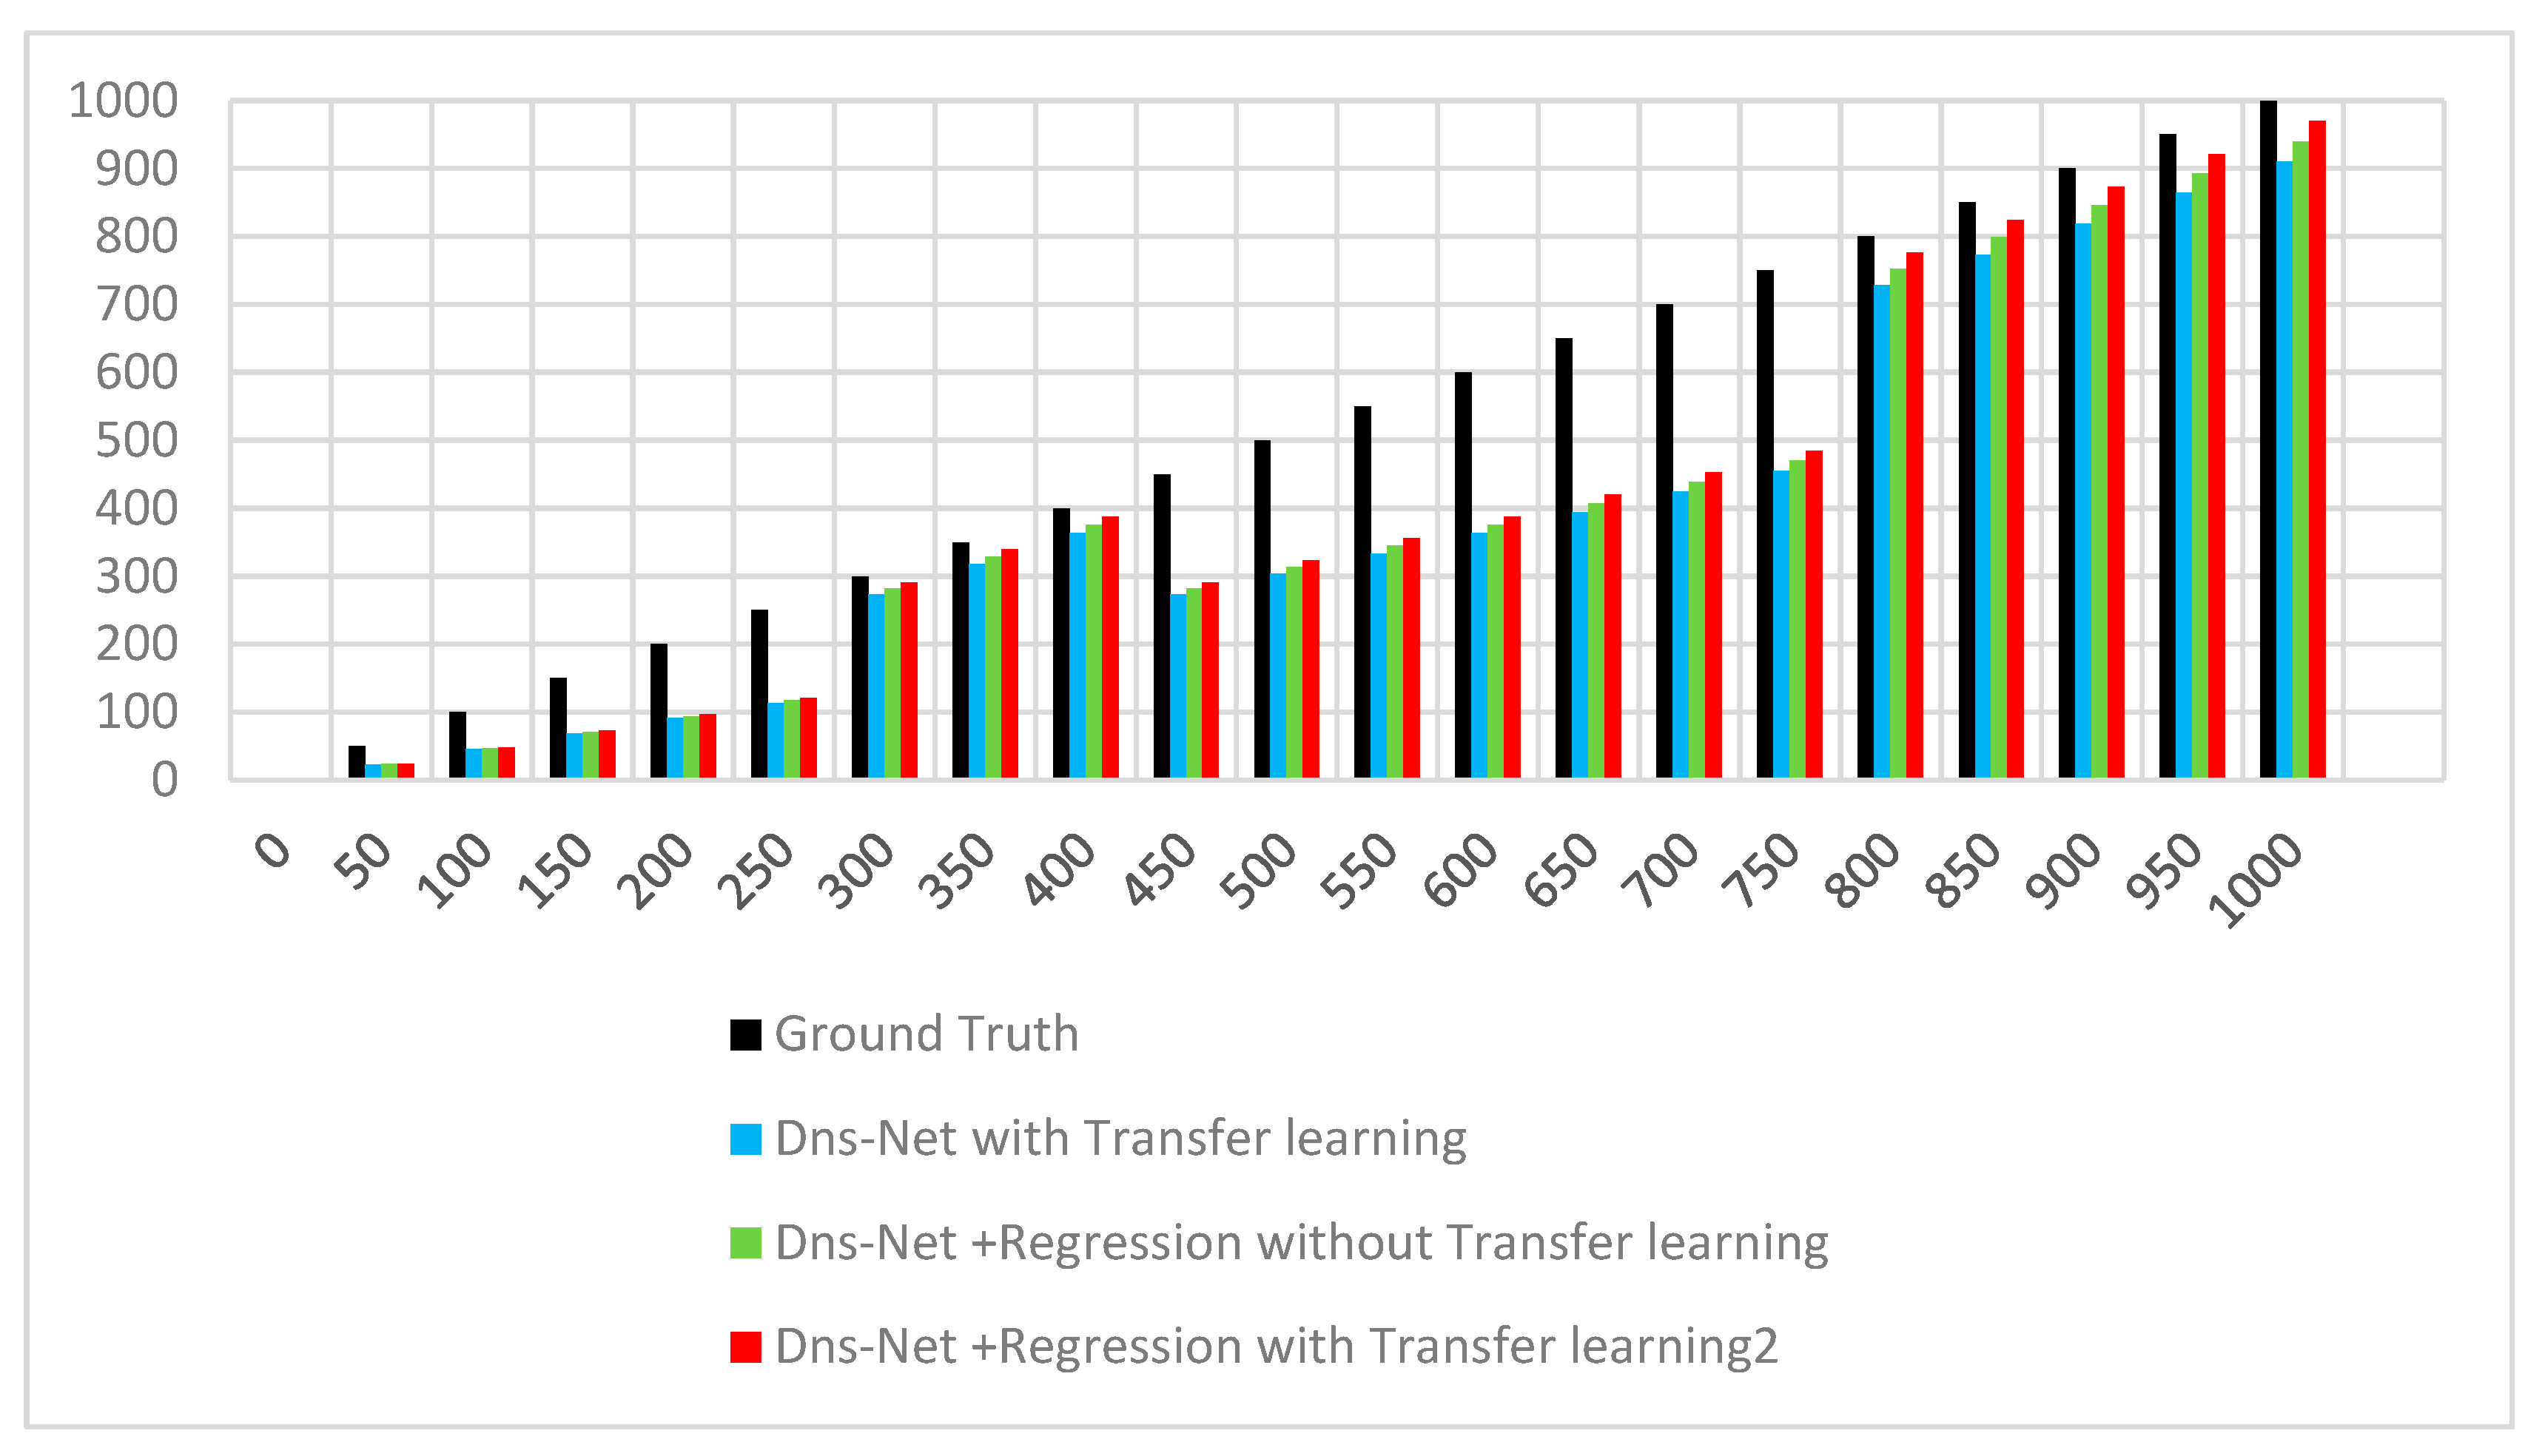
This study indicates the effect of the size on the training set size on the correct prediction. As we can see, the prediction accuracy increases with the size of the training set. Figure 7 depicts the effect of the training set size on the prediction accuracy of the different models against the ground truth.
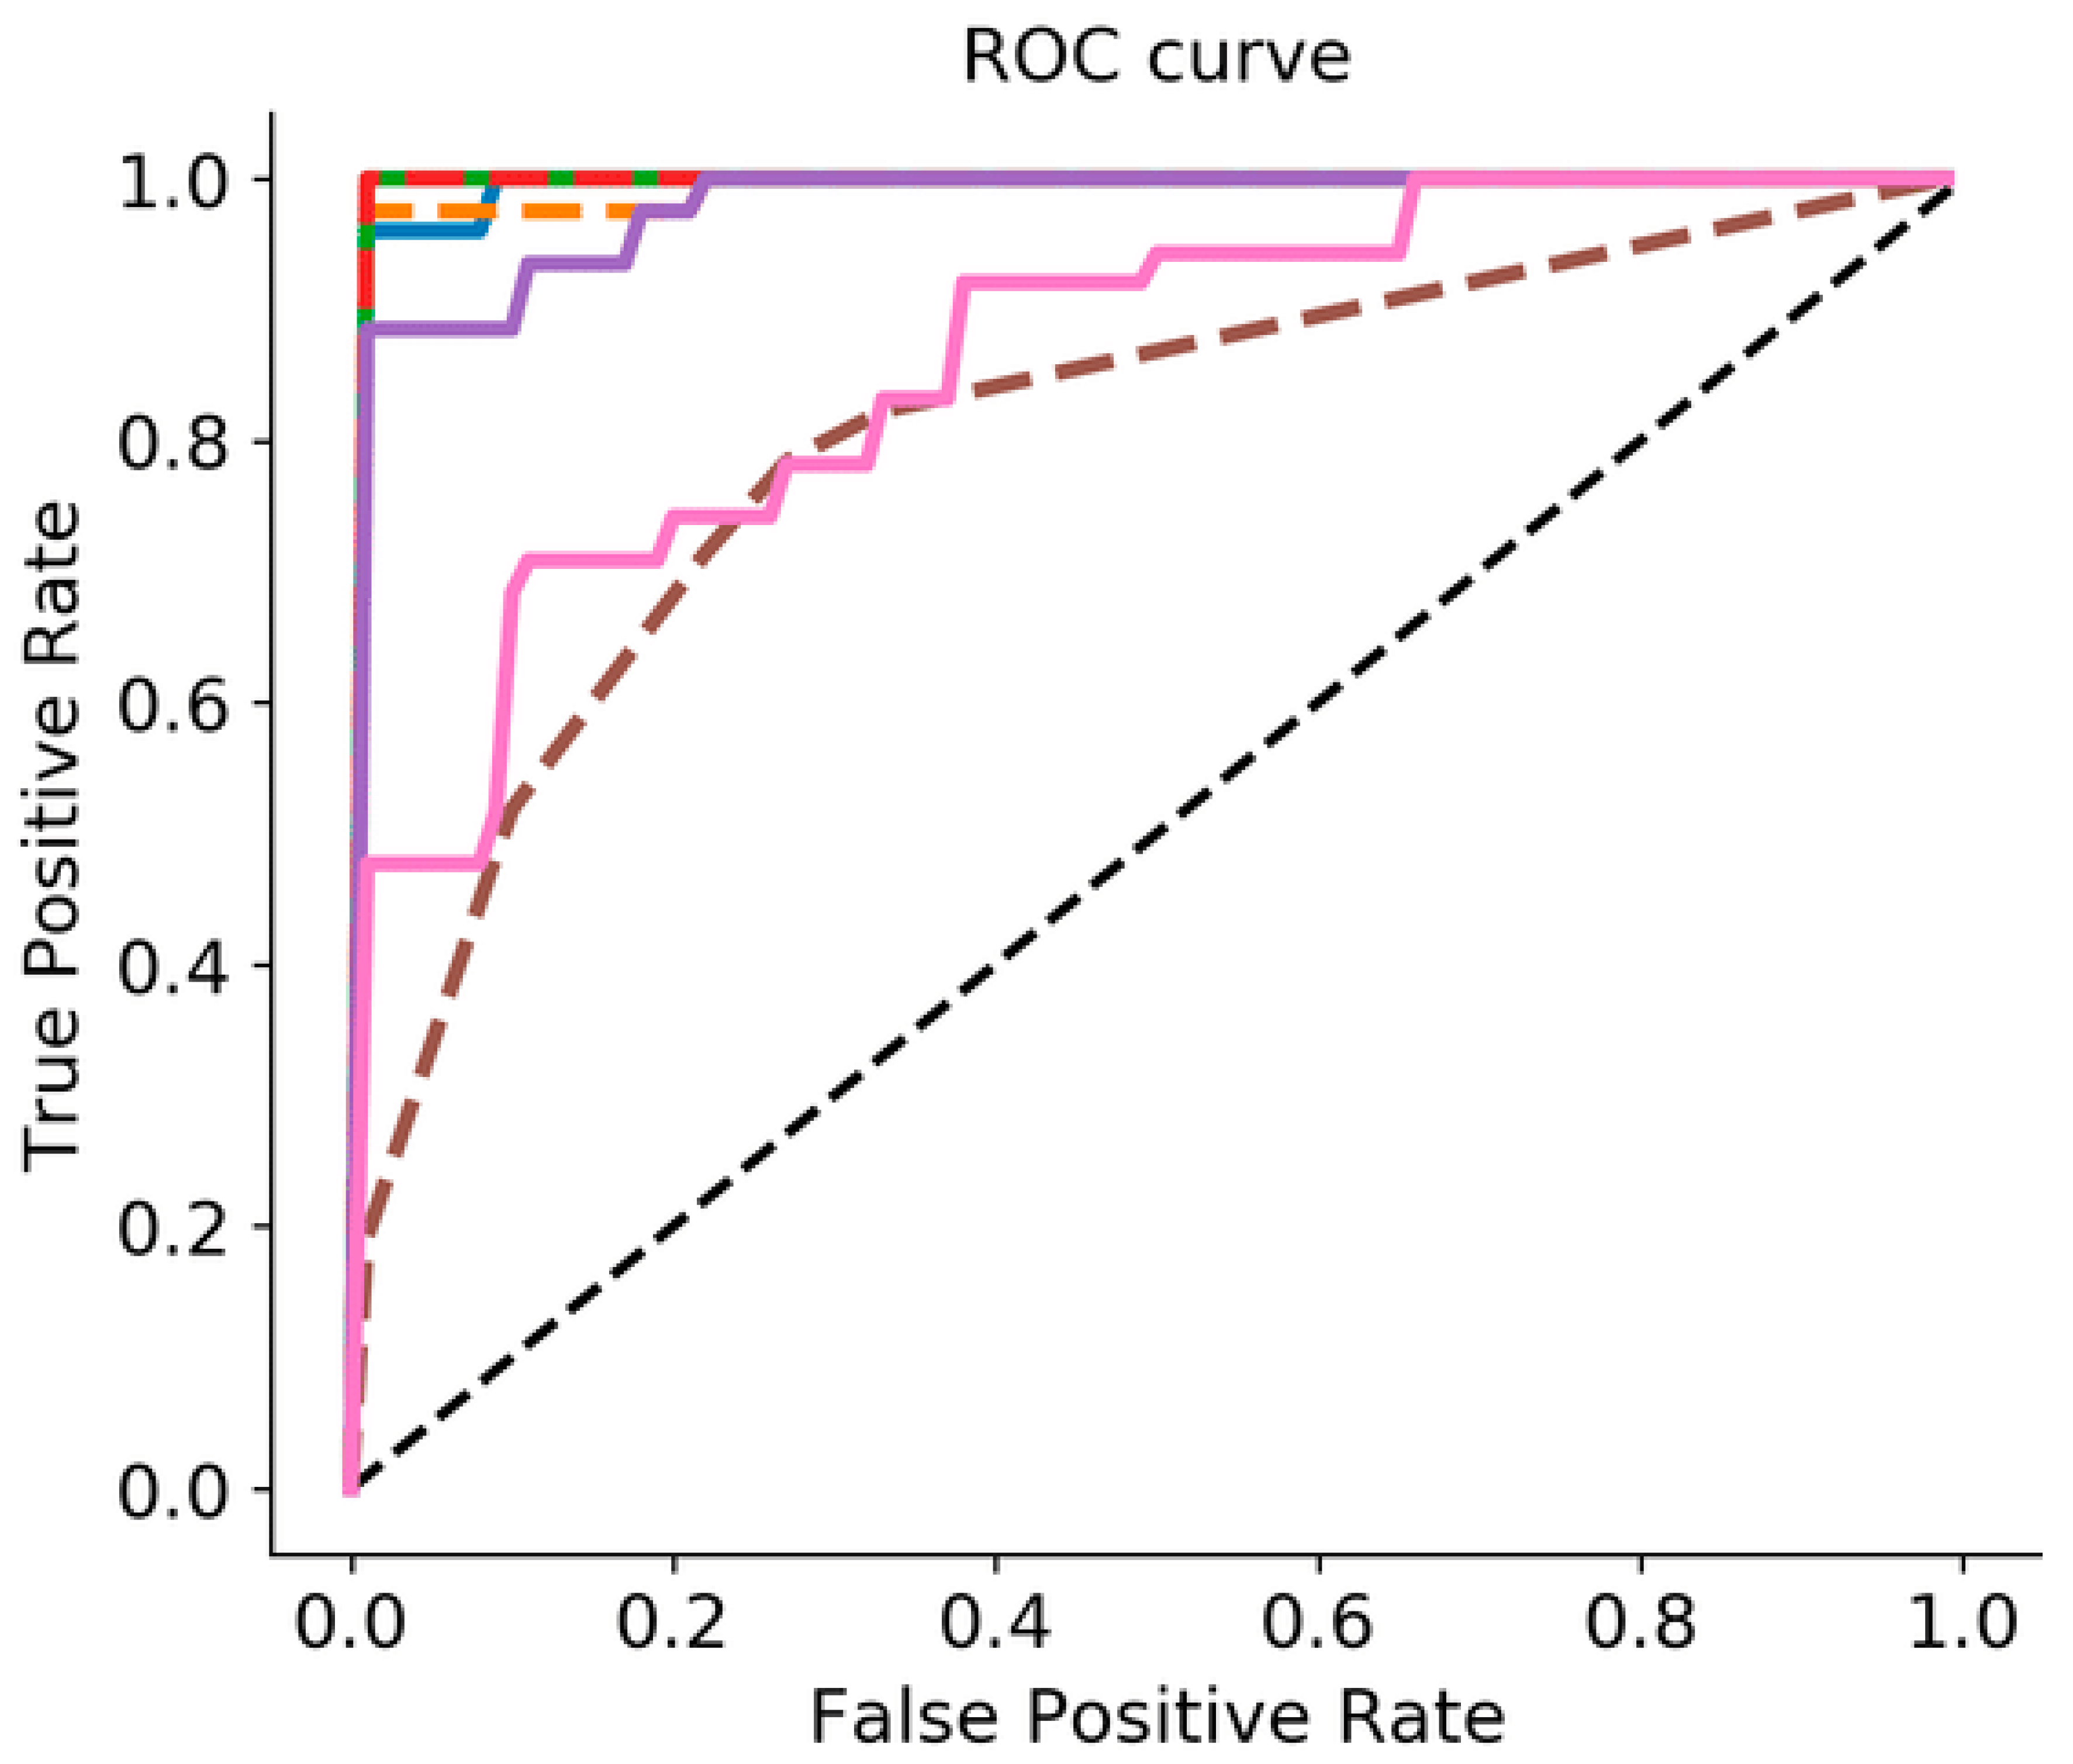
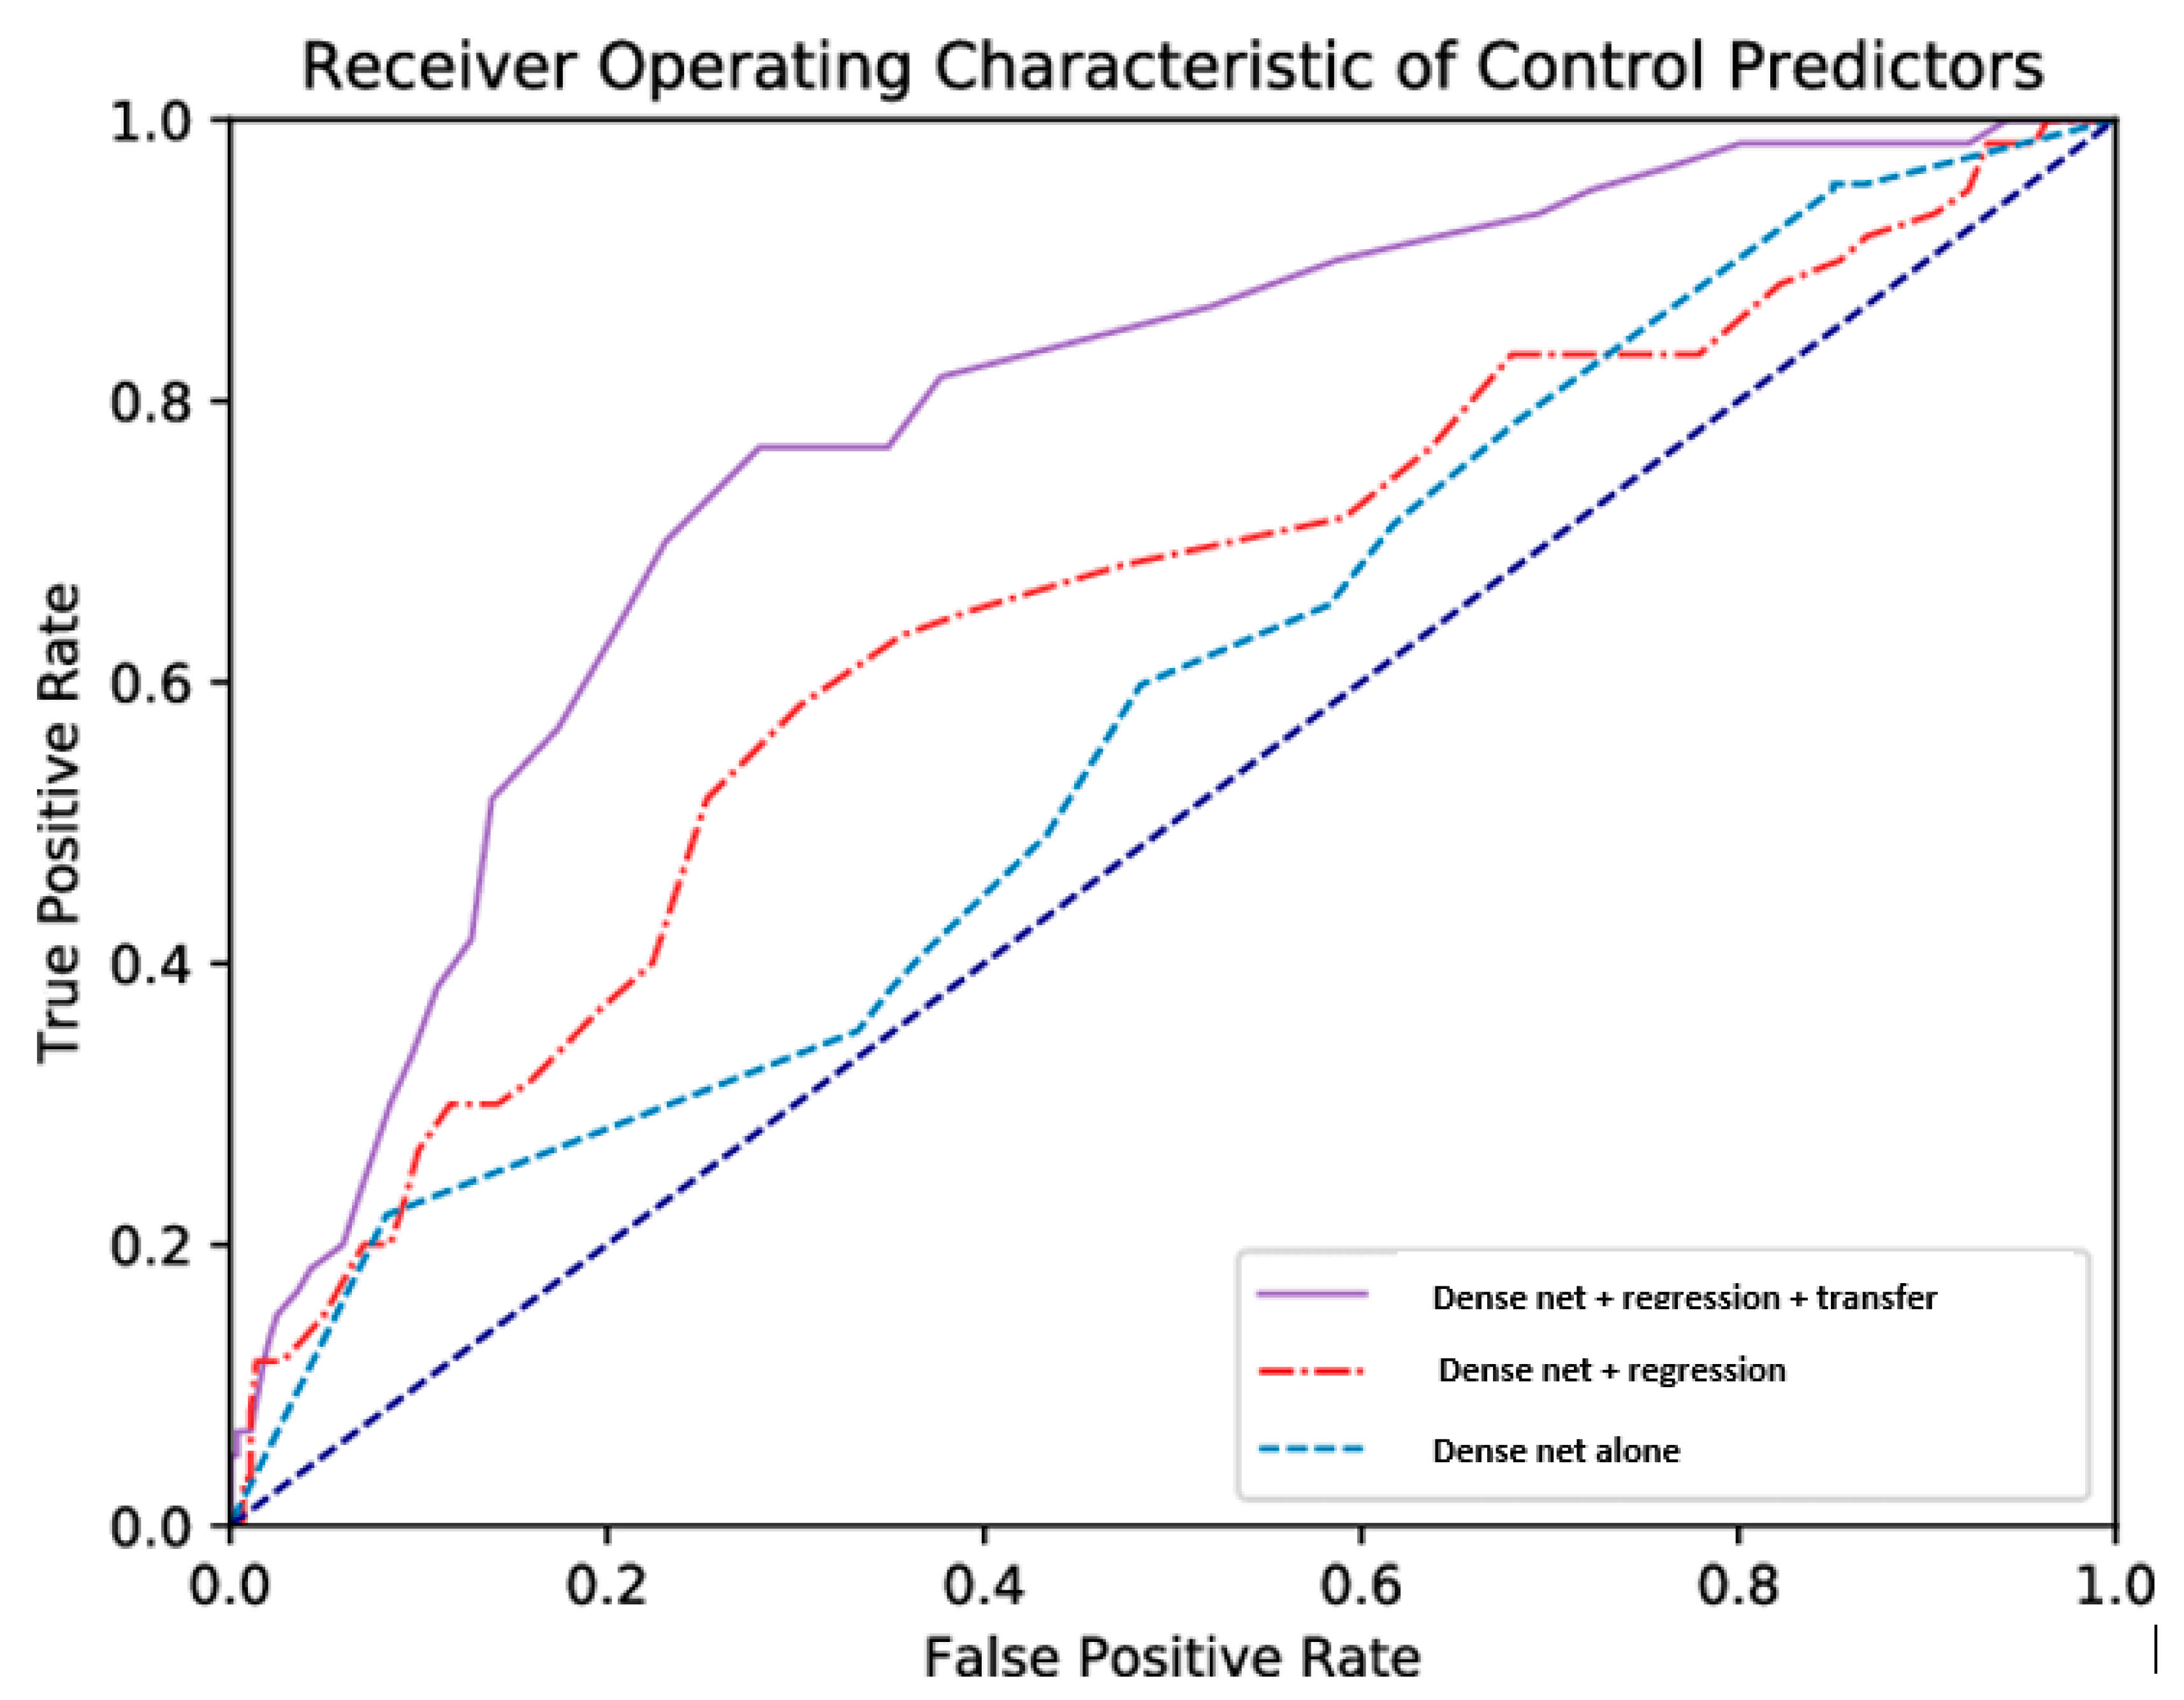
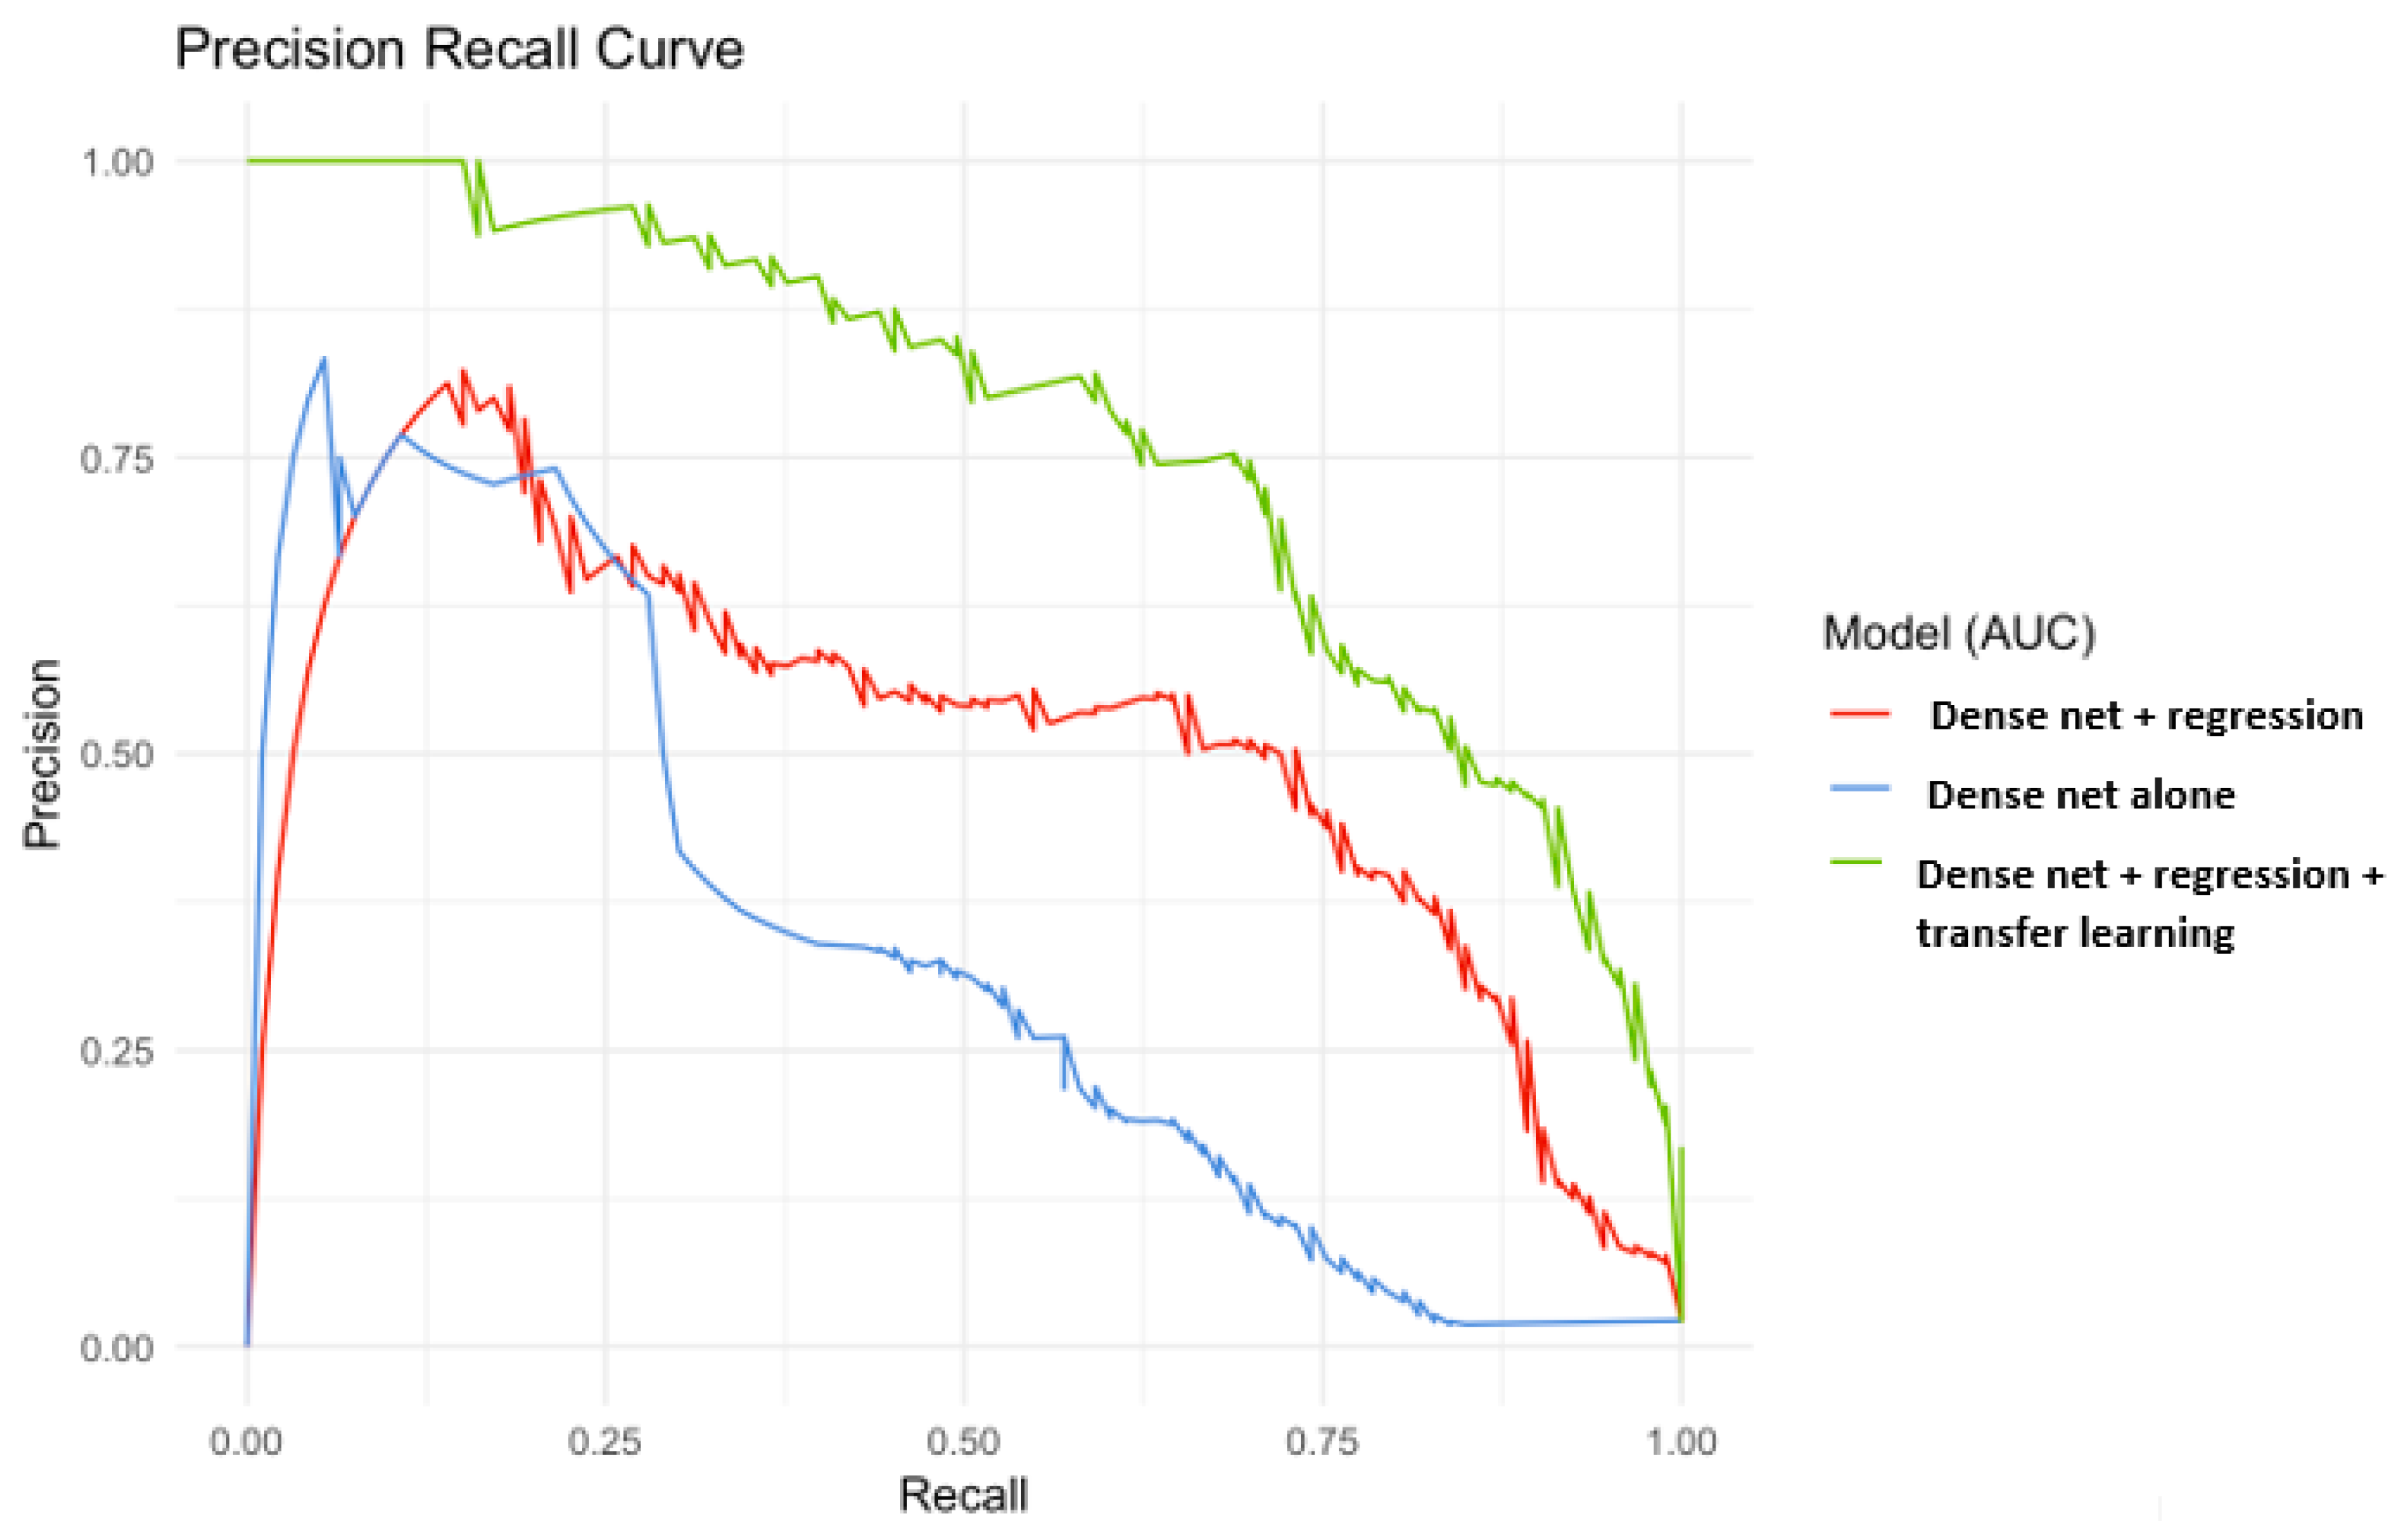
The AUC curve proves that the proposed model classifies among crystal structure cases, we also computed the AUC curve for the Dns-Net model, as depicted in Figure 8. The AUC function adds up the true and false positives as well as the false negative and then plot them on the AUC graph. Also, the average precision and recall are plotted on a graph. The areas under the AUC curve are 0.97 and 0.94, respectively which is a high value indicating the high performance of the proposed model. AUC curves in Figure 8, Figure 9 and Figure 10 depict Precision versus recall of the Dns-Net model with regression inferring the transfer learning effect.
The highest area under the ROC curve is 0.98 for the normal case (no-defect structures). The lowest area of 0.90 for the pristine case of crystal structures. By employing the weighting means, we can produce balanced data which can enhance the accuracy. From the AUC plot of our proposed model, the area under the curve for all the cases is higher than 0.91 which reveals a high accuracy of the model.
Also, the transfer learning technique is found to be efficient. 80% of the dataset is selected for the training of the model and 20% for testing.
3.4. Comparative Analysis
The performance analysis of the proposed architecture for the dataset in [21] is compared with recent similar research. As can be understood from these results, the proposed multitasking model produced the best performance for the classes of the four cases of crystal structures. The performance comparison of our proposed model with works presented in [40,41] where the dataset in [21] was utilized. This comparative study confirms the best performance was attained by the multitasking model with transfer learning. The performance of the two proposed models is averaged for all of the experiments and is depicted in Table 7.
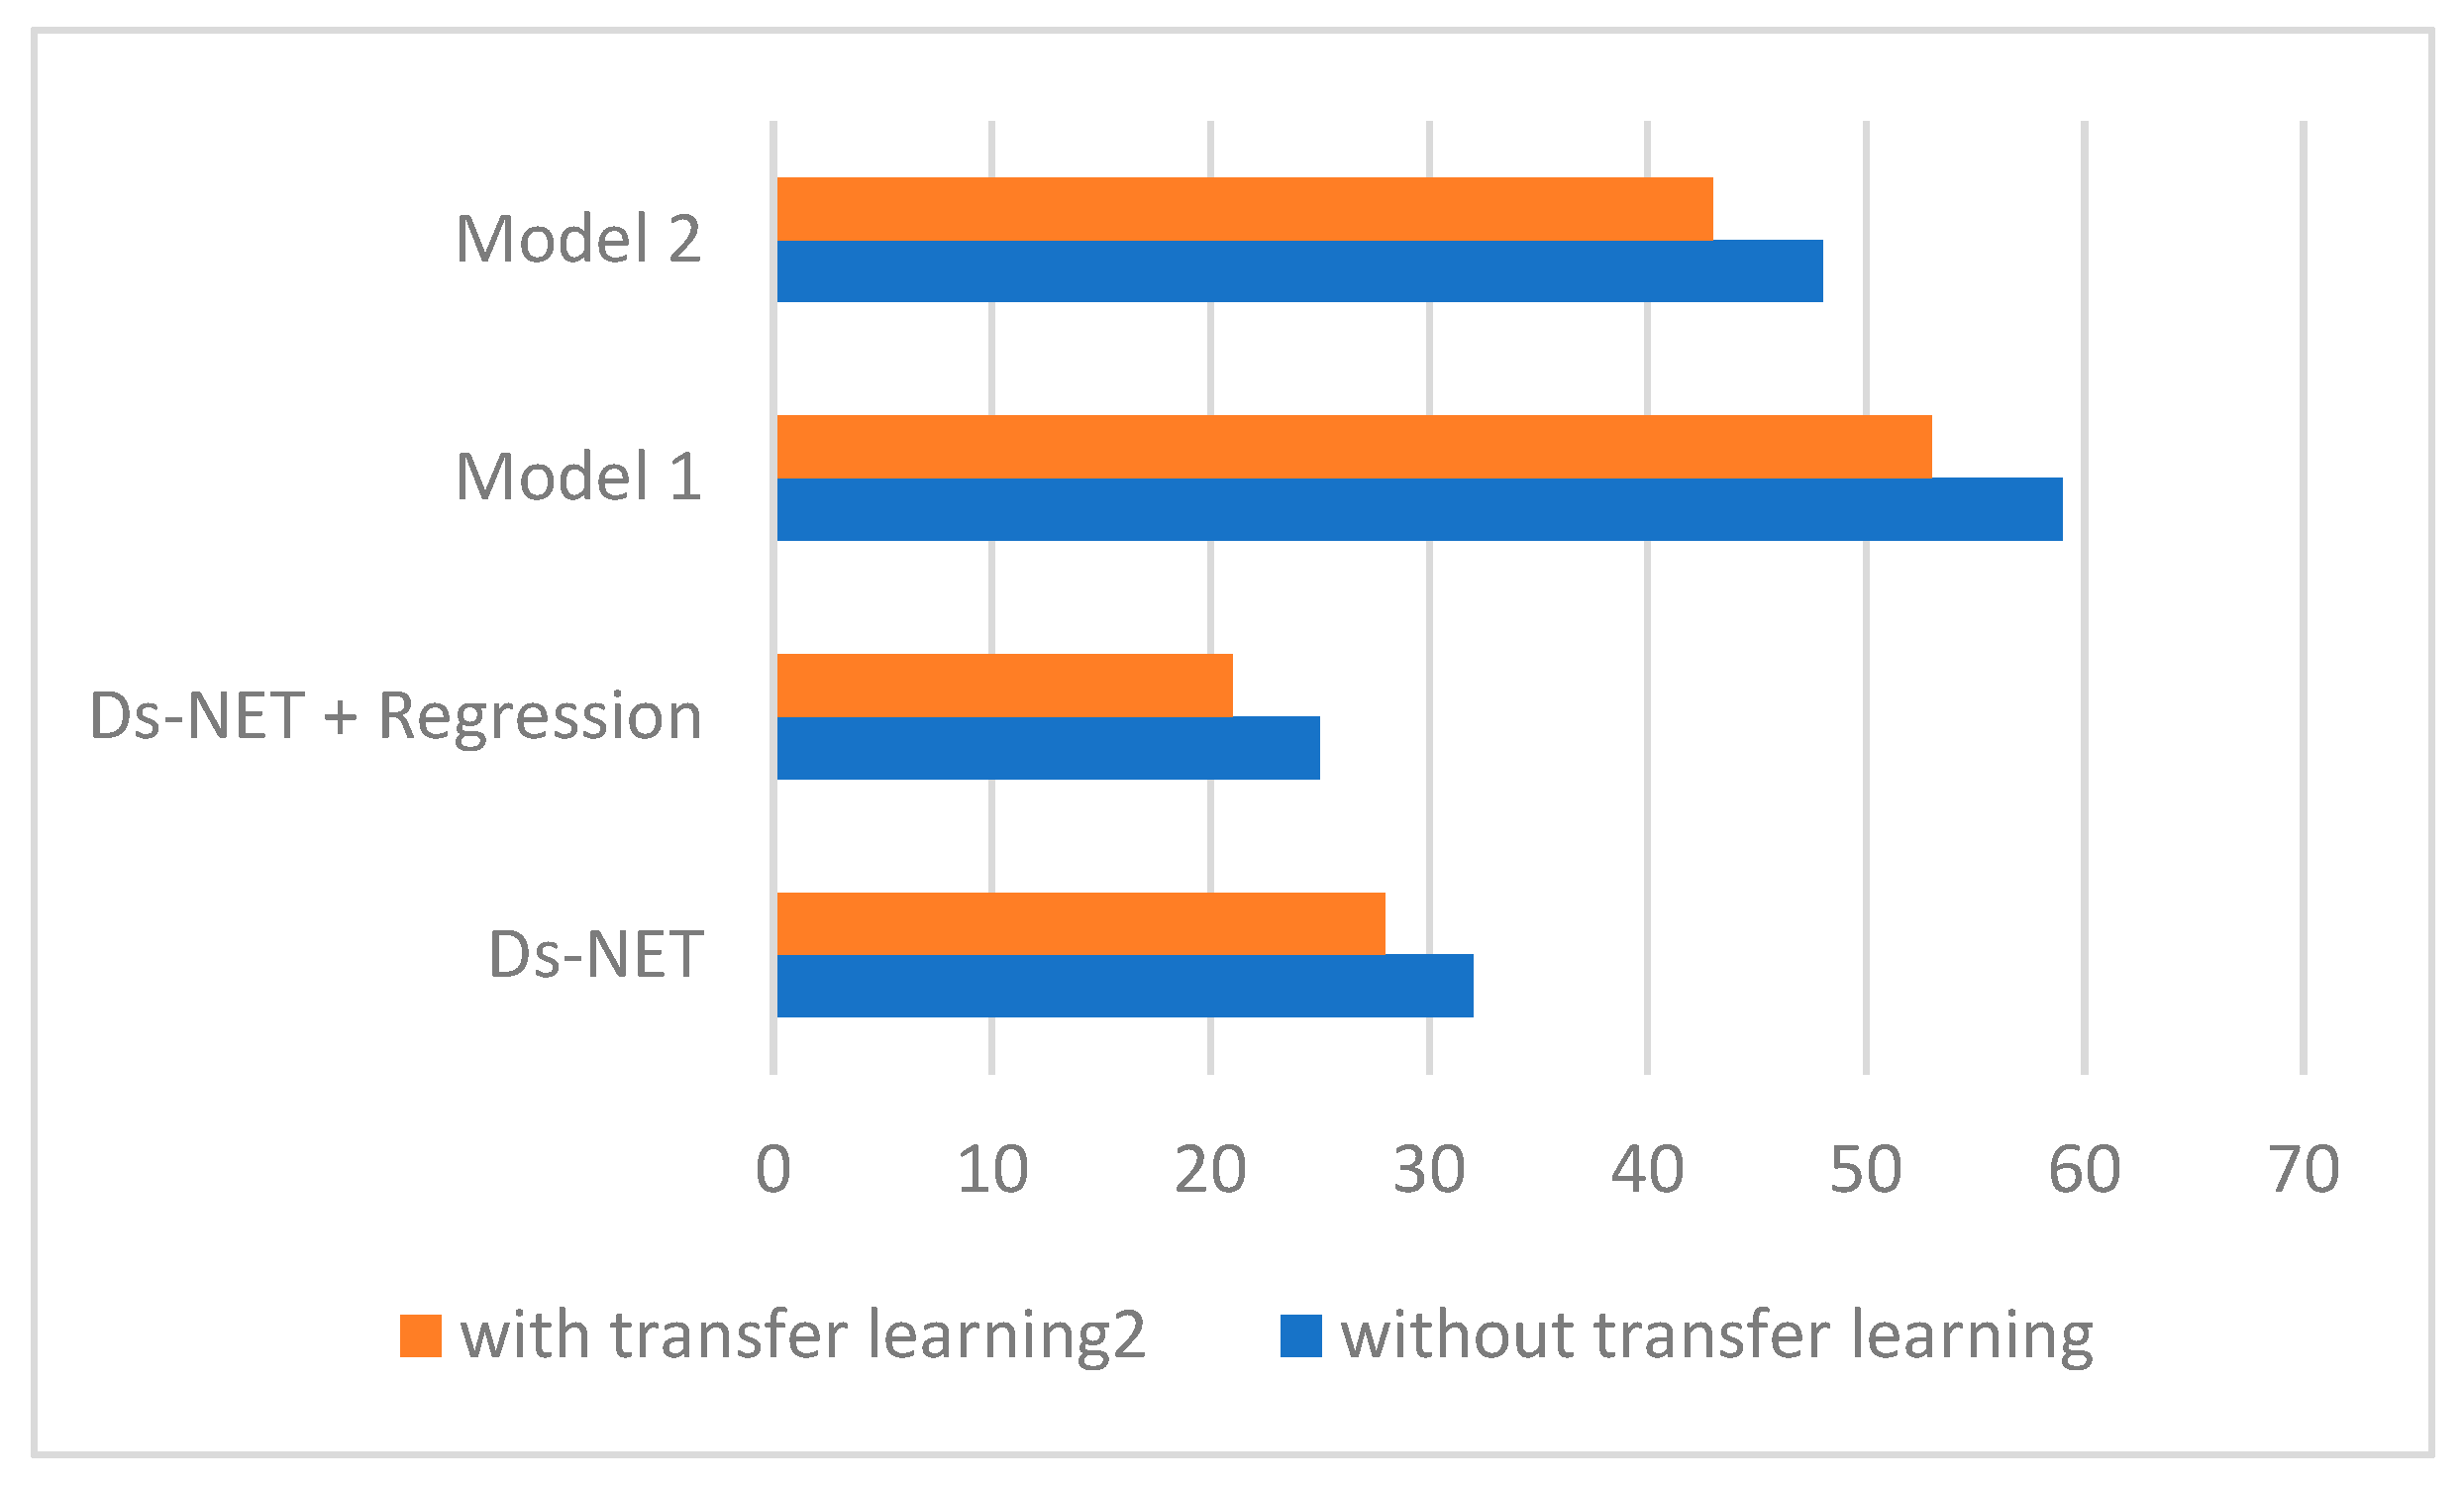
Figure 11 depicts the computational time in a single training epoch for diverse models on the same dataset. the training computational time is influenced by both the database and batch size, Figure 10 expresses the training computational time for a database of 1022 images with batches of twelve images as seen in Model 2 [40]. It can be realized that the training time of the model in [41] (Model 1) takes the longest in training, 53 s, while the training computational time of our multitasking model is at least 21 s. Also, it is seen that transfer learning can reduce the computational time for training.
4. Conclusions
In this research, we proposed a multitasking classification model for the crystal structure’s surface using the dense Dns-Net deep learning architecture. Two public datasets of crystal structure diffraction images were utilized to train and test the proposed model. A dense neural network (DNN) is proposed with better classification accuracy. The multitask technique is tested by utilizing a dataset of 16,000 Silicon nitride crystal structures. The dataset includes crystals with 30% highly defective crystals. The DNN model has a high accuracy of 97% with a shorter classification time.
The experimental results demonstrate that the proposed model produced the best performance compared to similar classification models. One of the main limitations of the multitasking model as a deep learning model is the extensiveness of the datasets utilized and the training time required with a large dataset. Nevertheless, as soon as the proposed deep learning model is trained, it predicts a test image in little time, less than 0.4 s. Future extension of this work will comprise the real-time requirements of this model to be installed in clinical settings for LECD crystal structure inspection.
The limitation of this research is that it is restricted to one kind of material crystals as it did not include four classes.
Author Contributions
Conceptualization, H.A.H.M. and A.A.A.; methodology, H.A.H.M.; software, H.A.H.M.; validation, H.A.H.M. and A.A.A.; formal analysis, H.A.H.M.; investigation, H.A.H.M.; resources, A.A.A.; data curation, H.A.H.M.; writing—original draft preparation, H.A.H.M.; writing— review and editing, A.A.A.; visualization, H.A.H.M.; supervision, H.A.H.M.; project administration, H.A.H.M.; funding. All authors have read and agreed to the published version of the manuscript.
Funding
This research was funded by Princess Nourah bint Abdulrahman University Researchers Supporting Project number (PNURSP2022R113), Princess Nourah bint Abdulrahman University, Riyadh, Saudi Arabia.
Institutional Review Board Statement
Not applicable.
Informed Consent Statement
Not applicable.
Data Availability Statement
Not applicable.
Conflicts of Interest
The authors declare that they have no conflicts of interest to report regarding the present study.
References
- Tang, B.; Lu, Y.; Zhou, J.; Chouhan, T.; Wang, H.; Golani, P.; Xu, M.; Xu, Q.; Guan, C.; Liu, Z. Machine learning-guided synthesis of advanced inorganic materials. Mater. Today 2020, 41, 72–80. [Google Scholar] [CrossRef]
- Raccuglia, P.; Elbert, K.C.; Adler, P.D.F.; Falk, C.; Wenny, M.B.; Mollo, A.; Zeller, M.; Friedler, S.A.; Schrier, J.; Norquist, A.J. Machine-learning-assisted materials discovery using failed experiments. Nature 2016, 533, 73–77. [Google Scholar] [CrossRef] [PubMed]
- Sorkun, M.C.; Astruc, S.; Koelman, J.M.V.A.; Er, S. An artificial intelligence-aided virtual screening recipe for two-dimensional materials discovery. NPJ Comput. Mater. 2020, 6, 106. [Google Scholar] [CrossRef]
- Kaufmann, K.; Vecchio, K.S. Searching for high entropy alloys: A machine learning approach. Acta Mater. 2020, 198, 178–222. [Google Scholar] [CrossRef]
- Ziletti, A.; Kumar, D.; Scheffler, M.; Ghiringhelli, L.M. Insightful classification of crystal structures using deep learning. Nat. Commun. 2018, 9, 2775. [Google Scholar] [CrossRef]
- Dai, D.; Liu, Q.; Hu, R.; Wei, X.; Ding, G.; Xu, B.; Xu, T.; Zhang, J.; Xu, Y.; Zhang, H. Method construction of structure-property relationship from data by machine learning assisted mining for materials design applications. Mater. Des. 2020, 196, 109194. [Google Scholar] [CrossRef]
- Lee, J.W.; Park, W.B.; Lee, J.H.; Singh, S.P.; Sohn, K.S. A deep-learning technnique for phase identification in multiphase inorganic compounds using synthetic XRD powder patterns. Nat. Commun. 2020, 11, 86. [Google Scholar] [CrossRef]
- Park, W.B.; Chung, J.; Jung, J.; Sohn, K.; Singh, S.P.; Pyo, M.; Shim, N.; Sohn, K.S. Classification of crystal structure using a convolutional neural network. IUCrJ 2017, 4, 486–494. [Google Scholar] [CrossRef]
- Schütt, K.T.; Sauceda, H.E.; Kindermans, P.J.; Tkatchenko, A.; Müller, K.R. SchNet—A deep learning architecture for molecules ans materials. J. Chem. Phys. 2018, 148, 241722. [Google Scholar] [CrossRef]
- Pilania, G.; Gubernatis, J.E.; Lookman, T. Multi-fidelity machine learning models for accurate bandgap predictions of solids. Comput. Mater. Sci. 2017, 129, 156–163. [Google Scholar] [CrossRef] [Green Version]
- Pilania, G.; Balachandran, P.V.; Kim, C.; Lookman, T. Finding new perovskite halides via machine learning. Front. Mater. 2016, 3, 19. [Google Scholar] [CrossRef]
- Gómez-Peralta, J.I.; Bokhimi, X. Ternary halide perovskites for possible optoelectronic applications revealed by Artificial Intelligence and DFT calculations. Mater. Chem. Phys. 2021, 267, 124710. [Google Scholar] [CrossRef]
- Hong, Y.; Hou, B.; Jian, H.; Zhang, J. Machine learning and artificial neutal network accelerated computational discoveries in materials science. WIREs Comput. Mol. Sci. 2020, 10, e1450. [Google Scholar]
- Schütt, O.; VandeVondele, J. Machine learning adaptive basis sets for efficient large scale density functional theory simulation. J. Chem. Theory Comput. 2018, 14, 4168–4175. [Google Scholar] [CrossRef]
- Xie, T.; Grossman, J.C. Crystal graph convolutional neural networks for an accurate and interpretable prediction of material properties. Phys. Rev. Lett. 2018, 120, 145301. [Google Scholar] [CrossRef] [PubMed]
- Schmidt, J.; Shi, H.; Borlido, P.; Chen, L.; Botti, S.; Marques, M.A.L. Predicting the thermodynamic stability of solids combining density functional theory and machine learning. Chem. Mater. 2017, 29, 5090–5103I. [Google Scholar] [CrossRef]
- Isayev, O.; Oses, C.; Toher, C.; Gossett, E.; Curtarolo, S.; Tropsha, A. Universal fragment descriptors for predicting properties of inorganic crystals. Nat. Commun. 2017, 8, 15679. [Google Scholar] [CrossRef]
- Saidi, W.A.; Shadid, W.; Castelli, I.E. Machine-learning structural and electronic properties of metal halide perovskites using a hierarchical convolutional neural network. NPJ Comput. Mater. 2020, 6, 36. [Google Scholar] [CrossRef]
- Roldán-Nofuentes, J.A.; Regad, S.B. Comparison of the Average Kappa Coefficients of Two Binary Diagnostic Tests with Missing Data. Mathematics 2021, 9, 2834. [Google Scholar] [CrossRef]
- Jha, D.; Ward, L.; Paul, A.; Liao, W.K.; Choudhary, A.; Wolverton, C.; Agrawal, A. ElmNet: Deep learning the chemistry of materials from only elemental composition. Sci. Rep. 2018, 8, 17593. [Google Scholar] [CrossRef]
- Goodall, R.E.A.; Lee, A.A. Predicting materials properties without crystal struture: Deep representation learning from stoichiometry. Nat. Commum. 2020, 11, 6280. [Google Scholar] [CrossRef] [PubMed]
- Smith, J.S.; Isayev, O.; Roitberg, A.E. ANI-1: An extensible neural network potential with DFT accuracy at force field computational cost. Chem. Sci. 2017, 8, 3192–3203. [Google Scholar] [CrossRef]
- Goh, G.B.; Hodas, N.O.; Vishnu, A. Deep learning for computational chemistry. J. Comput. Chem. 2017, 38, 1291–1307. [Google Scholar] [CrossRef] [PubMed]
- Agrawal, A.; Choudhary, A. Perspective: Materials informatics and big data: Realization of the “fourth paradigm” of science in materials science. APL Mater. 2016, 4, 053208. [Google Scholar]
- Valle, M.; Oganov, A.R. Crystal fingerprint space—A novel paradigm for studying crystal-structure sets. Acta Crystallogr. A 2010, 66, 507–517. [Google Scholar] [CrossRef]
- Ye, W.; Chen, C.; Wang, Z.; Chu, I.H.; Ong, S.P. Deep neural networks for accurate predictions of crytal stability. Nat. Commun. 2018, 9, 3800. [Google Scholar] [CrossRef]
- Hachmann, J.; Olivares-Amaya, R.; Atahan-Evrenk, S.; Amador-Bedolla, C.; Sánchez-Carrera, R.S.; Gold-Parker, A.; Voigt, L.; Brockway, A.M.; Aspuru-Guzik, A. The Harvard Clean Energy Project: Large-scale computational screening and design of organic photovoltaics an the World Community Grid. J. Phys. Chem. Lett. 2011, 2, 2241–2251. [Google Scholar] [CrossRef]
- Vom Material zur Innovation. Rahmenprogramm zur Förderung der Materialforschung “Bundesministerium für Bildung und Forschung”. Available online: https://www.ptj.de/vom-material-zur-innovation (accessed on 1 July 2022).
- Voulodimos, A.; Doulami, N.; Doulamis, A.; Protopapadakis, E. Recent developments in Deep Learning for engineering applications. Comput. Intell. Neurosci. 2018, 2018, 7068349. [Google Scholar] [CrossRef]
- Lee, J.G.; Jun, S.; Cho, Y.W.; Lee, H.; Kim, G.B.; Seo, J.B.; Kim, N. Deep learning in medical imaging: General overview. Korean J. Radiol. 2017, 18, 570–584. [Google Scholar] [CrossRef]
- Litjens, G.; Kooi, T.; Bejnordi, B.E.; Setio, A.A.A.; Ciompi, F.; Ghafoorian, M.; van der Laak, J.A.W.M.; van Ginneken, B.; Sánchez, C.I. A survey on deep learning in medical image analysis. Med. Image Anal. 2017, 42, 60–88. [Google Scholar] [CrossRef]
- Tkac, M.; Verner, R. Artificial neural networks in business: Two decades of research. Appl. Soft Comput. 2016, 38, 788–804. [Google Scholar] [CrossRef]
- Jordan, M.I.; Mitchell, T.M. Machine learning: Trends, perspectives, and prospects. Science 2015, 349, 255–260. [Google Scholar] [CrossRef]
- LeCun, Y.; Bengio, Y.; Hinton, G. Deep Learning. Nature 2015, 521, 436–444. [Google Scholar] [CrossRef]
- Sze, V.; Chen, Y.H.; Yang, T.J.; Emer, J.S. Efficient processing of deep neural networks: A tutorial and survey. Proc. IEEE 2017, 105, 2295–2329. [Google Scholar] [CrossRef]
- Behler, J. Perspective: Machine learning potentials for atomistic simulations. J. Chem. Phys. 2016, 145, 170901. [Google Scholar] [CrossRef]
- Ghiringelli, L.M.; Vybiral, J.; Levchenko, S.V.; Draxl, C.; Scheffler, M. Big data of materials science: Critical role of the descriptor. Phys. Rev. Lett. 2015, 114, 105503. [Google Scholar] [CrossRef]
- Fedorov, A.; Shamanaev, I.V. Crystal structure representation for neural networks using topological approach. Mol. Inf. 2017, 36, 1600162. [Google Scholar] [CrossRef] [PubMed]
- Thimm, G. Crystal topologies—The achievable and inevitble symmetries. Acta Crystallogr. A 2009, 65, 213–226. [Google Scholar] [CrossRef] [PubMed]
- Jiang, Y.; Chen, D.; Chen, X.; Li, T.; Wei, G.W.; Pan, F. Topological representations of crystalline compounds for the machine-learning prediction of materials properties. NPJ Comput. Mater. 2021, 7, 28. [Google Scholar] [CrossRef]
- Faber, F.; Lindmaa, A.; von Lillienfeld, O.A.; Armiento, R. Crystal structure representations for machine learning models of formation enegies. Int. J. Quantum Chem. 2015, 115, 1094–1101. [Google Scholar] [CrossRef]
- NVIDIA Workstation. Available online: https://www.nvidia.com/en-us/design-visualization/desktop-graphics/ (accessed on 20 June 2020).
- Python Documentation. Available online: https://www.python.org/doc/ (accessed on 27 May 2022).
- Gerke, O. Reporting Standards for a Bland–Altman Agreement Analysis: A Review of Methodological Reviews. Diagnostics 2020, 10, 334. [Google Scholar] [CrossRef] [PubMed]
Figure 1.
(top) Images of Pristine surface and different severity cases of crystal structures [5] (bottom) Diffraction structure of normal surface and different severity cases of crystal structures.
Figure 1.
(top) Images of Pristine surface and different severity cases of crystal structures [5] (bottom) Diffraction structure of normal surface and different severity cases of crystal structures.

Figure 2.
The proposed classifier and regression model, the images of the diffraction crystal images are fed as input for both the classifier and the regression model, and the outputs from both models are then fused.
Figure 2.
The proposed classifier and regression model, the images of the diffraction crystal images are fed as input for both the classifier and the regression model, and the outputs from both models are then fused.

Figure 3.
The Multitasking connected network with feature fusion from the squeeze model and the regression model where the classifier can predict the four classes for the input crystals.
Figure 3.
The Multitasking connected network with feature fusion from the squeeze model and the regression model where the classifier can predict the four classes for the input crystals.

Figure 4.
Transfer Learning Model.

Figure 5.
The correlation between the severity of the actual and predicted cases of crystal structures from diffraction photography of the surface measured using the Bland-Altman Plot which is a difference against average.
Figure 5.
The correlation between the severity of the actual and predicted cases of crystal structures from diffraction photography of the surface measured using the Bland-Altman Plot which is a difference against average.

Figure 6.
The ratio of the crystal structure severity using the Dns-Net + regression with transfer learning versus the actual ratio detected by experts.
Figure 6.
The ratio of the crystal structure severity using the Dns-Net + regression with transfer learning versus the actual ratio detected by experts.

Figure 7.
The effect of the training set size on the prediction accuracy of the different models against the ground truth.
Figure 7.
The effect of the training set size on the prediction accuracy of the different models against the ground truth.

Figure 8.
AUC curve for the Dns-Net model, the greater the area under the curve the better accuracy.
Figure 8.
AUC curve for the Dns-Net model, the greater the area under the curve the better accuracy.

Figure 9.
AUC curve for the Dns-Net model with regression inferring the transfer learning effect, the greater the area under the curve the better accuracy.
Figure 9.
AUC curve for the Dns-Net model with regression inferring the transfer learning effect, the greater the area under the curve the better accuracy.

Figure 10.
Precision versus recall of the Dns-Net model with regression inferring the transfer learning effect, the precision increased with the transfer learning.
Figure 10.
Precision versus recall of the Dns-Net model with regression inferring the transfer learning effect, the precision increased with the transfer learning.

Figure 11.
Prediction time of the Dns-Net model with regression inferring the transfer learning effect versus other models.
Figure 11.
Prediction time of the Dns-Net model with regression inferring the transfer learning effect versus other models.


Table 1.
Exper-1confusion matrix for Dns-Net without the transfer learning.
| Predicted Cases | Total | |||||
|---|---|---|---|---|---|---|
| No-Defect | Pristine | Defective Random Displacement | Defective 25% Vacancies | |||
| Actual Cases | No-defect | 3470 | 28 | 2 | 0 | 3500 |
| Pristine | 88 | 4410 | 2 | 0 | 4500 | |
| Defective random displacement | 14 | 86 | 3700 | 200 | 4000 | |
| Defective 25% vacancies | 0 | 0 | 250 | 3750 | 4000 | |
Table 2.
Exper-1 confusion matrix for Dns-Net with the transfer learning.
| Predicted Cases | Total | |||||
|---|---|---|---|---|---|---|
| No-Defect | Pristine | Defective Random Displacement | Defective 25% Vacancies | |||
| Actual Cases | No-defect | 3480 | 18 | 2 | 0 | 3500 |
| Pristine | 67 | 4440 | 3 | 0 | 4500 | |
| Defective random displacement | 14 | 86 | 3730 | 170 | 4000 | |
| Defective 25% vacancies | 0 | 0 | 230 | 3780 | 4000 | |
Table 3.
Experimental Results.
| Average Results | ||||
|---|---|---|---|---|
| Model | Accuracy % | Sensitivity % | Specificity % | Error Rate |
| Dns-Net without the transfer learning | 91.7 | 86.9 | 90.1 | 0.092 |
| Dns-Net with the transfer learning | 94.98 | 91.7 | 92.79 | 0.0473 |
Table 4.
Exper-2 confusion matrix for Dns-Net + regression without transfer learning.
| Predicted Cases | Total | |||||
|---|---|---|---|---|---|---|
| No-Defect | Pristine | Defective Random Displacement | Defective 25% Vacancies | |||
| Actual Cases | No-defect | 3490 | 8 | 2 | 0 | 3500 |
| Pristine | 38 | 4460 | 2 | 0 | 4500 | |
| Defective random displacement | 14 | 36 | 3900 | 50 | 4000 | |
| Defective 25% vacancies | 0 | 0 | 50 | 3950 | 4000 | |
Table 5.
Exper-2 confusion matrix for Dns-Net + regression with transfer learning.
| Predicted Cases | Total | |||||
|---|---|---|---|---|---|---|
| No-Defect | Pristine | Defective Random Displacement | Defective 25% Vacancies | |||
| Actual Cases | No-defect | 3498 | 2 | 0 | 0 | 3500 |
| Pristine | 18 | 4480 | 2 | 0 | 4500 | |
| Defective random displacement | 0 | 0 | 3970 | 30 | 4000 | |
| Defective 25% vacancies | 0 | 0 | 20 | 3980 | 4000 | |
Table 6.
Experimental Results for Exper-2.
| Average Results | ||||
|---|---|---|---|---|
| Model | Accuracy % | Sensitivity % | Specificity % | Error Rate |
| Dns-Net + Regression without the transfer learning | 95.7 | 95.9 | 95.1 | 0.0321 |
| Dns-Net + Regression with the transfer learning | 98.73 | 97.7 | 96.79 | 0.0219 |
Table 7.
Experimental Results for Exper-2.
| Model | Accuracy % | Sensitivity % | Specificity % | Error Rate | Number of Classes |
|---|---|---|---|---|---|
| Dns-Net + Regression without the transfer learning | 95.7 | 95.9 | 95.1 | 0.0321 | 4 |
| Dns-Net + Regression with the transfer learning | 98.73 | 97.7 | 96.79 | 0.0219 | 4 |
| Model in [40] | 88.12% | 89.1% | 90.1% | 0.0481 | 2 |
| Model in [41] | 93.5% | 94.7% | 93.55 | 0.0412 | 4 |
Publisher’s Note: MDPI stays neutral with regard to jurisdictional claims in published maps and institutional affiliations. |
© 2022 by the authors. Licensee MDPI, Basel, Switzerland. This article is an open access article distributed under the terms and conditions of the Creative Commons Attribution (CC BY) license (https://creativecommons.org/licenses/by/4.0/).
Share and Cite
MDPI and ACS Style
Alarfaj, A.A.; Hosni Mahmoud, H.A. Feature Fusion Deep Learning Model for Defects Prediction in Crystal Structures. Crystals 2022, 12, 1324. https://doi.org/10.3390/cryst12091324
AMA Style
Alarfaj AA, Hosni Mahmoud HA. Feature Fusion Deep Learning Model for Defects Prediction in Crystal Structures. Crystals. 2022; 12(9):1324. https://doi.org/10.3390/cryst12091324
Chicago/Turabian StyleAlarfaj, Abeer Abdulaziz, and Hanan Ahmed Hosni Mahmoud. 2022. "Feature Fusion Deep Learning Model for Defects Prediction in Crystal Structures" Crystals 12, no. 9: 1324. https://doi.org/10.3390/cryst12091324
Note that from the first issue of 2016, this journal uses article numbers instead of page numbers. See further details here.