Article

Synthesis of New Homopiperazine-1.4-Diium Tetrachloridromercurate (II) Monohydrate (C5H14N2)[HgCl4]·H2O, Crystal Structure, Hirshfeld Surface, Spectroscopy, Thermal Analysis, Antioxidant Activity, Electric and Dielectric Behavior

1
Materials Chemistry Laboratory, Faculty of Sciences of Bizerte, University of Carthage, Zarzouna 7021, Tunisia
2
Department of Chemistry, College of Sciences and Humanities, Shaqra University, Shaqra 11911, Saudi Arabia
3
Department of Chemistry, College of Science, King Saud University, Riyadh 11451, Saudi Arabia
4
Department of Chemistry, College of Sciences and Arts, King Abdulaziz University, Rabigh 21589, Saudi Arabia
5
Laboratory of Material Physics: Structures and Properties, LR01ES15, Faculty of Sciences, University of Carthage, Zarzouna 7021, Tunisia
6
Department of Marine Electronics and Mechanical Engineering, Faculty of Marine Engineering, Tokyo University of Marine Science and Technology, Tokyo 135-8533, Japan
*
Author to whom correspondence should be addressed.
Crystals 2022, 12(4), 486; https://doi.org/10.3390/cryst12040486
Submission received: 6 March 2022 / Revised: 24 March 2022 / Accepted: 28 March 2022 / Published: 31 March 2022
(This article belongs to the Special Issue Feature Papers in Crystal Engineering in 2022)

Abstract

:
Using acid–base assays and simple slow evaporation method at ambient temperature, we were successful in producing a novel salt with the chemical formula (C5H14N2)[HgCl4]·H2O. According to single-crystal X-ray diffraction data, the crystal packing was regulated by H-bonds and by Coulomb interactions (also called electrostatic interactions) between distinct entities, which formed a 3D network. The 2D fingerprint plots and the Hirshfeld surface were utilized to examine the effect of intermolecular interactions. FTIR spectroscopy, PL spectroscopy, thermal analysis, and electrical conductivity experiments were also carried out, and the antioxidant activity was tested.

1. Introduction

Several strategies have been used to investigate, synthesize, and describe mercury-based compounds because of their self-assembling nature [1]. The anions in this class of compounds have long been recognized to exhibit a wide range of stoichiometric, geometric, and connectivity properties, due to the full 4f and 5d electron shells, which make themmore flexible [2]. These compounds may have different geometries, and their deformed forms and substantial distortions in the ideal polyhedron are readily possible [3,4,5,6]. Hg2+ ions have a wide range of potential applications in the paper industry, paints, and preservation of mercury (II) compounds. Despite these advantages in terms of potential applications in various fields, the formation of polymers containing Hg2+ ions is disproportionately sparse in comparison to Zn2+ and Cd2+metals [7,8,9,10,11,12,13,14,15,16,17,18].
Recently, homopiperazine (heterocyclic amine) has found widespread use in several applications, including as a component of liquids for CO2 capture [19] and as a component of various organic and organic/inorganic supramolecular ionic salts and transition metal complexes. In these applications, the materials are generally characterized by X-ray diffractions, we can conclude that there are a large number of X-ray structures involving the dication of homopiperazinium in salts or mixed salts; we note sulfate oxalate manganese [20], cobalt sulfate [21], zinc phosphate [22], and so on. There are also an interesting number of structures in which homopiperazine reacts like bidentate ligand on nickel [23], copper [24], and platinum [25,26,27,28]. There are several uses for homopiperazines in medicine, including antimicrobial, antibiotic, antituberculous, antipsychotic, anticonvulsant, depressive, anti-inflammatory, cytotoxic, antimalarial, antiarrhythmic, and antiviral [29,30,31,32,33].
In this article, according to the motivations stated above, we have introduced a novel compound, homopiperazine-1.4-diium tetrachloromercurate (II) monohydrate ([HgCl4]2−, (C5H14N2)2+, H2O). We will analyze the information given by the single-crystal XRD and by PXRD. We will discuss their spectroscopic properties (FT-IR and PL) and their thermal properties. Moreover, we will study their intermolecular interactions by the analysis of Hirshfeld surfaces. Furthermore, we will determine the electric and dielectric properties to give more information about conduction modes. We ended the study with a test of antioxidant activity.

2. Experimental Part

2.1. Chemical Preparation

The compound (C5H14N2)[HgCl4]·H2O is obtained by acid–base reaction. The homopiperazine amine (C5H14N2) (0.28 mL, 2mmol, purity 98%, Sigma-Aldrich, Burlington, MA, USA) dissolved in 20 mL of ethanol was added to a solution containing HgCl2 (0.271 g, 1 mmol, 99.5% Fluka, Buchs, Switzerland) dissolved in 15 mL of hydrochloric acid (36–38%, Sigma-Aldrich) (6 M) (molar ratio 1:2) and 15 mL of water. Drop by drop, concentrated hydrochloric acid (HCl) was added to the solution until it was clear. Colorless prismatic crystals of high quality formed after almost three weeks of crystallization in the solution at room temperature.
The reaction scheme is as follows:
HgCl2+2HCl + C5H12N2+H2O → (C5H14N2)[HgCl4]·H2O
The CHN-elemental analysis for the compound (C5H14N2)[HgCl4]·H2O is as follows: Anal. calculated C, 12.98; H, 3.48; and N, 6.05%; and experimental: C, 12.67; H, 3.09; and N, 5.98%.

2.2. Investigation Methods

Rigaku Mercury CCD2 (Rigaku Corporation, Tokyo, Japan) equipped with MoKα radiation (0.71075) at 298 K was used to determine crystal data of (C5H14N2)[HgCl4]·H2O.The refinement was carried out by the SHELXL version 2018/1 program [34]. Empirical absorption adjustments were calculated on the basis of a multi-scan. ORTEP and DIAMOND software were used to generate the structural graphics [35]. Table 1 contains selected crystallographic data and experimental information. The experimental PXRD patterns of (C5H14N2)[HgCl4]·H2O were determined using a powder diffractometer called Advance Bruker D8 with Cu-(λ(Kα1)= 1.54060 Å) radiation (with receiving slit size = 0.1 mm, and sample length= 10 mm) and by the variation of 2θ from 0 to 50°. The simulated diffractogram is determined directly by Mercury software [36].
The (C5H14N2)[HgCl4]·H2O compound’s Fourier transform infrared spectrum was acquired using a Nicolet Impact 410 FT-IR spectrophotometer, according to the manufacturer (SpectraLab Scientific Inc., Markham, ON, Canada). A SAFAS FLX-Xenius spectrofluorometer (SAFAS, Monaco, Monaco) was used to conduct photoluminescence experiments at room temperature (T = 25 °C), with the intensities of the photoluminescence measurements being corrected for the screening effect.
A PYRIS 1 TGA apparatus (Perkin Elmer, Waltham, MA, USA) was used to manufacture thermograms in the temperature range 300–680 K with an initial mass of about 11.8 mg utilizing a PYRIS 1 DTA thermogram generator. The electrical measurements of the real Z′ and imaginary Z” impedance characteristics changed across a temperature range (311–403 K). These measurements were taken with a Hewlett Packard HP 4192A analyzer (Test Equipment Center Inc., Gainesville, FL, USA). To guarantee electrical connections, the pelleted sample’s two parallel sides were covered with silver paint. A weak mechanical pressure was used to maintain contact between the platinum wires and the sample, which was regulated by a screw/spring system and transferred through an alumina rod. Furthermore, the anti-free-radical activity of DPPH· was also tested using assays similar to those reported by Brand-Williams et al., with slight changes [37].Thus, in a volume of 1 mL, different concentrations of the extract to be tested are prepared in methanol, and then 2 mL of the 0.1 mM concentration of DPPH· solution are added. After vigorous stirring, the mixture is incubated for 1 h in the dark, and then the absorbance was determined using a UV–vis spectrophotometer (JASCO-V530) (Jasco photometers & spectrophotometers, Portland, OR, USA) at 515 nm. Parallel to this, a solution containing 1 mL of DPPH· was created as an analytical blank. The anti-free-radical activity was estimated using the percentage inhibition (%I) value obtained by the following formula:
% I = Abs 0 Abs 1 Abs 0 × 100
where Abs0 is absorbance of the analytical blank, and Abs1 is absorbance of the solution in the presence of extract.
The anti-free-radical activity or EC50 (efficient concentration 50 percent), defined as the quantity of extract required to halve the initial concentration of DPPH·, can be determined using the curve showing the variation of (%I) as a function of the different concentrations of the extract.

3. Results and Discussion

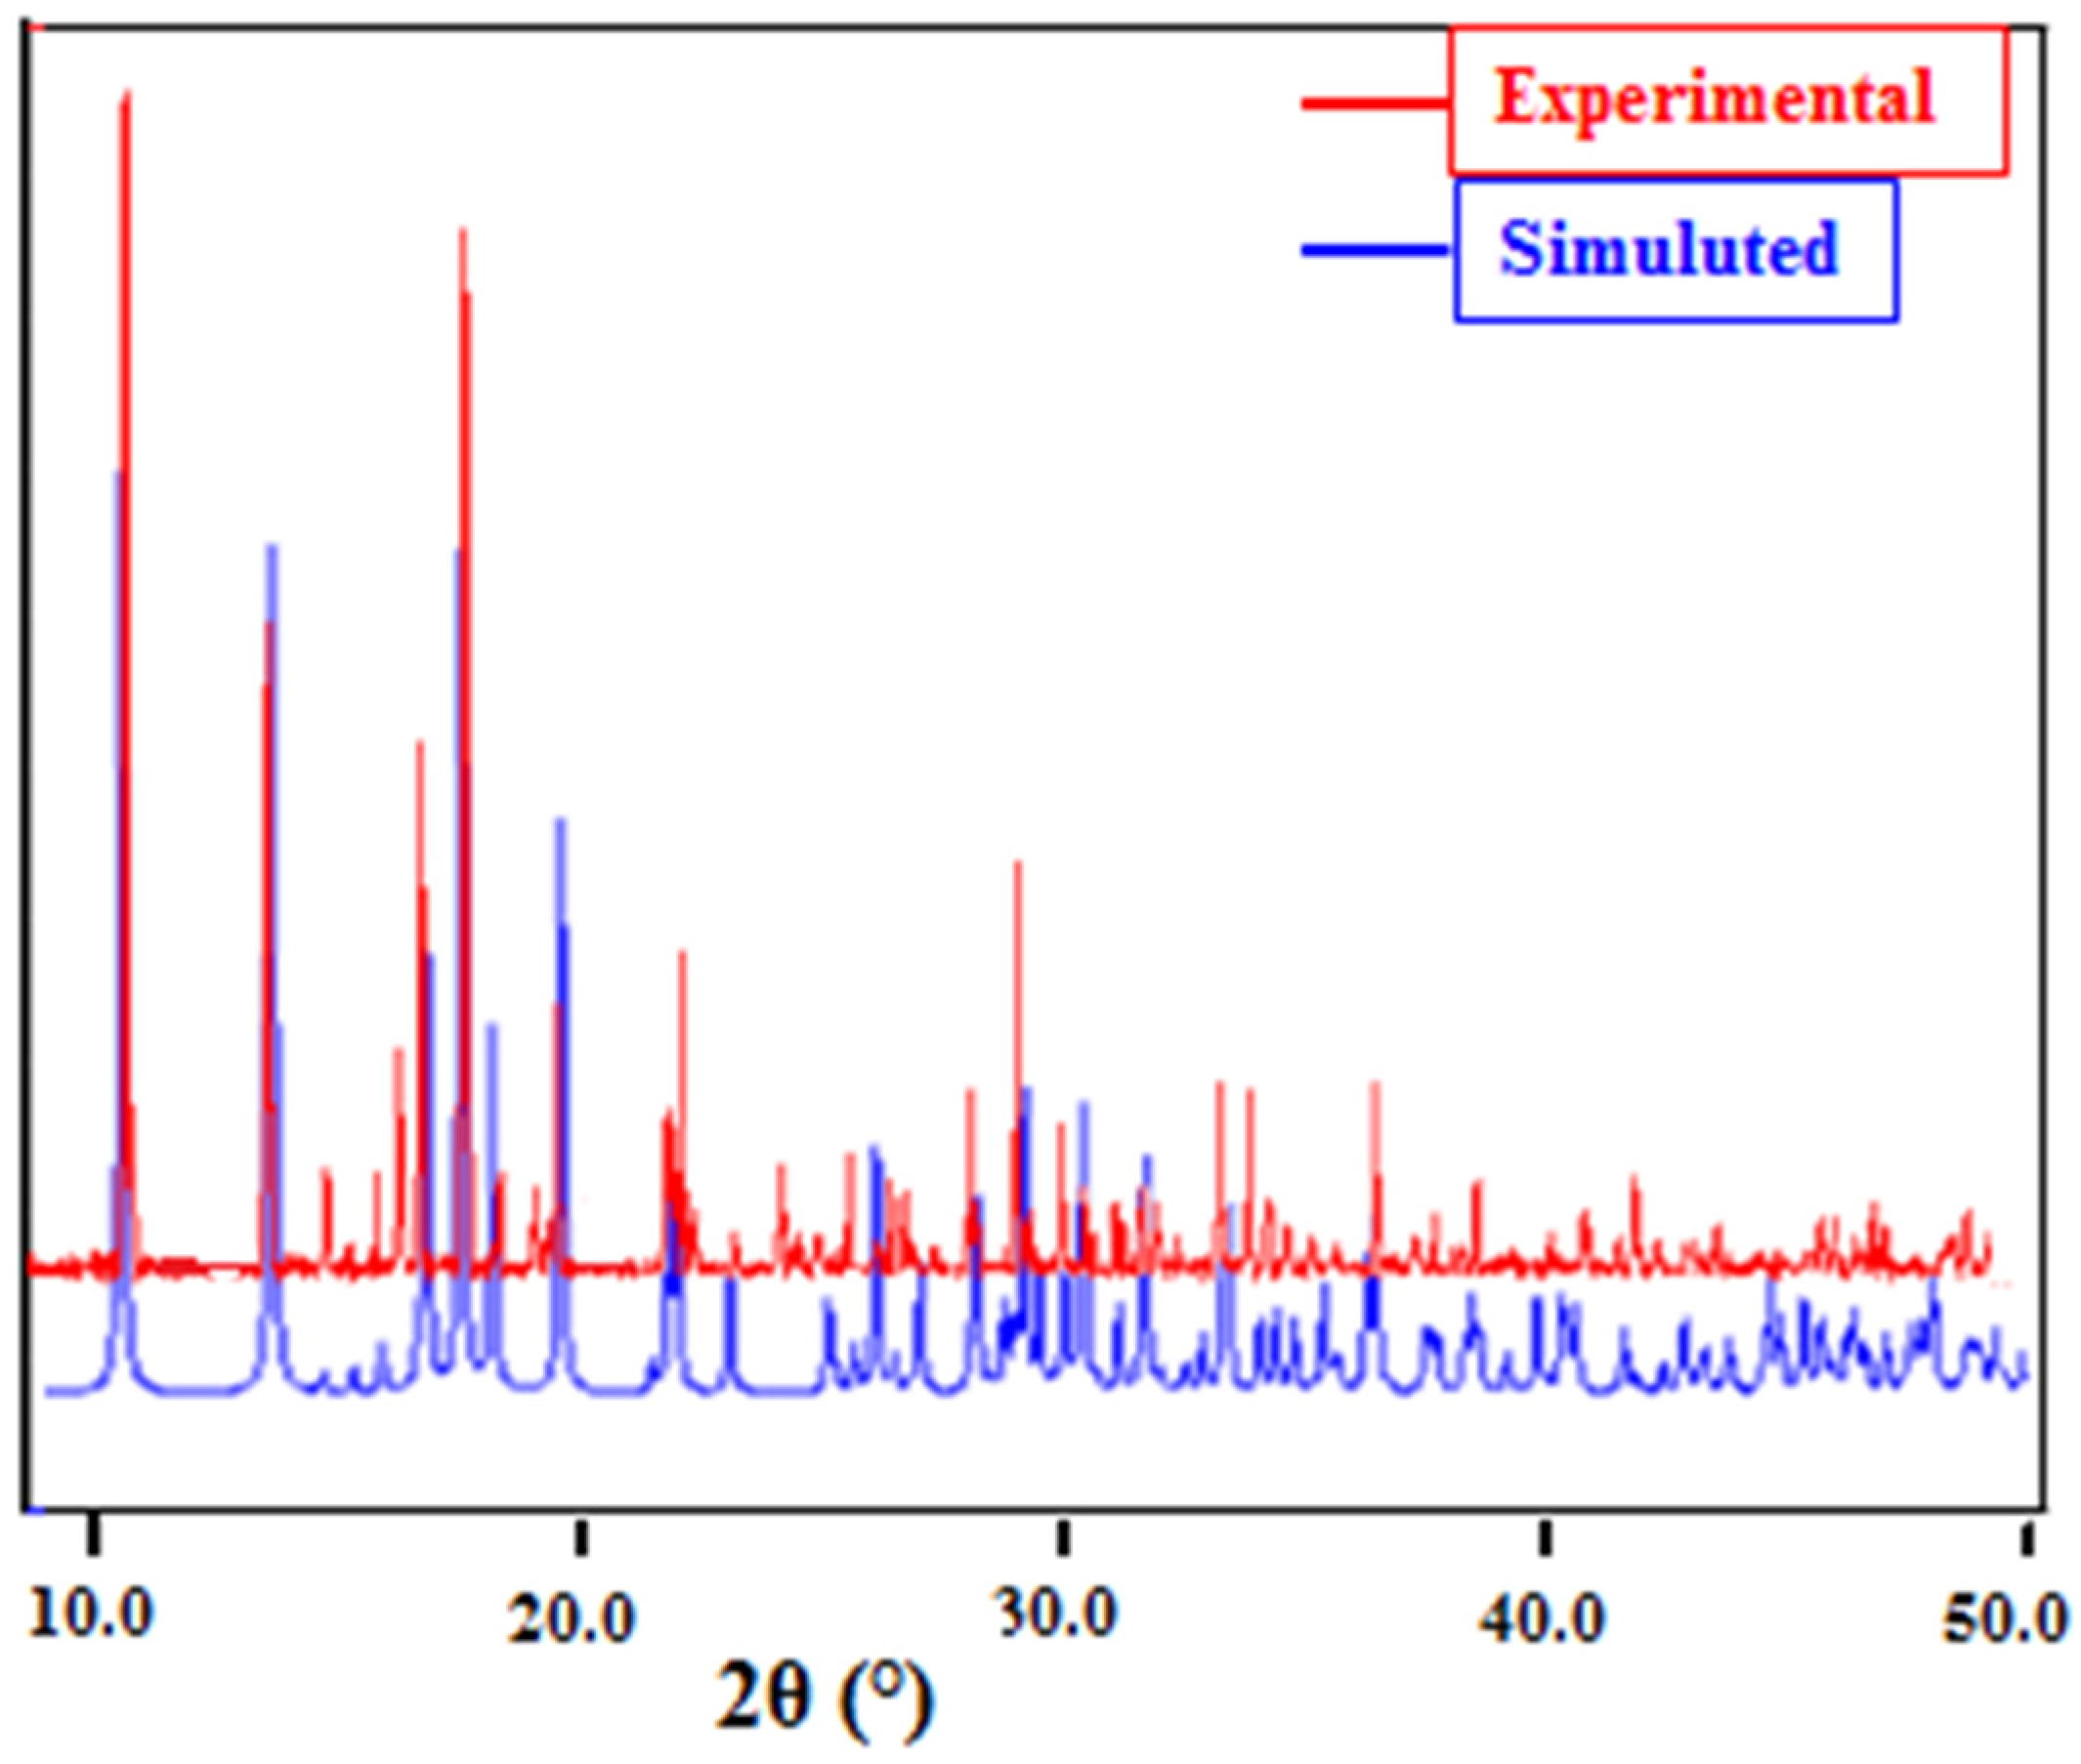
3.1. X-ray Diffraction Powder Analysis

The coincidence between the peak positions of the experimental and the simulated powder X-ray diffraction patterns (PXRD), indicated in Figure 1, verify the phase purity of the compound (C5H14N2)[HgCl4]·H2O.

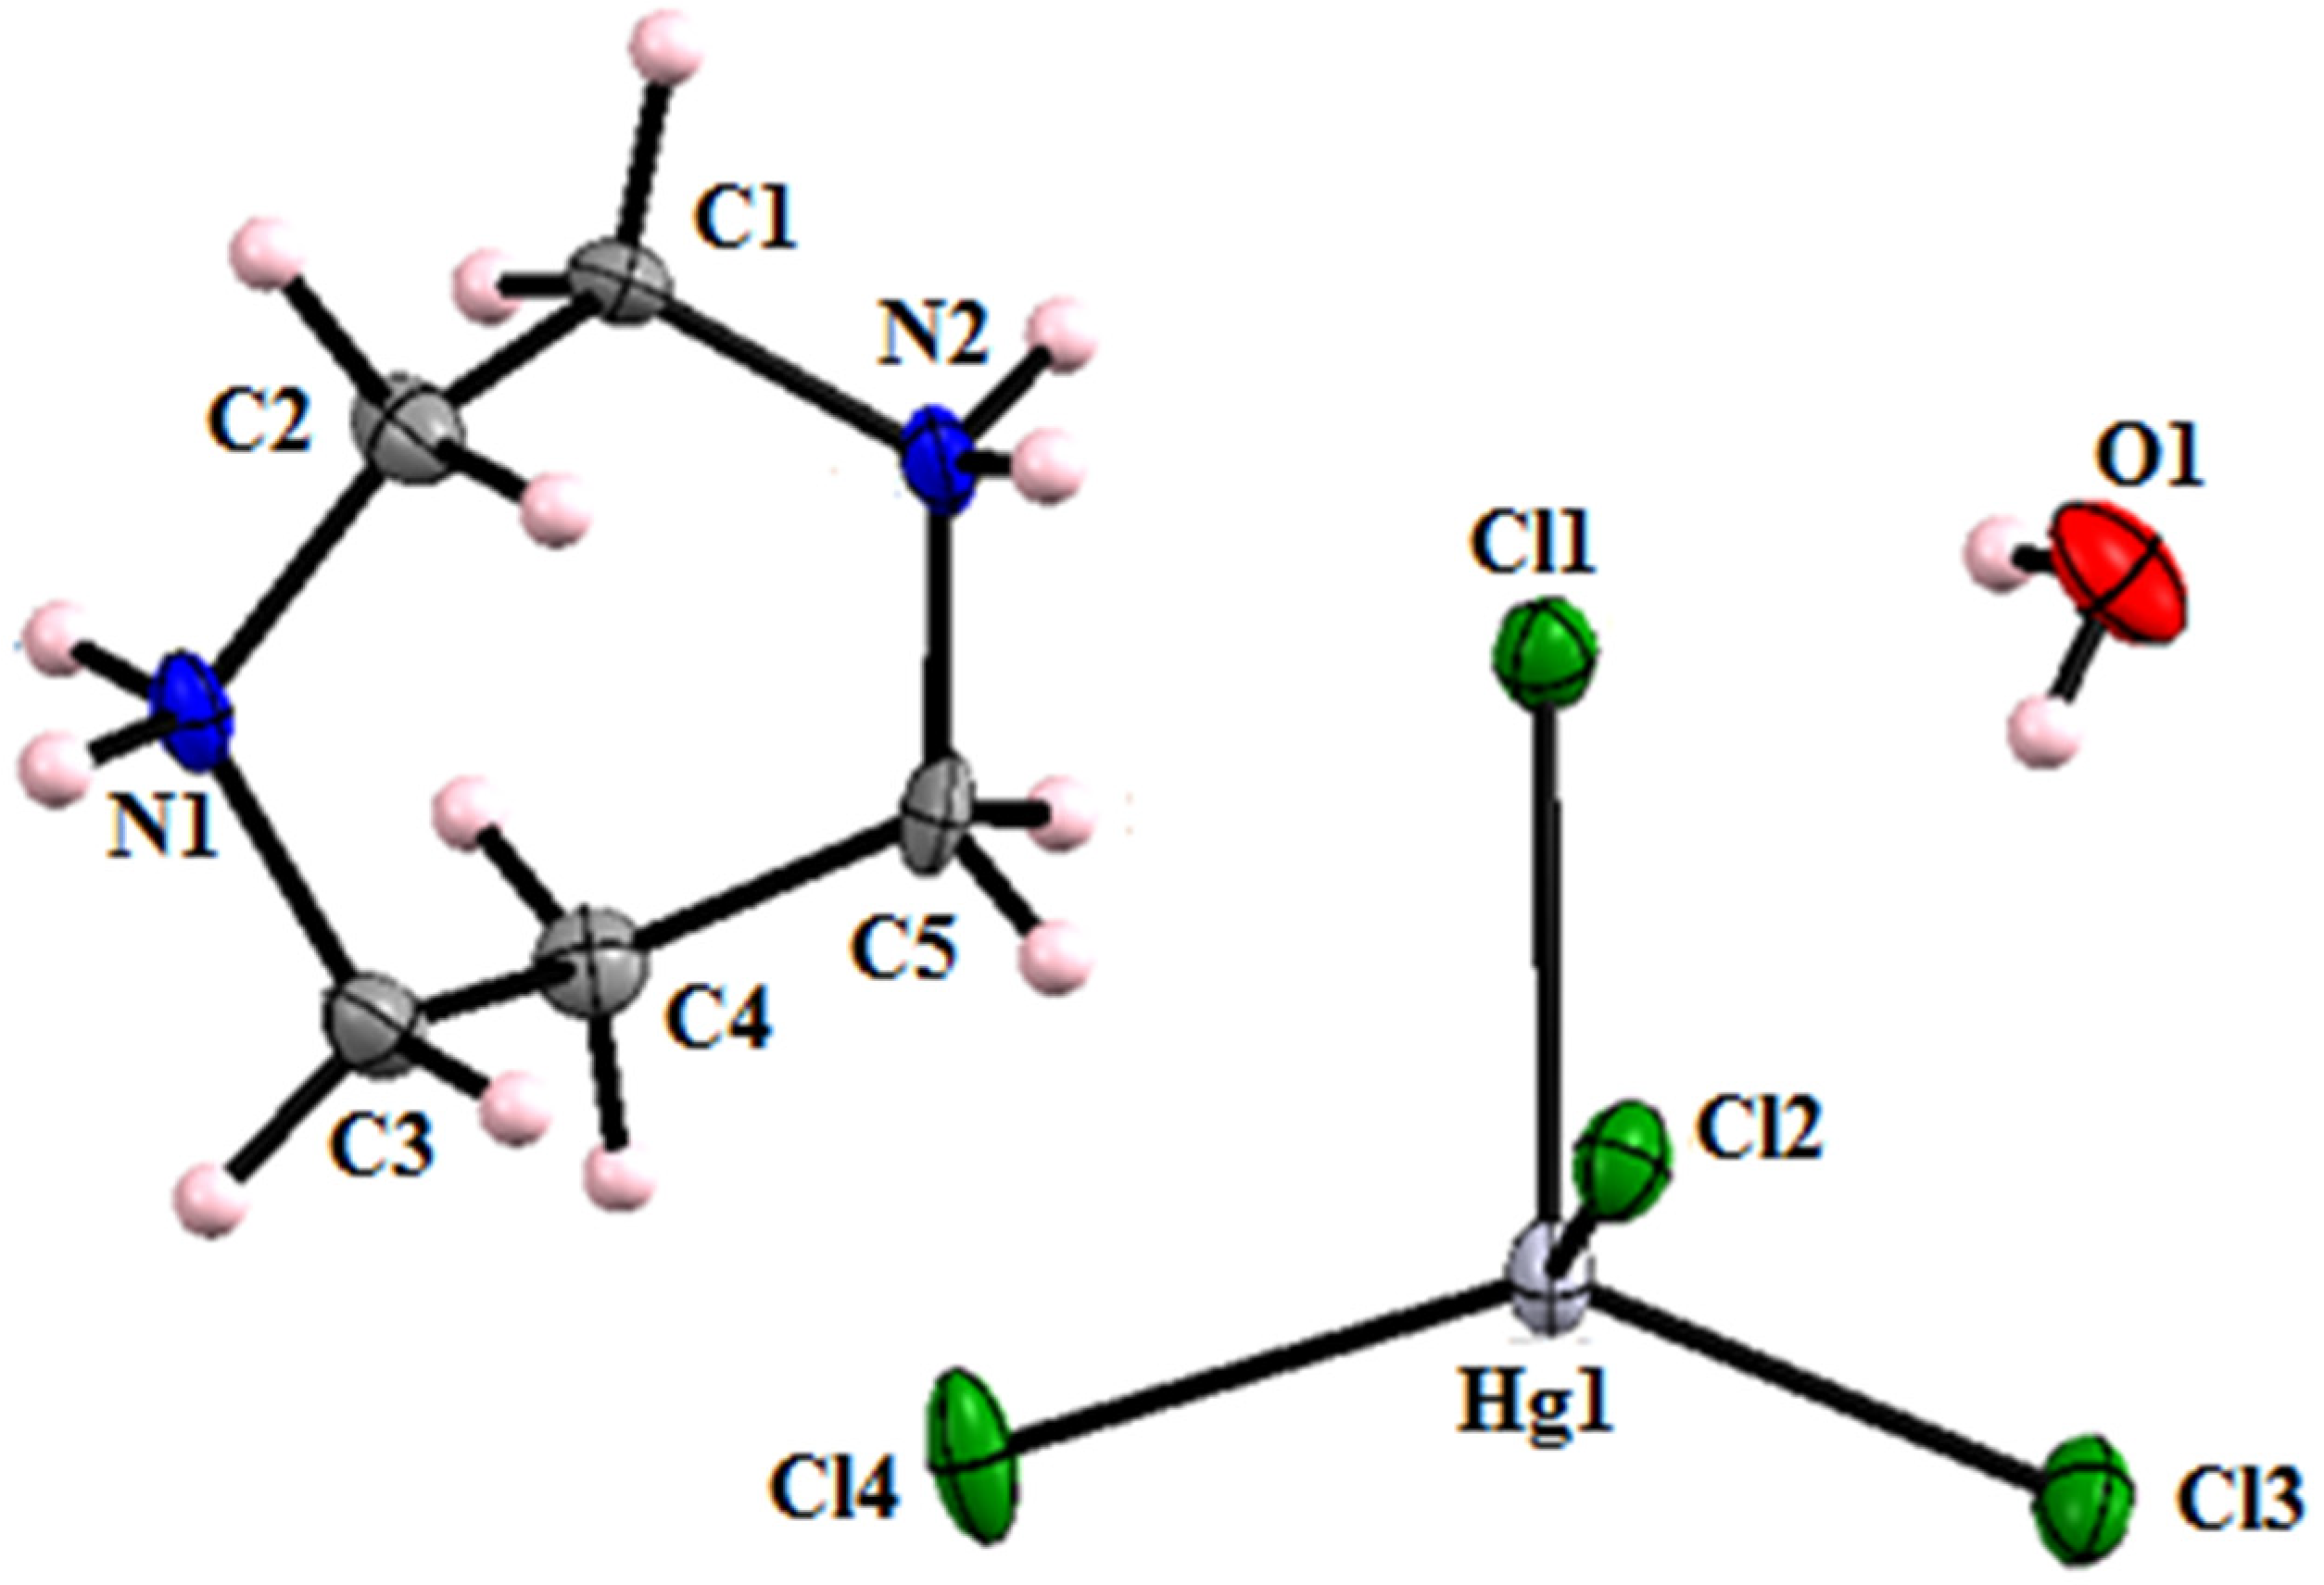
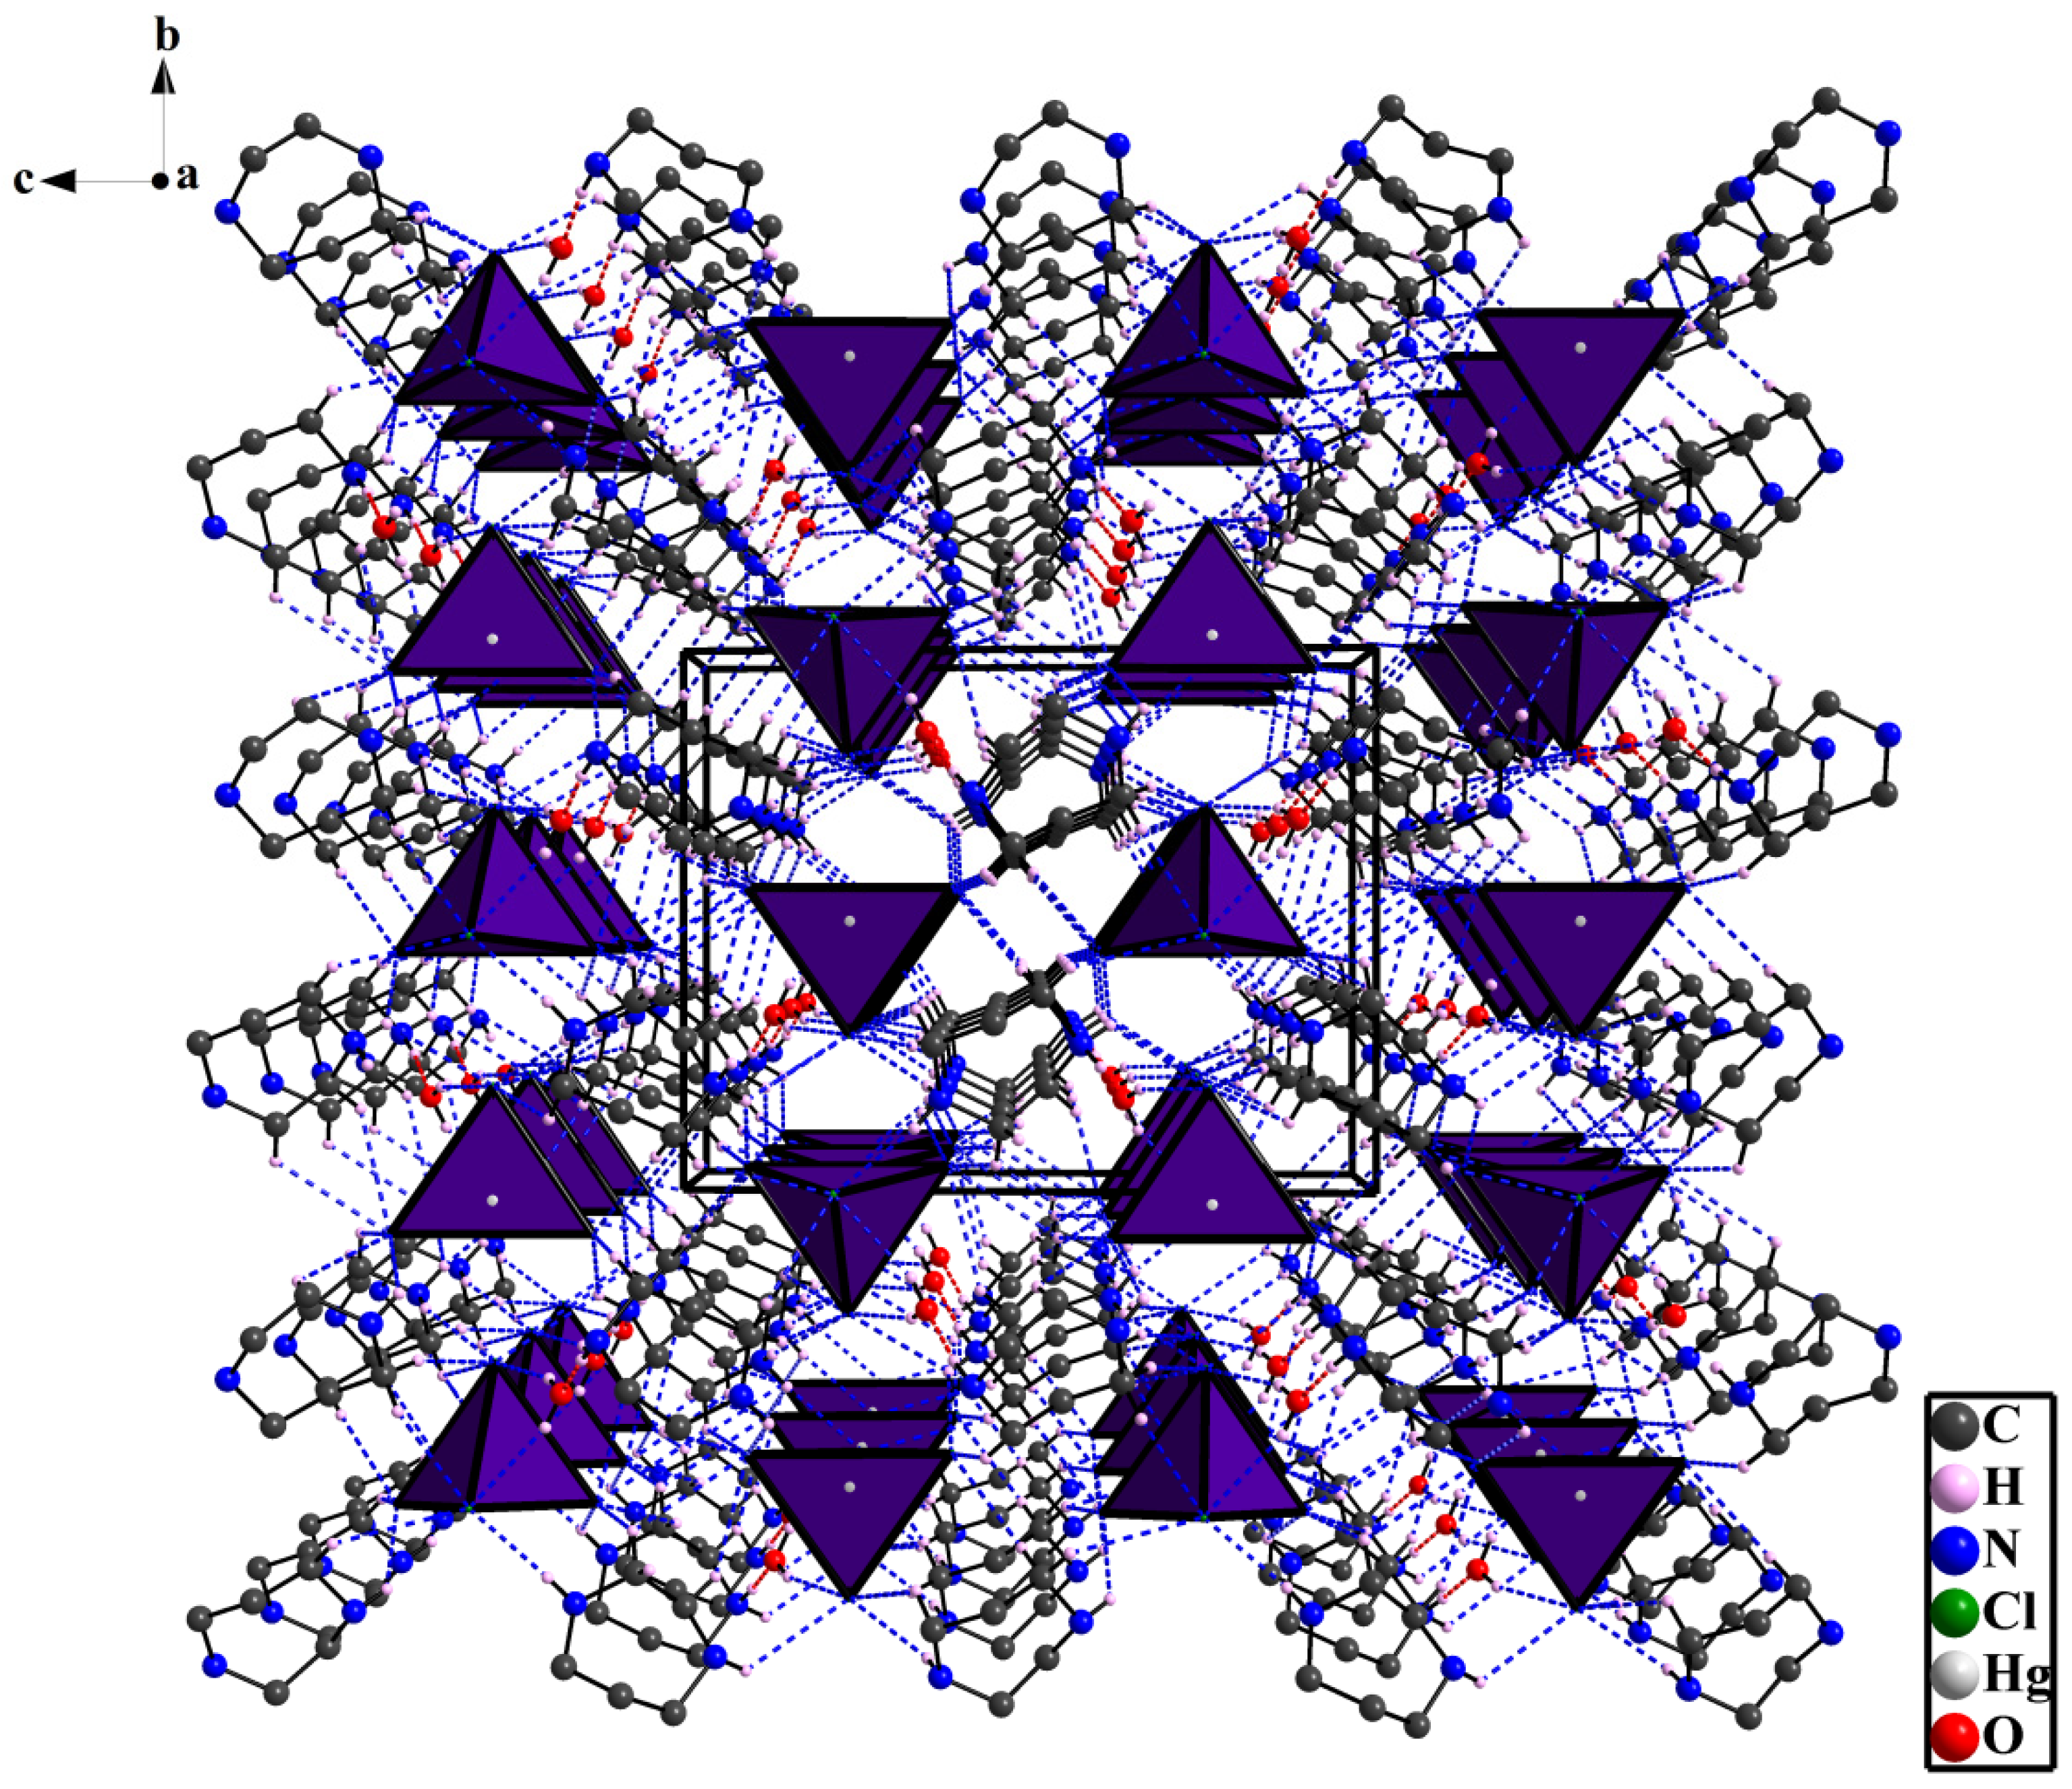
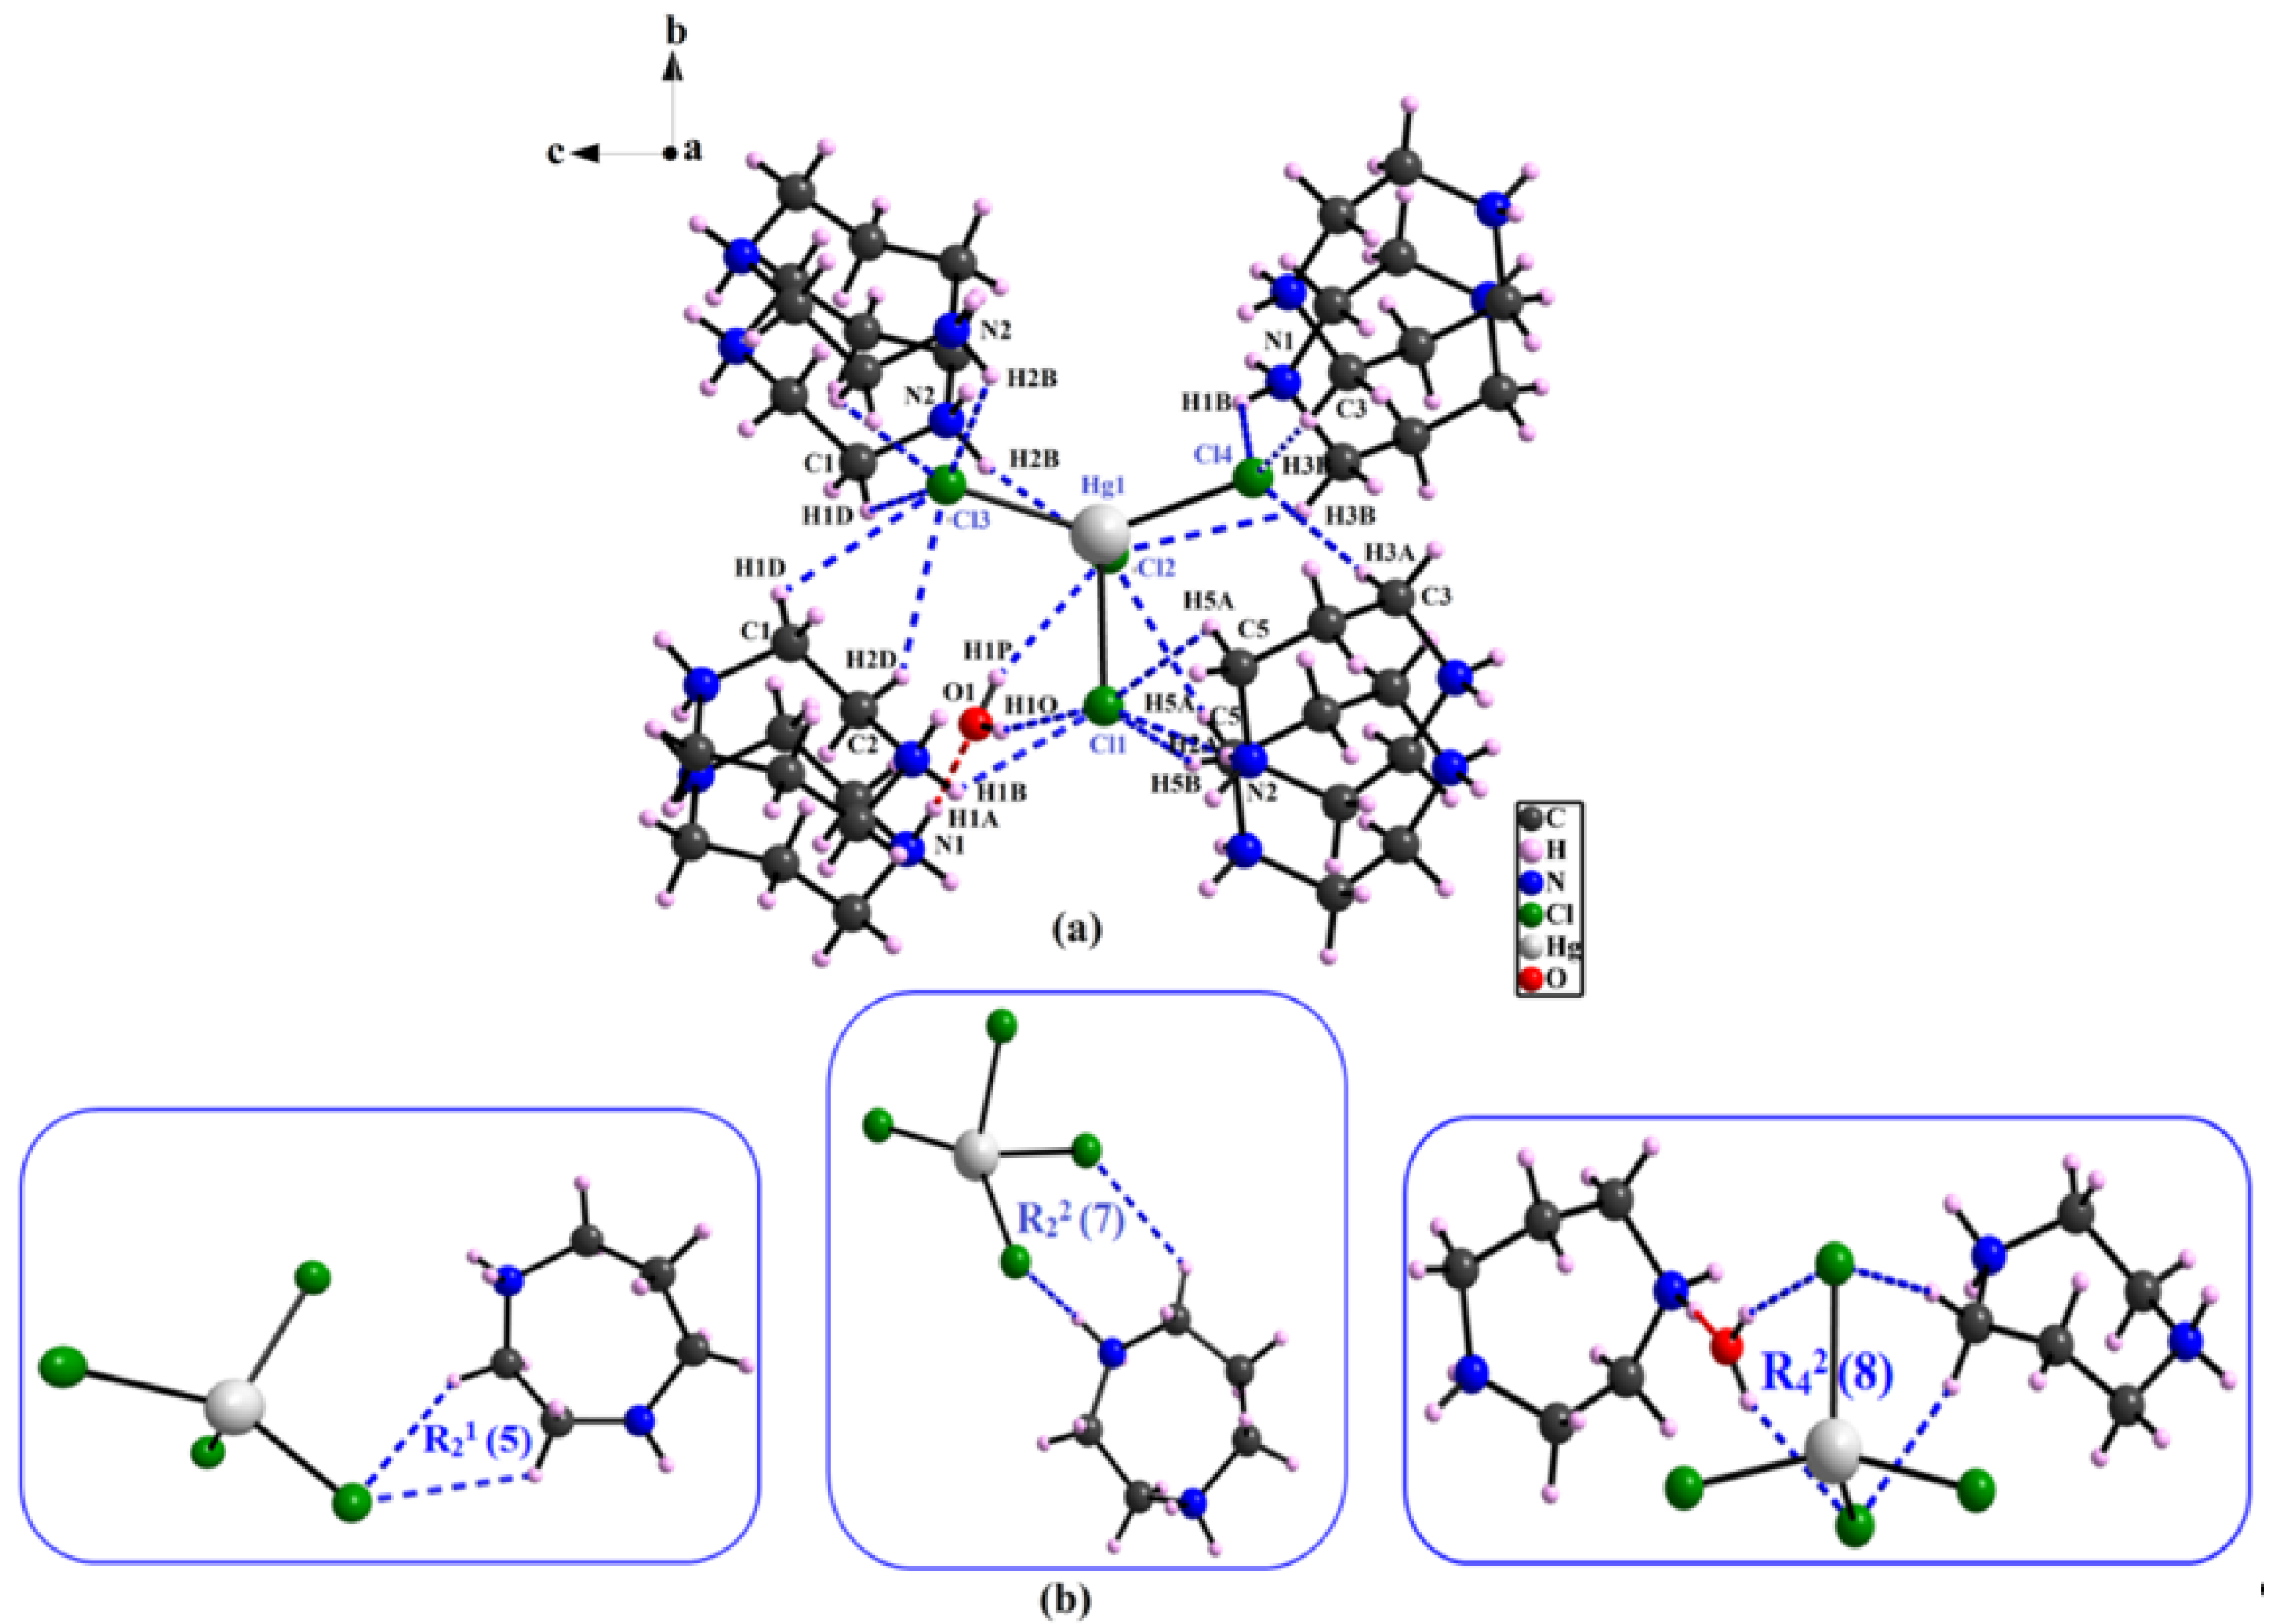
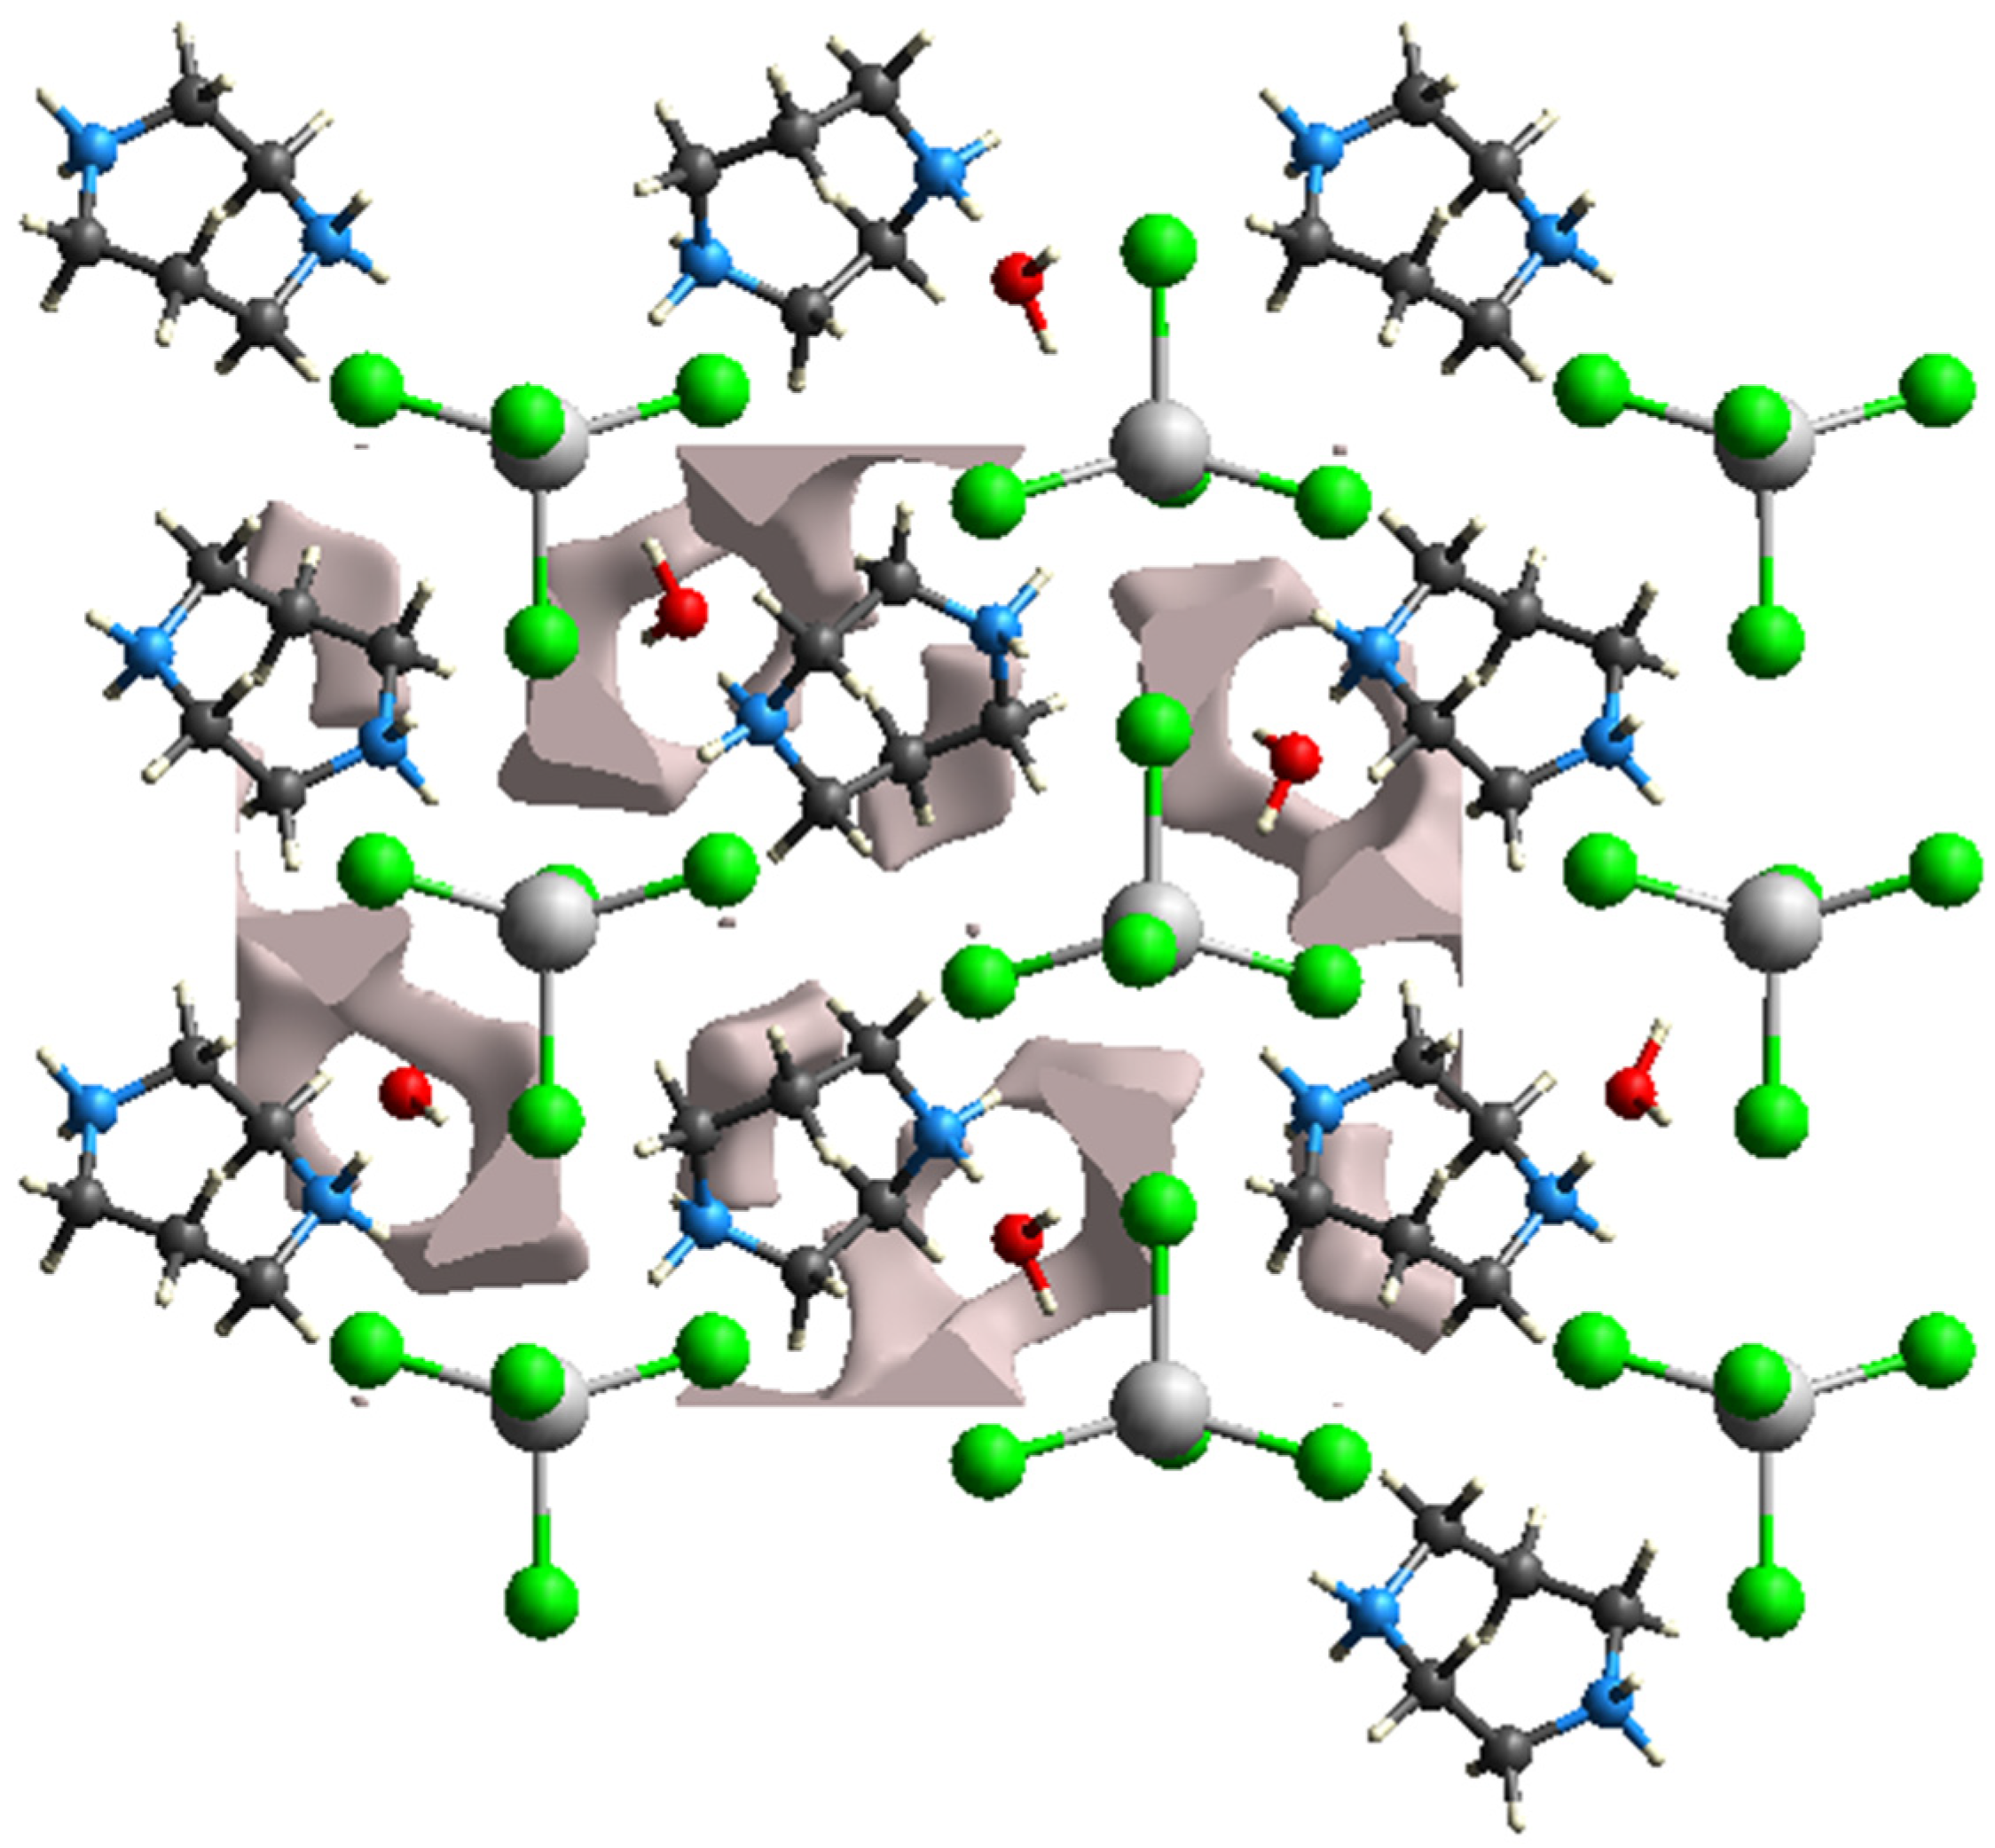
3.2. Structure Description of (C5H14N2)[HgCl4]·H2O

The asymmetric unit of the title compound consists of one homopiperzine-1.4-diium, one tetrachloridomercurate [HgCl4]2−, and one water molecule (Figure 2). Table 1 shows the experimental details of the novel compound. As can be seen in Figure 3, this compound’s atomic structure may be defined by the alternation of three entities: organic cations (C5H14N2)2+, inorganic anions [HgCl4]2−, and water molecules. The various components of (C5H14N2)[HgCl4]·H2O are held by a variety of H-bonds and by electrostatic interactions (Table S1). The hydrogen bonds lead to a wide variety of ring motifs R21(5), R22(5), and R42 (8) (Figure 4).
In the [HgCl4]2− anion, the Hg2+ is surrounded by four chloride atoms (Cl1, Cl2, Cl3, and Cl4). To distinguish between tetrahedral geometry, square plane geometry, and trigonal pyramid geometry, Yang et al. have proposed the parameter “τ4”, employing the following relation [38]:
τ 4 = 360 ( α + β ) 141
where α and β are the two highest angles (α = 137.77 (7)° and β = 106.74 (6)°).If τ4 tends to 0, the geometry is homologous to the geometry of the square plane; if τ4tends to 1, the geometry is assimilated to tetrahedral geometry; and if τ4is close to 0.85, the geometry is assimilated to trigonal pyramid geometry. In this case, τ4 is equal to 0.819 (close to 0.85). Therefore, this value shows the trigonal pyramid geometry of [HgCl4]2− anions. Indeed, these results correspond to those observed in comparable compounds [39,40,41,42,43,44].
The organic cations [C5H14N2]2+ are intercalated between the inorganic entities to ensure the balance charge of (C5H14N2)[HgCl4]·H2O. The geometrical properties of the organic cations [C5H14N2]2+, summarized in Table S2, are consistent with those reported in the literature [45]. Each cation establishes thirteen hydrogen bonds among them. Two are bifurcated: N1–H1B… (Cl1iii, Cl4vi) and N2–H2B… (Cl2ii, Cl3i) (For symmetry codes, see Table S1). The conformation of the [C5H14N2]2+ring may be defined in terms of Cremer and Pople puckering coordinates [46], and it was shown that Q = 0.7906 Å, q2 = 0.4355 Å, q3= −0.6599, θ = 33.43°, and φ = 50.93°, identical to the most stable chair conformation. This result can be confirmed by the asymmetrical parameters.
Table S2 gathers the values of the distances and angles of the different entities constituting the structure of the title compound.

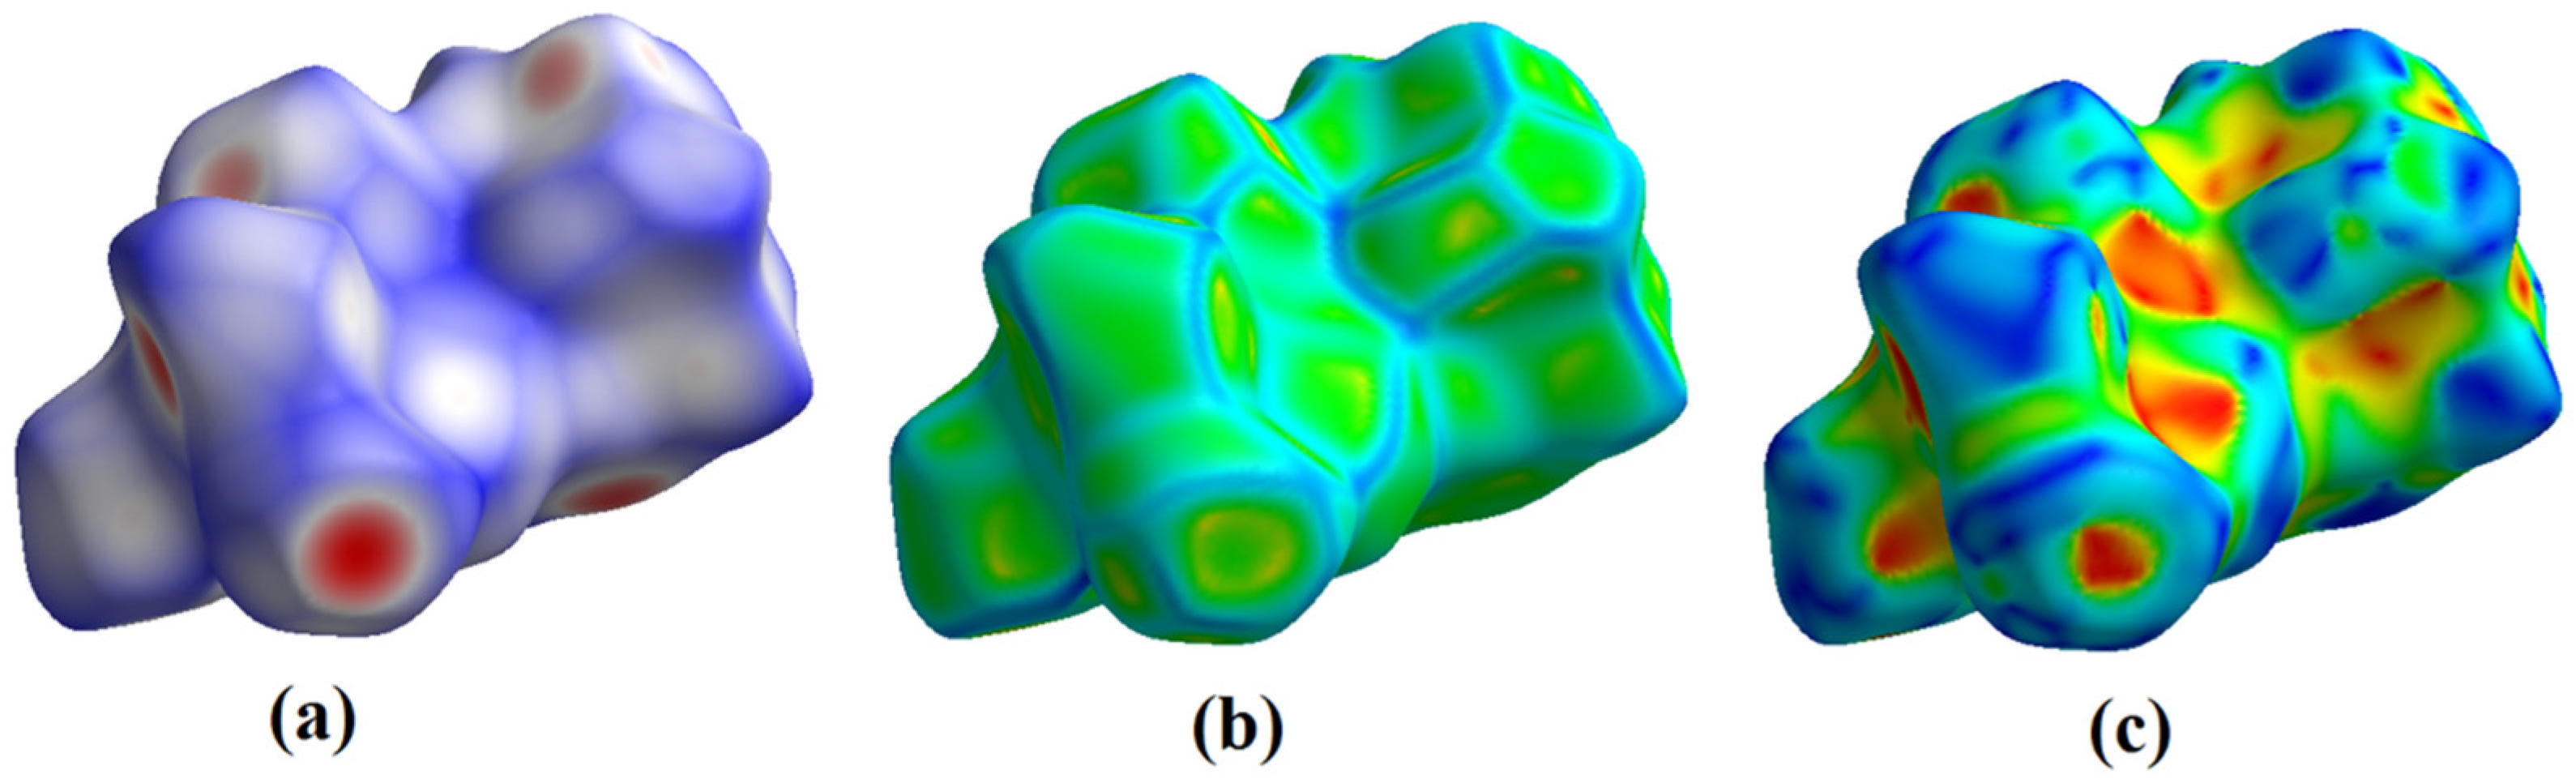
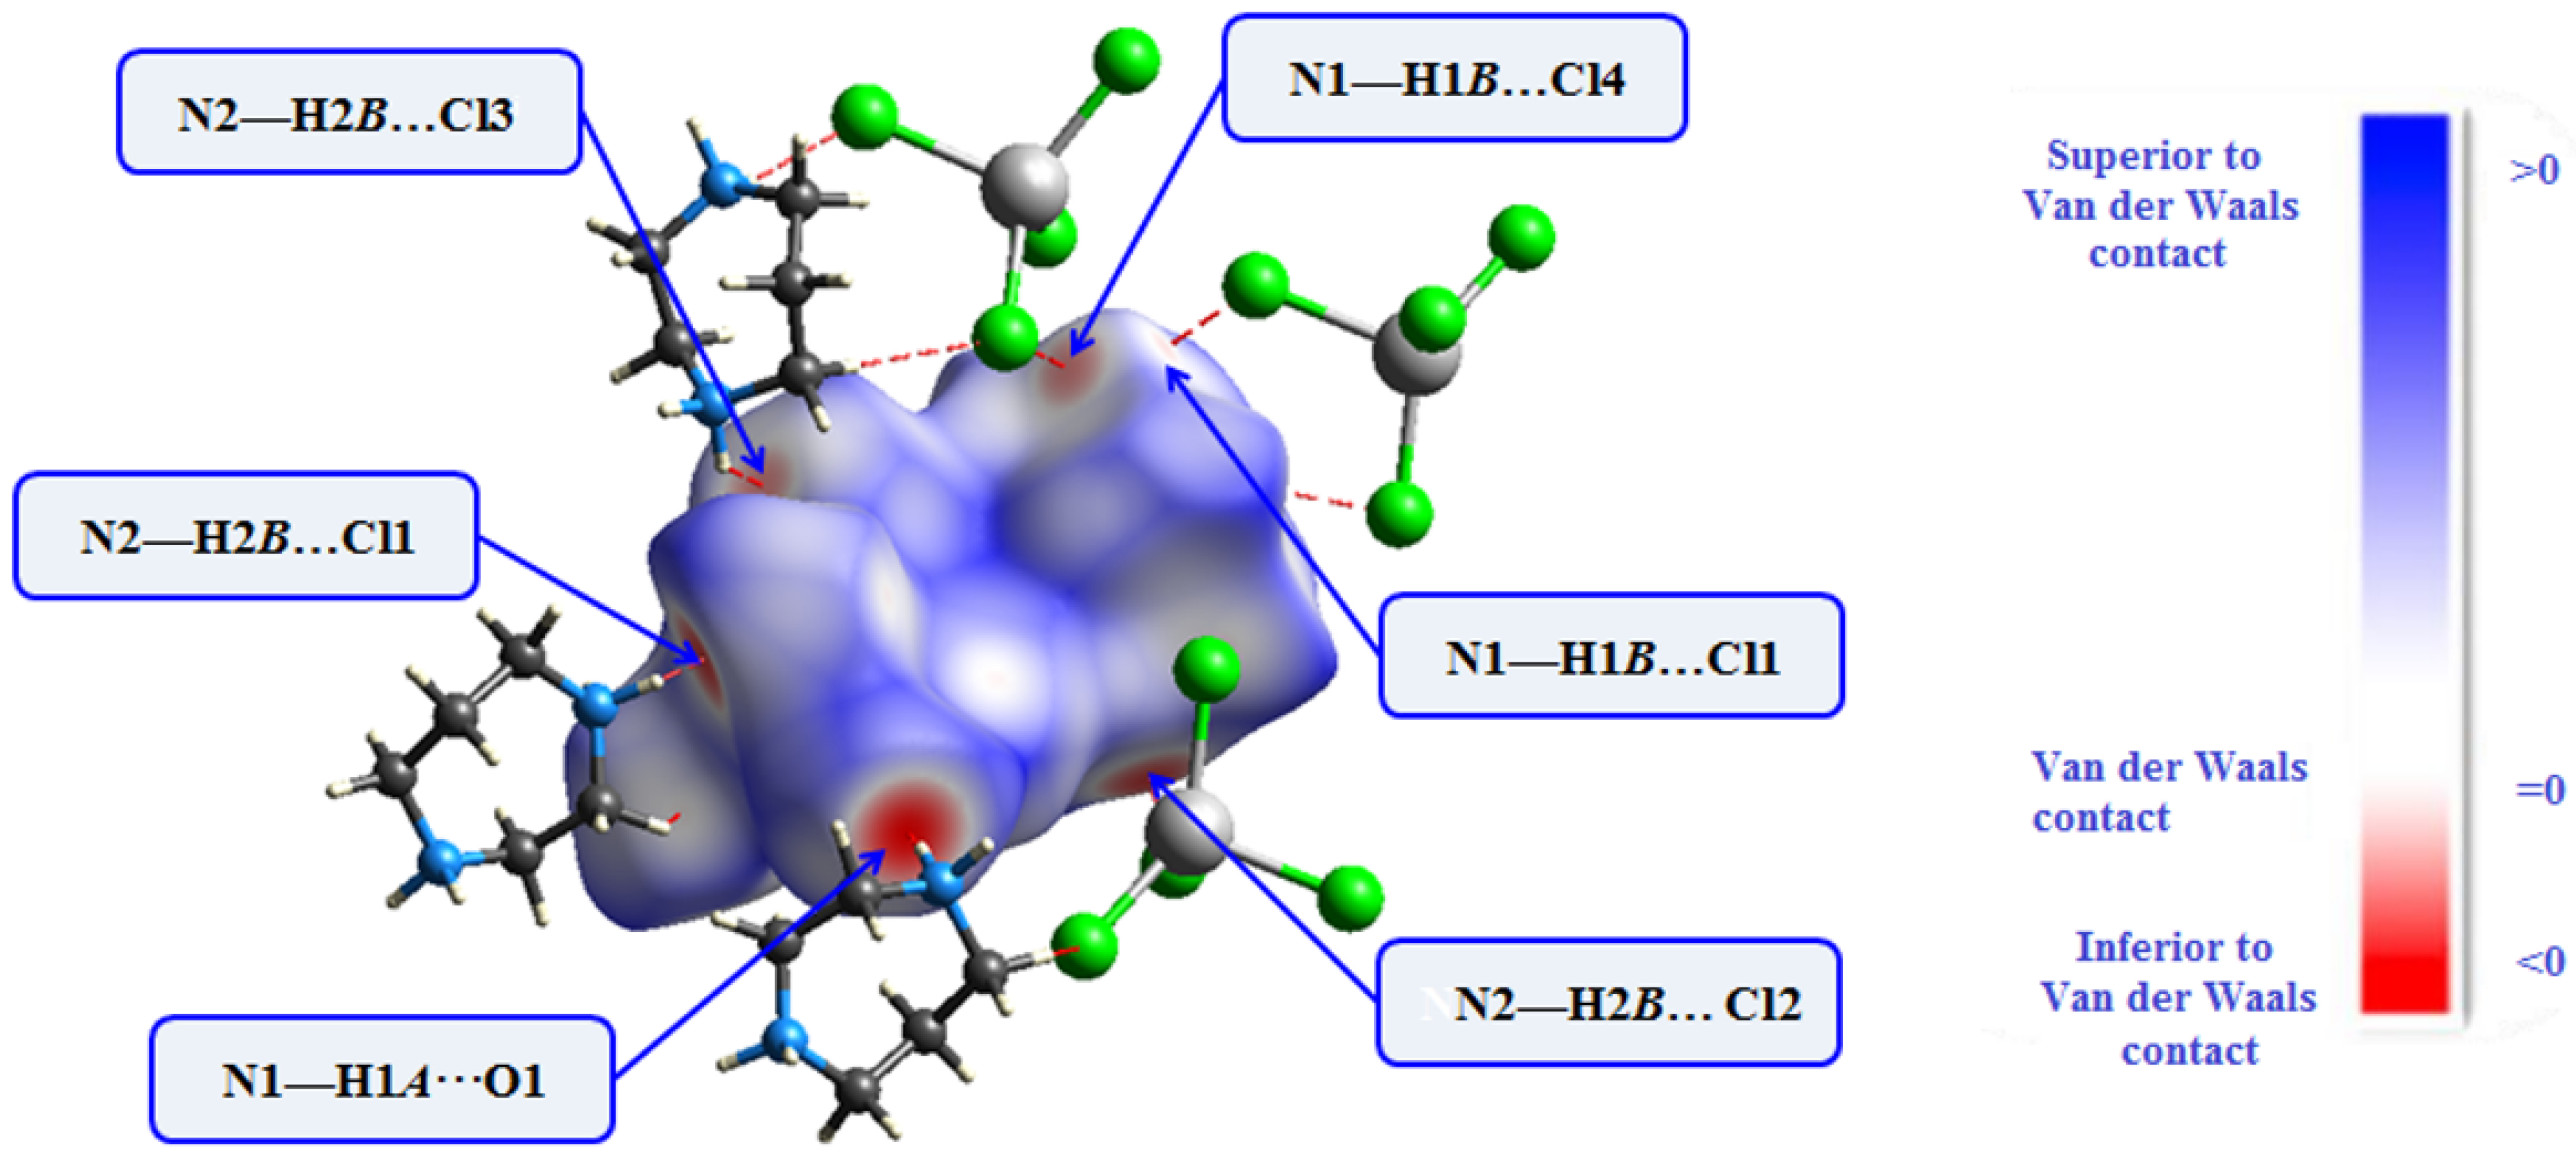
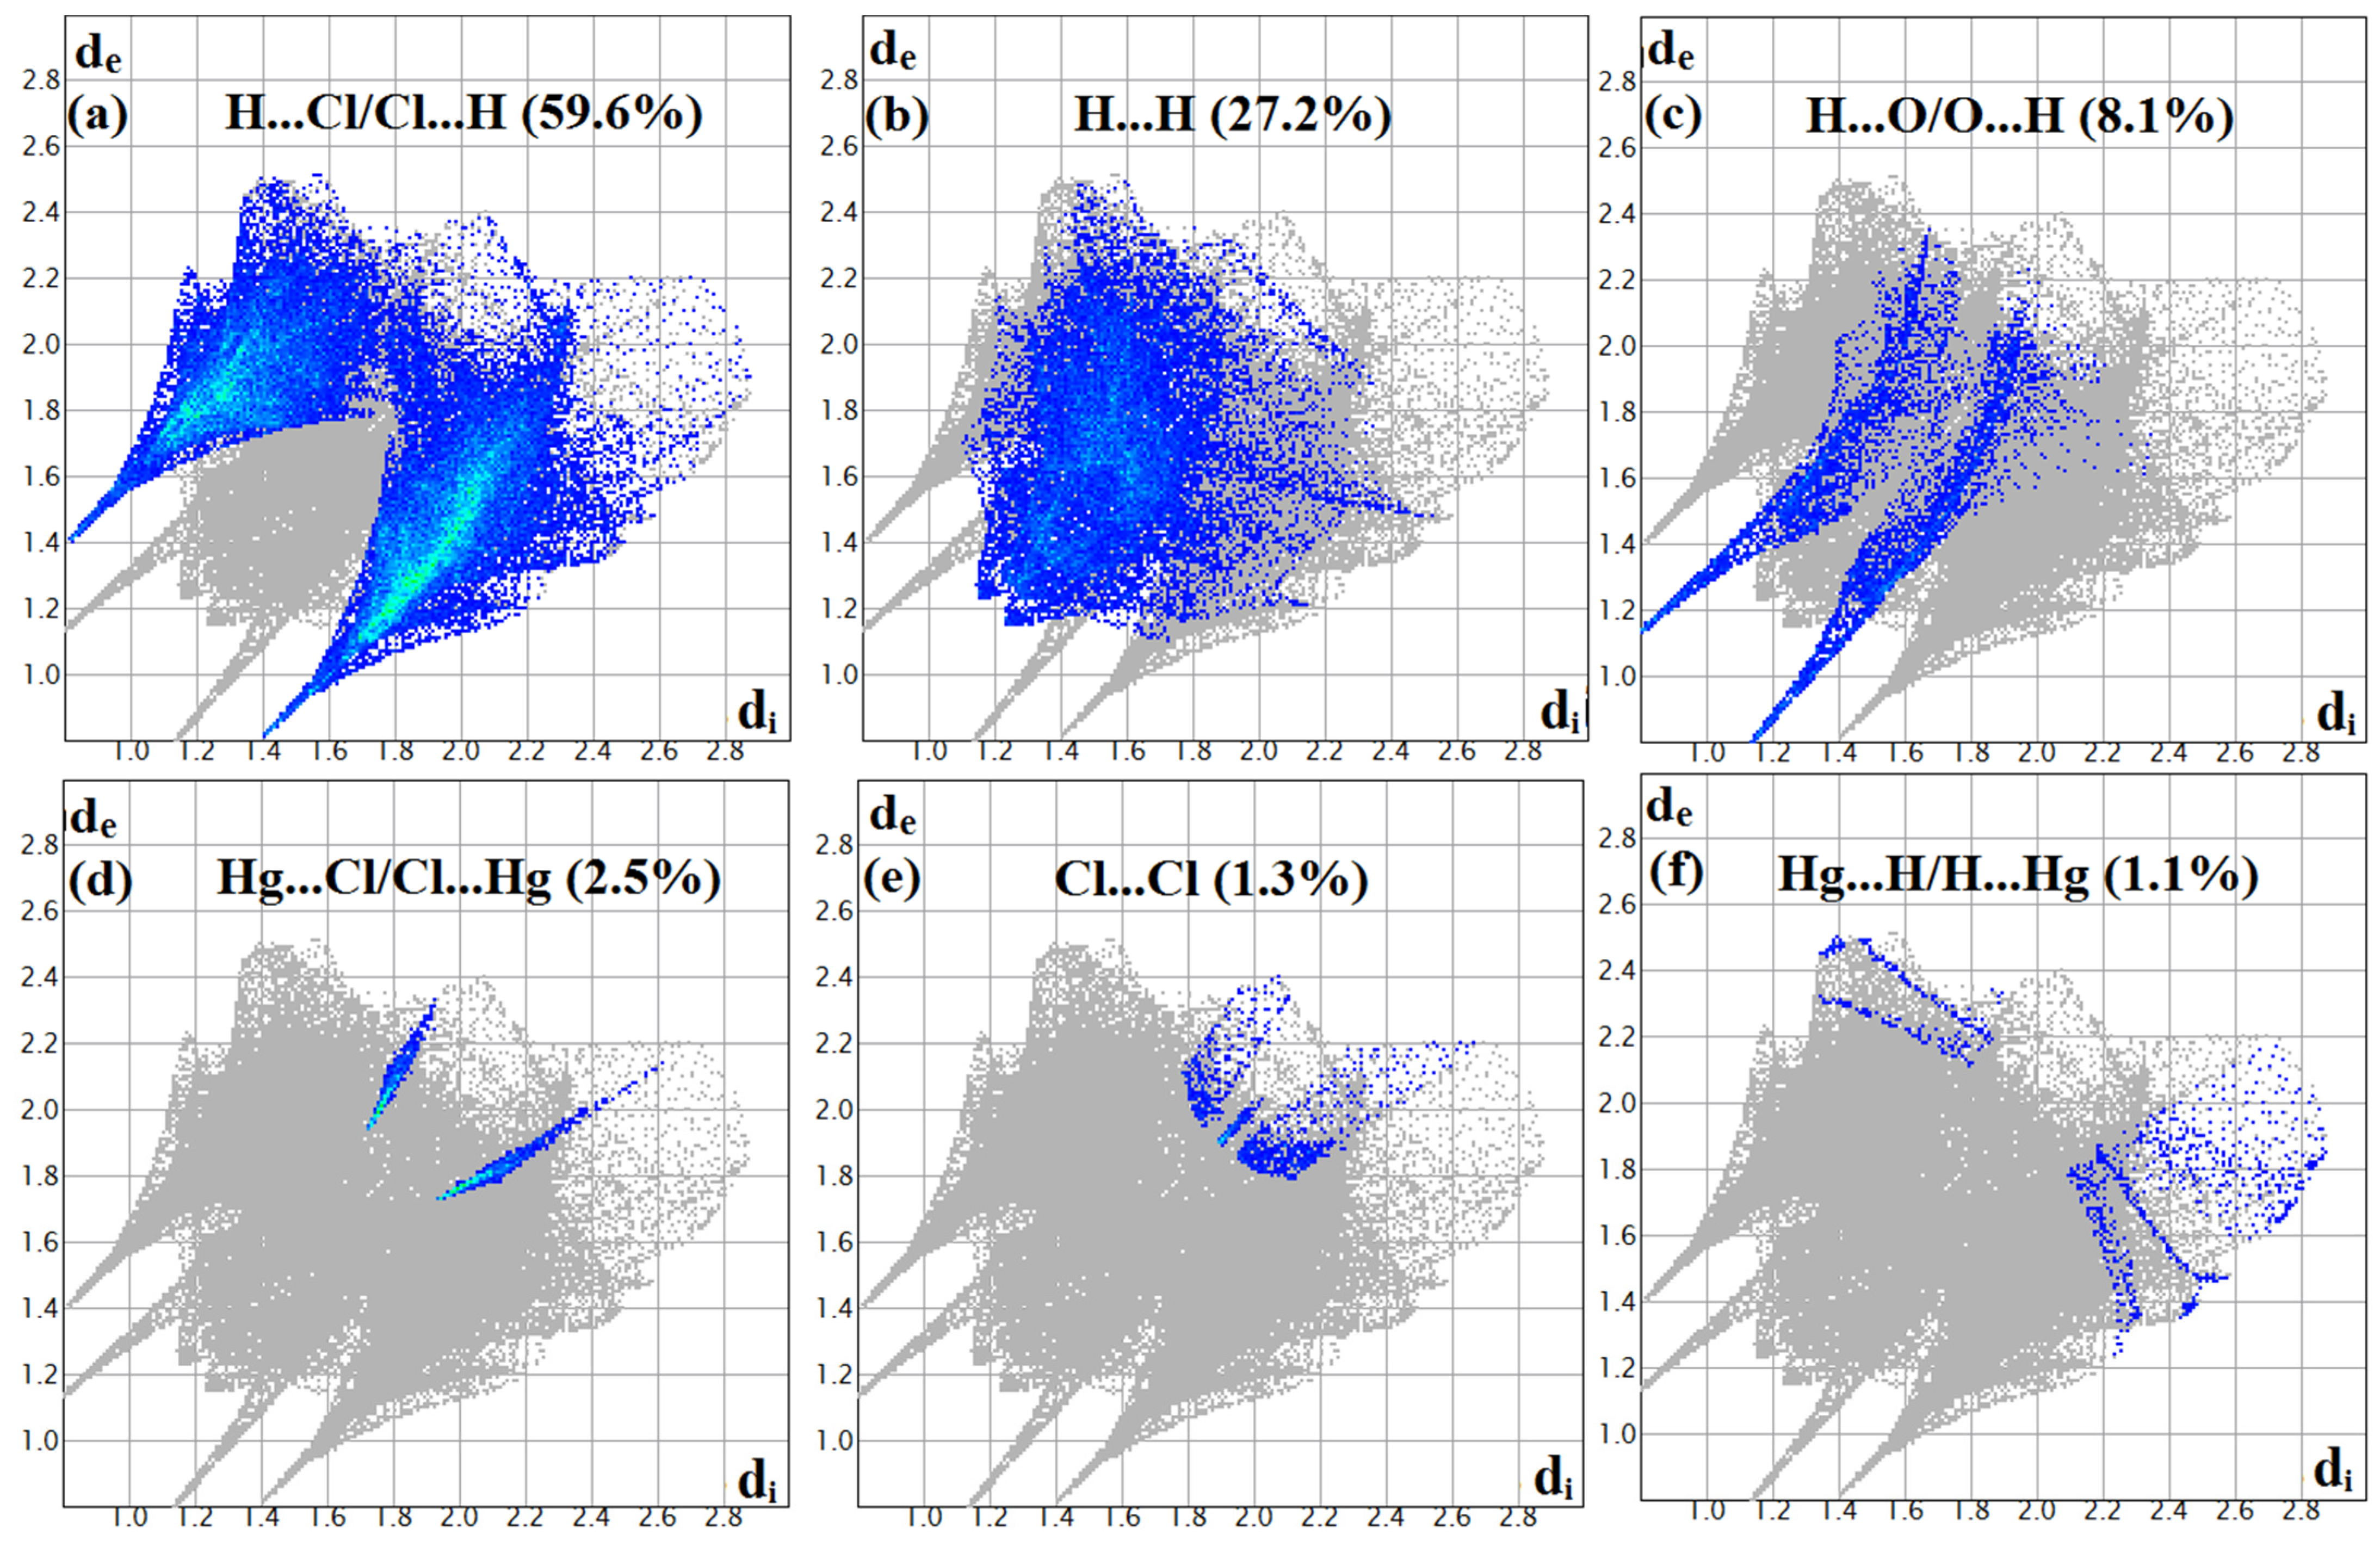
3.3. Hirshfeld Surface Analysis

Using CrystalExplorer software [47], we can determine the nature of the intermolecular interactions present in (C5H14N2)[HgCl4]·H2O using 3D Hirshfeld surface analysis (HS), while the 2D fingerprint traces quantitatively reveal the contributions of interactions in the crystalline edifice. The Hirshfeld surfaces (HS) around the asymmetric unit are portrayed in Figure 5, presenting the surfaces that were mapped over dnorm(Figure 5a), curvedness (Figure 5b), and shape index (Figure 5c) surfaces. Dark-red dots found in the dnorm view represent the contacts of the H-bonds: H…Cl and H…O (Figure 6).
The value 59.6% is attributed to the dominant contacts, which are H…Cl/Cl…H, corresponding to the interactions C–H…Cl, N–H…Cl, and O–H…Cl (Figure 7a). They are illustrated by a pair of sharp spikes characteristics in the 2D fingerprint plot. Furthermore, because of the abundance of chlorine and hydrogen on the molecular surface, these connections are the most common contacts: in this case, the SCl is 32.35%, and the SH is 61.6%, with an enrichment rate larger than the unity EHCl = 1.495 (Table 2). The H…H contacts occupy 27.2% of the total surface, due to the abundance of hydrogen at the molecular surface with EHH= 0.719. The H…H contacts are illustrated by a large spot located in the middle of the 2D fingerprint (Figure 7b). The percentage 8.1% is reserved for the third interactions in the (C5H14N2)[HgCl4]·H2O, which are H…O/O…H contacts with an enrichment rate greater than the unit EHO= 1.623 (Figure 7c). They refer to N–H…O hydrogen bonds type. Hg…Cl/Cl…Hg contacts contribute 2.5% of the total surface (Figure 7d). The percentages 1.3% and 1.1% are assigned, respectively, to the Cl…Cl contacts and to the Hg…H/H…Hg interactions (Figure 7e,f). Additionally, Figure 8 illustrates the produced crystal’s void region. The voids in the crystalline substance were observed by generating an isosurface of the electron density (0.002 a.u.). The volume of the empty surface per unit cell is about 72.91 Å3, and its surface area is 295.82 Å2. The crystal unit lattice has a void percentage around 5.844%.

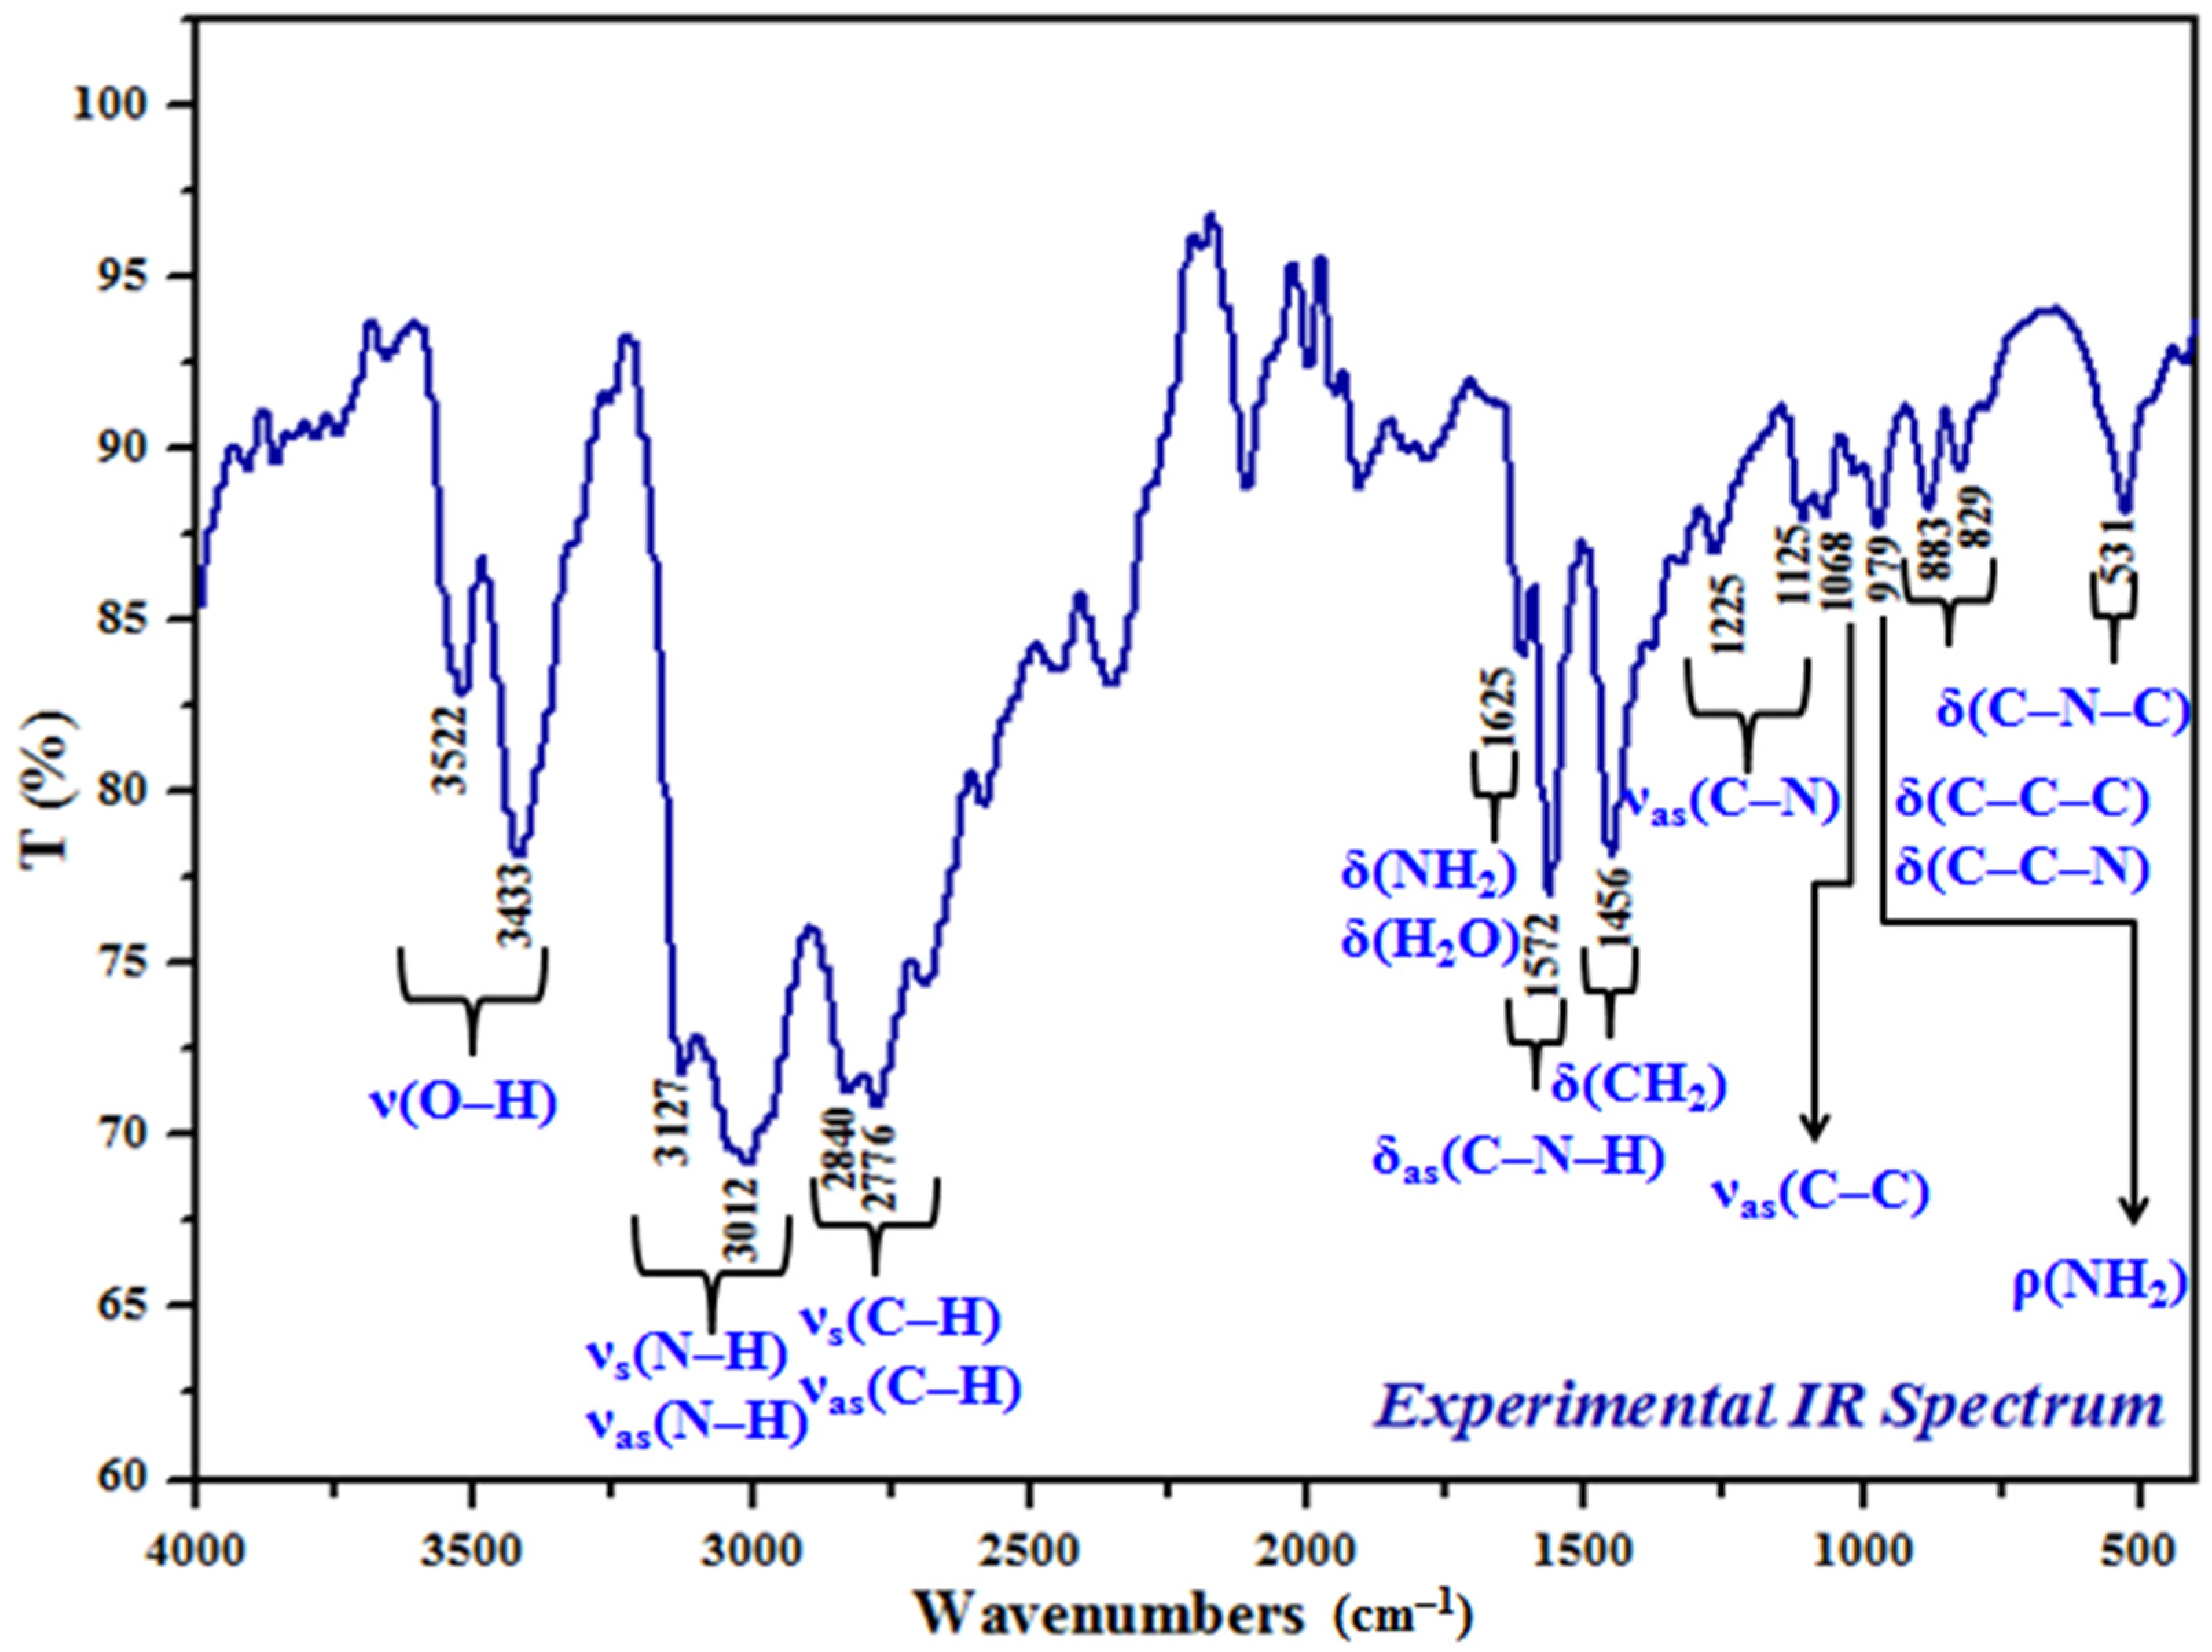
3.4. Vibrational Study

Figure 9 shows the IR spectrum of the crystal (C5H14N2)[HgCl4]·H2O. We will determine the different functional groups using published research of similar materials possessing the same organic cation [48,49,50,51,52]. In Table S3, we propose an attempt to designate this compound’s most representative vibrational modes.
The bands located at 3522 and 3433 cm−1 correspond to the valence vibrations of the water molecule. In the region of wavenumbers between 3200 and 2700 cm−1, there are four broad bands. The first two bands detected at 3127 and 3012 cm−1 are assigned to the asymmetric and symmetric N–H bond stretching, respectively. The remaining two bands observed at 2840 and 2776 cm−1 are attributed to the asymmetric and symmetric C–H stretching, respectively. The thin band at 1625 cm−1 corresponds to NH2 in-plane deformation vibration. On the other hand, the intense band appearingat 1572 cm−1 corresponds to the δ(C–N–H) asymmetric bending. The band located at 1456 cm−1 is attributed to δ(CH2). The two low-intensity bands at 1225 and1125 cm−1 correspond to the C–N stretching. The band at 1068 cm−1is assigned to C–C stretching. The rocking vibration band, ρ(NH2), is located at 979 cm−1. The two bands at 883 and at 829 cm−1correspond to δ(C–C–C) ring bending vibrations, while the band seen at 531 cm−1is attributed to the deformation vibrations δ(C–N–C) and to the deformation vibrations δ(C–C–N).

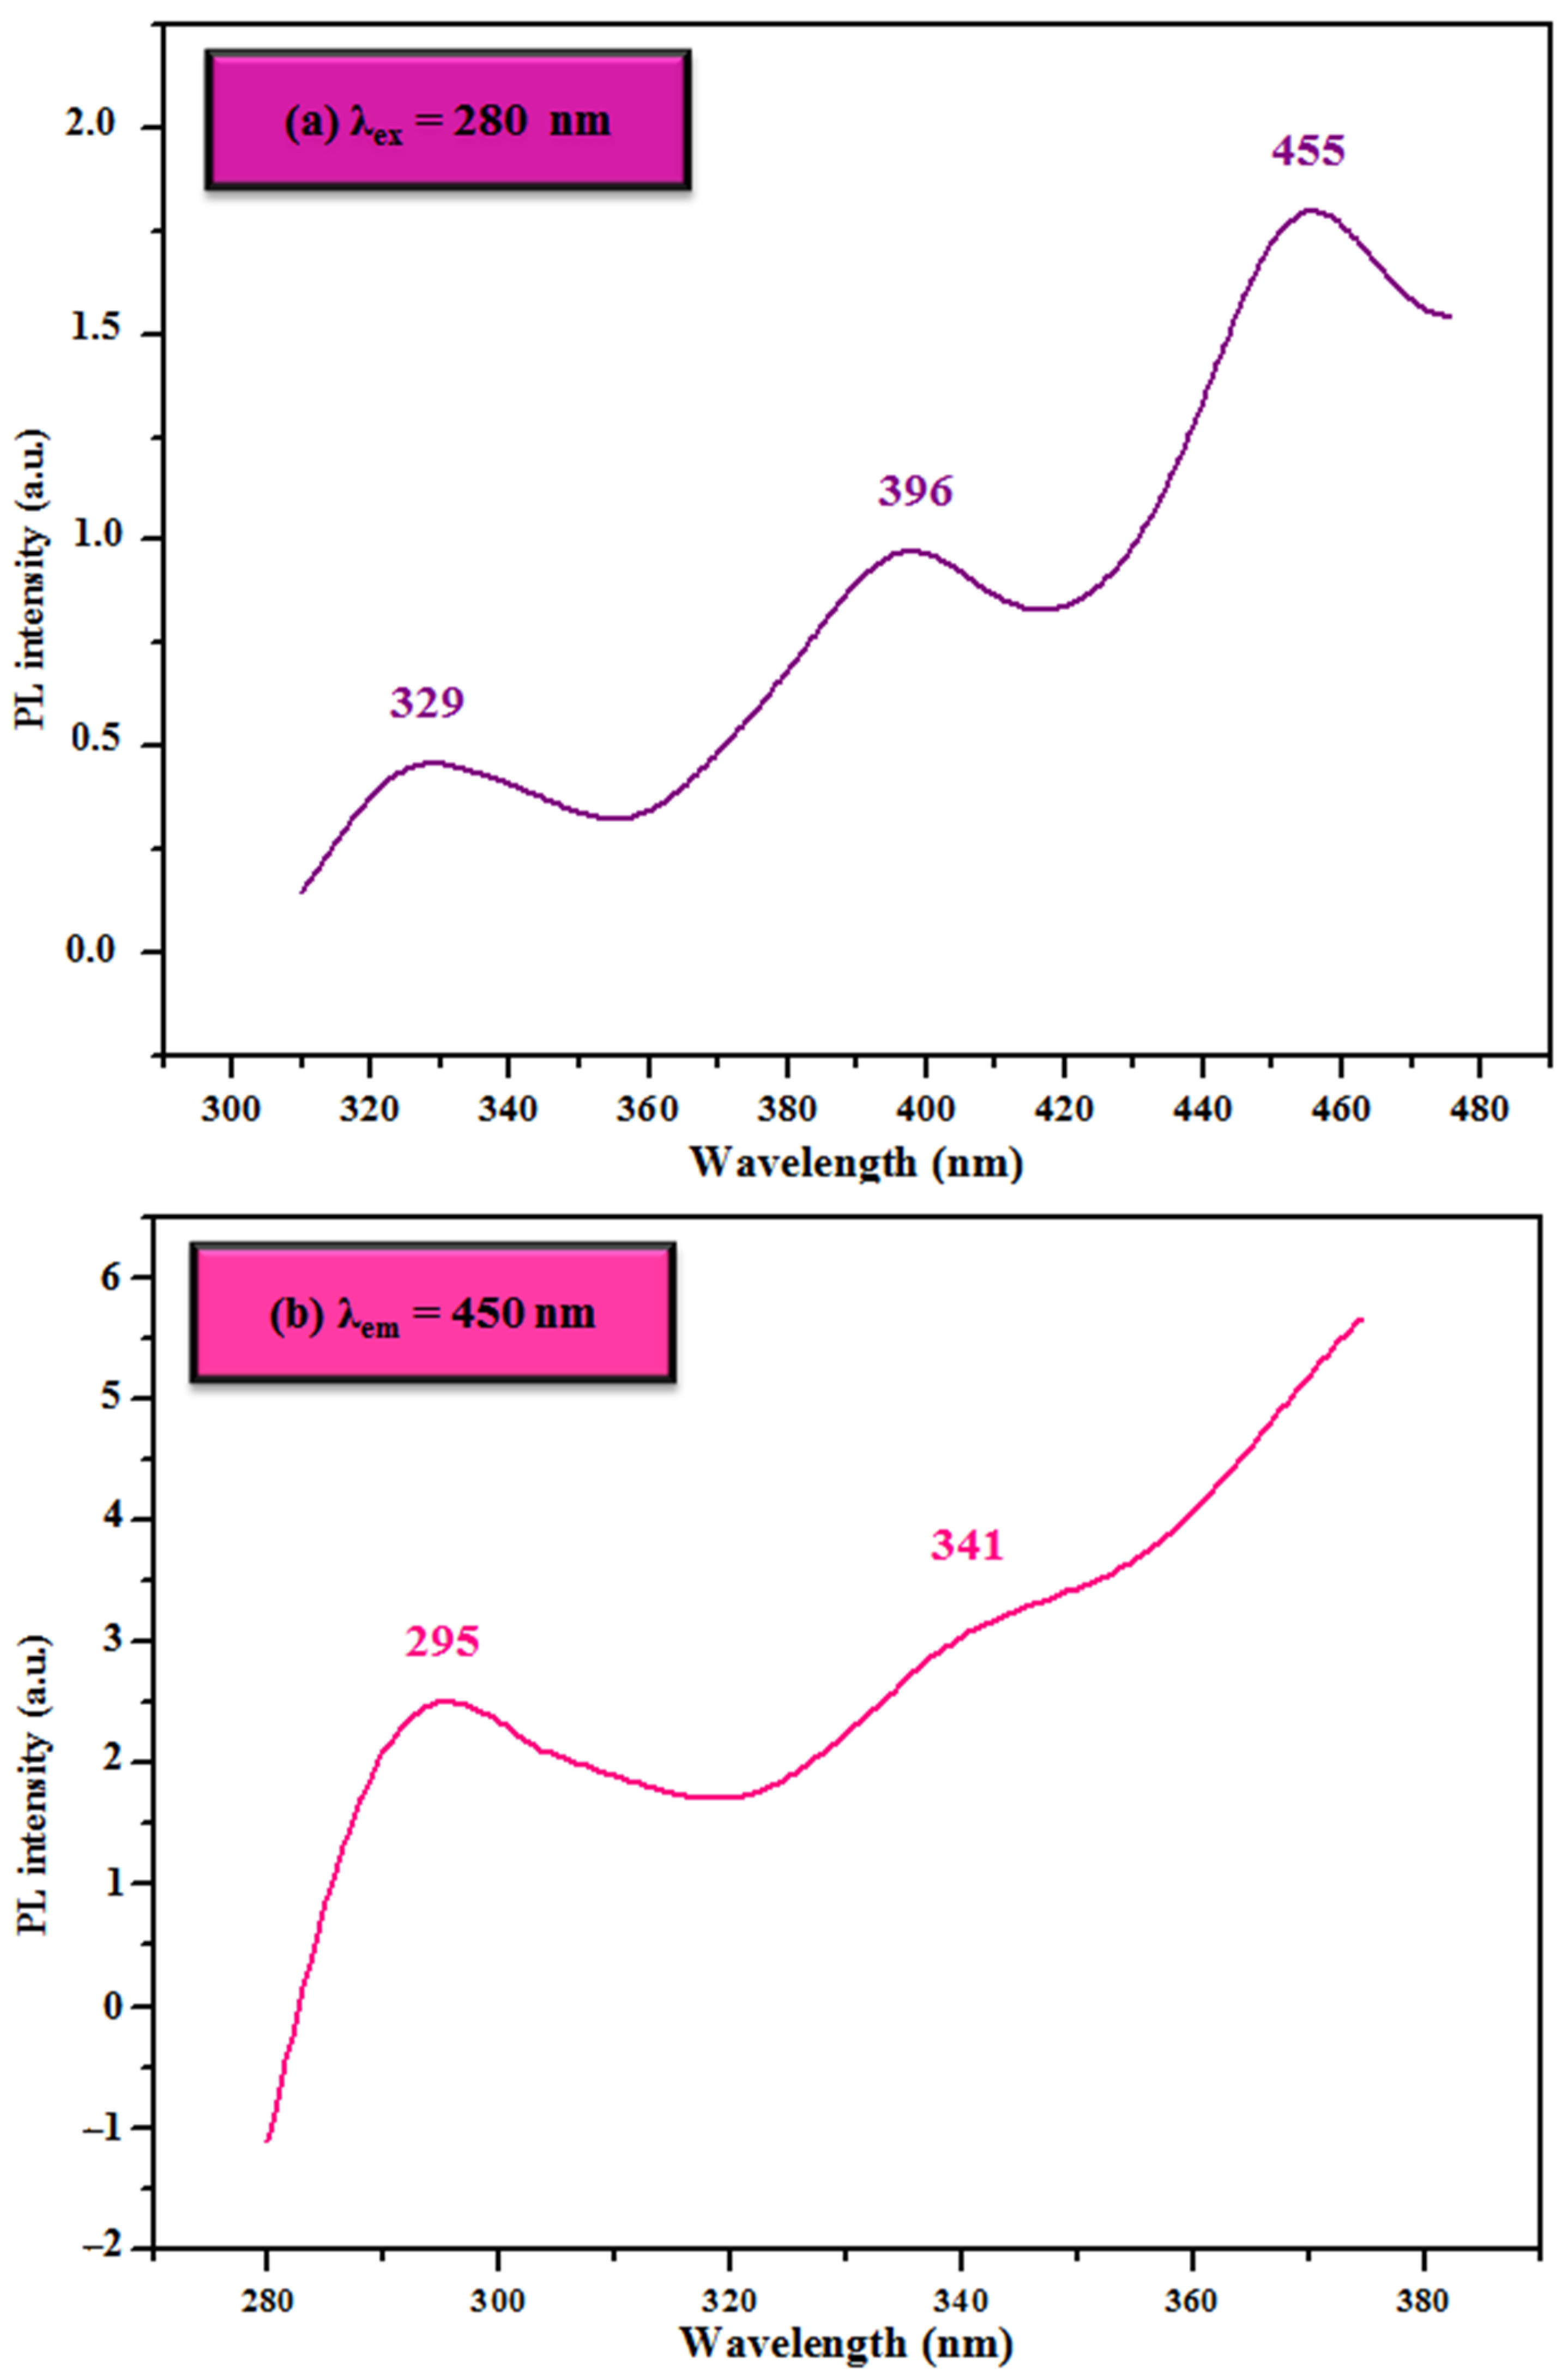
3.5. Fluorescence Properties

We performed photoluminescence (PL) measurements to determine the transmission mode of the light radiation emitted by the compound following excitation. This method is used to examine the optical emission properties of materials.
The excitation and emission spectra of (C5H14N2)[HgCl4]·H2O are shown in Figure 10 at ambient temperature and in the solid state. The excitation spectrum is recorded for a wavelength of the order of 280 nm, and three bands are observed, of which the most intense is detected around 455 nm. The emission spectrum is constituted by two bands; the first band is observed at 295 nm, and the second band is detected at 341 nm (the most intense). These two bands may mainly arise from ligand-metal charge transfer (LMCT) [53,54].

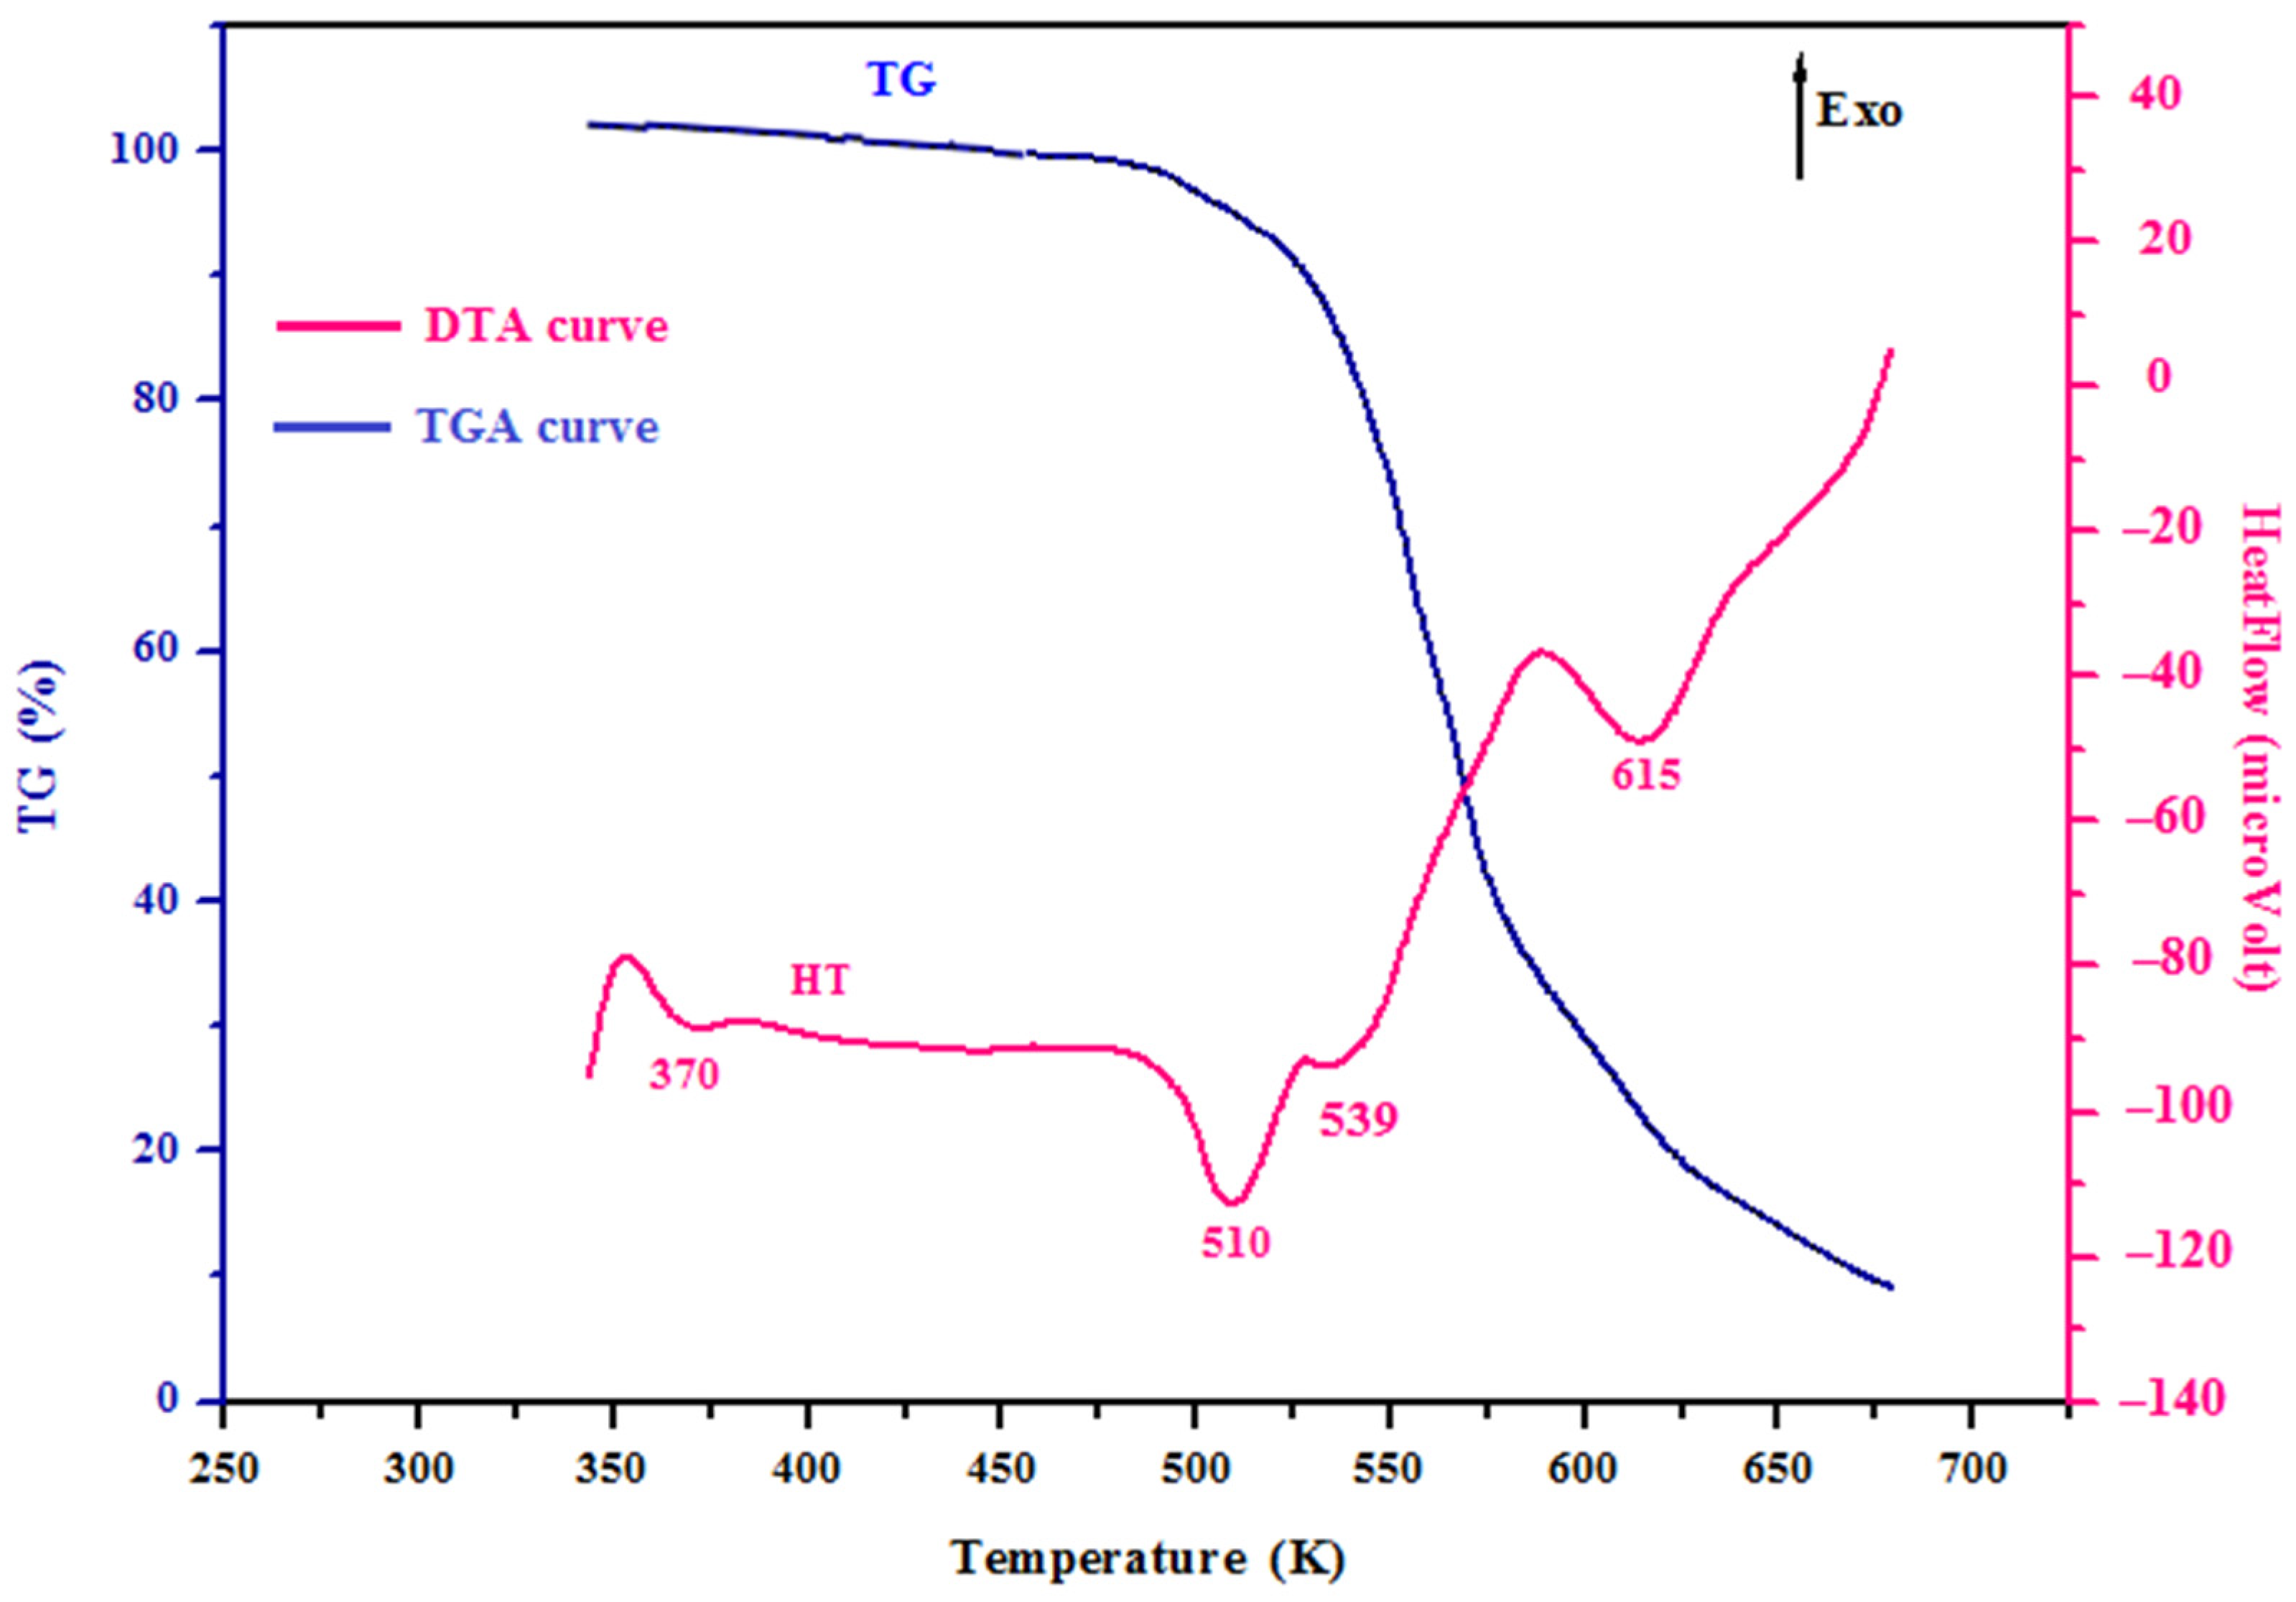
3.6. Thermal Behavior

Figure 11 highlights the results obtained by the thermal analysis of the compound (C5H14N2)[HgCl4]·H2O. According to the TGA-DTA curve, four peaks were detected in the DTA curve, and three mass losses in the TGA curve. The first peak at 370 K corresponds to the elimination of the water molecule, with a loss of mass of 3.605% (experimentally) vs. 3.8% (theoretically). The second and the third peaks are observed at 510 (ΔH= 415.279 J·g−1) and at 539 K, and they correspond to the departure of the organic part (C5H14N2)2+and four chlorine atoms, with a mass loss theoretically equal to 52.739% and experimentally to 53%. The fourth peak, located at 615 K (ΔH = 495.741 J·g−1), corresponds to the Hg atom’s escape, with a mass loss of 43% (experimentally)/43.3% (theoretically). The black residue (10%) obtained at the end of the analysis is formed by a mixture of mercury oxide and carbon.

3.7. Dielectric Constant Investigation

We suggest investigating the electric transport capabilities of the compounds created in order to explore probable ionic conduction. To investigate the conductivity of the compound, we generated a pellet with geometric factor g = e/s = 0.197 cm−1.
Electrical conductivity measurements provide insight into the behavior of charge carriers in a dielectric conductivity field, as well as their mobility and conduction processes. Crystals have greater temperature conductivity due to inherent flaws created by thermal fluctuations, as proven for the Hg complex [55], where the activation energy Ea was approximately 0.72 eV.

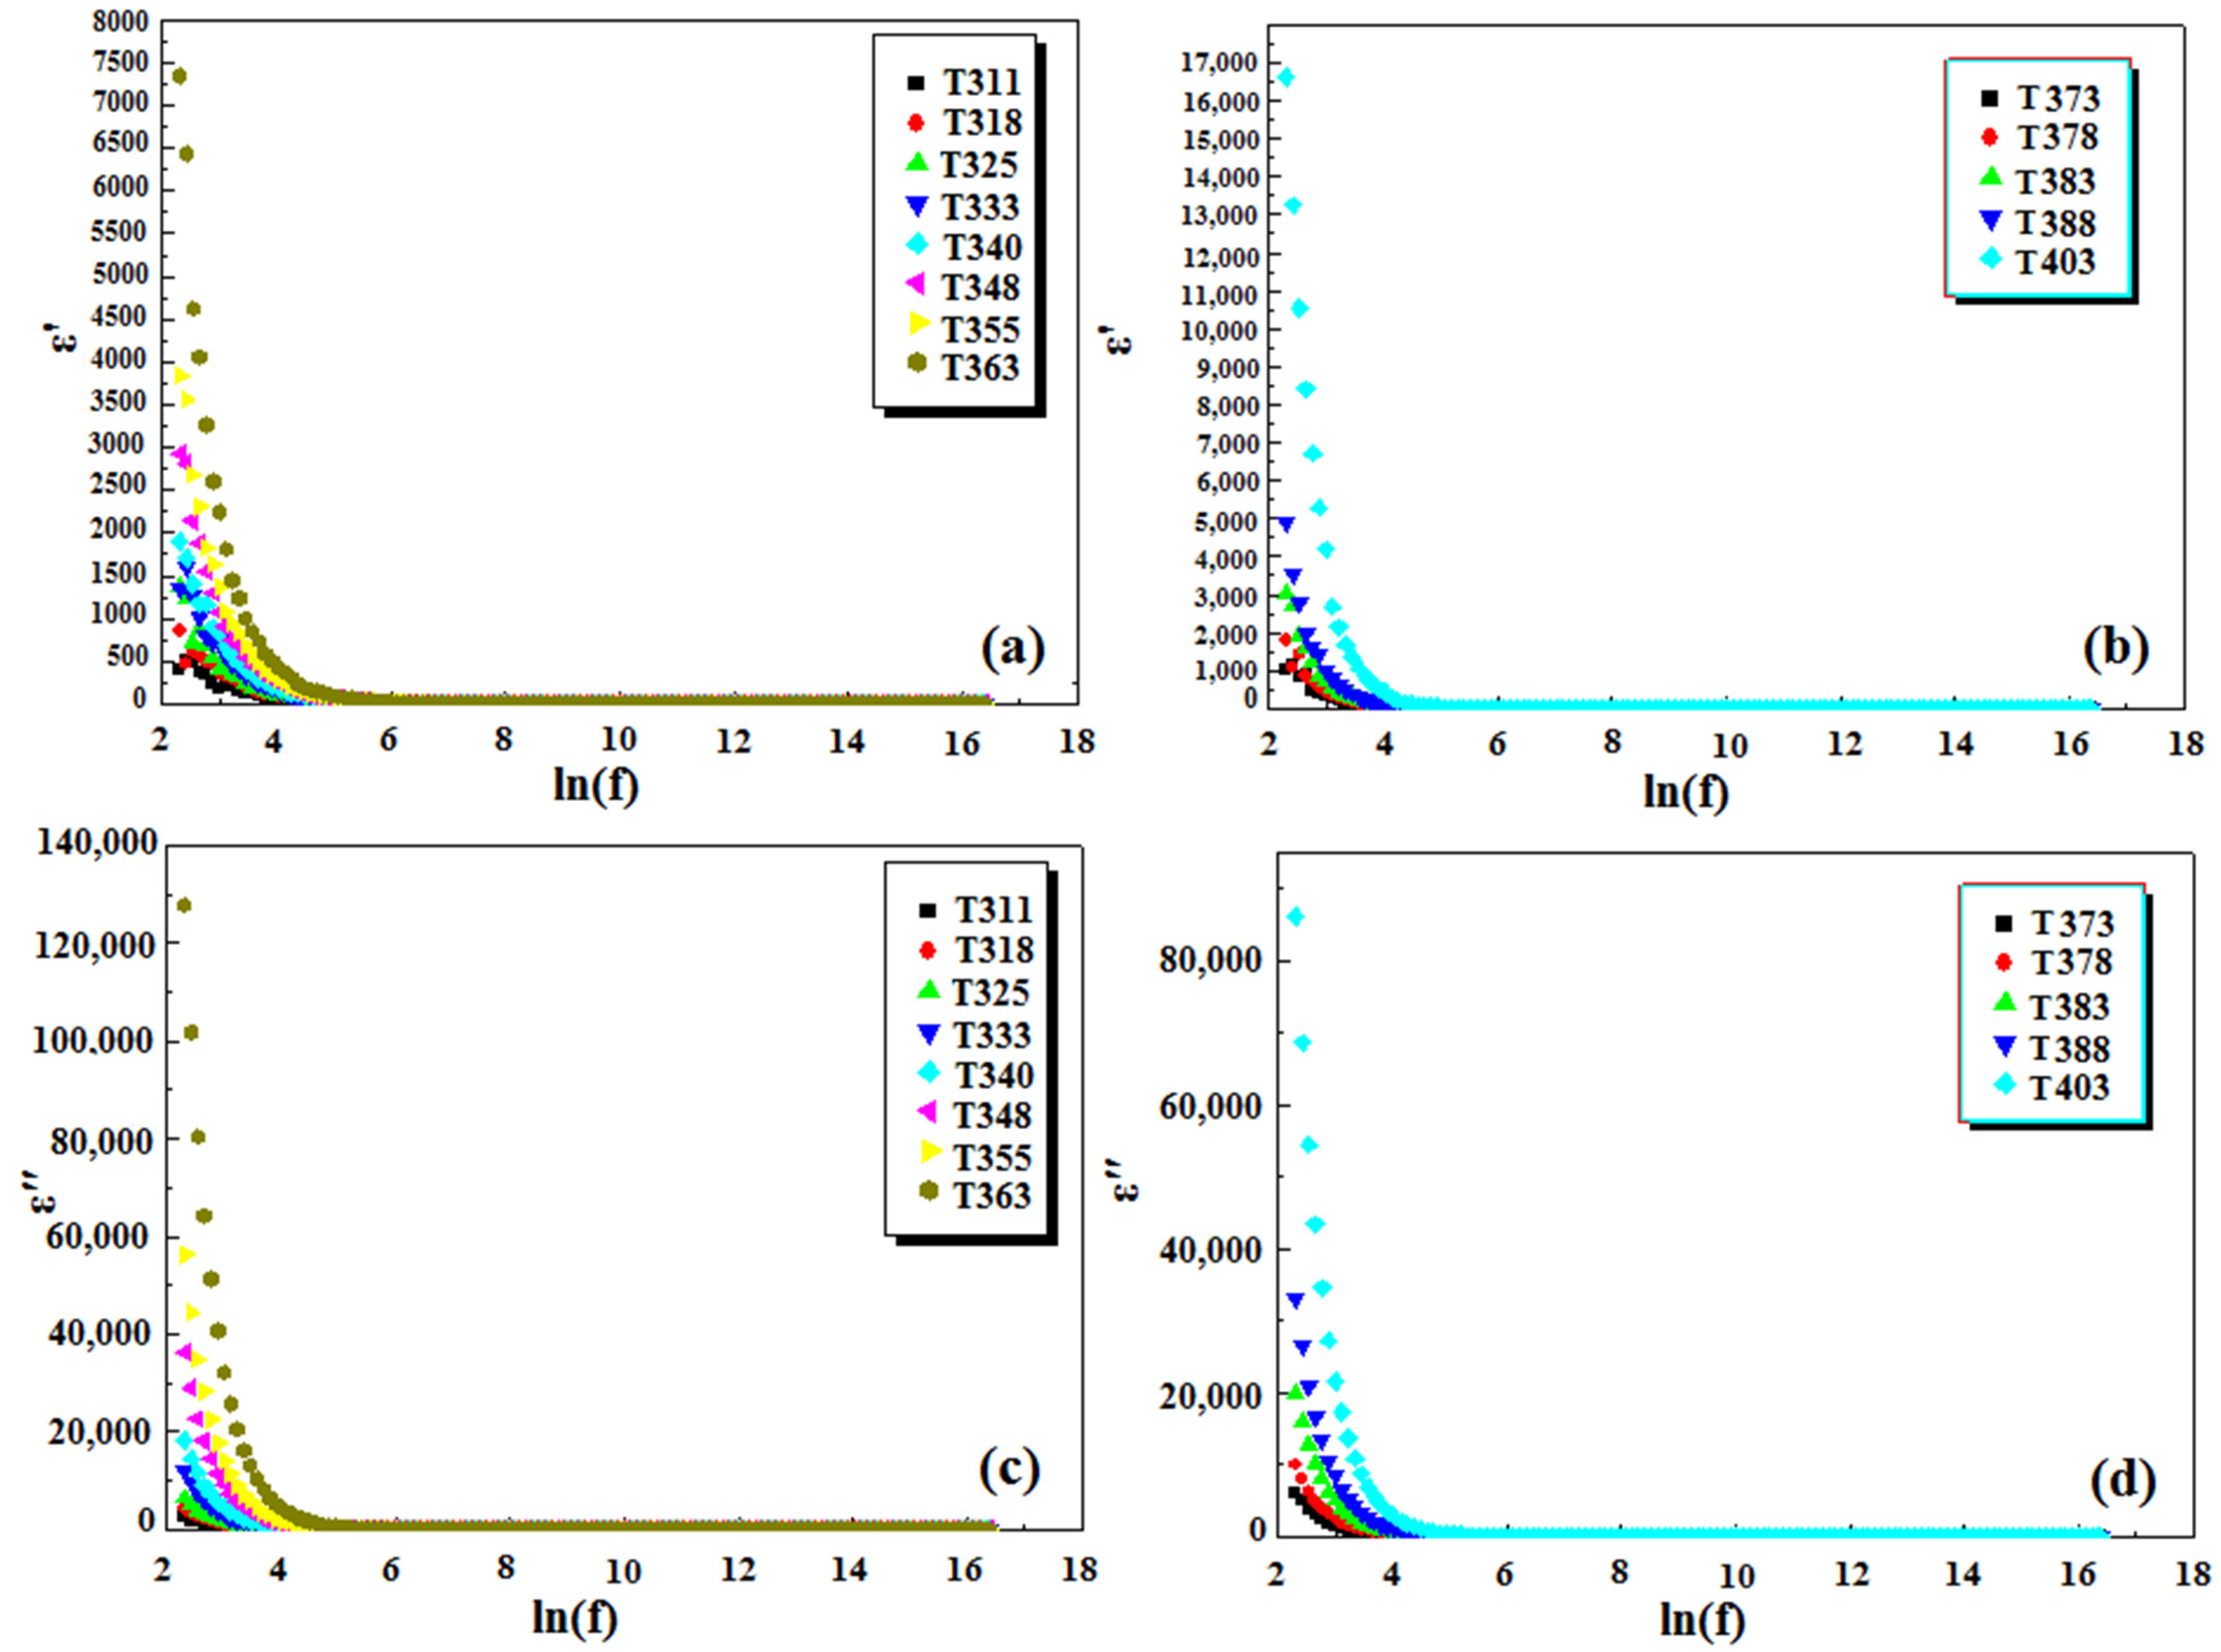
3.7.1. The Dielectric Constants (ε′ and ε″) Versus ln(f)

The spectra in Figure 12 reveal the link between dielectric constants (ε′ and ε″) and frequencies. At low frequencies, these spectra exhibit dielectric dispersion, where all polarization processes contribute. In general, the polarization process is divided into four parts: electron polarization (or atomic polarization), orientation polarization (also known as dipolar polarization), ion polarization, and interfacial polarization (also called space charge polarization). However, as frequency increases, the influence of various bias mechanisms decreases. Several studies [56,57] have identified this sort of behavior, which may be explained by the polarization process. Observations of the dielectric behavior of simple salts have been made in a similar manner [58,59].

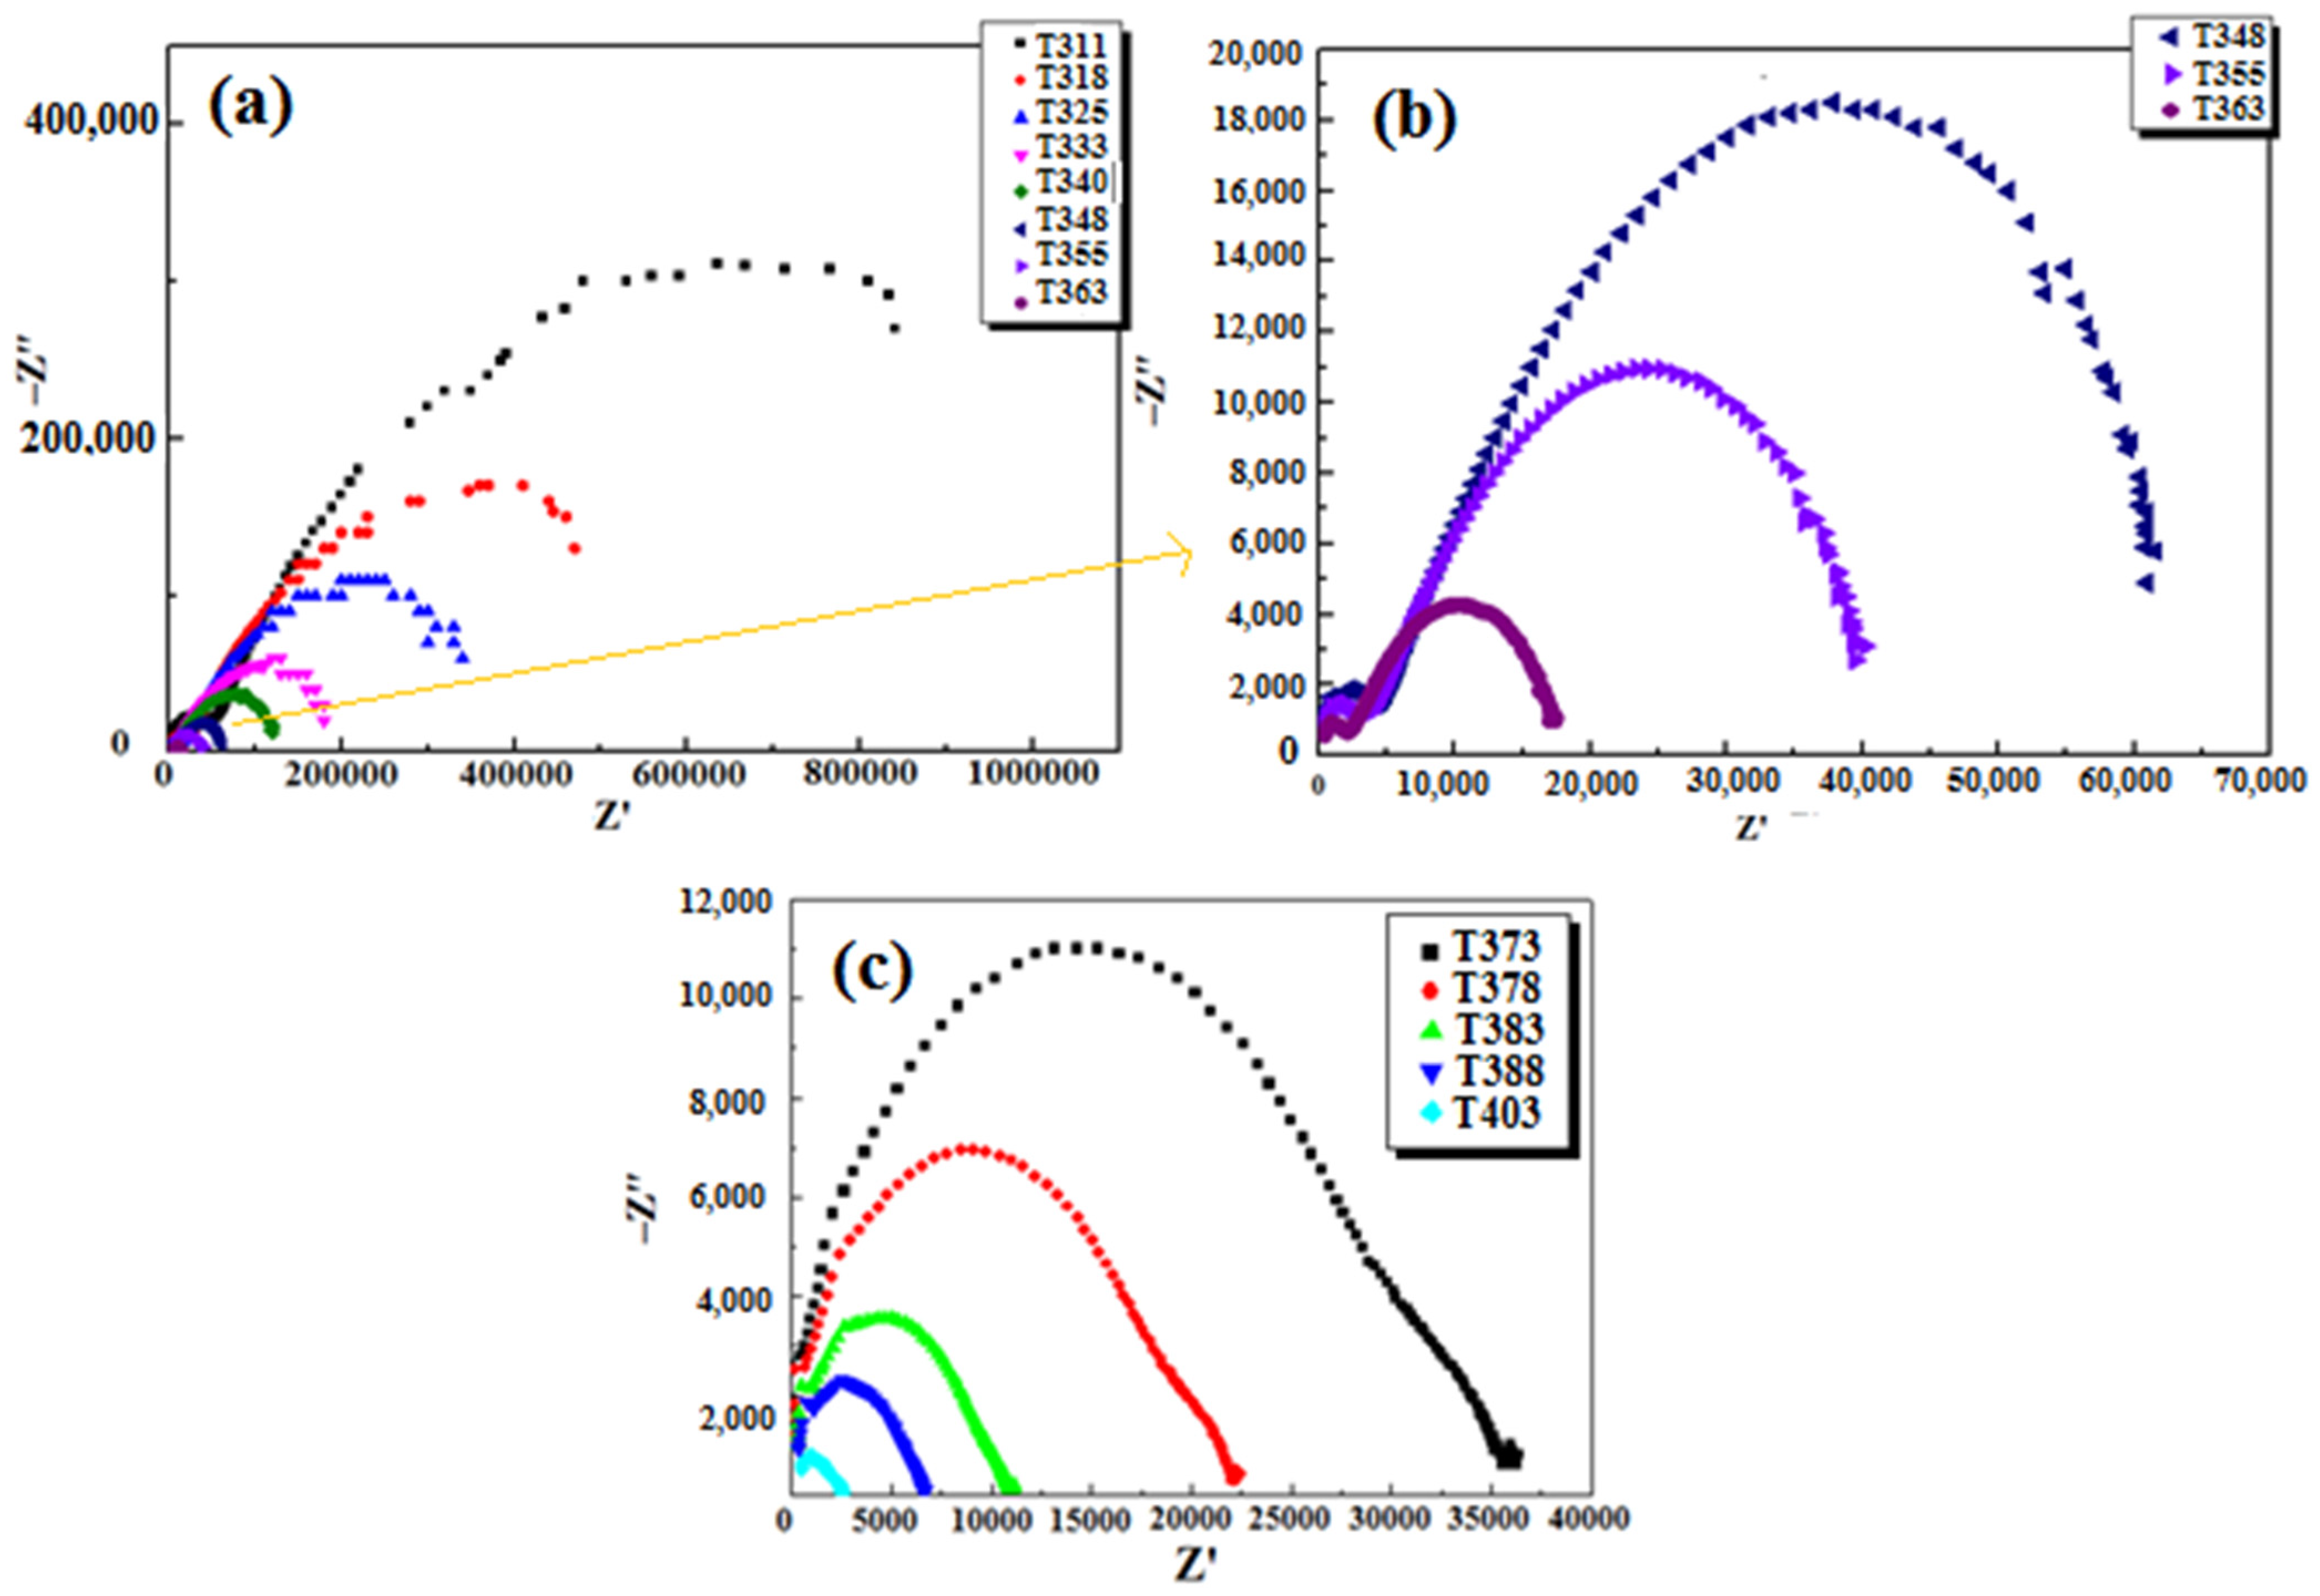
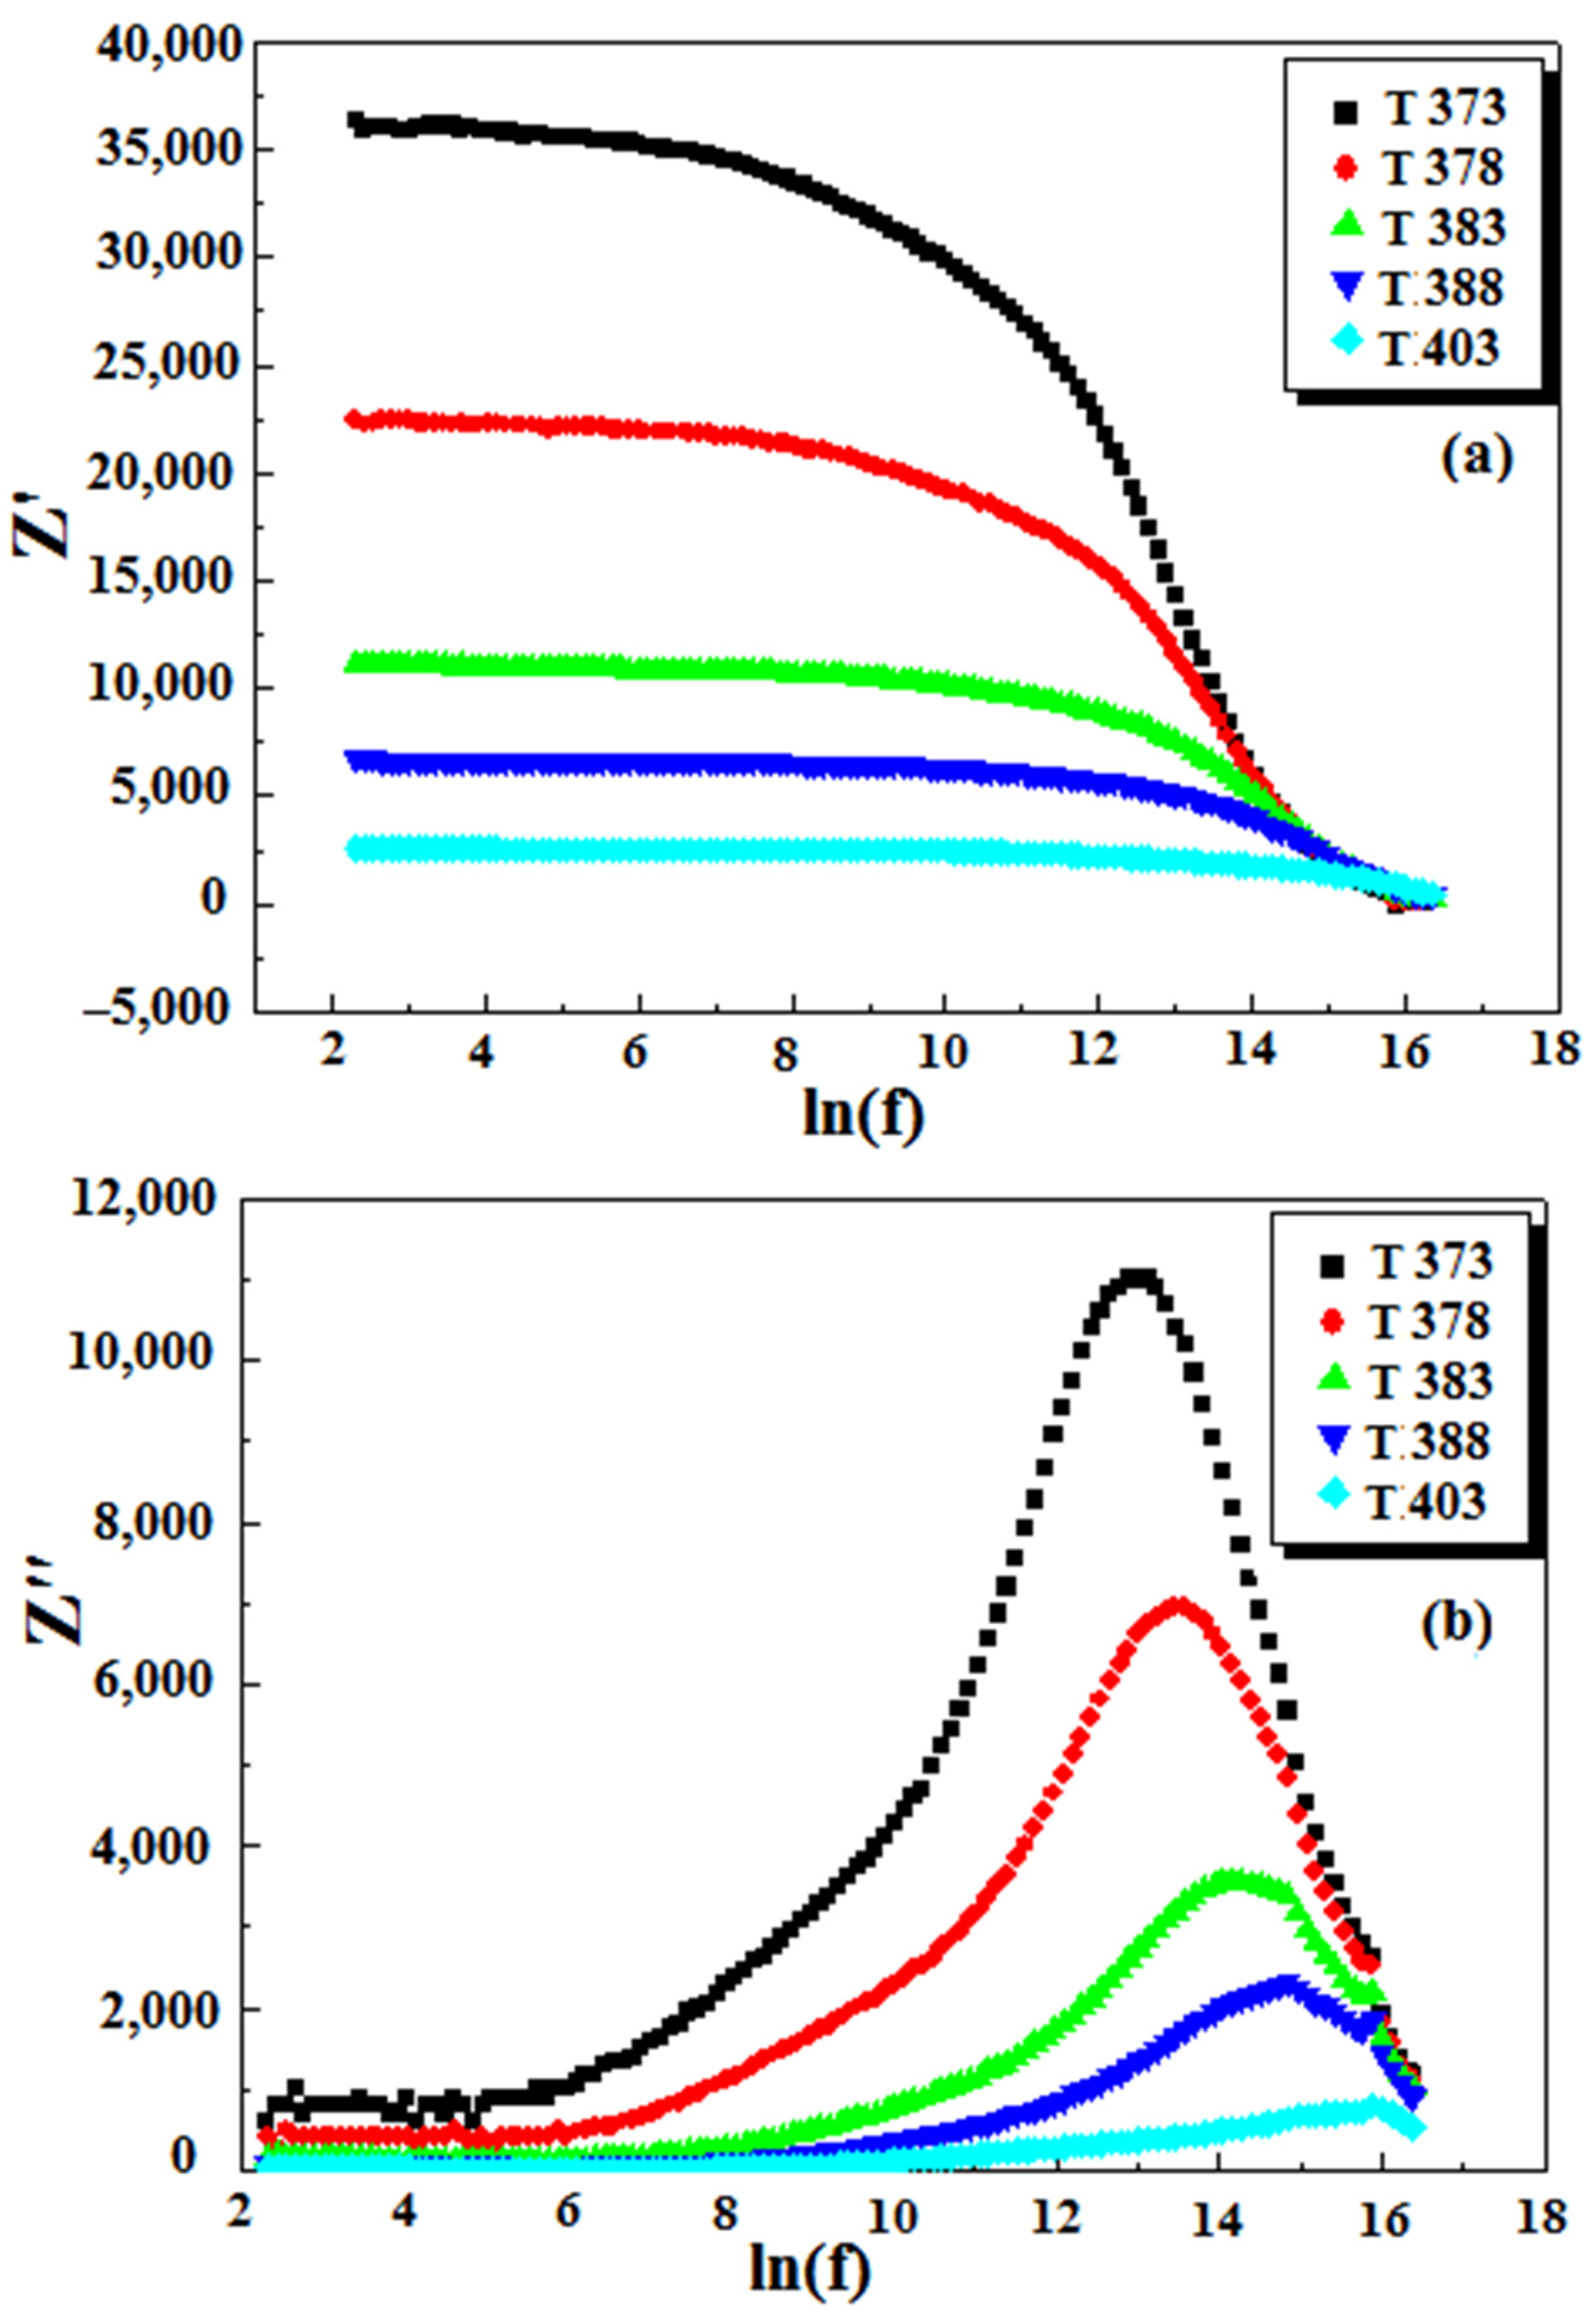
3.7.2. Impedance Spectroscopy

The impedance spectroscopy technique is used to examine and discriminate between the contributions of the material electrode contact and the grain and grain boundary. Semicircular arcs at high frequencies are ascribed to grain contributions, whereas semicircular arcs at low frequencies are assigned to grain boundaries [60]. The impedance spectrum of(C5H14N2)[HgCl4]·H2O is shown in Figure 13 between 311 and 403 K. We noted that the conduction is reduced by those of the grain boundaries at temperatures below 363 K (Figure 13a,b); on the other hand, at temperatures above 373 K, the conduction is reduced by the grains (Figure 13c). Nyquist diagram is another name for this graph. These lines, which are quite complicated, form semicircular arcs. There is a certain frequency associated with each of the experiment’s data points. The diameter of the semicircle denotes the electrical resistivity of the product at the specified temperature, and the greatest resistivity value corresponds to the relaxation frequency w= 1/RC. Using impedance curves, it is possible to show that the radius of the semicircle decreases as the temperature rises. This is in accordance with the Cole–Cole rule [61]. The impedance Z may well be measured and expressed in the following ways as a function of resistance R and capacitance C:
Z*(ω) = Z′(ω)−jZ″(ω)
With ;   Z ( ω ) = R 1 + ω 2 R 2 C 2
Z   ( ω ) = ω R 2 C 1 +   ω 2   R 2 C 2
Z′(ω) and Z″(ω) represent the real and imaginary components of the impedance created by the above equations, respectively [62]. The impedance data were matched to the equivalence of the R and C parallel systems [63].
The impedance analysis of this complex enables us to have a better understanding of the observed dielectric dispersion phenomena. The real component Z′ and the imaginary part Z” have a frequency dependency, which illustrates the complex impedance of this sample at different temperatures (Figure 14).
In Figure 14a, we can notice that in the zone where the frequencies are high, Z′ becomes independent of them, and this is manifested by the merging of the curves. Furthermore, the rise in frequencies and temperatures causes a decrease in the magnitude of Z′, but it causesan increase in the conductivity of the material. This observation might be explained by the release of space charge, which results in a decrease in the material’s barrier properties as the temperature increases [64].
Z′ increases with frequency and reaches a maximum before quickly decreasing, as seen in Figure 14b.The value of the maxima of Z” falls gradually as frequency and temperature increase, finally merging into the high-frequency area. This might be a sign of the material’s polarization effects accumulating at low frequencies and high temperatures [65].

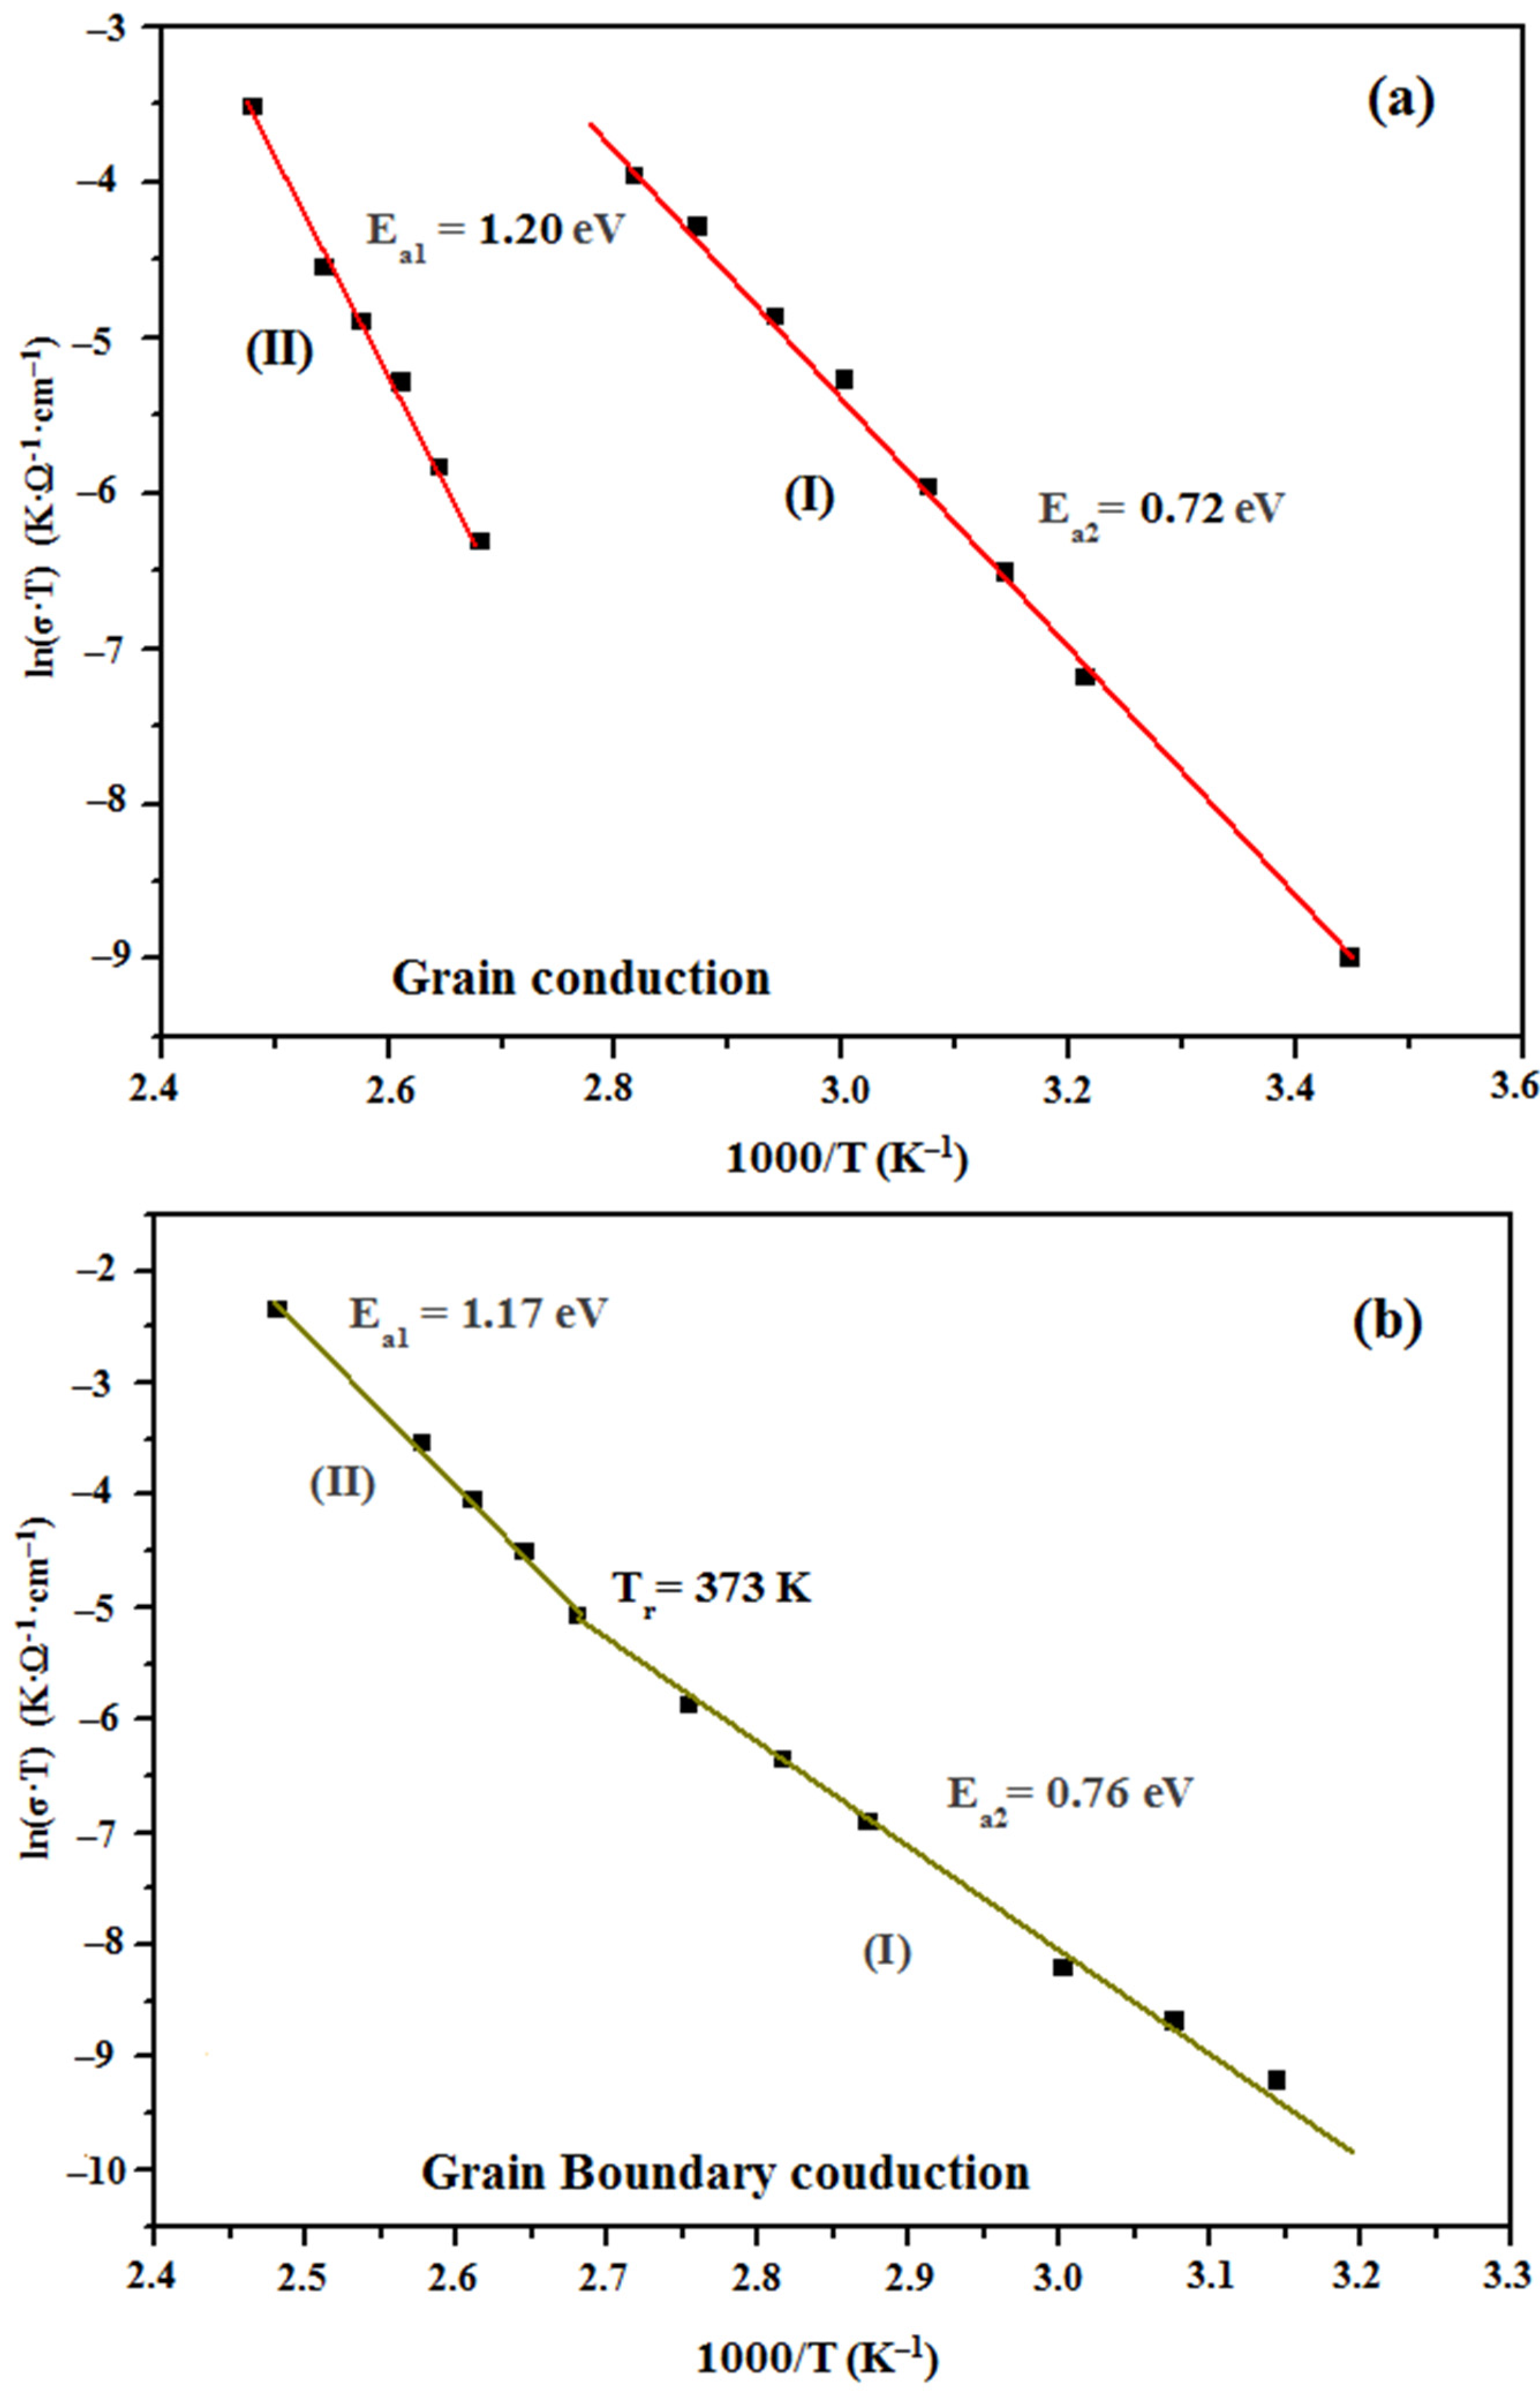
3.7.3. Electric Conductivity

Based on the Arrhenius modeling equation, Figure 15 depicts the development of electrical conductivity (grain and grain boundary) as a function of temperature: σ·T = A exp(−Ea/Kβ·T) [66] (where Ea represents the activation energy, A is the pre-exponential factor, K is the Boltzmann constant, and T is the temperature in Kelvin). The curves of Figure 15a,b show a breakout towards 373 K. Indeed, the curves are made up of two parts, (I) and (II). The first part (I) is located in the region of temperatures below 363 K, while the second part (II) is placed in the region of temperatures above 373 K. The conductivity follows Arrhenius’ law in both parts. According to the curves in Figure 15, there isa modification in the slope of the linear curve at T = 373 K. The change in the slope can be explained by a modification of the conduction mechanisms, which causes the departure of the water molecule (dehydration) because our compound contains H2O. This phenomenon is observed in other materials [67]. We think that the conduction is of proton origin. Protons of the synthesized material come from the organic part and from the water molecules. After dehydration, conducting proton density decreases, inducting the sudden decrease of the conductivity observed at 373 K. This result was confirmed in the TGA-DTA part. The activation energies deduced for both conductions are very close: Ea1 = 1.20 eV and Ea2 = 0.72 eV (grain conduction), and Ea1 = 1.17 eV and Ea2 = 0.76 eV (grain boundary conduction).

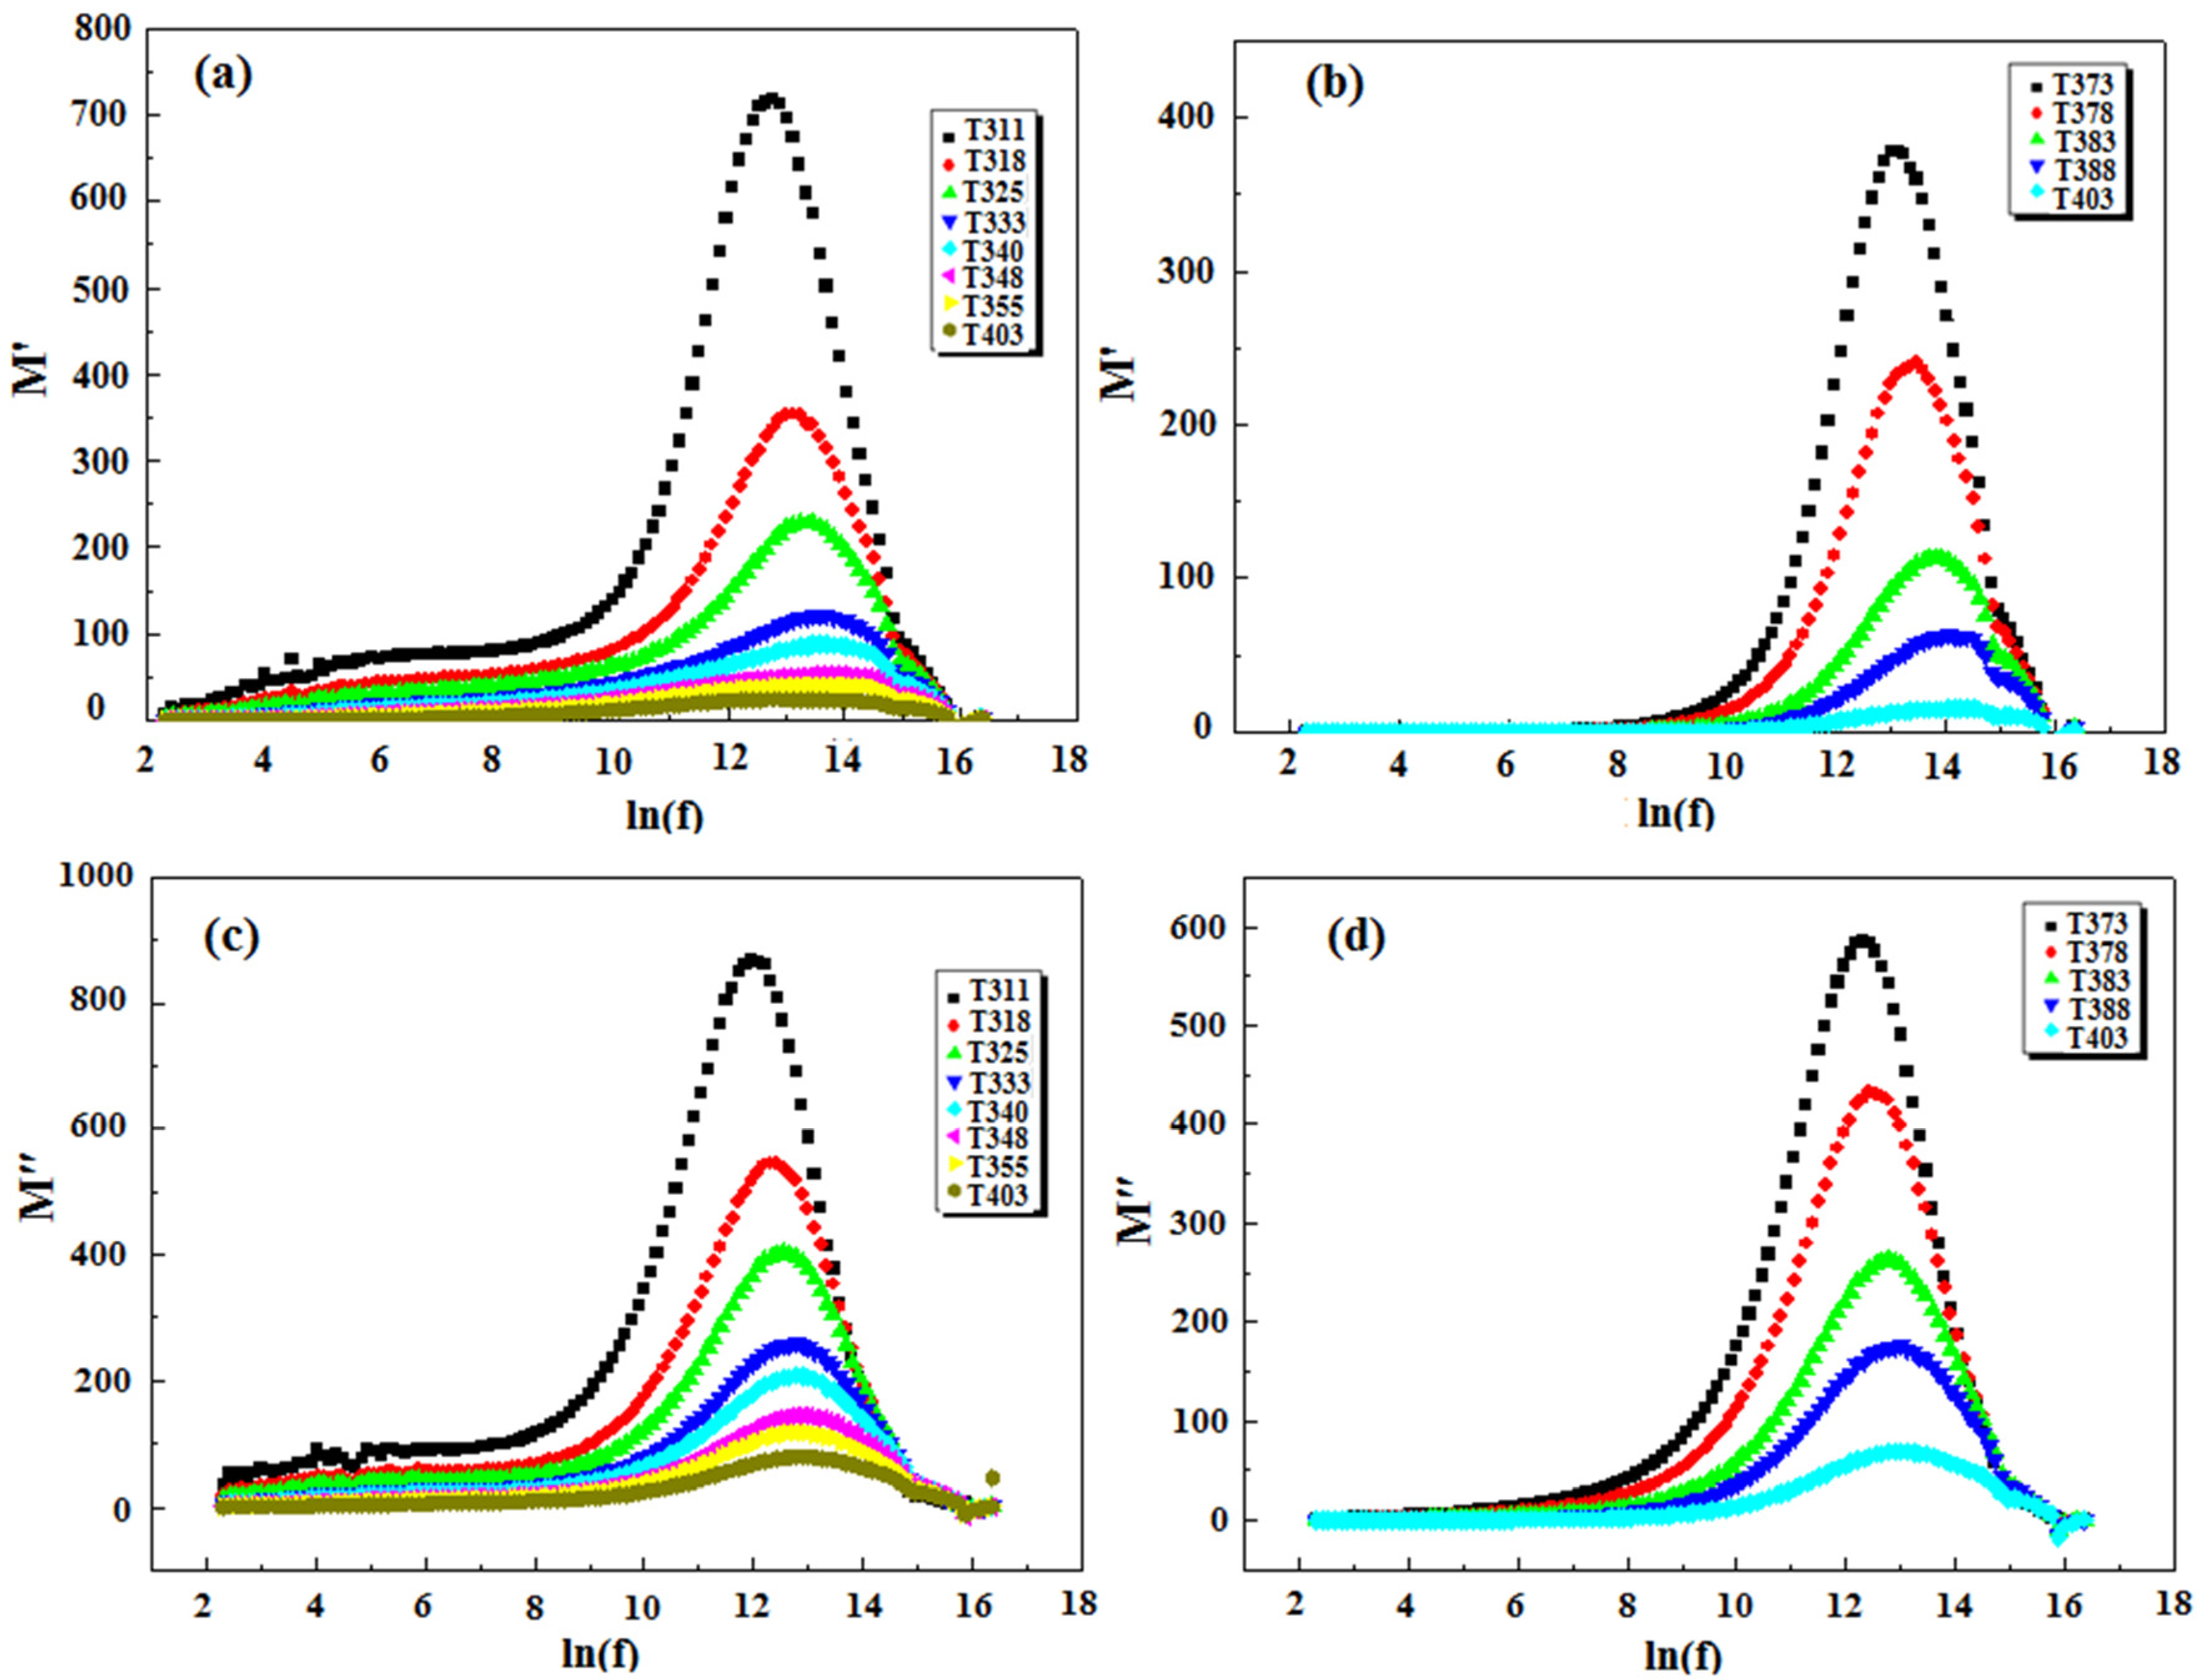
3.7.4. Electrical Modulus

The purpose of the modulus (M)spectroscopy graph is to discern components that have the same resistance but have a different capacitance. Another fascinating feature of M formalism is the absence of the electrode influence. The following formula was used to calculate the complex electric modulus (M*):
M *   ( ω ) = 1 ε * = M + jM
where M′ = ΩC0Z″, M″ = ΩC0Z′, ω represent the angular frequency (2πf) and ε* is called the complex permittivity formalism, and C0 = ε0(A/t) represents the geometrical capacitance such that
  • ε0 represents the permittivity of free space;
  • A is the area of the electrode surface;
  • T expresses the thickness.
The fluctuation of the real component M′ of the electrical modulus M′ is seen in Figure 16a,b. The low values of M′ are reported at all temperatures and in the low-frequency zone. When the frequency is raised, the value of M′ grows as well, until it hits a maximum, indicating a maximum in dielectric losses. Such findings might be linked to a lack of restoring force guiding charge carrier motion under the influence of generated electric fields. This demonstrates that the electrode effect in the material has been eliminated [68]. In Figure 16c,d, at various temperatures and frequencies, the fluctuation of the imaginary part of the electrical modulus M″ is shown as a function of ln(f), implying a connection between the movements of the mobile ions [69]. At temperatures between 311 and 403 K, a well-recognized relaxation process has been established. As the temperature rises, the relaxation peaks move to higher frequencies. The modulus spectrum’s appearance shows that the material has a hopping electrical conduction process.

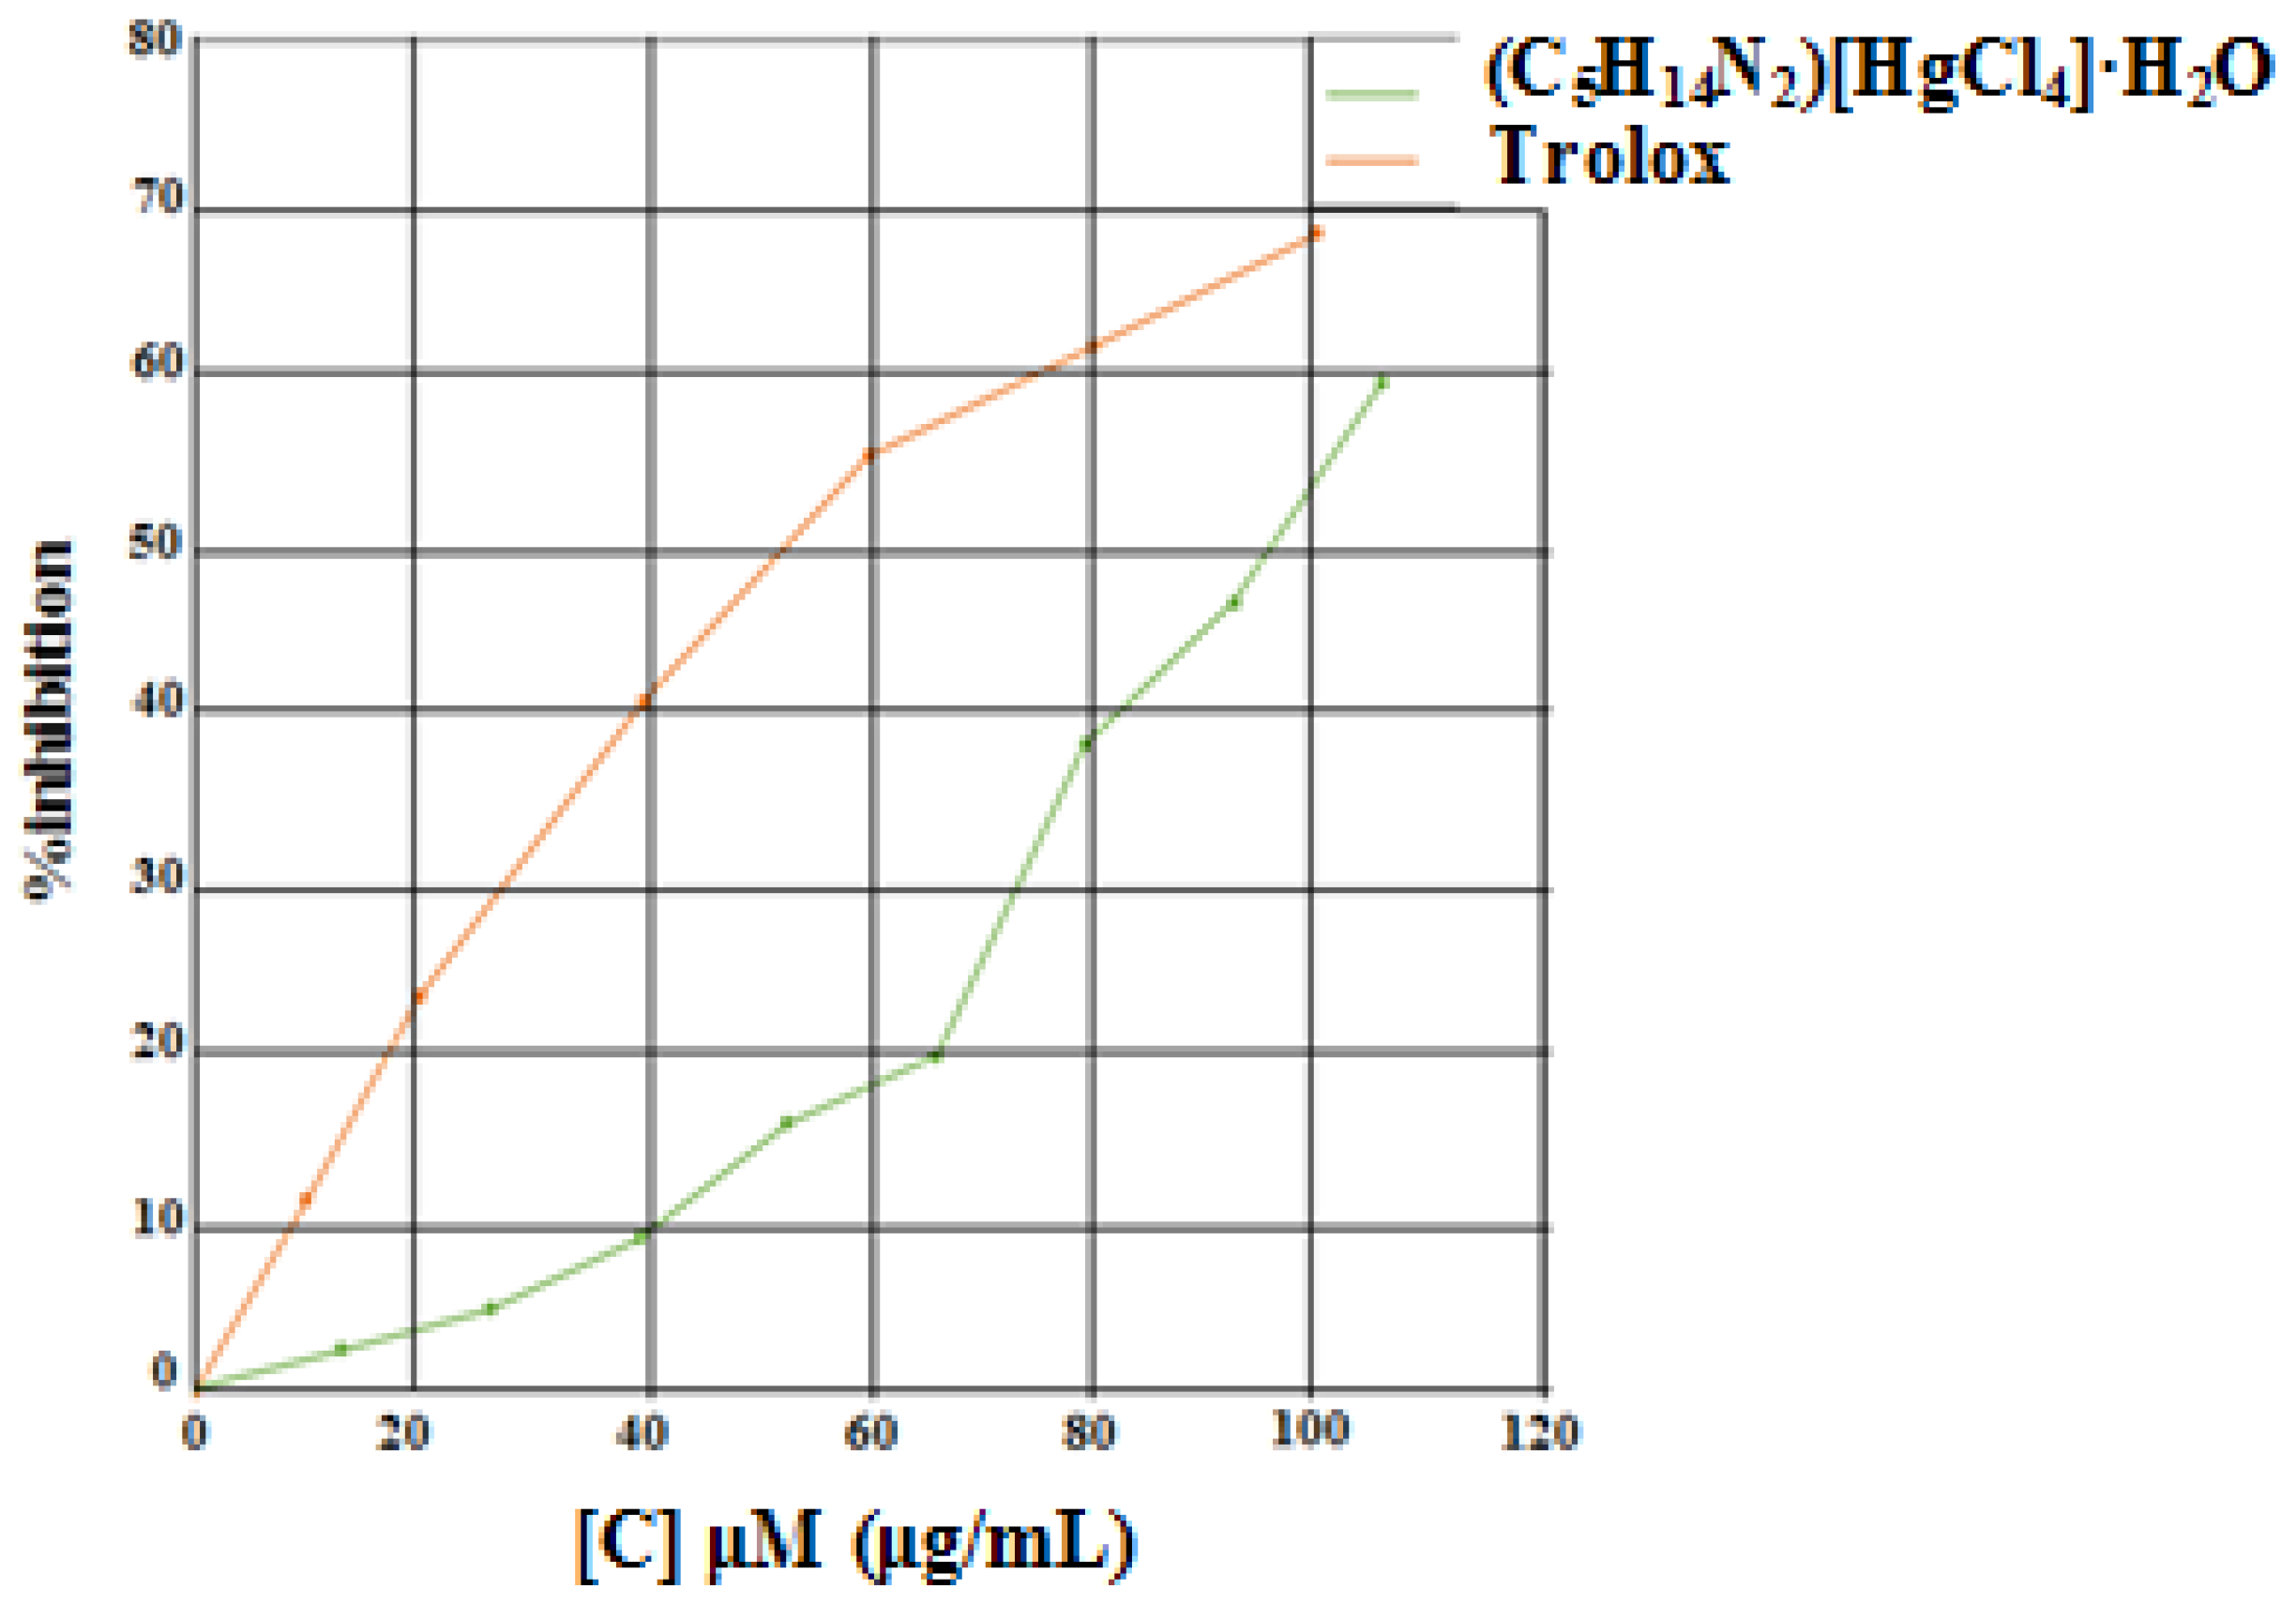
3.8. Discussion of Antioxidant Activity

The different concentrations of the 70% ethanolic extract (0,10,15,20,25,30,35, and 40 μg/mL acted in adose-dependent manner at various doses, with 0, 0.96, 1.95, 3.68, 6.52, 8.19, 15.85, 19.36, and 24.78% inhibition. In Figure 17, it is shown that the percentage inhibition of the free radical DPPH· (2.2-diphenyl-1-picryldrazyl) has the same pattern for the extract used. It has been observed that the percentage inhibition increases with the concentration of the 70%ethanolic extract, and it is generally lower when compared to that of the synthetic antioxidant DPPH·, which shows a higher antioxidant activity of the inhibition percentage.
The study of the antioxidant activity of the extract from Staviarebaudiana using the DPPH· free-radical-scavenging method showed that the 70% ethanolic extract has significant antioxidant activity. This activity remains significantly lower than that of DPPH·, but it is a crude extract, containing a large number of different compounds. It is therefore very likely that it contains compounds which, once purified, may exhibit activity comparable to that of DPPH·.
The antioxidant capacity is expressed in Trolox equivalent (TEAC), which gives a value of EC50 = 18.19 ± 0.04 μΜ (μg/mL); it corresponds to the concentration of Troloxthatgives a value of EC50 (Trolox) = 19.642 μΜ (μg/mL) having the same activity as the substance to be tested at one concentration. The result is given in μΜ (μg/mL) of Trolox equivalent per g of product with a value of 1.863 μmol Trolox/mg of extract (scavenger effect of the DPPH· radical).
The inhibitory activity of the different extracts [70] on a methanolic solution of DPPH·measured at 515 nm, was used to assess their anti-free-radical activity. This effect is explained by the transfer of single electrons from the DPPH·’s exterior orbital to the antioxidant, which would totally react with the radical after reaching a certain concentration. When the concentration is increased, the antioxidant is explained by the existence of multiple bioactive molecules, which is followed by the saturation of the radical’s electronic layers.

4. Conclusions

The compound homopiperazine-1.4-diium tetrachloridromercurate (II) monohydrate crystallized in the monoclinic system, according to a single XRD. Four types of hydrogen bonds and electrostatic interactions connect the various entities that make up the crystal packing. The different types of intermolecular interactions are demonstrated by Hirshfeld surface. The homogeneity of the single crystal was confirmed by the XRD powder analysis result. The compound’s several types of functional groups were revealed by IR spectroscopy. Thermal studies (TGA-DTA) were used to determine the complex’s thermal stability. At room temperature and in the solid form, luminescence research reveals an interesting fluorescence feature. Temperature and frequency were used to depict dielectric characteristics in the 311–403 K range. The Arrhenius law governs the relaxation time and electrical conductivity. The conductivity of this material has been examined as a function of frequency in the temperature range 311–403 K, where the conduction process ascribed to the ion-hopping mechanism. The test for antioxidant activity demonstrates that the produced compound exhibits antioxidant activity.

Supplementary Materials

The following supporting information can be downloaded at: https://www.mdpi.com/article/10.3390/cryst12040486/s1, Table S1: The different H-Bonds present in (C5H14N2)[HgCl4]·H2O.; Table S2: The different distances and angles of every part in (C5H14N2)[HgCl4]·H2O.; Table S3: The main bands detected in the infrared spectrum of (C5H14N2)[HgCl4]·H2O: Wavenumbers values and their modes of vibration.

Author Contributions

Software, K.H.A. and W.F.; validation, M.H.M.; formal analysis, A.O.; investigation, A.A.A.; resources, M.A.B.; writing—original draft preparation, C.A.; supervision, C.B.N. and M.H.M.; project administration, K.M.A. All authors have read and agreed to the published version of the manuscript.

Funding

This research received no external funding.

Institutional Review Board Statement

Not applicable.

Informed Consent Statement

Not applicable.

Data Availability Statement

Not applicable.

Acknowledgments

The author would like to thank the Deanship of Scientific Research at Shaqra University for supporting this work. The authors thank Researchers Supporting Project number (RSP-2021/242), King Saud University, Riyadh, Saudi Arabia. We would like to express our gratitude to Werner Kaminsky of the University of Washington in the United States of America (USA) for finishing the structural resolution.

Conflicts of Interest

The authors declare no conflict of interest.

References

  1. Baklouti, Y.; Zouari, F. Synthesis, Crystal Structure, Thermal and Dielectric Properties of a New Semi-organic Crystal: 2[N(2-Aminoethyl)-1,3-propanediaminium] octachlorodimercurate, tetrachloromercurate. J. Clust. Sci. 2015, 26, 1215–1229. [Google Scholar] [CrossRef]
  2. Grdenić, D. The structural chemistry of mercury. Q. Rev. Chem. Soc. 1965, 19, 303–328. [Google Scholar] [CrossRef]
  3. Lambarki, F.; Ouasri, A.; Rhandour, A.; Saadi, M.; El Ammari, L.; Hajji, L. Structural, vibrational and electrical studies of tetramethylammonium trichloromercurate [(CH3)4N]HgCl3. J. Mol. Struct. 2018, 1173, 865–875. [Google Scholar] [CrossRef]
  4. Pitt, M.A.; Johnson, D.W. Main group supramolecular chemistry. Chem. Soc. Rev. 2007, 36, 1441–1453. [Google Scholar] [CrossRef]
  5. Robin, A.Y.; Fromm, K.M. Coordination polymer networks with O-and N-donors: What they are, why and how they are made. Coord. Chem. Rev. 2006, 250, 2127–2157. [Google Scholar] [CrossRef]
  6. Mahmoudi, G.; Morsali, A. Counter-ion influence on the coordination mode of the 2, 5-bis (4-pyridyl)-1, 3, 4-oxadiazole (bpo) ligand in mercury (II) coordination polymers, [Hg (bpo)nX2]: X = I, Br, SCN, N3− and NO2−; spectroscopic, thermal, fluorescence and structural studies. Cryst. Eng. Comm. 2007, 9, 1062–1072. [Google Scholar] [CrossRef]
  7. BelHajSalah, S.; Hermi, S.; Alotaibi, A.A.; Alotaibi, K.M.; Lefebvre, F.; Kaminsky, W.; BenNasr, C.; Mrad, M.H. Stabilization ofhexachloride net withmixedSn(IV) metal complex and2,3-dimethylanilinium organic cation: Elaboration, optical, spectroscopic, computational studies andthermal analysis. Chem. Pap. 2022, 76, 1861–1873. [Google Scholar] [CrossRef]
  8. Althobaiti, M.G.; Hermi, S.; Alotaibi, A.A.; Alotaibi, K.M.; Hassan, H.A.; Mi, J.X.; Ben Nasr, C.; Mrad, M.H. A New Cu (II) Metal Complex Template with 4–Tert–Butyl-Pyridinium Organic Cation: Synthesis, Structure, Hirshfeld Surface, Characterizations and Antibacterial Activity. Crystals 2022, 12, 254. [Google Scholar] [CrossRef]
  9. Hermi, S.; Althobaiti, M.G.; Alotaibi, A.A.; Almarri, A.H.; Fujita, W.; Lefebvre, F.; Ben Nasr, C.; Mrad, M.H. Synthesis, Crystal Structure, DFT Theoretical CalculationandPhysico-Chemical Characterization of a New Complex Material (C6H8Cl2N2)2[Cd3Cl10]·6H2O. Crystals 2021, 11, 553. [Google Scholar] [CrossRef]
  10. Hermi, S.; Alotaibi, A.A.; Alswieleh, A.M.; Alotaibi, K.M.; Althobaiti, M.G.; Jelsch, C.; Wenger, E.; Ben Nasr, C.; Mrad, M.H. The Coordination Behavior of Two New Complexes, [(C7H10NO2)CdCl3]n(I) and [(C7H9NO2)CuCl2] (II), Based on 2,6-Dimethanolpyridine; Elaboration of the Structure and Hirshfeld Surface, Optical, Spectroscopic and Thermal Analysis. Materials 2022, 15, 1624. [Google Scholar] [CrossRef]
  11. Menabue, L.; Pellacani, G.C.; Albinati, A.; Ganazzoli, F.; Cariati, F.; Rassu, G. Synthesis and low-frequency vibrational spectra of N-(2-ammoniumethyl)-piperazinium halide-mercurates (II). Crystal structure of N-(moniumethyl)-piperaziniummonochloridetetrachloromercurate (II). Inorg. Chim. Acta 1982, 58, 227–231. [Google Scholar] [CrossRef]
  12. Natal’ya, V.P.; Magarill, S.A.; Borisov, S.V.; Romanenko, G.V.; Pal’chik, N.A. Crystal chemistry of compounds containing mercury in low oxidation states. Russ. Chem. Rev. 1999, 68, 615–636. [Google Scholar]
  13. Atuchin, V.V.; Borisov, S.V.; Magarill, S.A.; Pervukhina, N.V. Crystal structural premises to epitaxial contacts for a series of mercury-containing compounds. J. Cryst. Growth 2011, 318, 1125–1128. [Google Scholar] [CrossRef]
  14. Martin, D.P.; Hann, Z.S.; Cohen, S.M. Metalloprotein–Inhibitor Binding: Human Carbonic Anhydrase II as a Model for Probing Metal–Ligand Interactions in a Metalloprotein Active Site. Inorg. Chem. 2013, 52, 12207–12215. [Google Scholar] [CrossRef] [PubMed] [Green Version]
  15. Wamani, W.; Hannachi, N.; Mhiri, T.; Belhouchet, M. Impedance spectroscopy, electrical relaxation and Ac conductivity studies of organic-inorganic hybrid compound: NH3 (C6H4) 2NH3HgCl4. J. Adv. Chem. 2014, 7, 1348–1358. [Google Scholar] [CrossRef]
  16. Salah, A.B.; Bats, J.W.; Fuess, H.; Daoud, A. Crystal structure determination of the complexes of trimethylammonium chloride and mercury (II) chloride: (CH3)3NHHgCl3,{(CH3)3NH}2HgCl4, and (CH3)3NHHg2Cl5. Z. Kristallogr. 1983, 164, 259–272. [Google Scholar] [CrossRef]
  17. Wang, W.X.; Zhu, R.Q.; Fu, X.Q.; Zhang, W. Crystal Structure and Dielectric Property of (p-CH3OC6H4NH3)+(18-crown-6)·H2PO4·2H3PO4. Z. Anorg. Allg. Chem. 2012, 638, 1123–1126. [Google Scholar] [CrossRef]
  18. Debabis, R.B.; Amamou, W.; Chniba-Boudjada, N.; Zouari, F. Synthesis, crystal structure, and vibrational and magnetic properties of Co (II) and Hg (II) complexes with an 8-hydroxyquinoline unit. J. Phys. Chem. Solids 2019, 124, 296–304. [Google Scholar] [CrossRef]
  19. Kim, Y.; Choi, J.; Nam, S.; Jeong, S.; Yoon, Y. NMR study of carbon dioxide absorption in aqueous potassium carbonate and homopiperazine blend. Energy Fuels 2012, 26, 1449–1458. [Google Scholar] [CrossRef]
  20. Li, T.; Chen, C.; Guo, F.; Li, J.; Zeng, H.; Lin, Z. Extra-large-pore metal sulfate-oxalates with diamondoid and zeolitic frameworks. Inorg. Chem. Commun. 2018, 93, 33–36. [Google Scholar] [CrossRef]
  21. Sahbani, T.; Sta, W.S.; Al-Deyab, S.S.; Rzaigui, M. Homopiperazine-1,4-diium bis[hexaaquacobalt(II)] trisulfate. Acta Crystallogr. Sect. E 2011, 67, m1079. [Google Scholar] [CrossRef] [PubMed] [Green Version]
  22. Natarajan, S. Hydro/solvothermal synthesis and structures of new zinc phosphates of varying dimensionality. Inorg. Chem. 2002, 41, 5530–5537. [Google Scholar] [CrossRef] [PubMed]
  23. Guo, Y.-M.; Du, M.; Bu, X.-H. Bis(1,4-diazacycloheptane-N,N’)nickel(II) perchlorate. Acta Crystallogr. Sect. E 2001, 57, m280–m282. [Google Scholar] [CrossRef]
  24. Xing, Z.; Yin, H.-B. Crystal structure of (1,4-diazepane)4CuII2(μ-Cl)10CuI6, C20H48Cl10Cu8N8. Z. Kristallogr. NCS 2019, 243, 391–392. [Google Scholar] [CrossRef]
  25. Ling, E.C.H.; Allen, G.W.; Hambley, T.W. DNA binding of a platinum(II) complex designed to bind interstrand but not intrastrand. J. Am. Chem. Soc. 1994, 116, 2673–2674. [Google Scholar] [CrossRef]
  26. Ali, M.S.; Powers, C.A.; Whitmire, K.H.; Guzman-Jimenez, I.; Khokhar, A.R. Synthesis, characterization, and representative crystal structure of lipophilic platinum(II) (homopiperazine)carboxylate complexes. J. Coord. Chem. 2001, 52, 273–287. [Google Scholar] [CrossRef]
  27. Ali, M.S.; Mukhopadhyay, U.; Shirvani, S.M.; Thurston, J.; Whitmire, K.H.; Khokhar, A.R. Homopiperazine platinum(II) complexes containing substituted disulfide groups: Crystal structure of [PtII(homopiperazine)(diphenylsulfide)Cl]NO3. Polyhedron 2002, 21, 125–131. [Google Scholar] [CrossRef]
  28. Ali, M.S.; Longoria, E., Jr.; Ely, T.O.; Whitmire, K.H.; Khokhar, A.R. HomopiperazinePt(II) adducts with DNA bases and nucleosides: Crystal structure of [PtII(homopiperazine)(9-ethylguanine)2](NO3)2. Polyhedron 2006, 25, 2065–2071. [Google Scholar] [CrossRef]
  29. Phlip, D. Supramolecular Chemistry: Concepts and Perspectives; Wiley: Hoboken, NJ, USA, 1996; pp. 1–6. ISBN 3527-2931. [Google Scholar]
  30. Schneider, H.J. Mechanisms of molecular recognition: Investigations of organic host–guest complexes. Angew. Chem. Int. Ed. 1991, 30, 1417–1436. [Google Scholar] [CrossRef]
  31. Feddaoui, I.; Abdelbaky, M.S.M.; García-Granda, S.; Ben Nasr, C.; Mrad, M.H. Elaboration, crystal structure, vibrational, optical properties, thermal analysis and theoretical study of a new inorganic-organic hybrid salt [C4H12N2]4·Pb2Cl11·Cl.·4H2O. J. Mol. Struct. 2020, 1211, 128056. [Google Scholar] [CrossRef]
  32. Teimoori, S.; Panjamurthy, K.; Vinaya, K.; Prasanna, D.S.; Raghavan, S.C.; Rangappa, K.S. Synthesis and Biological Evaluation of Novel Homopiperazine Derivatives as Anticancer Agents. J. Cancer Ther. 2011, 2, 507–514. [Google Scholar] [CrossRef] [Green Version]
  33. Belhaj Salah, S.; da Silva, P.S.P.; Lefebvre, F.; Ben Nasr, C.; Ammar, S.; Mrad, M.L. Synthesis, crystal structure, physico-chemical characterization of a new hybrid material, (2-hydroxyethyl)piperazine-1,4-diium hexachlorostannate(IV) monohydrate. J. Mol. Struct. 2017, 1137, 553–561. [Google Scholar] [CrossRef]
  34. Sheldrick, G.M. Crystal structure refinement with SHELXL. ActaCrystallogr. Sect. C 2015, 71, 3–8. [Google Scholar] [CrossRef] [PubMed]
  35. Brandenburg, K. Diamond Version 2.0; Crystal Impact: Bonn, Germany, 1998. [Google Scholar]
  36. Macrae, C.F.; Edgington, P.R.; McCabe, P.; Pidcock, E.; Shields, G.P.; Taylor, R.; Towler, M.; van de Streek, J. Mercury: Visualization and analysis of crystal structures. J. Appl. Crystallogr. 2006, 39, 453–457. [Google Scholar] [CrossRef] [Green Version]
  37. Brand-Williams, W.; Cuvelier, M.E.; Berset, C. Use of a Free Radical Method to Evaluate Antioxidant Activity. Lebensm. Wiss. U. Technol. 1995, 28, 25–30. [Google Scholar] [CrossRef]
  38. Yang, L.; Powell, D.R.; Houser, R.P. Structural variation in copper (I) complexes with pyridylmethylamide ligands: Structural analysis with a new four-coordinate geometry index, τ4. Dalton Trans. 2007, 9, 955–964. [Google Scholar] [CrossRef]
  39. Kumar, M.; Verma, S.K.; Singh, B.; Thakur, A.; Kumar, A.; Jasrotia, D. 2D Interwoven Metal-Organic Framework in Tetrachloromercurate (II) based Hybrid Material. Chem. Sci. 2015, 4, 629–637. [Google Scholar]
  40. Dinesh, J.; Rademeyer, M.; Billing, D.G.; Lemmerer, A. Bis (2-methyl-4-nitroanilinium) tetrachloridomercurate (II). ActaCrystallogr. Sect. E 2008, 64, m1598. [Google Scholar] [CrossRef]
  41. Jomaa, M.B.; Bourguiba, N.F.; Chebbi, H.; Abdelbaky, M.S.; García-Granda, S.; Korbi, N.; Ouzari, H.I. Structural study, spectroscopic characterization, thermal behavior, DFT calculations and antimicrobial properties of a new hybrid compound, (C7H9N2)2 [HgCl4]·H2O. J. Coord. Chem. 2020, 73, 506–523. [Google Scholar] [CrossRef]
  42. Zhu, R.Q. Bis(2-ethyl-1H-imidazol-3-ium) tetrachloridomercurate(II). ActaCrystallogr. Sect. E 2012, E68, m148. [Google Scholar] [CrossRef]
  43. Ayari, C.; Althobaiti, M.G.; Alotaibi, A.A.; Almarri, A.; Ferretti, V.; Ben Nasr, C.; Mrad, M.H. Synthesis, Crystal Structure, Hirshfeld Surface, and Physicochemical Characterization of New Salt Bis (2-ethyl-6-methylanilinium) tetrachloromercurate (II)[C9H14N]2HgCl4. J. Chem. 2021, 2021. [Google Scholar] [CrossRef]
  44. Ayari, C.; Alotaibi, A.A.; Alotaibi, K.M.; Ferretti, V.; Kaminsky, W.; Lefebvre, F.; Ben Nasr, C.; Mrad, M.H. A new Hg (II) hybrid compound (C6H9N2)[Hg6Cl13]· H2O elaboration, crystal structure, spectroscopic, thermal, and DFT theoretical calculations. Chem. Pap. 2022, 76, 2327–2340. [Google Scholar] [CrossRef]
  45. Mrad, M.L.; Belhajsalah, S.; Abdelbaky, M.S.M.; Garcia-Granda, S.; Essalah, K.; Ben Nasr, C. Synthesis, crystal structure, vibrational, optical properties, and a theoretical study of a new Pb (II) complex with bis (1-methylpiperazine-1,4-diium):[C5H14N2]2PbCl6·3H2O. J. Coord. Chem. 2019, 72, 358–371. [Google Scholar] [CrossRef]
  46. Cremer, D.T.; Pople, J.A. General definition of ring puckering coordinates. J. Am. Chem. Soc. 1975, 97, 1354–1358. [Google Scholar] [CrossRef]
  47. Wolff, S.K.; Grimwood, D.J.; McKinnon, J.J.; Jayatilaka, D.; Spackman, M.A. Crystal Explorer, version 1.5; University of Western Australia: Perth, Australia, 2007. [Google Scholar]
  48. Hermi, S.; Alotaibi, A.A.; Lefebvre, F.; Ben Nasr, C.; Mrad, M.H. Elaboration, crystal structure, physico-chemical characterization and theoretical investigation of a new non-centrosymmetricSn (IV) complex (C4H12N2)[SnCl6]·3H2O. J. Mol. Struct. 2020, 1216, 128296. [Google Scholar] [CrossRef]
  49. Shi, Q.Z.; Xing, Z.; Cao, Y.N.; Ma, S.B.; Chen, L.Z. Synthesis, structure and dielectric properties of a Cd coordination polymer based on homopiperazine. J. Mol. Struct. 2017, 1130, 363–367. [Google Scholar] [CrossRef]
  50. Mrad, M.H.; Feddaoui, I.; Abdelbaky, M.S.; García-Granda, S.; Nasr, C.B. Elaboration, crystal structure, characterization and DFT calculation of a new Hg (II) inorganic-organic hybrid salt [C6H16N2O] HgCl4. J. Solid State Chem. 2020, 286, 121280. [Google Scholar] [CrossRef]
  51. Kitagawa, S.; Kitaura, R.; Noro, S.I. Functional porous coordination polymers. Angew. Chem. Int. Ed. 2004, 43, 2334–2375. [Google Scholar] [CrossRef]
  52. Mrad, M.L.; Feddaoui, I.; Abdelbaky, M.S.M.; García-Granda, S.; Ben Nasr, C. Synthesis, crystal structure, vibrational and optical properties of a new Pb(II) complex (2-hydroxyethyl)piperazine-1,4-diium tetrachloroplombate(II) C6H16N2OPbCl4. Inorg. Chim. Acta 2018, 476, 38–45. [Google Scholar] [CrossRef]
  53. Wu, L.M.; Wu, X.T.; Chen, L. Structural overview and structure–property relationships of iodoplumbate and iodobismuthate. Coord. Chem. Rev. 2009, 253, 2787–2804. [Google Scholar] [CrossRef]
  54. Adonin, S.A.; Sokolov, M.N.; Fedin, V.P. Polynuclear halide complexes of Bi (III): From structural diversity to the new properties. Coord. Chem. Rev. 2016, 312, 1–21. [Google Scholar] [CrossRef]
  55. Potheher, I.V.; Rajarajan, K.; Jeyasekaran, R.; Vimalan, M.; Yogam, F.; Sagayaraj, P. Growth, Optical, Thermal and Conductivity Behavior of Nonlinear Optical Single Crystals of CdHg(SCN)4(CH3OC2H5O). J. Therm. Anal. Calorim. 2013, 111, 1491–1497. [Google Scholar] [CrossRef]
  56. Ahmad, N.; Ahmad, M.M.; Kotru, P.N. Single crystal growth by gel technique and characterization of lithium hydrogen tartrate. J. Cryst. Growth 2015, 412, 72–79. [Google Scholar] [CrossRef]
  57. Rajagopal, B.; Sharma, A.V.; Ramana, M.V. Electric and FTIR studies on magnesium hydrogen maleate hexahydrate (MHMH) single crystals. Scholars Research Library. Arch. Appl. Sci. Res. 2011, 3, 321–326. [Google Scholar]
  58. Mahfoudh, N.; Karoui, K.; Khirouni, K.; Ben Rhaiem, A. Optical, electrical properties and conduction mechanism of [(CH3)2NH2]2ZnCl4 compound. Physica B Condens. Matter. 2018, 554, 126–136. [Google Scholar] [CrossRef]
  59. Karoui, K.; Ben Rhaiem, A.; Guidara, K. Electrical characterization of the [N(CH3)4][N(C2H5)4] ZnCl4compound. Ionics 2011, 17, 517–525. [Google Scholar] [CrossRef]
  60. Singh, S.; Ralhan, N.K.; Kotnala, R.K.; Verma, K.C. Nanosize dependent electrical and magnetic properties of NiFe2O4 ferrite. Indian J. Pure Appl. Phys. 2012, 50, 739–743. [Google Scholar]
  61. Karoui, K.; Rhaiem, A.B.; Hlel, F.; Arous, M.; Guidara, K. Dielectric and electric studies of the [N(CH3)4][N(C2H5)4]ZnCl4 compound at low temperature. Mater. Chem. Phys. 2012, 133, 1–7. [Google Scholar] [CrossRef]
  62. Sinclair, D.C.; West, A.R. Impedance and modulus spectroscopy of semiconducting BaTiO3 showing positive temperature coefficient of resistance. J. Appl. Phys. 1989, 66, 3850–3856. [Google Scholar] [CrossRef]
  63. Mohamed, C.B.; Karoui, K.; Jomni, F.; Guidara, K.; Rhaiem, A.B. Electrical properties and conduction mechanism of [C2H5NH3]2CuCl4 compound. J. Mol. Struct. 2015, 1082, 38–48. [Google Scholar] [CrossRef]
  64. Rao, K.S.; Prasad, D.M.; Krishna, P.M.; Tilak, B.; Varadarajulu, K.C. Impedance and modulus spectroscopy studies on Ba0. 1Sr0.81La0.06Bi2Nb2O9ceramic. Mater. Sci. Eng. B 2006, 133, 141–150. [Google Scholar]
  65. Chandra, K.P.; Prasad, K.; Gupta, R.N. Impedance spectroscopy study of an organic semiconductor: Alizarin. Phys. B Condens. Matter 2007, 388, 118–123. [Google Scholar] [CrossRef]
  66. Rao, K.S.; Krishna, P.M.; Prasad, D.M.; Lee, J.H.; Kim, J.S. Electrical, electromechanical and structural studies of lead potassium samarium niobateceramics. J. Alloys. Compd. 2008, 464, 497–507. [Google Scholar] [CrossRef]
  67. Mansour, S.A.; Yahia, I.S.; Sakr, G.B. Electrical conductivity and dielectric relaxation behavior of fluorescein sodium salt (FSS). Solid State Commun. 2010, 150, 1386–1391. [Google Scholar] [CrossRef]
  68. Hangloo, V.; Tickoo, R.; Bamzai, K.K.; Kotru, P.N. Dielectric characteristics of mixed Gd–Ba molybdate crystals grown at ambient temperatures by the gel encapsulation technique. Mater. Chem. Phys. 2003, 81, 152–159. [Google Scholar] [CrossRef]
  69. Borsa, F.; Torgeson, D.R.; Martin, S.W.; Patel, H.K. Relaxation and fluctuations in glassy fast-ion conductors: Wide-frequency-range NMR and conductivity measurements. Phys. Rev. B 1992, 46, 795. [Google Scholar] [CrossRef] [PubMed] [Green Version]
  70. Braca, A.; De Tommasi, N.; Di Bari, L.; Pizza, C.; Politi, M.; Morelli, I. Antioxidant Principles from Bauhinia tarapotensis. J. Nat. Prod. 2001, 64, 892–895. [Google Scholar] [CrossRef]
Figure 1. Experimental powder XRD pattern of (C5H14N2)[HgCl4]·H2O compared with theoretical PXRD pattern.
Crystals 12 00486 g001
Figure 2. The asymmetric unit of (C5H14N2)[HgCl4]·H2O.
Crystals 12 00486 g002
Figure 3. Perspective view of the (C5H14N2)[HgCl4]·H2O compound (the red and blue lines represent hydrogen bonds).
Crystals 12 00486 g003
Figure 4. (a)The intermolecular H-bonds between the organic cation (homopiperazinium) and chlorine anion (Cl), between the organic cation and H2O molecule, and between the water molecule and chlorine anion; (b) the different ring motifs in (C5H14N2)[HgCl4]·H2O.
Crystals 12 00486 g004
Figure 5. HS mapped over dnorm (a), curvedness (b), and shape index (c) surfaces.
Crystals 12 00486 g005
Figure 6. H-Bonds present in the (C5H14N2)[HgCl4]·H2O compound.
Crystals 12 00486 g006
Figure 7. Relative contributions of various intermolecular interactions to the Hirshfeld surface area of (C5H14N2)[HgCl4]·H2O: (a) H…Cl/Cl…H contacts; (b) H…H contacts; (c) H…O/O…H contacts; (d) Hg…Cl/Cl…Hg contacts; (e) Cl…Cl contacts; (f) Hg…H/H…Hg contacts.
Crystals 12 00486 g007
Figure 8. The crystal voids: 0.002 a.u. electron-density isosurfaces.
Crystals 12 00486 g008
Figure 9. IR absorption spectrum of (C5H14N2)[HgCl4]·H2O.
Crystals 12 00486 g009
Figure 10. PL spectrum of (C5H14N2)[HgCl4]·H2O.
Crystals 12 00486 g010
Figure 11. TGA-DTA curves for (C5H14N2)[HgCl4]·H2O.
Crystals 12 00486 g011
Figure 12. (a,b) ε′ as a function of ln(f); (c,d) ε″ as function of ln(f).
Crystals 12 00486 g012
Figure 13. (a)-–Z″ versus Z′ of (C5H14N2)[HgCl4]·H2O at the range of 311–363 K; (b) Illustrative representation of –Z″ versus Z′ of (C5H14N2)[HgCl4]·H2O at 363, 355 and 348 K; (c)—Z″ versus Z′ of (C5H14N2)[HgCl4]·H2O at the range of 373–403 K.
Crystals 12 00486 g013
Figure 14. (a) Z′ (real part of impedance) versus ln(f) in the range of 373–403 K of (C5H14N2)[HgCl4]·H2O; (b) Z″ (imaginary part of impedance) versus ln(f) in the range of 373–403 K of (C5H14N2)[HgCl4]·H2O.
Crystals 12 00486 g014
Figure 15. (a) Ln (σ.T) versus 1000/T for (C5H14N2)[HgCl4]·H2O in the grain conduction; (b) Ln (σ.T) versus 1000/T for (C5H14N2)[HgCl4]·H2O in the grain boundary conduction. Such as the first part (I) is located in the region of temperatures below 363 K, while the second part (II) is placed in the region of temperatures above 373 K.
Crystals 12 00486 g015
Figure 16. (a,b) Variation of M′ (real part of the electrical modulus) versus ln(f) of (C5H14N2)[HgCl4]·H2O at various temperatures; (c,d) variation of M″ (imaginary part of the electrical modulus) versus ln(f) of (C5H14N2)[HgCl4]·H2O at various temperatures.
Crystals 12 00486 g016
Figure 17. Inhibition (%) as a function of concentrations of (C5H14N2)[HgCl4]·H2O and of Trolox.
Crystals 12 00486 g017
Table 1. The results obtained by the X-ray diffraction analysis on a single crystal.
Crystal Data
Chemical formula(C5H14N2)[HgCl4]·H2O
Molar mass (g·mol−1)462.59
Crystal system, space groupMonoclinic, P21/c
Temperature (K)293
a, b, c(Å)6.272 (3), 12.480 (6), 15.984 (9)
β (°)94.386 (6)
V (Å3)1247.5 (11)
Z4
Radiation typeMo
µ (mm−1)13.16
Crystal size (mm)0.45 × 0.3 × 0.2
Form, ColorPrism, colorless
Data Collection
Diffractometer
Absorption correction
Rigaku Mercury CCD2
Multi-scan
Tmin, Tmax
Limits h, k, l
0.048, 0.071
h = −8–8
k = −16–13
l = −17–20
No. of measured, independent, and observed (I > 2σ(I)) reflections9371, 2829, 2214
Rint0.061
(sinθ/λ)max−1)0.649
Refinement
R[F2 > 2σ(F2)], wR (F2), S0.035, 0.089, 1.07
No. of reflections2829
No. of parameters119
∆ρmin, ∆ρmax(e·Å−3)−1.50, 1.47
CCDC No.2155598
Table 2. EXY(enrichment reports) of (C5H14N2)[HgCl4]·H2O.
AtomsHgClOH
% Surface1.832.354.0561.6
Hg 2.15 0.50
Cl 0.12 1.49
O 1.62
H 0.72
Publisher’s Note: MDPI stays neutral with regard to jurisdictional claims in published maps and institutional affiliations.

