Article

The Effect of Extrusion Temperatures on Microstructure and Mechanical Properties of Mg-1.3Zn-0.5Ca (wt.%) Alloys

1
Department of Mechanical Engineering, North Carolina A&T State University, Greensboro, NC 27411, USA
2
Hopkins Extreme Materials Institute, The Johns Hopkins University, Baltimore, MD 21218, USA
*
Author to whom correspondence should be addressed.
Crystals 2021, 11(10), 1228; https://doi.org/10.3390/cryst11101228
Submission received: 15 September 2021 / Revised: 7 October 2021 / Accepted: 7 October 2021 / Published: 12 October 2021

Abstract

:
The present work mainly investigated the effect of extrusion temperatures on the microstructure and mechanical properties of Mg-1.3Zn-0.5Ca (wt.%) alloys. The alloys were subjected to extrusion at 300 °C, 350 °C, and 400 °C with an extrusion ratio of 9.37. The results demonstrated that both the average size and volume fraction of dynamic recrystallized (DRXed) grains increased with increasing extrusion temperature (DRXed fractions of 0.43, 0.61, and 0.97 for 300 °C, 350 °C, and 400 °C, respectively). Moreover, the as-extruded alloys exhibited a typical basal fiber texture. The alloy extruded at 300 °C had a microstructure composed of fine DRXed grains of ~1.54 µm and strongly textured elongated unDRXed grains. It also had an ultimate tensile strength (UTS) of 355 MPa, tensile yield strength (TYS) of 284 MPa, and an elongation (EL) of 5.7%. In contrast, after extrusion at 400 °C, the microstructure was almost completely DRXed with a greatly weakened texture, resulting in an improved EL of 15.1% and UTS of 274 MPa, TYS of 220 MPa. At the intermediate temperature of 350 °C, the alloy had a UTS of 298 MPa, TYS of 234 MPa, and EL of 12.8%.

Graphical Abstract

1. Introduction

Magnesium (Mg) and its alloys have attracted great interest for potential applications in the automotive and aerospace industries due to their low density and high specific strength [1]. However, the poor formability at room temperature and insufficient mechanical properties have severely limited their widespread applications.
Thermomechanical processing has been proven to be an effective method for improving the mechanical properties of Mg alloys through grain refinement and texture control, especially severe plastic deformation (SPD) methods, such as equal channel angular pressing (ECAP) [2], multi-directional forging (MDF) [3], high-pressure torsion (HPT) [4], or accumulative roll-bonding (ARB) [5]. However, these SPD processes are not suited for continuous manufacturing. In comparison, extrusion processing is the most commonly used, effective, and well-accepted method to enhance the mechanical properties of Mg alloys. A variety of Mg alloys have been investigated via extrusion, including rare earth (RE)-containing and RE-free alloys. After extrusion, RE-containing alloys obtained superior mechanical properties, for example, Mg-1.5Zn-0.25Gd (wt.%) with an ultimate tensile strength (UTS) of 417 MPa, tensile yield strength (TYS) of 395 MPa, and elongation (EL) of 8.3% [6]; also, Mg-1.8Gd-1.8Y-0.7Zn-0.2Zr (wt.%) with a UTS of 542 MPa, TYS of 473 MPa, and EL of 8.0% [7]. However, due to the high cost and natural resource scarcity of RE elements, RE-free Mg alloys would be much more competitive for large-scale industry applications [8].
Most recently, Mg-Zn-Ca system alloys have received great attention because of their good precipitation hardening and aging hardening effects [9,10], low cost and creep resistance [11,12], as well as excellent biodegradability [13,14]. Du et al. [15] achieved high strength (UTS of 305 MPa, TYS of 292 MPa, and EL of 10.3%) in Mg-4.5Zn-1.1Ca (wt.%) alloys after extrusion at 300 °C with an extrusion ratio of 12, which resulted in fine dynamically recrystallized (DRXed) grains with strong basal texture. Tong et al. [16] investigated Mg-5.3Zn-0.6Ca (wt.%) extruded at 300 °C with an extrusion speed of 0.1 mm/s showing an excellent combination of strength and ductility with a UTS of 279 MPa, TYS of 220 MPa and EL of 21.4% owing to fine-grain and solid-solution strengthening. Similarly, Zhang et al. [17] reported that, for Mg-1.0Zn-0.5Ca (wt.%) alloys, they obtained high strength with a UTS of 300 MPa after extrusion at 310 °C because of grain refinement and the appearance of a strong basal texture. In fact, the mechanical properties of extruded Mg alloys are strongly dependent on the extrusion parameters, such as extrusion speed, extrusion ratio, and extrusion temperature. Among them, extrusion temperature is the most significant parameter that directly determines the resultant microstructure, texture, and mechanical properties. Li et al. [18] studied Mg-3.0Zn-0.2Ca (wt.%) using an extrusion ram speed of 17 mm/s at different temperatures (25 °C, 150 °C, 250 °C, and 300 °C), and the results showed that the grain size of the DRXed region monotonically increased with increasing extrusion temperature, but the change in the texture intensity was not monotonic, it increased first then subsequently decreased.
Most of the previous works concentrated on the behavior of Mg-Zn-Ca alloys with a highest extrusion temperature of 300 °C. But systematic investigations of the higher extrusion temperature (>300 °C) behavior of Mg-Zn-Ca alloys have rarely been reported. Therefore, in this work, the relationship between the use of high extrusion temperatures (300–400 °C) and the microstructural evolution as well as the mechanical properties of Mg-1.3Zn-0.5Ca (wt.%) were investigated.

2. Materials and Methods

Alloys with a composition of Mg-1.3Zn-0.5Ca (wt.%) (hereafter, identified as ZX10) were fabricated by melting high purity Mg (99.97%, US Magnesium, Salt Lake, UT, USA) and Zn (99.999%, Alfa Aesar, Ward Hill, MA, USA) and Ca (99.5%, Alfa Aesar, Ward Hill, MA, USA) at 730 °C and casting into a pre-heated steel permanent mold with a diameter of 40 mm in an argon-filled glove box as was done previously for other Mg-based alloys [19]. Cylinders, 38.0 mm in diameter and 50.0 mm in height, were machined from the ingots after being homogenized at 320 °C × 20 h + 430 °C × 24 h and being quenched into water. In turn, these homogenized cylinders were extruded at 300 °C, 350 °C, and 400 °C using an indirect extrusion method with an extrusion ratio of 9.37, and a ram speed of 0.1 mm/s. The cross-section of the extruded bar is 11 mm × 11 mm.
The microstructure was characterized using optical microscopy (OM, AxioImager m2m, Carl Zeiss, Jenna, Germany), scanning electron microscopy (SEM, Hitachi, SU8000, Tokyo, Japan), an equipped energy dispersive X-ray spectroscopy (EDS) detector (X-MaxN 50, Oxford Instruments, High Wycombe, UK), and an electron backscattered diffraction (EBSD) detector (Symmetry TM, Oxford Instruments. High Wycombe, UK). For the as-extruded ZX10 alloy, the observation position for microstructure analysis was selected to be at the center of the sample parallel to the extrusion direction (ED). The metallographic samples were prepared by standard mechanical grinding with SiC papers from 30 µm to 1 µm grit size and final polishing with 0.05 µm grit Al2O3 suspension. The polished samples were then etched using etchant (10 mL acetic acid + 4.2 g picric acid + 10 mL water + 70 mL ethanol) for OM observation. The samples for EBSD were first polished in the same manner as for OM, followed by further polishing in the ion mill (Fischione Instruments, Model1061 SEM Mill, Export, PA, USA) for 25 min with the parameters of 3 kV and 3° tilt angle. EBSD measurements were performed at 15 kV and 20 µA with a step size of 0.5–1.5 µm. The EBSD data were post-processed by Aztec Crystal software (version 2.0) [20] and MTEX Matlab Toolbox (MTEX 5.7.0) [21]. The grain size and volume fraction of the DRXed and secondary phases were statistically calculated by Image Pro-Plus software. To ensure adequate statistics, at least four images were used for the calculation.
The mechanical properties of ZX10 alloy were evaluated using an Instron 5569 universal testing machine with a tensile strain rate of 0.001 s−1. Dog-bone shape tensile specimens of 3 mm thick and 15 mm gauge section were cut from the as-extruded alloy samples along the ED. The tests were repeated for three specimens to ensure the accuracy and reliability of the tensile results, and then the average values were calculated. After the tests, the fractured surfaces of the specimens were further investigated by OM and SEM.

3. Results

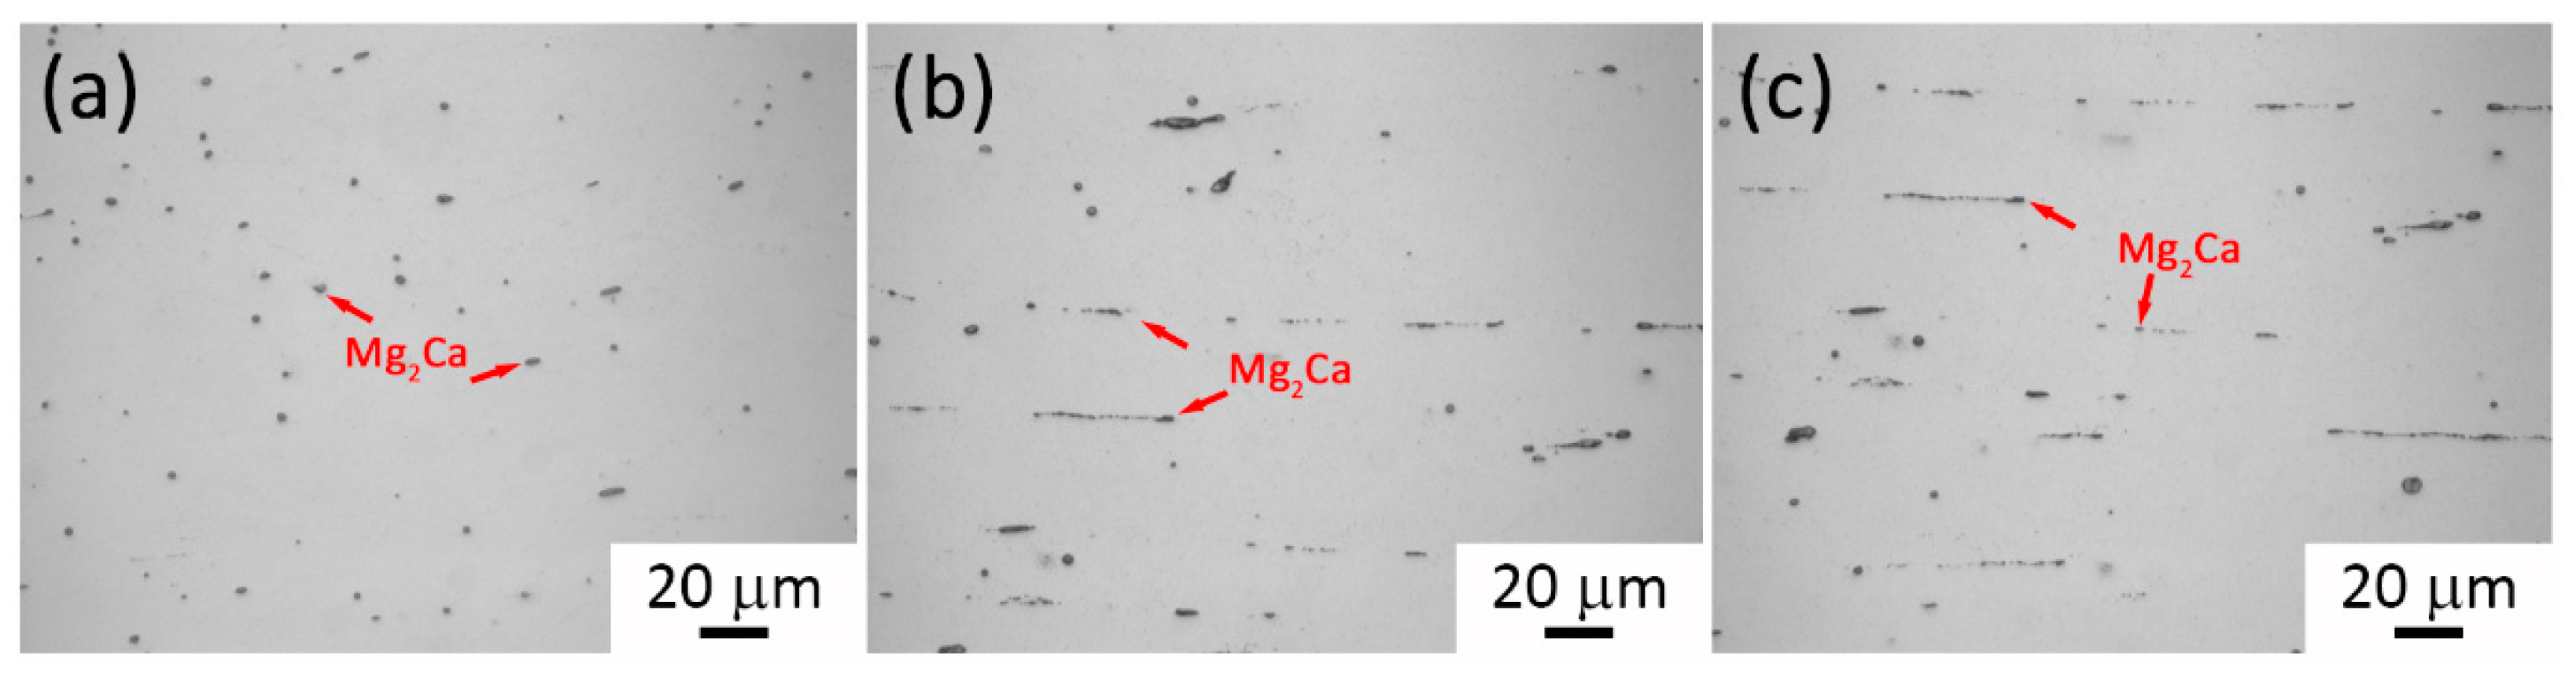
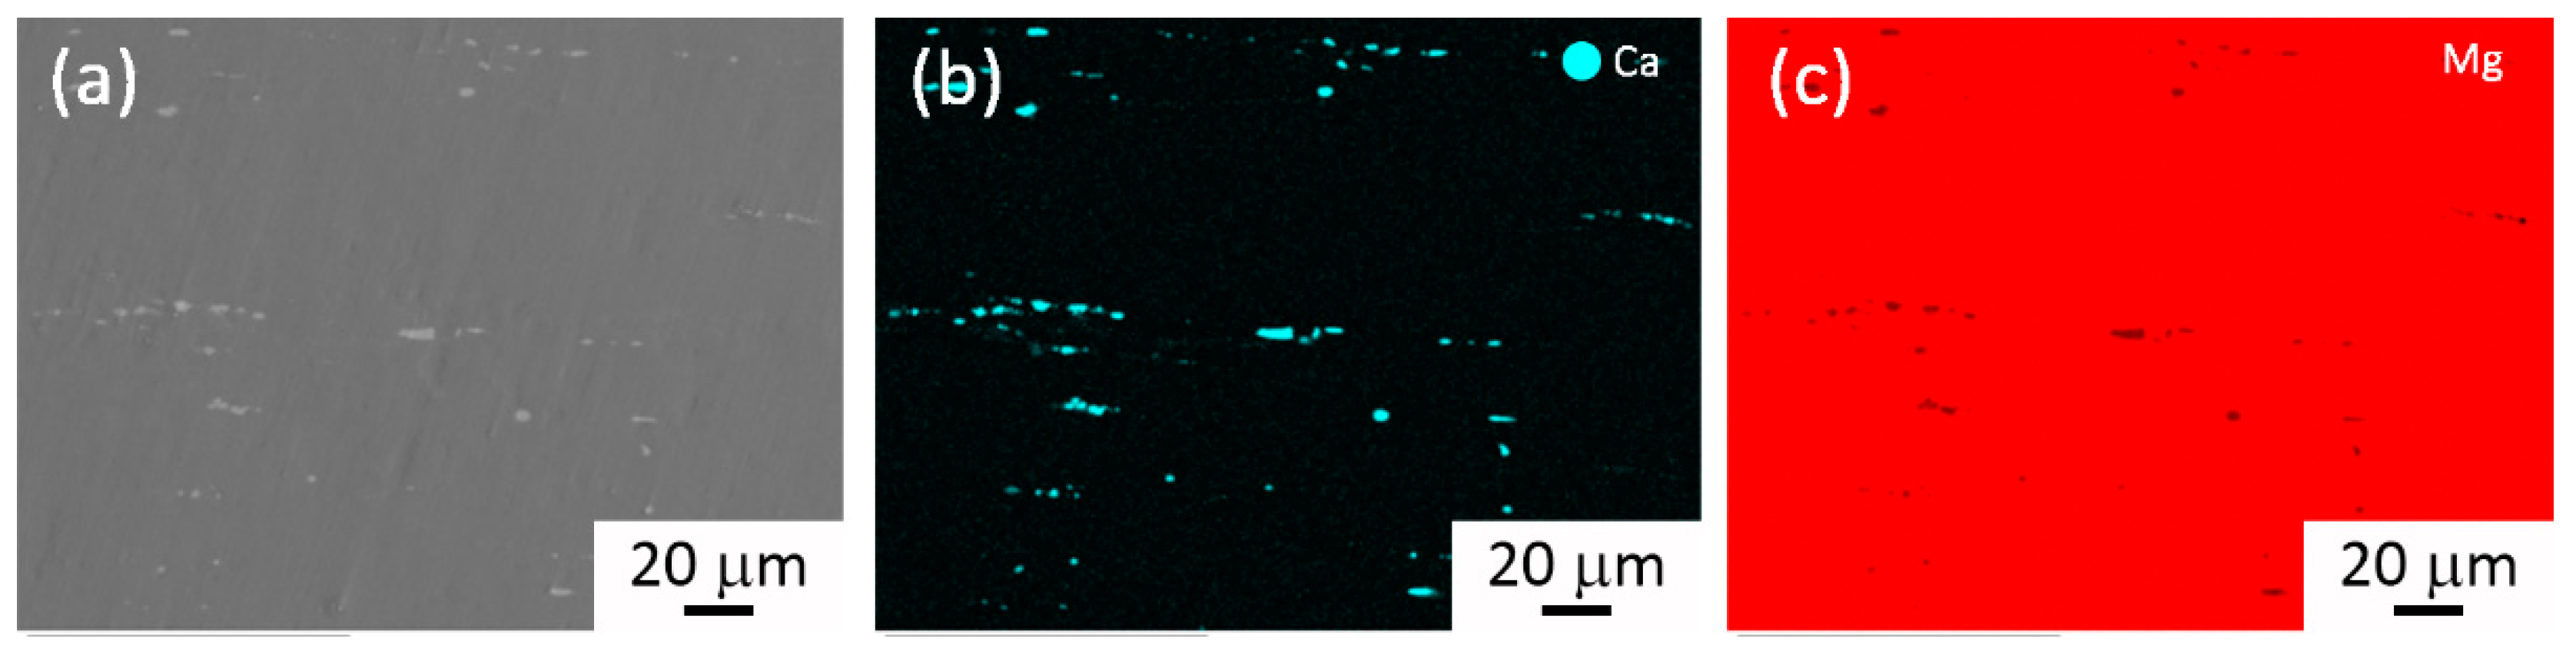
3.1. As-Cast and Homogenized Microstructure of ZX10 Alloy

Figure 1 depicts the optical microstructure and EDS analysis results of the as-cast ZX10 alloy. The figures show that the grain size of the as-cast ZX10 alloy was about ~300 µm, while many second phase particles in the form of continuous networks were distributed near grain boundaries (GB) and within the grain interiors (Figure 1a). According to the point detection (Figure 1b) and elemental mapping (Figure 1c–e), the second phase precipitates (~10 µm in size) consisted mainly of Ca and Mg. The corresponding EDS point analysis results (Figure 1f) revealed a relatively high amount of element Ca in these phases, which is much higher than element Zn. It was reported that Ca2Mg6Zn3 and Mg2Ca intermetallic are commonly observed for Mg-Zn-Ca alloys with higher contents of Zn and Ca (Zn/Ca wt.% > 2) [22,23]. In addition, Nie et al. [9] reported that Mg2Ca was the primary intermetallic phase in the as-cast low content Mg-1Zn-1Ca (wt.%) alloys with a small amount of Zn dissolved in these particles. The ratio of Mg: Ca varies between 2.46 (point 1) and 3.64 (point 4). In the absence of other intermetallic phases in the Mg-Ca system, for the ZX10 alloy, the second phase was considered to be Mg2Ca.
Figure 2 shows optical micrographs of the homogenized ZX10 alloy. It can be seen that the grain size was still around 300 µm, and the second phase particles, formed in the as-cast state, were mostly dissolved into the Mg matrix, leaving a very limited number of particles at the grain boundaries and inside the grains. This is because Mg2Ca has a very high melting point (714 °C [24]), and is often difficult to completely dissolve into the Mg matrix.

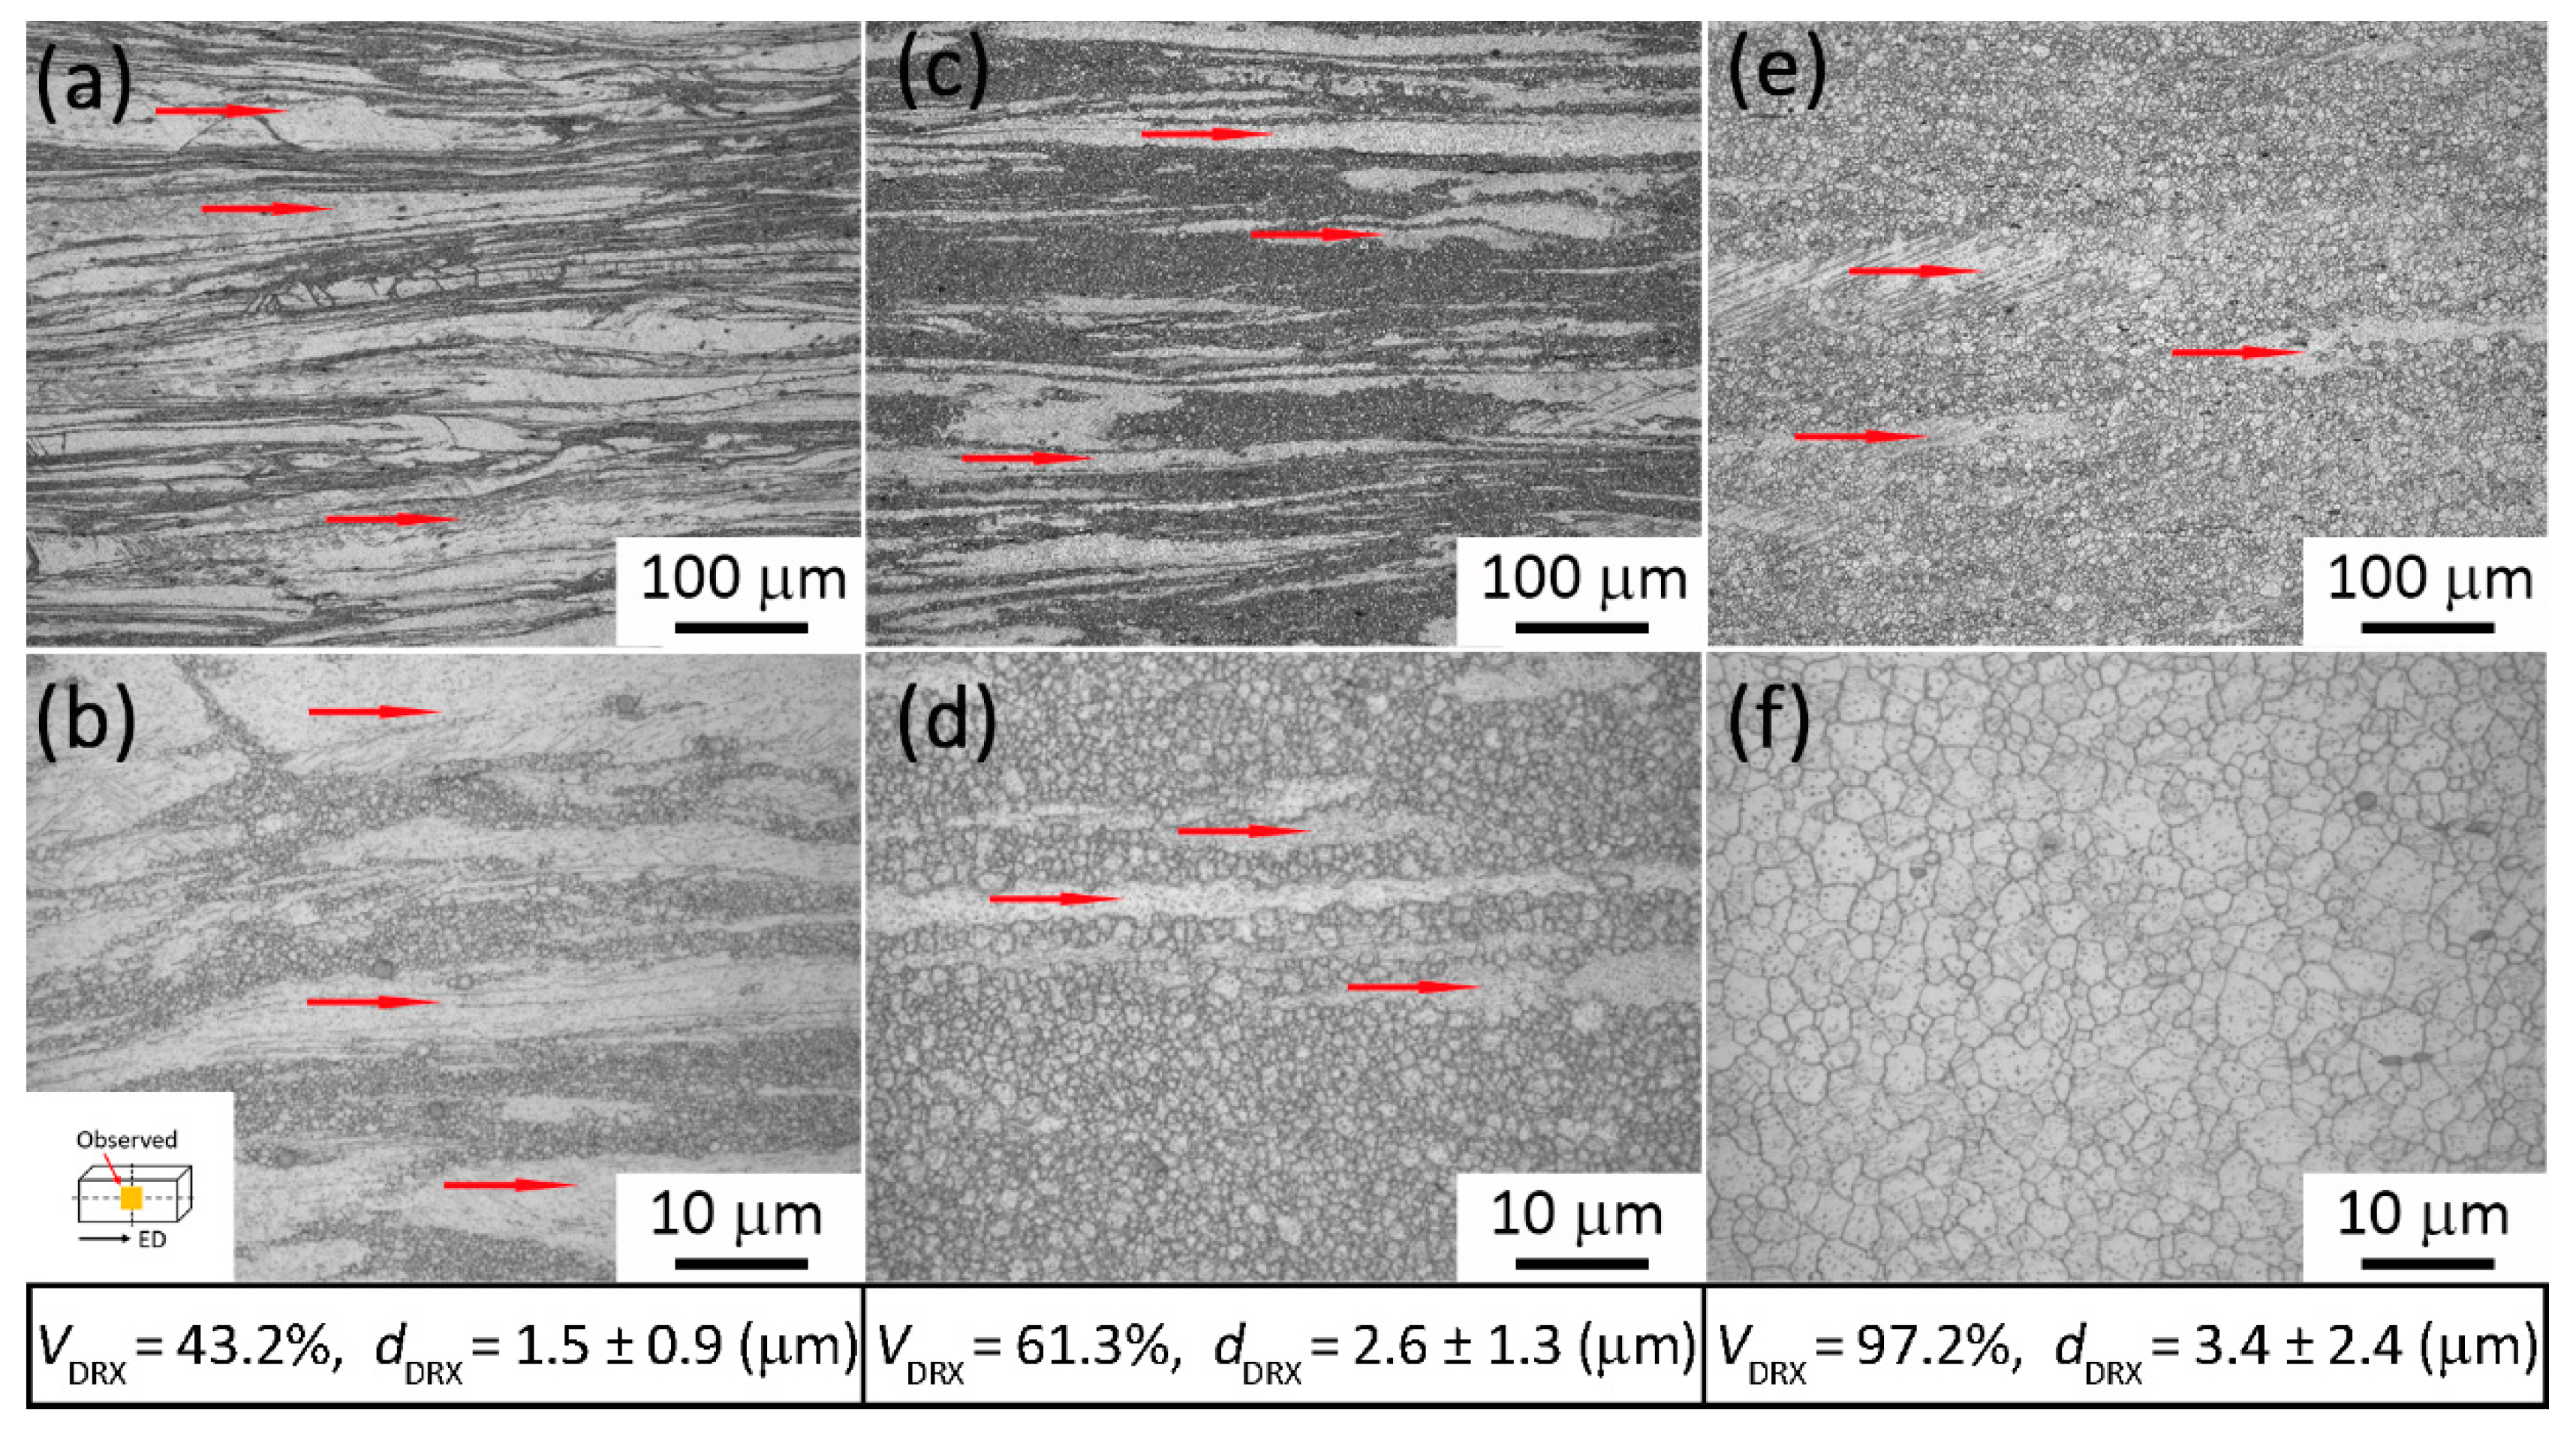
3.2. As-Extruded Microstructure of ZX10 Alloy

Figure 3 shows the optical micrographs of the as-extruded ZX10 alloy without etching. It can be seen that the distribution of the coarse precipitates with a size of 1–3 μm was preferential, and they still exist, aligned along the ED. SEM was used to further analyze the composition of the second phase. As seen in Figure 4, the second phase was mainly composed of Ca and Mg, which is also considered Mg2Ca. The microstructures after etching are also shown in Figure 5. Compared to the as-homogenized state in Figure 2, the microstructures of the as-extruded ZX10 alloy had been greatly refined due to the occurrence of DRX during extrusion processing. Meanwhile, it is obvious to note that the as-extruded ZX10 alloy exhibits a bimodal microstructure, consisting of mostly equiaxed DRXed regions with fine grains and unDRXed areas with elongated grains that appear as stripes. More importantly, the degree of DRX and the grain size of DRXed regions were different in the as-extruded ZX10 alloy, processed at different extrusion temperatures. Ultrafine DRXed grains with an average size of 1.5 µm were attained when extruded at 300 °C, but the volume fraction of the DRXed grains (VDRX) was relatively low (43.2%). As the extrusion temperature increased to 350 °C and 400 °C, the average grain size of DRXed region increased to 2.6 µm and 3.4 µm, and the VDRX also apparently increased to 61.3% and 97.2%, respectively, as depicted in Figure 5. The inverse pole figure (IPF) maps of the as-extruded ZX10 alloy and corresponding grain size distributions obtained by EBSD are given in Figure 6. It shows clearly that the VDRX and the grain size of DRXed regions gradually increased with extrusion temperatures from 300 °C to 400 °C.

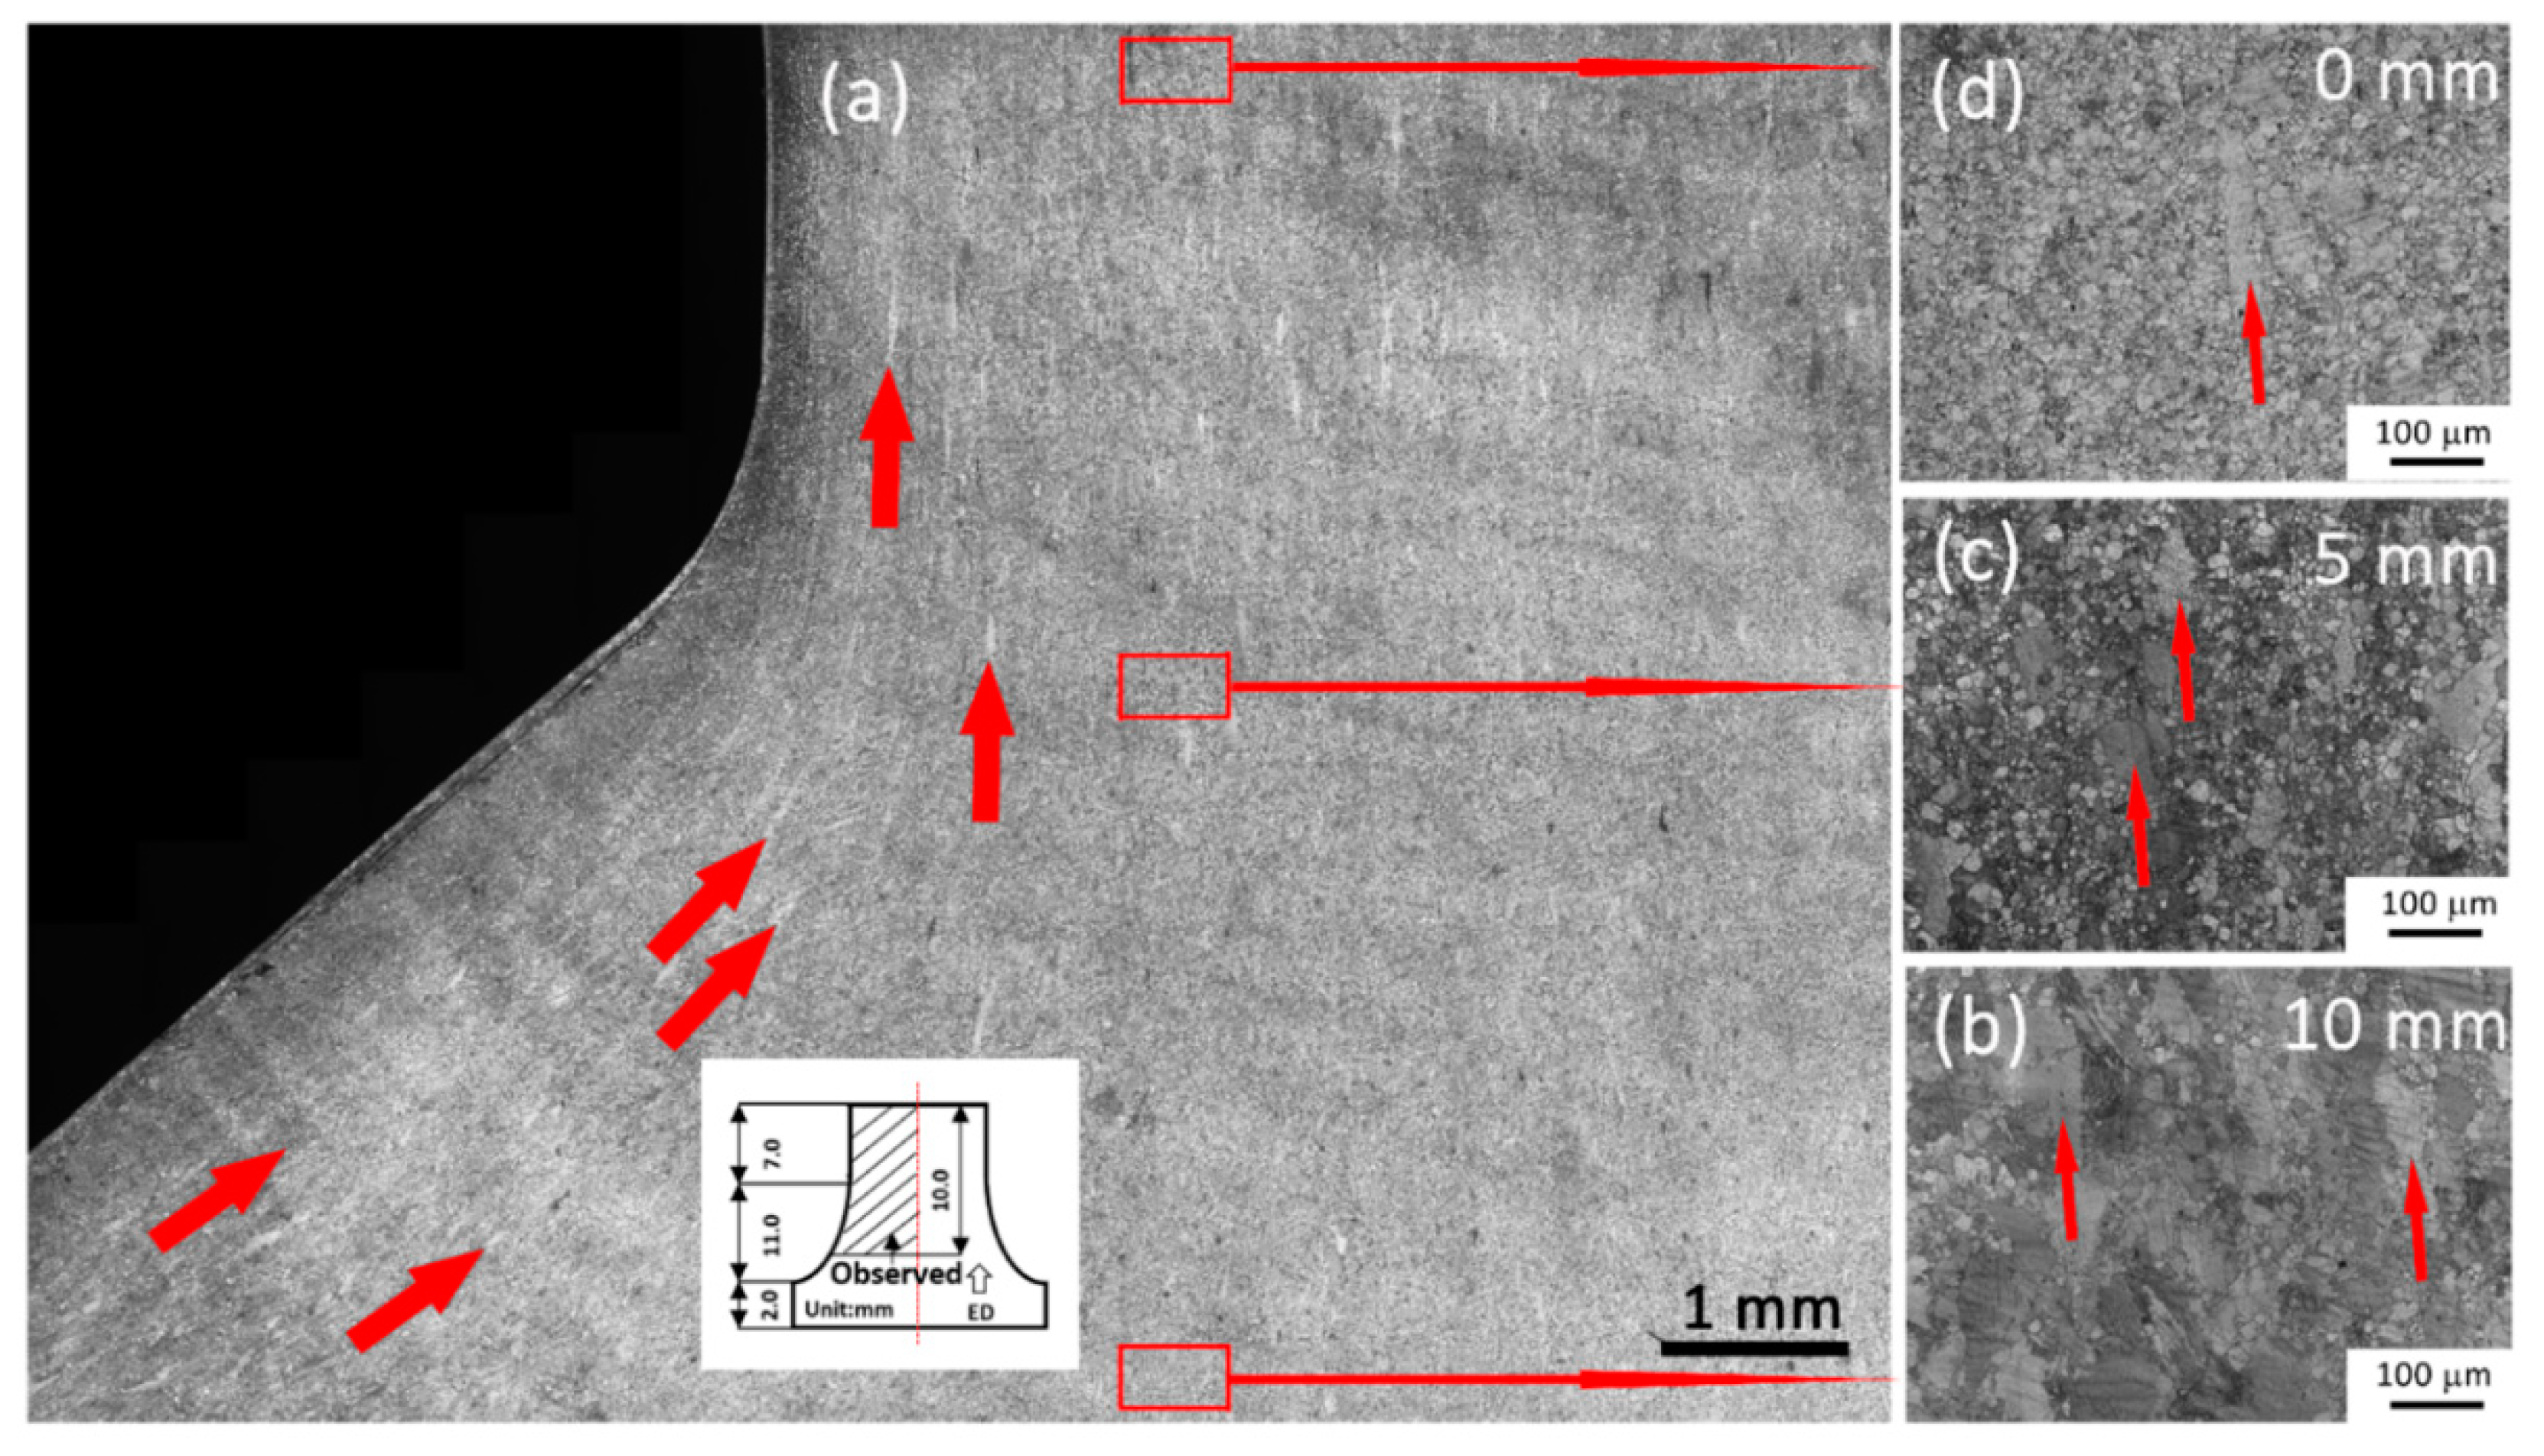
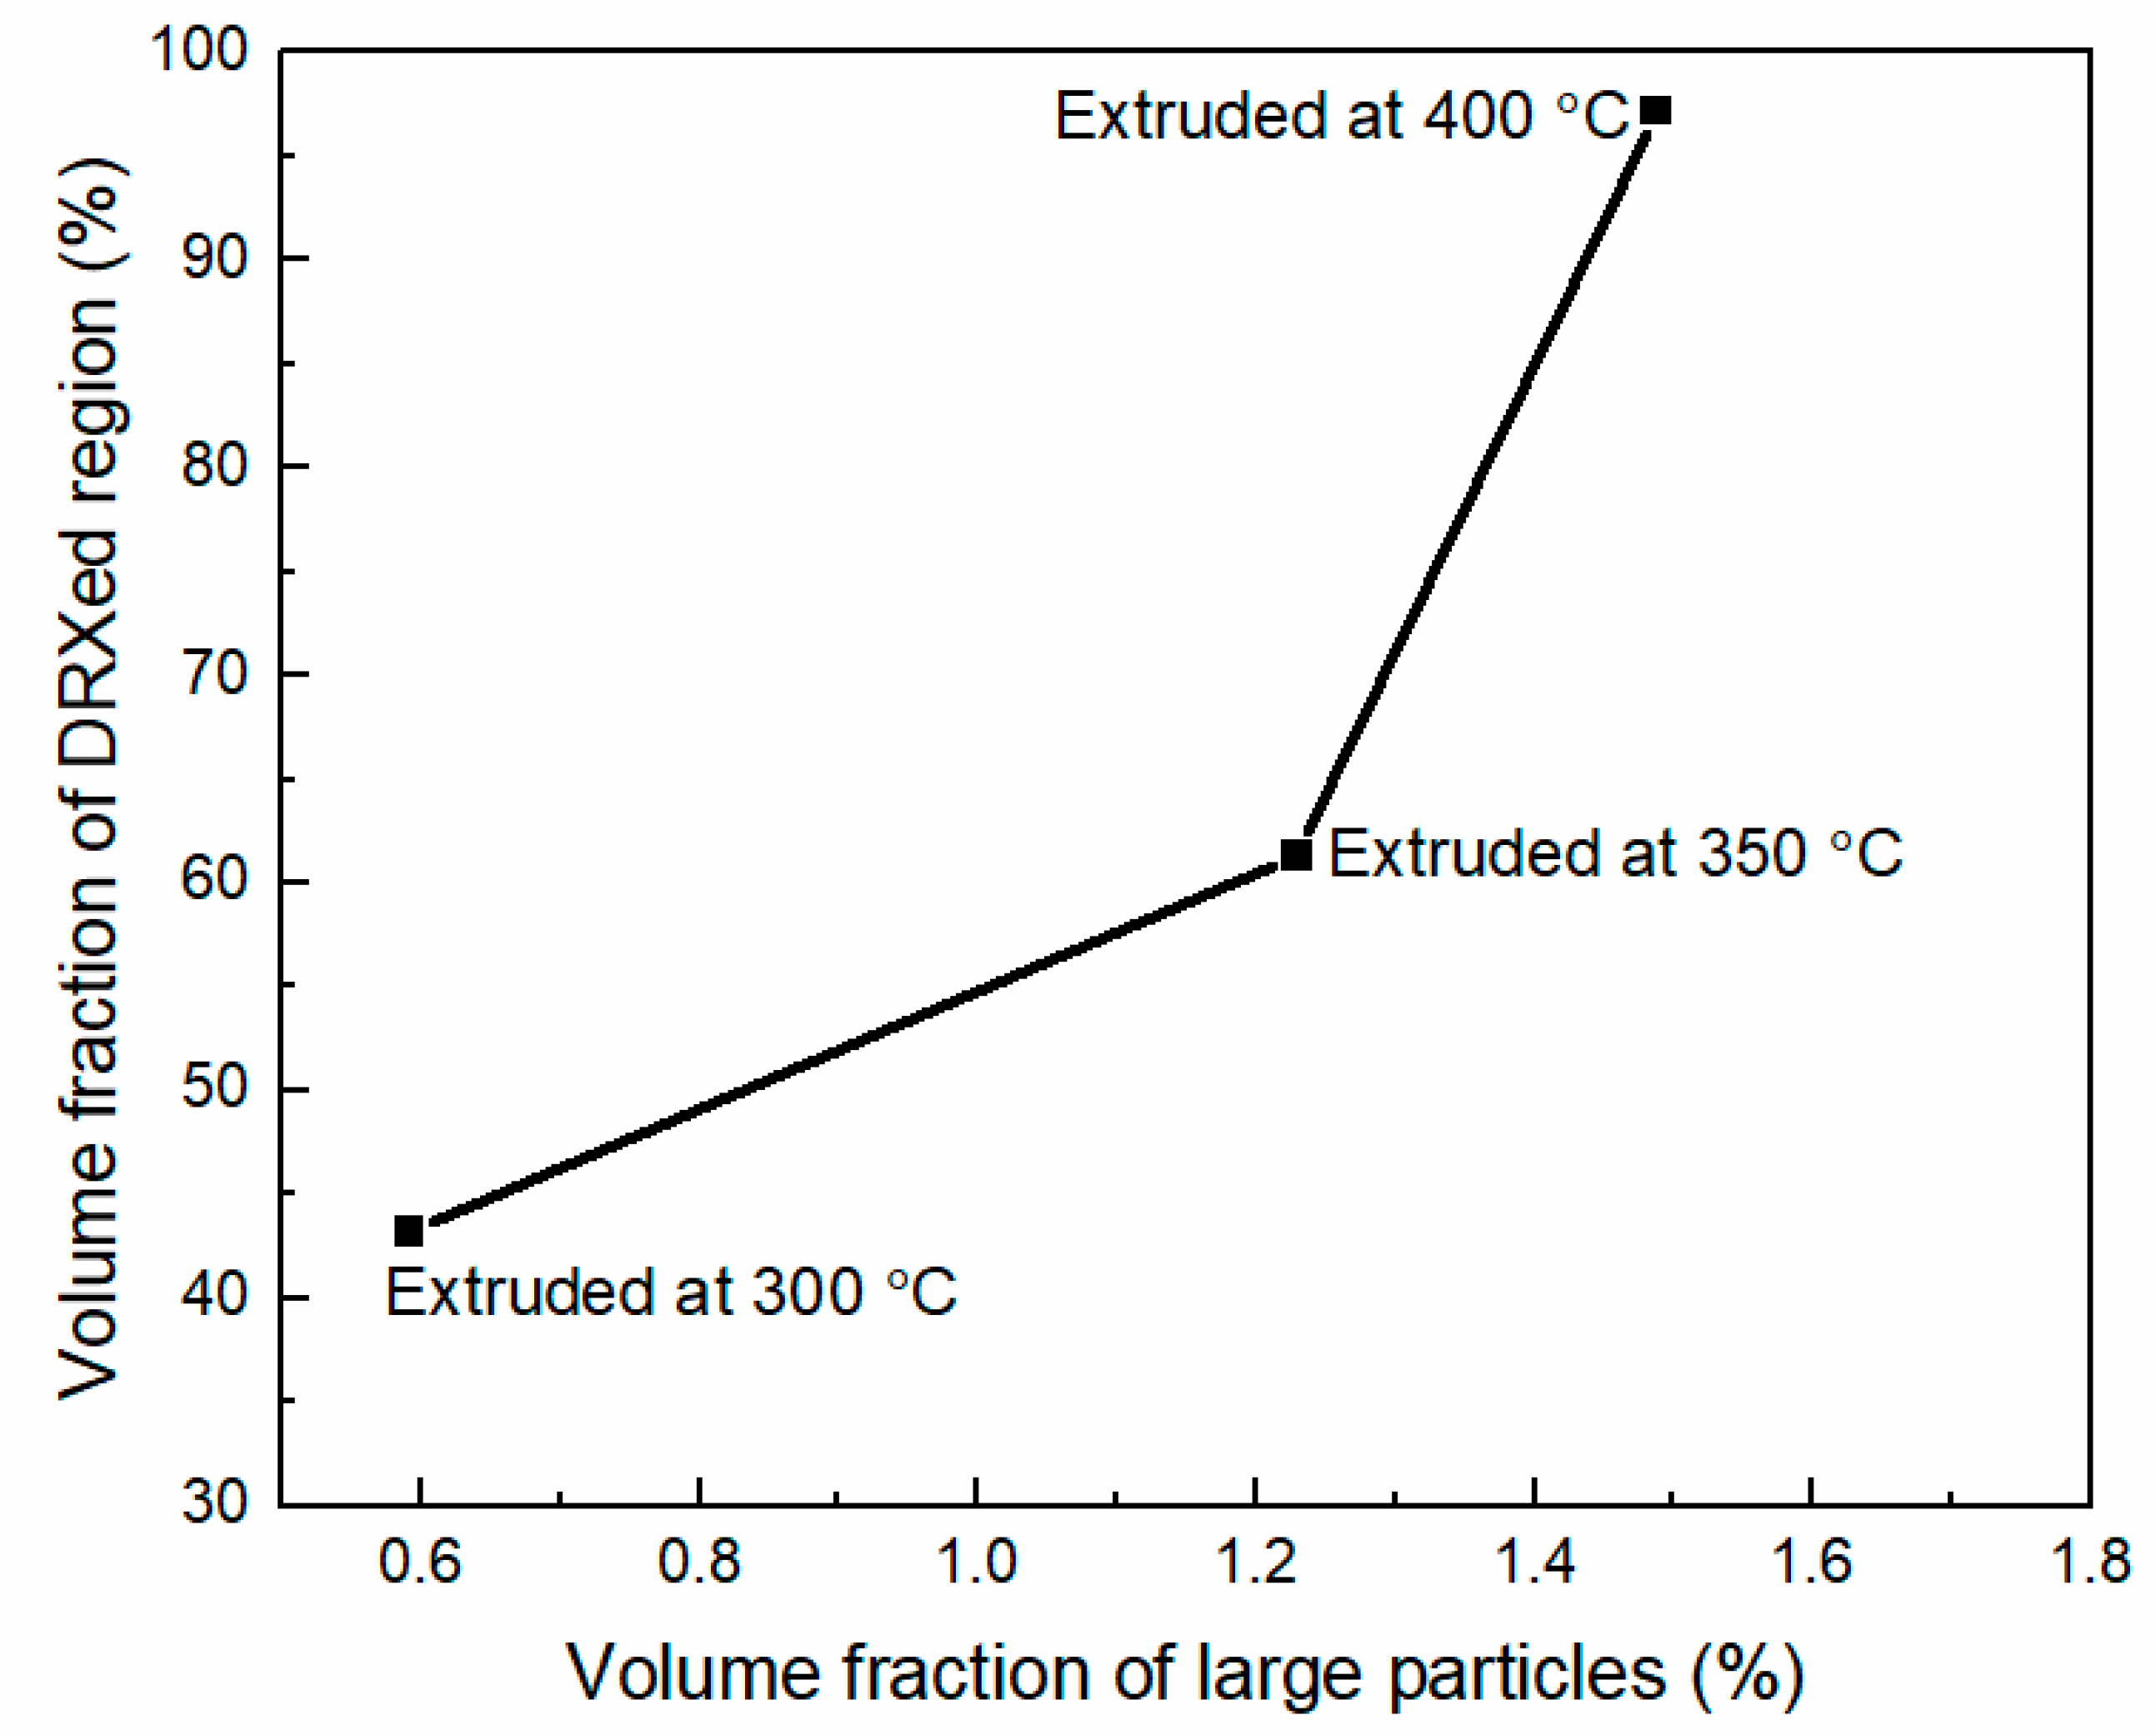
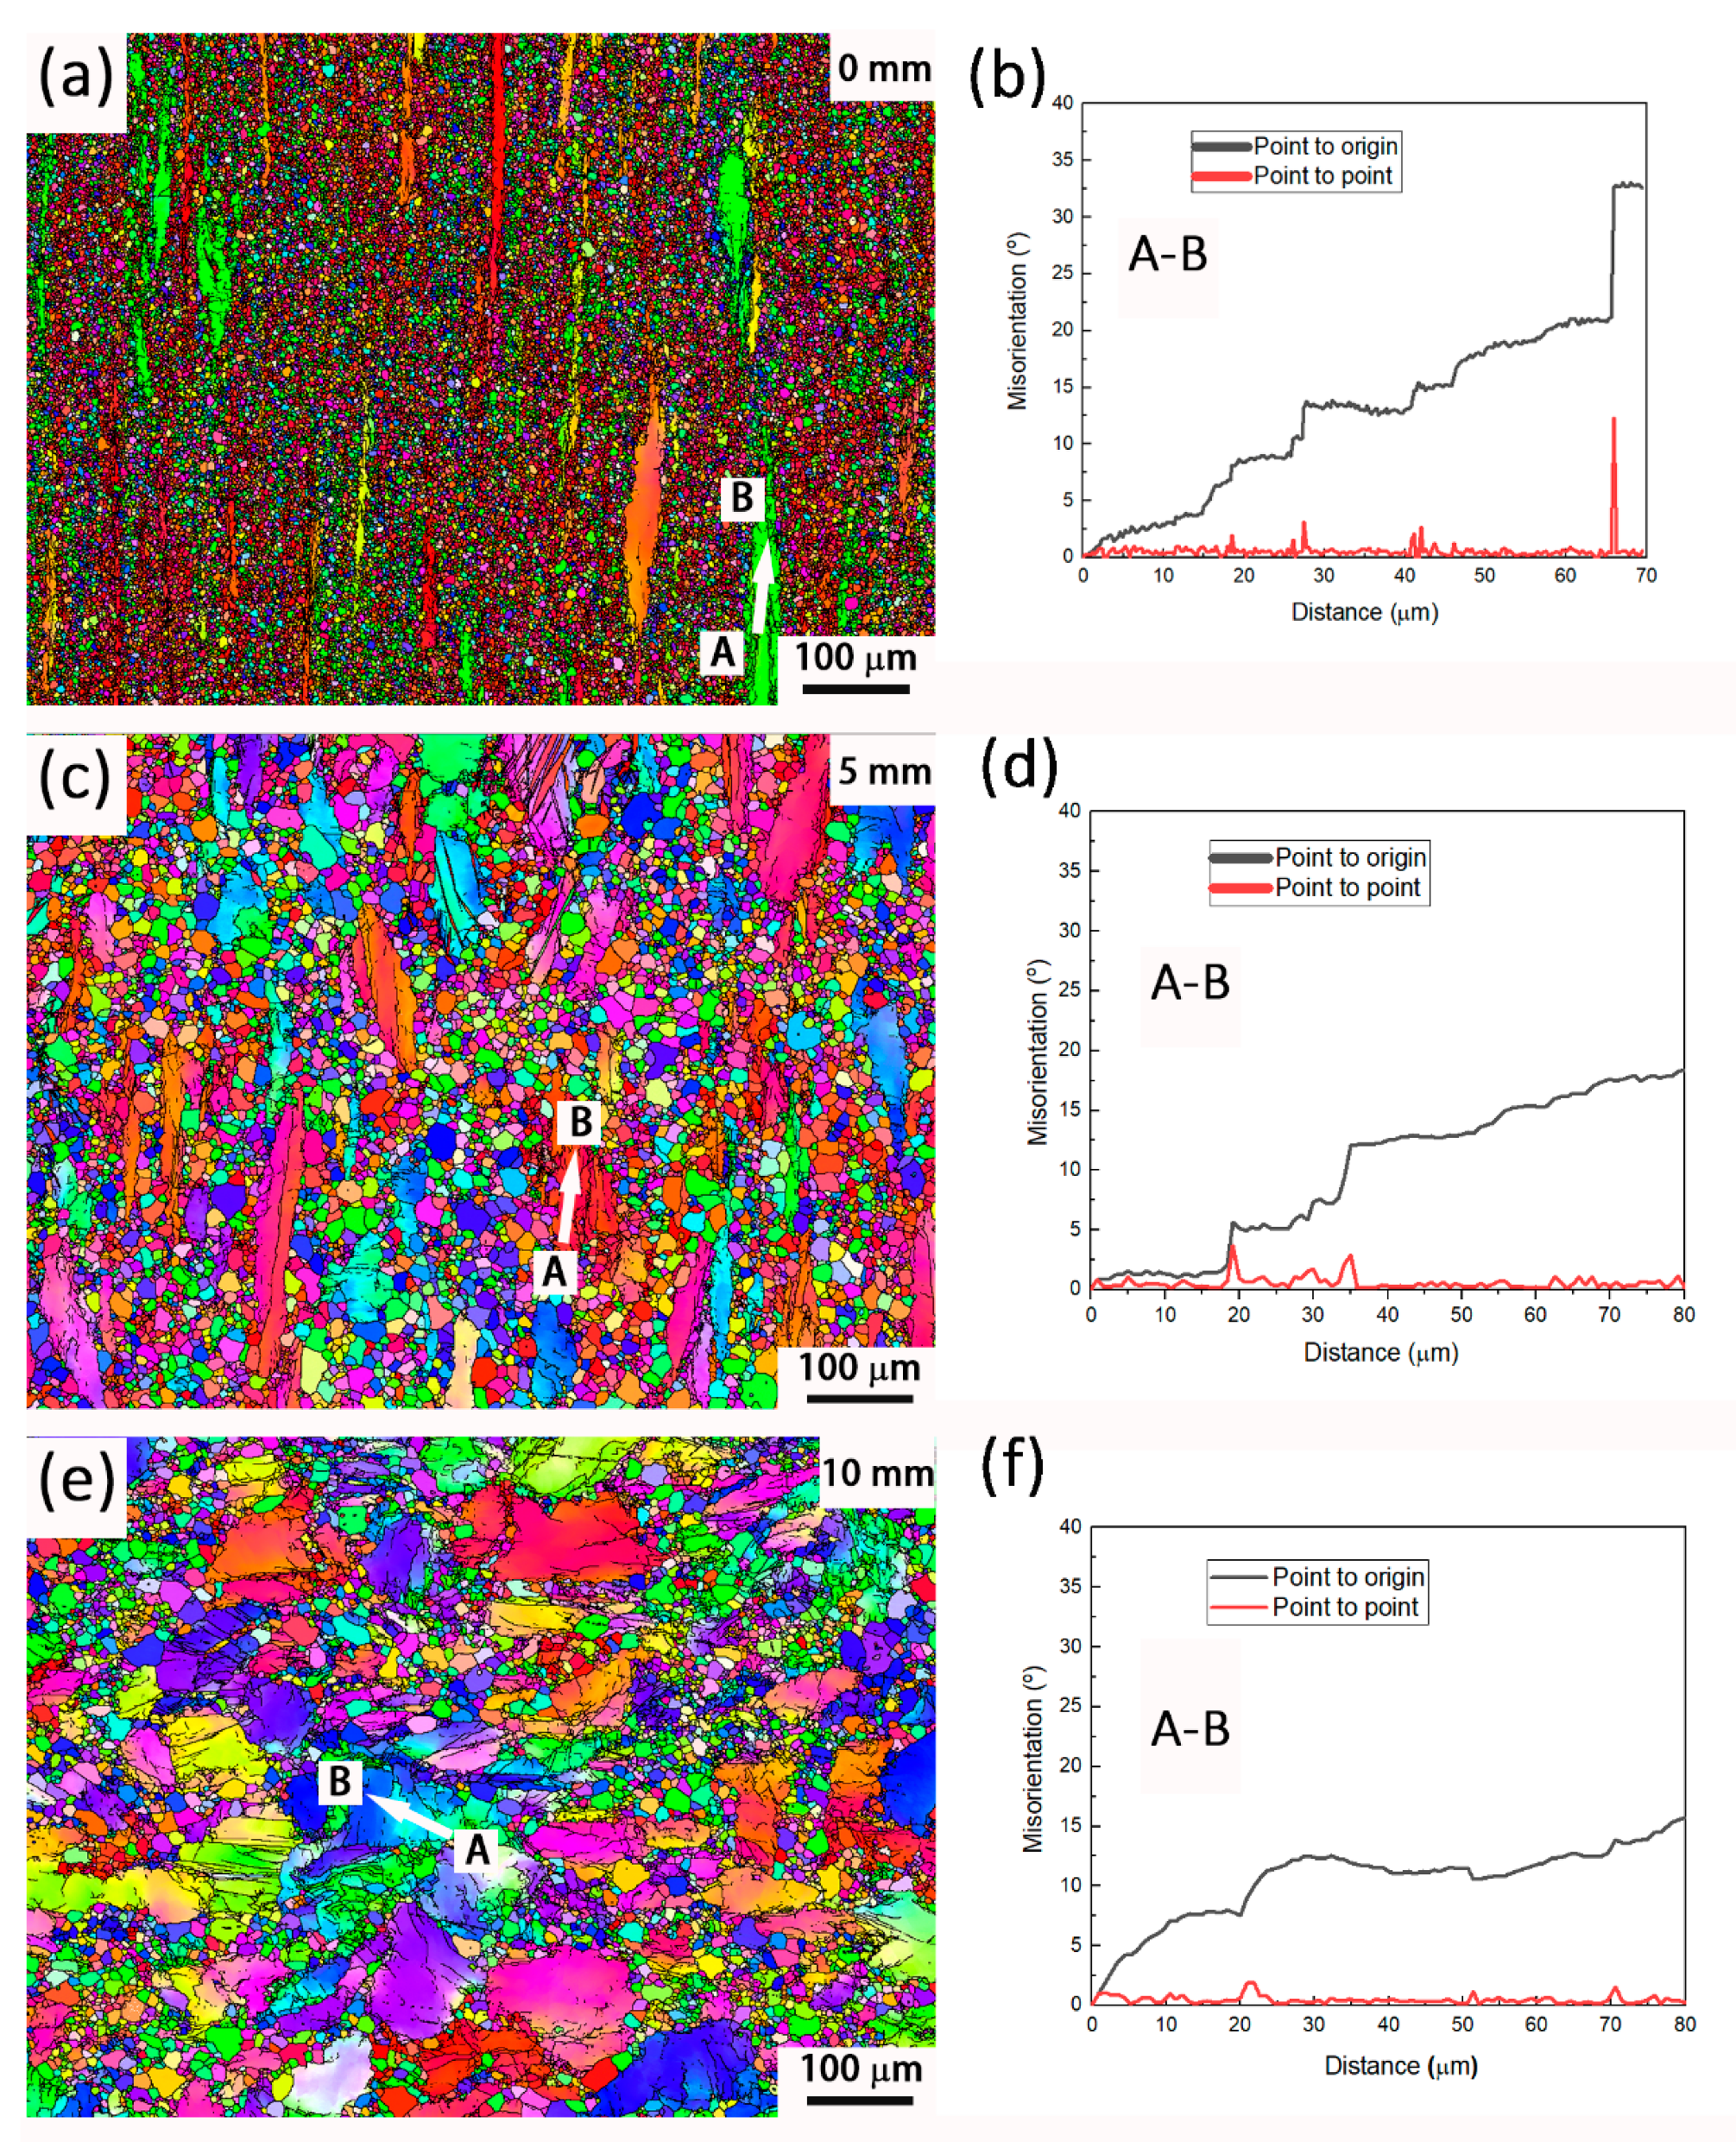
3.3. Microstructural Evolution during Extrusion
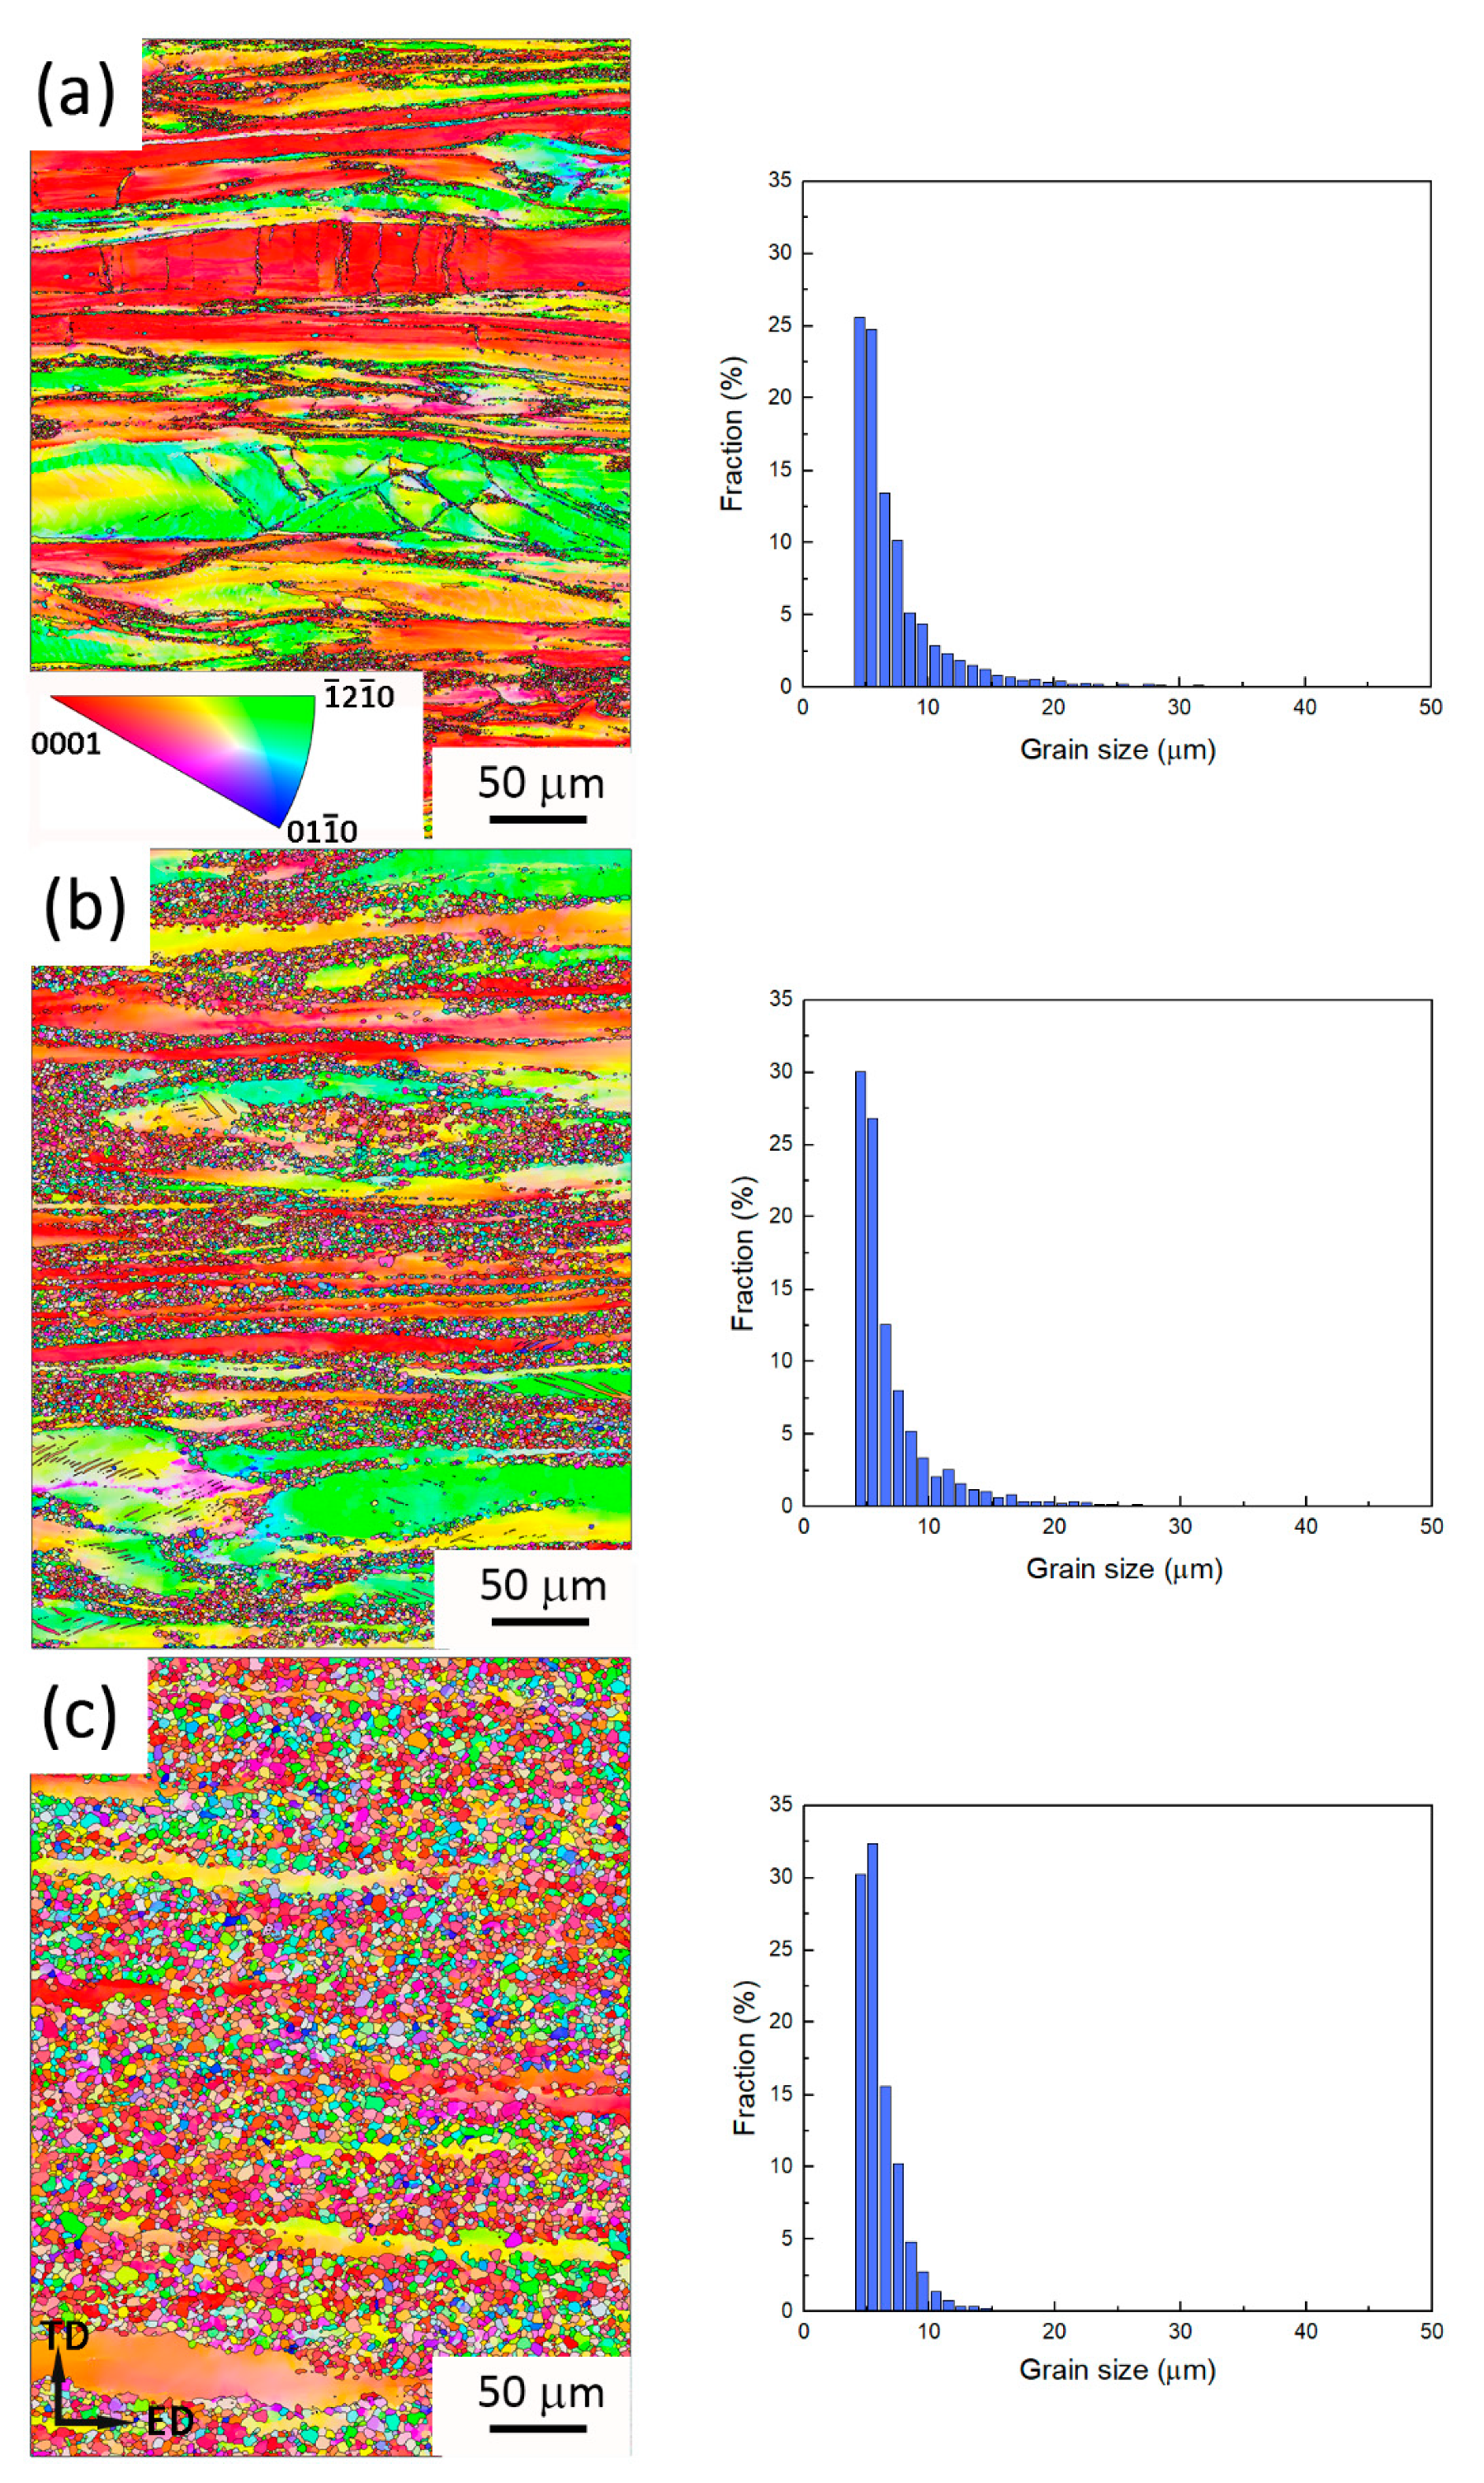
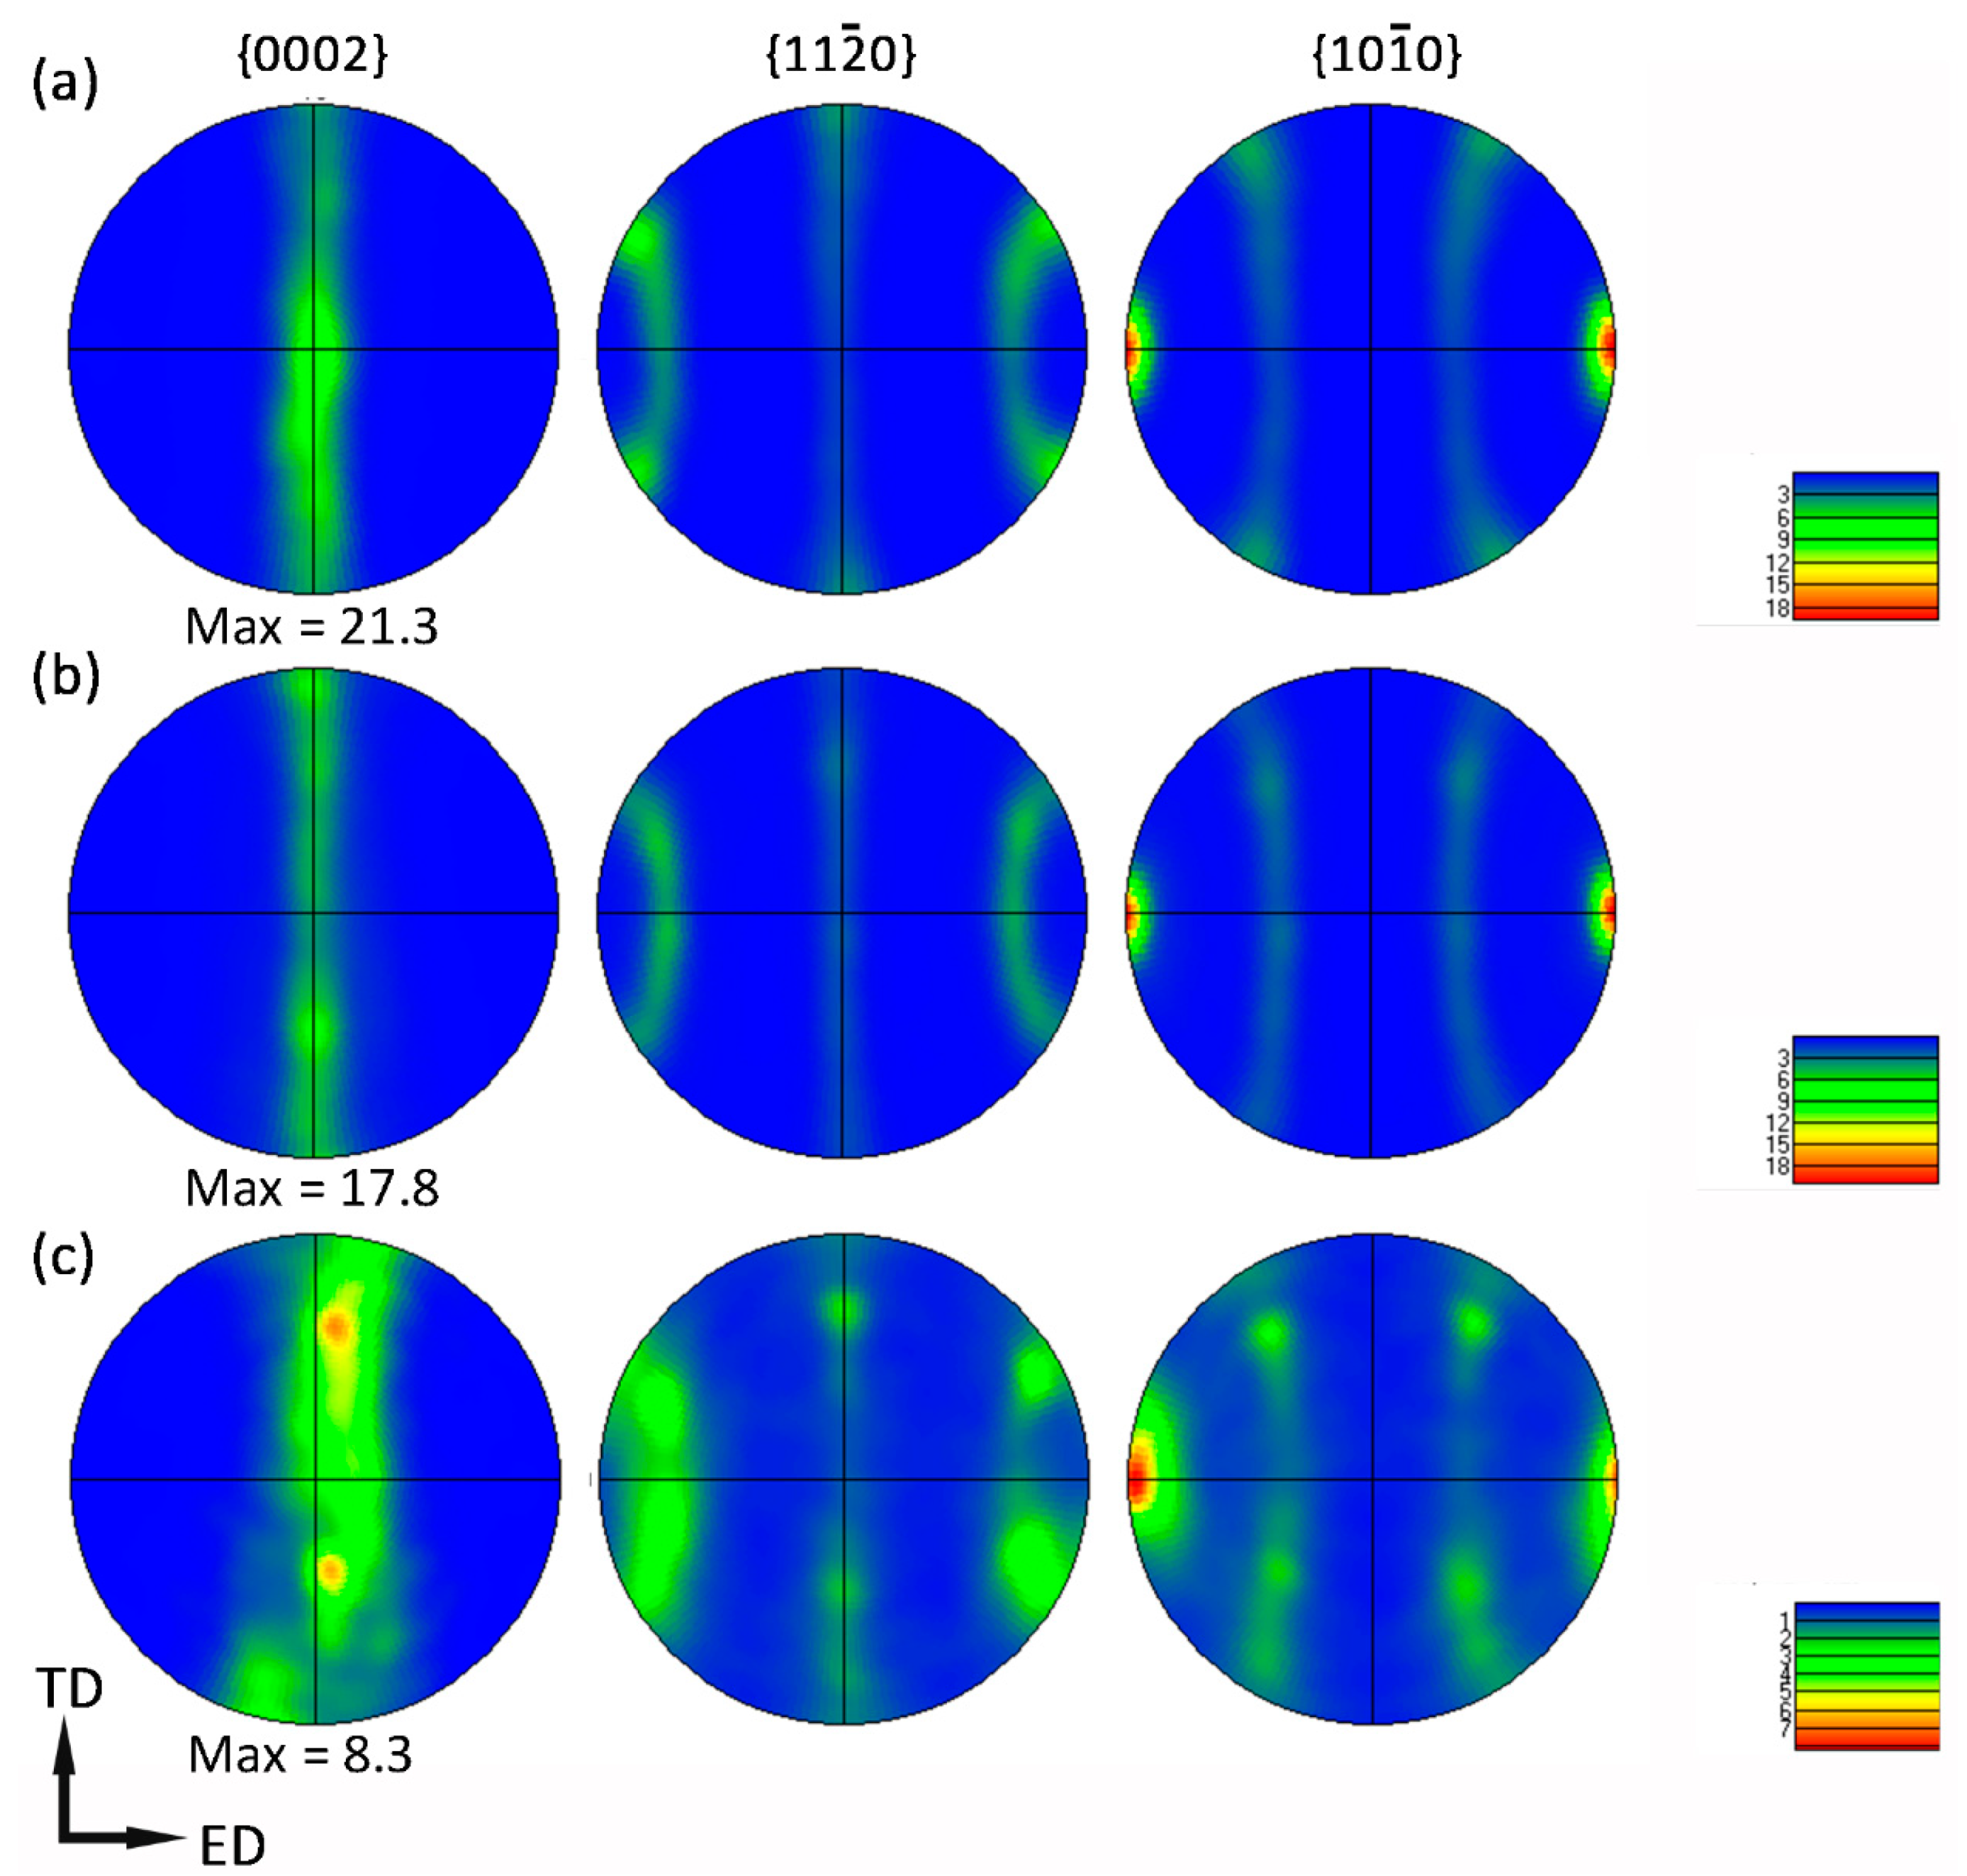
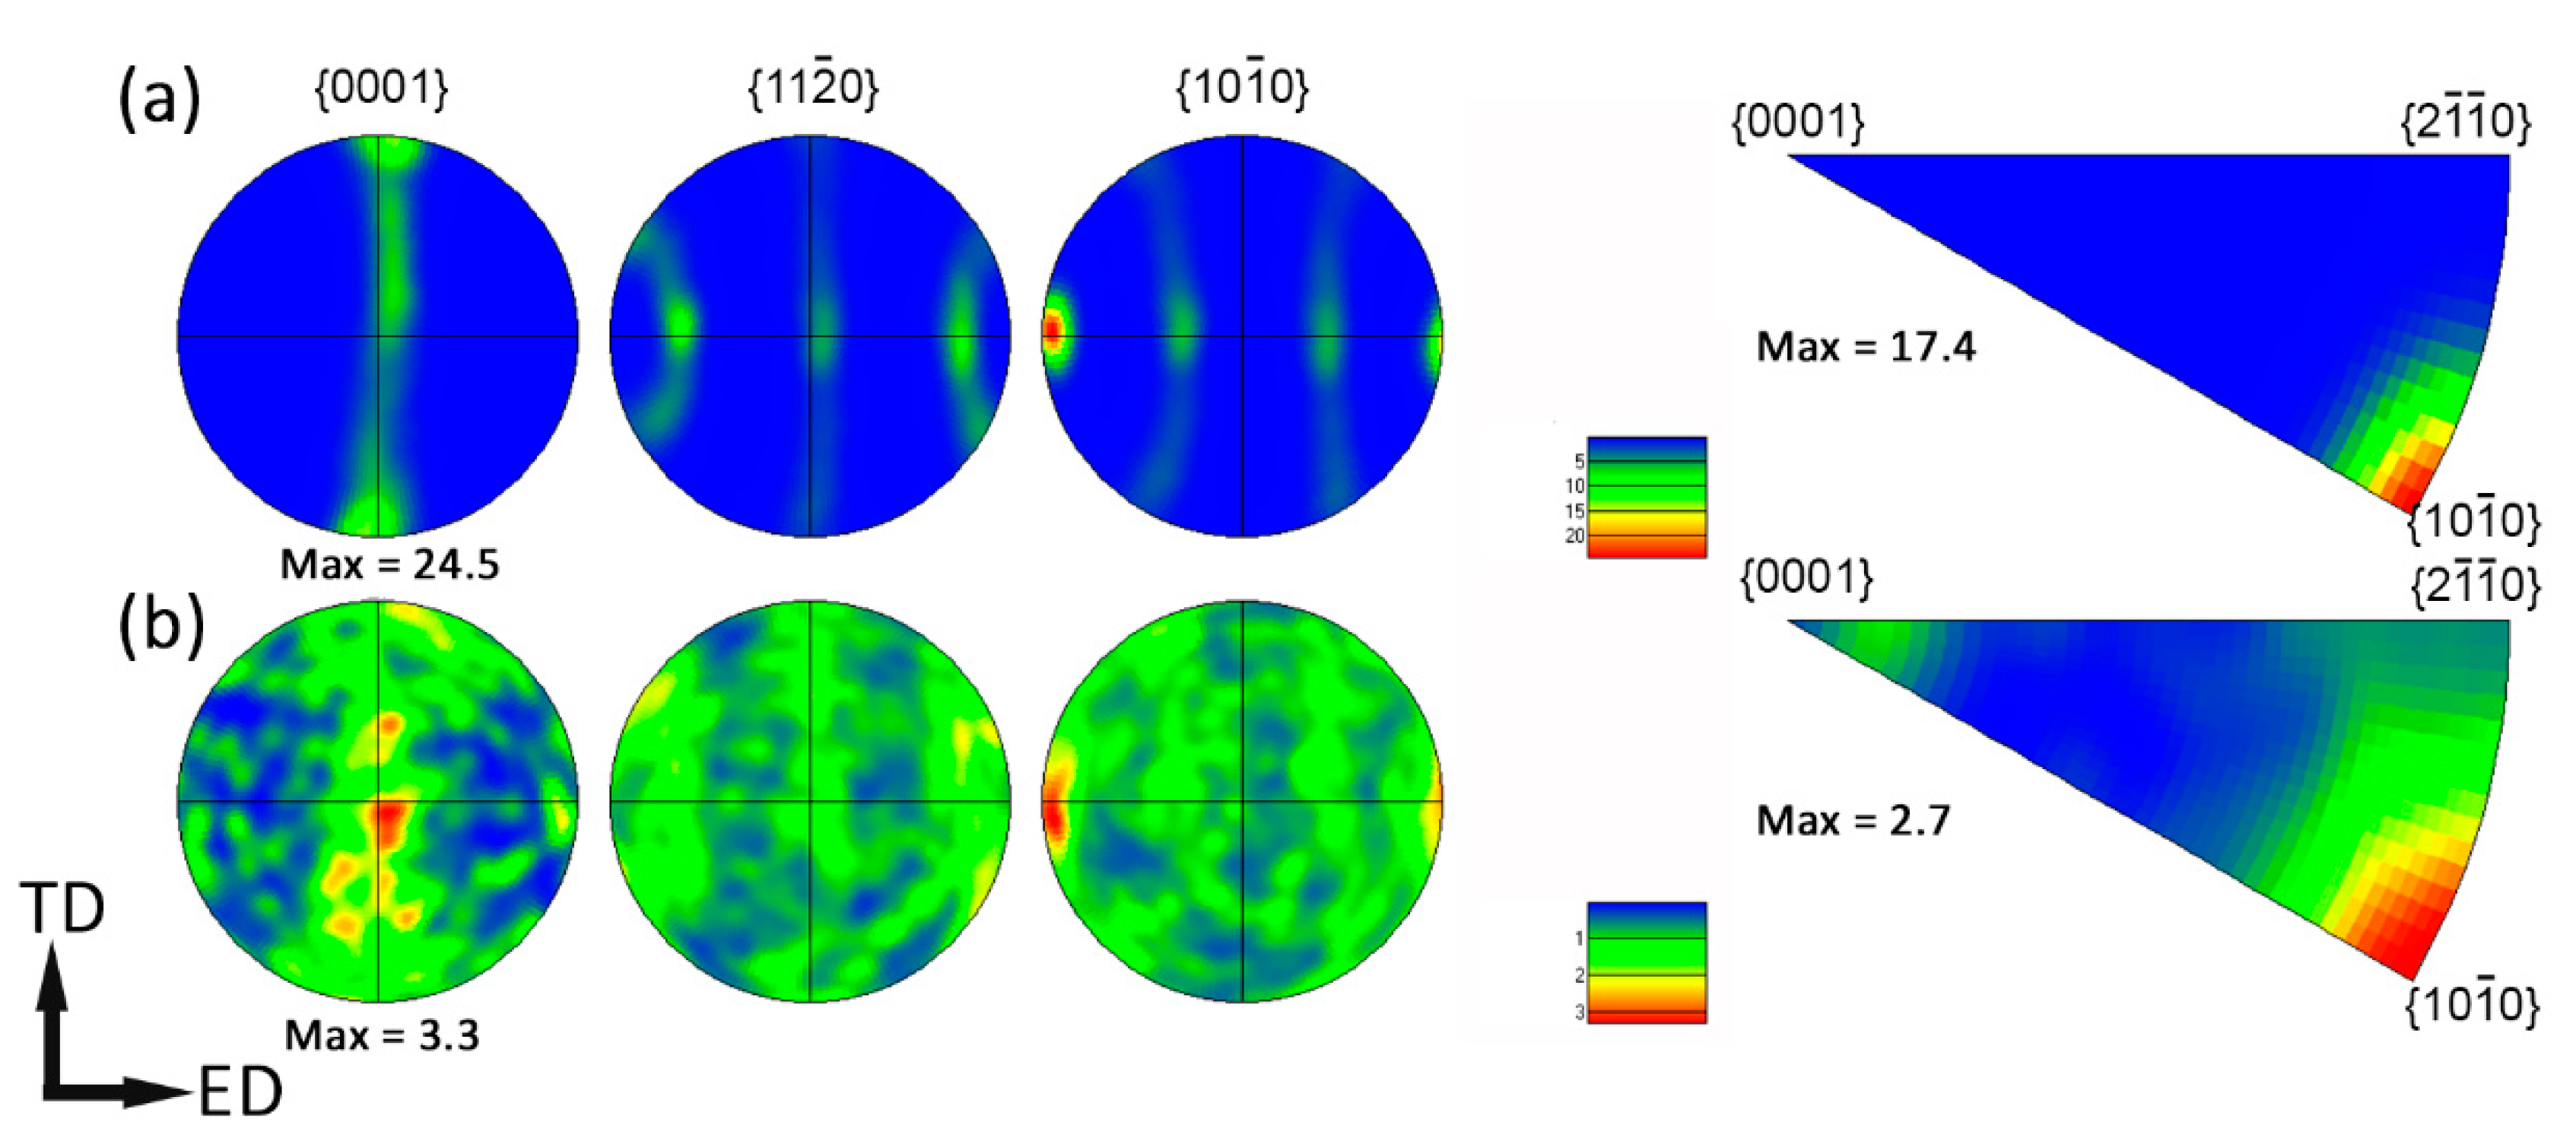
Figure 7 shows optical micrographs from a sample extrusion processed at 400 °C that was interrupted. The section of the sample still in the extrusion die, at different positions below the die exit, reveals the early stages of the microstructural evolution during the overall extrusion process. It can be seen that the microstructure exhibited a gradual change along the flow of the material, showing the changing strain field from the entrance to the exit in the die (from the bottom to the top of the image). In addition, clearly visible large unDRXed grain regions, as indicated by red arrows, were elongated along the material’s flow direction, which still existed after passing through the die exit. Besides, from the microstructures at a higher magnification (Figure 7b–d), a typical bimodal microstructure can be obviously observed, which was composed of large unDRXed and fine DRXed grains. At 10 mm below the die exit (Figure 7b), fine grains with a size of less 5 µm were observed with small DRXed fraction, indicating the onset of DRX. At 5 mm below the die exit (Figure 7c), the DRXed fraction increased with increasing deformation strain, while the DRXed grain size remained almost the same. Near the die exit (Figure 7d), the region had a grain size of less than 2 µm, and it appears that DRX was almost completed with only a few elongated unDRXed grains being left.

3.4. Texture

The pole figures of the as-extruded ZX10 alloy are given in Figure 8, which shows that all the as-extruded samples exhibited a typical {10 1 ¯ 0} fiber texture with the <10 1 ¯ 0> orientation parallel to the ED, which is a typical texture for extruded Mg alloys. Meanwhile, the maximum pole intensity of the basal plane texture decreased from 21.3 to 17.8 and 8.3 as the extrusion temperature increased from 300 °C to 350 °C and 400 °C, indicating that the extrusion temperature had a great impact on the texture. To further explain the high pole intensity of the ZX10 alloy, the pole figures and inverse pole figures of the DRXed and unDRXed regions in the alloy extruded at 300 °C were examined separately and are given in Figure 9. It clearly shows that the maximum pole intensity of unDRXed region of basal plane texture (24.5) was much higher than that of the DRXed region (3.3). As such, the ZX10 alloy extruded at 300 °C possesses a higher texture pole intensity which is a direct result of the higher volume fraction of unDRXed area. Moreover, the unDRXed region exhibited a very strong {10 1 ¯ 0} basal fiber texture. In contrast, the DRXed region had a more diffused and weaker texture, with a weakened {10 1 ¯ 0} basal fiber component with a facilitated formation of the {2 1 ¯ 1 ¯ 0} basal fiber texture.

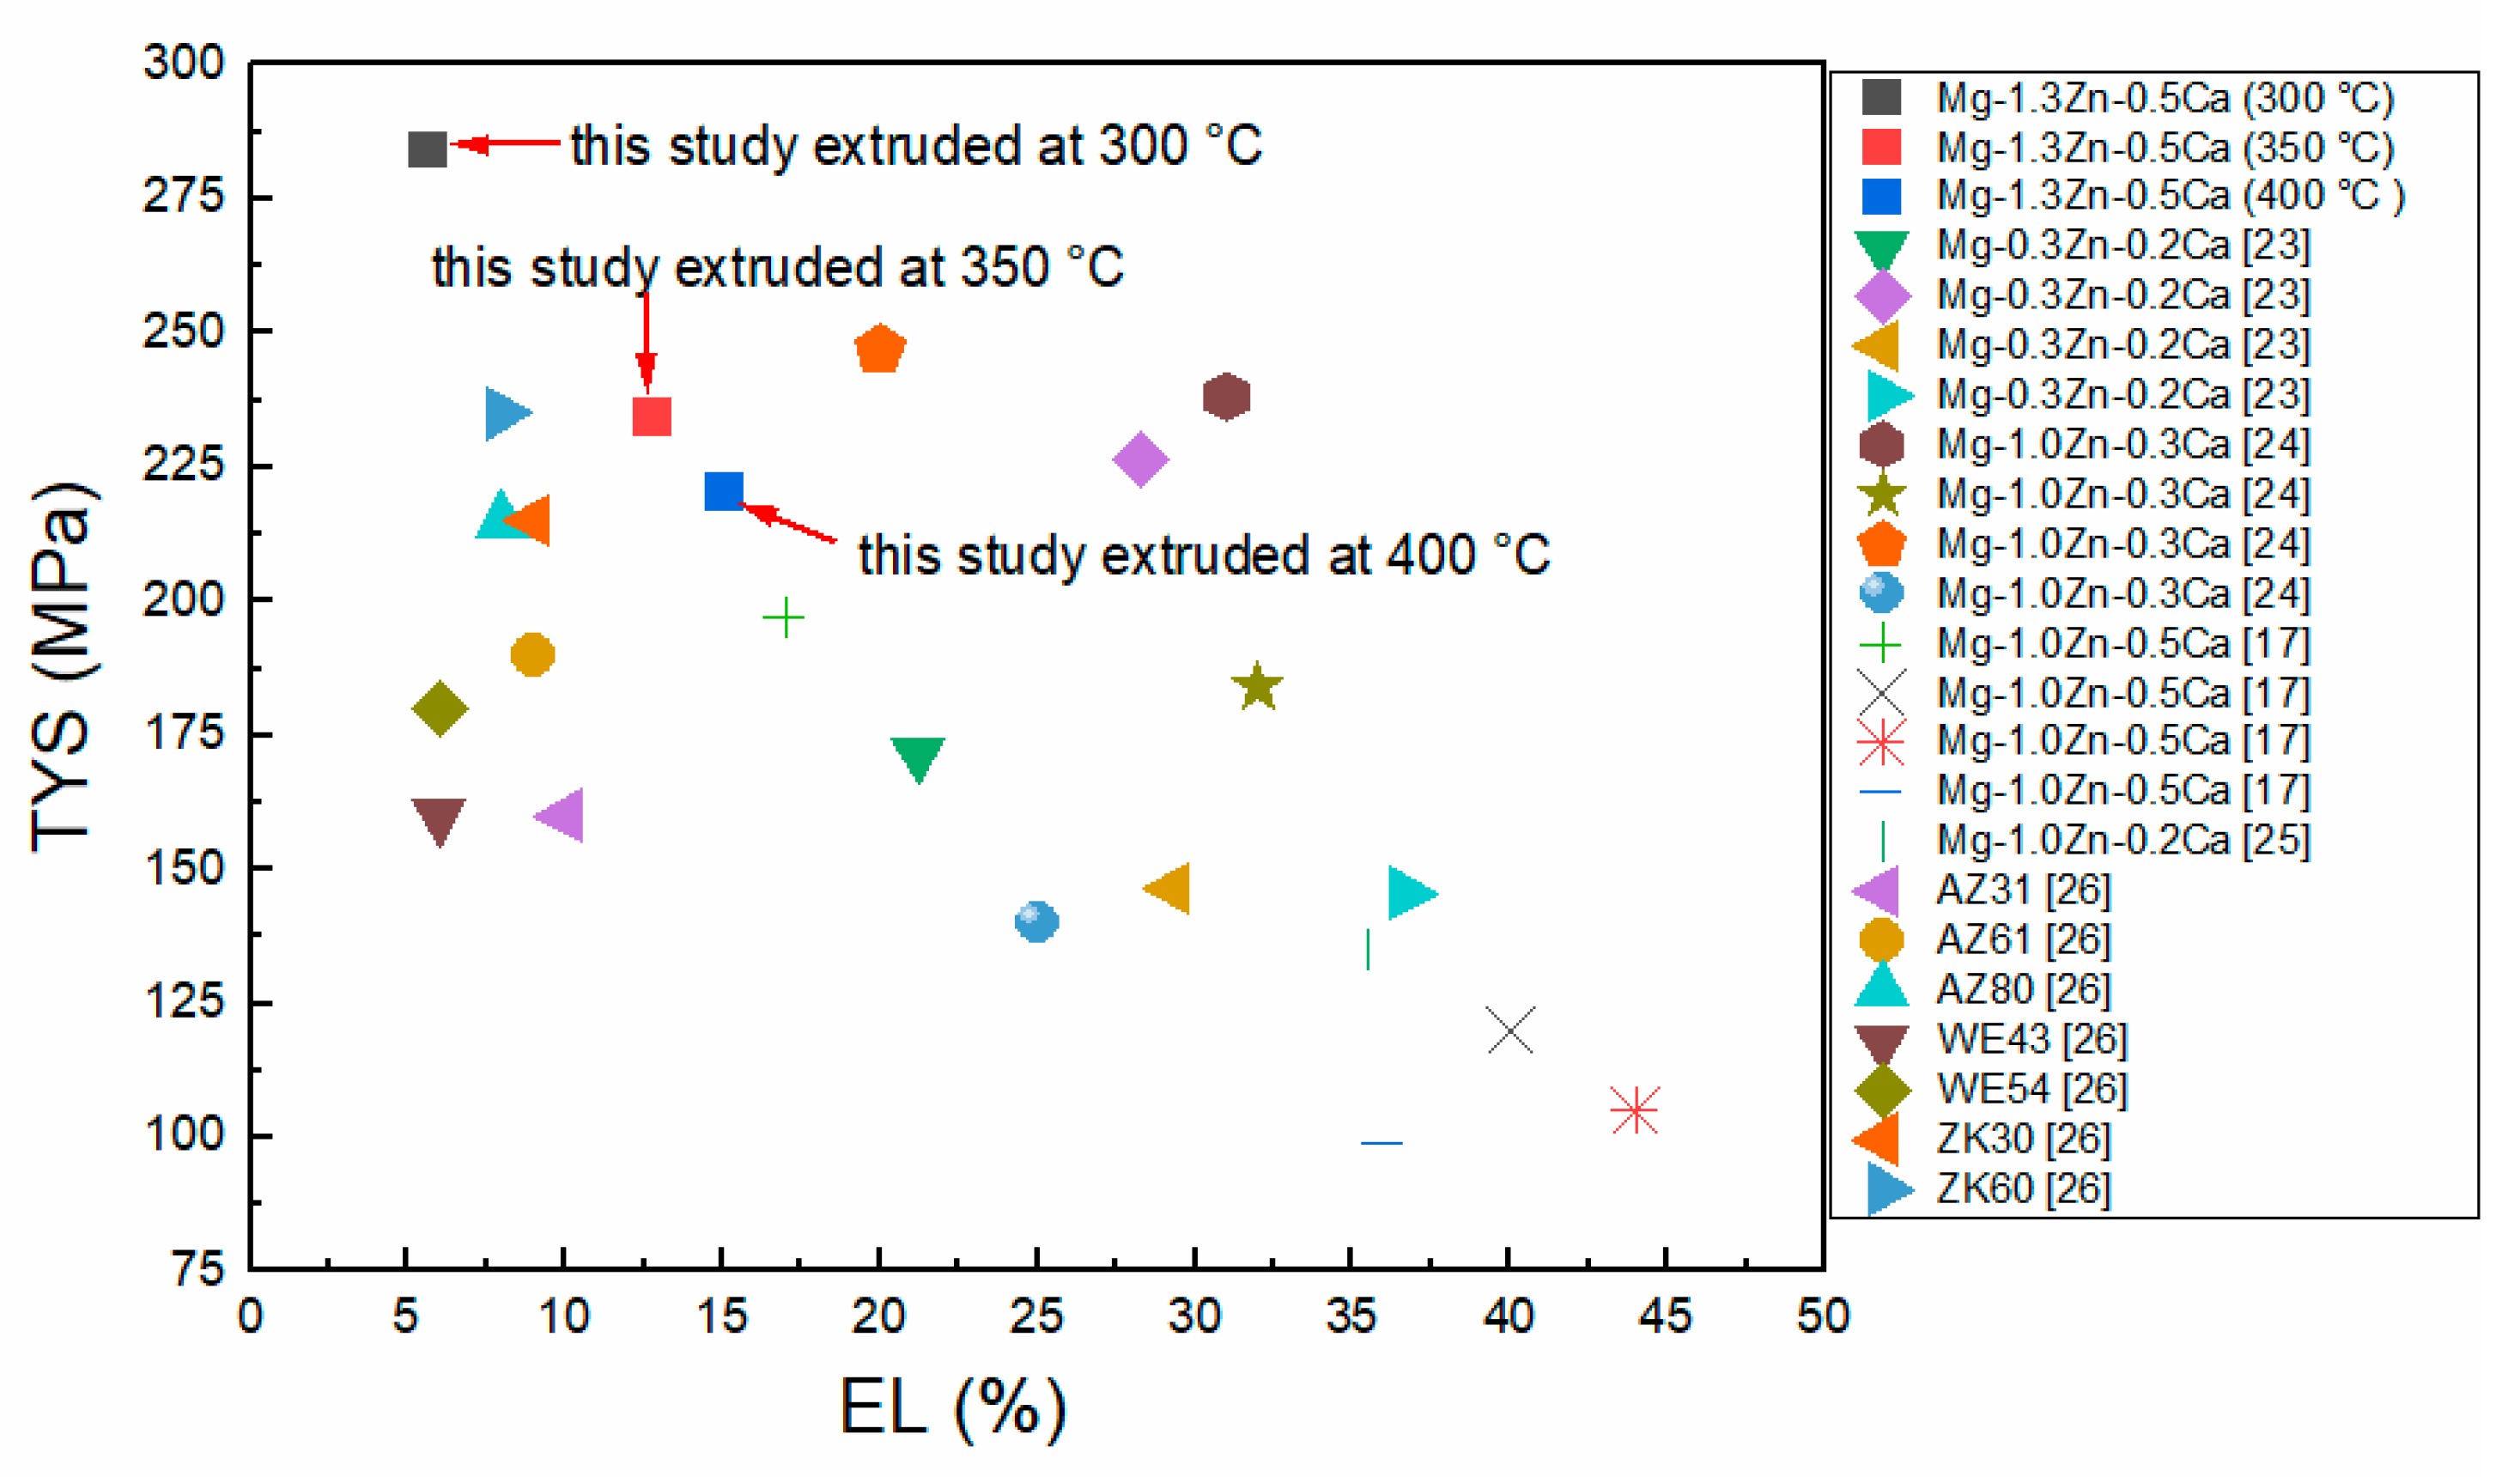
3.5. Mechanical Properties

The room temperature tensile engineering stress–strain curves and mechanical properties of the homogenized and as-extruded ZX10 alloy are given in Figure 10. The detailed mechanical properties are listed in Table 1. From Figure 10a, it can be seen that the mechanical properties of as-extruded ZX10 alloy had obtained great improvement compared to that of homogenized state. Typically, high UTS (~355 MPa) and TYS (~284 MPa) as well as medium EL (~5.7%) were achieved at an extrusion temperature of 300 °C. Figure 10b shows that the UTS and TYS decreased monotonically for higher extrusion temperatures, while the EL increased monotonically. Furthermore, Figure 11 provides a comparison of TYS among the ZX10 alloy in the present work and other low alloying Mg-Zn-Ca alloys. It can be seen that the as-extruded ZX10 alloy in the present work, especially for the case of 300 °C, resulted in a higher TYS than any of the other Mg-Zn-Ca alloys [17,25,26,27], or the commercial AZ or ZK series of alloys [28], and is even higher than those of the RE-containing alloys [28].

4. Discussion

4.1. Microstructure

Generally speaking, the DRX behavior of Mg alloys is related to the following factors: large precipitates [29,30,31] and extrusion parameters [1]. Previous works have shown that large precipitates (>1 µm) could be used in promoting recrystallization via the mechanism of particle-stimulated nucleation (PSN) [32,33]. Kim et al. [34] reported that the volume fraction of the DRXed region was linearly proportional to the volume fraction of large precipitates (>1 µm). In this case, the second phase, with a size of 1~3 µm existed after extrusion (Figure 3), and the volume fractions were 0.59%, 1.22%, and 1.49% for the alloy extruded at 300 °C, 350 °C, and 400 °C, respectively. Figure 12 shows the relationship between the volume fraction of DRXed region and large particles, which has a non-linear correlation. So, the PSN mechanism did not occur for the extruded alloys.
Moreover, it has been reported that the DRXed grain size of the Mg alloys is strongly related to the Zenner–Hollomon parameter, Z = ε ˙ exp ( Q RT ) [35,36,37], where ε ˙ is the strain rate, Q is the activation energy for lattice diffusion of Mg, R is the gas constant, and T is the deformation temperature. Then the relationship between the DRXed grain size and the Zenner–Hollomon parameter can be expressed as [38,39]:
Z d DRX m = A
where dDRX is the DRXed grain size, m is the grain size exponent, and A is a constant. It is clearly seen that the DRXed grains size increases with increasing extrusion temperature. In this case, the DRXed grain sizes for the extrusion temperature of 300 °C, 350 °C and 400 °C were 1.5 µm, 2.6 µm and 3.4 µm, respectively. Therefore, it can be explained that the increasing DRXed grain size was caused by the increasing extrusion temperature.
In addition, in order to reveal the DRX behavior of the as-extruded ZX10 alloy during the extrusion processing, the microstructures of the samples at 0 mm, 5 mm and 10 mm, directly below the extrusion die exit were observed by EBSD. The analysis results are shown in Figure 13. It can be seen from the IPF maps (Figure 13a,c,e) that the unDRXed grains were deformed along the ED to form elongated grains from the bottom to the exit of the die, and the recrystallization fraction gradually increased with many fine DRXed grains. From the misorientation angle along the point to origin indicated by the arrow AB in the unDRXed grains, it can be seen that the misorientation angle in the unDRXed grains gradually increased. Especially, the misorientation angle along AB in Figure 13a can reach as high as 32°. In addition, a large number of sub-grain boundaries can be observed in the unDRXed grains, as well as a large number of sub-grains or substructures were surrounded by low-angle grain boundaries (Figure 13c). According to the typical continuous DRX mechanism (cDRX) [40,41,42], low-angle grain boundaries can continuously absorb more moving dislocations with increasing strain, and can gradually transform into high-angle grain boundaries, and finally transform into new recrystallized grains. Therefore, it can be concluded that cDRX played a leading role in the extrusion process of ZX10 alloy.

4.2. Texture

As described in Section 3.4, a basal fiber texture was formed in the as-extruded ZX10 alloy. Much of the research has proved that the basal {0001} plane and the <10 1 ¯ 0> direction in the majority of grains were arranged along the ED during extrusion processing [43,44,45]. Therefore, a basal fiber texture <10 1 ¯ 0>//ED was formed. Moreover, the basal texture intensity of the as-extruded ZX10 alloy decreased with increasing extrusion temperature. Previous studies have emphasized that the basal texture intensity in the unDRXed regions of Mg alloys was much higher than that in DRXed regions [46,47,48]. Similar results are also observed in Figure 9 that shows that the texture intensity of the unDRXed area was much higher than that of the DRXed area in the ZX10 alloy extruded at 300 °C. In short, the actual basal texture intensity of the as-extruded ZX10 alloy was mainly determined by unDRXed regions depending on their area fraction.

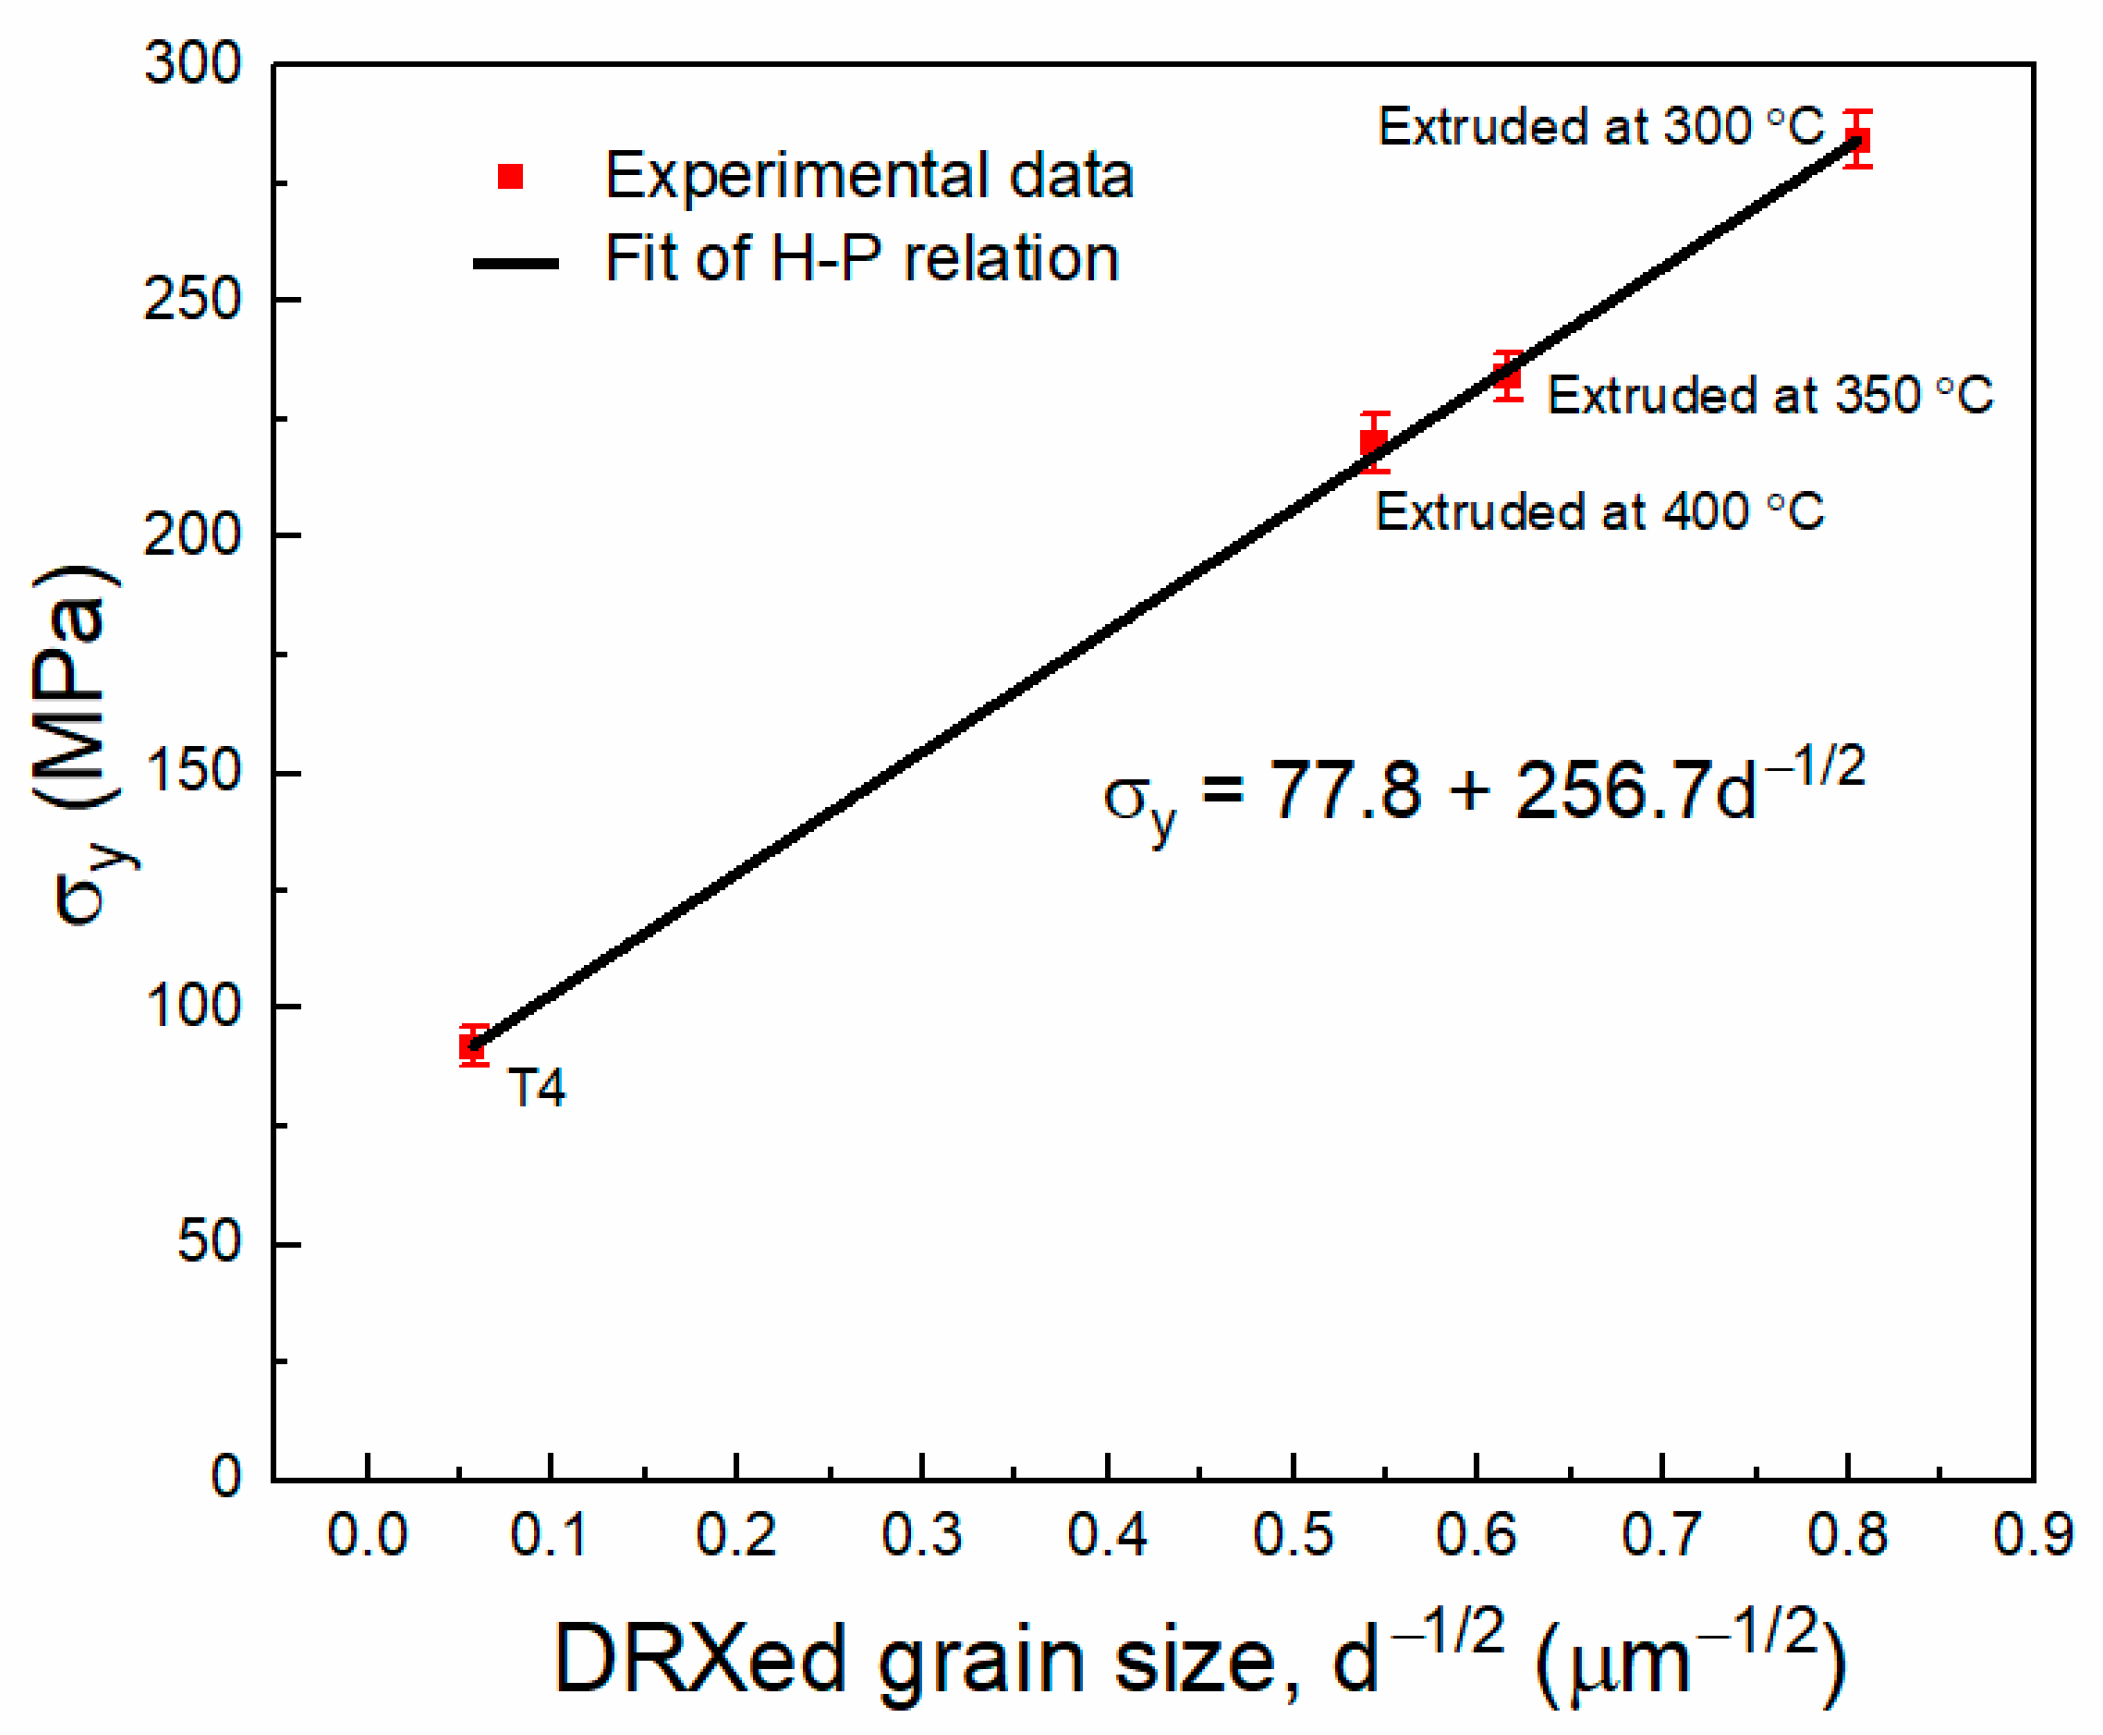
4.3. Mechanical Properties

As described in Section 3.5, as the extrusion temperatures increased from 300 °C to 400 °C, the TYS decreased from 284 MPa to 220 MPa, while the EL improved from 5.7% to 15.1%. Generally speaking, for Mg alloys with relatively low alloying content, the mechanical properties of the plastically deformed sample are related to the size of DRXed grains and the basal texture.
Firstly, the relationship between TYS and DRXed grain size can be analyzed by the Hall–Petch (H–P) equation [49]:
σ y = σ 0 +   k y d 1 / 2
where σy is the tensile yield strength, σ0 is a material’s constant for the onset strength for dislocation movement, ky is the strengthening coefficient (a constant specific to each material), and d (in µm) is the average grain size.
Figure 14 shows the Hall–Petch relationship for the extruded ZX10 alloy with σ0 = 77.8 MPa and ky = 256.7 MPa. It can be seen that the σy and d were in good agreement with the H–P relationship. So, it can be concluded that increasing dDRXed will be conducive to decreasing of the TYS as the extrusion temperature increased.
Secondly, it has been reported that the strong basal texture in the extruded Mg alloys is beneficial for enhancing the strength of the alloys when tensioned along the ED [1,50]. So, the high basal texture intensity of the extruded ZX10 alloy may also lead to high strength. As mentioned in Section 3.4, the pole intensity of basal texture decreased with extrusion temperature increasing from 300 °C to 350 °C and 400 °C, which were 21.3, 17.8, and 8.3, respectively. That is another factor for the decrease of TYS with the increasing extrusion temperatures.
Thirdly, the decrement in the TYS with increasing temperature is also related to the dense dislocation induced during hot extrusion. In order to evaluate the dislocations density, kernel average misorientation (KAM) [51,52] was retrieved from EBSD data, which quantifies the average misorientation around a measurement point with respect to a defined set of nearest neighbor points, and values above a threshold of 5° were excluded from the calculation [53]. The KAM value distributions and average KAM values given in Figure 15 show that the dislocation density was much higher for the alloys extruded at 300 °C. Since the dislocations interact with each other and act as obstacles to the dislocation motions, the dense dislocations induce deformation strengthening and contribute to its high strength. By increasing extrusion temperatures, KAM values decreased and dislocation strengthening was gradually weakened.
In addition, the effect of texture on TYS and EL can also be explained by Schmid factor (SF), which can be expressed as [54]:
τ CRSS   = σ y ×   m
where τCRSS is the critical resolved shear stress (CRSS) and m is the Schmid factor, which can be expressed as m = cos α   ×   cos β , where α is the angle between the slip direction and the axis of the external force and β is the angle between slip plane and the axis of external force. The basal slip system {0001} <11 2 ¯ 0> is easily activated with a higher m value, which leads to lower TYS and higher EL. The Schmid factor distribution histograms of the as-extruded ZX10 alloy at different extrusion temperatures are shown in Figure 16. When the extrusion temperature was 300 °C, the value of m was only 0.29 due to the limited extent of the DRXed region, indicating that it was difficult to initiate a large number of basal slips when tensioned along the ED, resulting in higher TYS and lower EL. As the extrusion temperature increased to 350 °C and 400 °C, respectively, the value of m gradually rose to 0.32 and 0.35, respectively, and basal slip systems were easier to initiate, leading to a decrease in the TYS and an improvement of the EL.
Figure 17 shows optical micrographs and SEM observations of fractured surfaces of the as-extruded ZX10 alloy. As shown in Figure 17a, twinning was found in the unDRXed regions, but which was negligible in the DRXed regions. Moreover, although the coarse second phase Mg2Ca precipitates were distributed along the ED (Figure 3), no cracks were observed around them, indicating that the fracture was more related to the occurrence of twinning. Many prior research works have revealed that the elongation of extruded Mg alloys was related to the presence of unDRXed regions [1,29]. Compression twinning and double twinning could occur easily in the unDRXed grains as compared with the DRXed grains [29,55]. The larger the grain size, the faster the generation of these twins. During the subsequent tensile processing, the accumulation of dislocations at twin boundaries leads to a buildup of stress concentration and causes the initiation of the micro-cracking of these boundaries. As seen in Figure 17b,d,f, the micro-cracks were observed. The connection of micro-cracks resulted in the instability and led to the fracture of the alloys. Generally, the large number of unDRXed regions will be favorable for the initiation of twinning, but which is adverse to greater elongation [55]. So, the ZX10 alloy extruded at 400 °C with the highest fraction of DRXed regions revealed the highest elongation. Finally, as shown in Figure 17b,d,f, the dimples were also observed, indicating that the main fracture mode is a plastic fracture.

5. Conclusions

Mg-1.3Zn-0.5Ca (wt.%, ZX10) alloy was processed with hot indirect-extrusion with an extrusion ratio of 9.37 at three different temperatures of 300 °C, 350 °C, and 400 °C. The microstructure, texture, and mechanical properties of the extruded materials have been investigated in the present work. The main conclusions are summarized as follows:
(1) Both the volume fraction and average grain size of DRXed regions increased as the extrusion temperature increased from 300 °C to 400 °C;
(2) Large precipitates (>1 µm) of Mg2Ca were dynamically precipitated along the extrusion direction, the amount of which gradually increased with increasing extrusion temperature;
(3) A strong basal fiber texture was formed in the presence of as-extruded Mg-1.3Zn-0.5Ca alloys, and the pole intensity decreased with increasing extrusion temperature due to the increased volume fraction of DRXed regions;
(4) A mechanical property with a UTS of 355 MPa, TYS of 284 MPa and EL of 5.7% was achieved in the Mg-1.3Zn-0.5Ca alloy extruded at 300 °C. With a further increase of temperature, the UTS and TYS decreased, accompanied by an improvement of EL.

Author Contributions

Experiments, H.Z.; data analysis, H.Z. and S.Y.; writing—original draft, H.Z.; writing—revised draft, review, and editing, Z.X. and L.J.K.; supervising, J.S. All authors have read and agreed to the published version of the manuscript.

Funding

This research was funded by The Materials in Extreme Dynamic Environments (MEDE) cooperative agreement (W911NF-12-2-0022) and The National Science Foundation (NSF, CMMI 2026313). The NCA&T project number is 290959.

Institutional Review Board Statement

Not applicable.

Informed Consent Statement

Not applicable.

Data Availability Statement

Not applicable.

Acknowledgments

This work was supported by the “Tailoring Mg-alloy Systems through Composition/Microstructure/Severe Plastic Deformation for Army Extreme Dynamic Environment Applications” project funded by the US Army Research Laboratory through the Materials in Extreme Dynamic Environments program at John Hopkins University.

Conflicts of Interest

The authors declare no conflict of interest.

References

  1. Li, W.J.; Deng, K.K.; Zhang, X.; Nie, K.B.; Xu, F.J. Effect of ultra-slow extrusion speed on the microstructure and mechanical properties of Mg-4Zn-0.5 Ca alloy. Mater. Sci. Eng. A 2016, 677, 367–375. [Google Scholar] [CrossRef]
  2. Valiev, R.Z.; Langdon, T.G. Principles of equal-channel angular pressing as a processing tool for grain refinement. Prog. Mater. Sci. 2006, 51, 881–981. [Google Scholar] [CrossRef]
  3. Xing, J.; Soda, H.; Yang, X.; Miura, H.; Sakai, T. Ultra-fine grain development in an AZ31 magnesium alloy during multi-directional forging under decreasing temperature conditions. Mater. Trans. 2005, 46, 1646–1650. [Google Scholar] [CrossRef] [Green Version]
  4. Straumal, B.; Baretzky, B.; Mazilkin, A.; Phillipp, F.; Kogtenkova, O.; Volkov, M.; Valiev, R. Formation of nanograined structure and decomposition of supersaturated solid solution during high pressure torsion of Al–Zn and Al–Mg alloys. Acta Mater. 2004, 52, 4469–4478. [Google Scholar] [CrossRef]
  5. Pérez-Prado, M.T.; Ruano, O. Grain refinement of Mg–Al–Zn alloys via accumulative roll bonding. Scr. Mater. 2004, 51, 1093–1097. [Google Scholar] [CrossRef]
  6. Huang, H.; Yuan, G.; Chen, C.; Ding, W.; Wang, Z. Excellent mechanical properties of an ultrafine-grained quasicrystalline strengthened magnesium alloy with multi-modal microstructure. Mater. Lett. 2013, 107, 181–184. [Google Scholar] [CrossRef]
  7. Homma, T.; Kunito, N.; Kamado, S. Fabrication of extraordinary high-strength magnesium alloy by hot extrusion. Scr. Mater. 2009, 61, 644–647. [Google Scholar] [CrossRef]
  8. Pan, H.; Ren, Y.; Fu, H.; Zhao, H.; Wang, L.; Meng, X.; Qin, G. Recent developments in rare-earth free wrought magnesium alloys having high strength: A review. J. Alloys Compd. 2016, 663, 321–331. [Google Scholar] [CrossRef]
  9. Nie, J.F.; Muddle, B.C. Precipitation hardening of Mg-Ca (-Zn) alloys. Scr. Mater. 1997, 37, 1475–1481. [Google Scholar] [CrossRef]
  10. Oh-Ishi, K.; Watanabe, R.; Mendis, C.; Hono, K. Age-hardening response of Mg–0.3 at.% Ca alloys with different Zn contents. Mater. Sci. Eng. A 2009, 526, 177–184. [Google Scholar] [CrossRef]
  11. Gao, X.; Zhu, S.M.; Muddle, B.C.; Nie, J.F. Precipitation-hardened Mg–Ca–Zn alloys with superior creep resistance. Scr. Mater. 2005, 53, 1321–1326. [Google Scholar] [CrossRef]
  12. Naghdi, F.; Mahmudi, R. Impression creep behavior of the extruded Mg–4Zn–0.5 Ca and Mg–4Zn–0.5 Ca–2RE alloys. Mater. Sci. Eng. A 2014, 616, 161–170. [Google Scholar] [CrossRef]
  13. Hofstetter, J.; Becker, M.; Martinelli, E.; Weinberg, A.M.; Mingler, B.; Kilian, H.; Pogatscher, S.; Uggowitzer, P.J.; Löffler, J.F. High-strength low-alloy (HSLA) Mg–Zn–Ca alloys with excellent biodegradation performance. JOM 2014, 66, 566–572. [Google Scholar] [CrossRef]
  14. Sun, Y.; Zhang, B.; Wang, Y.; Geng, L.; Jiao, X. Preparation and characterization of a new biomedical Mg–Zn–Ca alloy. Mater. Des. 2012, 34, 58–64. [Google Scholar] [CrossRef]
  15. Du, Y.; Zheng, M.; Xu, C.; Qiao, X.; Wu, K.; Liu, X.; Wang, G.; Lv, X. Microstructures and mechanical properties of as-cast and as-extruded Mg-4.50 Zn-1.13 Ca (wt%) alloys. Mater. Sci. Eng. A 2013, 576, 6–13. [Google Scholar] [CrossRef]
  16. Tong, L.; Zheng, M.; Cheng, L.; Zhang, D.; Kamado, S.; Meng, J.; Zhang, H. Influence of deformation rate on microstructure, texture and mechanical properties of indirect-extruded Mg–Zn–Ca alloy. Mater. Charact. 2015, 104, 66–72. [Google Scholar] [CrossRef]
  17. Zhang, B.; Geng, L.; Huang, L.; Zhang, X.; Dong, C. Enhanced mechanical properties in fine-grained Mg–1.0 Zn–0.5 Ca alloys prepared by extrusion at different temperatures. Scr. Mater. 2010, 63, 1024–1027. [Google Scholar] [CrossRef]
  18. Li, C.J.; Sun, H.F.; Fang, W.B. Effect of Extrusion Temperatures on Microstructures and Mechanical Properties of Mg-3Zn-0.2Ca-0.5Y Alloy. Procedia Eng. 2014, 81, 610–615. [Google Scholar] [CrossRef] [Green Version]
  19. Wang, J.; Jang, Y.; Wan, G.; Giridharan, V.; Song, G.-L.; Xu, Z.; Koo, Y.; Qi, P.; Sankar, J.; Huang, N. Flow-induced corrosion of absorbable magnesium alloy: In-situ and real-time electrochemical study. Corros. Sci. 2016, 104, 277–289. [Google Scholar] [CrossRef] [Green Version]
  20. Zhao, D.; Lü, S.; Li, J.; Guo, W.; Wu, S. A novel continuous squeeze casting-extrusion process for grain refinement and property improvement in AZ31 alloy. Mater. Sci. Eng. A 2021, 808, 140942. [Google Scholar] [CrossRef]
  21. Bachmann, F.; Hielscher, R.; Schaeben, H. Grain detection from 2d and 3d EBSD data—Specification of the MTEX algorithm. Ultramicroscopy 2011, 111, 1720–1733. [Google Scholar] [CrossRef]
  22. Levi, G.; Avraham, S.; Zilberov, A.; Bamberger, M. Solidification, solution treatment and age hardening of a Mg–1.6 wt.% Ca–3.2 wt.% Zn alloy. Acta Mater. 2006, 54, 523–530. [Google Scholar] [CrossRef]
  23. Jardim, P.; Solorzano, G.; Vander Sande, J. Second phase formation in melt-spun Mg–Ca–Zn alloys. Mater. Sci. Eng. A 2004, 381, 196–205. [Google Scholar] [CrossRef]
  24. Zhong, Y.; Liu, J.; Witt, R.A.; Sohn, Y.-H.; Liu, Z.-K. Al2(Mg, Ca) phases in Mg–Al–Ca ternary system: First-principles prediction and experimental identification. Scr. Mater. 2006, 55, 573–576. [Google Scholar] [CrossRef]
  25. Li, C.J.; Sun, H.F.; Li, X.W.; Zhang, J.L.; Fang, W.B.; Tan, Z.Y. Microstructure, texture and mechanical properties of Mg-3.0 Zn-0.2 Ca alloys fabricated by extrusion at various temperatures. J. Alloys Compd. 2015, 652, 122–131. [Google Scholar] [CrossRef]
  26. Hofstetter, J.; Rüedi, S.; Baumgartner, I.; Kilian, H.; Mingler, B.; Povoden-Karadeniz, E.; Pogatscher, S.; Uggowitzer, P.J.; Löffler, J.F. Processing and microstructure–property relations of high-strength low-alloy (HSLA) Mg–Zn–Ca alloys. Acta Mater. 2015, 98, 423–432. [Google Scholar] [CrossRef]
  27. Zhang, B.; Wang, Y.; Geng, L.; Lu, C. Effects of calcium on texture and mechanical properties of hot-extruded Mg–Zn–Ca alloys. Mater. Sci. Eng. A 2012, 539, 56–60. [Google Scholar] [CrossRef]
  28. Friedrich, H.E.; Mordike, B.L. Magnesium Technology; Springer: Berlin/Heidelberg, Germany, 2006; Volume 212. [Google Scholar]
  29. Wang, C.J.; Kang, J.W.; Deng, K.K.; Nie, K.B.; Liang, W.; Li, W.G. Microstructure and mechanical properties of Mg-4Zn-xGd (x = 0, 0.5, 1, 2) alloys. J. Magnes. Alloy. 2020, 8, 441–451. [Google Scholar] [CrossRef]
  30. Jiang, H.; Zhao, T.; Liu, M.; Wu, M.; Yan, X. Two-dimensional SiS as a potential anode material for lithium-based batteries: A first-principles study. J. Power Sources 2016, 331, 391–399. [Google Scholar] [CrossRef]
  31. Yu, H.; Hongge, Y.; Jihua, C.; Bin, S.; Yi, Z.; Yanjin, S.; Zhaojie, M. Effects of minor Gd addition on microstructures and mechanical properties of the high strain-rate rolled Mg–Zn–Zr alloys. J. Alloys Compd. 2014, 586, 757–765. [Google Scholar] [CrossRef]
  32. Al-Samman, T. Modification of texture and microstructure of magnesium alloy extrusions by particle-stimulated recrystallization. Mater. Sci. Eng. A 2013, 560, 561–566. [Google Scholar] [CrossRef]
  33. Robson, J.; Henry, D.; Davis, B. Particle effects on recrystallization in magnesium–manganese alloys: Particle pinning. Mater. Sci. Eng. A 2011, 528, 4239–4247. [Google Scholar] [CrossRef]
  34. Kim, S.H.; Jung, J.G.; You, B.S.; Park, S.H. Effect of Ce addition on the microstructure and mechanical properties of extruded Mg-Sn-Al-Zn alloy. Mater. Sci. Eng. A 2016, 657, 406–412. [Google Scholar] [CrossRef]
  35. Mabuchi, M.; Kubota, K.; Higashi, K. New recycling process by extrusion for machined chips of AZ91 magnesium and mechanical properties of extruded bars. Mater. Trans. JIM 1995, 36, 1249–1254. [Google Scholar] [CrossRef] [Green Version]
  36. Galiyev, A.; Kaibyshev, R.; Gottstein, G. Correlation of plastic deformation and dynamic recrystallization in magnesium alloy ZK60. Acta Mater. 2001, 49, 1199–1207. [Google Scholar] [CrossRef]
  37. Chang, C.; Lee, C.; Huang, J. Relationship between grain size and Zener–Holloman parameter during friction stir processing in AZ31 Mg alloys. Scr. Mater. 2004, 51, 509–514. [Google Scholar] [CrossRef]
  38. Xu, S.; Matsumoto, N.; Kamado, S.; Honma, T.; Kojima, Y. Dynamic microstructural changes in Mg–9Al–1Zn alloy during hot compression. Scr. Mater. 2009, 61, 249–252. [Google Scholar] [CrossRef]
  39. Xu, S.; Kamado, S.; Honma, T. Recrystallization mechanism and the relationship between grain size and zener–hollomon parameter of mg–al–zn–ca Alloys During Hot Compression. Scr. Mater. 2010, 63, 293–296. [Google Scholar] [CrossRef]
  40. Al-Samman, T.; Gottstein, G. Dynamic recrystallization during high temperature deformation of magnesium. Mater. Sci. Eng. A 2008, 490, 411–420. [Google Scholar] [CrossRef]
  41. Fatemi-Varzaneh, S.; Zarei-Hanzaki, A.; Beladi, H. Dynamic recrystallization in AZ31 magnesium alloy. Mater. Sci. Eng. A 2007, 456, 52–57. [Google Scholar] [CrossRef]
  42. Sitdikov, O.; Kaibyshev, R. Dynamic recrystallization in pure magnesium. Mater. Trans. 2001, 42, 1928–1937. [Google Scholar] [CrossRef] [Green Version]
  43. Mukai, T.; Yamanoi, M.; Watanabe, H.; Higashi, K. Ductility enhancement in AZ31 magnesium alloy by controlling its grain structure. Scr. Mater. 2001, 45, 89–94. [Google Scholar] [CrossRef]
  44. Somekawa, H.; Singh, A.; Mukai, T. Microstructure evolution of Mg–Zn binary alloy during a direct extrusion process. Scr. Mater. 2009, 60, 411–414. [Google Scholar] [CrossRef]
  45. Singh, A.; Osawa, Y.; Somekawa, H.; Mukai, T. Ultra-fine grain size and isotropic very high strength by direct extrusion of chill-cast Mg–Zn–Y alloys containing quasicrystal phase. Scr. Mater. 2011, 64, 661–664. [Google Scholar] [CrossRef]
  46. Wang, B.; Xu, D.; Wang, S.; Sheng, L.; Zeng, R.C.; Han, E.H. Influence of solution treatment on the corrosion fatigue behavior of an as-forged Mg-Zn-Y-Zr alloy. Int. J. Fatigue 2019, 120, 46–55. [Google Scholar] [CrossRef]
  47. Du, Y.; Qiao, X.; Zheng, M.; Wu, K.; Xu, S. The microstructure, texture and mechanical properties of extruded Mg–5.3 Zn–0.2 Ca–0.5 Ce (wt%) alloy. Mater. Sci. Eng. A 2015, 620, 164–171. [Google Scholar] [CrossRef]
  48. Jiang, H.; Qiao, X.; Xu, C.; Zheng, M.; Wu, K.; Kamado, S. Ultrahigh strength as-extruded Mg–10.3 Zn–6.4 Y–0.4 Zr–0.5 Ca alloy containing W phase. Mater. Des. 2016, 108, 391–399. [Google Scholar] [CrossRef]
  49. Yu, H.; Xin, Y.; Wang, M.; Liu, Q. Hall-Petch relationship in Mg alloys: A review. J. Mater. Sci. Technol. 2018, 34, 248–256. [Google Scholar] [CrossRef]
  50. Kang, J.W.; Sun, X.F.; Deng, K.K.; Xu, F.J.; Zhang, X.; Bai, Y. High strength Mg-9Al serial alloy processed by slow extrusion. Mater. Sci. Eng. A 2017, 697, 211–216. [Google Scholar] [CrossRef]
  51. Li, H.; Hsu, E.; Szpunar, J.; Utsunomiya, H.; Sakai, T. Deformation mechanism and texture and microstructure evolution during high-speed rolling of AZ31B Mg sheets. J. Mater. Sci. 2008, 43, 7148–7156. [Google Scholar] [CrossRef]
  52. Yang, Y.; Huo, Q.; Zhang, Y.; Luo, L.; Xiao, Z.; Wang, J.; Hashimoto, A.; Yang, X. Effects of volume fraction of fine grains on the tensile creep properties of a hot-deformed Mg-Gd-Y-Zr alloy. Mater. Sci. Eng. A 2020, 777, 139052. [Google Scholar] [CrossRef]
  53. Xu, C.; Nakata, T.; Qiao, X.; Jiang, H.; Sun, W.; Chi, Y.; Zheng, M.; Kamado, S. Effect of extrusion parameters on microstructure and mechanical properties of Mg-7.5 Gd-2.5 Y-3.5 Zn-0.9 Ca-0.4 Zr (wt%) alloy. Mater. Sci. Eng. A 2017, 685, 159–167. [Google Scholar] [CrossRef]
  54. Chai, L.; Xia, J.; Zhi, Y.; Gou, Y.; Chen, L.; Yang, Z.; Guo, N. Deformation mode-determined misorientation and microstructural characteristics in rolled pure Zr sheet. Sci. China Technol. Sci. 2018, 61, 1346–1352. [Google Scholar] [CrossRef]
  55. Kang, J.W.; Wang, C.J.; Deng, K.K.; Nie, K.B.; Bai, Y.; Li, W.J. Microstructure and mechanical properties of Mg-4Zn-0.5 Ca alloy fabricated by the combination of forging, homogenization and extrusion process. J. Alloys Compd. 2017, 720, 196–206. [Google Scholar] [CrossRef]
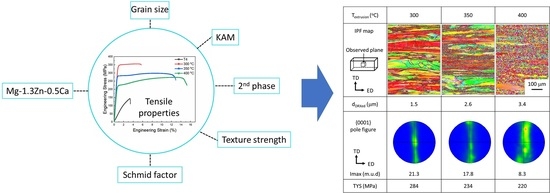
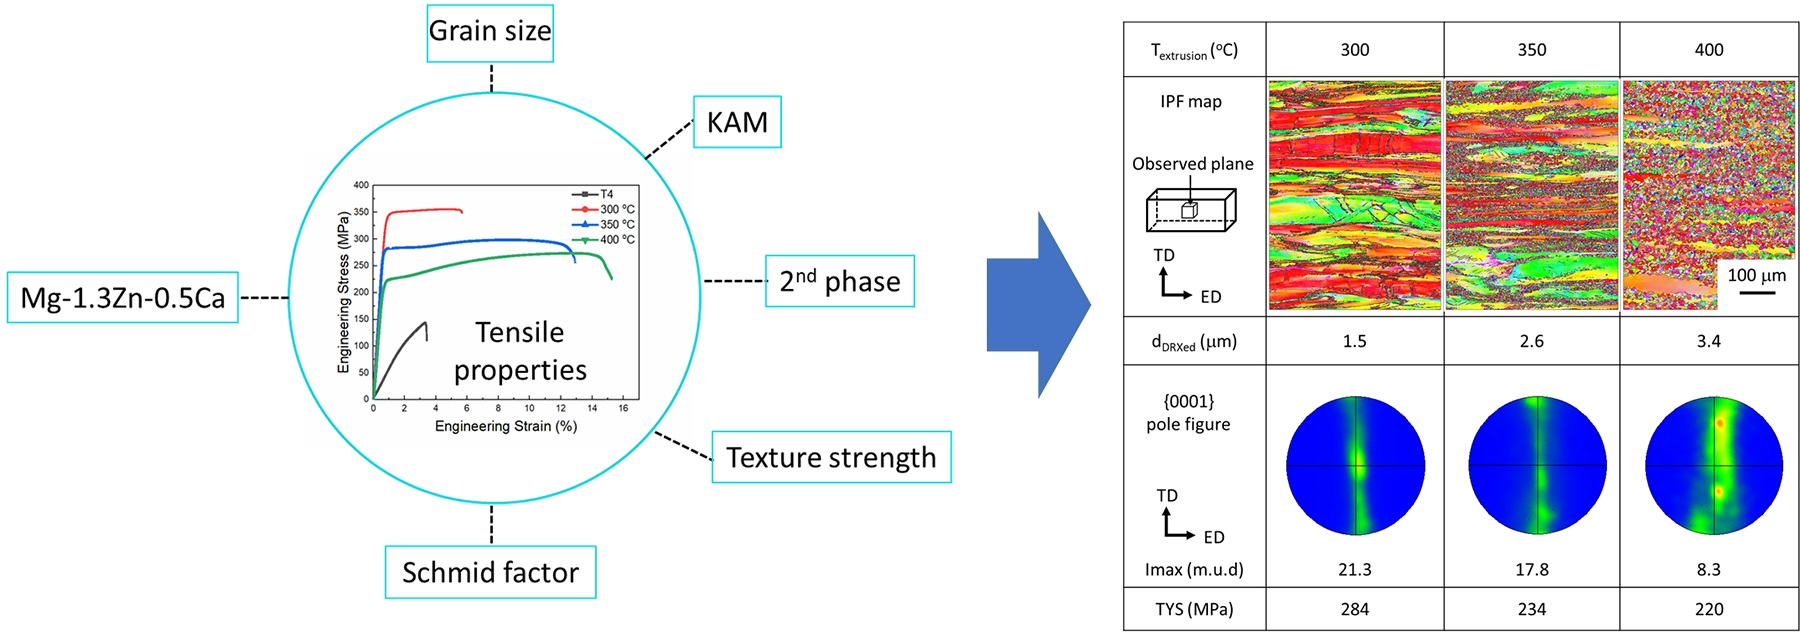
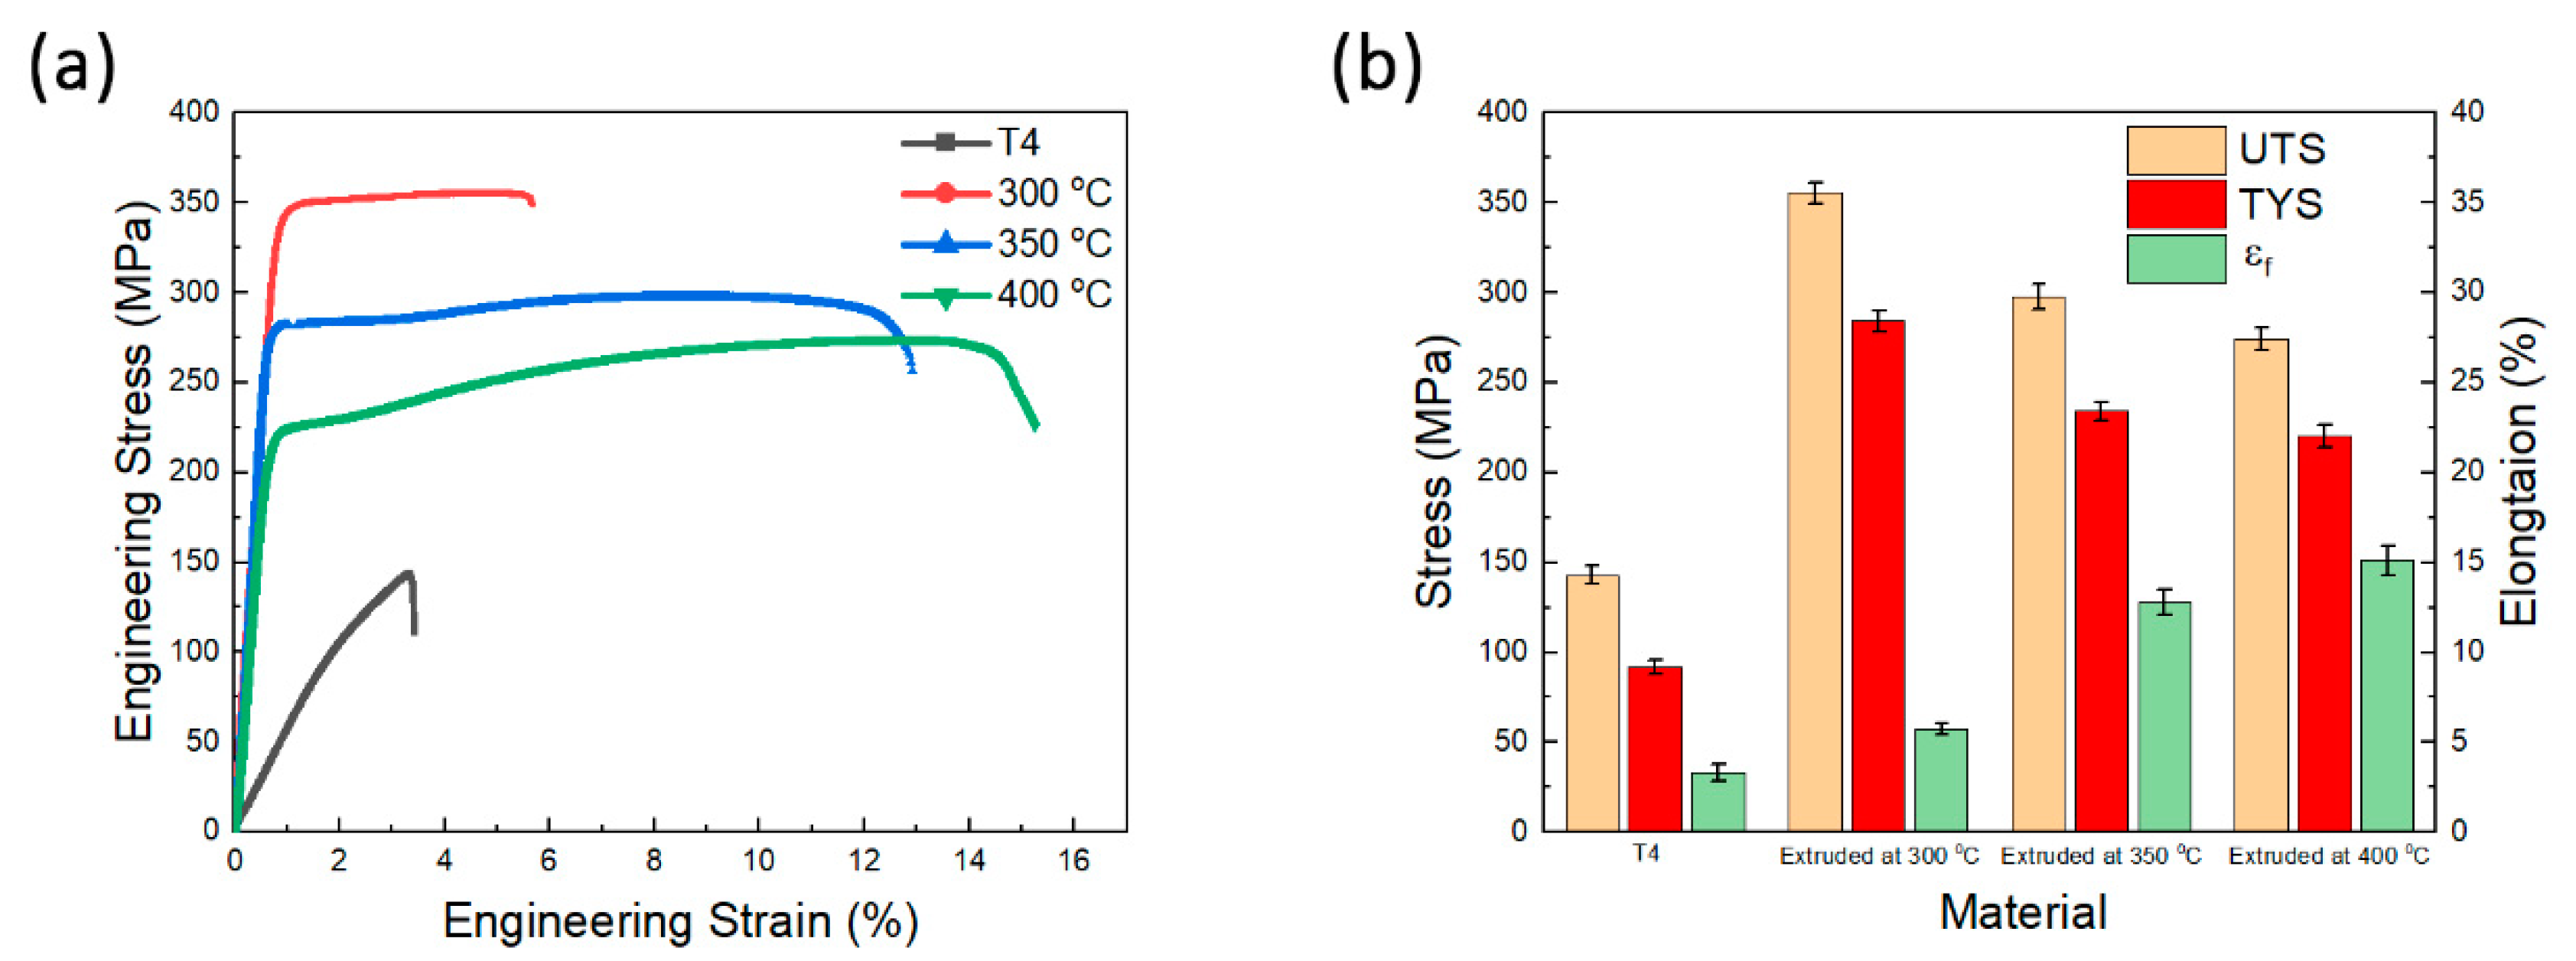
Figure 1. (a,b) Optical micrographs of the as-cast ZX10 alloy and (ce) EDS analysis of as-cast ZX10 alloy: (c) SEM image, corresponding elemental maps of Ca (d) and Zn (e), and (f) point analysis results of second phase precipitates identified (with red crosses) in (c).
Crystals 11 01228 g001
Figure 2. Optical micrographs of as-homogenized ZX10 alloy: (a) Low magnification, (b) High magnification.
Crystals 11 01228 g002
Figure 3. Optical micrographs without etching of the as-extruded ZX10 alloy showing the distribution of second phase precipitates: (a) 300 °C, (b) 350 °C, and (c) 400 °C. The precipitates were marked by red arrows.
Crystals 11 01228 g003
Figure 4. SEM observation of ZX10 alloy extruded at 400 °C: (a) SEM image, corresponding elemental maps of Ca (b) and Mg (c).
Crystals 11 01228 g004
Figure 5. Optical micrographs of the as-extruded ZX10 alloy at different temperatures. (a,b) 300 °C, (c,d) 350 °C, and (e,f) 400 °C. The red arrows indicate large unDRXed grains.
Crystals 11 01228 g005
Figure 6. Inverse pole figure (IPF) maps on the ND plane of the ZX10 alloy (on the left) and corresponding grain size distributions (on the right) for the conditions: (a) extruded at 300 °C, (b) extruded at 350 °C, (c) extruded at 400 °C.
Crystals 11 01228 g006
Figure 7. Optical micrographs of the interrupted die sample extruded at 400 °C at different positions shown in schematic illustration (see inset): (a) large overview of the area near the die exit, and (bd) indicate different locations below the die exit. Red arrows indicate the large unDRXed grains.
Crystals 11 01228 g007
Figure 8. Pole figures of the ZX10 alloy extruded at: (a) 300 °C, (b) 350 °C, and (c) 400 °C.
Crystals 11 01228 g008
Figure 9. Pole figures and inverse pole figures of the ZX10 alloy extruded at 300 °C. (a) unDRXed regions and (b) DRXed regions.
Crystals 11 01228 g009
Figure 10. Mechanical properties of the ZX10 alloy extruded at different temperatures. (a) the tensile engineering stress-strain curves and (b) UTS; ultimate tensile strength, TYS (tensile yield strength), and elongation.
Crystals 11 01228 g010
Figure 11. The comparison of tensile yield strength (TYS) among the present ZX10 alloy extruded at different temperatures and other low-alloying Mg-Zn-Ca, AZ and ZK series, and RE-containing alloys.
Crystals 11 01228 g011
Figure 12. The relationship between volume fraction of the DRXed region and the volume fraction of large precipitates (>1 µm).
Crystals 11 01228 g012
Figure 13. EBSD results of the interrupted die sample extruded at 400 °C at different positions (a,b) 0 mm, (c,d) 5 mm, and (e,f) 10 mm below the die exit: (a,c,e) are IPF maps, and (b,d,f) are the line profiles of the misorientation angle along the arrow AB shown in (a,c,e).
Crystals 11 01228 g013
Figure 14. Hall–Petch plots of the σy against d−1/2 for the extruded ZX10 alloy.
Crystals 11 01228 g014
Figure 15. KAM value distributions (a), and average KAM values (b) of the as-extruded ZX10 alloy under different conditions calculated based on EBSD analysis.
Crystals 11 01228 g015
Figure 16. Schmid factor of the {0001} <11 2 ¯ 0> basal slip distribution histograms of the ZX10 alloy extruded at: (a) 300 °C, (b) 350 °C, and (c) 400 °C.
Crystals 11 01228 g016
Figure 17. Optical micrographs on the side surface near the fracture and SEM fractography of the ZX10 alloy extruded at: (a,b) 300 °C, (c,d) 350 °C, and (e,f) 400 °C; evidence of twinning, micro-cracks, and dimples are indicated by red arrows.
Crystals 11 01228 g017
Table 1. Results of Tensile Testing of the ZX10 alloy carried out along ED.
MaterialUTS (MPa)TYS (MPa)EL * (%)
T4143 ± 692 ± 43.3 ± 0.5
Extruded at 300 °C355 ± 6284 ± 65.7 ± 0.3
Extruded at 350 °C298 ± 7234 ± 512.8 ± 0.7
Extruded at 400 °C274 ± 6220 ± 615.1 ± 0.8
* EL: elongation.
Publisher’s Note: MDPI stays neutral with regard to jurisdictional claims in published maps and institutional affiliations.

