1. Introduction
As a kind of soft magnetic material, grain-oriented silicon steel is widely used in the manufacture of iron cores of various transformers and large generators [
1,
2,
3]. It is an indispensable important functional material in the fields of electronics and electric power and in the military industry. Due to the increasing emphasis on environmental protection, energy saving and emission reduction in recent years, the traditional high-temperature slab-heating technology has become unsuitable for the development of grain-oriented silicon steel. The production of grain-oriented silicon steel, especially high-magnetic-induction grain-oriented silicon steel by low-temperature slab-heating technology, has become a research hotspot at home and abroad [
4,
5,
6].
The final microstructure and texture of grain-oriented silicon steel are completely formed by the secondary recrystallization that occurs during high-temperature annealing, and the microstructure and texture of the secondary recrystallization are affected by the texture formed during the decarburization annealing. In order to obtain a certain amount of primary recrystallized grains with Goss orientation, which will become the secondary recrystallized crystal nucleus, the decarburization annealing must be applied to the cold-rolled sheet to cause primary recrystallization. The microstructure and texture of primary recrystallization of traditional oriented silicon steel using MnS and AlN as inhibitors have been extensively studied [
7,
8,
9,
10]. At present, the production of oriented silicon steel, especially Hi-B oriented steel, is mainly based on the traditional high-temperature slab-heating process, and the inhibitors are mainly MNS and AlN with high solid solution temperature (above 1350 °C). Previous studies have shown that adding Nb to silicon steel can significantly reduce the solid solution temperature of AlN. At the same time, adding an appropriate amount of Nb to silicon steel can make the solid solution temperature of Nb(N,C) lower than 1250 °C. Therefore, using Nb(N,C) and AlN as the main inhibitors can achieve a lower slab reheating temperature (lower than 1250 °C), which has the advantages of energy saving, improving yield and prolonging furnace life [
11,
12]. However, research on the decarburization annealing process for Nb-containing low-temperature oriented silicon steel has been rarely reported so far. In this paper, the primary recrystallization microstructure, texture and grain boundary of Nb-containing low-temperature oriented silicon steel after decarburization annealing at different holding times were studied by OM, EBSD and XRD. The samples with different decarburization annealing time were annealed at high temperature, and the effects of different decarburization annealing times on the secondary recrystallization, texture and magnetic properties of the final product of Nb-containing low-temperature oriented silicon steel were also studied.
2. Materials and Methods
The sample was a cold-rolled plate obtained by single cold rolling of a hot-rolled plate at a reduction of 88%. The chemical composition of the cold-rolled plate is shown in
Table 1. The decarbonization annealing process is that the sample is heated to 850 °C in a sliding rapid annealing furnace (Zhonghuan RTP-08123K-H, Tianjin, China), held for 3, 5 and 7 min, respectively. Additionally, the mixture of 25% N
2 and 75% H
2 is introduced to the furnace as the protective atmosphere. The water bath temperature is about 60 °C. Finally, the samples obtained after decarburization annealing are heated to 1200 °C at a heating rate of 50 °C/h and annealed at this temperature for 10 h.
Samples with the size of 12 mm × 5 mm were cut from the steel sample after decarburization annealing and after high-temperature annealing by wire cutting machine. The metallographic sample with a size of 12 mm × 5 mm was cut from the decarburization annealed steel sample by wire cutting machine, and microstructures were observed by Axiovert-200MAT Zeiss metallographic microscope. The EBSD samples were electropolished in 8% perchloric acid ethanol solution. The microstructure and texture of the samples were analyzed by an electron backscatter diffraction (EBSD) system mounted on an FEI Quanta 650 FEG scanning electron microscope. The ODFs of all studied samples were calculated from EBSD measurement using the TSL OIM package. The grain boundary character analysis and ODFs of each sample were all calculated based on the data of more than 400 grains. In ODF analysis, texture components were divided into 7 grades. The magnetic properties, such as iron loss (P1.7/50 (W/kg)) and magnetic induction (B800 (T)) of the final product of silicon steel sheets, were measured by using a 2000E type testing system for AC magnetic properties of silicon steel sheets, and a magnetic permeameter for a silicon steel sheet with a size of 30 × 100 mm.
3. Results
3.1. Effect of Decarburization Annealing Time on Primary Recrystallization
3.1.1. Microstructure of Primary Recrystallization
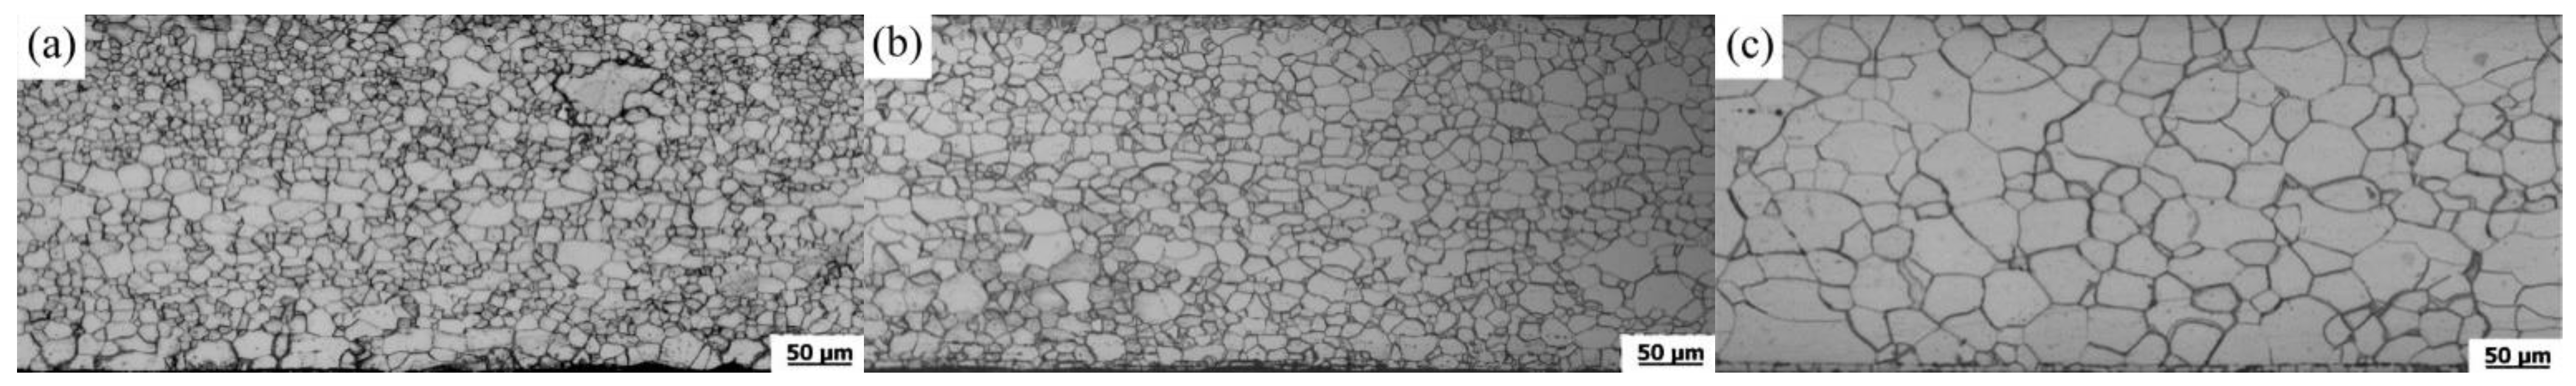
Figure 1 shows the microstructure of decarbonized annealing samples along the thickness direction of Nb-containing low-temperature oriented silicon steel at different holding times. As shown in
Figure 1, all samples annealed at different holding times were completely recrystallized, and their microstructure is composed of single ferrite equiaxed grains. However, the homogeneity of average grain size and microstructure are quite different. With the increase in holding time, the grain size increases gradually, and the microstructure changes from non-uniform to homogeneous to non-uniform.
When the holding time is 3 min, the grain size is the smallest; the average grain size is about 13 μm, but the microstructure uniformity is poor. This is because when recrystallization occurs, the nucleation and growth occur firstly at the locations where storage energy is relatively high, while the process of recrystallization at the locations with lower storage energy is relatively prolonged. Because of the short holding time, the recrystallization grains in these regions have no time to grow. This results in the non-uniform microstructure [
12,
13,
14]. With the increase in decarburization annealing time, the small grains will gradually grow. When the holding time is 5 min, the best uniformity of the microstructure is obtained, and the average grain size is about 15 μm. The fine uniform primary recrystallization grain obtained is favorable for the secondary recrystallization grain to annex the first recrystallized grain during the final high-temperature annealing, and the primary recrystallization grain grows abnormally [
15]. With a further increase in decarburization annealing time, the grain growth is obvious. The average grain size in the matrix exceeds 25 μm after holding for 7 min. There are several coarse grains in the sample. The different grain storage energy in different orientations leads to different driving forces of recrystallization growth, and the homogeneity of grain size decreases. In conclusion, when holding time is 5 min, the primary recrystallized grains are the most uniform.
3.1.2. Primary Recrystallization Texture
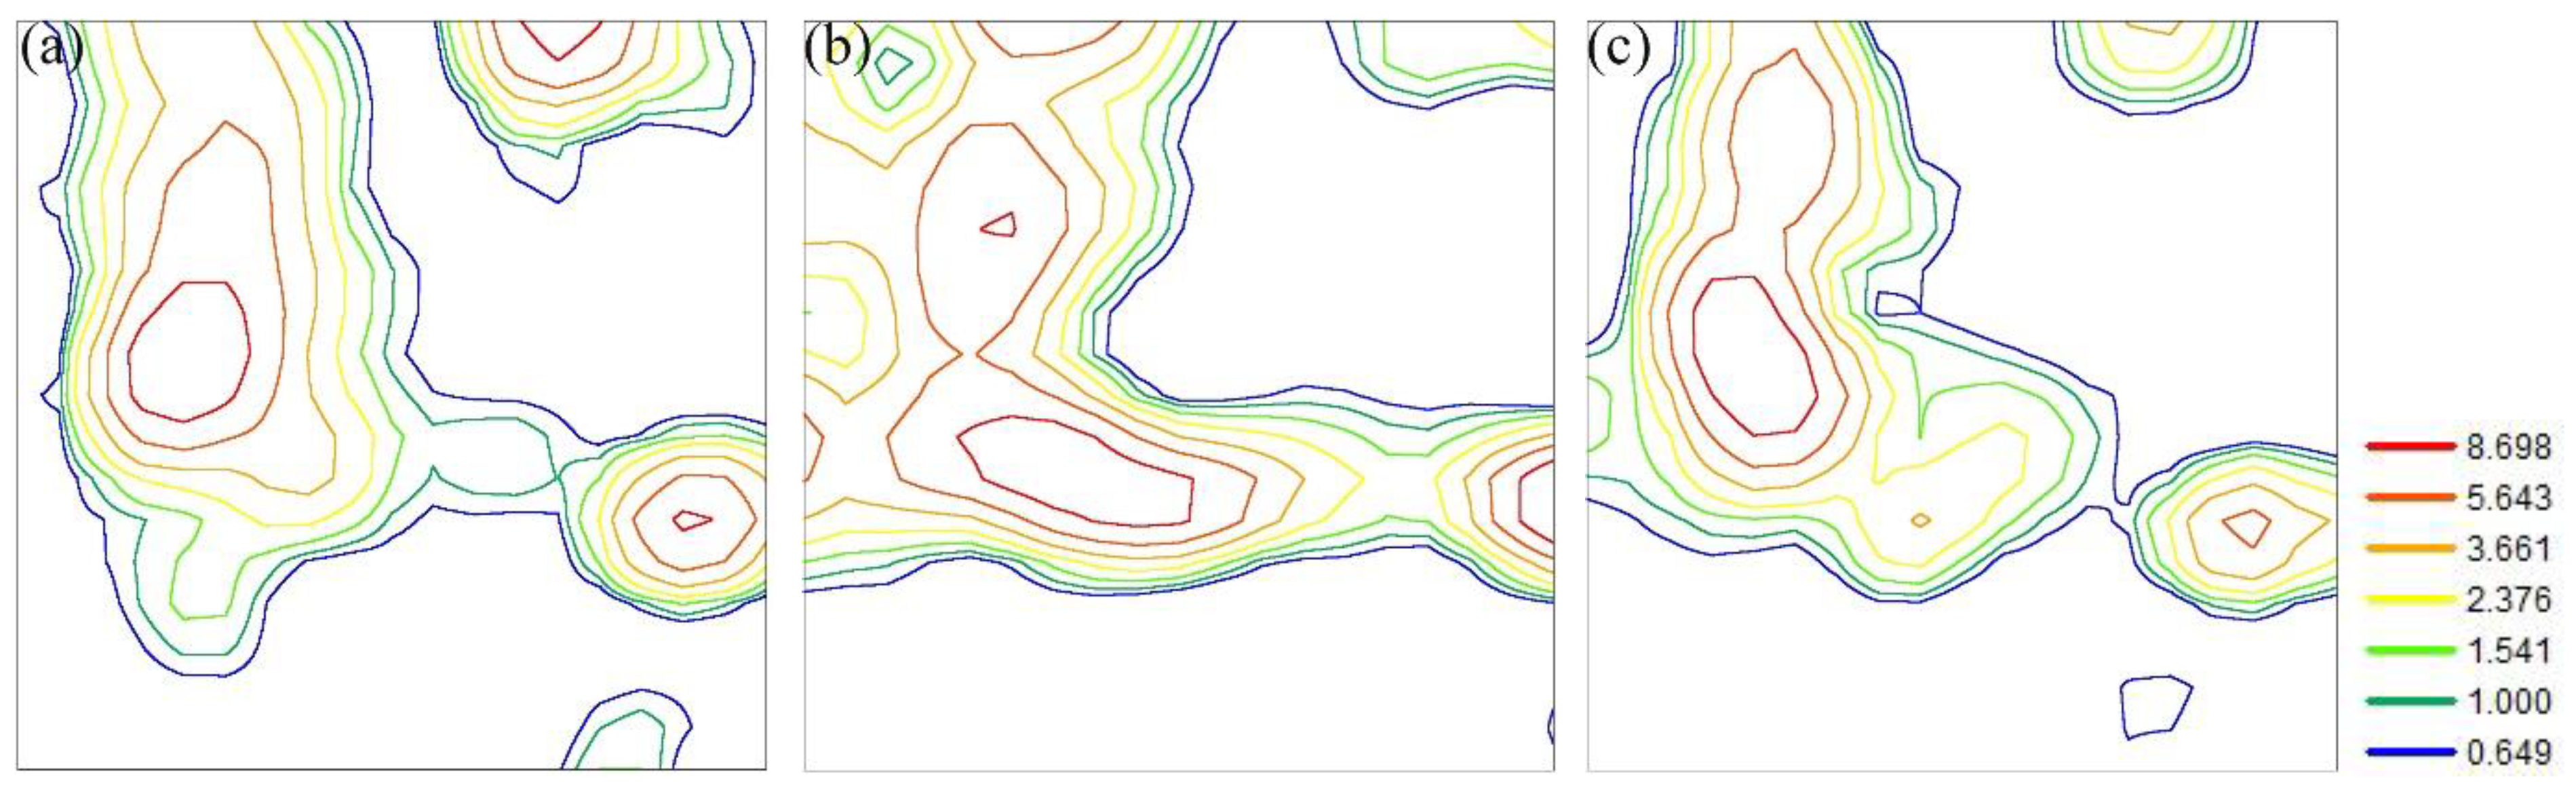
Figure 2 shows the section of the surface texture orientation distribution function φ
2 = 45° after decarbonization annealing at different holding times. It can be observed from
Figure 2 that the texture types of primary recrystallization after decarburization annealing at three different times are basically same, the γ-fiber texture {111} <112>, {111} <110> dominate, the strength of the α-fiber texture is relatively weak and there are some weaker Goss texture components. Different grain strain energy storage occurs in cold-rolled deformation matrices with different orientations, (110) > (111) > (112) > (001) [
12]. Therefore, during decarburization annealing, the (111) grains firstly nucleate and grow, and the (001) grains that have not been recrystallized around are swallowed by grain boundary migration. Therefore, γ-fiber texture {111} <112>, {111} <110> becomes the strongest component in the primary recrystallization texture. When holding for 3 min, there is a small brass texture {011} <211>, such that the abnormal growth of the brass texture during high-temperature annealing has a negative effect on the formation of Goss texture during secondary recrystallization.
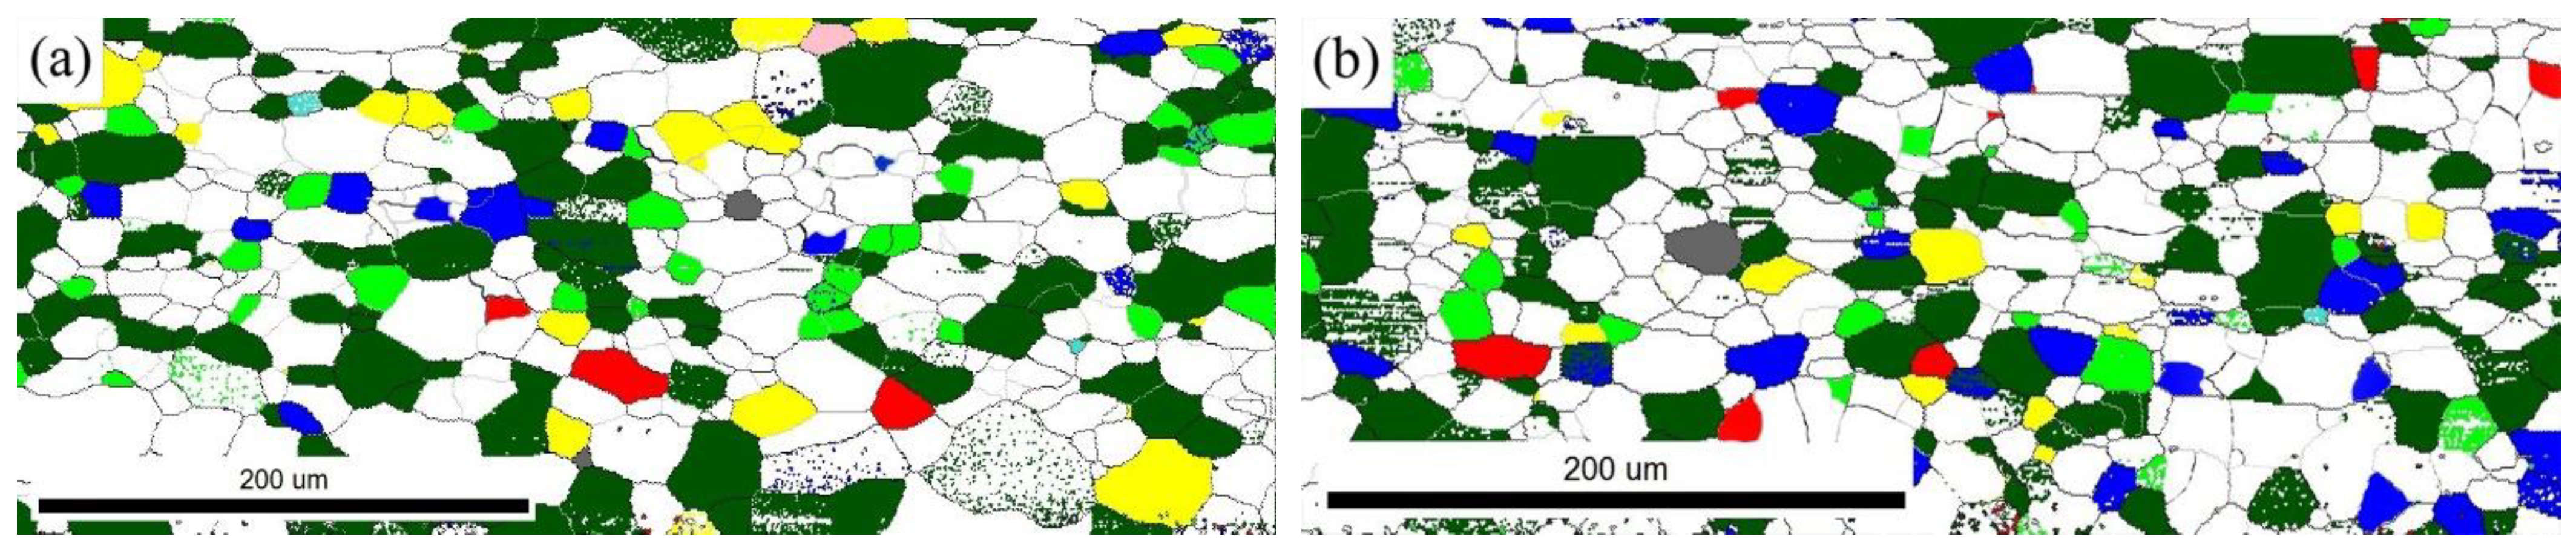
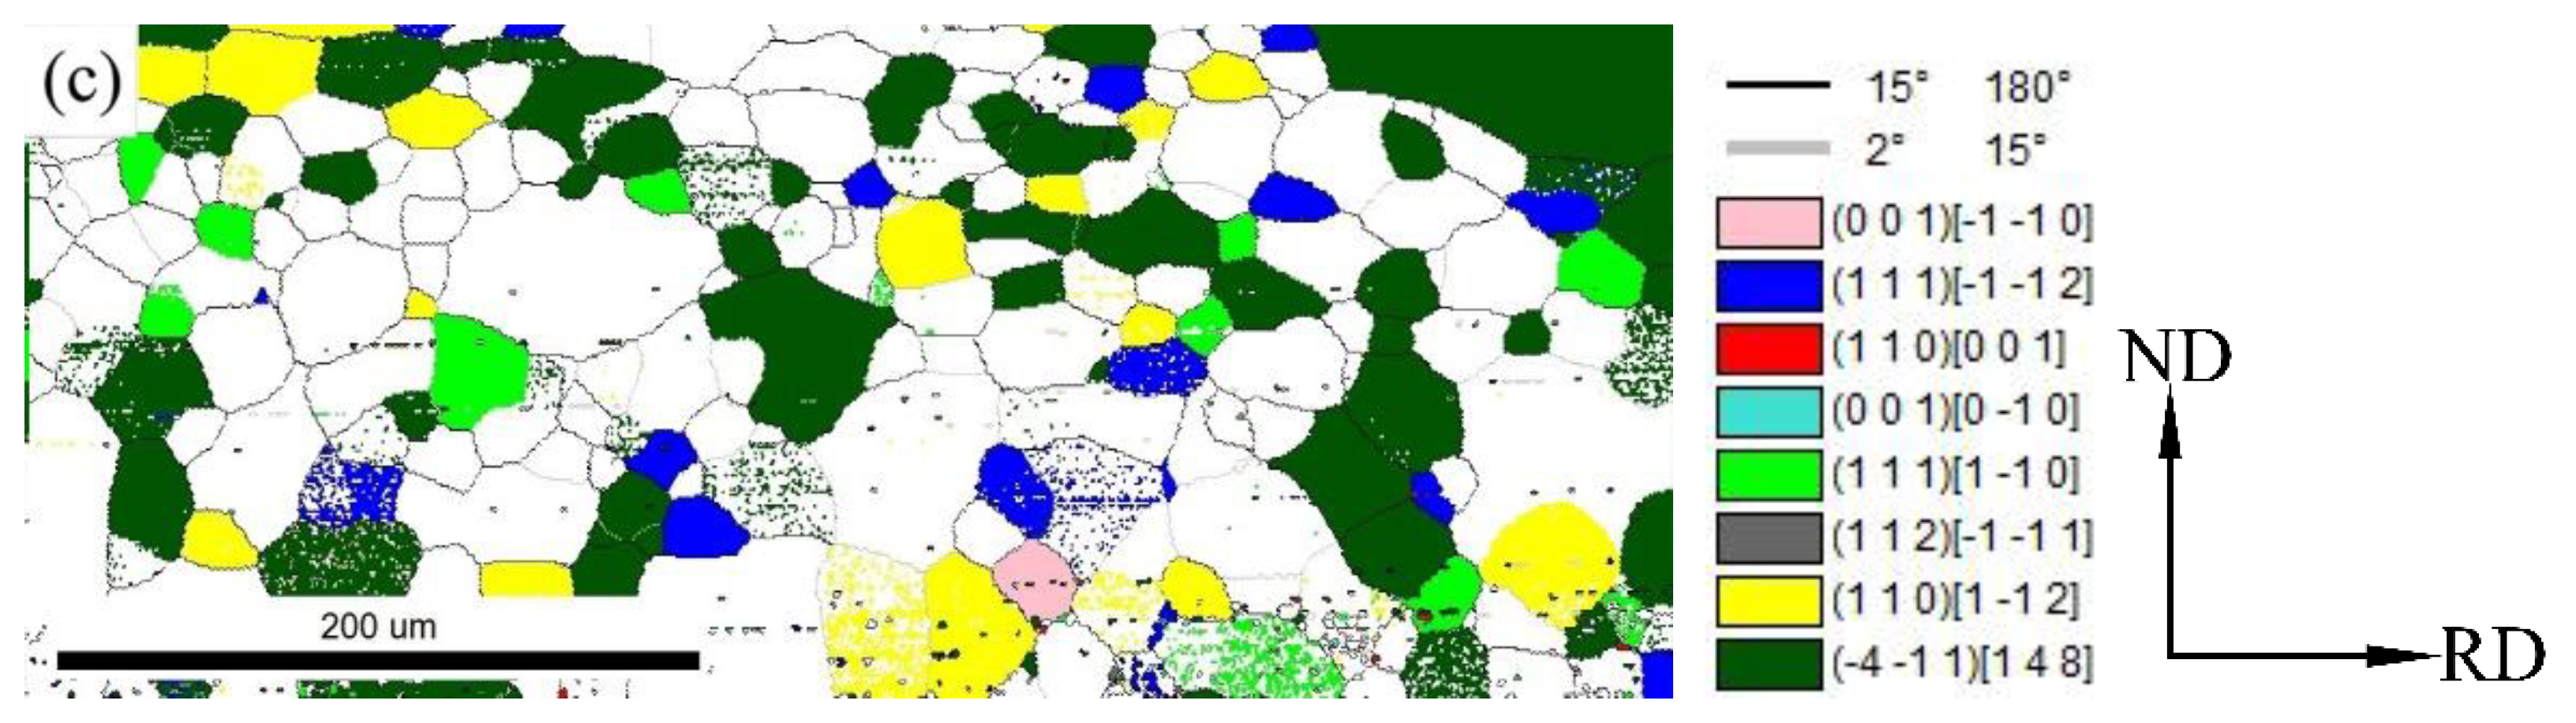
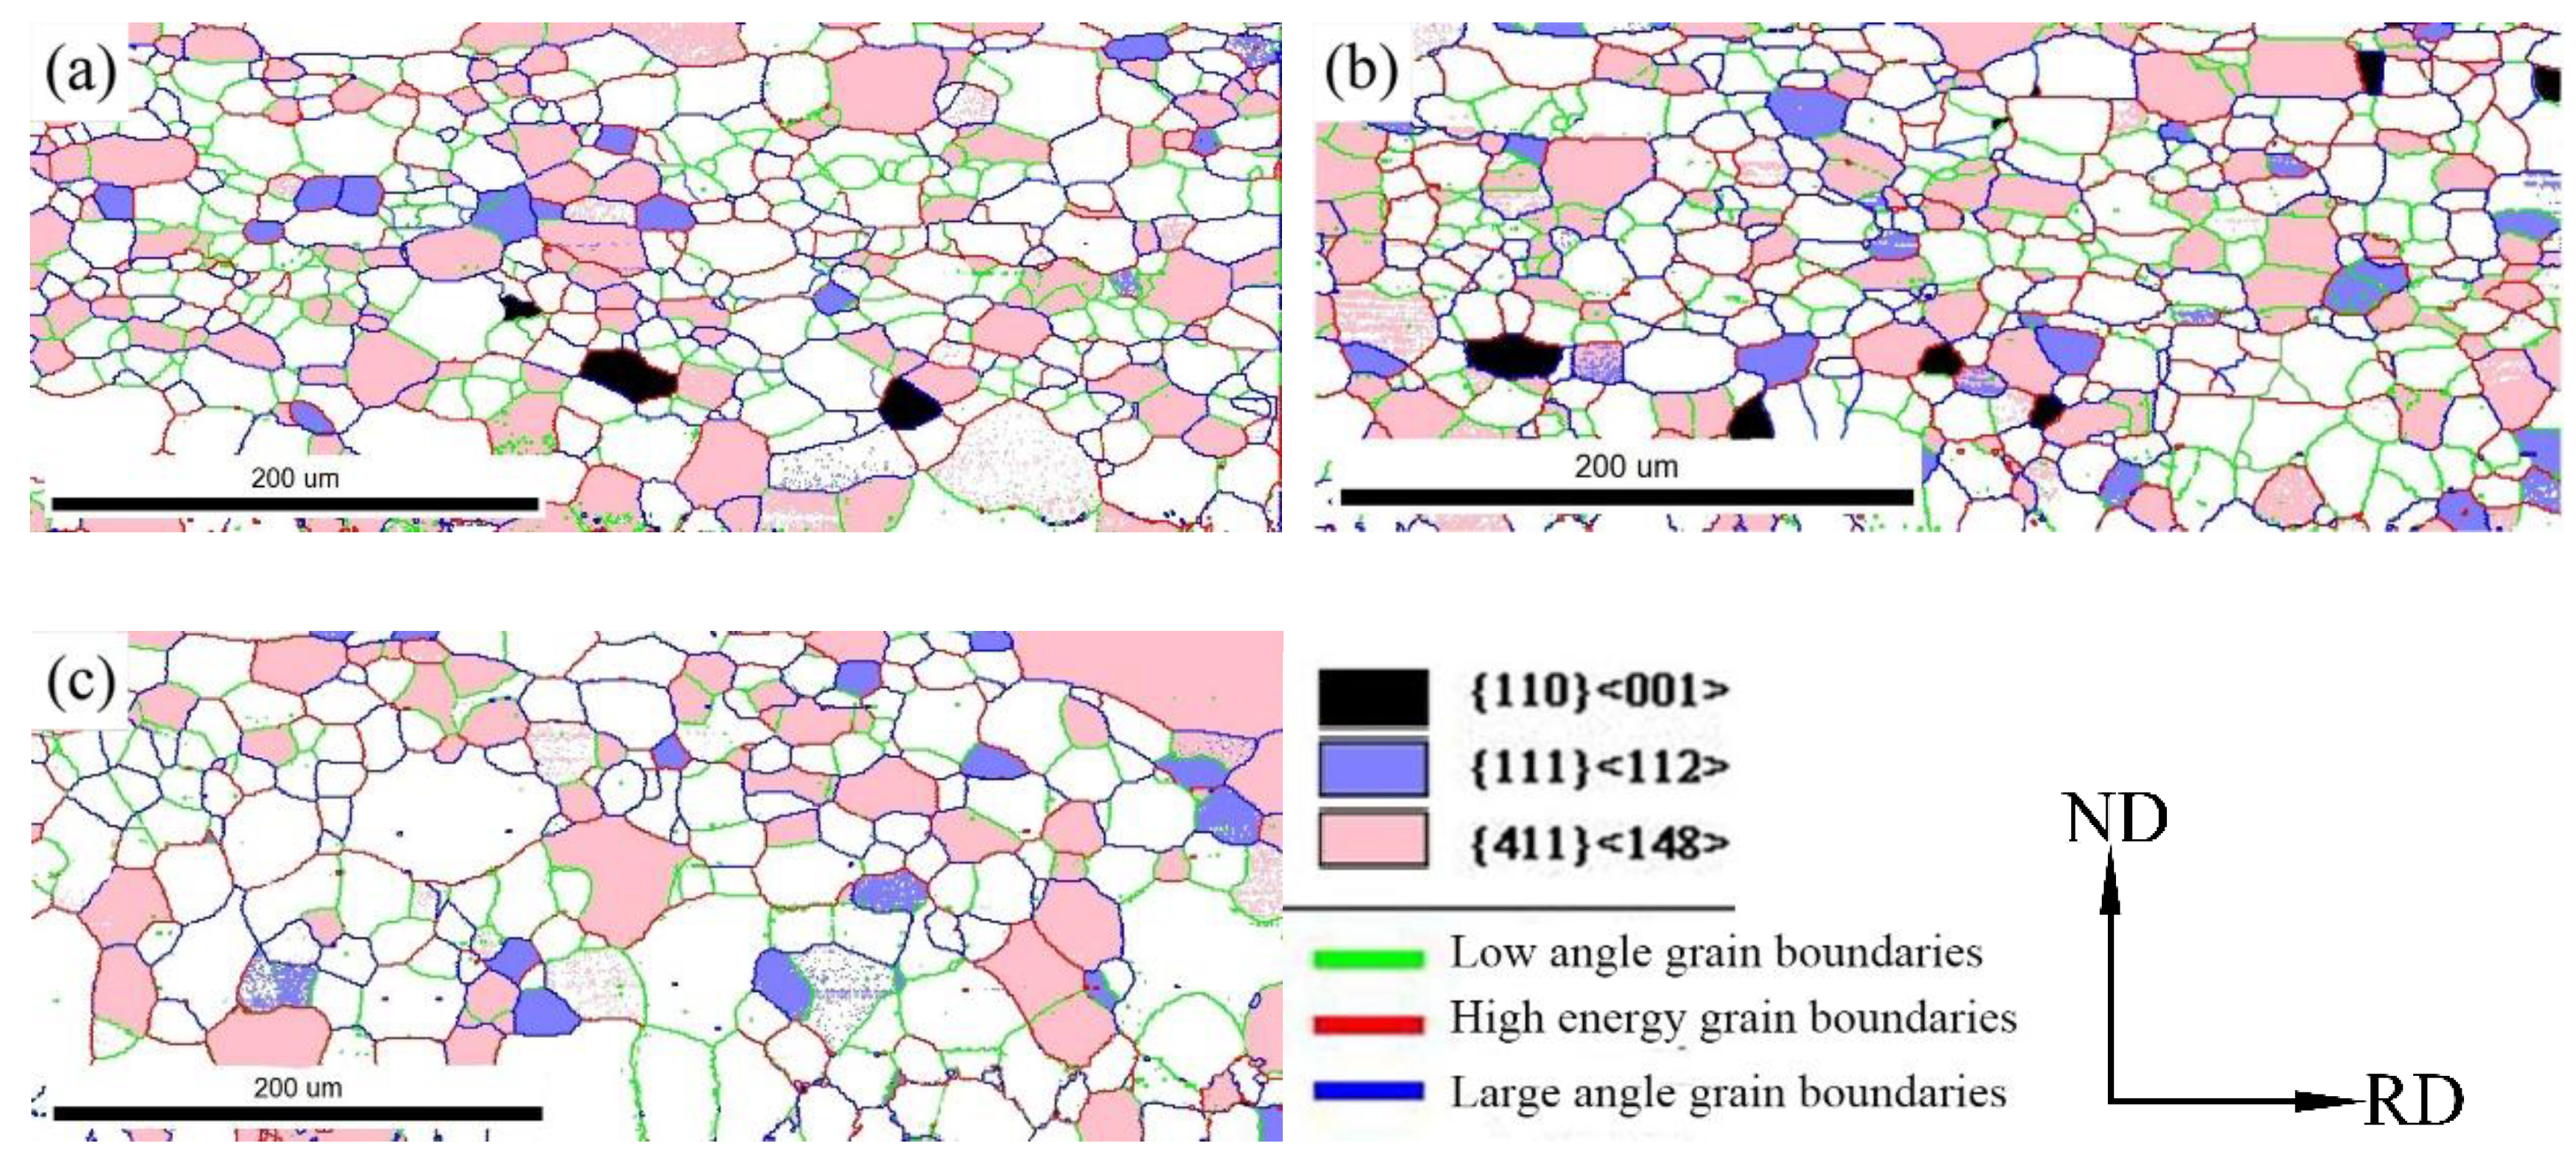
Figure 3 shows the EBSD orientation maps of decarbonized annealing samples along the thickness direction at different holding times.
Table 2 shows the content of the main textures in the sample (the misorientation angle is 15°). In
Figure 2, the blue and green grains represent the {111} <112> and {111} <110> textures on the γ-fiber, respectively; the dark green is {411} <148> texture, the red is Goss texture. After decarbonization annealing, the texture along the thickness direction of the plate is relatively uniform, and the texture composition is almost the same, mainly including blue, green and dark green, and the three kinds of grains are distributed in the surface layer, the subsurface layer and the central layer. Most of the texture around the red Goss texture is {111} <112>, {411} <148> and {111} <110> texture, and there is no size advantage. As shown in
Table 2, the percentage of {411} < 148 > texture in different holding times is the highest. Because the primary cold-rolling method was used in this experiment, the reduction is relatively large. After cold rolling, strong {001} <110> texture and {112} <110> texture are easily formed, while {411} < 148 > texture quantity is relatively small, and most of them are distributed in the grain boundary, sub-grain boundary and dislocation of α-fiber oriented grain [
16,
17,
18]. When decarburization annealing is carried out, because of the low storage energy of α-fiber oriented grains during cold deformation, the recrystallization process and grain growth process become slower and the α fiber oriented grains will form a large-angle grain boundary with the nearby {411} <148> oriented grains. Therefore, there is a strong {411} <148> orientation texture in the matrix after decarburization annealing. The content of {411} <148> texture is the highest and {111} <112> content is the lowest at 3 min, {411} <148> content is the lowest and {111} <112> content is the highest at 5 min and {110} <112> texture content is the least and most distributed near the central layer; the content of {110} <112> texture is the highest and the content of Goss texture is the least at 7 min. From
Figure 3 and
Table 3, the advantageous {411} <148> and {111} <112> textures are greater at 5 min.
3.1.3. Grain Boundary Characteristics of Primary Recrystallization
The high-energy (HE) boundaries model [
11,
19,
20] states that the grain boundary defects are greater between 20° and 45° orientation difference, the grain boundary energy is higher and the grain boundary mobility is higher, which is beneficial to the nucleation and growth of Goss oriented grains. The grain boundary with a large difference in orientation has a direct influence on the nucleation and growth of the {110} <001> texture in the secondary recrystallization. When the number of high-energy grain boundaries and large-angle grain boundaries is large, the overall storage energy of the grain boundaries is also high. When the number of high-energy grain boundaries and large-angle grain boundaries is large, the overall storage energy of grain boundaries is also high, so the migration speed is high, and the inhibitor at this time has only weakly inhibiting high-energy grain boundaries and large-angle grain boundaries. The ability of the grain boundary to diffuse outward and move forward is relatively strong, and the {110} <001> grain is more susceptible to nucleation and growth.
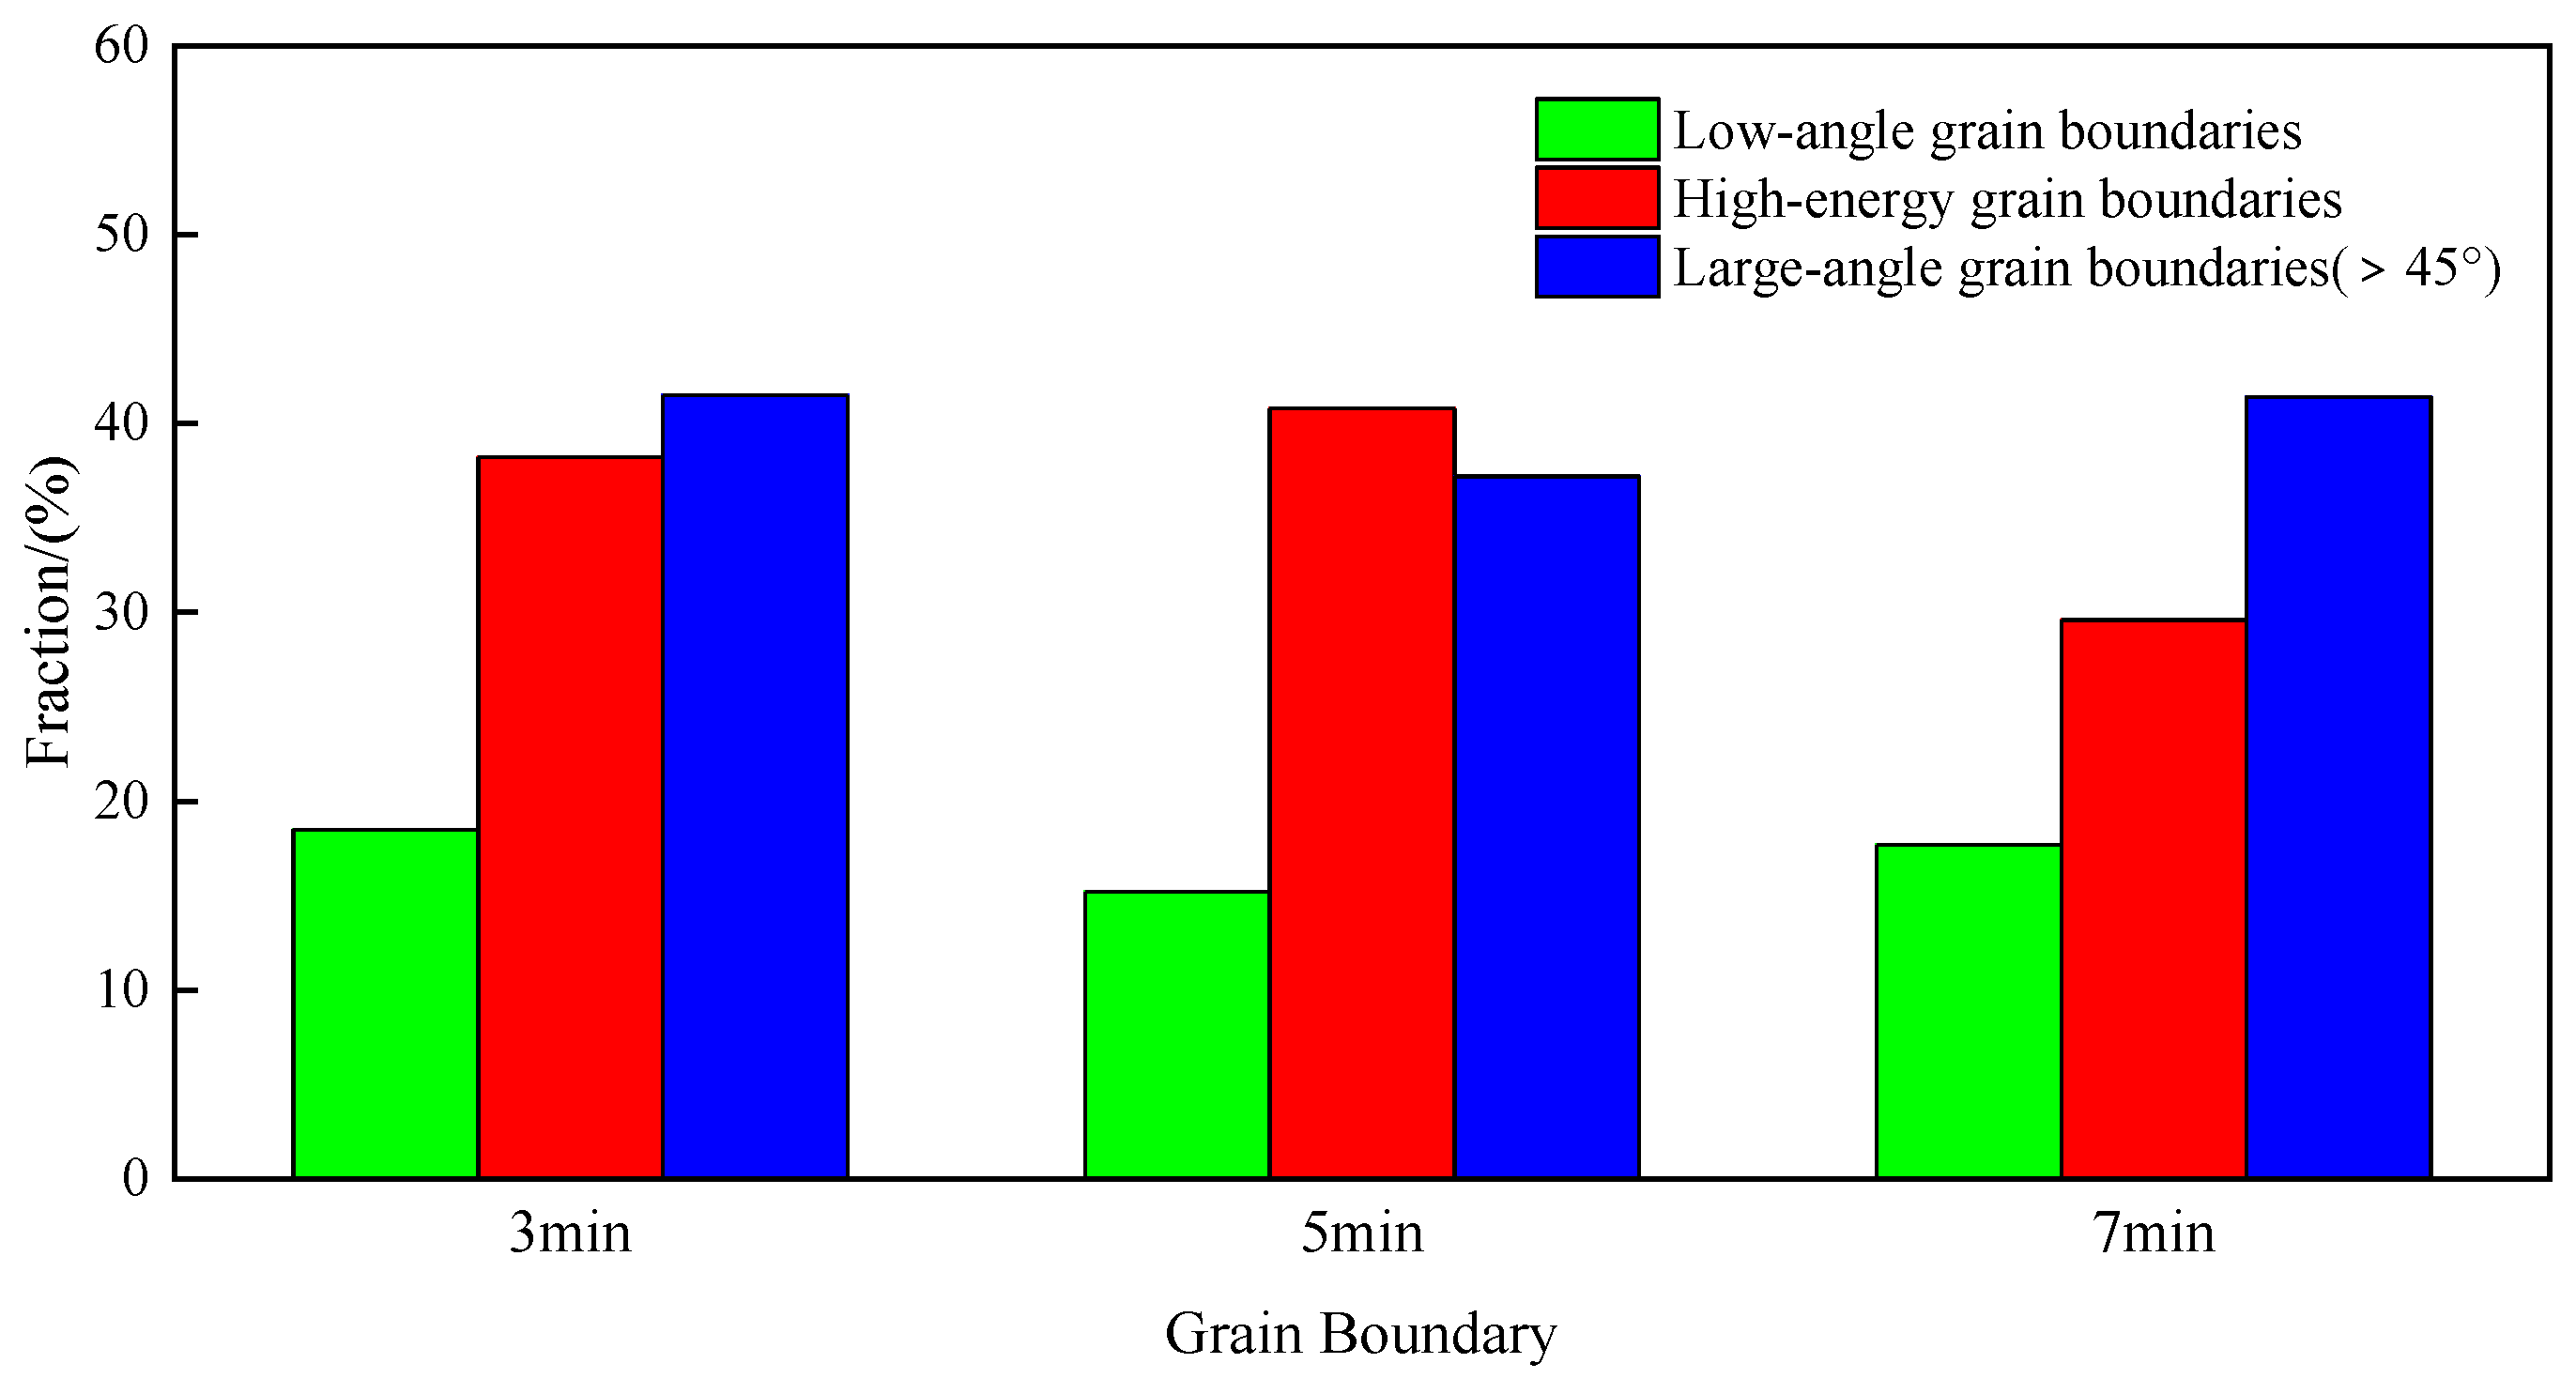
Figure 4 is a grain boundary distribution diagram of the decarburization annealing sample along the thickness direction of different holding time periods, wherein the proportion of the low-angle grain boundaries, the high-energy grain boundaries and the large-angle grain boundaries of >45° are shown in
Figure 5. It can be seen from
Figure 4 that there are only two types of grain boundaries around the Goss texture: a high-energy grain boundary and a very small number of large-angle grain boundaries of >45°, and the two grain boundaries are easy to migrate. Both types of grain boundaries exist around {111} <112> and {411} <148> textures, and Goss texture and high-energy crystals are easily formed between {111} <112> and {411} <148> textures. At this time, the storage energy of the grain boundary is high, so there is a high migration speed, which is very helpful for the abnormal growth of Goss grains during high-temperature annealing. It can be observed from
Figure 4 and
Figure 5 that the proportion of high-energy grain boundaries and large-angle grain boundaries of >45° formed in the primary recrystallized matrix after decarburization annealing at different holding times is larger than that of low-angle grain boundaries. When the temperature is held for 3 min and 7 min, the large-angle grain boundary of >45° is the greatest, followed by the high-energy grain boundary and then the low-angle grain boundary. When the temperature is held for 5 min, there are the greatest high-energy grain boundaries with high mobility, and the smallest low-angle grain boundaries with low mobility. The grain boundary distribution at this holding time is most beneficial to the abnormal growth of the subsequent Goss grains.
The coincident site lattice (CSL) boundaries model [
21] holds that the higher migration velocity of the CSL grain boundary is beneficial to the growth of Goss oriented grains, especially the higher migration velocity of the Σ9 grain boundary, and the most likely migration occurs, followed by Σ5 grain boundary; the Σ3 grain boundary is not mobile. The primary recrystallization occurs when the cold-rolled sample undergoes decarburization annealing, wherein the {411} <148> and {111} <112> oriented grains, respectively, satisfy the high mobility of the Σ9 grain boundary with the Goss grains. The primary recrystallization occurs when the cold-rolled sample undergoes decarburization annealing, wherein the {411} <148> and {111} <112> oriented grains and the Goss grains, respectively, satisfy the high mobility of the Σ9 grain boundary. Therefore, Goss grains will move on the fast grain boundaries and grow by consuming a large number of grains of {111} <112> and {411} <148> orientations in the secondary recrystallization process.
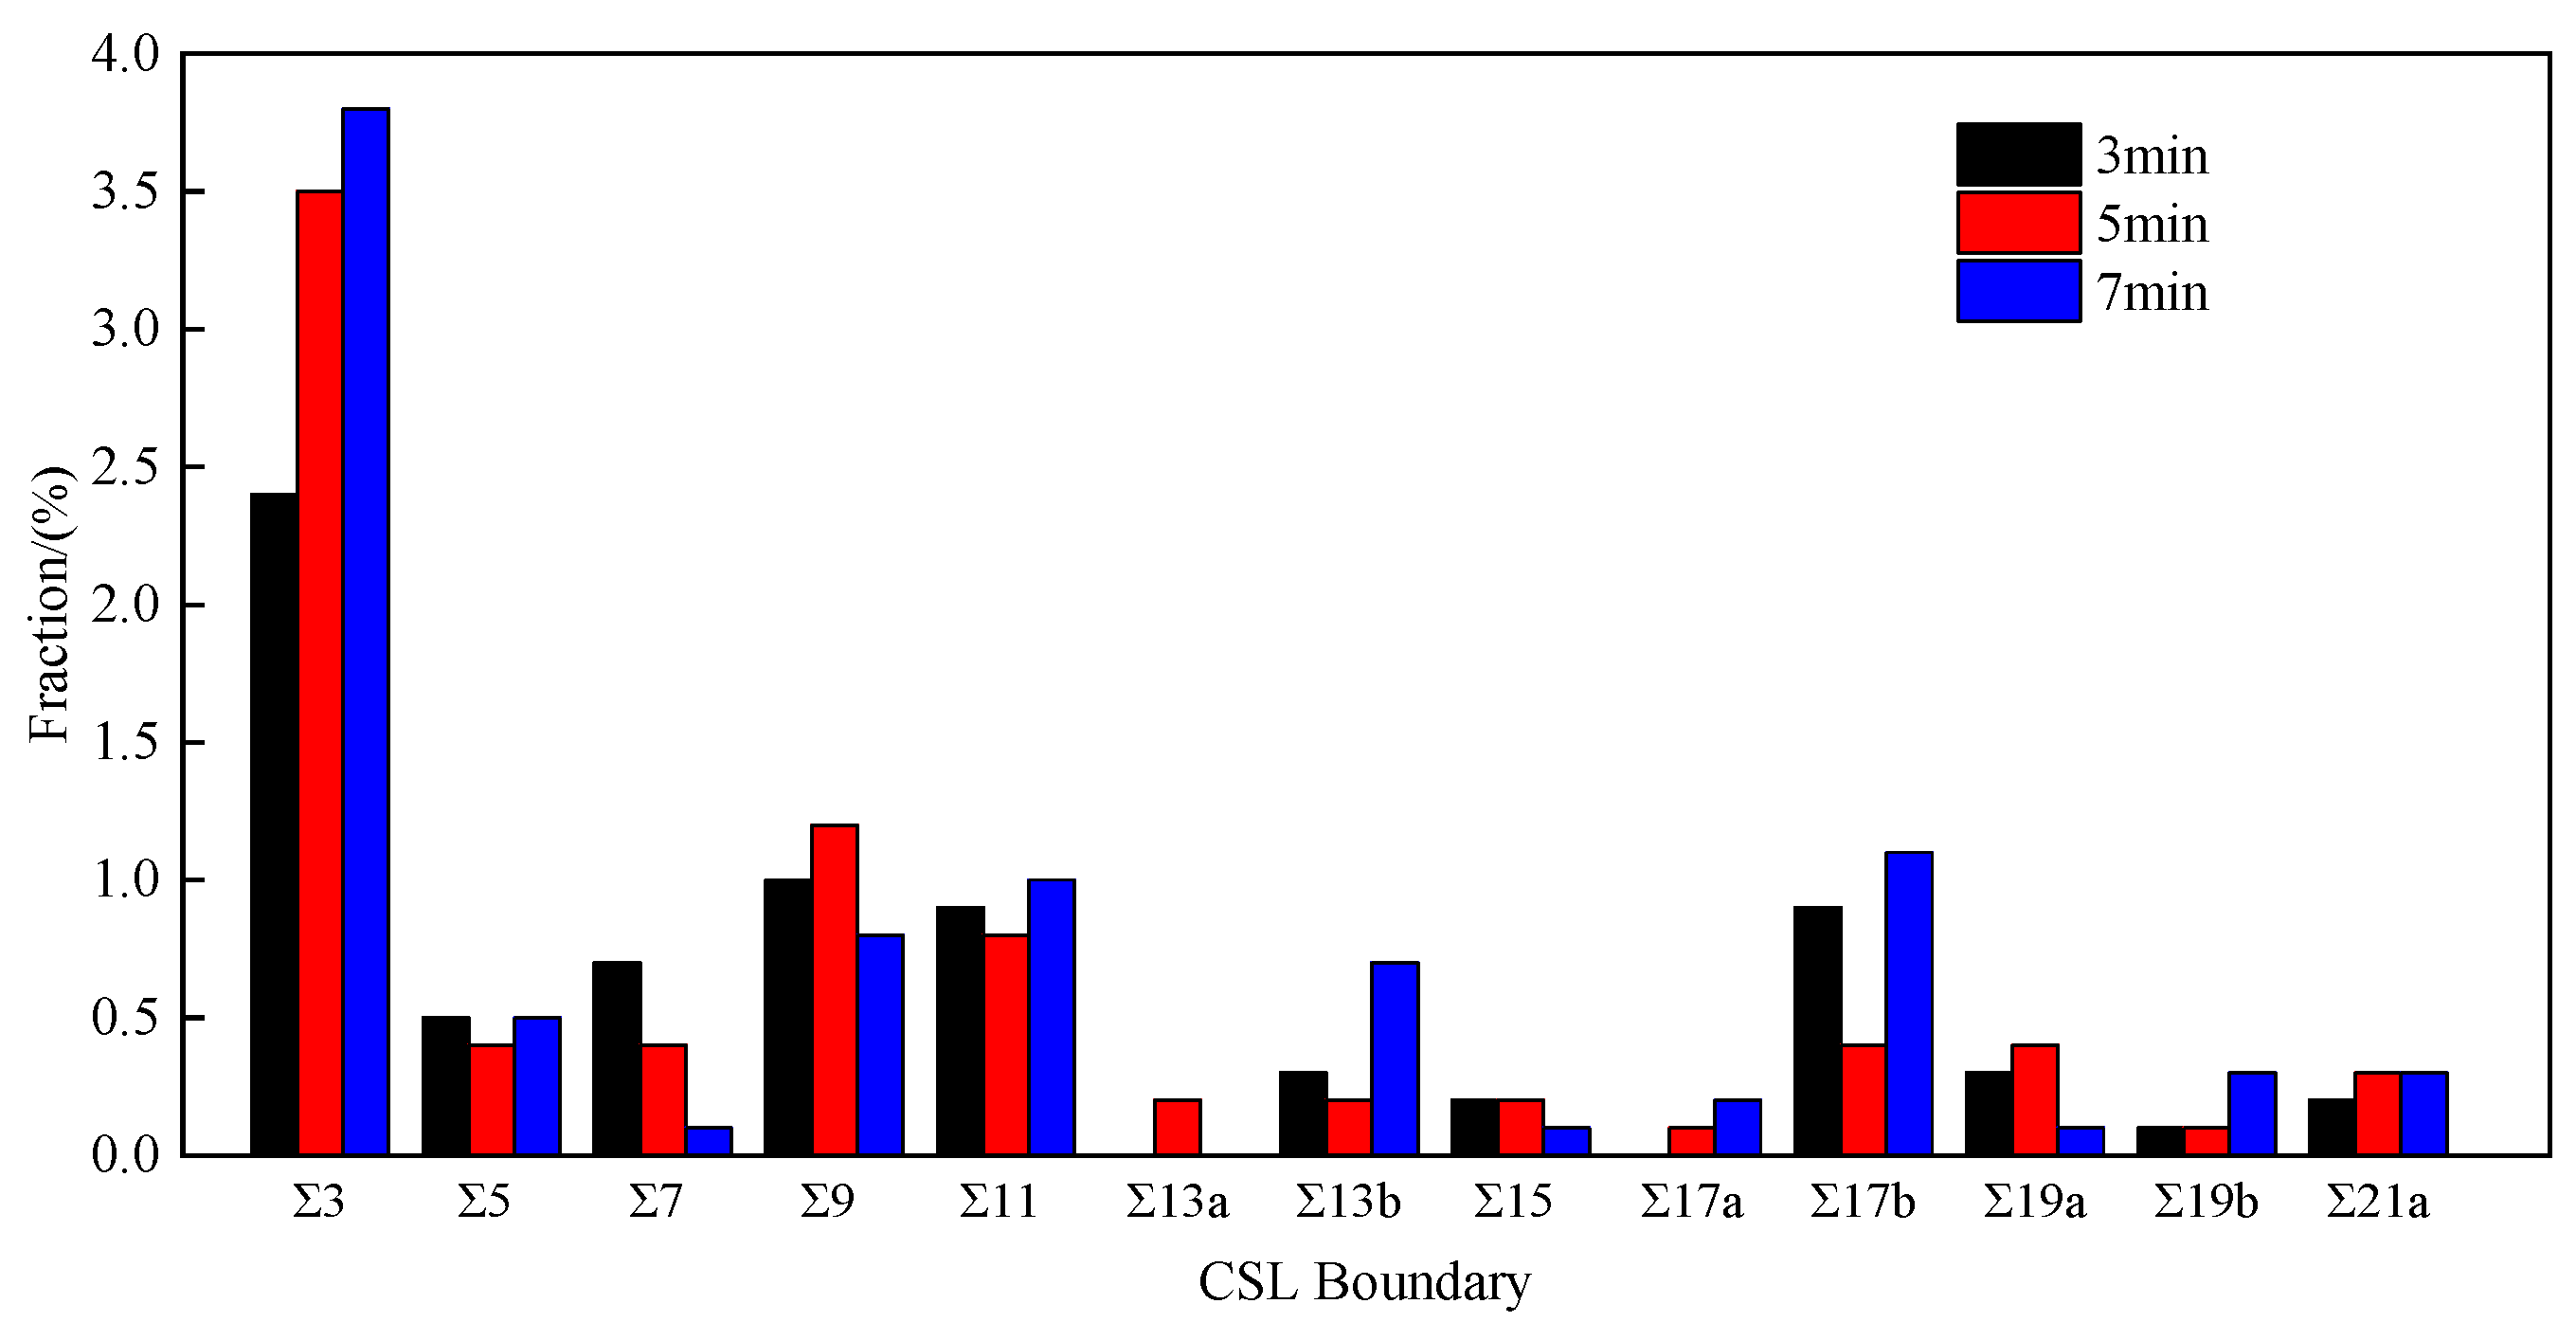
Figure 6 is a diagram showing the distribution of coincident site lattice boundaries in the thickness direction of the sample after decarburization annealing at different holding times. It can be seen from
Figure 6 that the grain boundary types after decarburization annealing are mostly distributed between the Σ3~Σ11 grain boundaries, and the Σ3 grain boundaries account for the highest proportion. Comparing the ratios of the grain boundaries of the three groups of samples, it is found that the Σ7 grain boundary is the strongest after 3 min, accounting for 0.7% of the total proportion, while the Σ3 grain boundary is the weakest. When insulated for 5 min, the ratio of the Σ9 grain boundary is the highest, which is 2.8%; the Σ5 grain boundary and Σ11 grain boundary are the lowest. The grain boundaries of Σ3 and Σ11 are the highest, and the grain boundaries of Σ7 and Σ9 are the lowest after 7 min.
3.2. Effect of Decarburization Annealing Time on Secondary Recrystallization and Magnetic Properties
For body-centered cubic metals, the grain surface energy of different orientations is ordered from low to high: (110) < (100) < (111) [
22]. The grain with low surface energy can be preferentially grown, so the Goss nucleus {110} <001> formed during the primary recrystallization can undergo secondary recrystallization during high-temperature annealing to obtain a perfect Goss texture.
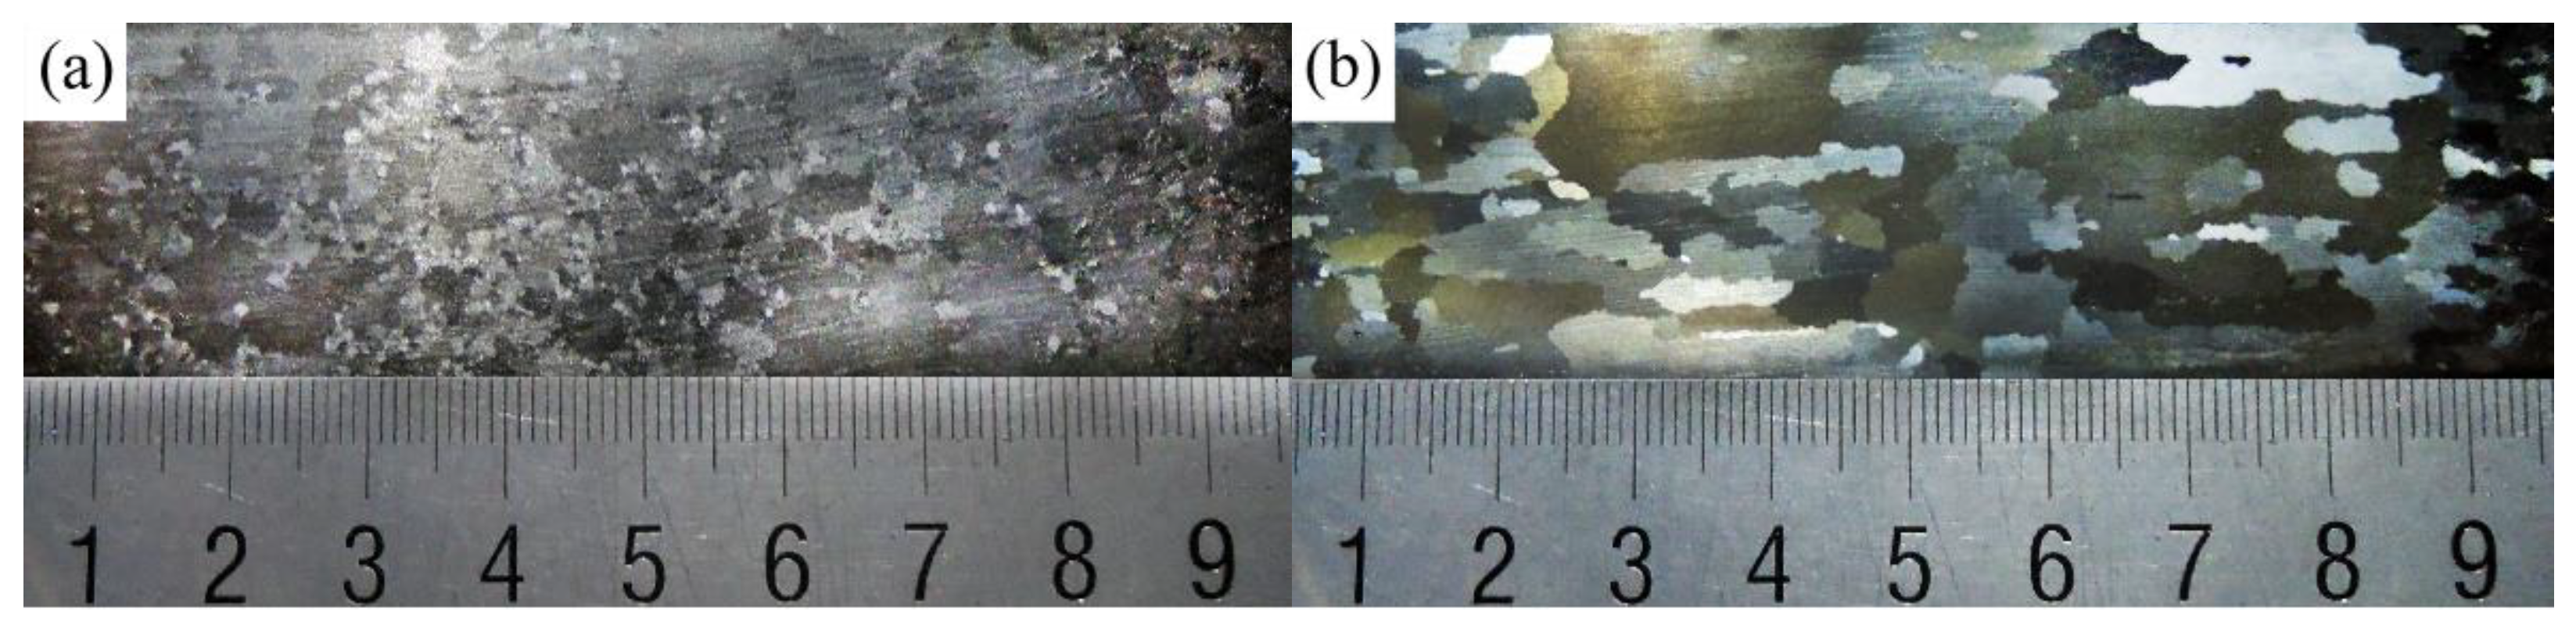
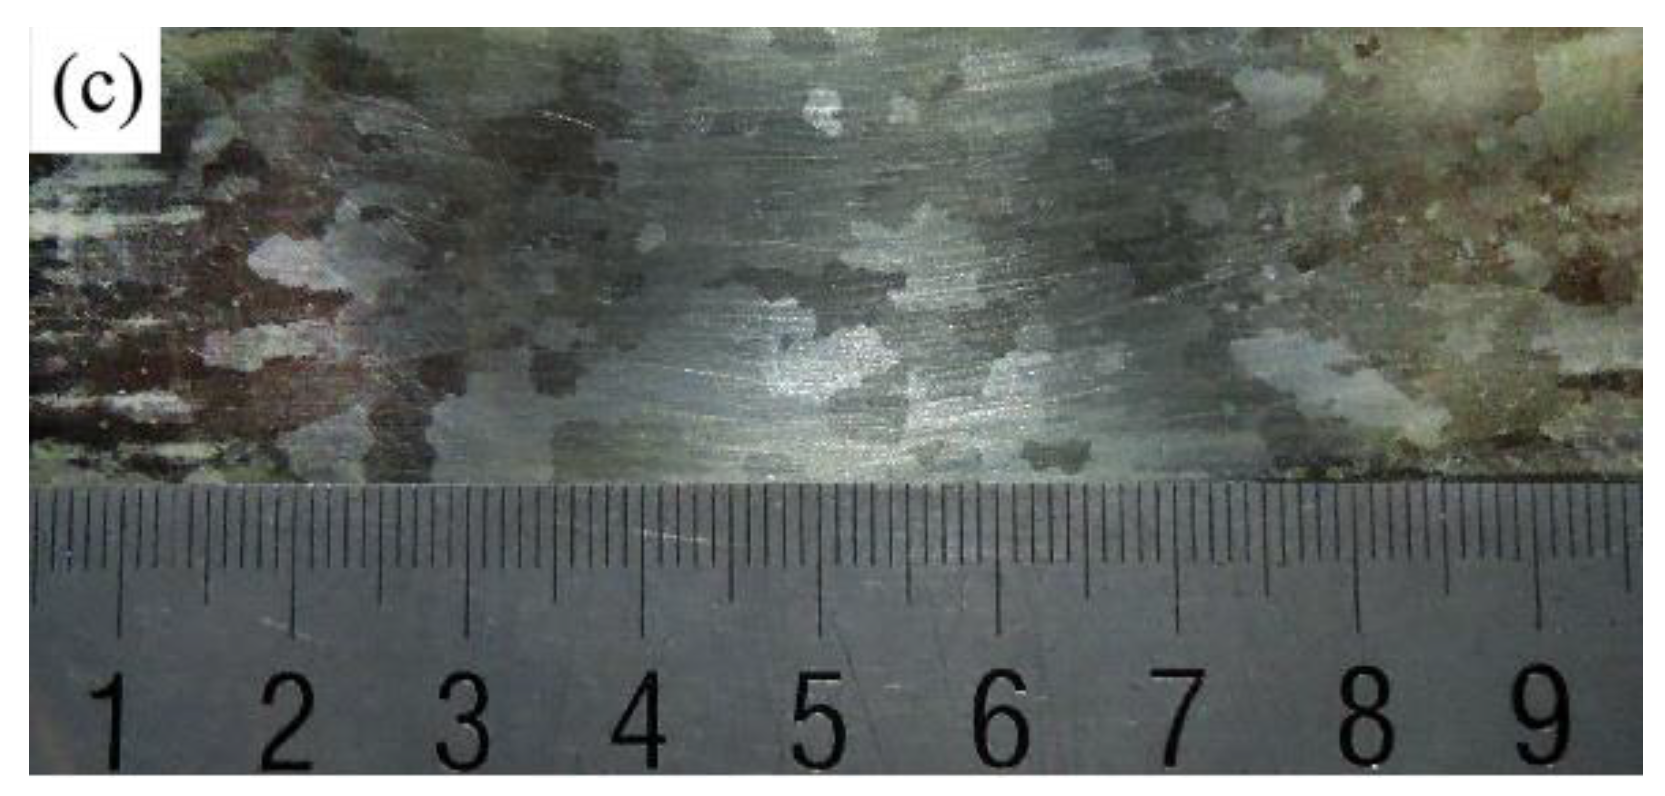
Figure 7 is a low-magnification photo of the finished product after high-temperature annealing under different decarburization annealing holding times. It can be seen from
Figure 7 that the samples under each decarburization annealing holding time have undergone secondary recrystallization. Among them, 850 °C × 5 min samples have a perfect secondary recrystallization, and the maximum size of Goss grains is 25 mm, as shown in
Figure 7b. However, the secondary recrystallization process of the high-temperature annealed sample shown in
Figure 7a,c is incomplete, only a few grains have grown abnormally and a large number of mixed-crystal regions which are harmful to magnetic properties exist.
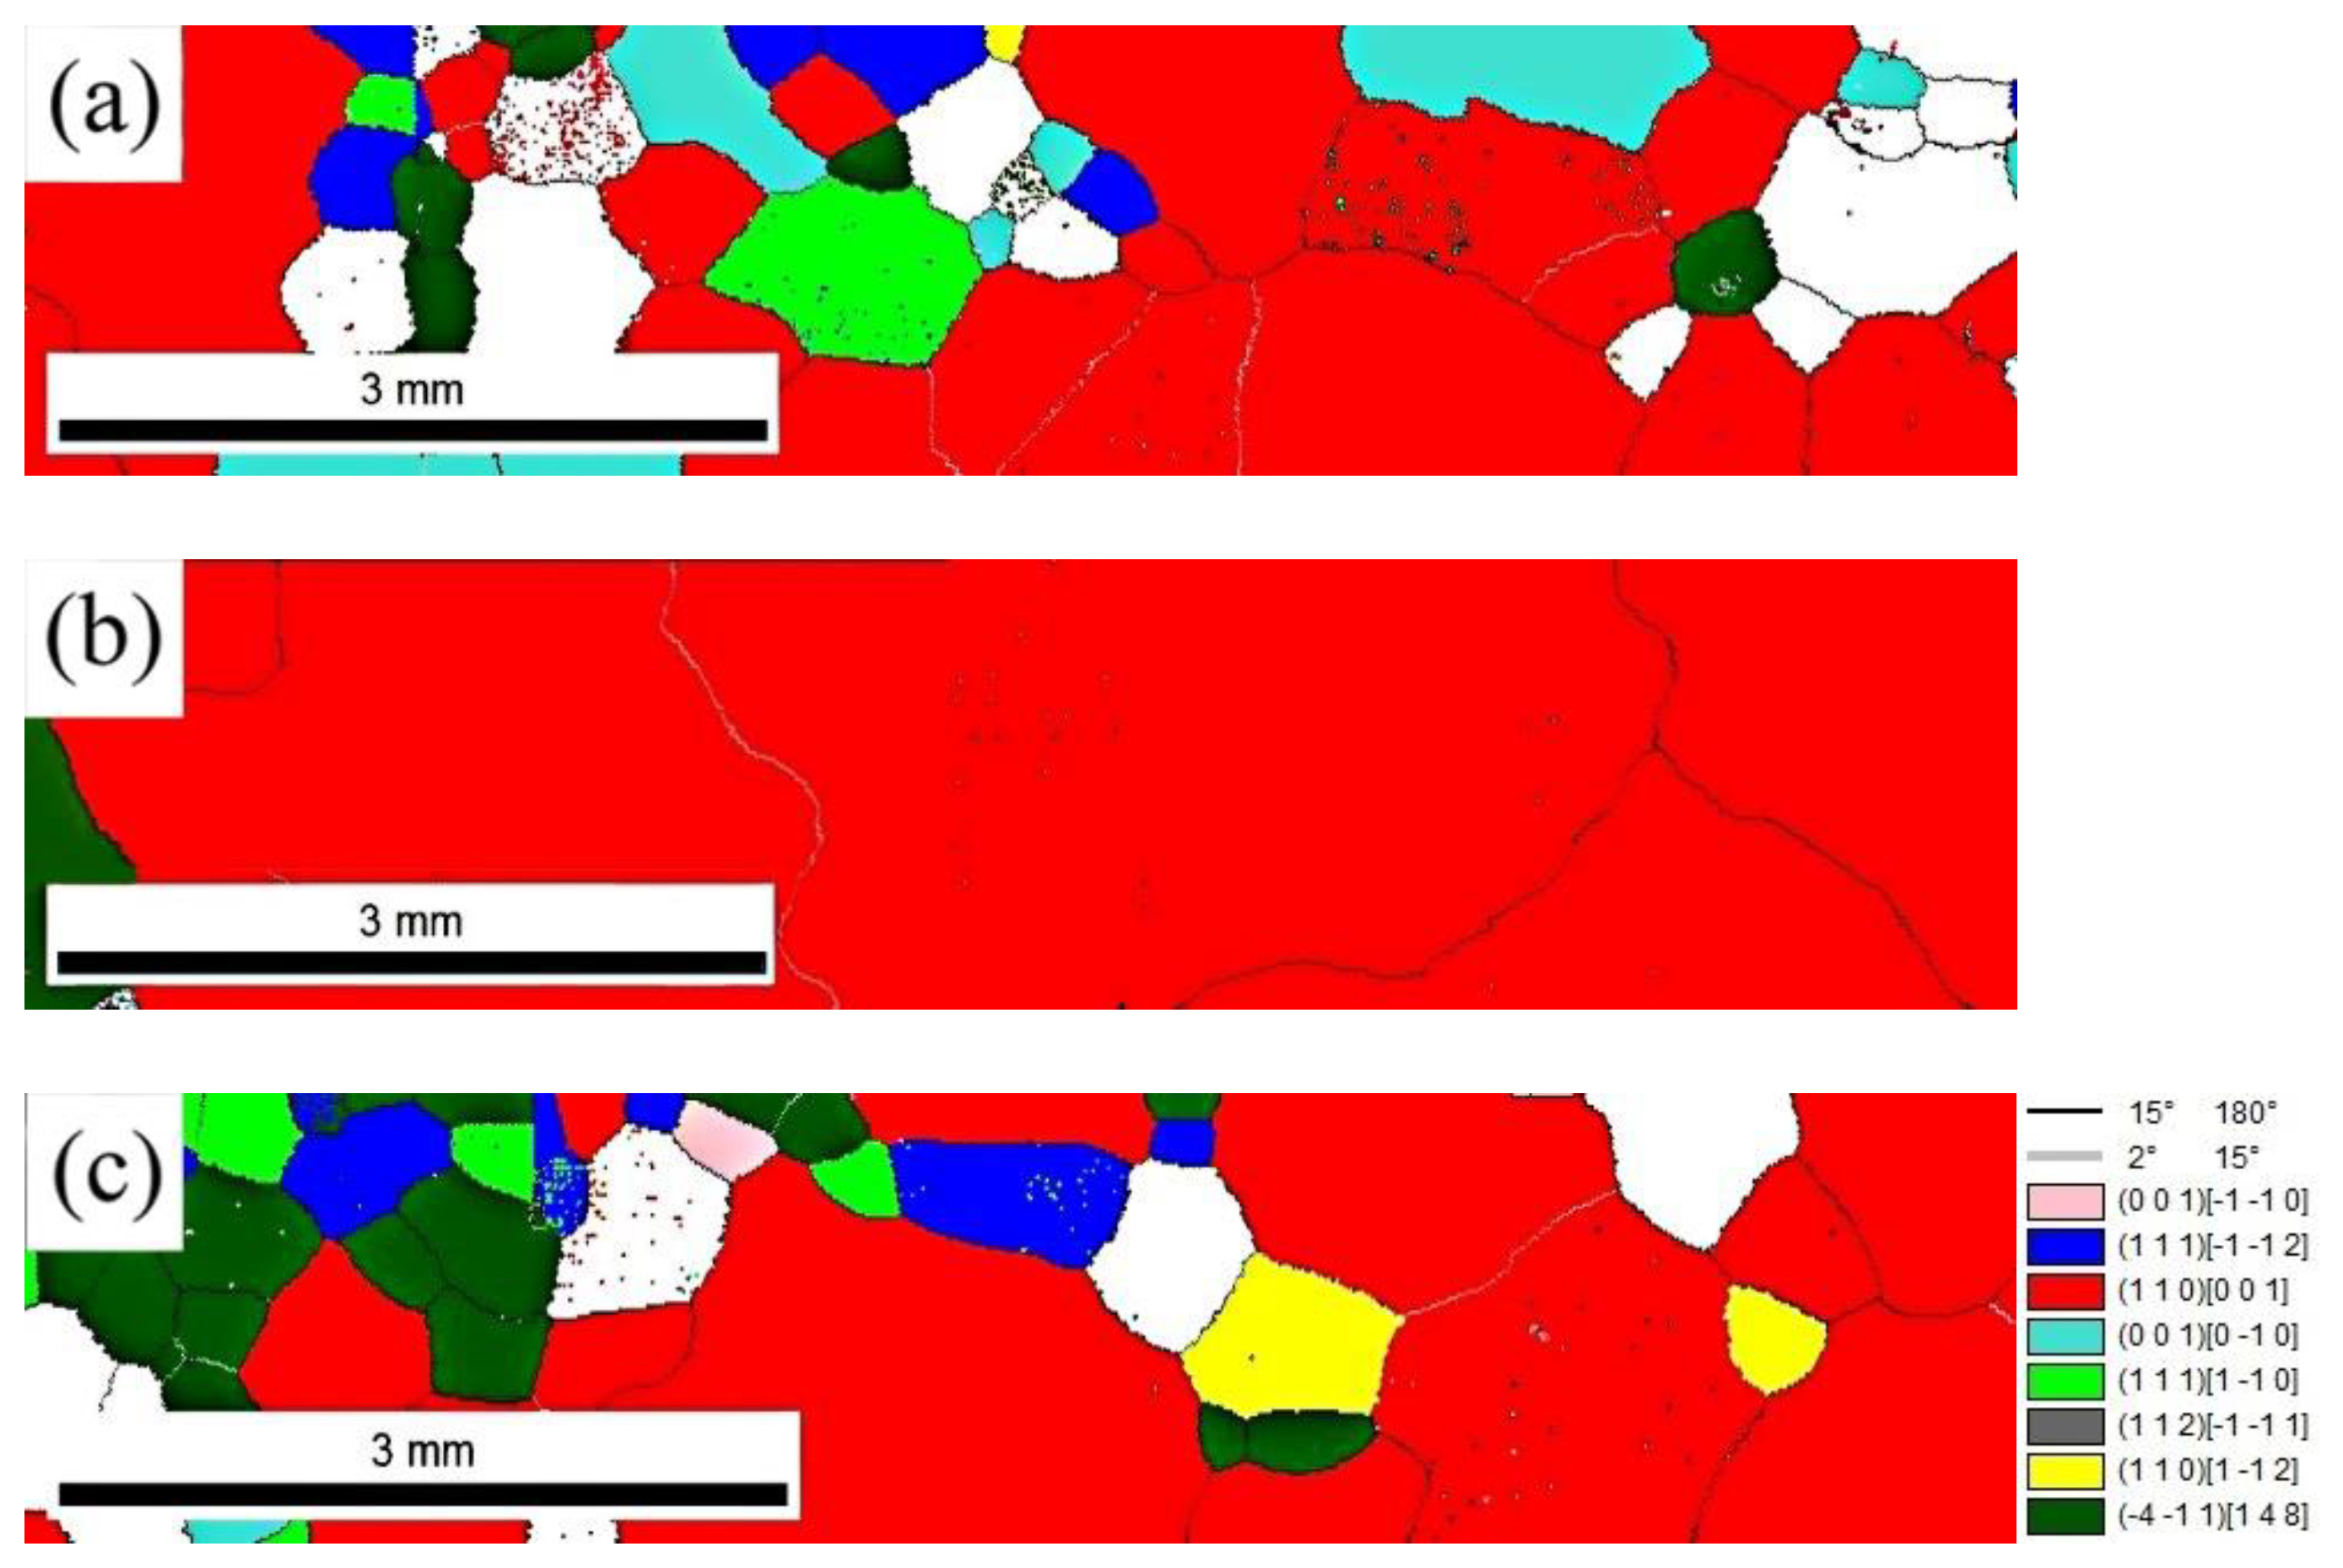
Figure 8 shows the EBSD orientation imaging of the decarburization samples with high-temperature annealing at different holding times, and the main texture contents in the range of 50 mm × 30 mm in the samples are counted and listed in
Table 3. It can be seen from
Figure 8 and
Table 3 that the finished product with decarburization annealing and heat preservation for 5 min is mainly Goss grains, accounting for 96.2% of the whole. It can be seen from
Figure 3b that Goss orientation grains are seldom obtained from the primary recrystallization in the annealing process above-mentioned, and the nucleation rate of high-temperature annealing is relatively low, so that the Goss orientation crystal nuclei can be grown sufficiently. All of the high-temperature annealed samples at other holding times grow non-Goss grains, so the Goss texture finds it difficult to consume these grains, and the final finished structure is not composed of the Goss grains with the same orientation, which inevitably leads to a product with high iron loss and a low magnetic induction.
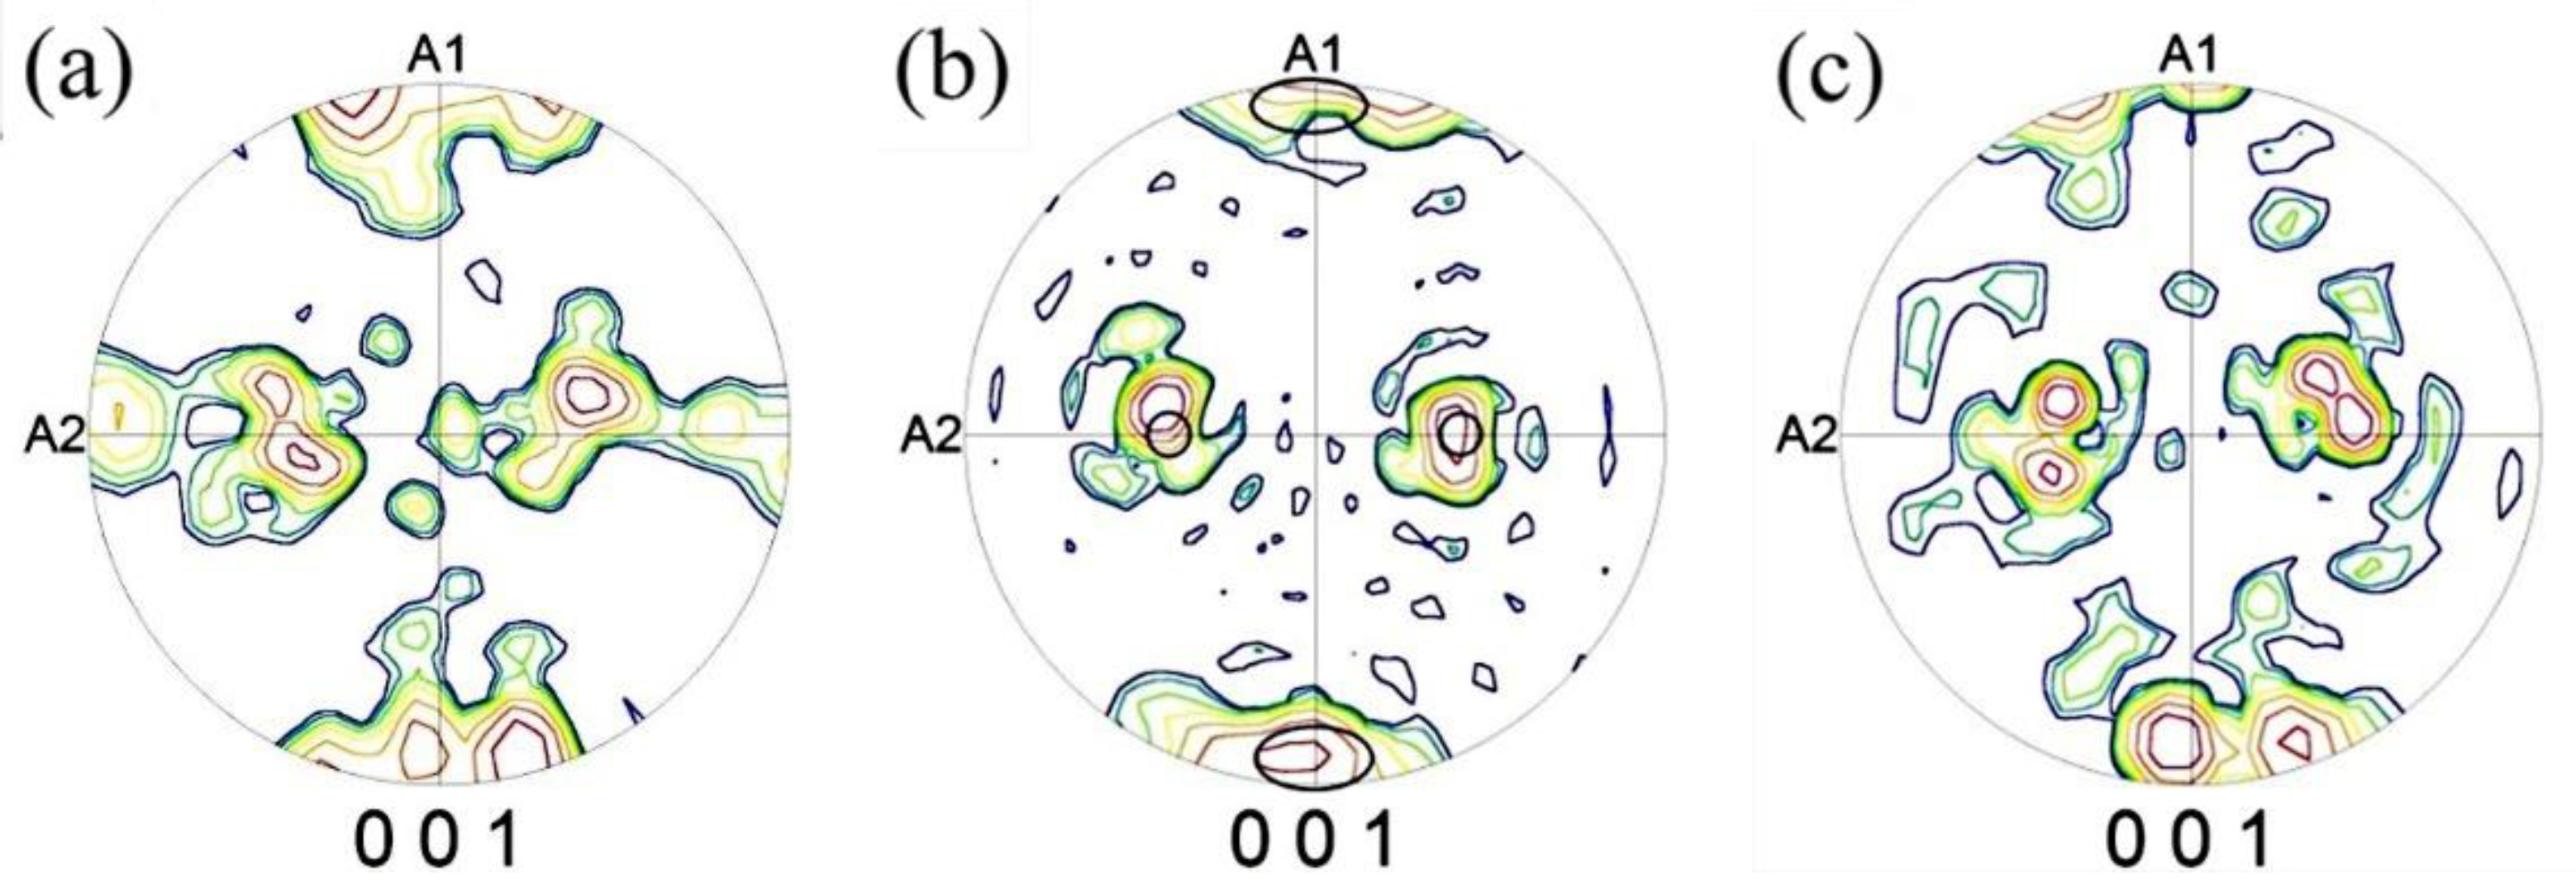
Figure 9 shows the {001} pole figures of a decarburization annealing sample after high-temperature annealing at different holding times, and the black area in
Figure 9b represents the density distribution area of Goss texture. It can be seen that the Goss texture distributions of the decarburization annealing samples with different annealing times are different. The Goss texture distribution of the samples with 3 min or 7 min holding times is relatively weak, with a large deviation angle. However, the sample with heat preservation for 5 min has a dense Goss texture distribution and a small deviation angle.
Table 4 shows the magnetic properties of the finished products with high temperature annealing and decarburization annealing samples at different holding times. The decarburization annealing samples and high temperature annealing samples with different holding time were analyzed. It was found that the decarburization annealing samples were kept for 3 min. The average recrystallized grain size was small but the microstructure uniformity was poor, conducive texture has a low orientation density along the rolling direction. There are many brass textures in the tissue along the thickness direction, and Σ7 grain boundary has a higher proportion, which result in a strong {001} <100> texture of the sample after high temperature annealing. The magnetic induction strength of the finished product is at least 1.67 T and the iron loss is 1.58 W/kg. The first recrystallized structure of the decarburization annealed sample kept for 5 min is the best. And the texture was the strongest along the rolling direction {111} <112>. The texture was favorable in the thickness direction. More high-energy grain boundaries cause abnormal growth of Goss grains during high-temperature annealing, thus forming a strong Goss texture. The magnetic induction strength of the finished product is 1.89 T and the iron loss is 1.33 W/kg. The average recrystallized grain size of the decarburization annealed sample kept for 7 min has exceeded 25 μm. There is a large amount of brass texture in the thickness direction, which is retained after high temperature annealing. The magnetic induction strength of the finished product is not high at 1.72 T, but the iron loss is higher at 1.49 W/kg.
4. Conclusions
(1) The primary recrystallization microstructures of the different decarburization annealing times show obvious differences. When the holding time is 5 min, the primary recrystallized structure is the most uniform and fine, and the average grain size of the primary recrystallization increases with the increase in the holding time.
(2) When annealing and holding for 5 min, the decarburization annealing at 850 °C results in the favorable {111} <112> texture content being the highest, followed by the {411} <148> texture content, which is about the same as with the other two annealing heat preservation times; the content of unfavorable texture {110} <112> is the lowest and mostly distributed near the center layer.
(3) When the temperature is kept for 5 min, there are the greatest high-energy grain boundaries with high mobility, and the lowest low-angle grain boundaries with low mobility, and the Σ9 grain boundary ratio is up to 2.8%, so the grain boundary distribution at this holding time is the most favorable for the abnormal growth of the subsequent Goss grains.
(4) The sample decarburization annealing at 850 °C for 5 min undergoes perfect secondary recrystallization after high-temperature annealing. The texture component is mainly a single Goss texture, and the Goss grain size reaches 4.6 mm. The final obtained magnetic properties are the best, with B800 = 1.89 T and P1.7/50 = 1.33 W/kg.
Author Contributions
X.T.: Methodology, Writing—Original Draft, Investigation, Software, Formal Analysis, Visualization. S.K.: Writing—Review and Editing. J.L.: Software, Validation, Methodology. S.L.: Software, Resources. Y.F.: Conceptualization, Supervision, Project Administration, Funding Acquisition. All authors have read and agreed to the published version of the manuscript.
Funding
The authors would like to express their gratitude for projects supported by the National Natural Science Foundation of China (51974134 and 51674123), Major Science and Technology Special Project of Hebei Province (No. 21281008Z).
Acknowledgments
The authors would like to thank North China University of Technology for providing the materials and testing equipment for the experiments.
Conflicts of Interest
The authors declare they have no conflicts of interest. The funders had no role in the design of the study; in the collection, analysis, or interpretation of data; in the writing of the manuscript; or in the decision to publish the results.
References
- Li, H.; Feng, Y.; Qi, X.; Cang, D.; Liang, J. Study on microstructure and precipitates at different normalizing in Fe-3.15%Si low temperature oriented silicon steel. Acta Metall. Sin. 2013, 49, 562–568. [Google Scholar] [CrossRef]
- Li, H.; Feng, Y.-L.; Zhang, D.; Song, M.; Cang, D.-Q. Balanced solubility product and enthalpies of formation of Nb compounds in 0.09% oriented silicon steel. Rare Met. 2013, 32, 318–322. [Google Scholar] [CrossRef]
- Li, Z.; Tang, D.; Dang, N.; Mi, Z. Research advance of the grain oriented silicon steel since 2000. Heat Treat. Met. 2012, 37, 5–9. [Google Scholar]
- Song, H.-Y.; Liu, H.-T.; Lu, H.-H.; Li, H.-Z.; Liu, W.-Q.; Zhang, X.-M.; Wang, G. Effect of hot rolling reduction on microstructure, texture and ductility of strip-cast grain-oriented silicon steel with different solidification structures. Mater. Sci. Eng. A 2014, 605, 260–269. [Google Scholar] [CrossRef]
- Hayakawa, Y.; Kurosawa, M. Orientation relationship between primary and secondary recrystallized texture in electrical steel. Acta Mater. 2002, 50, 4527–4534. [Google Scholar] [CrossRef]
- Kustas, A.; Sagapuram, D.; Trumble, K.; Chandrasekar, S. Texture Development in High-Silicon Iron Sheet Produced by Simple Shear Deformation. Metall. Mater. Trans. A 2016, 47, 3095–3108. [Google Scholar] [CrossRef]
- Chen, Y.; Fan, L.; Zhang, C.; Xiang, L.; Tang, G.; Qiu, S. Determination of intermediate complete decarburizing annealing process of common grain- otiented silicon steel. Mater. Mech. Eng. 2013, 37, 73–81. [Google Scholar]
- Wu, Z.; Hu, S.; Yue, G.; Dai, F.; Xiao, S.F.Q.; Zhang, F. Effects of annealing condition on decarburization of grain oriented silicon. Trans. Mater. Heat Treat. 2017, 38, 91–97. [Google Scholar]
- Zhang, C.; Jin, Z.; Ren, H.; Gao, P.; Li, B.; Luo, C. Effect of one stage decarbonization annealing on primary recrystallized grain boundary characteristics of oriented silicon steel based on CSP technology. Heat Treat. Met. 2015, 40, 40–44. [Google Scholar]
- Gao, X.Y.; Ren, H.P.; Wang, H.Y.; Chen, S.M. Effect of lanthanum on the precipitation and dissolution of NbC in microalloyed steels. Mater. Sci. Eng. A 2017, 683, 116–122. [Google Scholar] [CrossRef]
- Feng, Y.; Guo, J.; Li, J.; Ning, J. Effect of Nb on solution and precipitation of inhibitors in grain-oriented silicon steel. J. Magn. Magn. Mater. 2016, 426, 89–94. [Google Scholar] [CrossRef]
- Feng, Y.; Li, Y.; Guo, J.; Li, J.; Du, T. Effect of slab reheating temperature on recrystallization microstructure, texture and magnetic properties of Nb-containing grain-oriented silicon steel. J. Magn. Magn. Mater. 2017, 439, 135–143. [Google Scholar] [CrossRef]
- Poddar, D.; Cizek, P.; Beladi, H.; Hodgson, P.D. The evolution of microbands and their interaction with NbC precipitates during hot deformation of a Fe–30Ni–Nb model austenitic steel. Acta Mater. 2015, 99, 347–362. [Google Scholar] [CrossRef]
- Tirumalasetty, G.K.; Van Huis, M.A.; Fang, C.M.; Xu, Q.; Tichelaar, F.D.; Hanlon, D.N.; Sietsma, J.; Zandbergen, H.W. Characterization of NbC and (Nb,Ti)N nanoprecipitates in TRIP assisted multiphase steels. Acta Mater. 2011, 59, 7406–7415. [Google Scholar] [CrossRef] [Green Version]
- Li, Z.; Yang, P.; Yan, M.; Mao, W.M. Evolution of microstructures and textures of {100} initial texture in an electrical steel. Chin. J. Stereol. Image Anal. 2009, 3, 237–244. [Google Scholar]
- Wang, H.; Fu, B.; Xiang, L.; Qiu, S. Evolution characteristics of microstructure and texture of CGO steel. Mater. Heat Treat. 2016, 37, 90–97. [Google Scholar]
- Zhou, S.; Pei, W.; Sha, Y.; Zuo, L. Effect of magnetic annealing on recrystallization texture and microstructure of non-oriented silicon steel. J. Northeast. Univ. 2007, 28, 1131–1135. [Google Scholar]
- Liu, Z.; Yang, P.; Mao, W. Effect of {114} <418> texture on abnormal growth during secondary recrystallization in grain-oriented steel. Acta Metall. Sin. 2015, 51, 769–776. [Google Scholar]
- Kumano, T.; Haratani, T.; Ushigami, Y. Grain Boundary Characteristics in Grain Oriented Silicon Steel. ISIJ Int. 2004, 44, 1888–1893. [Google Scholar] [CrossRef]
- Chang, S. Texture change from primary to secondary recrystallization by hot-band normalizing in grain-oriented silicon steels. Mater. Sci. Eng. A 2007, 452–453, 93–98. [Google Scholar] [CrossRef]
- Ushigami, Y.; Kumano, T.; Haratani, T.; Nakamura, S.; Takebayashi, S.; Kubota, T. Secondary Recrystallization in Grain-Oriented Silicon Steel. Mater. Sci. Forum 2004, 467–470, 853–862. [Google Scholar] [CrossRef]
- Hayakawa, Y.; Muraki, M.; Szpunar, J.A. The changes of grain boundary character distribution during the secondary recrystallization of electrical steel. Acta Mater. 1998, 46, 1063–1073. [Google Scholar] [CrossRef]
| Publisher’s Note: MDPI stays neutral with regard to jurisdictional claims in published maps and institutional affiliations. |
© 2021 by the authors. Licensee MDPI, Basel, Switzerland. This article is an open access article distributed under the terms and conditions of the Creative Commons Attribution (CC BY) license (https://creativecommons.org/licenses/by/4.0/).


