
Tunable Bandgaps in Phononic Crystal Microbeams Based on Microstructure, Piezo and Temperature Effects


Jiangsu Key Laboratory of Engineering Mechanics, School of Civil Engineering, Southeast University, Nanjing 210096, China
*
Authors to whom correspondence should be addressed.
Crystals 2021, 11(9), 1029; https://doi.org/10.3390/cryst11091029
Submission received: 3 August 2021
/
Revised: 23 August 2021
/
Accepted: 24 August 2021
/
Published: 26 August 2021
(This article belongs to the Section Inorganic Crystalline Materials)
Abstract
:A new model of non-classical phononic crystal (PC) microbeam for the elastic wave bandgap generation is provided, incorporating microstructure, piezomagnetism, piezoelectricity and temperature effects. The wave equation of a general magneto–electro–elastic (MEE) phononic crystal microbeam is derived, which recovers piezoelectric- and piezomagnetic-based counterparts as special cases. The piezomagnetic and piezoelectric materials are periodically combined to construct the PC microbeam and corresponding bandgaps are obtained by using the plane wave expansion (PWE) method. The effects of the piezomagnetism, piezoelectricity, microstructure, geometrical parameters and applied multi-fields (e.g., external electric potential, external magnetic potential, temperature change) on the bandgaps are discussed. The numerical results reveal that the bandgap frequency is raised with the presence of piezo and microstructure effects. In addition, the geometry parameters play an important role on the bandgap. Furthermore, large bandgaps can be realized by adjusting the external electric and magnetic potentials at micron scale, and lower bandgap frequency can be realized through the temperature rise at all length scales.
1. Introduction
Phononic crystal (PC) structures, known as periodic composite structures, exhibiting bandgaps with piezoelectric/piezomagnetic/magnetoelectric phases, have been investigated in recent years, which can find important applications in harmonic signal processing, vibration reducing, noise controlling, filtering, and other MEMS/NEMS devices [1,2,3,4,5,6,7,8,9,10]. The bandgap for elastic wave propagation arises from the Bragg scattering and local resonance [11,12,13]. As a result, thin structures (e.g., rods, beams, plates and shells) usually exhibit size-dependent effects at small scales [14,15,16,17,18,19,20,21,22,23,24,25], which cannot be captured by the existing classical theories. The same phenomenon also happens in bandgaps made of micro-/nano-PC structures.
Many higher-order/non-classical theories have been proposed to explain this phenomenon, which describes the size effects by attaching additional material parameters, such as nonlocal theories [26,27], surface elasticity theories [28], strain gradient theories [17,29,30] and couple stress theories [31,32,33]. These theories and their extended versions are widely applied to predict the bandgap at the micron and nanometer scales. For example, Qian et al. [34] and Song et al. [35] examined the effects of external electric and temperature fields on the bandgap for piezoelectric PC nanobeams and nanoplates based on the nonlocal theory. Qian [36] also studied the surface effect on bandgaps in a PC nanobeam. Zhang et al. [37] established a piezomagnetic PC nanobeam based on the nonlocal theory and explored the effects of nonlocal parameter, geometric parameters, magnetic field and pre-stress on the bandgap. The bandgaps of 1D, 2D and 3D PCs based on the modified coupled stress theory (MCST) and the surface elasticity theory were symmetrically investigated [38,39,40,41,42,43], and Espo et al. [8] extended this to a piezoelectric PC beam model. This MCST or its extended versions have been given a direct physical interpretation based on material microstructures [44], which can successfully describe the microstructure effects for thin structures at very small scale.
On the other hand, in purely elastic PCs, the bandgap performance is fixed once the inclusion geometry and material are given. However, PCs made of piezoelectric/piezomagnetic/ magnetoelectric materials and incorporating the thermoelastic effect can manipulate the bandgap size in real time by varying the external multi-physical fields, which have important application in MEMS/NEMS devices. Hence, the prediction of the bandgap for magneto–electro–elastic phononic crystal (MEE-PC) structures at the micro scale is very desirable. However, based on the authors’ knowledge, within the context of the MCST or its extended versions, no model that is able to predict the bandgaps has been proposed for a MEE-PC beam at the micron scale. This motivated the current work.
In this paper, a new MEE-PC beam model incorporating microstructure, piezomagnetism, piezoelectricity and temperature effects is presented based on the extended MCST. With the help of the extended MCST, the current model can obtain more accurate bandgaps in a MEE-PC beam at the micron scale. This configuration requires uniform cross section and perfect bonded conditions, which can be additively manufactured. The wave equation of a general MEE-PC microbeam is derived and applied to determine the bandgaps made of piezomagnetic and piezoelectric materials using the plane wave expansion (PWE) method. A parametric study is then performed to examine a series of factors. The current model can be used to guide the design of resonator components, tunable filters and other functional MEMS devices.
2. Formulation
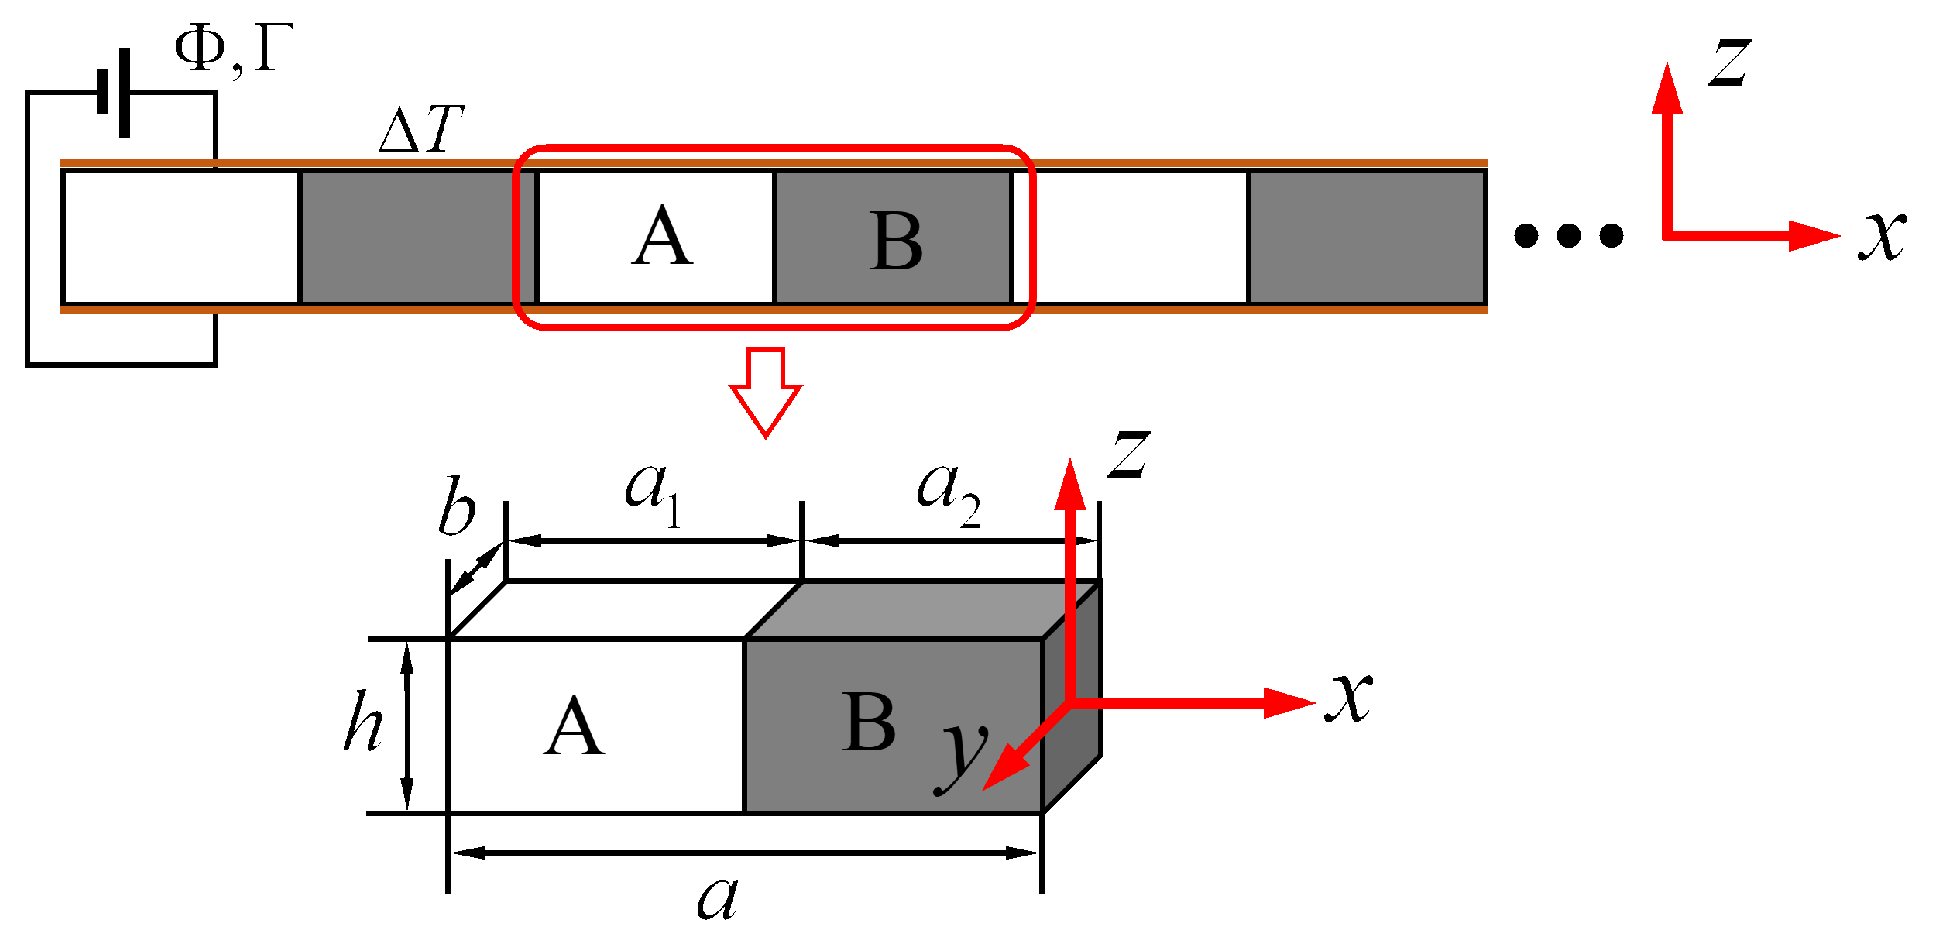
As shown in Figure 1, consider a MEE-PC beam that continues indefinitely along the x-axis with a uniform rectangular cross section. The unit cell consists of two perfect bonded beams of material A with length and material B with length , and the lattice constant . The MEE-PC beam is subjected to applied z-axis polarized electric potential , magnetic potential and a uniform temperature change .
Based on the extended MCST [45,46], the constitutive equations of a MEE Euler beam incorporating microstructure and temperature effects can be expressed as follows [36,46,47]:
where is the axial stress; is the electric displacement; is the magnetic flux; is the couple stress; is the elastic constant; and are couple stress constants; and are, respectively, piezoelectric and dielectric constants; and are the piezomagnetic and magnetic constants, respectively; is the magneto-dielectric coupling constant; is the coefficient of thermal expansion; and are pyroelectric and pyromagnetic constants, respectively; is the temperature change; and are, respectively, axial linear strain and symmetric curvature in Bernoulli Euler beam given by
with being the deflection. The electric field and magnetic field are related to the electric potential and the magnetic potential through
The boundary conditions of the magnetic and electric fields for the beam are assumed as
Integrating Equation (20) and its product with z over the cross section of beam, it follows that
where A is the area of the beam cross section.
According to the generalized Young–Laplace equations [49,50], the governing equation including couple stress [15] can be written as
where
Substituting Equations (21), (22) and (24) into Equation (23), and eliminating the beam width b, the wave equation in term of w can be obtained as
When the piezoelectric and piezomagnetic effects are suppressed (i.e., setting ), the wave equation given in Equation (25) will reduce to
as the microstructure-dependent wave equation for an Euler beam with temperature effect.
When the microstructure effect is suppressed by setting , Equation (25) becomes
as the wave equation for a MEE-Euler beam with temperature effect.
The bandgap is calculated by using PWE. According to Bloch’s theorem [51] and the periodicity of the model, the form of the elastic wave can be given as
where is the wave angular frequency, i is the imaginary unit, Bloch wave vector k limited to the first Brillouin zone and is an amplitude.
The material properties and the elastic wave are expanded into a Fourier series in reciprocal space and then put into the corresponding wave equation, which can be converted into solving the eigenproblem. For a certain value of k, the corresponding eigenfrequencies can be obtained by solving the eigenequation. The bandgaps of the MEE-PC microbeam can be then be identified as the ranges of over which there is no real value of k [40]. In addition, bandgaps in the composite PC microbeams with piezoelectric or piezomagnetic inclusions can be determined as special cases. From Equations (25)–(27), it can be shown that the current model recovers the MCST-based elastic model and classical MEE model as special cases.
Note that the current model possesses the same limitations as those of the classical case using the plane wave expansion method. For a finite or complicated structure, the finite-element method might be an alternative choice. In addition, in reality, the bandgaps can be affected by various reasons, such as the non-uniformity of the beam, bonded conditions and microdefects. Furthermore, some experimental cases could be constructed at very small scales.
3. Numerical Results
To quantitatively illustrate the new model, numerical results are presented in this section. In generating these results, material A is taken to be piezomagnetic (PM) material , and material B is chosen to be piezoelectric (PE) material . The parameters are listed in Table 1. Note that the bandgap calculated by the wave equation in Equation (25) is considered to be the current model, while the classical bandgap is identified in Equation (27). Furthermore, only the first bandgap is calculated and discussed in subsequent sections, unless otherwise noted.
3.1. Validation
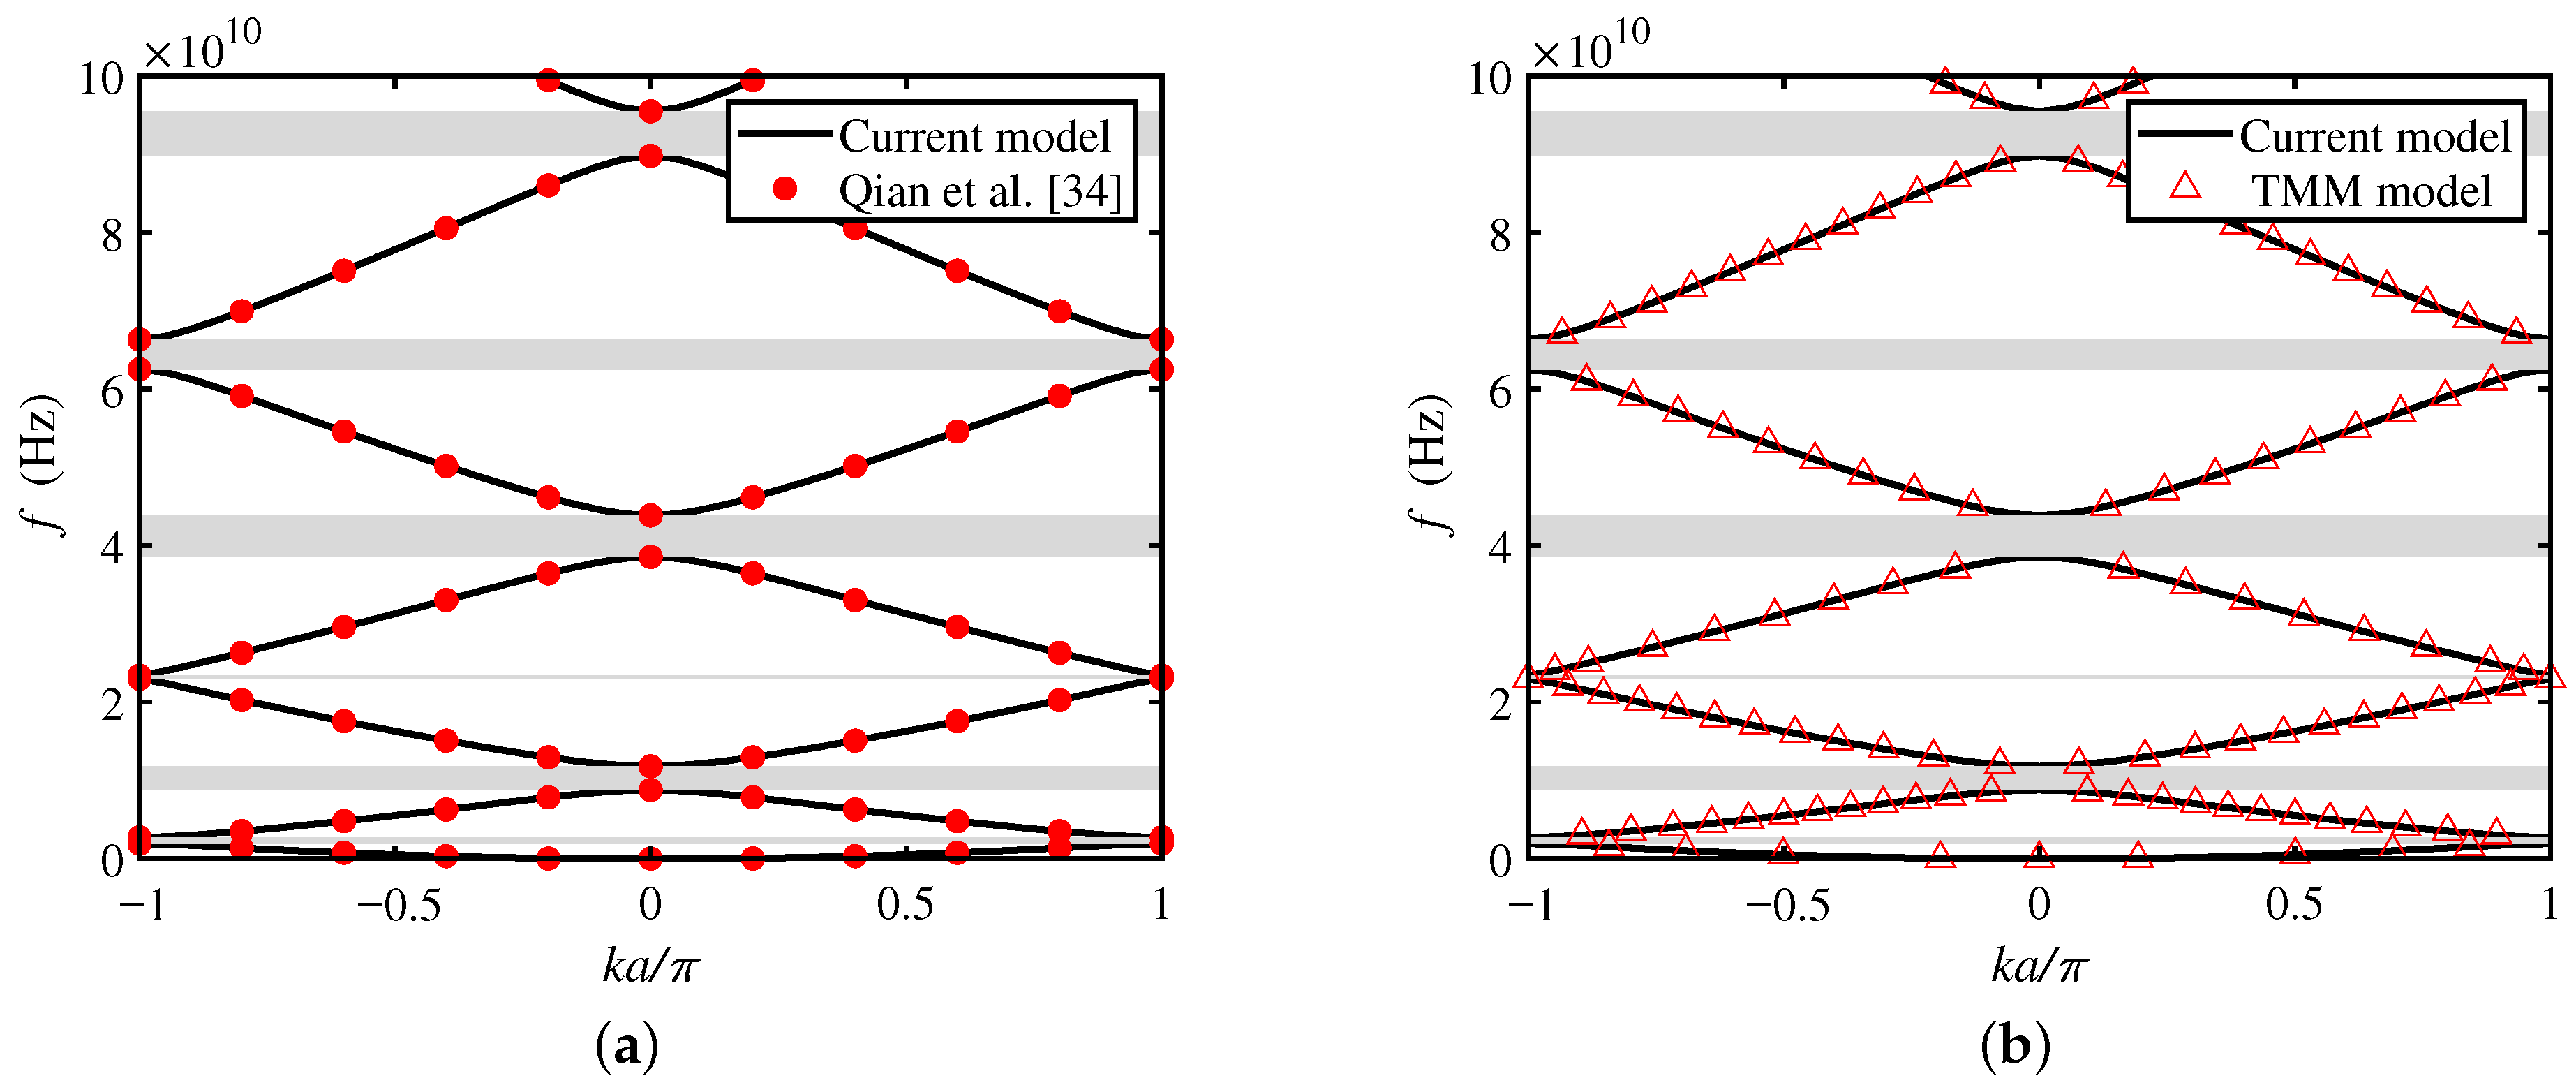
To verify the correctness of the current model provided from Section 2, an example in comparison with another study was carried out. The geometric and physical parameters of the model in this section are adopted from Qian et al. [34]. The specific bandgaps of the current model are gained by suppressing the microstructure and piezomagnetic effects of the model (i.e., setting in Section 2), as shown in Figure 2a,b. For the convenience of comparison, bandgaps without a size effect (i.e., not applying nonlocal theory) provided by Qian et al. [34] are also plotted in Figure 2a. It is shown that bandgaps predicted by the current model without microstructure and piezomagnetic effects are in good agreement with those by Qian et al. [34]. In addition, to validate the PWE method in the current model, the bandgaps predicted by the transfer matrix method (TMM) with the same conditions have also been plotted in Figure 2b. Note that the TMM method has been successfully proved to predict bandgaps in the multifield PC beams at macron scale [52,53,54]. It can be observed that the numerical results of both the PWE and TMM methods are the same.
3.2. Effects of Piezoelectricity and Piezomagnetism on Bandgap
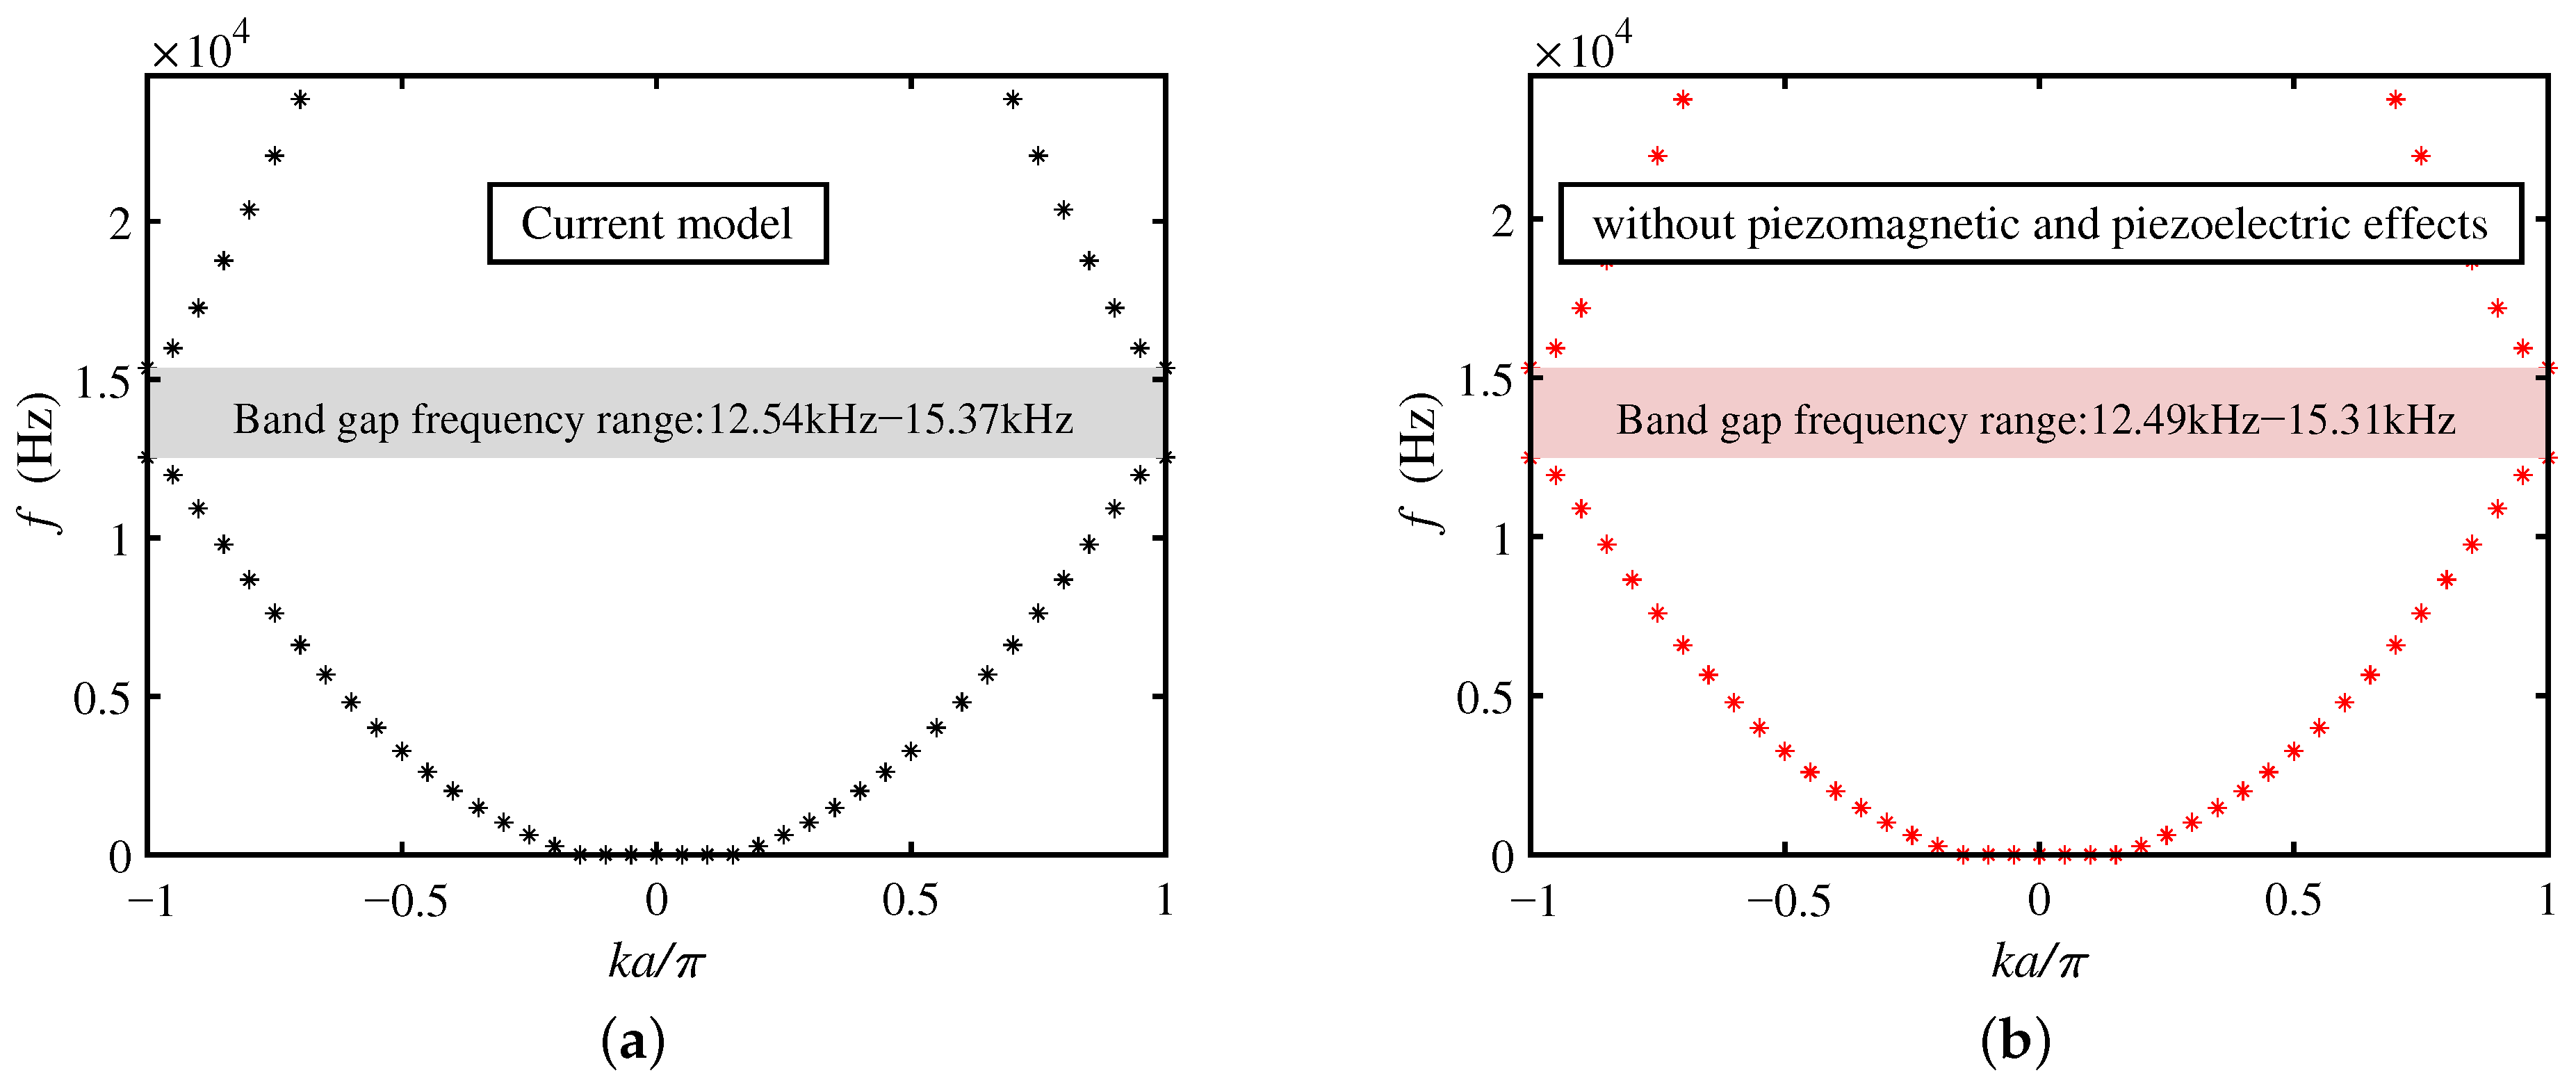
In this section, the geometric parameters of PC microbeams are , , . The other parameters are (i.e., turn off external electric and magnetic potentials). The first bandgap of the current model is shown in Figure 3a. It is worth noting that the bandgap without piezoelectricity and piezomagnetism effects can be produced by setting (see Equation (26)), as shown in Figure 3b.
In Figure 3a, the first bandgap range of the current model is 12.54–15.37 kHz, and the bandgap range without piezoelectricity and piezomagnetism effects is 12.49–15.31 kHz (see Figure 3b). It is seen from Figure 3 that the frequency values forming the first bandgap for the current model are always higher than those for the case without the piezo effect, as expected [55].
3.3. Effect of Microstructure (Beam Thickness) on Bandgap
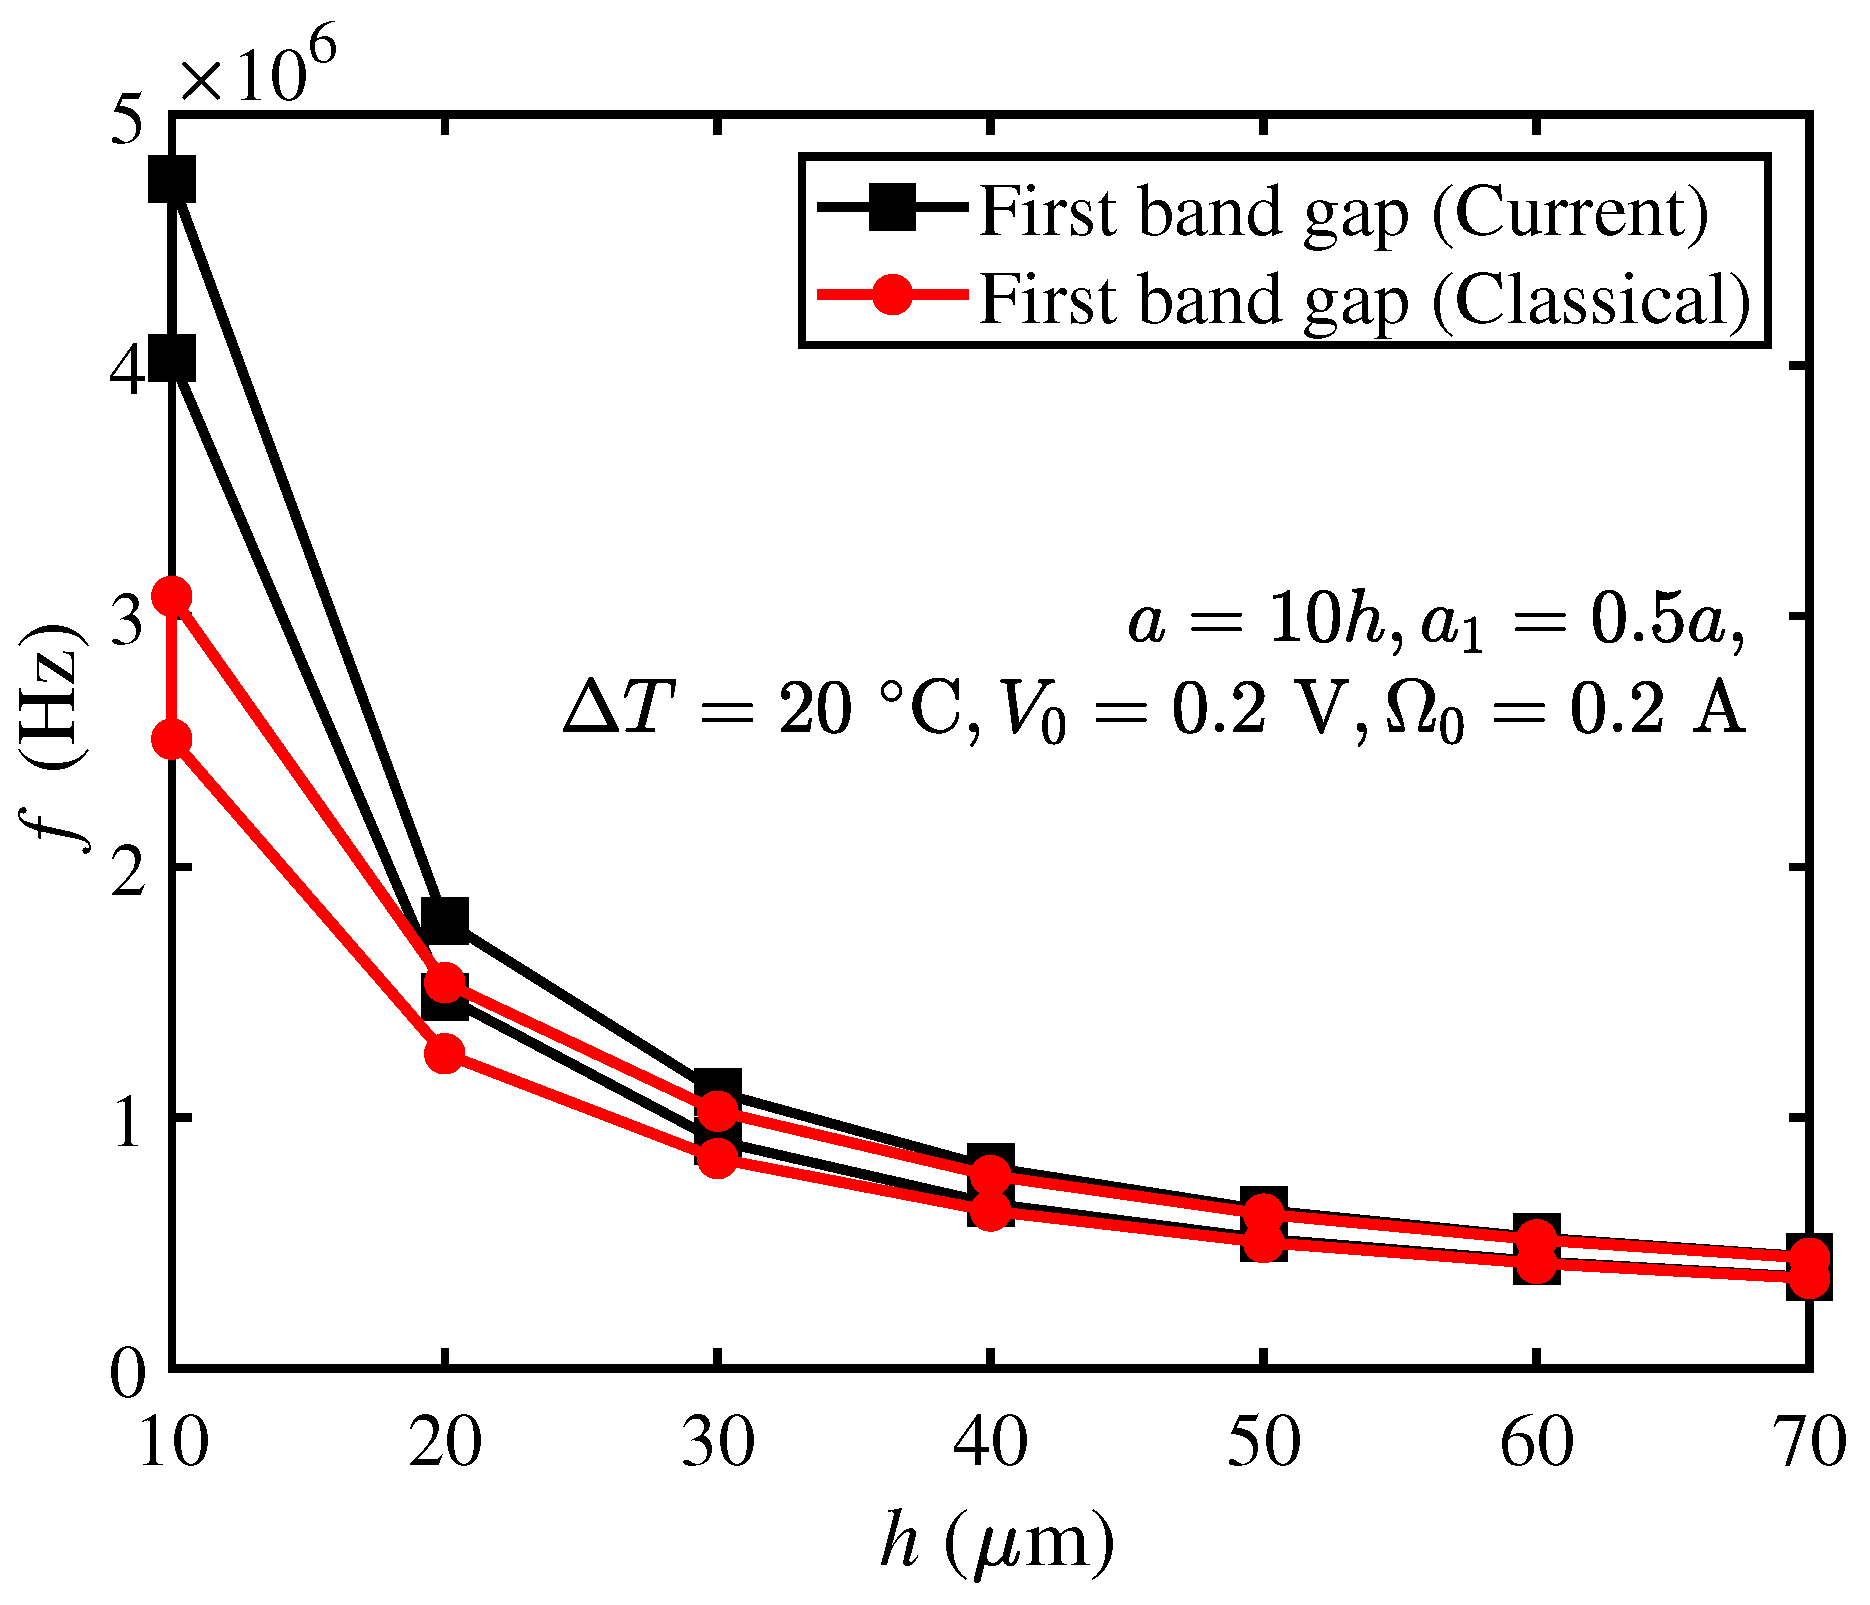
The geometric parameters of the PC microbeams in this section are , , the beam thickness h varies from 10 μm to 70 μm, and other parameters are °C, , . The bandgap (i.e., black square line) predicted by the current model is shown in Figure 4. For comparison purposes, the bandgap (i.e., red circular line) predicted by the classical model (i.e., eliminating the microstructure effect) is also plotted in Figure 4.
From Figure 4, it is observed that both the bandgap frequencies of the current and classical models decrease with the increase in beam thickness h. However, with the increase in beam thickness h, the difference between the two models gradually decreases. In addition, both the upper and lower frequency values of the current model are always higher than those of the classical model. This indicates that the microstructure effect leads to an increased beam frequency, thereby stiffening the beam as expected [19]. Furthermore, at the macroscopic scale, the microstructure effect can be neglected.
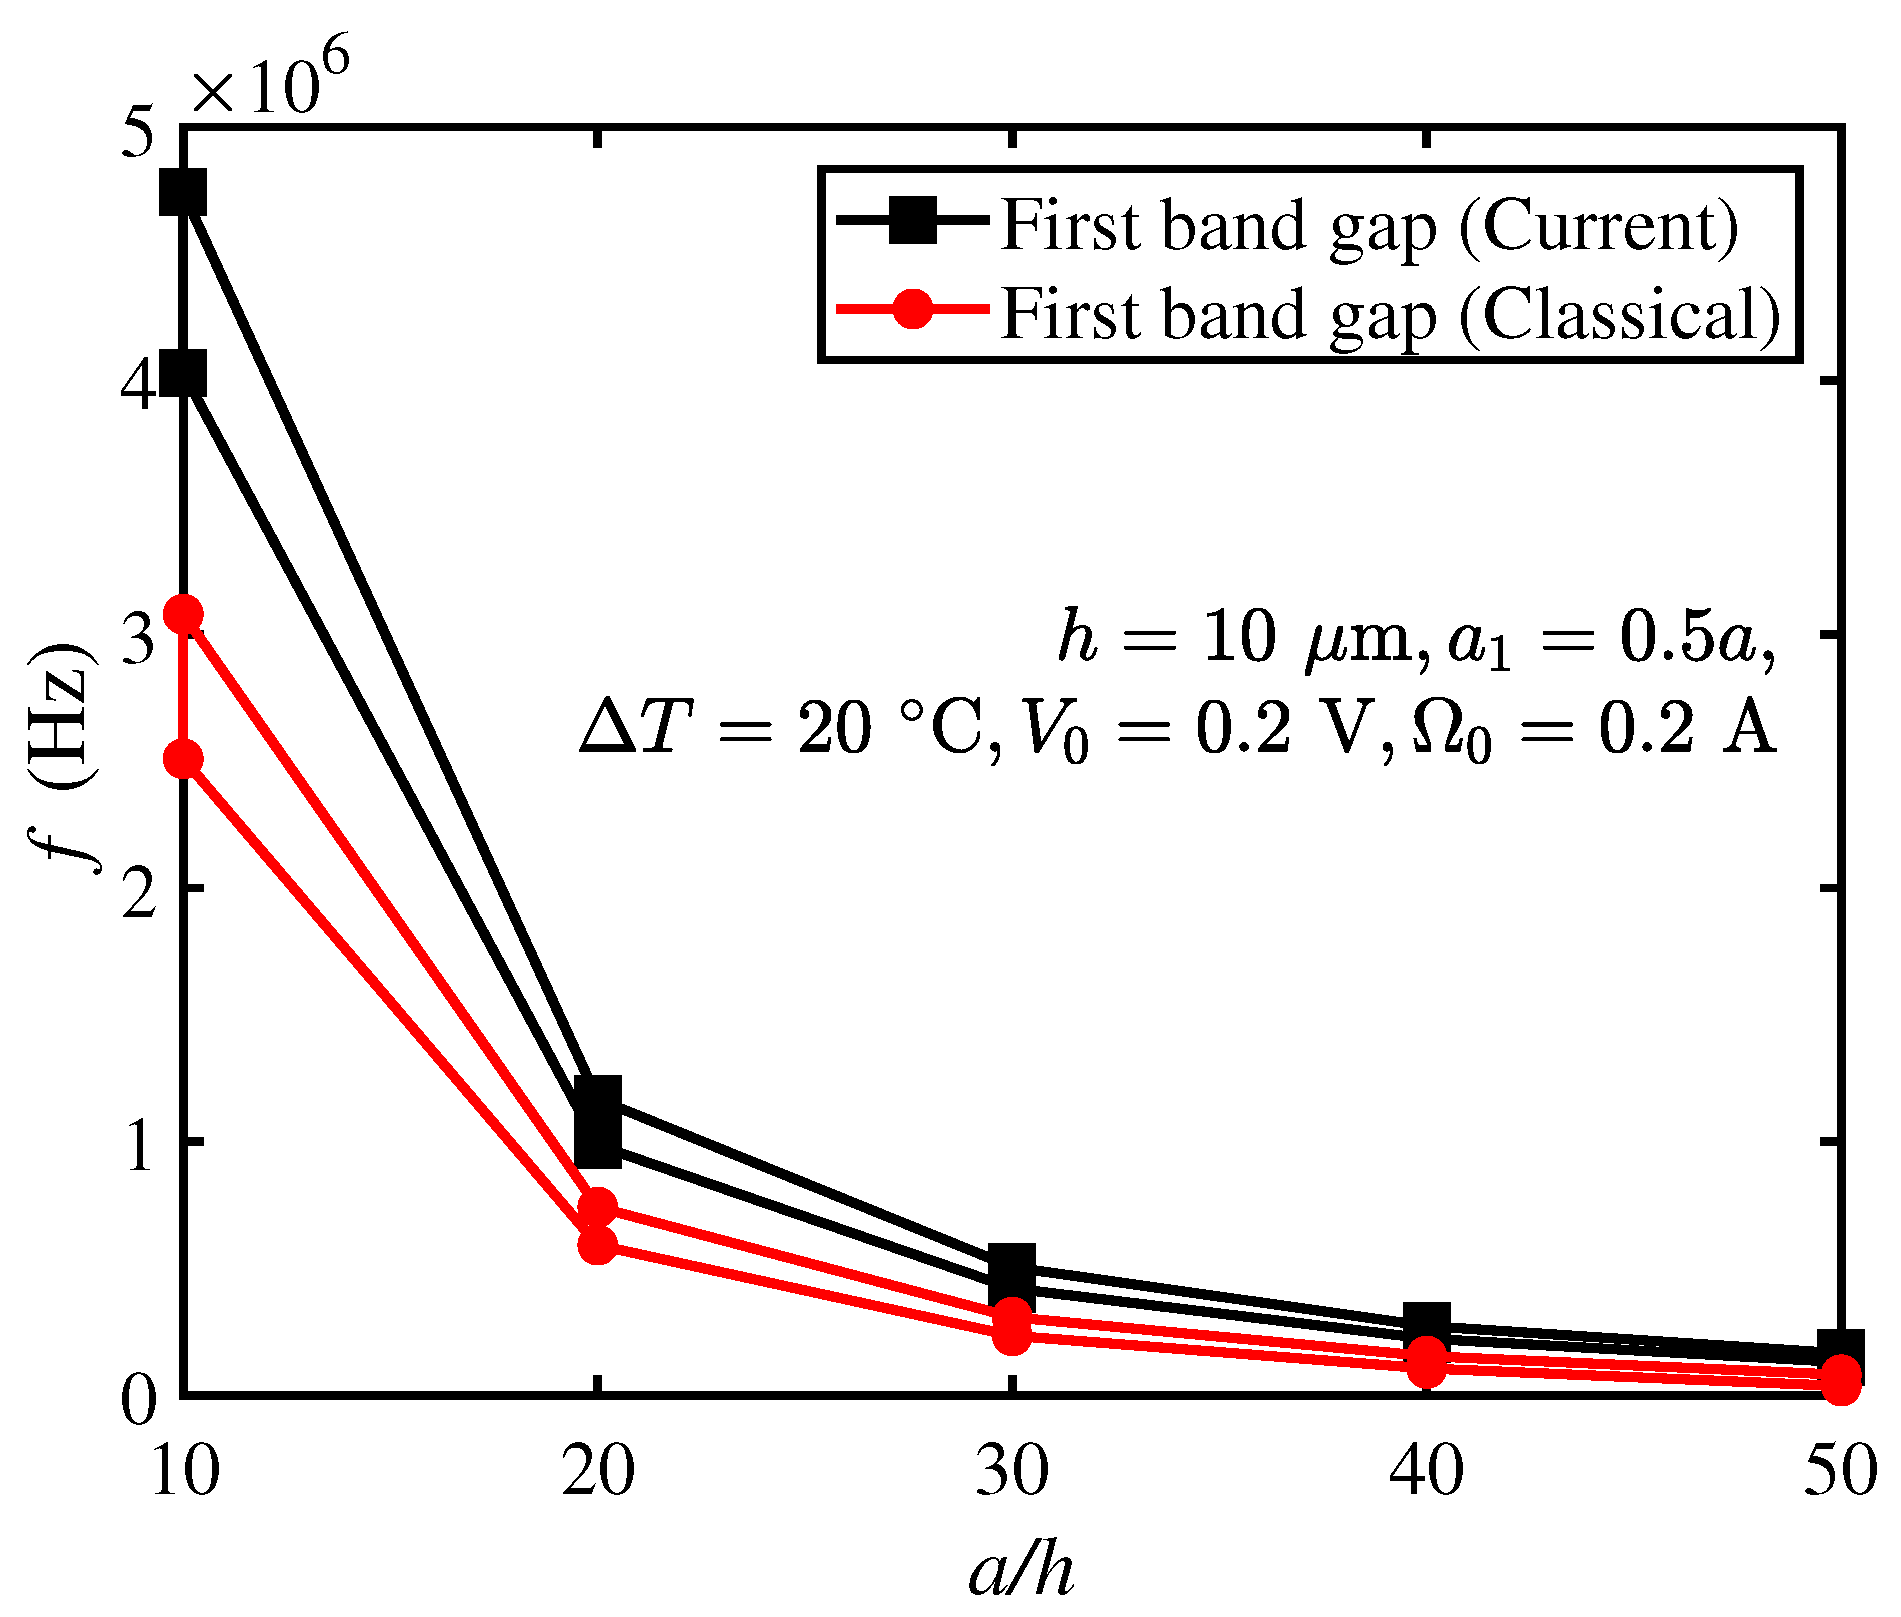
3.4. Effect of Lattice Constant on Bandgap
Figure 5 displays variation of bandgap as a function of the normalized lattice constant , of the current model (i.e., black square line) and the classical model (i.e., red circular line). Here, μm, varies from 10 to 50 and other parameters are kept to be the same as Section 3.3. As the lattice constant a increases, the frequency and size of the bandgap gradually decrease, which can be seen from Figure 5 for both models. This reveals that a lower frequency bandgap can be adjusted by the lattice constant. Moreover, it is not difficult to see that the bandgap frequency of the current model is always higher than that of the classical model.
3.5. Effect of Volume Fraction on Bandgap
In Figure 6, the bandgap of the current and classical models varies with which is defined as the volume fraction of material A () (i.e., ), and values of the bandgap are provided in Figure 6 and Table 2. The geometric parameters are μm, , and the other parameters are the same as those in Section 3.3.
From Figure 6 and Table 2, the bandgap of the current model increases with the increase in before attaining its maximum of 722.67 kHz at , after which the bandgap size decreases. The bandgap of the classical model is similar to that shown in the current model. This indicates that a larger bandgap can be generated by manipulating the volume fraction of the material.
3.6. Tunable Bandgap through the External Electric Potential
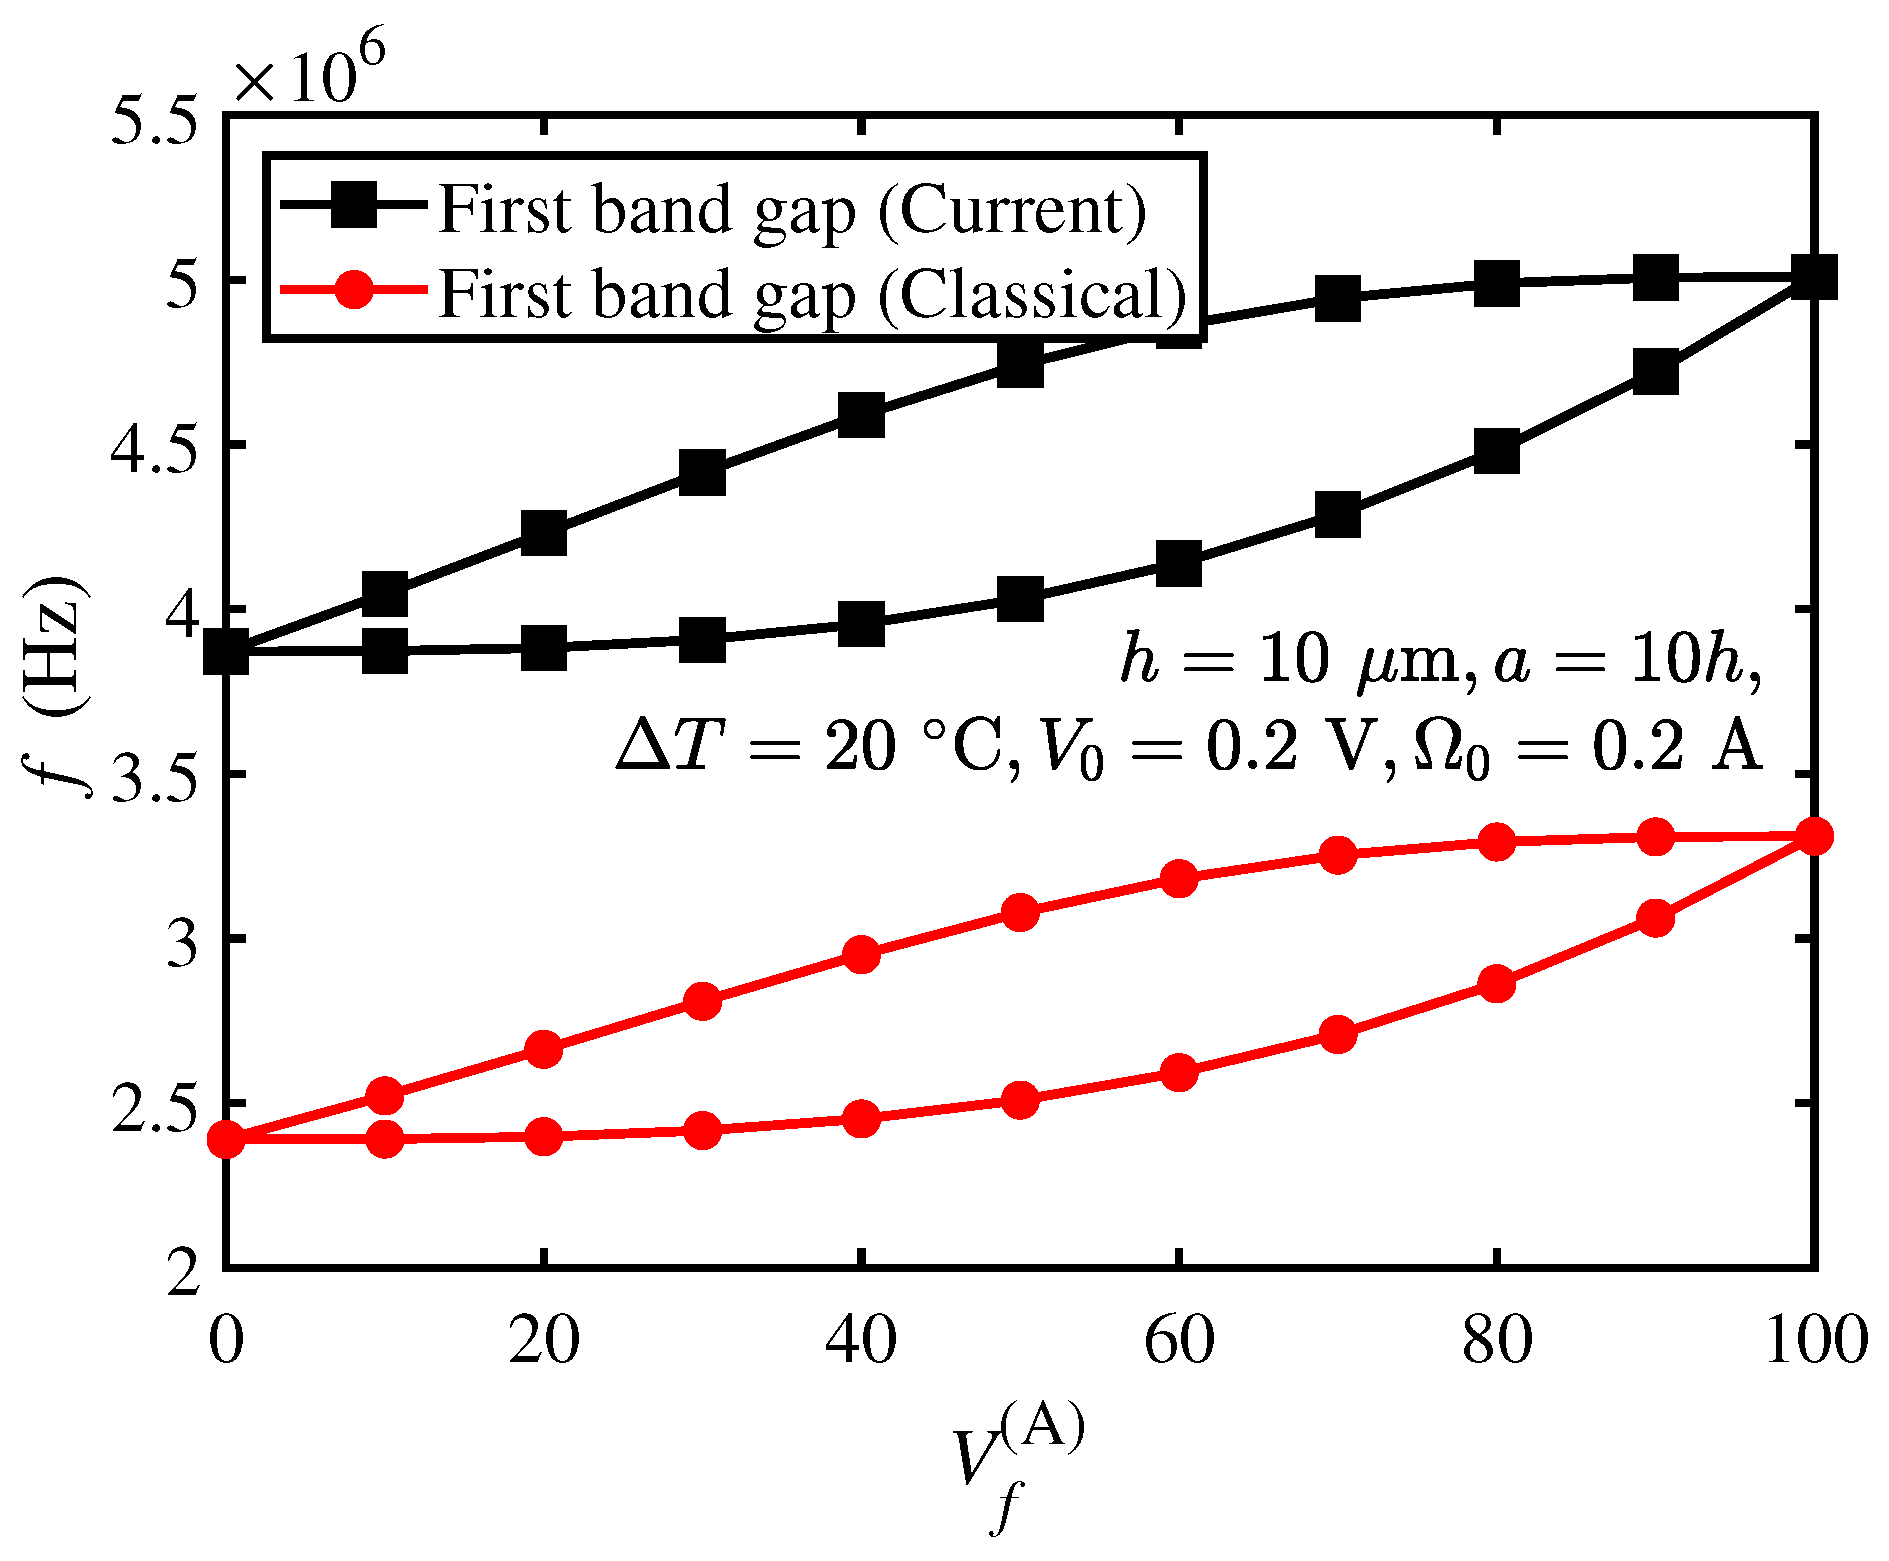
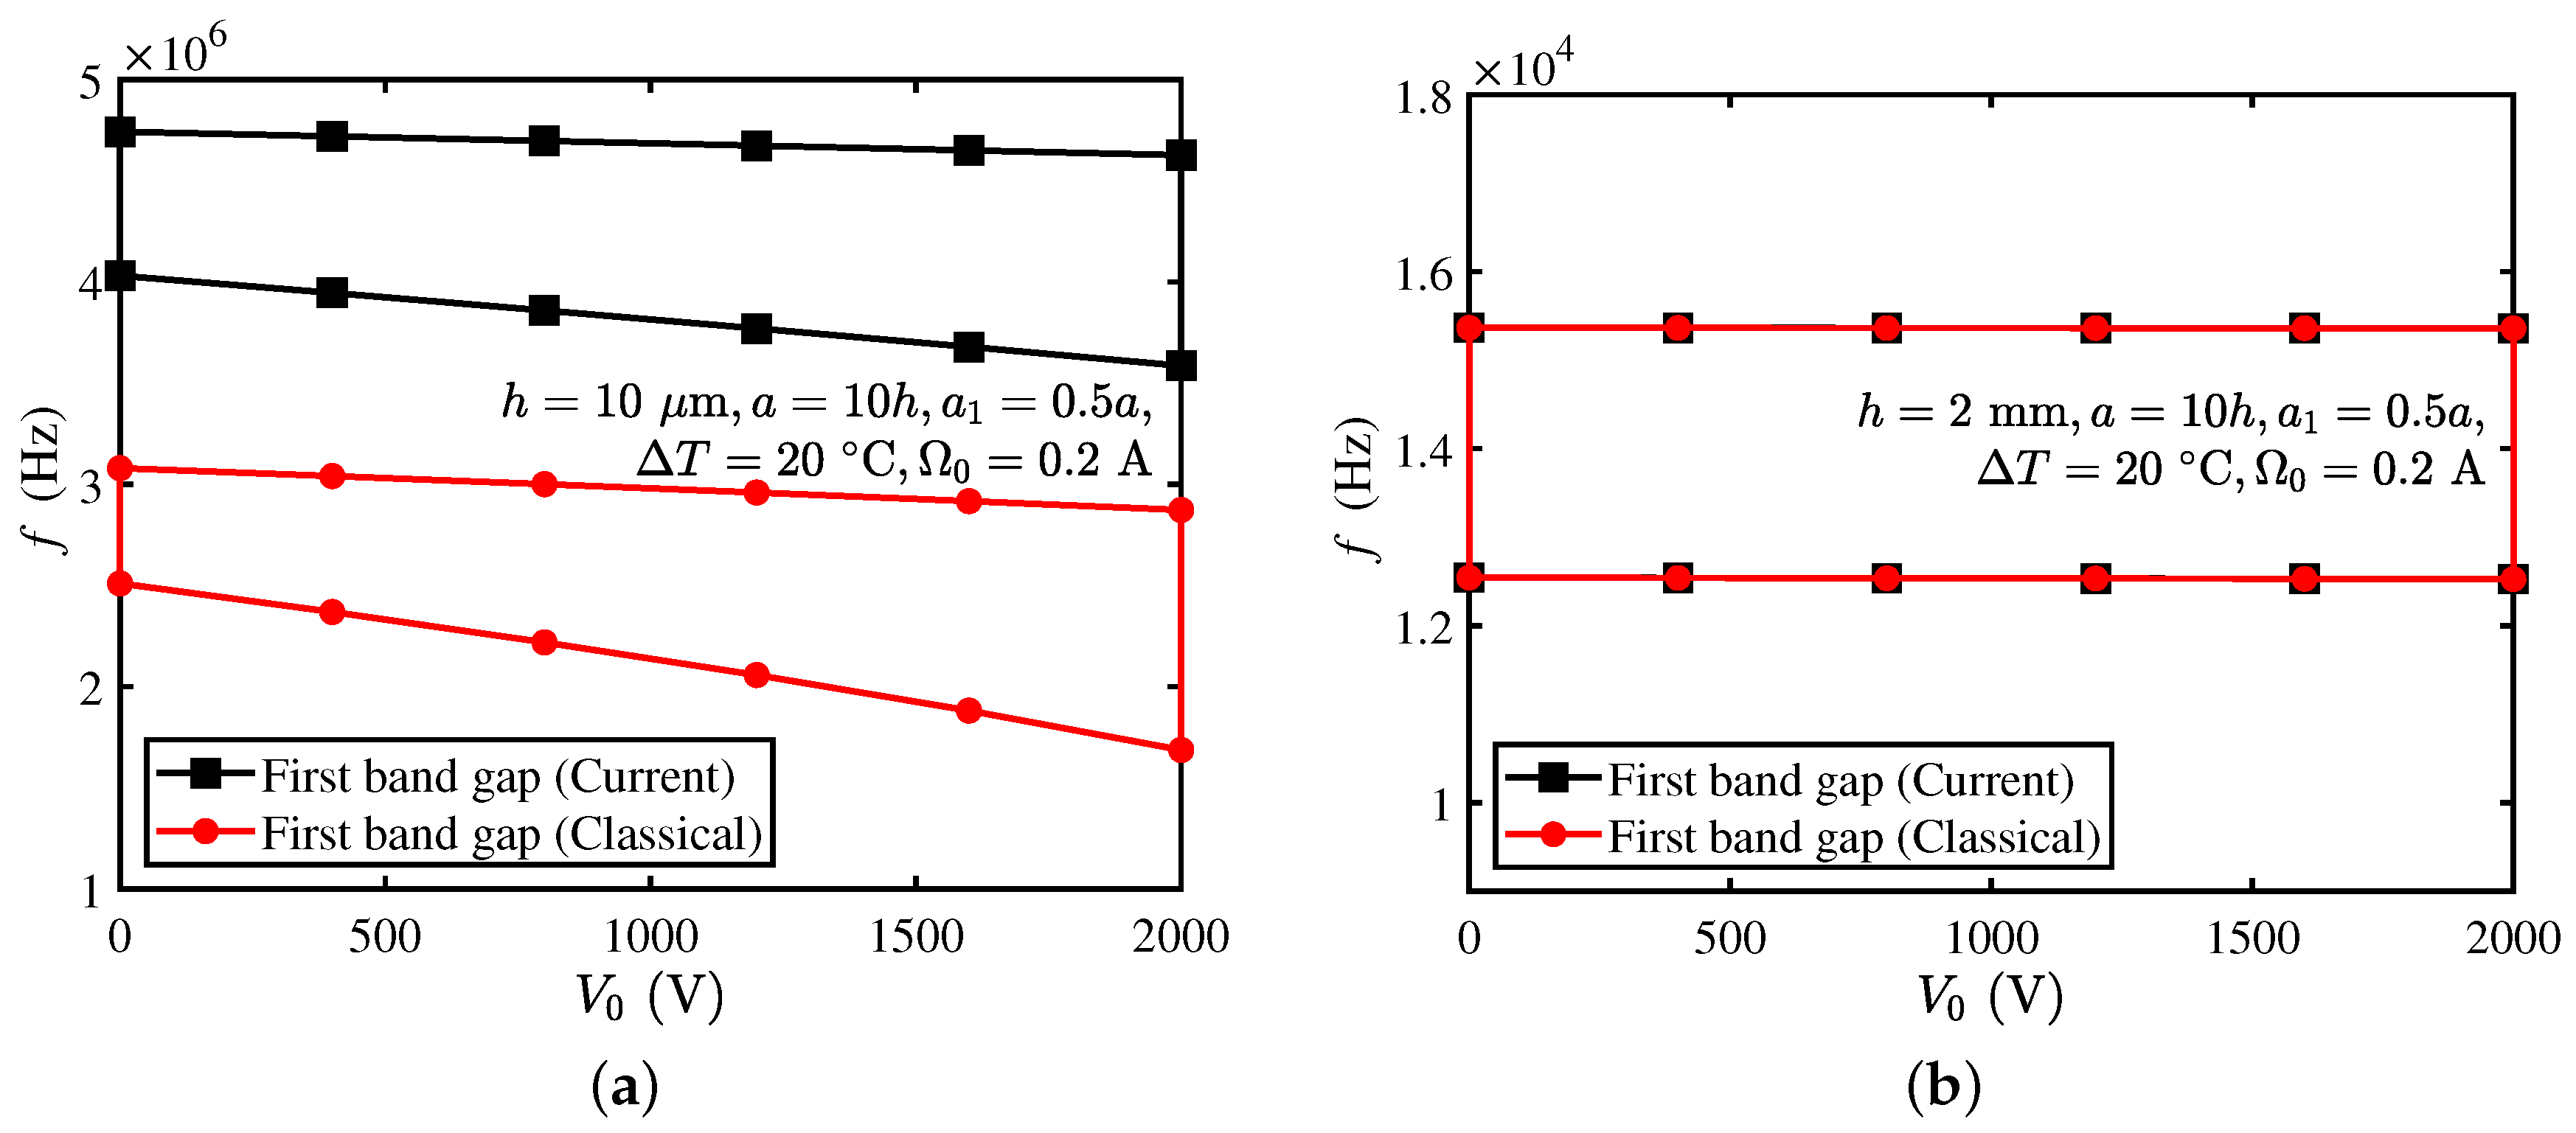
This section shows the bandgap can be adjusted through the external electric potential of the current and classical models. The external electric potential varies from 0 to 2000 V, and the beam thickness μm in Figure 7a, while mm in Figure 7b. The remaining parameters are fixed as those in Section 3.3 (i.e., , , °C, ).
From Figure 7a, it is seen that the bandgap size of the current model gradually increases with the increase in applied electric potential when the beam size is small (with μm here), while the frequency decreases. The bandgap of the classical model has a similar trend. In addition, the bandgap frequency of the current model is always higher than that of the classical model, which is consistent with the conclusion in previous sections.
When the beam size is large (with mm here), the change in the bandgap is not obvious with the applied electric potential. Meanwhile, the frequency and size of bandgap predicted by the current and classical models are almost the same, as shown in Figure 7b. By comparing Figure 7a with Figure 7b, it can be found that the effect of external electric potential on micro-scale PCs is greater than that of large scale.
3.7. Tunable Bandgap through the External Magnetic Potential
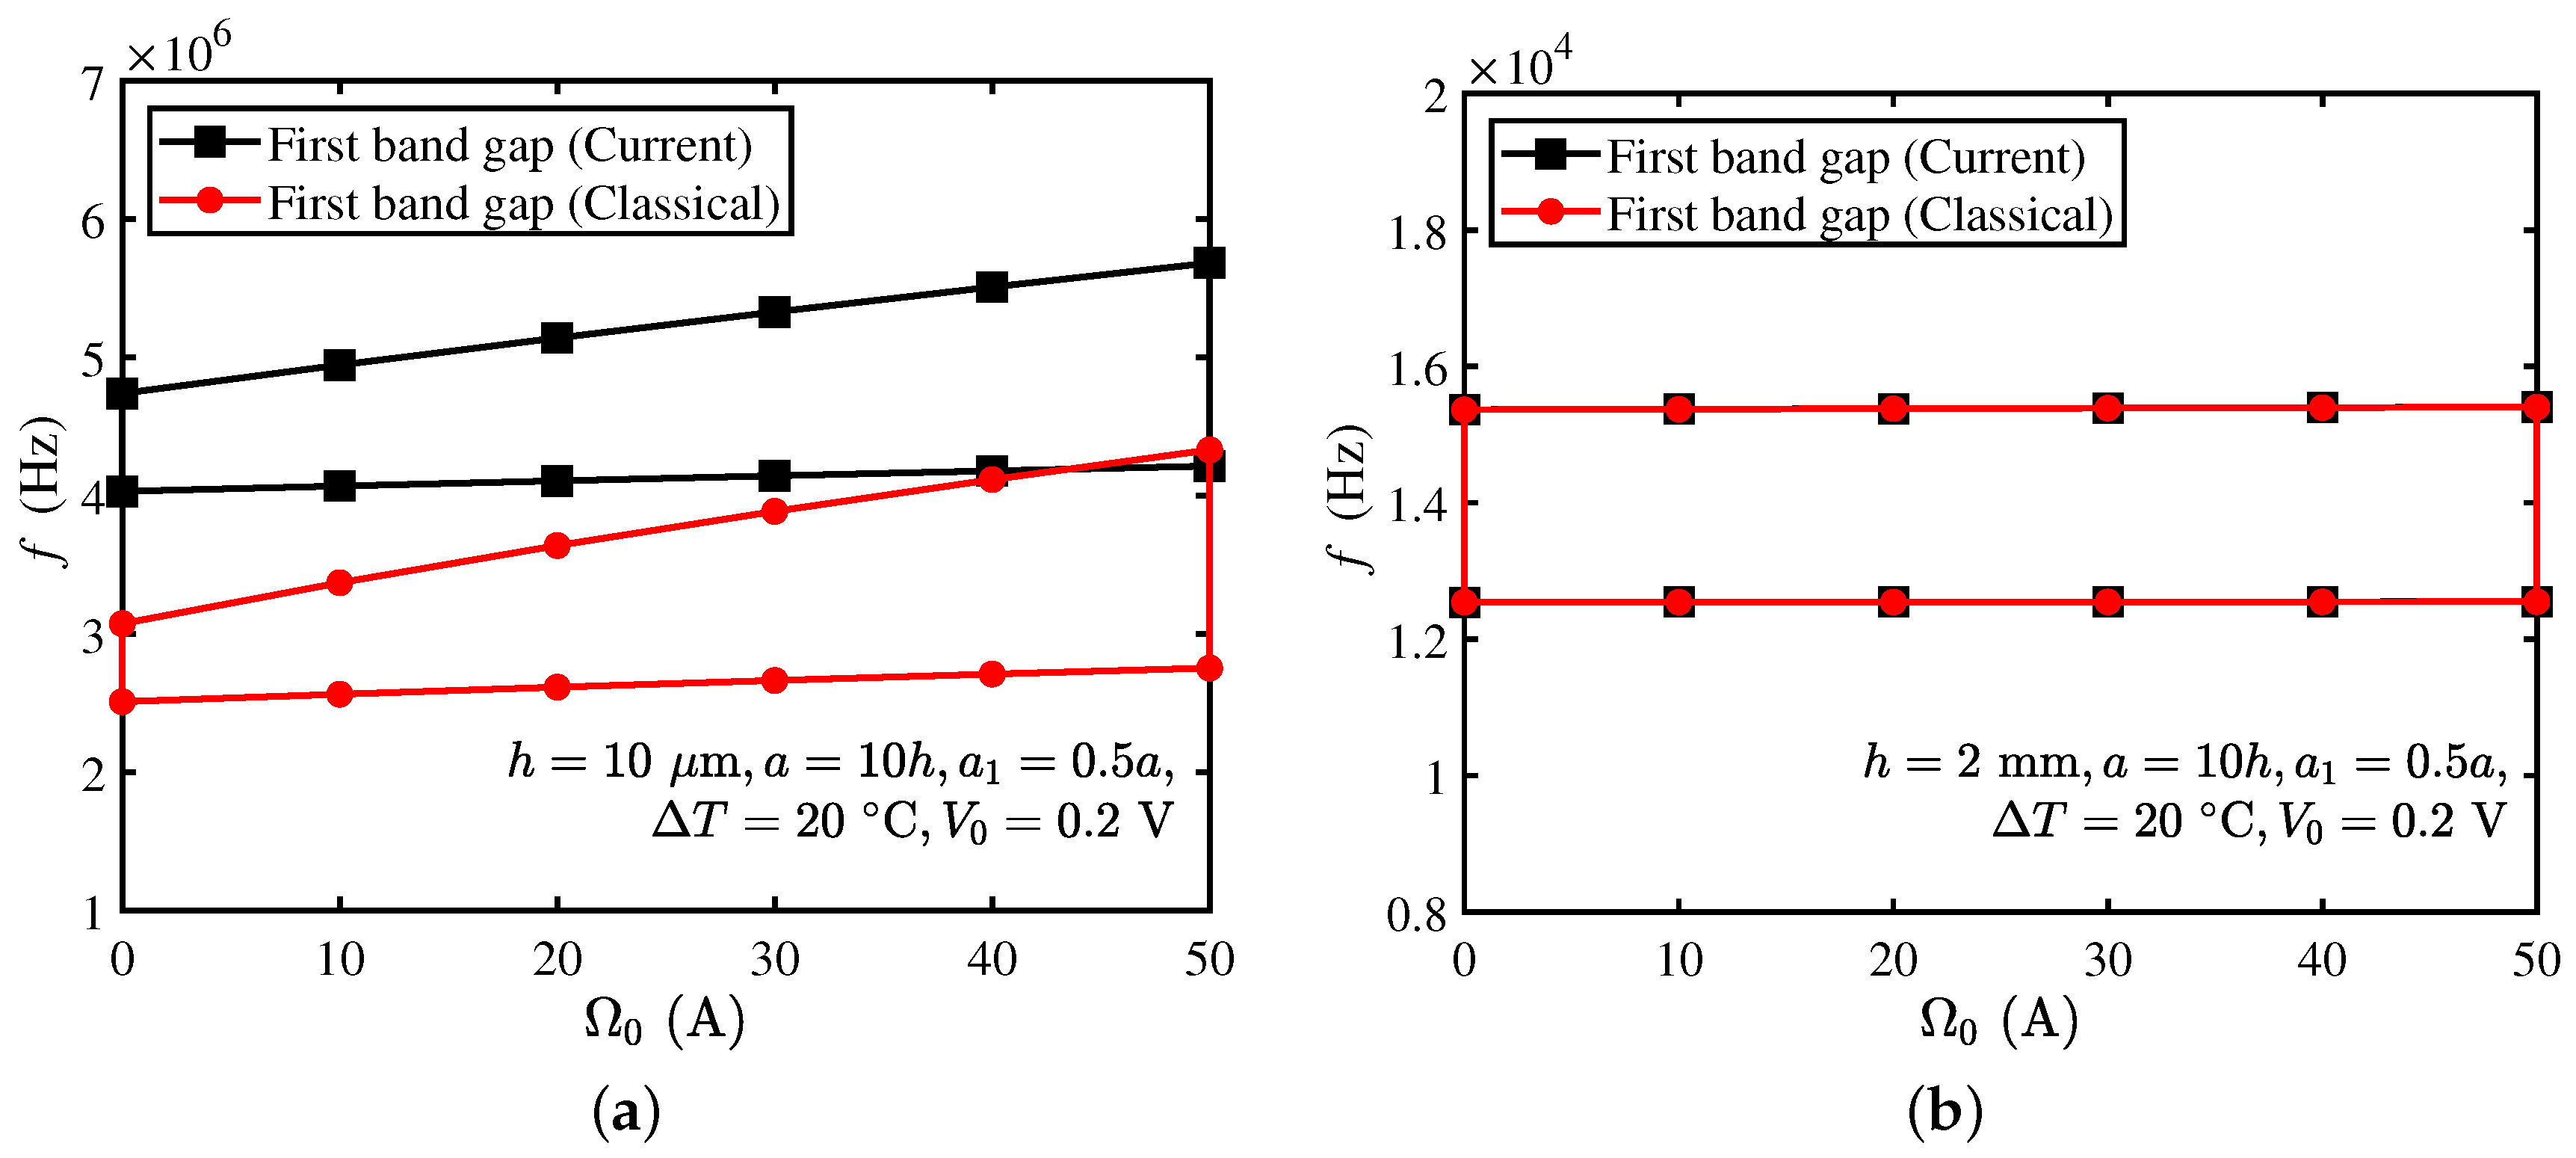
In this section, the effect of external magnetic potential on the bandgap is studied with μm and mm. The applied magnetic potential varies from 0 to 50 A, , and other parameters are kept the same as those in Section 3.6.
For μm, the frequency and size of bandgap of the current and classical models are positively correlated with the external magnetic potential. However, the bandgap frequency of the current model is higher than that of the classical model. For mm, the fluctuation of the bandgap is not obvious. At the same time, the bandgap frequency and size predicted by the two models are almost the same, as shown in Figure 8b. This shows that the microstructure effect and applied magnetic potential on the bandgap are significant only when h is very small.
3.8. Tunable Bandgap through the Temperature Change
Figure 9 plots the bandgap of the current and classical models with temperature variation at μm and mm. Temperature change varies from −100 to and other parameters are the same as Section 3.6.
From Figure 9a, with the increase in , the bandgap frequency of the two models decreases. From Figure 9b, the variation trend of the bandgap is like that for μm. In addition, Figure 9b shows that in the case of mm, the bandgap size of the current model is the same as that of the classical model. From Figure 9, it indicates that the effect of temperature on bandgaps is present at all length scales.
4. Conclusions
In this paper, based on the extended MCST, a new model of piezoelectric/ piezomagnetic/ magnetoelectric PC microbeam is proposed to determine the bandgap. The wave equation for a general MEE-PC microbeam is obtained. The bandgap of the MEE-PC microbeam is determined, which reduces to the piezoelectric- and piezomagnetic-based counterparts as special cases.
The numerical results show that the piezo effects result in an increased beam frequency. The microstructure effect is large when the beam is very small but diminishes as the beam thickness increases. In addition, the numerical results show that the bandgap size varies significantly with the lattice constant and volume fraction. Moreover, external electric and magnetic fields are more likely to affect the bandgaps at small scale, which can be used to manipulate bandgaps in MEMS devices. However, the bandgap sizes can be tailored by adjusting the temperature rather than the external electric and magnetic fields at all length scales.
Author Contributions
Conceptualization, J.H. and G.Z.; methodology, J.H., Z.H., G.Z. and C.M.; writing—original draft preparation, J.H. and Z.H. All authors have read and agreed to the published version of the manuscript.
Funding
The work reported here is funded by the National Key R&D Program of China (grant number 2018YFD1100401) and the National Natural Science Foundation of China [grant numbers 12002086, 11872149, 11772091].
Institutional Review Board Statement
Not applicable.
Informed Consent Statement
Not applicable.
Data Availability Statement
Not applicable.
Conflicts of Interest
The authors declare no conflict of interest.
References
- Zhao, J.; Yin, R.C.; Fan, T.; Lu, M.H.; Chen, Y.F.; Zhu, Y.Y.; Zhu, S.N.; Ming, N.B. Coupled phonon polaritons in a piezoelectric-piezomagnetic superlattice. Phys. Rev. B-Condens. Matter 2008, 77, 75126. [Google Scholar] [CrossRef]
- Wang, Y.Z.; Li, F.M.; Kishimoto, K.; Wang, Y.S.; Huang, W.H. Elastic wave band gaps in magnetoelectroelastic phononic crystals. Wave Motion 2009, 46, 47–56. [Google Scholar] [CrossRef]
- Matar, O.B.; Robillard, J.F.; Vasseur, J.O.; Hladky-Hennion, A.C.; Deymier, P.A.; Pernod, P.; Preobrazhensky, V. Band gap tunability of magneto-elastic phononic crystal. J. Appl. Phys. 2012, 111, 054901. [Google Scholar] [CrossRef] [Green Version]
- Lan, M.; Wei, P. Band gap of piezoelectric/piezomagnetic phononic crystal with graded interlayer. Acta Mech. 2014, 225, 1779–1794. [Google Scholar] [CrossRef]
- Jiang, S.; Dai, L.; Chen, H.; Hu, H.; Jiang, W.; Chen, X. Folding beam-type piezoelectric phononic crystal with low-frequency and broad band gap. Appl. Math. Mech.-Engl. Ed. 2017, 38, 411–422. [Google Scholar] [CrossRef]
- Liu, J.; Guo, H.; Wang, T. A Review of Acoustic Metamaterials and Phononic Crystals. Crystals 2020, 10, 305. [Google Scholar] [CrossRef]
- Yuan, L.; Zhao, P.; Ding, Y.; Ding, B.; Du, J.; Ma, T.; Wang, J. Study on Lamb Waves in a Composite Phononic Crystal Plate. Crystals 2020, 10, 799. [Google Scholar] [CrossRef]
- Espo, M.; Abolbashari, M.H.; Hosseini, S.M. Band structure analysis of wave propagation in piezoelectric nano-metamaterials as periodic nano-beams considering the small scale and surface effects. Acta Mech. 2020, 231, 2877–2893. [Google Scholar] [CrossRef]
- Zhang, S.; Liu, J.; Zhang, H.; Wang, S. Tunable Low Frequency Band Gap and Waveguide of Phononic Crystal Plates with Different Filling Ratio. Crystals 2021, 11, 828. [Google Scholar] [CrossRef]
- Miranda, E., Jr.; Aranas, C., Jr.; Rodrigues, S.; Cantanhêde, H.; Reis, G.; Paiva, A.; Dos Santos, J. Dispersion Diagram of Trigonal Piezoelectric Phononic Structures with Langasite Inclusions. Crystals 2021, 11, 491. [Google Scholar] [CrossRef]
- Kushwaha, M.S.; Halevi, P.; Martínez, G.; Dobrzynski, L.; Djafari-Rouhani, B. Theory of acoustic band structure of periodic elastic composites. Phys. Rev. B 1994, 49, 2313–2322. [Google Scholar] [CrossRef]
- Chen, Y.; Wang, L. Periodic co-continuous acoustic metamaterials with overlapping locally resonant and Bragg band gaps. Appl. Phys. Lett. 2014, 105, 191907. [Google Scholar] [CrossRef]
- Zhang, G.; Zheng, C.; Qiu, X.; Mi, C. Microstructure-dependent Band Gaps for Elastic Wave Propagation in a Periodic Microbeam Structure. Acta Mech. Solida Sin. 2021, 34, 527–538. [Google Scholar] [CrossRef]
- McFarland, A.W.; Colton, J.S. Role of material microstructure in plate stiffness with relevance to microcantilever sensors. J. Micromech. Microeng. 2005, 15, 1060–1067. [Google Scholar] [CrossRef]
- Park, S.K.; Gao, X.L. Bernoulli-Euler beam model based on a modified couple stress theory. J. Micromech. Microeng. 2006, 16, 2355–2359. [Google Scholar] [CrossRef]
- Yang, F. Size-dependent effective modulus of elastic composite materials: Spherical nanocavities at dilute concentrations. J. Appl. Phys. 2004, 95, 3516–3520. [Google Scholar] [CrossRef]
- Lam, D.C.C.; Yang, F.; Chong, A.C.M.; Wang, J.; Tong, P. Experiments and theory in strain gradient elasticity. J. Mech. Phys. Solids 2003, 51, 1477–1508. [Google Scholar] [CrossRef]
- Ma, H.M.; Gao, X.L.; Reddy, J.N. A non-classical Mindlin plate model based on a modified couple stress theory. Acta Mech. 2011, 220, 217–235. [Google Scholar] [CrossRef]
- Ma, H.M.; Gao, X.L.; Reddy, J.N. A microstructure-dependent Timoshenko beam model based on a modified couple stress theory. J. Mech. Phys. Solids 2008, 56, 3379–3391. [Google Scholar] [CrossRef]
- Shaat, M.; Mahmoud, F.F.; Gao, X.L.; Faheem, A.F. Size-dependent bending analysis of Kirchhoff nano-plates based on a modified couple-stress theory including surface effects. Int. J. Mech. Sci. 2014, 79, 31–37. [Google Scholar] [CrossRef]
- Zhang, G.Y.; Gao, X.L. A non-classical Kirchhoff rod model based on the modified couple stress theory. Acta Mech. 2019, 230, 243–264. [Google Scholar] [CrossRef]
- Hong, J.; Zhang, G.; Wang, X.; Mi, C. A simplified strain gradient Kirchhoff rod model and its applications on microsprings and microcolumns. J. Mech. Mater. Struct. 2020, 15, 203–223. [Google Scholar] [CrossRef]
- Hong, J.; Wang, S.; Zhang, G.; Mi, C. Bending, buckling and vibration analysis of complete microstructure-dependent functionally graded material microbeams. Int. J. Appl. Mech. 2021, 13, 2150057. [Google Scholar] [CrossRef]
- Zhang, G.Y.; Gao, X.L. A non-classical model for first-ordershear deformation circular cylindrical thin shells incorporating microstructure and surface energy effects. Math. Mech. Solids 2021, 26, 1294–1319. [Google Scholar] [CrossRef]
- Zhang, G.Y.; Gao, X.L.; Littlefield, A.G. A non-classical model for circular cylindrical thin shells incorporating microstructure and surface energy effects. Acta Mech. 2021, 232, 2225–2248. [Google Scholar] [CrossRef]
- Eringen, A.C. Nonlocal polar elastic continua. Int. J. Eng. Sci. 1972, 10, 1–16. [Google Scholar] [CrossRef]
- Eringen, A.C. On differential equations of nonlocal elasticity and solutions of screw dislocation and surface waves. J. Appl. Phys. 1983, 54, 4703–4710. [Google Scholar] [CrossRef]
- Gurtin, M.E.; Ian Murdoch, A. A continuum theory of elastic material surfaces. Arch. Ration. Mech. Anal. 1975, 57, 291–323. [Google Scholar] [CrossRef]
- Mindlin, R.D. Micro-structure in linear elasticity. Arch. Ration. Mech. Anal. 1964, 16, 51–78. [Google Scholar] [CrossRef]
- Mindlin, R.D.; Eshel, N.N. On first strain-gradient theories in linear elasticity. Int. J. Solids Struct. 1968, 4, 109–124. [Google Scholar] [CrossRef]
- Mindlin, R.D.; Tiersten, H.F. Effects of couple-stresses in linear elasticity. Arch. Ration. Mech. Anal. 1962, 11, 415–448. [Google Scholar] [CrossRef]
- Koiter, W. Couple stresses in the theory of elasticity, I and II, in: Nederl. Akad.Wetensch. Proc. Ser. B 1964, 67, 17–29. [Google Scholar]
- Yang, F.; Chong, A.C.M.; Lam, D.C.C.; Tong, P. Couple stress based strain gradient theory for elasticity. Int. J. Solids Struct. 2002, 39, 2731–2743. [Google Scholar] [CrossRef]
- Qian, D. Bandgap properties of a piezoelectric phononic crystal nanobeam based on nonlocal theory. J. Mater. Sci. 2019, 54, 4038–4048. [Google Scholar] [CrossRef]
- Song, X.; Qian, D.; Qi, Y. Studies on calculation method and bandgap properties of a nonlocal piezoelectric phononic crystal nanoplate. Ferroelectrics 2021, 570, 132–144. [Google Scholar] [CrossRef]
- Qian, D. Bandgap properties of a piezoelectric phononic crystal nanobeam with surface effect. J. Appl. Phys. 2018, 124, 055101. [Google Scholar] [CrossRef]
- Zhang, S.; Gao, Y. Flexural wave band structure of magneto-elastic phononic crystal nanobeams based on the nonlocal theory. Phys. Lett. A 2021, 390, 127090. [Google Scholar] [CrossRef]
- Zhang, G.Y.; Gao, X.L.; Bishop, J.E.; Fang, H.E. Band gaps for elastic wave propagation in a periodic composite beam structure incorporating microstructure and surface energy effects. Compos. Struct. 2018, 189, 263–272. [Google Scholar] [CrossRef]
- Gao, R.Z.; Zhang, G.Y.; Ioppolo, T.; Gao, X.L. Elastic wave propagation in a periodic composite beam structure: A new model for band gaps incorporating surface energy, transverse shear and rotational inertia effects. J. Micromech. Mol. Phys. 2018, 3, 1840005. [Google Scholar] [CrossRef]
- Zhang, G.Y.; Gao, X.L. Band gaps for flexural elastic wave propagation in periodic composite plate structures based on a non-classical Mindlin plate model incorporating microstructure and surface energy effects. Contin. Mech. Thermodyn. 2019, 31, 1911–1930. [Google Scholar] [CrossRef]
- Zhang, G.; Gao, X.L. Elastic wave propagation in a periodic composite plate structure: Band gaps incorporating microstructure, surface energy and foundation effects. J. Mech. Mater. Struct. 2019, 14, 219–236. [Google Scholar] [CrossRef]
- Zhang, G.Y.; Gao, X.L.; Ding, S.R. Band gaps for wave propagation in 2-D periodic composite structures incorporating microstructure effects. Acta Mech. 2018, 229, 4199–4214. [Google Scholar] [CrossRef]
- Zhang, G.Y.; Gao, X.L. Elastic wave propagation in 3-D periodic composites: Band gaps incorporating microstructure effects. Compos. Struct. 2018, 204, 920–932. [Google Scholar] [CrossRef]
- Nikolov, S.; Han, C.S.; Raabe, D. On the origin of size effects in small-strain elasticity of solid polymers. Int. J. Solids Struct. 2007, 44, 1582–1592. [Google Scholar] [CrossRef] [Green Version]
- Zhang, G.Y.; Gao, X.L.; Guo, Z.Y. A non-classical model for an orthotropic Kirchhoff plate embedded in a viscoelastic medium. Acta Mech. 2017, 228, 3811–3825. [Google Scholar] [CrossRef]
- Zhang, G.Y.; Qu, Y.L.; Gao, X.L.; Jin, F. A transversely isotropic magneto-electro-elastic Timoshenko beam model incorporating microstructure and foundation effects. Mech. Mater. 2020, 149, 103412. [Google Scholar] [CrossRef]
- Vinyas, M.; Kattimani, S.C. Static studies of stepped functionally graded magneto-electro-elastic beam subjected to different thermal loads. Compos. Struct. 2017, 163, 216–237. [Google Scholar] [CrossRef]
- Pan, E. Exact Solution for Simply Supported and Multilayered Magneto-Electro-Elastic Plates. J. Appl. Mech. 2001, 68, 608–618. [Google Scholar] [CrossRef]
- Chen, T.; Chiu, M.S.; Weng, C.N. Derivation of the generalized Young-Laplace equation of curved interfaces in nanoscaled solids. J. Appl. Phys. 2006, 100, 074308. [Google Scholar] [CrossRef] [Green Version]
- Yan, Z.; Jiang, L.Y. The vibrational and buckling behaviors of piezoelectric nanobeams with surface effects. Nanotechnology 2011, 22, 245703. [Google Scholar] [CrossRef]
- Bloch, F. Über die Quantenmechanik der Elektronen in Kristallgittern. Z. Phys. 1929, 52, 555–600. [Google Scholar] [CrossRef]
- Chen, P.; Wang, Y.Z.; Wang, Y.S. Active control of flexural waves in a phononic crystal beam with staggered periodic properties. Wave Motion 2020, 93, 102481. [Google Scholar] [CrossRef]
- Chuang, K.C.; Zhang, Z.Q.; Wang, H.X. Experimental study on slow flexural waves around the defect modes in a phononic crystal beam using fiber Bragg gratings. Phys. Lett. A 2016, 380, 3963–3969. [Google Scholar] [CrossRef]
- Hu, B.; Zhang, Z.; Yu, D.; Liu, J.; Zhu, F. Broadband bandgap and shock vibration properties of acoustic metamaterial fluid-filled pipes. J. Appl. Phys. 2020, 128, 205103. [Google Scholar] [CrossRef]
- Miranda, E.J.P.; Dos Santos, J.M.C. Evanescent Bloch waves and complex band structure in magnetoelectroelastic phononic crystals. Mech. Syst. Sig. Process. 2018, 112, 280–304. [Google Scholar] [CrossRef]
Figure 1.
Schematic of a MEE-PC beam.

Figure 2.
Comparison of bandgaps of the current model without microstructure and piezomagnetic effects with (a) Qian et al. [34], and (b) TMM model.
Figure 2.
Comparison of bandgaps of the current model without microstructure and piezomagnetic effects with (a) Qian et al. [34], and (b) TMM model.

Figure 3.
Bandgaps of the current model (a) with and (b) without piezomagnetic and piezoelectric effects.
Figure 3.
Bandgaps of the current model (a) with and (b) without piezomagnetic and piezoelectric effects.

Figure 4.
Bandgaps of the current and classical models varying with the beam thickness h.

Figure 5.
Bandgaps of the current and classical models varying with the normalized lattice constant .
Figure 5.
Bandgaps of the current and classical models varying with the normalized lattice constant .

Figure 6.
Bandgaps of the current and classical models varying with the .

Figure 7.
Bandgaps of current and classical models under different external electric potentials with (a) μm, and (b) mm.
Figure 7.
Bandgaps of current and classical models under different external electric potentials with (a) μm, and (b) mm.

Figure 8.
Bandgaps of current and classical models under different external magnetic potentials with (a) μm, and (b) mm.
Figure 8.
Bandgaps of current and classical models under different external magnetic potentials with (a) μm, and (b) mm.

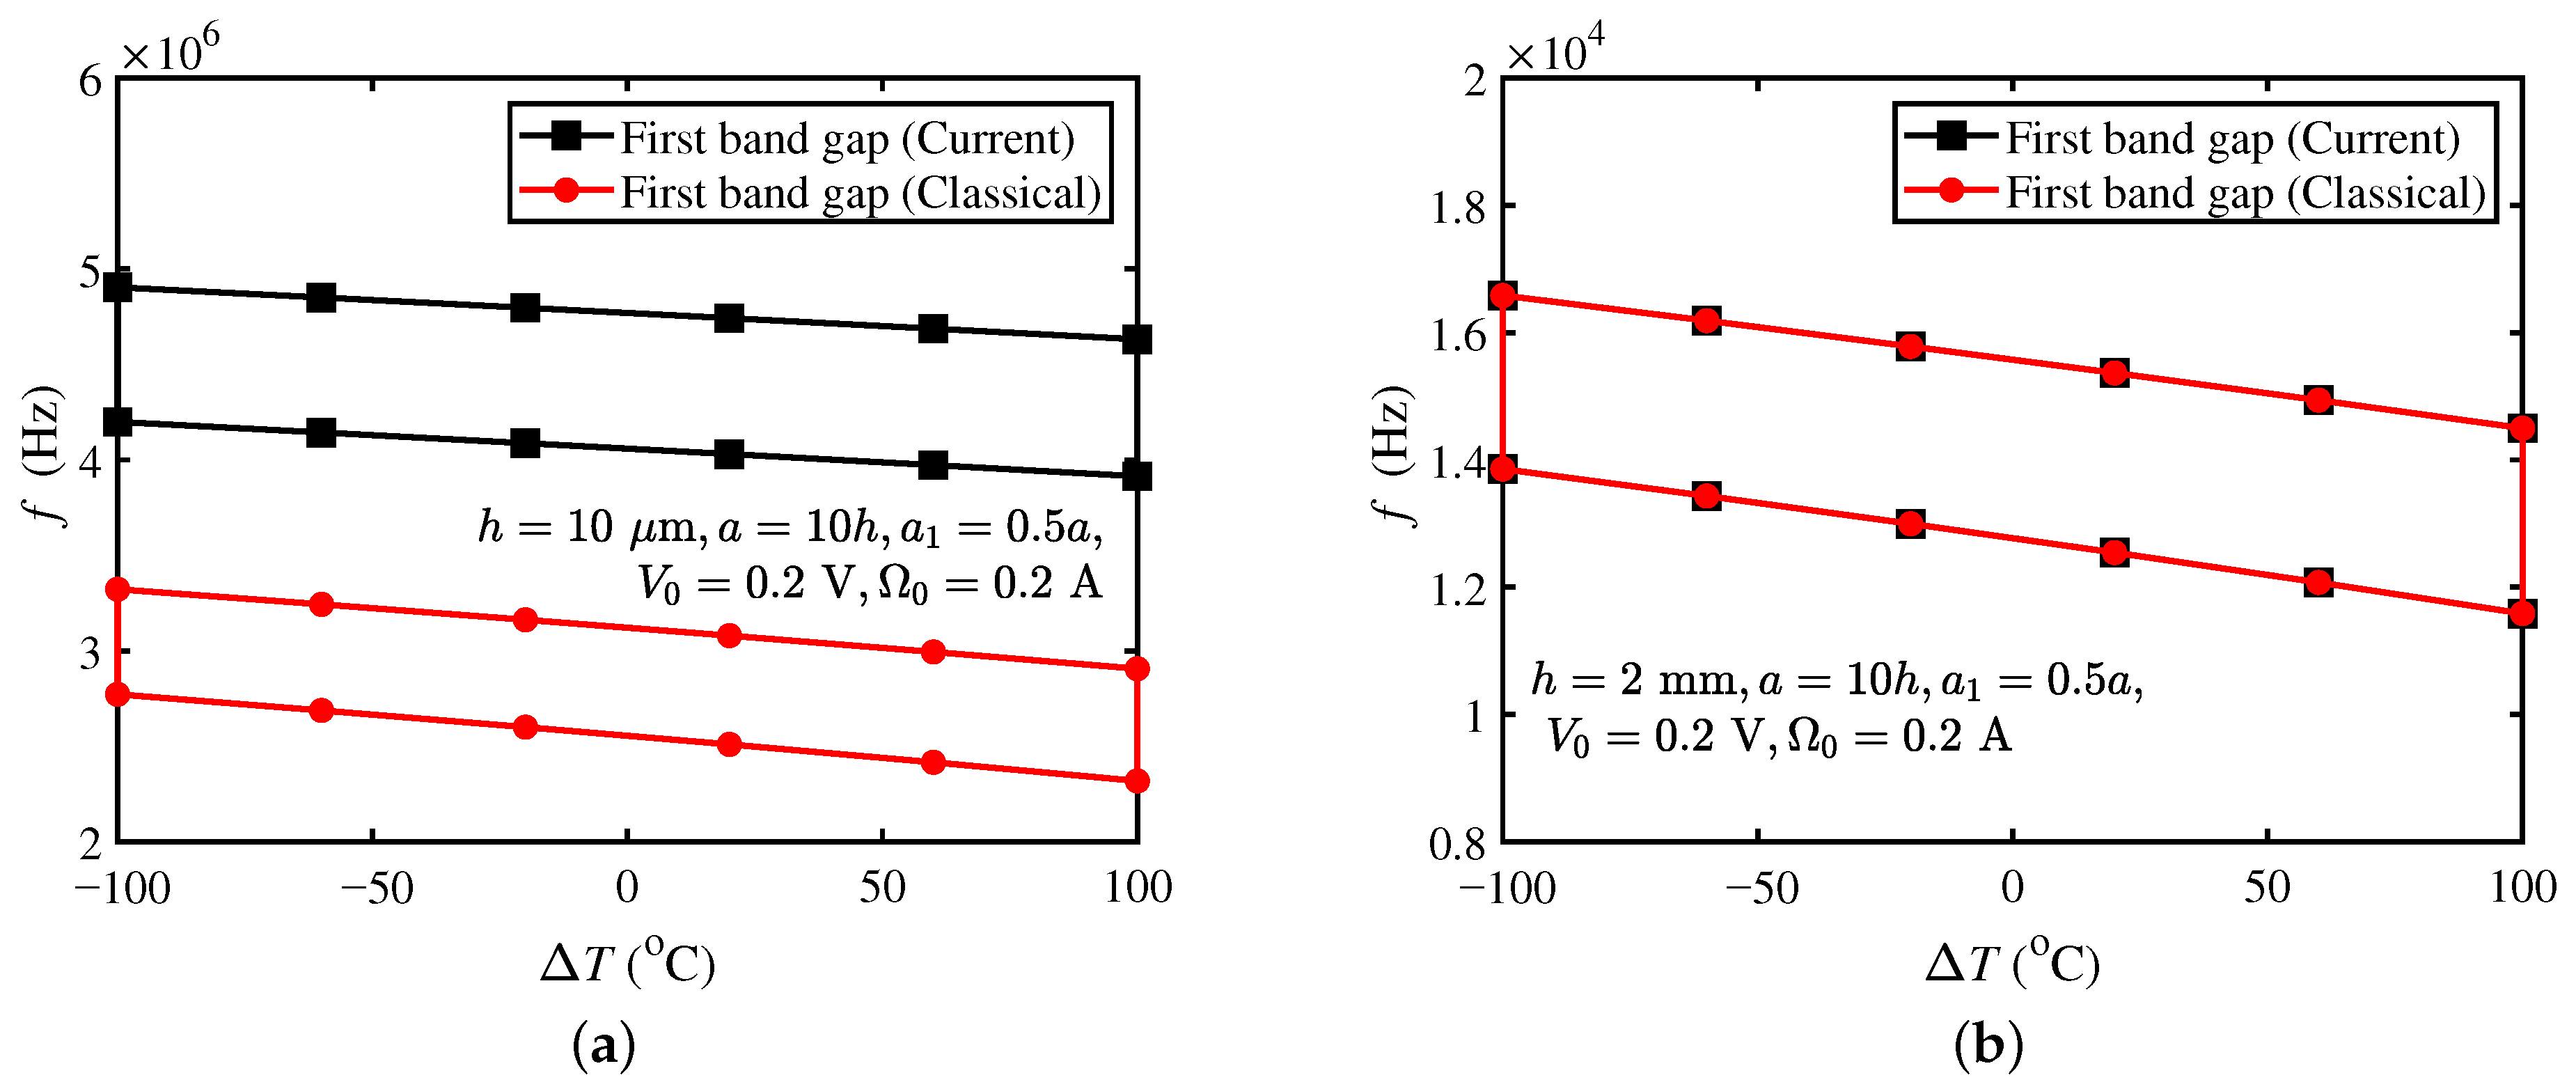
Figure 9.
Bandgaps of current and classical models under different temperature changes with (a) μm, and (b) mm.
Figure 9.
Bandgaps of current and classical models under different temperature changes with (a) μm, and (b) mm.


| Meterial Parameters | ||
|---|---|---|
| 5300 | 5800 | |
| 286 | 166 | |
| 15.366 | 8.134 | |
| 9.295 | 3.773 | |
| 0 | −4.4 | |
| 0.093 | 12.6 | |
| 580.3 | 0 | |
| 157 | 10 | |
| 0 | 0 | |
| 10 | 15.7 |
Table 2.
Bandgap size of current and classical models with different values of .
| Bandgap Size (kHz) | ||
|---|---|---|
| Current Model | Classical Model | |
| 0 | 0 | 0 |
| 10 | 173.99 | 131.08 |
| 20 | 347.14 | 165.44 |
| 30 | 507.5 | 392.57 |
| 40 | 634.74 | 499.07 |
| 50 | 711.86 | 569.63 |
| 60 | 722.67 | 588.9 |
| 70 | 656.09 | 544.64 |
| 80 | 508.63 | 430.46 |
| 90 | 285.18 | 246.47 |
| 100 | 0 | 0 |
Publisher’s Note: MDPI stays neutral with regard to jurisdictional claims in published maps and institutional affiliations. |
© 2021 by the authors. Licensee MDPI, Basel, Switzerland. This article is an open access article distributed under the terms and conditions of the Creative Commons Attribution (CC BY) license (https://creativecommons.org/licenses/by/4.0/).
Share and Cite
MDPI and ACS Style
Hong, J.; He, Z.; Zhang, G.; Mi, C. Tunable Bandgaps in Phononic Crystal Microbeams Based on Microstructure, Piezo and Temperature Effects. Crystals 2021, 11, 1029. https://doi.org/10.3390/cryst11091029
AMA Style
Hong J, He Z, Zhang G, Mi C. Tunable Bandgaps in Phononic Crystal Microbeams Based on Microstructure, Piezo and Temperature Effects. Crystals. 2021; 11(9):1029. https://doi.org/10.3390/cryst11091029
Chicago/Turabian StyleHong, Jun, Zhuangzhuang He, Gongye Zhang, and Changwen Mi. 2021. "Tunable Bandgaps in Phononic Crystal Microbeams Based on Microstructure, Piezo and Temperature Effects" Crystals 11, no. 9: 1029. https://doi.org/10.3390/cryst11091029
Note that from the first issue of 2016, this journal uses article numbers instead of page numbers. See further details here.