
Hydrogen Molecules Rotational Stimulated Raman Scattering in All-Fiber Cavity Based on Hollow-Core Photonic Crystal Fibers

1
College of Advanced Interdisciplinary Studies, National University of Defense Technology, Changsha 410073, China
2
Hunan Provincial Key Laboratory of High Energy Laser Technology, Changsha 410073, China
3
State Key Laboratory of Pulsed Power Laser Technology, Changsha 410073, China
*
Author to whom correspondence should be addressed.
Crystals 2021, 11(6), 711; https://doi.org/10.3390/cryst11060711
Submission received: 22 May 2021
/
Revised: 14 June 2021
/
Accepted: 18 June 2021
/
Published: 21 June 2021
(This article belongs to the Special Issue Specialty Photonic Crystal Fibres and Their Applications)
Abstract
:Here, we report the rotational stimulated Raman scattering (SRS) of hydrogen molecules in an all-fiber cavity based on hollow-core photonic crystal fibers (HC-PCFs). The gas cavity consists of a 49 m long HC-PCF filled with 18 bar high-pressure hydrogen and two sections of fusion spliced solid-core fibers on both ends. When pumped by a homemade 1064 nm pulsed fiber amplifier, only rotational SRS occurs in the gas cavity due to the transmission spectral characteristics of the used HC-PCF, and 1135 nm Stokes wave is obtained (Raman frequency shift of 587 cm−1). By changing the pulse width and repetition frequency of the pump source, the output characteristics are explored. In addition, a theoretical model is established for comparison with the experimental results. This work is helpful for the application of gas Raman laser based on the HC-PCFs.
1. Introduction
Since the first demonstration in 1963 [1], stimulated Raman scattering (SRS) in gases has been considered as an effective way of generating lasers at unobtainable wavelengths. Due to the large Raman shift and high Raman gain coefficient, light sources based on the SRS in gases can obtain tunable, narrow linewidth lasers, especially for the lasers in the ultraviolet and infrared spectral range [2,3]. However, the SRS in the gas cell has a short interaction length, which requires very high pump peak power, usually up to megawatt level. Besides, there are always more than one Raman line generated and the Raman conversion efficiency is quite low for the lasers at the desired wavelength. The appearance of hollow-core fibers (HCFs) provides an effective solution to these problems and gives birth to a new kind of fiber lasers, namely, fibers gas Raman lasers (FGRLs). The gas cell based on HCFs can greatly enhance the interaction between the pump laser and the gas molecules. The interaction length can be also greatly extended by increasing the length of the HCFs. What is more, the final gain spectrum of various orders of Stokes waves can be controlled by wavelength-dependent fiber attenuation in the HCFs, which can provide much higher conversion efficiency of the desired wavelength. Gaseous hydrogen is the most commonly used Raman gain medium in gas cells. The first demonstration of the SRS of hydrogen molecules in HCFs was in 2002 [4], then a lot of work has been done based on various HCFs [4,5,6,7,8,9,10,11,12,13,14,15]. However, in almost all reported FGRLs, the pump laser is coupled into the HCFs through free space, which is quite inconvenient and limits the applications of the FGRLs. Thus, in 2004 [13], Benabid et al. first reported an all-fiber gas cell spliced by an expensive special fiber fusion splicer (Vytran FFS-2000-PM, Morganville, NJ, USA), which is an effective but not common way. In 2007 [6], Couny et al. reported an all-fiber gas cavity, but the pump laser was coupled into the cavity through free space. Therefore, they did not realize the experimental system with all-fiber structure. In our previous work [11,15], we reported the 1.7 μm quasi all-fiber FGRL, and the optical isolators were introduced to avoid Fresnel reflection damage to the pump source. The fiber laser was used as the pump source and the pigtail was spliced to the input end of the HC-PCF, which greatly improves the stability of the system. However, the output end of the HC-PCF is still sealed in the gas chamber, making the experimental system still bulky. Chen et al. reported a 1135 nm FGRL with all-fiber structure in 2013 [14], but the power is less than 1 mW and the conversion efficiency is only 2.69%, meaning poor performance, and it is quite difficult to explore the applications.
In this paper, we report the hydrogen SRS in an all-fiber cavity based on HC-PCFs. The gas cavity is fabricated by splicing the HC-PCFs with two sections of solid-core fibers at each end using arc fusion technique [16,17,18]. When pumped with a pulsed 1064 nm fiber laser amplifier, a 1135 nm Stokes wave is generated by pure rotational SRS of hydrogen molecules due to the transmission loss spectrum of the HC-PCF. The output characteristics are explored with different pump pulse widths and repetition frequencies. When the width is 4 ns and the repetition frequency is 20 MHz, the maximum Stokes power of 289 mW is achieved with a power conversion efficiency of 28.5%, which can be greatly enhanced by improving the splicing loss and optimizing the HCF’s length in the future. A theoretical model is established, and the experimental result is in good agreement with the simulation result.
2. Experimental Setup
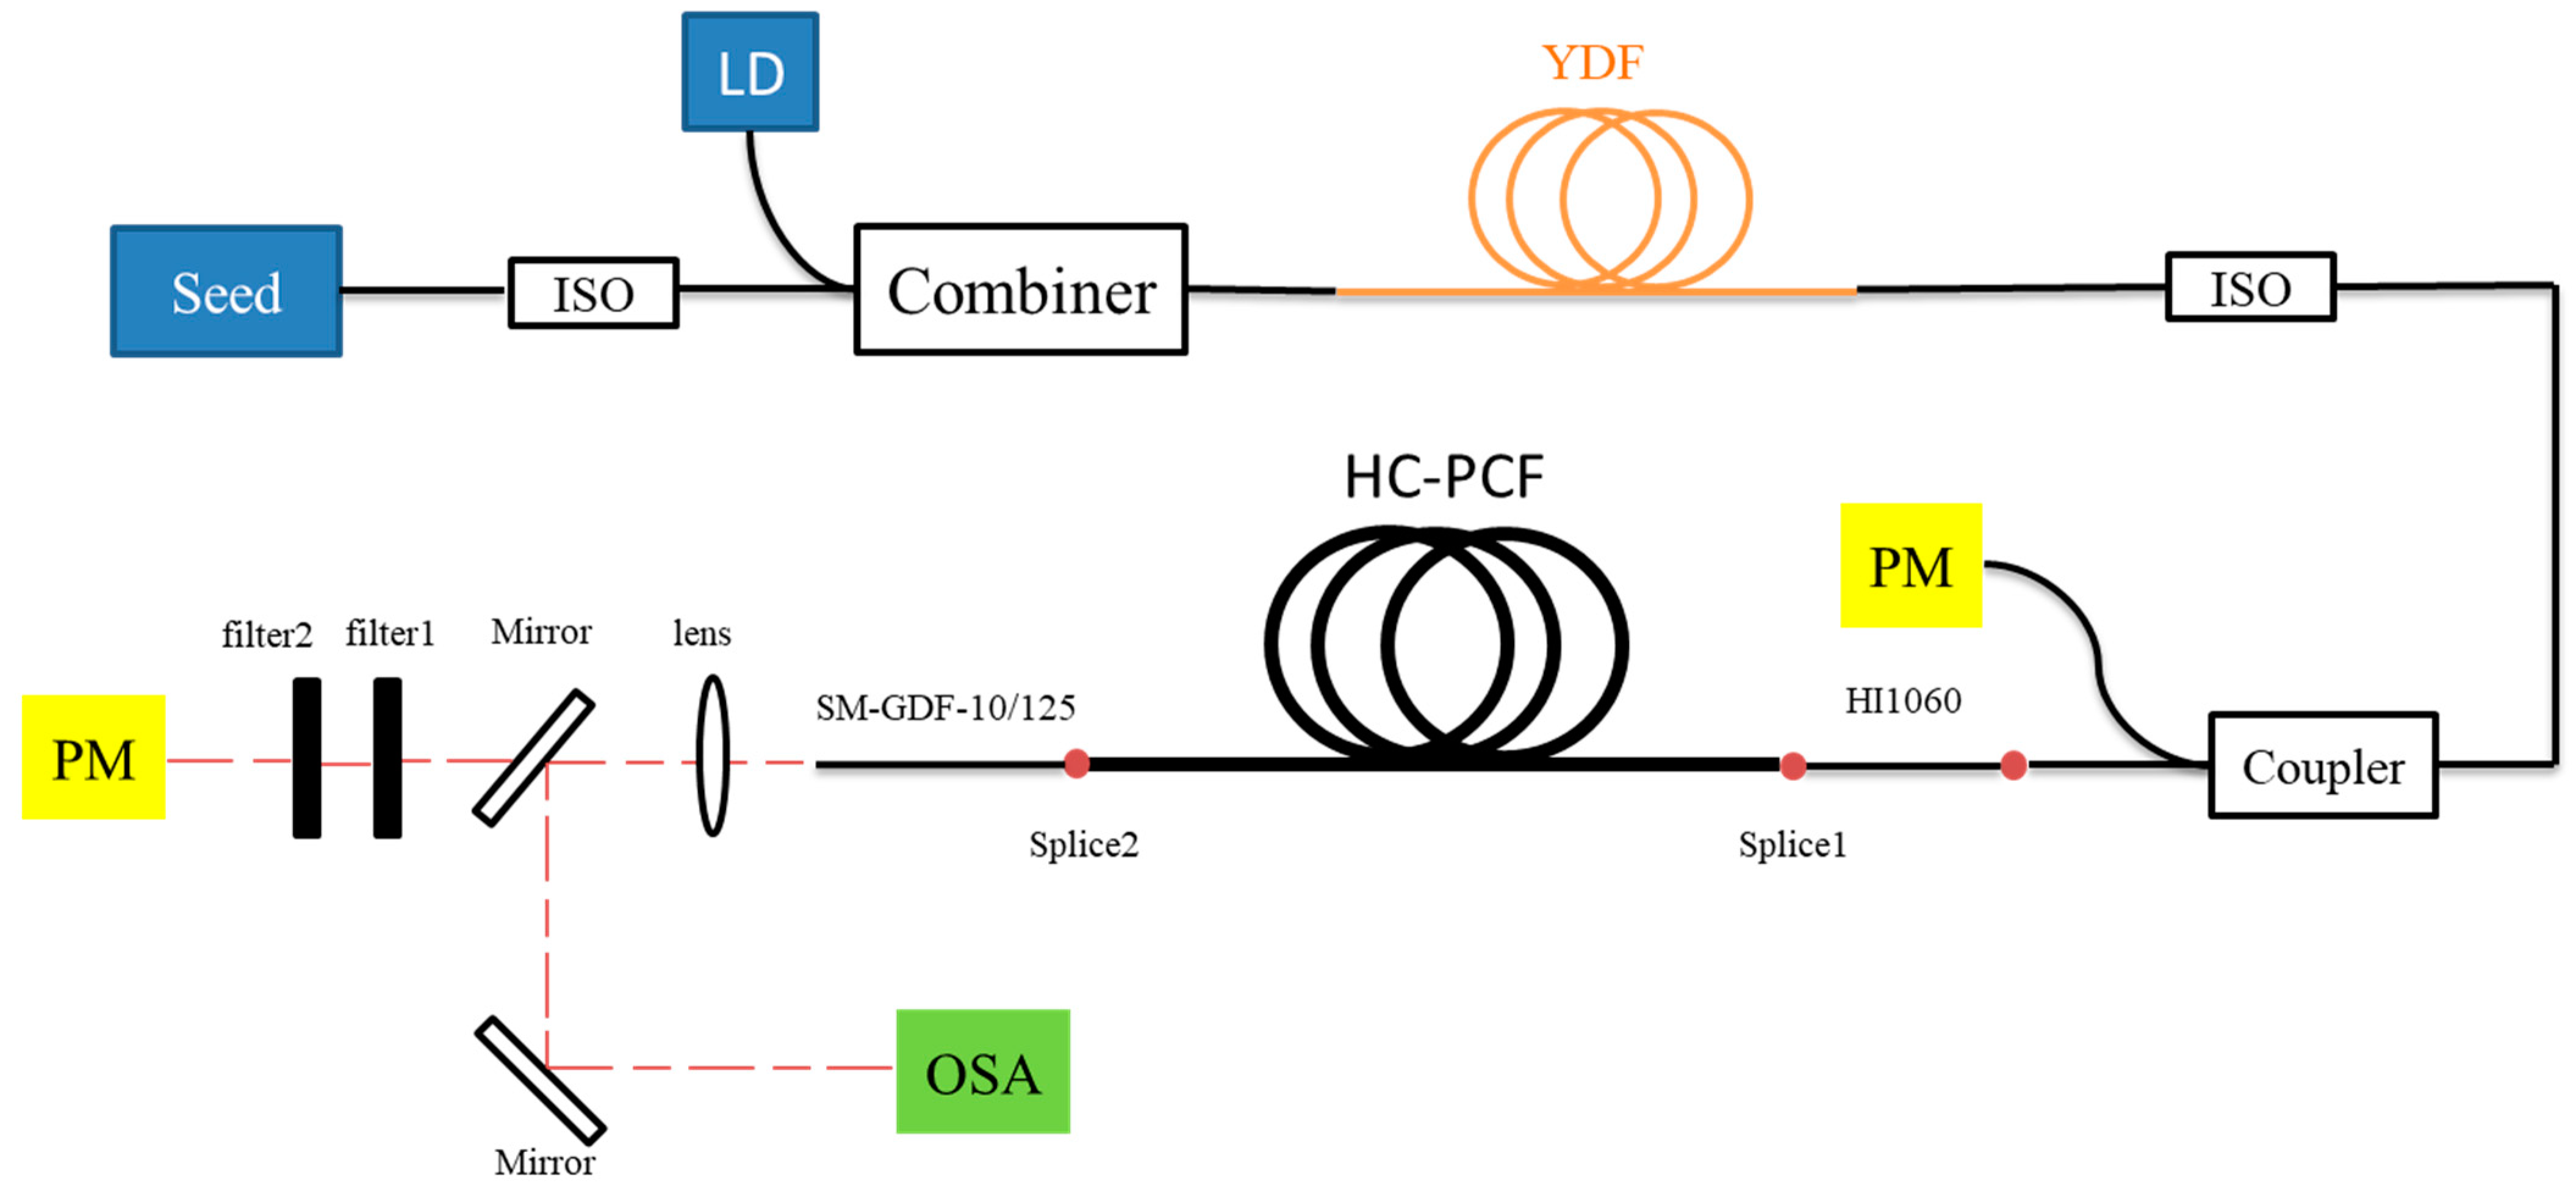
Figure 1 shows the experimental setup of pulsed 1 μm all-fiber Raman laser. The pump source consists of a seed which is a 1064 nm optical pulse machine (OPM; a laser diode with adjustable pulse generator, pulse driver, and efficient TEC controller) with multi-longitudinal modes and a homemade double-cladding ytterbium-doped fiber amplifier (YDFA). The pulse width of the seed can be adjusted form 1 ns to 6 ns and the repetition frequency tuning range is from 4 kHz to 25 MHz. The maximum average output power of 52.42 mW can be achieved when the seed is at the pulse width of 4 ns and the repetition frequency is 20 MHz. Figure 2a presents the measured fine spectrum with an OSA resolution of 0.02 nm in this power, and it can be seen that there are four longitudinal modes. In YDFA, there are 5 m ytterbium-doped fibers (YDF; Nufern double clad optical fiber, USA) with the absorption coefficient of 4.95 dB/m at 976 nm and the core diameter is 10 μm. The YDF is pumped by a 976 nm laser diode (LD) with the maximum output power of 3.28 W, which is coupled into the YDF by the fiber combiner. YDFA is fused with an optical isolator (the insertion loss is 0.46 dB, the isolation is 38.5 dB) to avoid the disturbance caused by the backward laser. The maximum output power of 1.51 W is achieved with the 3.28 W pump power at 976 nm when the pulse width of seed is 4 ns, and the repetition frequency is 20 MHz. The measured fine spectrum of the YDFA in Figure 2b keeps the characteristics well, and the corresponding wavelengths are 1063.94 nm, 1064.38 nm, 1064.83 nm, and 1065.27 nm, respectively. The output fiber of the isolator is fused with a fiber coupler (the measured coupling ratio is 99.83:0.17) to monitor the output power of the pump source in real time. The main output fiber of the coupler is fused with the all-fiber gas cavity. A convex-plane lens is placed at the output end of the gas cavity to collimate the laser. Two silver mirrors can help monitor the output spectrum. Besides, the residual pump laser and Stokes laser are separated by adjusting the flippable long-pass filters, which is helpful to measure the power.
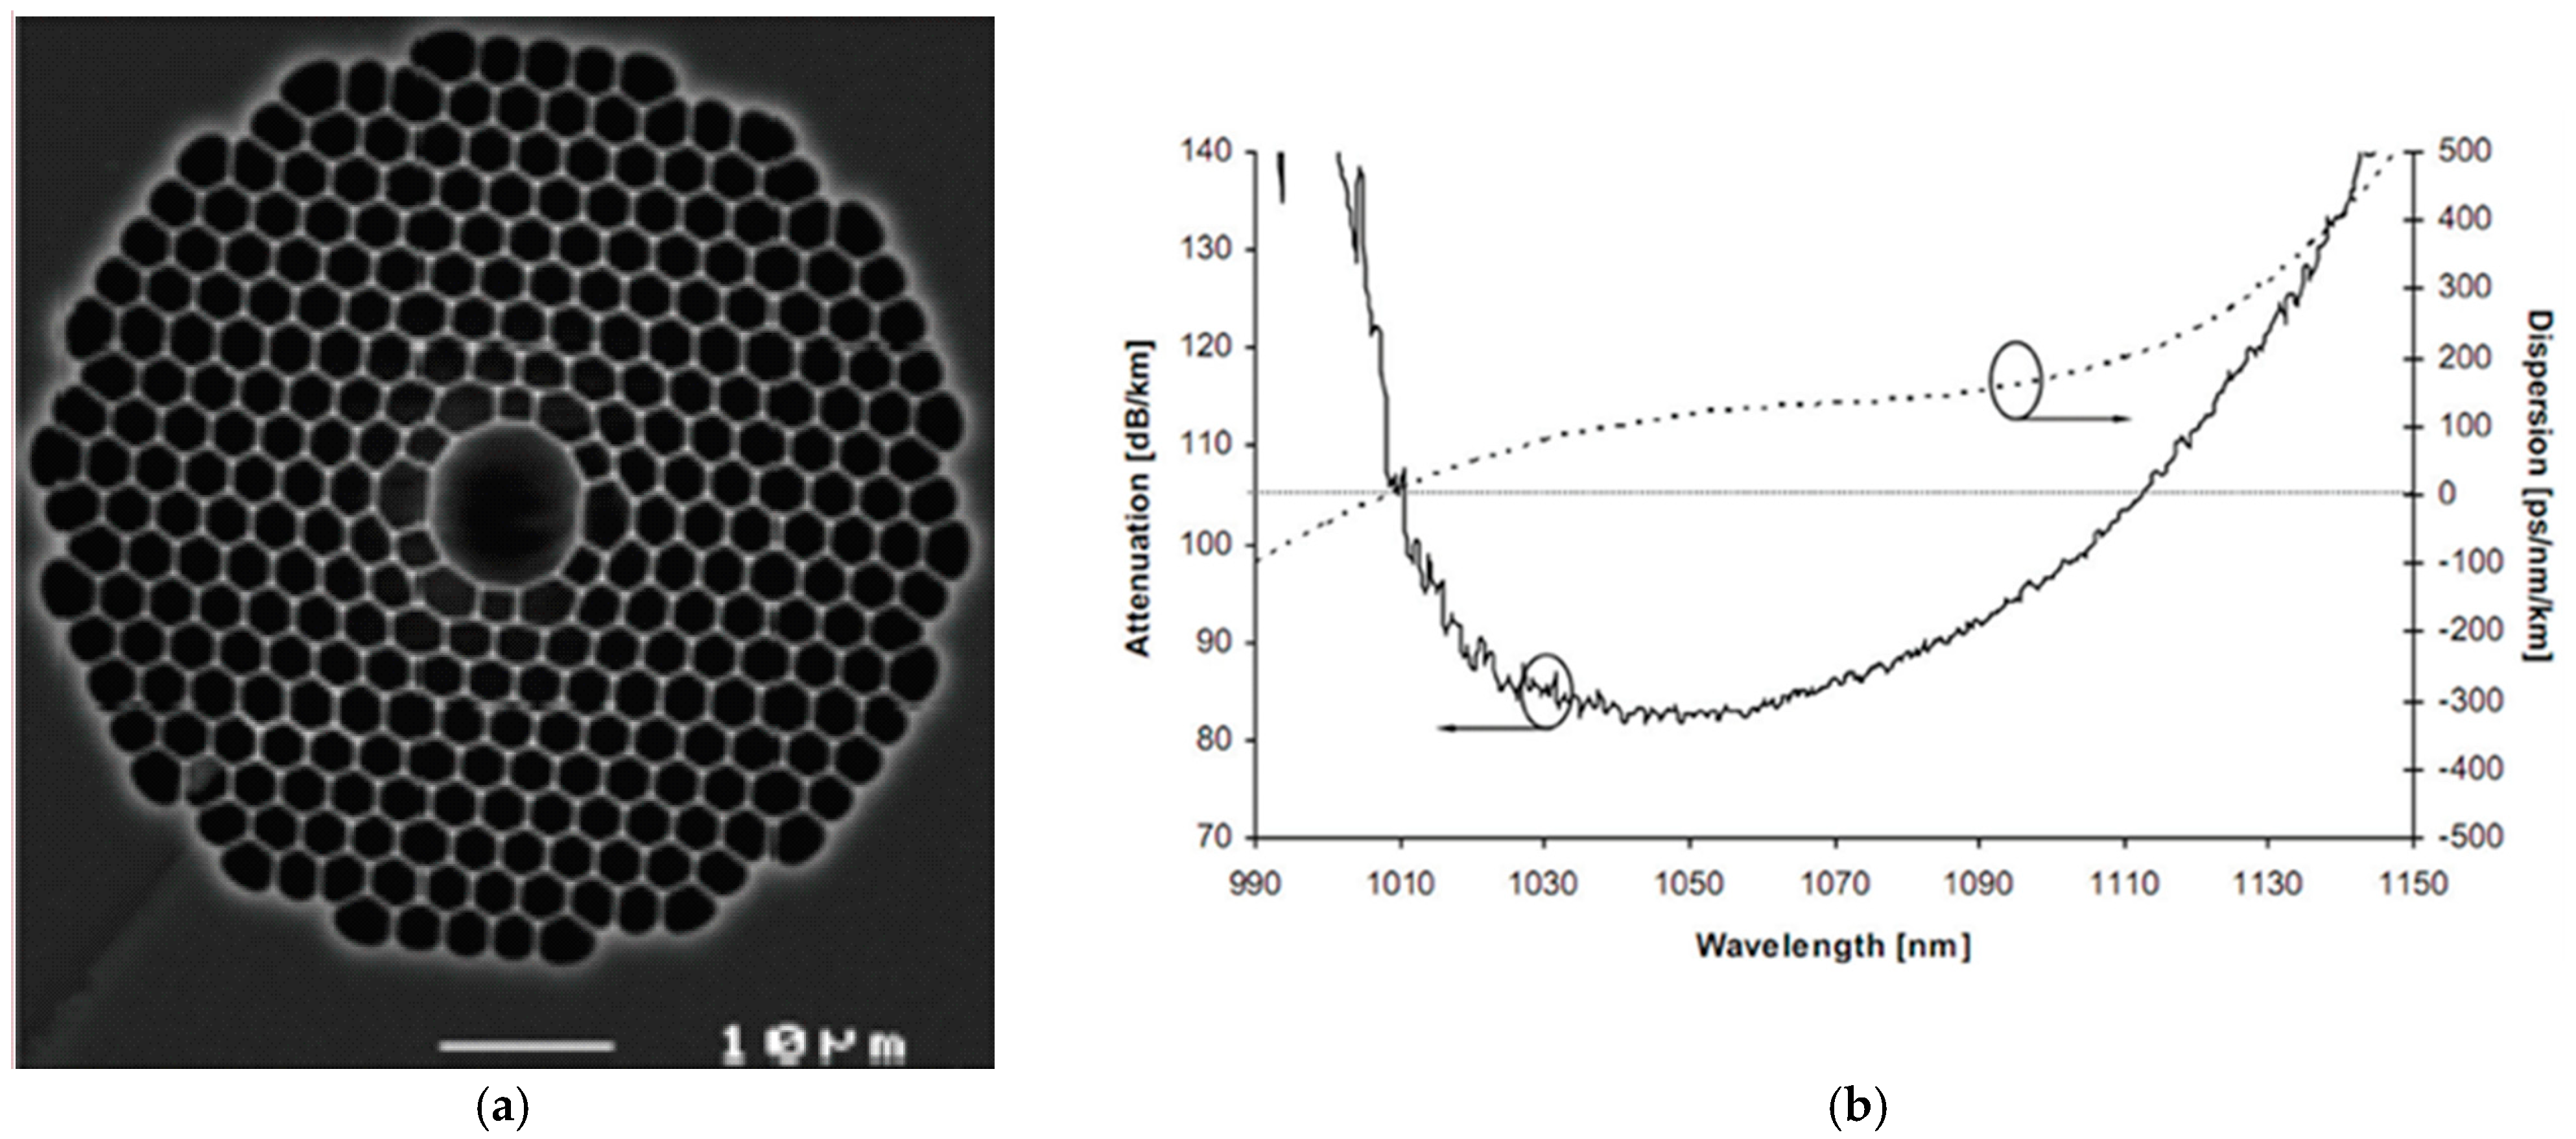
For the gas cavity, a 49 m long HC-PCF (NKT Photonics HC-1060-02, Rudersdal Municipality, Denmark) filled with 18 bar hydrogen is spliced to a solid-core fiber (Corning HI1060, Corning, NY, USA) as the pump injection end and the other end of the HC-PCF is spliced to another solid-core fiber (SM-GDF-10/125-15FA) as the output end. In our work, the end as the pump injection is spliced first and the other end of the HC-PCF is sealed into a specially designed gas chamber, which can keep the HC-PCF vacuumed and fill it with hydrogen. After standing for 10 h, the HC-PCF is taken out from the gas chamber and spliced with the solid-core fiber quickly. By calculating the amount of gas leakage in the fusion splicing process [16], the gas pressure in the all-fiber gas cavity is estimated to be 18 bar. Besides, the fusion loss of mode field mismatch can be reduced by using these different solid-core fibers, and the fusion losses of splice1 and splice2 is 1.56 dB and 0.45 dB, respectively. Figure 3a presents the cross-section of the HC-PCF under the electron microscope (the core diameter is 10 μm), and Figure 3b presents the transmission loss and dispersion curves (from the product manual provided by NKT Photonics). It can be seen that the losses at 1064 nm and 1135 nm are ~0.083 dB/m and ~0.012 dB/m, respectively.
3. Experimental Results and Discussion
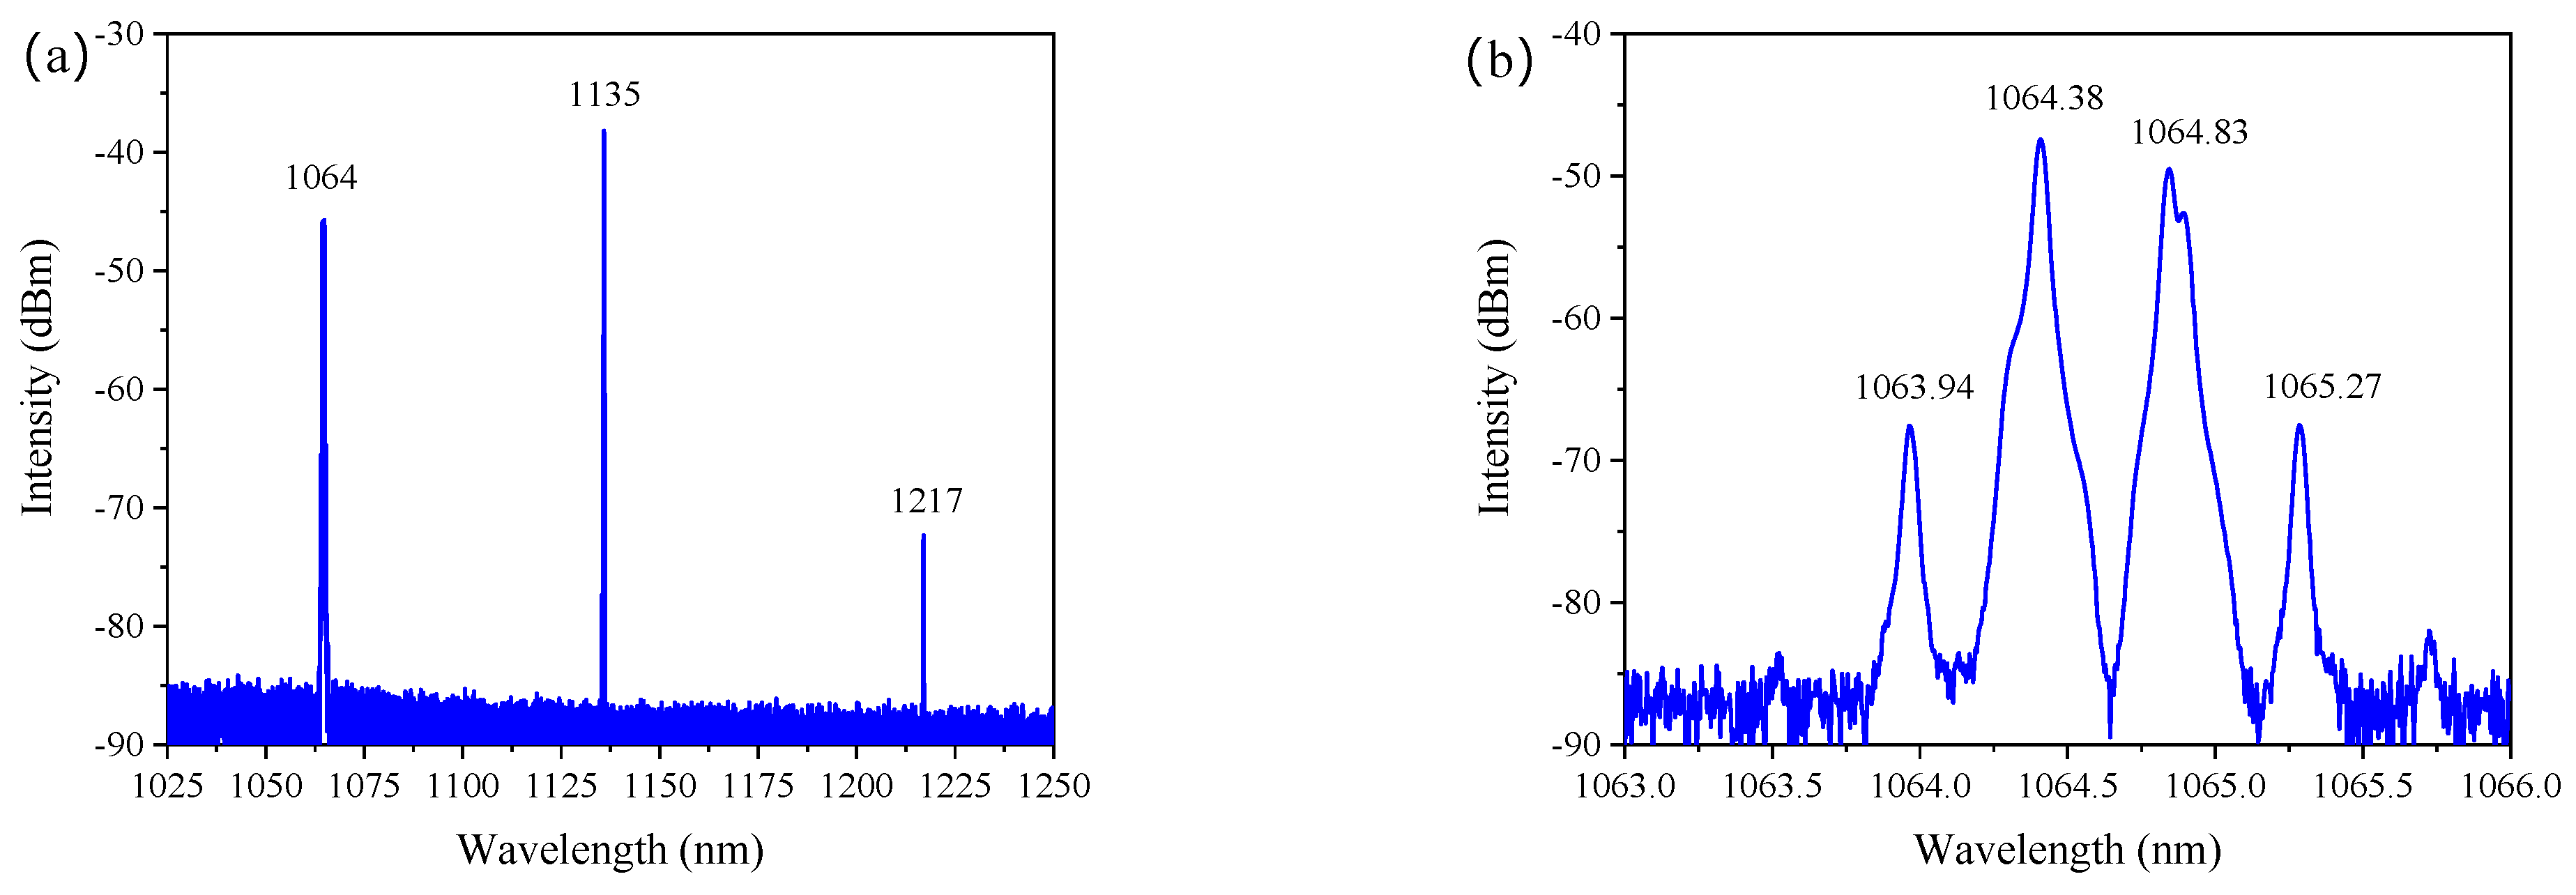
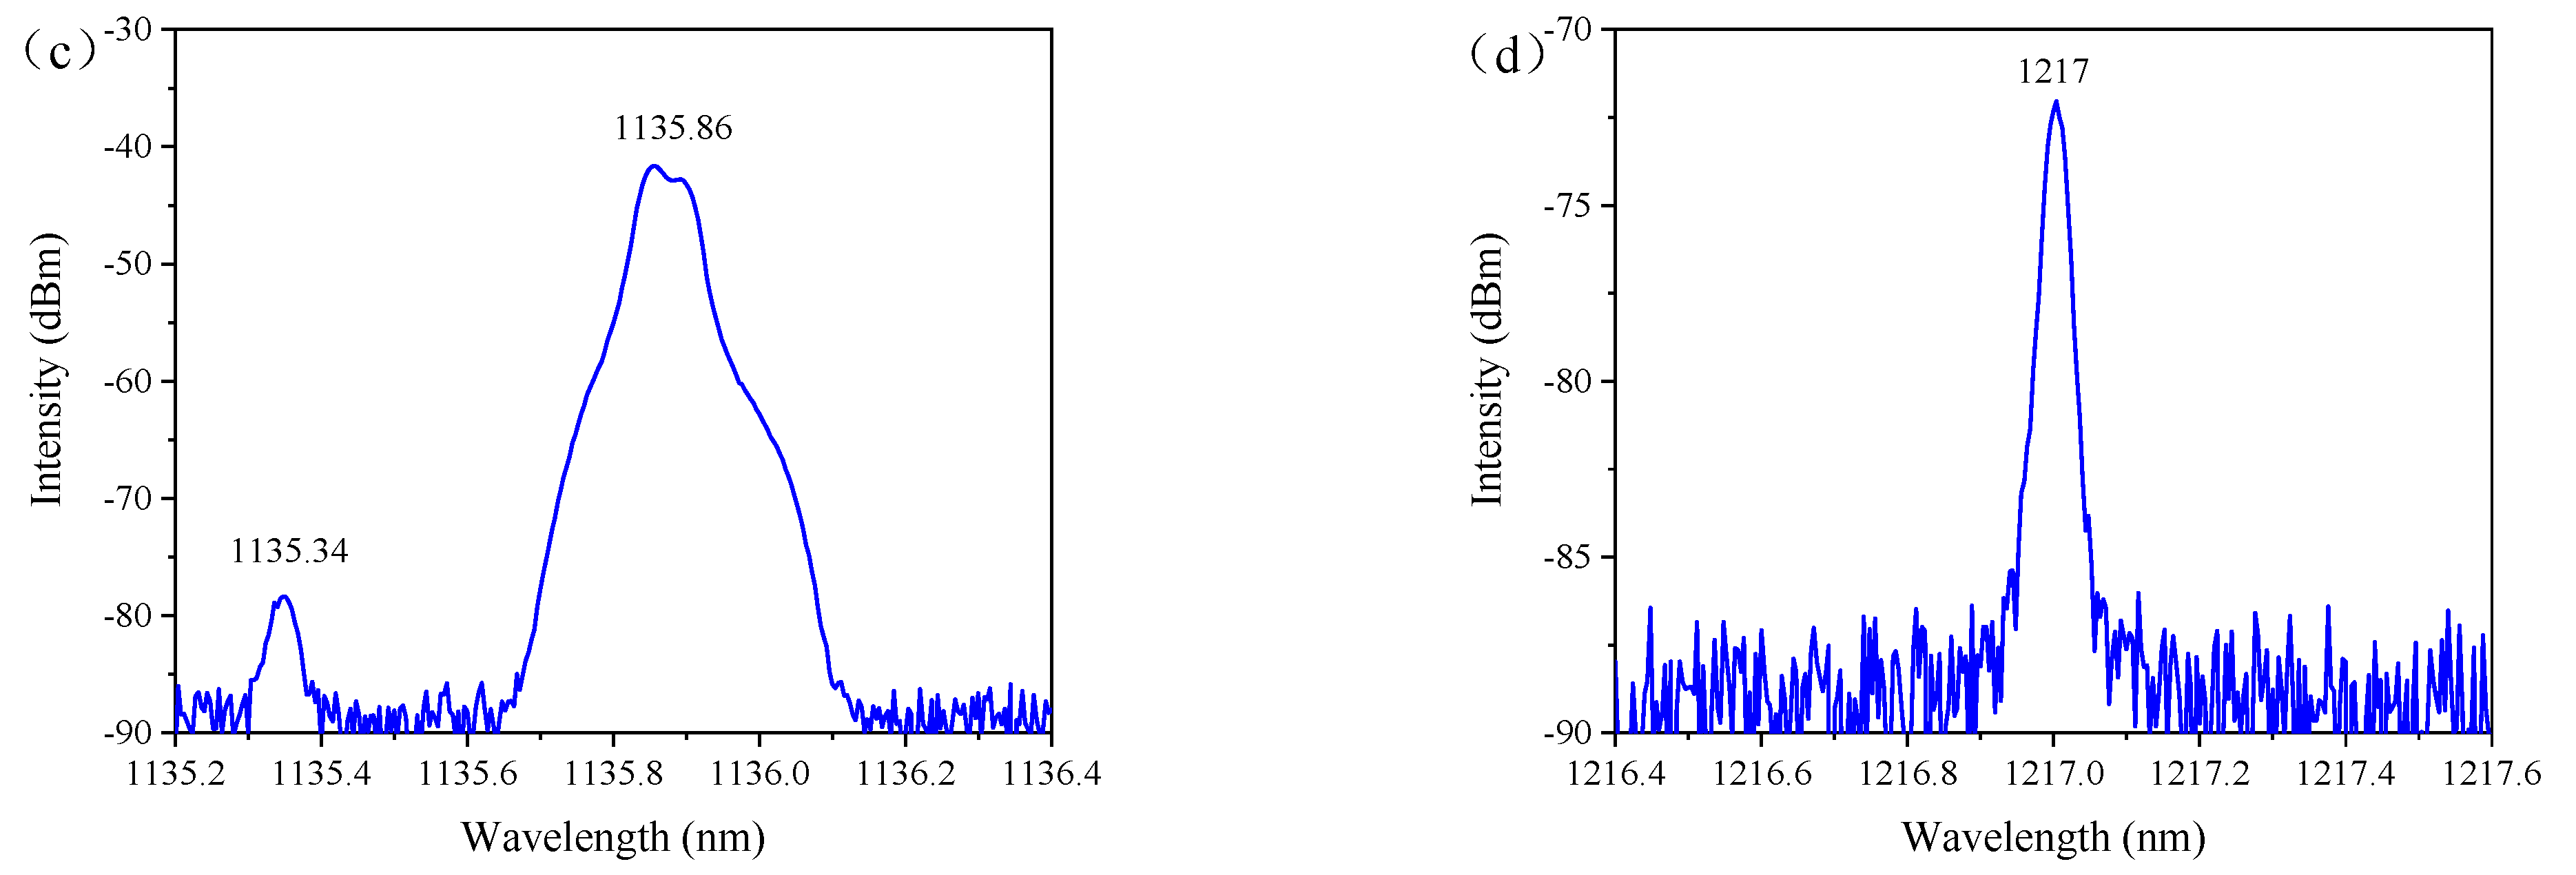
The output spectrum is measured when the pump source is at the maximum output power of 1.51 W, as shown in Figure 4a. The width of the pump pulse is 4 ns and the repetition frequency is 20 MHz. It can be seen that besides the pump line at 1064 nm, there are two lines in the spectrum. The line at 1135 nm is the first-order Raman line, and it is converted from 1064 nm pump line by the rotational SRS of hydrogen molecules in the gas cavity (the corresponding Raman frequency shift is 587 cm−1). The line at 1217 nm is the second-order Raman line converted from 1135 nm first-order Raman line with the same Raman frequency shift. Figure 4b–d presents the fine output spectrum of the residual pump laser, the first-order Stokes wave, and the second-order Stokes wave, respectively. The spectrum of the residual pump laser is similar to the output spectrum of the pump source in Figure 2b, but the intensity of some wavelengths has changed. The lines at 1064.38 nm and 1064.83 nm become weaker as they are strong enough to be converted into the first-order Stokes waves; it can be well verified from Figure 4c. There are two lines at 1135.32 nm and 1135.86 nm in the spectrum, which represent two different longitudinal modes. They are generated by the rotational SRS of hydrogen molecules pumped by the lasers at 1064.38 nm and 1064.83 nm, respectively. For the second-order Stokes wave at 1217 nm, there is only one Raman line in the spectrum as shown in Figure 4d. It is converted by the first-order Stokes wave of 1135.86 nm as it is strong enough.
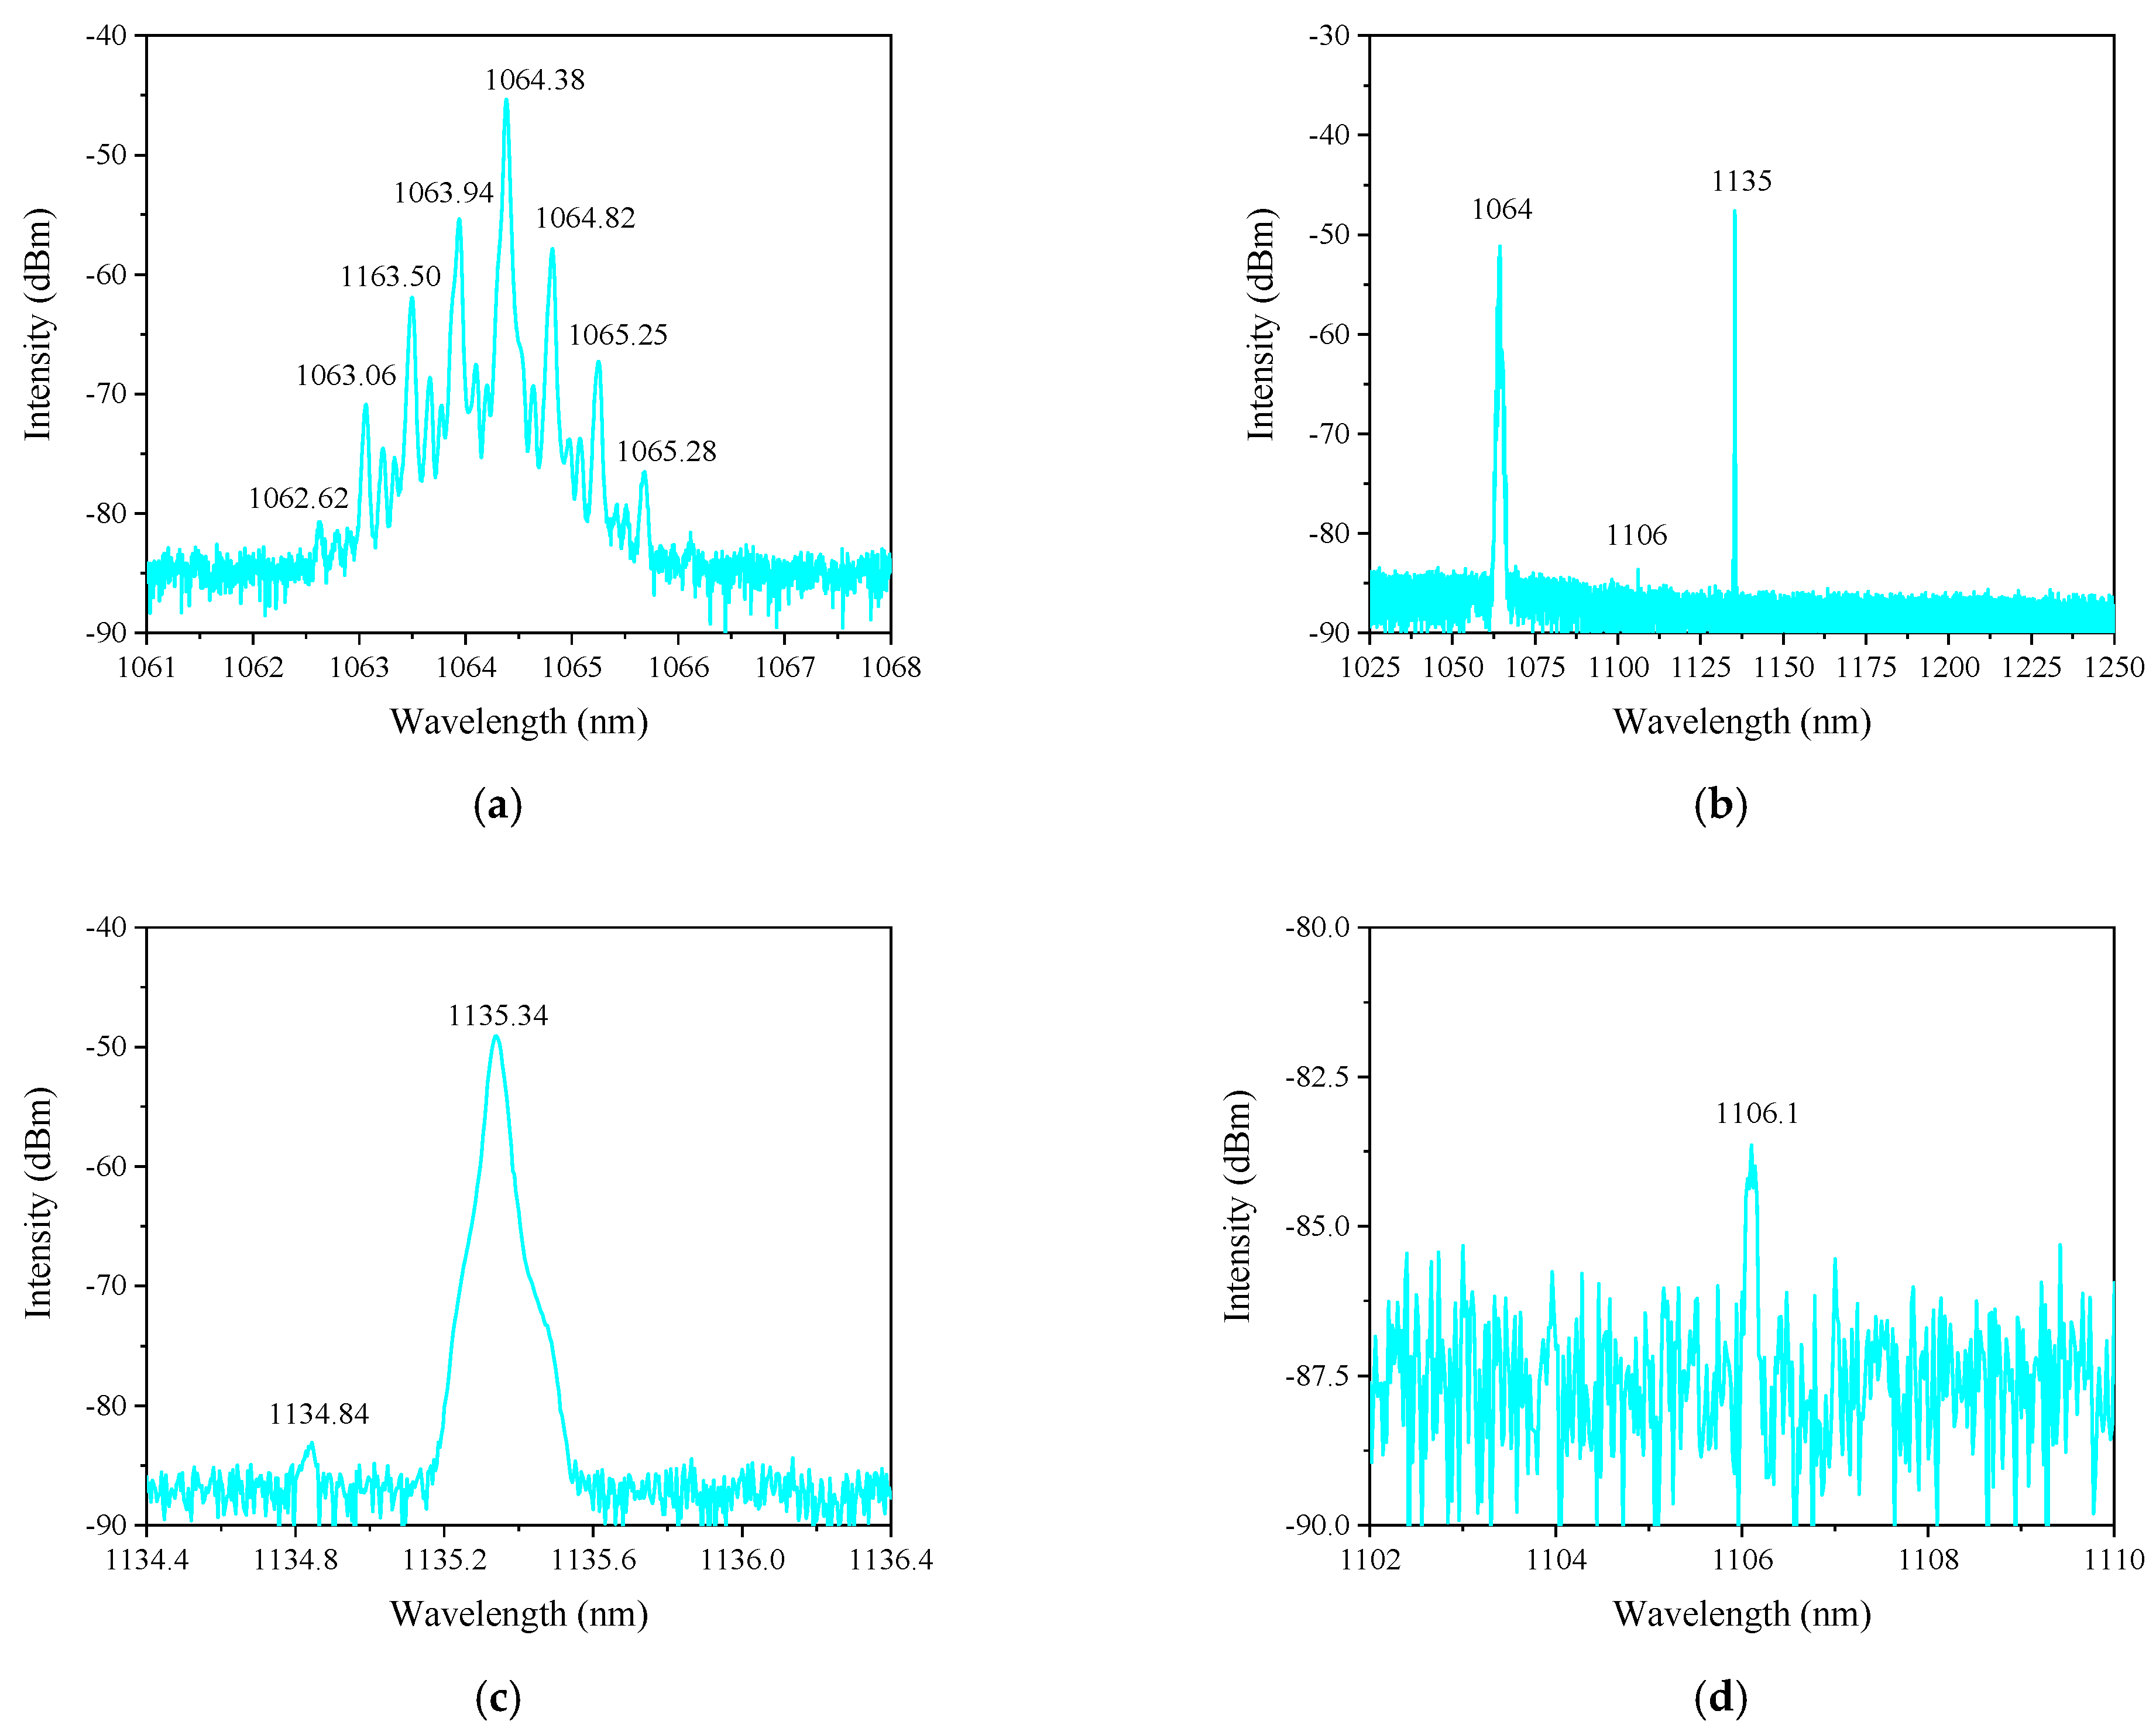
To explore the impact of the pulse width on the output characteristics of the all-fiber FGRL, we change the pump pulse width from 4 ns to 2 ns and keep the repetition frequency at 20 MHz. Figure 5a shows the output spectrum of the pump source with the maximum output power. It can be seen that there are many longitudinal modes. Figure 5b presents the output spectrum of the FGRL. There are mainly two lines in the output spectrum: a 1064 nm pump line and 1135 nm Raman line. Therefore, only the first-order Stokes wave is generated by the rotational SRS of hydrogen molecules, which is quite different from the case when the pump pulse width is 4 ns. There is a very weak line at 1106 nm that can only be detected by the highly sensitive OSA. It is also the first-order Stokes wave converted by the 1064 nm pump laser, and the corresponding Raman frequency shift is 354 cm−1. The corresponding Raman gain of 1106 nm is weaker than that in 1135 nm [19], so the pump laser is converted into a 1135 nm Stokes wave first, and only a few pump lasers are converted into 1106 nm Stokes waves. Figure 5c,d shows the fine spectrum of the first-order Stokes waves at 1135 nm and 1106 nm, respectively, which indicates that only the pump lasers at 1064.38 nm and 1063.94 nm are converted into the first-order Stokes waves (the Stokes wave at 1106.1 nm is converted by the pump laser at 1064.38 nm). Due to the accuracy of spectrometer, the linewidth of these lasers cannot be measured accurately, and some Stokes waves are too weak to be measured. Compared with the pump source with the pulse width of 4 ns, there are more longitudinal modes in the pump source when the pulse width is 2 ns, which may lead to the dispersion of power and the Raman conversion is not as sufficient as the case with the pulse width of 4 ns when the pump power is the same. The absence of the second-order Stokes wave indicates that the first-order Stokes wave is not strong, which also means the conversion is not sufficient.
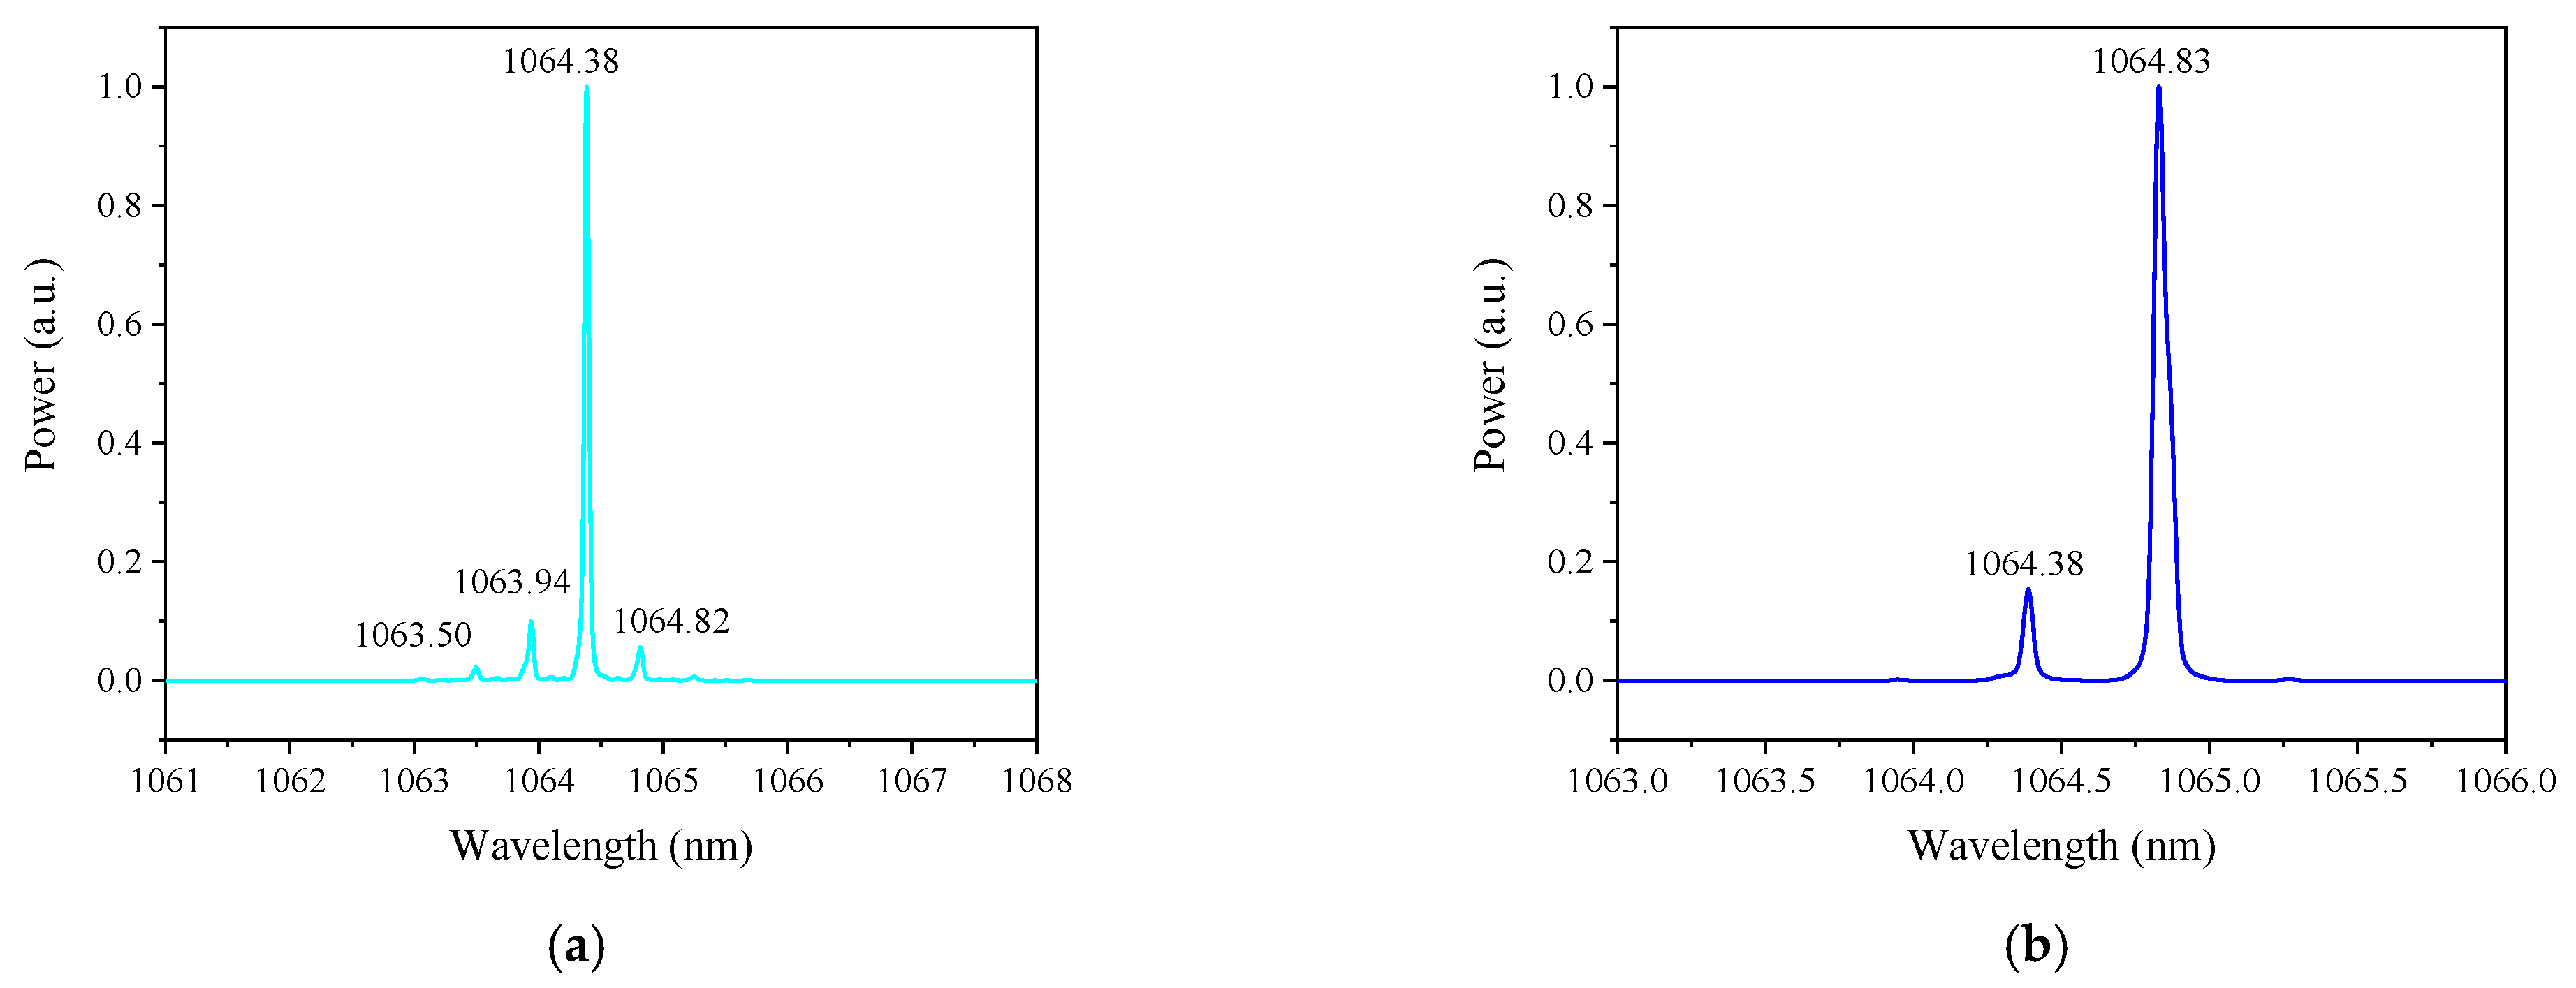
To display more clearly the power components of longitudinal modes, the spectral intensity in Figure 2b and Figure 5a is represented by a linear scale, as shown in Figure 6a,b. It can be seen that although the output spectrum contains many longitudinal modes when the pump pulse width is 2 ns, the power spectrum mainly contains four components with different wavelengths. The pump lines at 1064.38 nm and 1063.94 nm take up the dominant position with the ratio of 77.85% of the total output power. The power spectrum in Figure 6b indicates that when the pulse is 4 ns, the output power has only two main pump lines, and both can be converted into Stokes waves. By calculation, the lines at 1064.83 nm and 1064.38 nm account for 90.03% of the total output power, which is much higher than the case with the pulse width of 2 ns. Therefore, when the pump source is in the same output power and the pulse width is 4 ns, there are more pump lines with higher power participate in Raman conversion. This also explains why the second-order Stokes wave is not generated with the same pump power when the pump pulse is 2 ns.
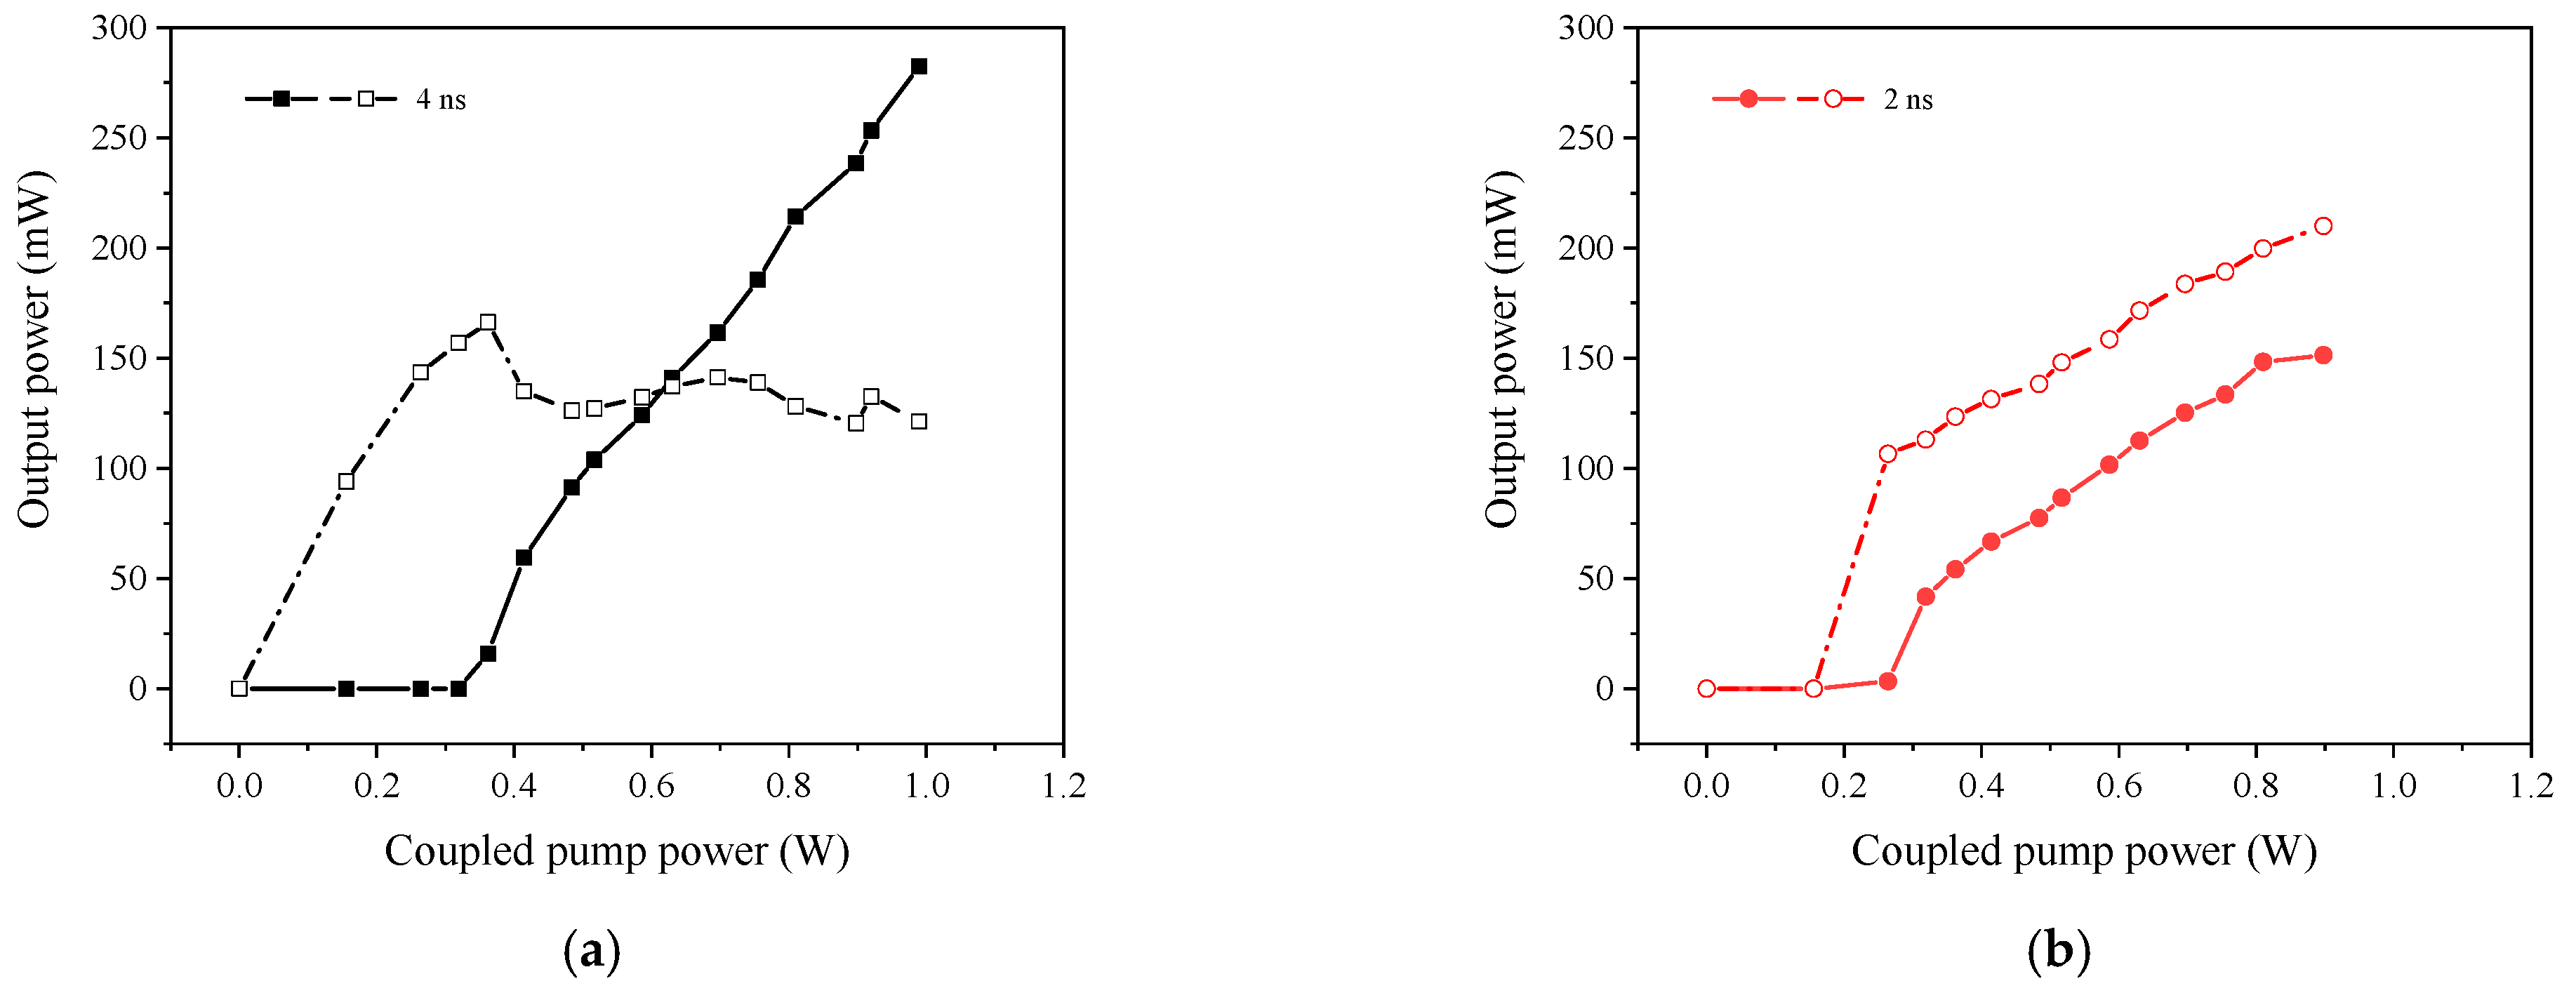
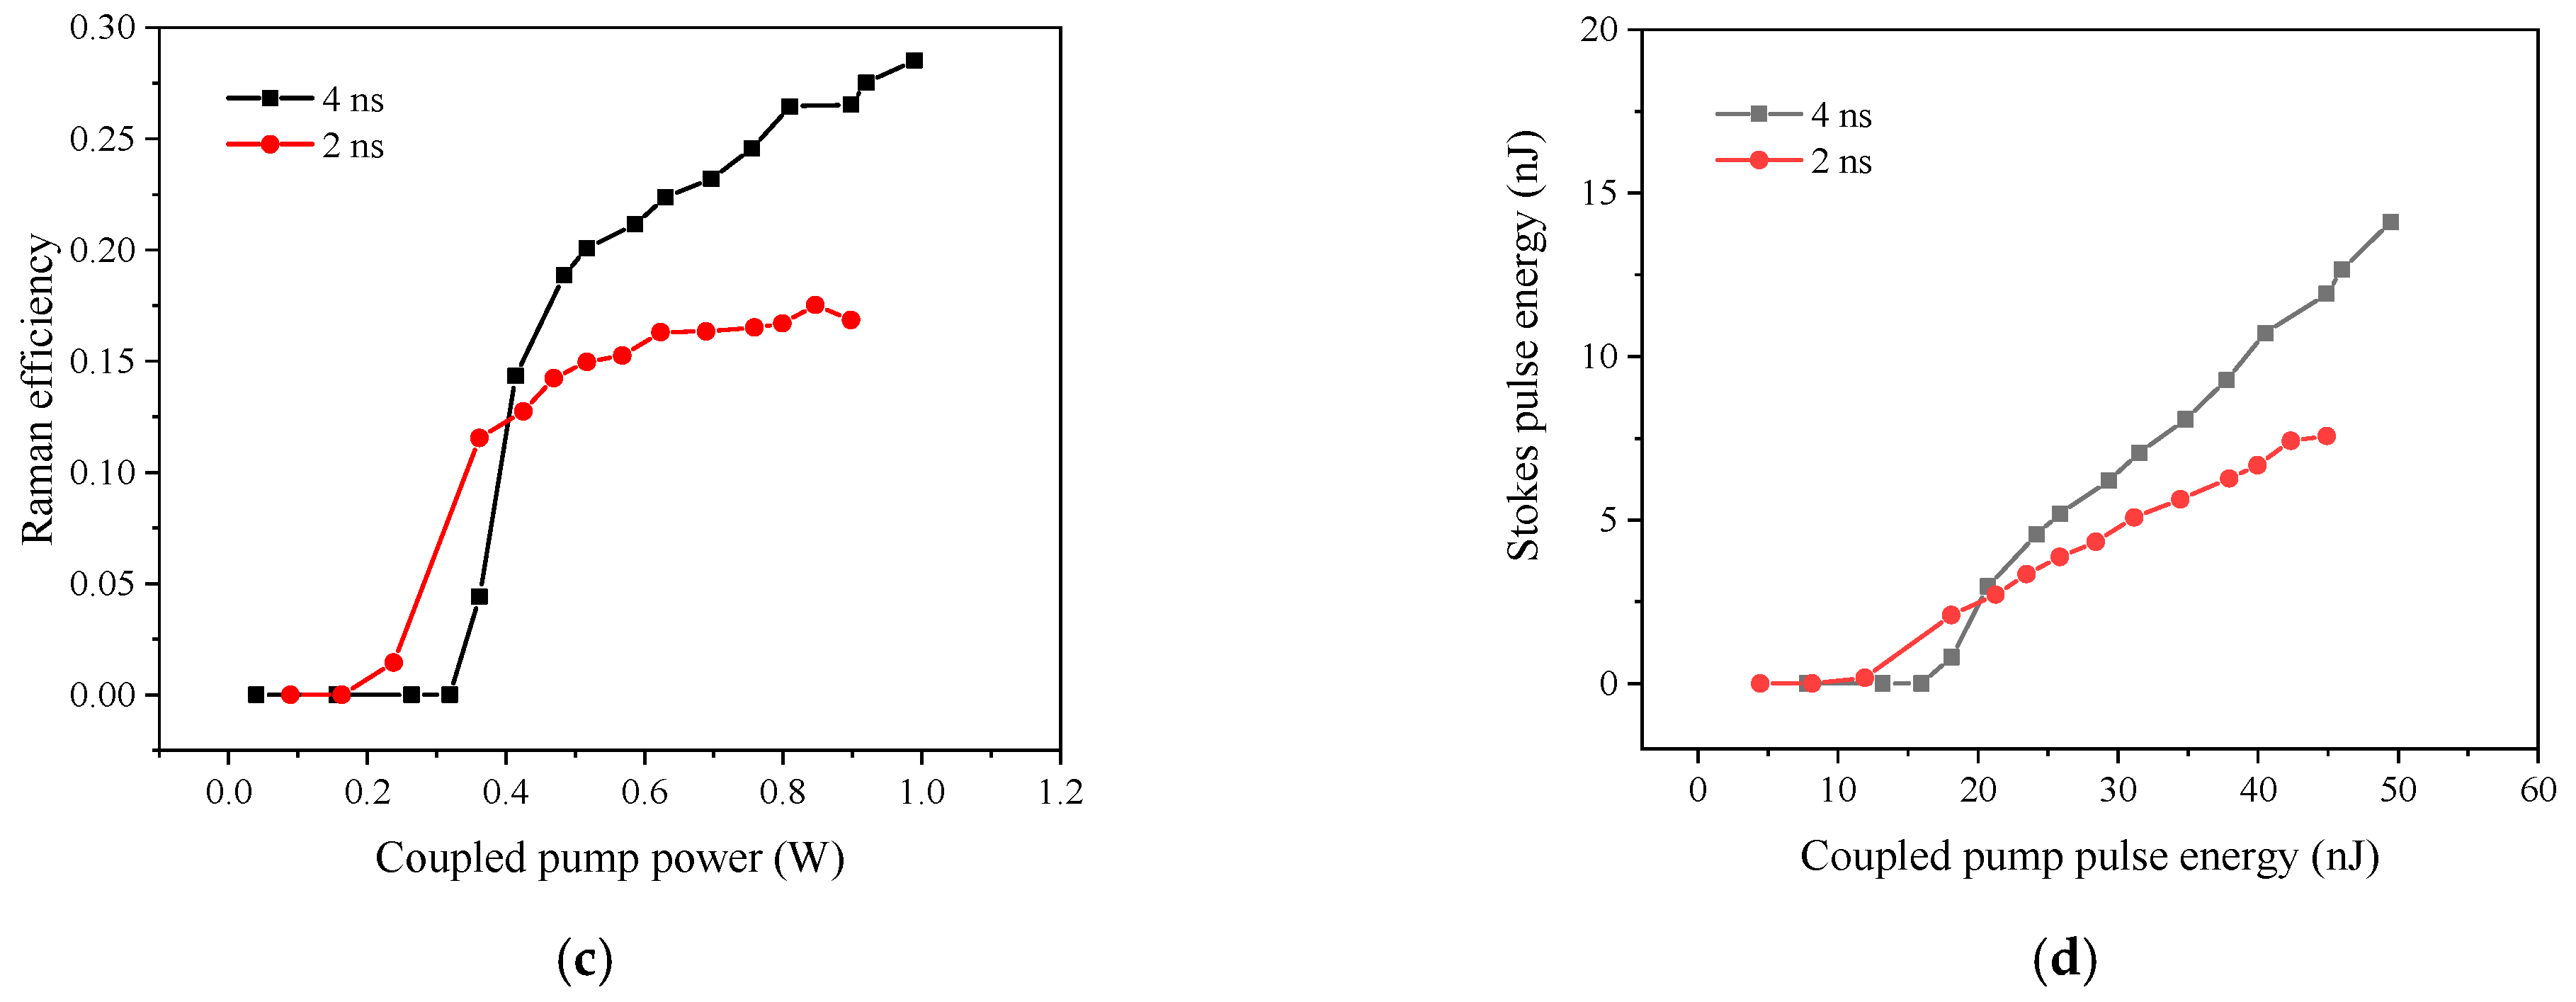
The output power characteristics of the FGRL with different pulse width of pump laser are measured, as shown in Figure 7a–c. The solid and hollow patterns in Figure 7a,b represent the Raman power and residual pump power, respectively. Moreover, the coupled pump power is the actual power that transmitted into the gas cavity after the Splice 1. It can be seen that with the increase in the coupled pump power, the Raman power with the pulse width of 2 ns is detected first. This is because the pump pulse with width 2 ns is narrower, which means the corresponding peak power is higher than the pulse with the width of 4 ns when the pump power is the same and exceed the Raman threshold earlier. Both the Raman powers with different pulse widths increase linearly. The residual pump power with the pulse width of 4 ns drops when the coupled pump power exceeds the Raman threshold, while it keeps increasing when the pulse is 2 ns. It indicates the Raman conversion is not sufficient when the pulse width is 2 ns in the case. The corresponding Raman efficiency (the ratio of coupled pump power to Raman power in the gas cavity) is calculated, as shown in Figure 7c. The maximum Raman efficiency 28.5% is obtained with the maximum coupled pump power and the pulse width is 4 ns. Besides, the Stokes pulse energy and the coupled pulse energy are explored in the Figure 7d. It can be seen that the Stokes energy with the pulse width of 4 ns is higher in general.
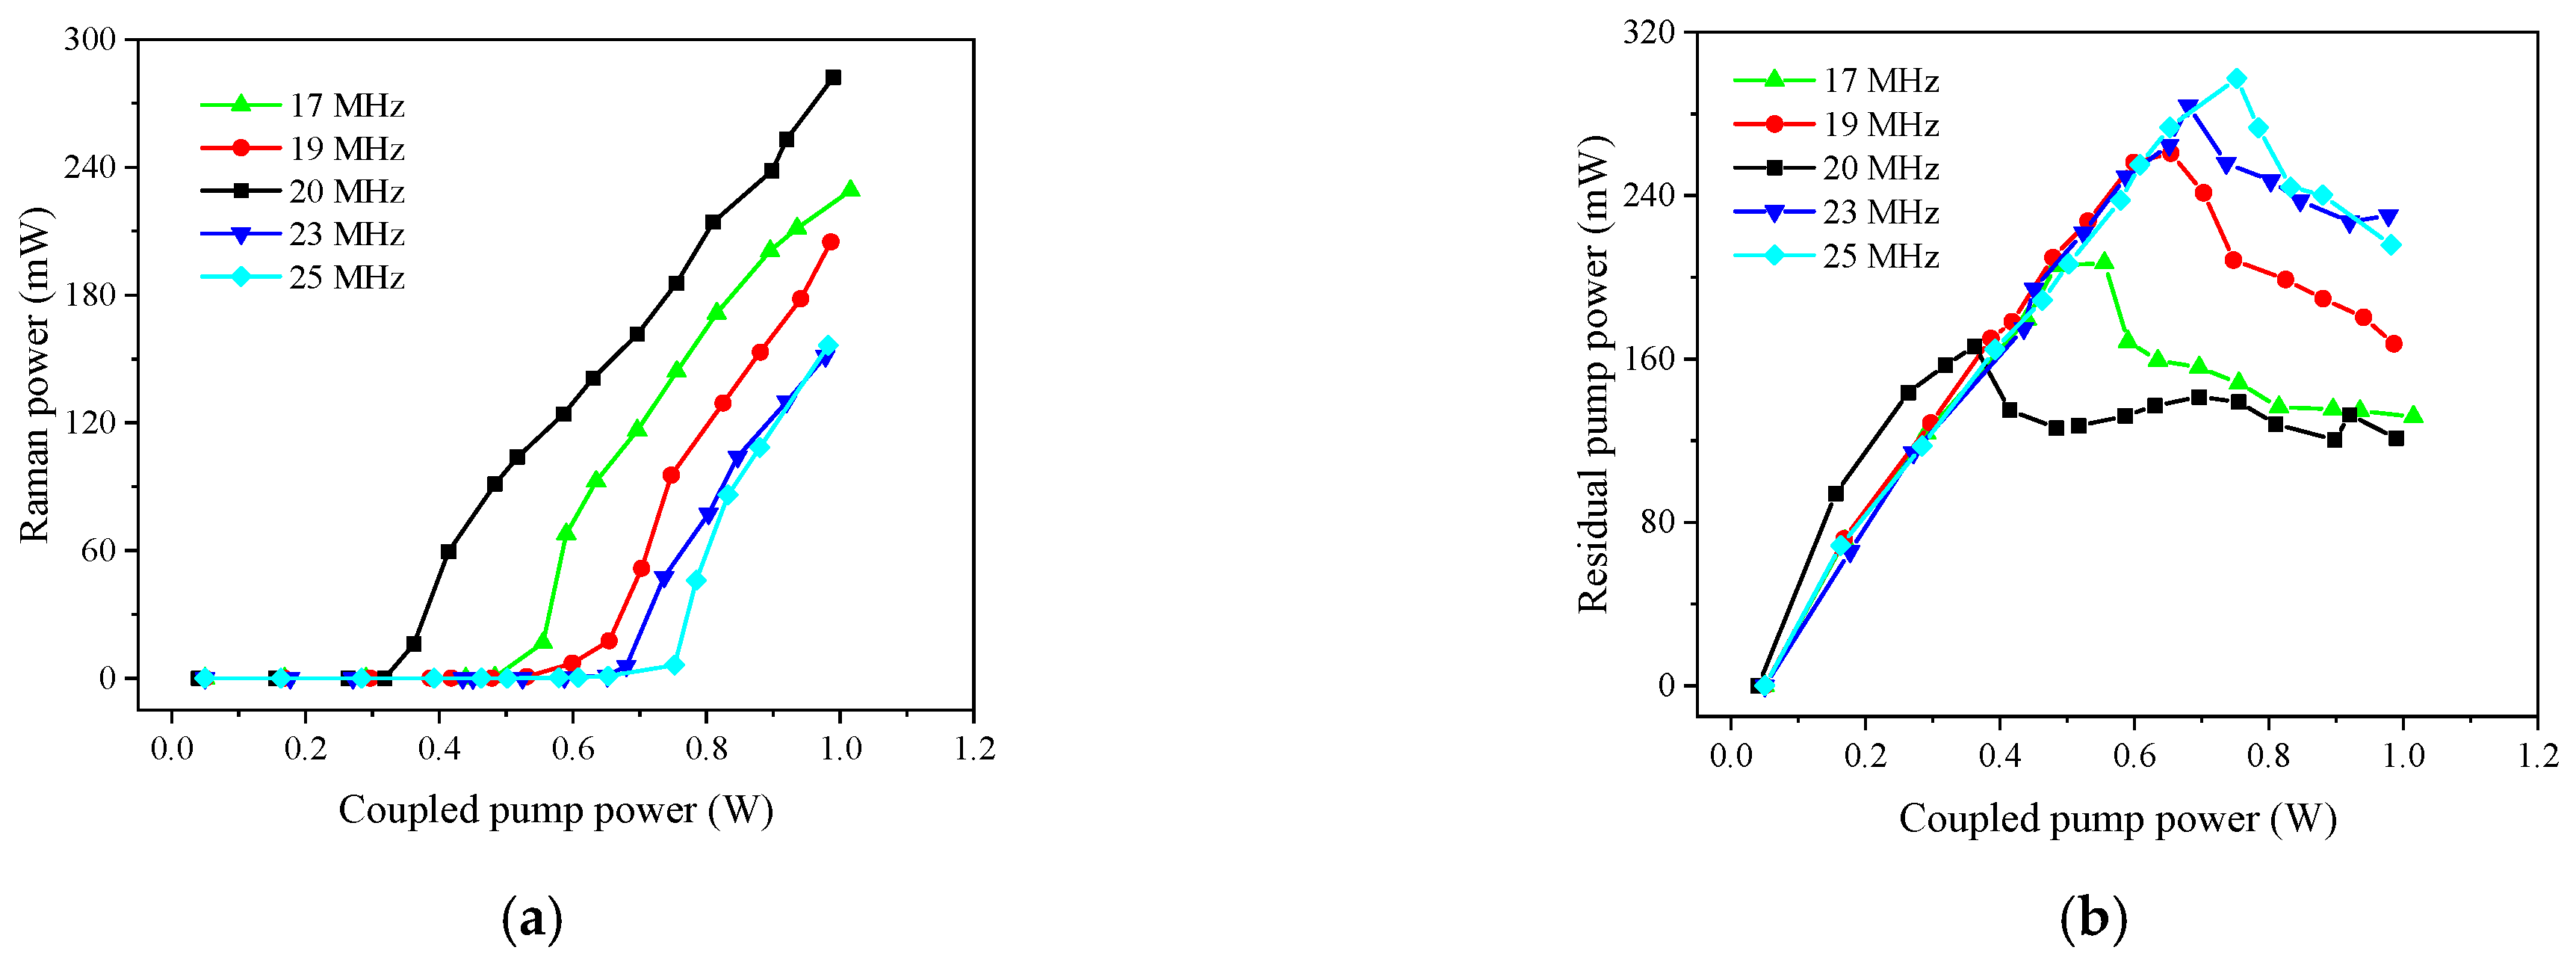
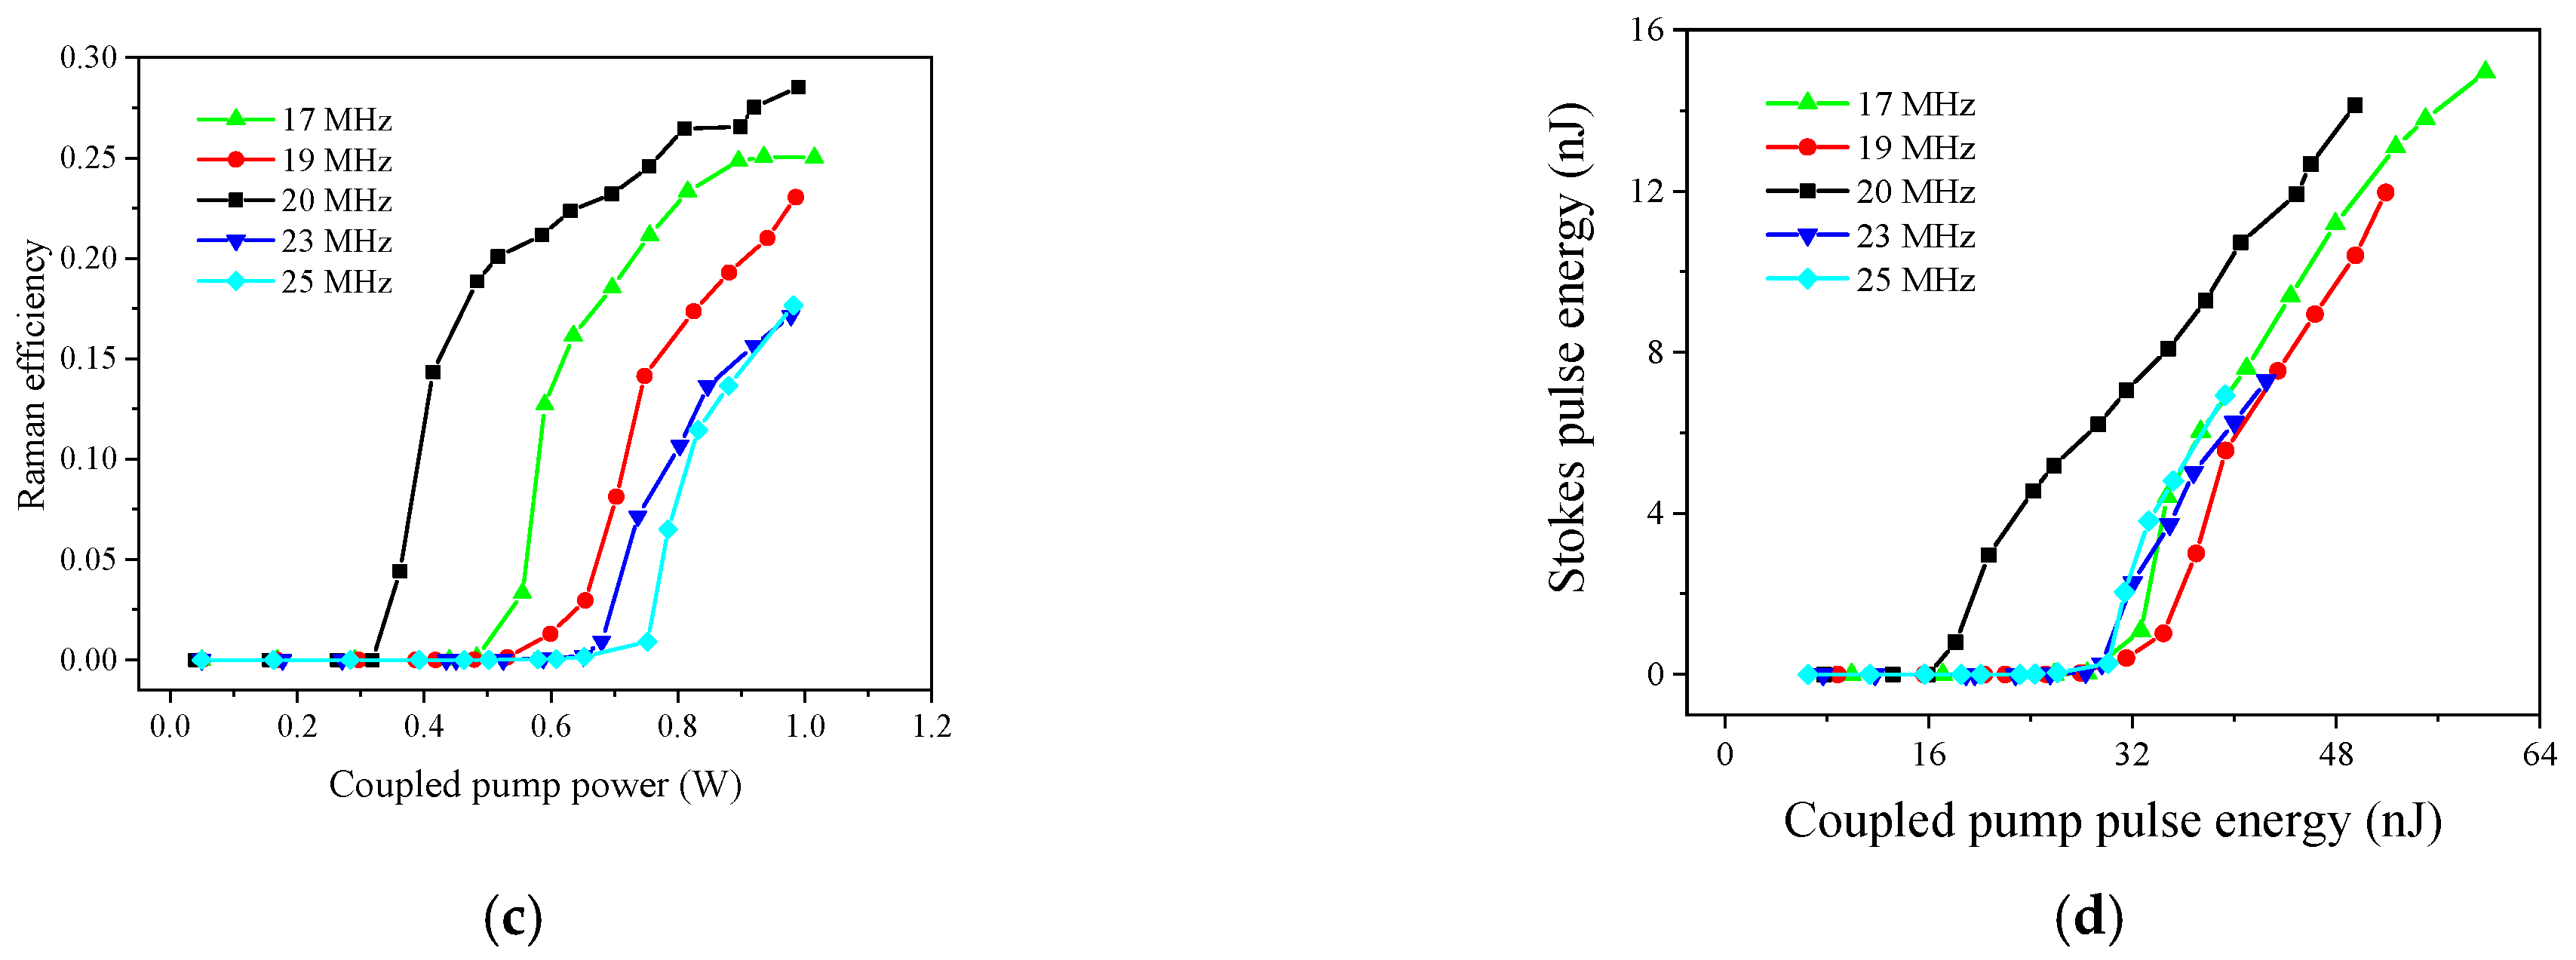
Furthermore, we measured the output power characteristics of the FGRL with different repetition frequencies and the same pulse width of 4 ns. Except for the repetition frequencies, the characteristics of the pump pulse like duration and spectral content are the same. Figure 8a,b presents the evolution of Raman power, residual pump power, and Raman efficiency with the increase of coupled pump power, respectively. It can be seen from Figure 8a,b that the curves with different repetition frequencies show similar trends. All the Raman powers increase linearly, while all the residual powers increase at first and then drop when the coupled pump power exceed the Raman threshold. Obviously, the optimal repetition frequency is 20 MHz with the lowest Raman threshold and the highest Raman power among the five repetition frequencies. When the repetition frequency is less than 20 MHz, the peak powers of the pump pulse and Raman pulse will become higher, which is conducive to the conversion of the second-order Raman laser. When it is higher than 20 MHz, less energy of pump pulses that exceed the first-order Raman threshold are converted into Raman pulses. Both situations will reduce the first-order Raman conversion efficiency. Figure 8c depicts the Raman efficiencies with different repetition frequencies. The maximum Raman efficiency is 28.5% in 20 MHz as mentioned earlier, which is more efficient than the previous work [14]. The corresponding Raman power is 289 mW, which is the maximum output Raman power. Compared with the previous work [14], the output power is increased by an order of magnitude. The pulse energy of Stokes pulse and coupled pump pulse is explored as shown in Figure 8d. It can be seen when the repetition frequency is 20 MHz, the Stokes pulse has the highest energy.
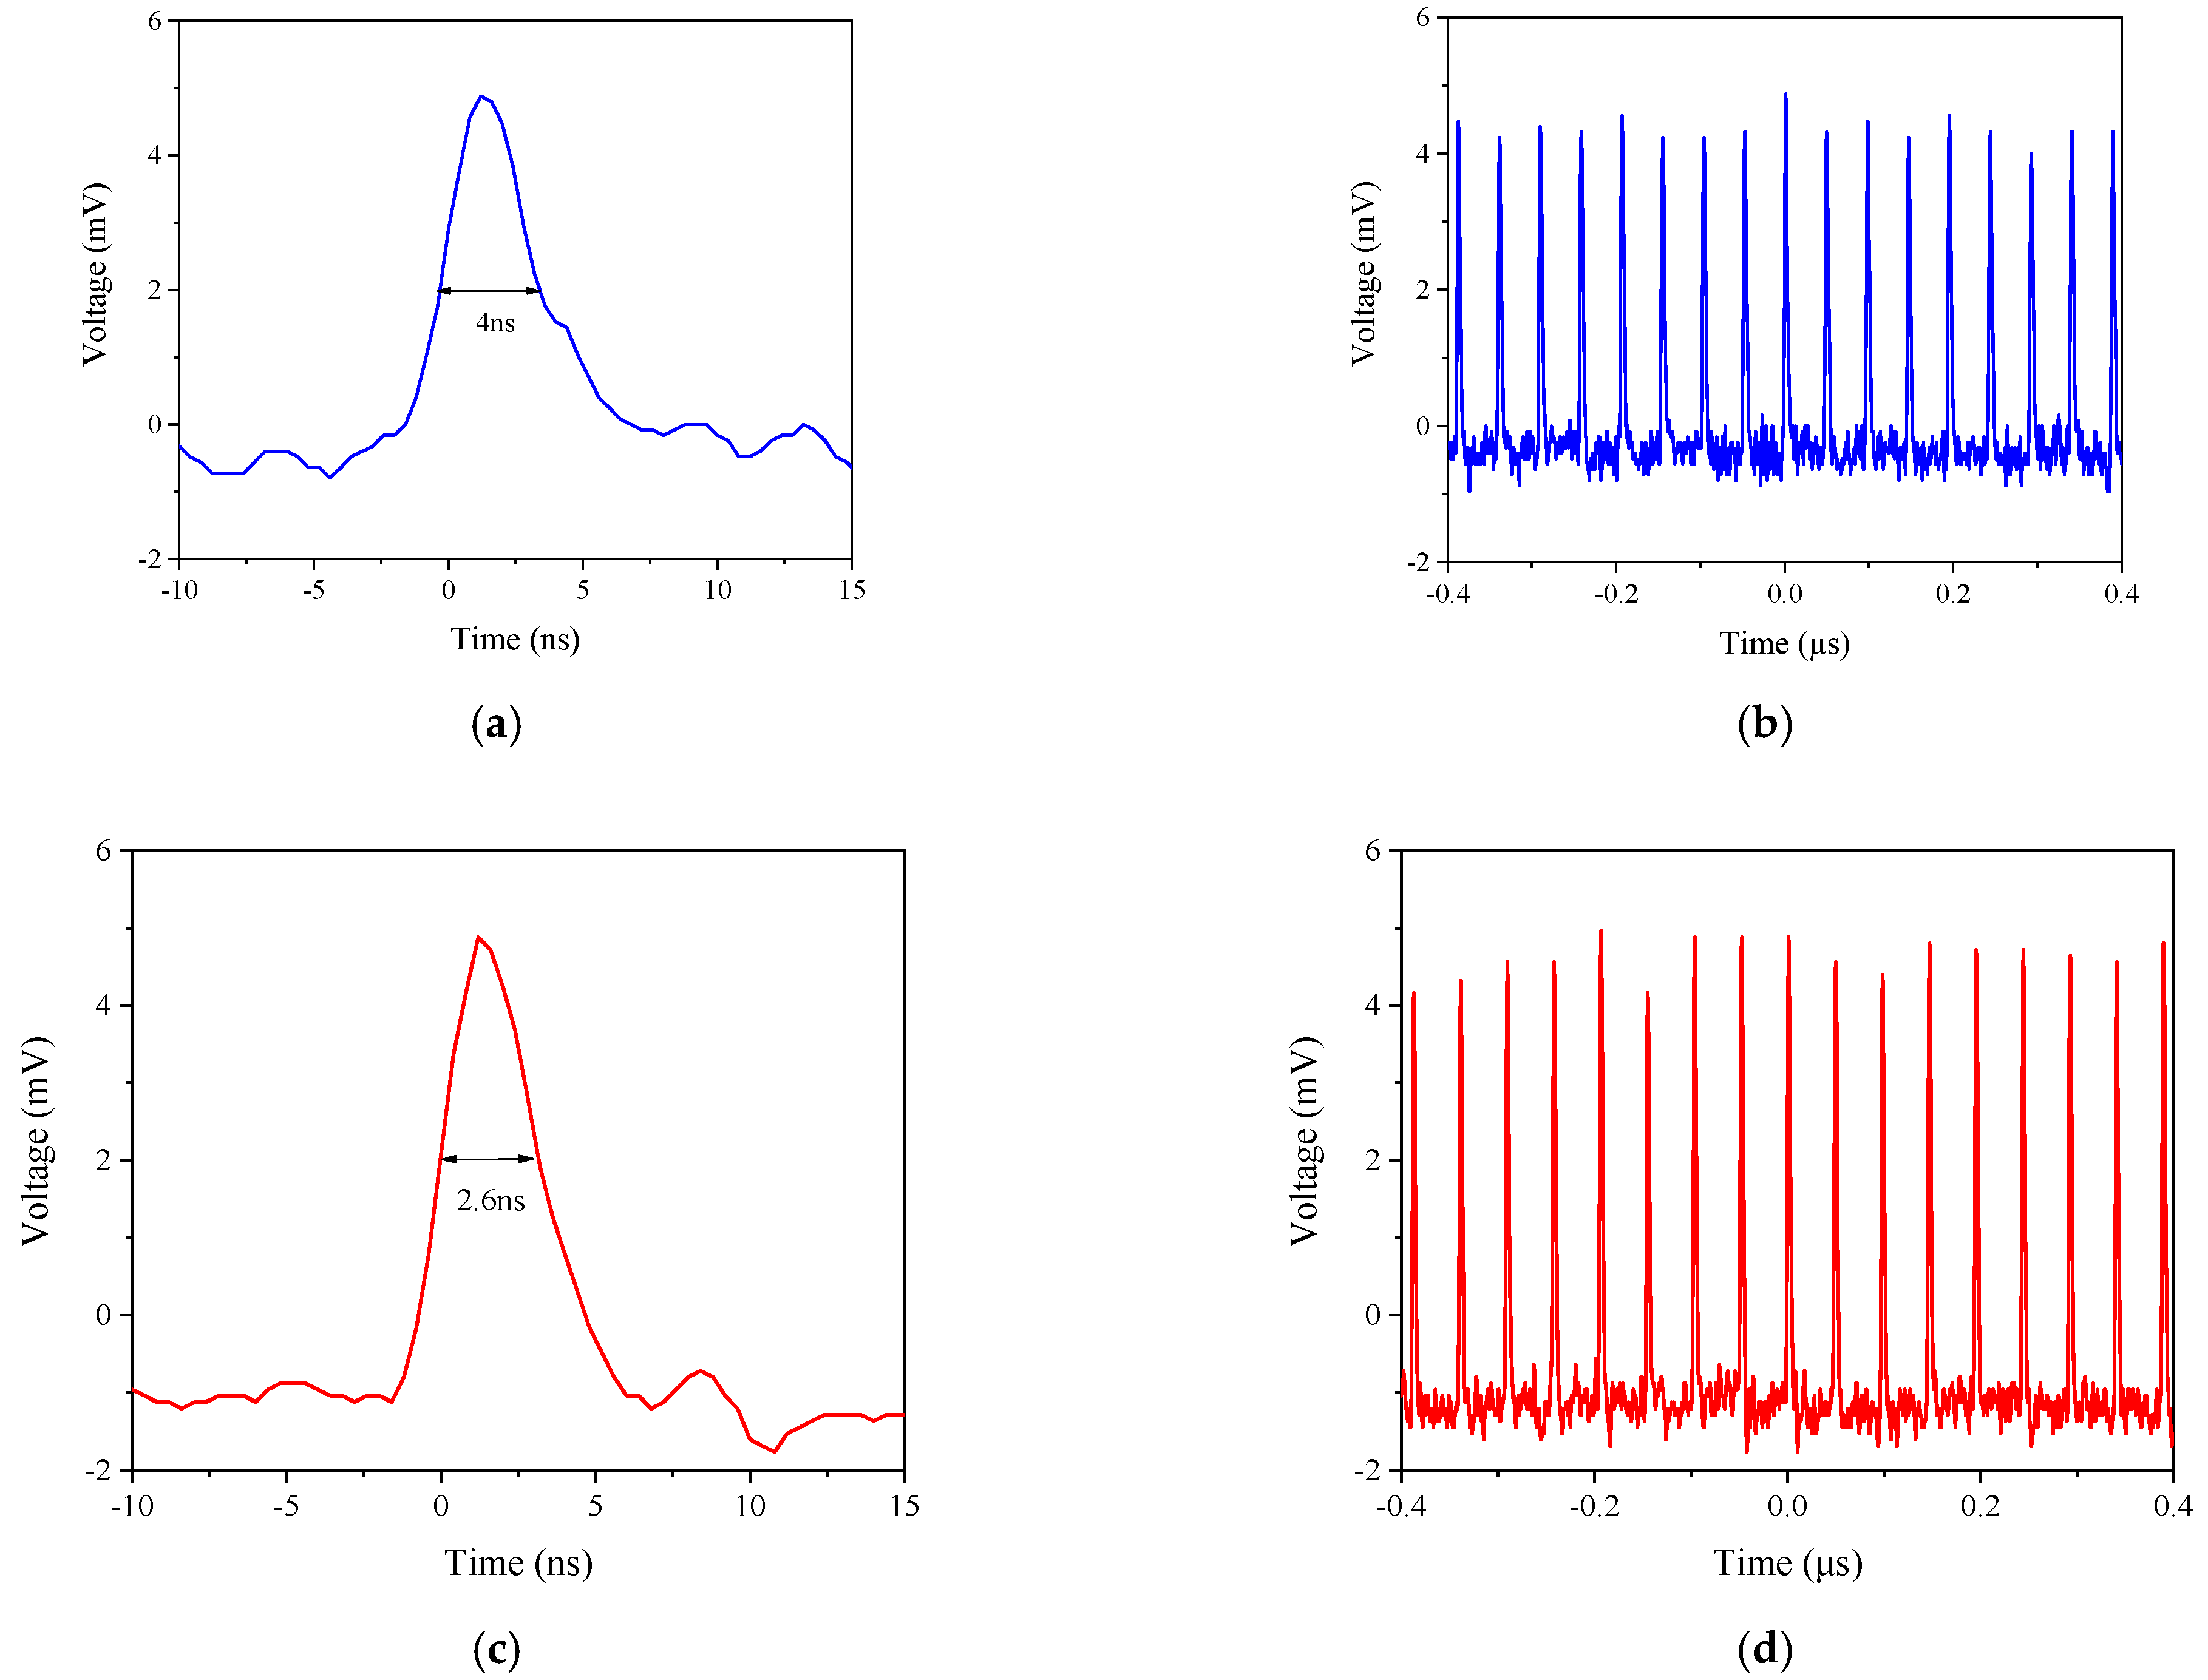
Figure 9a–d presents the shapes and the series of the pump pulses and the Stokes pulses when the pump power is maximum and the repetition is 20 MHz. It can be seen that the frequency of the Stokes pulses is 20 MHz, which is the same as the pump pulses. The pulse widths are measured, as shown in Figure 9a,c. It can be seen that the width of the Stokes pulse is narrower than that of pump pulse. This is not unexpected, because only the center part of the pump pulse that is higher than Raman threshold can be converted into the Stokes pulses.
For the single FGRL in our work, the process of the rotational SRS that generates the first-order and the second-order Stokes waves obey the rules as follows [15]:
where the subscripts of , , and represent the pump wave, the first-order Stokes wave, and the second-order Stokes wave, respectively; is the coordinate of the HC-PCF length; is the wavelength; is the steady-state Raman gain coefficient; is the intensity; and is the fiber loss. The boundary conditions can be given [11]:
where is the peak power of the coupled pump pulse in the HC-PCFs; is the mode field area of the HC-PCFs; is the Planck constant; is the light speed ; is the Raman linewidth. A simple steady-state theoretical model can be established by the formulas above.
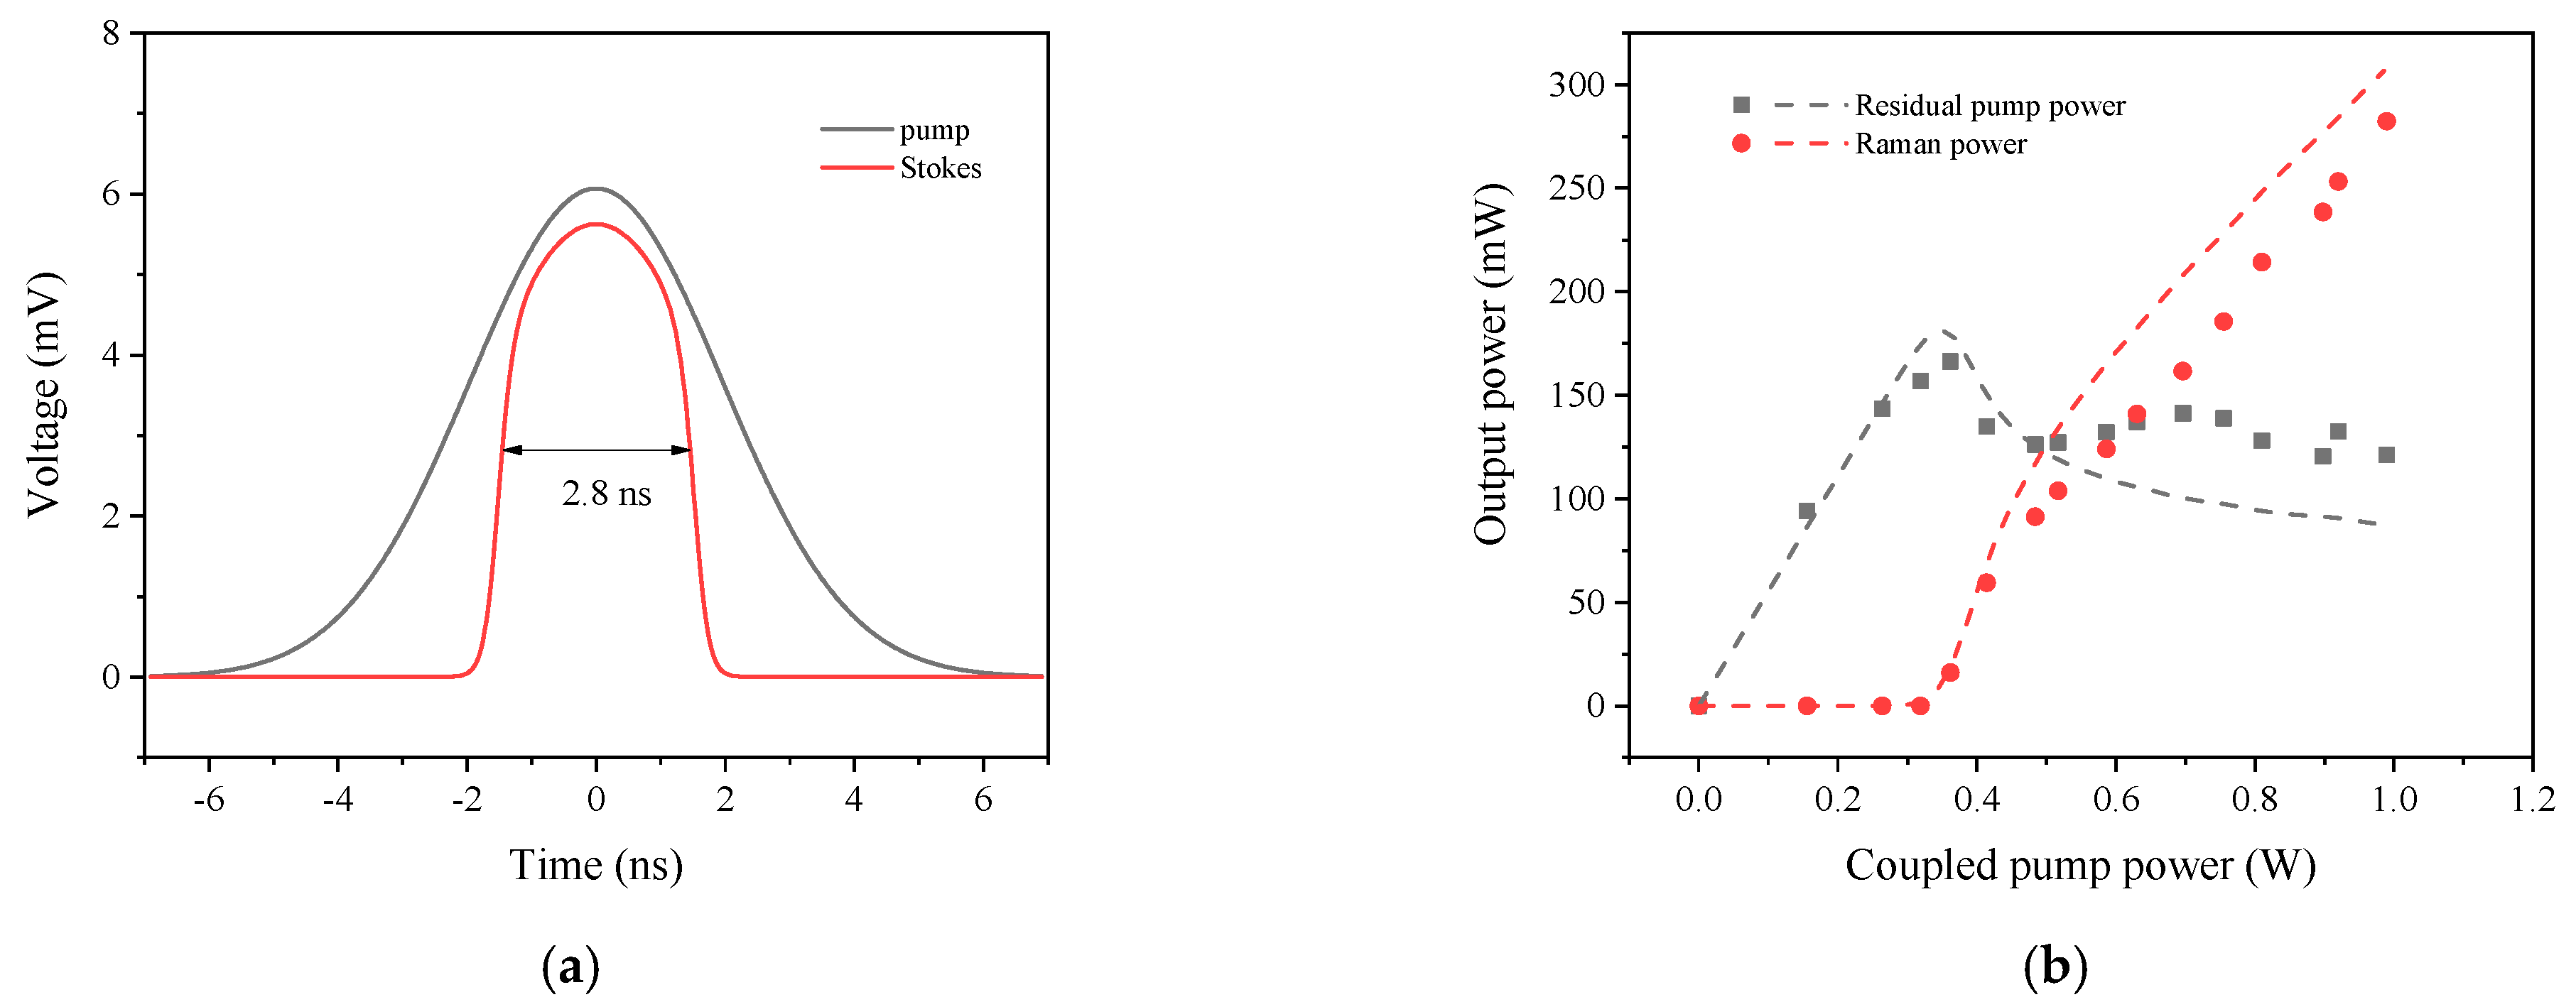
In our work, Figure 10a presents the simulation result of the pump pulse shape and the first-order Stokes pulse shape based on the theoretical model. Here is 3.1 GHz [20]. And is 0.35 cm/GW and is 0.18 cm/GW, which is estimated and adjusted slightly from in [10,11,18]. The mode field diameter of the HC-PCF is 7.5 μm and is 14.06π μm2. The pump pulse width is 4 ns and the repetition frequency is 20 MHz. It can be seen the Stokes pulse width is ~2.8 ns, which is in good agreement with the experimental results. Figure 10b shows the simulation results of the output power characteristics in the same case. For better comparison, the experimental results are plotted with solid patterns, while the simulation results are plotted with dotted lines. We can find that both the results show the similar trend and with the increase of the coupled pump power, the experimental results are in good agreement with the simulation results at first, then there is a deviation between them. We speculated that the homemade pulsed YDFA may has some continuous wave components which are useless in the Raman conversion and its power increases with the increase of coupled pump power. We hypothesize that by optimizing the performance of the amplifier, we can achieve better agreement between the experimental results and the simulation results.
4. Conclusions
We have demonstrated the rotational SRS of hydrogen molecules in an all-fiber cavity based on HC-PCFs. The all-fiber gas cavity is fabricated by fusion splicing 49 m long HC-PCFs filled with 18 bar hydrogen and two sections of solid-core fibers. When pumped by a homemade 1064 nm YDFA, the pure rotational SRS of hydrogen molecules occurs in the gas cavity. The output characteristics of the FGRL with different repetition frequency and pulse width are explored. The maximum output power with 289 mW of the first-order Stokes wave at 1135 nm is obtained and the corresponding Raman efficiency is 28.5%. A steady-state theoretical model is established, and the experimental results are in good agreement with the simulation results. This work makes a further exploration for the applications of the FGRLs.
Author Contributions
Conceptualization, Z.W. and W.P.; methodology, W.P.; software, W.H. and H.L.; validation, Z.W., H.L. and W.P.; formal analysis, Z.W.; investigation, W.P.; resources, M.W.; data curation, H.L.; writing—original draft preparation, W.P.; writing—review and editing, Z.W.; visualization, W.P. All authors have read and agreed to the published version of the manuscript.
Funding
This work was supported by Outstanding Youth Science Fund Project of Hunan Province Natural Science Foundation (2019JJ20023), National Natural Science Foundation of China (NSFC) (11974427, 12004431) and State Key Laboratory of Pulsed Power Laser Technology (SKL 2020 ZR05).
Institutional Review Board Statement
Not applicable.
Informed Consent Statement
Not applicable.
Data Availability Statement
The data presented in this study are available on request from the corresponding author. The data are not publicly available due to privacy.
Conflicts of Interest
The authors declare no conflict of interest.
References
- Minck, R.W.; Terhune, R.W.; Rado, W.G. Laser stimulated Raman effect and resonant four-photon interactions in gases H2, D2, and CH4. Appl. Phys. Lett. 1963, 3, 181–184. [Google Scholar] [CrossRef]
- Brink, D.J.; Proch, D. Efficient Tunable Ultraviolet Source Based on Stimulated Raman Scattering of an Excimer-Pumped Dye Laser. Opt. Lett. 1982, 7, 494–496. [Google Scholar] [CrossRef] [PubMed]
- Loree, T.R.; Cantrell, C.D.; Barker, D.L. Stimulated Raman emission at 9.2 μm from hydrogen gas. Opt. Comm. 1976, 17, 160–162. [Google Scholar] [CrossRef]
- Benabid, F. Stimulated Raman Scattering in Hydrogen-Filled Hollow-Core Photonic Crystal Fiber. Science 2002, 298, 399–402. [Google Scholar] [CrossRef] [PubMed]
- Benabid, F.; Bouwmans, G.; Knight, J.C.; Russell, P.S.J.; Couny, F. Ultrahigh Efficiency Laser Wavelength Conversion in a Gas-Filled Hollow Core Photonic Crystal Fiber by Pure Stimulated Rotational Raman Scattering in Molecular Hydrogen. Phys. Rev. Lett. 2004, 93, 123903. [Google Scholar] [CrossRef] [PubMed]
- Couny, F.; Benabid, F.; Light, P.S. Subwatt Threshold Cw Raman Fiber-Gas Laser Based on H2-Filled Hollow-Core Photonic Crystal Fiber. Phys. Rev. Lett. 2007, 99, 143903. [Google Scholar] [CrossRef]
- Wang, Z.; Yu, F.; Wadsworth, W.J.; Knight, J.C. Efficient 1.9 μm Emission in H2 -Filled Hollow Core Fiber by Pure Stimulated Vibrational Raman Scattering. Laser Phys. Lett. 2014, 11, 105807. [Google Scholar] [CrossRef] [Green Version]
- Gladyshev, A.V.; Bufetov, I.A.; Dianov, E.M.; Kosolapov, A.F.; Khudyakov, M.M.; Yatsenko, Y.P.; Kolyadin, A.N.; Krylov, A.A.; Pryamikov, A.D.; Biriukov, A.S.; et al. 2.9, 3.3, and 3.5 μm Raman Lasers Based on Revolver Hollow-Core Silica Fiber Filled by 1H2/D2 Gas Mixture. IEEE J. Select. Top. Quantum Electron. 2018, 24, 0903008. [Google Scholar] [CrossRef]
- Astapovich, M.S.; Gladyshev, A.V.; Khudyakov, M.M.; Kosolapov, A.F.; Likhachev, M.E.; Bufetov, I.A. Watt-Level Nanosecond 4.42 μm Raman Laser Based on Silica Fiber. IEEE Photon. Technol. Lett. 2019, 31, 78–81. [Google Scholar] [CrossRef]
- Huang, W.; Li, Z.; Cui, Y.; Zhou, Z.; Wang, Z. Efficient, Watt-Level, Tunable 1.7 μm Fiber Raman Laser in H2-Filled Hollow-Core Fibers. Opt. Lett. 2020, 45, 475–478. [Google Scholar] [CrossRef]
- Li, H.; Huang, W.; Cui, Y.; Zhou, Z.; Wang, Z. Pure Rotational Stimulated Raman Scattering in H2-Filled Hollow-Core Photonic Crystal Fibers. Opt. Express 2020, 28, 23881–23897. [Google Scholar] [CrossRef] [PubMed]
- Thapa, R.; Knabe, K.; Corwin, K.L.; Washburn, B.R. Arc Fusion Splicing of Hollow-Core Photonic Bandgap Fibers for Gas-Filled Fiber Cells. Opt. Express 2006, 14, 9576–9583. [Google Scholar] [CrossRef] [PubMed]
- Benabid, F.; Couny, F.; Knight, J.C.; Birks, T.A.; Russell, P.S.J. Compact, Stable and Efficient All-Fibre Gas Cells Using Hollow-Core Photonic Crystal Fibres. Nature 2005, 434, 488–491. [Google Scholar] [CrossRef]
- Chen, X.D.; Sun, Q.; Li, H.; Zhao, M.H. Compact All-Fiber Gas Raman Light Source Based on Hydrogen-Filled Hollow-Core Photonic Crystal Fiber Pumped with Single-Mode Q-Switched Fiber Laser. Opt. Fiber Technol. 2013, 19, 486–489. [Google Scholar] [CrossRef]
- Li, H.; Pei, W.; Huang, W.; Wang, M.; Wang, Z. Highly Efficient Nanosecond 1.7 μm Fiber Gas Raman Laser by H2-Filled Hollow-Core Photonic Crystal Fibers. Crystals 2020, 11, 32. [Google Scholar] [CrossRef]
- Sun, Q.; Mao, Q.; Liu, E.; Rao, R.; Ming, H. Hollow-Core Photonic Crystal Fiber High-Pressure Gas Cell; Sampson, D.D., Ed.; SPIE-International Society of Optical Engineering: Perth, WA, Australia, 2008; p. 700455. [Google Scholar]
- Bischel, W.K.; Dyer, M.J. Wavelength Dependence of the Absolute Raman Gain Coefficient for the Q(1) Transition in H2. J. Opt. Soc. Am. B 1986, 3, 677–682. [Google Scholar] [CrossRef]
- Xiao, L.; Demokan, M.S.; Jin, W.; Wang, Y.; Zhao, C.-L. Fusion Splicing Photonic Crystal Fibers and Conventional Single-Mode Fibers: Microhole Collapse Effect. J. Lightwave Technol. 2007, 25, 3563–3574. [Google Scholar] [CrossRef] [Green Version]
- Hanson, F.; Poirier, P. Stimulated Rotational Raman Conversion in H2, D2, and HD. IEEE J. Quantum Electron. 1993, 29, 2342–2345. [Google Scholar] [CrossRef]
- Herring, G.C.; Dyer, M.J.; Bischel, W.K. Temperature and Density Dependence of the Linewidths and Line Shifts of the Rotational Raman Lines in N2 and H2. Phys. Rev. A 1986, 34, 1944–1951. [Google Scholar] [CrossRef] [PubMed]
Figure 1.
Experimental setup: ISO, optical isolator, LD, laser dioxide, PM, power meter, OSA, optical spectrum analyzer.
Figure 1.
Experimental setup: ISO, optical isolator, LD, laser dioxide, PM, power meter, OSA, optical spectrum analyzer.

Figure 2.
The fine spectrum of (a) the seed and (b) the fiber amplifier at the maximum output power with an OSA resolution of 0.02 nm.
Figure 2.
The fine spectrum of (a) the seed and (b) the fiber amplifier at the maximum output power with an OSA resolution of 0.02 nm.

Figure 3.
(a) The schematic cross section of the HC-PCF and (b) the transmission loss and dispersion curves of the HC-PCF, both from the product manual provided by NKT Photonics.
Figure 3.
(a) The schematic cross section of the HC-PCF and (b) the transmission loss and dispersion curves of the HC-PCF, both from the product manual provided by NKT Photonics.

Figure 4.
(a) The total output spectrum of 1 µm all-fiber FGRL. (b–d) The fine spectrum of the residual pump laser, the first-order Stokes laser, and the second-order Stokes laser, respectively.
Figure 4.
(a) The total output spectrum of 1 µm all-fiber FGRL. (b–d) The fine spectrum of the residual pump laser, the first-order Stokes laser, and the second-order Stokes laser, respectively.


Figure 5.
(a) The output spectrum of the pump source at the maximum output power when the pulse width of the pump laser is 2 ns and the repetition frequency is 20 MHz. (b) The total output spectrum of 1 µm all-fiber FGRL in this case. (c,d) The fine spectrum of the first-order Stokes waves at 1135 nm and 1106 nm, respectively.

Figure 6.
(a,b) The power spectrums of the pump source at the maximum power with the pulse width of 2 ns and 4 ns, respectively.
Figure 6.
(a,b) The power spectrums of the pump source at the maximum power with the pulse width of 2 ns and 4 ns, respectively.

Figure 7.
The output power characteristics of the FGRL with the pulse width of (a) 4 ns and (b) 2 ns. The solid and hollow patterns represent the Raman power and residual pump power, respectively. (c) The Raman efficiency of different pulse widths. (d) The Stokes pulse energy with coupled pump pulse energy in different repetition frequency.


Figure 8.
The output power characteristics of the FGRL with different repetition frequencies (pulse width 4 ns). (a–c) The Raman power, residual pump power and Raman efficiency, respectively. (d) The Stokes pulse energy with coupled pump pulse energy in different repetition frequency.
Figure 8.
The output power characteristics of the FGRL with different repetition frequencies (pulse width 4 ns). (a–c) The Raman power, residual pump power and Raman efficiency, respectively. (d) The Stokes pulse energy with coupled pump pulse energy in different repetition frequency.


Figure 9.
The temporal characteristic of the FGRL when the pump source is at the maximum power and the repetition is 20 MHz. (a,b) The shapes and the series of the pump pulses. (c,d) The shapes and the series of the Stokes pulses.
Figure 9.
The temporal characteristic of the FGRL when the pump source is at the maximum power and the repetition is 20 MHz. (a,b) The shapes and the series of the pump pulses. (c,d) The shapes and the series of the Stokes pulses.

Figure 10.
The simulation results of (a) the pump pulse shape and the first-order Stokes pulse shape and (b) the output power characteristics.
Figure 10.
The simulation results of (a) the pump pulse shape and the first-order Stokes pulse shape and (b) the output power characteristics.

Publisher’s Note: MDPI stays neutral with regard to jurisdictional claims in published maps and institutional affiliations. |
© 2021 by the authors. Licensee MDPI, Basel, Switzerland. This article is an open access article distributed under the terms and conditions of the Creative Commons Attribution (CC BY) license (https://creativecommons.org/licenses/by/4.0/).
Share and Cite
MDPI and ACS Style
Pei, W.; Li, H.; Huang, W.; Wang, M.; Wang, Z. Hydrogen Molecules Rotational Stimulated Raman Scattering in All-Fiber Cavity Based on Hollow-Core Photonic Crystal Fibers. Crystals 2021, 11, 711. https://doi.org/10.3390/cryst11060711
AMA Style
Pei W, Li H, Huang W, Wang M, Wang Z. Hydrogen Molecules Rotational Stimulated Raman Scattering in All-Fiber Cavity Based on Hollow-Core Photonic Crystal Fibers. Crystals. 2021; 11(6):711. https://doi.org/10.3390/cryst11060711
Chicago/Turabian StylePei, Wenxi, Hao Li, Wei Huang, Meng Wang, and Zefeng Wang. 2021. "Hydrogen Molecules Rotational Stimulated Raman Scattering in All-Fiber Cavity Based on Hollow-Core Photonic Crystal Fibers" Crystals 11, no. 6: 711. https://doi.org/10.3390/cryst11060711
Note that from the first issue of 2016, this journal uses article numbers instead of page numbers. See further details here.