‘Quasi-Tricritical’ and Glassy Dielectric Properties of a Nematic Liquid Crystalline Material


Institute of High Pressure Physics Polish Academy of Sciences, ul. Sokołowska 29/37, 01-142 Warsaw, Poland
Crystals 2020, 10(4), 297; https://doi.org/10.3390/cryst10040297
Submission received: 4 March 2020
/
Revised: 28 March 2020
/
Accepted: 30 March 2020
/
Published: 13 April 2020
(This article belongs to the Special Issue Nematic Liquid Crystals)
Abstract
:Results of dielectric studies in the nematic and isotropic liquid phases of pentylcyanobiphenyl (5CB), a model rod-like liquid crystalline material, are shown. They are based on the discussion of the evolution of dielectric constant (), its changes under the strong electric field (nonlinear dielectric effect, NDE), and finally, the primary relaxation time. It is shown that changes in and NDE are entirely dominated by the impact of pretransitional fluctuations (pre-nematic and pre-isotropic, respectively) which are associated with the weakly discontinuous character of the isotropic–nematic phase transition. This influence also extends for the low-frequency, ionic species dominated, region. Notable, that the derivative-based and distortions sensitive analysis revealed the tricritical nature of the I-N transition. Although the glass transition in 5CB occurs in the deeply supercooled state at , the dynamics (changes of the primary relaxation time) follow a previtreous pattern both in the isotropic and in the nematic phase. Finally, the discussion of the ’molecular’ vs. ‘quasi-critical’ characterizations of the isotropic and nematic phases is presented. It shows the evident prevalence of the ‘quasi-critical-picture’, which offers the consistent temperature parameterization in the total tested temperature range.
1. Introduction
The name ‘liquid crystals’ may appear self-contradictory, but it describes the real nature of unique states locating between the isotropic liquid and the solid crystalline state. Liquid crystals (LCs) are built from molecules creating fluids in which elements of the long-range order of crystals with the mobility of liquids are combined. Liquid crystals are crucial for challenging chapters of physics, chemistry, and modern biology [1,2,3,4,5,6,7]. They are also omnipotent for a variety of applications, mainly displays used from smartphones to computers and TV sets [8,9]. As the most classical liquid crystalline material, one can indicate pentylcyanobiphenyl (5CB)—the rod-like compound with the permanent dipole moment () approximately parallel to the long molecular axis [3]. It exhibits only the nematic mesophase, with the uniaxial orientational ordering while the translational disorder remains. The essential reference point for properties of 5CB are isotropic-nematic (I-N) and the nematic-solid (I-S) phase transitions. [3,4] Notable, that one of the most significant theoretical concepts of the Physics of Liquid Crystals and the Soft Matter Physics, Landau-de Gennes (LdG) model, was created to comment strong and surprisingly similar pretransitional changes of the Cotton-Mouton effect (CME, ), Kerr effect (KE, ) and the intensity of the scattered light (IL) in the isotropic liquid phase [1,3,10]:
where is the difference of refractive indexes for samples with molecules oriented in a parallel and perpendicular way in respect to the long molecular axis; E is the intensity of the electric field and B demotes the magnetic induction. and is for the I-N ‘clearing’ temperature, denotes the hypothetical, extrapolated, continuous phase transition and is the measure of the discontinuity of the I-N transition. Equation (1) can be linked to the temperature evolution of compressibility described by the power/critical exponent .
For nematogenic liquid crystalline materials, particularly important for applications, such properties as dielectric constant (), refractive index () and electric conductivity (), primary relaxation time () or viscosity () are particularly important [2,3,4,8]. There are five decades of studies indicating for these properties no pretransitional anomalies on approaching the I-N transition [2,3,4,8,11,12,13]:
where Equation (3) is for the Arrhenius behavior and denotes the activation energy.
Essentially important, regarding both fundamentals and applications, are changes of components of the refractive index (, ) and dielectric constant (,) in the nematic phase [2,3,4,8]. Their evolutions are most often analyzed in terms of the Haller relation [3,4,14,15,16,17,18]:
and
where the empirical exponent . It is expected that in the nematic phase below the clearing temperature : and , i.e., constant values for the completely ordered sample are reached. They are assumed to reflect the molecular anisotropy of LC molecules [3].
Generally, no pretransitional behavior near the nematic–solid phase transition is expected. [1,2,3,4,5,6,7,8] Notwithstanding, there is a limited evidence of such behavior, in 2-cyano-4-pentylbiphenyl 4-(trans-4-pentylcyclohexyl) benzoate (the LC compound with the transverse location of the permanent dipole moment), [19] or 5CB and BaTiO3 nanoparticles composites [20,21], for instance.
However, there are blots in the simple and broadly applied ‘research landscape’ sketched above [1,2,3,4,8]. First, both and changes are considered as basic metrics of the order parameter in the Physics of Liquid Crystals and the Phase Transitions, including the LdG model [1,2,3,22]. The order parameter constitutes here the basic parameter, and its evolution has to be described by the universal, well-defined and constant value of the exponent [22], in clear disagreement with the Haller relation [14]. Second, already in 1981 Bradshaw and Raynes [23] and in 1983 Thoen and Menu [24] presented the evidence for a notable pretransitional anomaly in the isotropic phase of n-cyanobiphenyls, including 5CB for dielectric constant. Starting from 1996, the author of this report tested the behavior of dielectric constant in the isotropic phase, first on approaching the I-N transition and subsequently also for the Isotropic-Smectic A (I-SmA), Isotropic-Smectic E (I-SmE) and the Isotropic-Chiral Nematic (I-N*) phase transitions. In each mentioned case, studies carried out even up to validated the following pretransitional behavior [25,26,27]:
where , are for the hypothetical, extrapolated, continuous phase transition; the power exponent is linked to the specific heat pretransitional/critical anomaly . Following tests in the homogeneous phase of binary mixtures of limited miscibility, it was suggested that .
Notable, that the pretransitional anomaly in the isotropic liquid phase described by Equation (6) is relatively strong and easy for detecting, but requiring high-resolution experiments which takes into account the general rule for ‘critical phenomena tests’: the temperature distance between subsequent tested temperatures should strongly decrease when approaching the singular temperature (T* in the given case).
In the last two decades, such in-deep studies taking into account Equation (6) have been carried out also by ‘other’ authors, extending the evidence confirming the appearance of the pretransitional effect in the isotropic liquid phase and the validity also for LC molecule beyond the basic rod-like pattern [28,29,30]. Notably, that the lack of pretransitional ‘anomaly’ is also possible (see Equation (2)) but only for systems where the permanent dipole moment is perpendicular to the long molecular axis [19,31]. It is coupled to the exponent .
One should stress that direct experimental studies of the heat capacity/specific heat yielded a strong record for pretransitional anomalies associated with the exponent on both sides of the I-N transition, independently from the position or even absence of the permanent dipole moment [3,22]. In classical monographs regarding the Physics of Liquid Crystals the surrounding of the I-N transition in rod-like LC materials is indicated as the model case for which the basic mean-field theory (MFT) is valid [1,2,3,4]. From the experimental point of view power/critical exponents constitute the key check-point in testing theoretical predictions. For the basic MFT model [22]: , (T > TC = T*) and (T < TC = T*), and , (T > TC = T*), and (T < TC = T*) for the compressibility related exponent.
Concluding, rod-like liquid crystalline materials with the nematic phase are considered as the experimental model-system for the fundamental insights and society-important applications [1,2,3,4,5,6,7,8,9,10,11]. Notwithstanding, some of their essential properties remain surprisingly puzzling, as indicated above. One can also add questions regarding the range and degree of the impact of phase transitions on basic features, or the still poorly tested relationship between pretransitional fluctuations and ionic dopants, which dominates dielectric properties in the low-frequency domain [11,12,13].
The target of this report is the experimental evidence and explanation of the cognitive gap indicated above. Results are based on broadband dielectric spectroscopy, and nonlinear dielectric effect (changes of dielectric constant under the strong electric field) studies carried out in isotropic and nematic phases of rod-like pentylcyanobiphenyl (5CB). Unique features, hidden so far, have been revealed due to the high-resolution measurements in the broad temperature range, as well as the innovative distortions-sensitive analytic methodology.
2. Materials and Methods
Experimental studies were conducted using the broadband dielectric spectrometer (Novocontrol) with the Quattro unit for temperature control. It enables complex impedance measurements up to GHz. The analysis explored the complex dielectric permittivity . They were carried out in pentylcyanobiphenyl (5CB), with the mesomorphism [2,3]:
Solid Crystal—()–Nematic—()–Isotropic liquid. 5CB molecules are terminated by the permanent dipole moment (), approximately parallel to the long molecular axis [3]. Samples of 5CB were deeply degassed immediately before measurements, basing on the sequence ‘freeze and pump’. Such processing also significantly reduced the electric conductivity of tested samples. The analysis of experimental data explored innovative derivative-based tools, developed by the author [32,33,34]. Measurements of dielectric constant in the nematic phase of 5CB were carried out using the flat-parallel capacitors made from the gold-coated copper, with the gap , and diameter . The applied magnetic field .
Dielectric studies (broadband dielectric spectroscopy BDS, nonlinear dielectric effect NDE) in the isotropic phase and for non-oriented samples in the nematic phase were carried out using the capacitor made from Invar. They also offer the insight into dynamics focused on the primary (structural, alpha) relaxation process. Details regarding this issue are given in the Appendix A.
Nonlinear dielectric effect (NDE) describes changes of dielectric constant due to the action of the strong electric field E: [35,36,37]. Such studies, associated with measurement of a tiny shift of the electric capacitance, , were performed using the dual-field resonant method, with the radio-frequency weak measuring field and the DC strong electric field applied in the form of ca. lasting pulses. The latter makes the impact of ionic-dopants, which can cause the parasitic heating effect, negligible. This report is based on the results of in-deep re-analyzed earlier findings of the author [21,33,38,39] and new measurements. The latter is related mainly to NDE studies and results presented in Figure 1 as well as in the Appendix A.
3. Results and Discussion
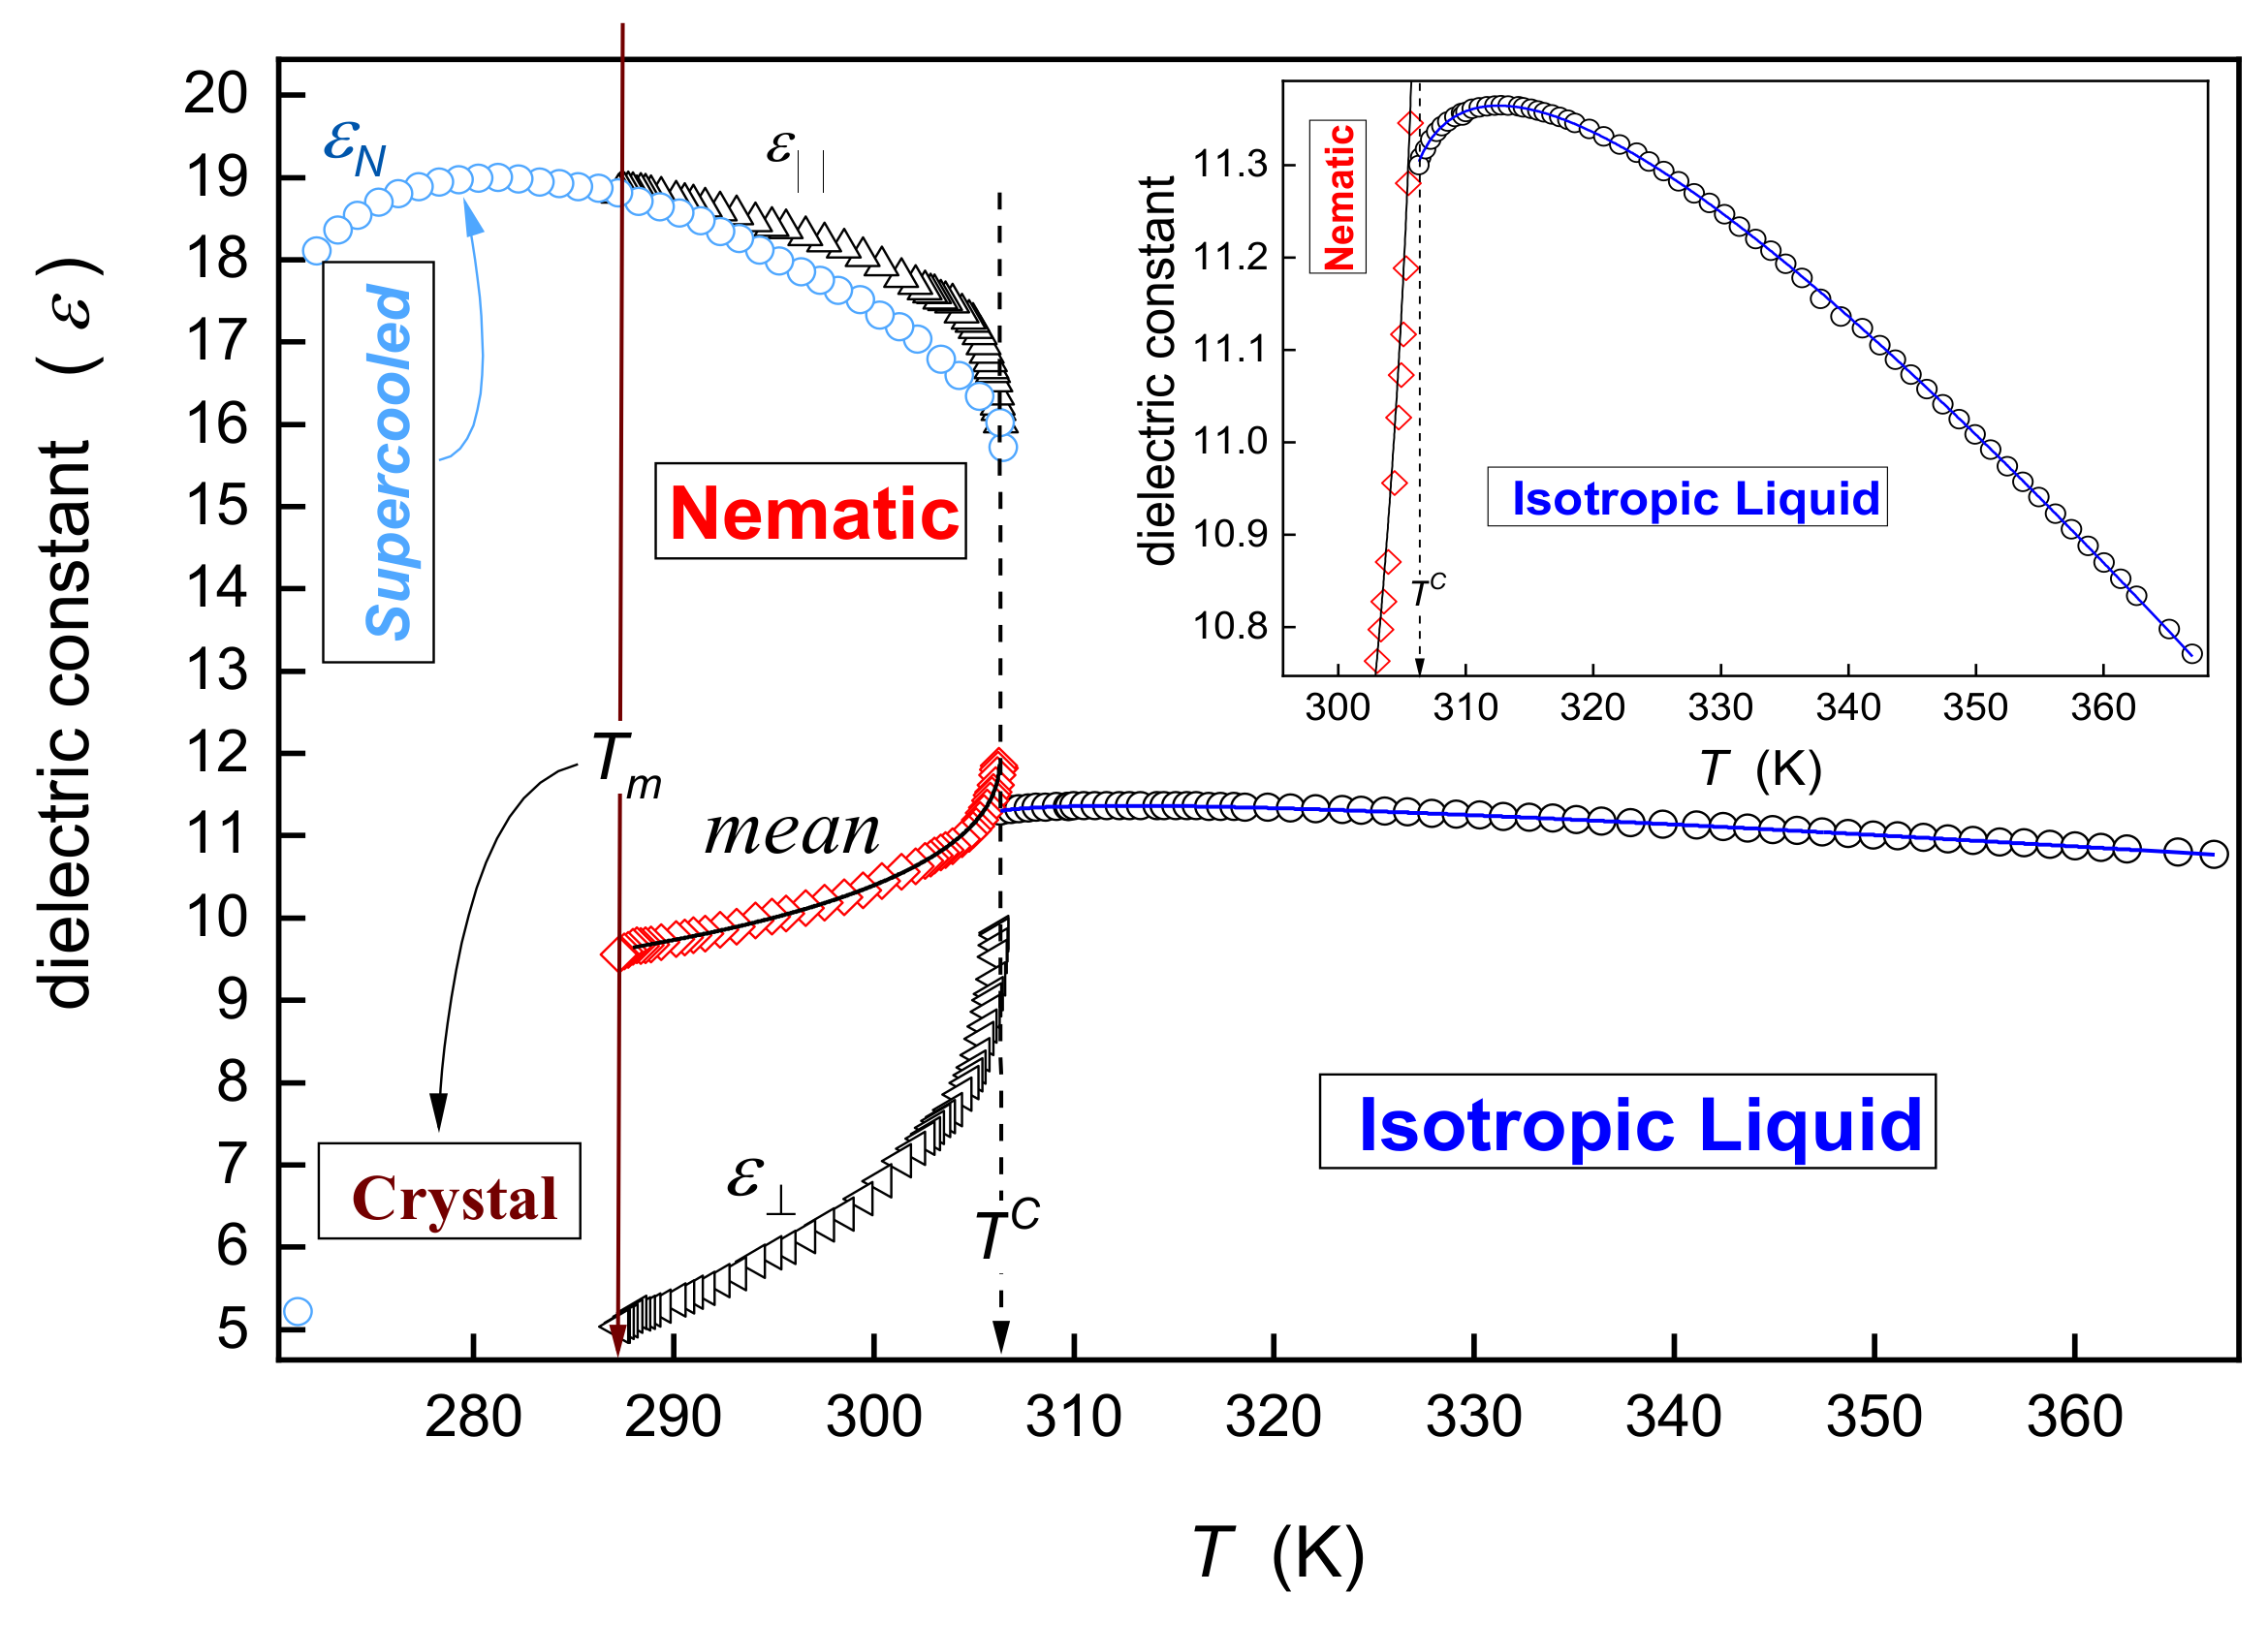
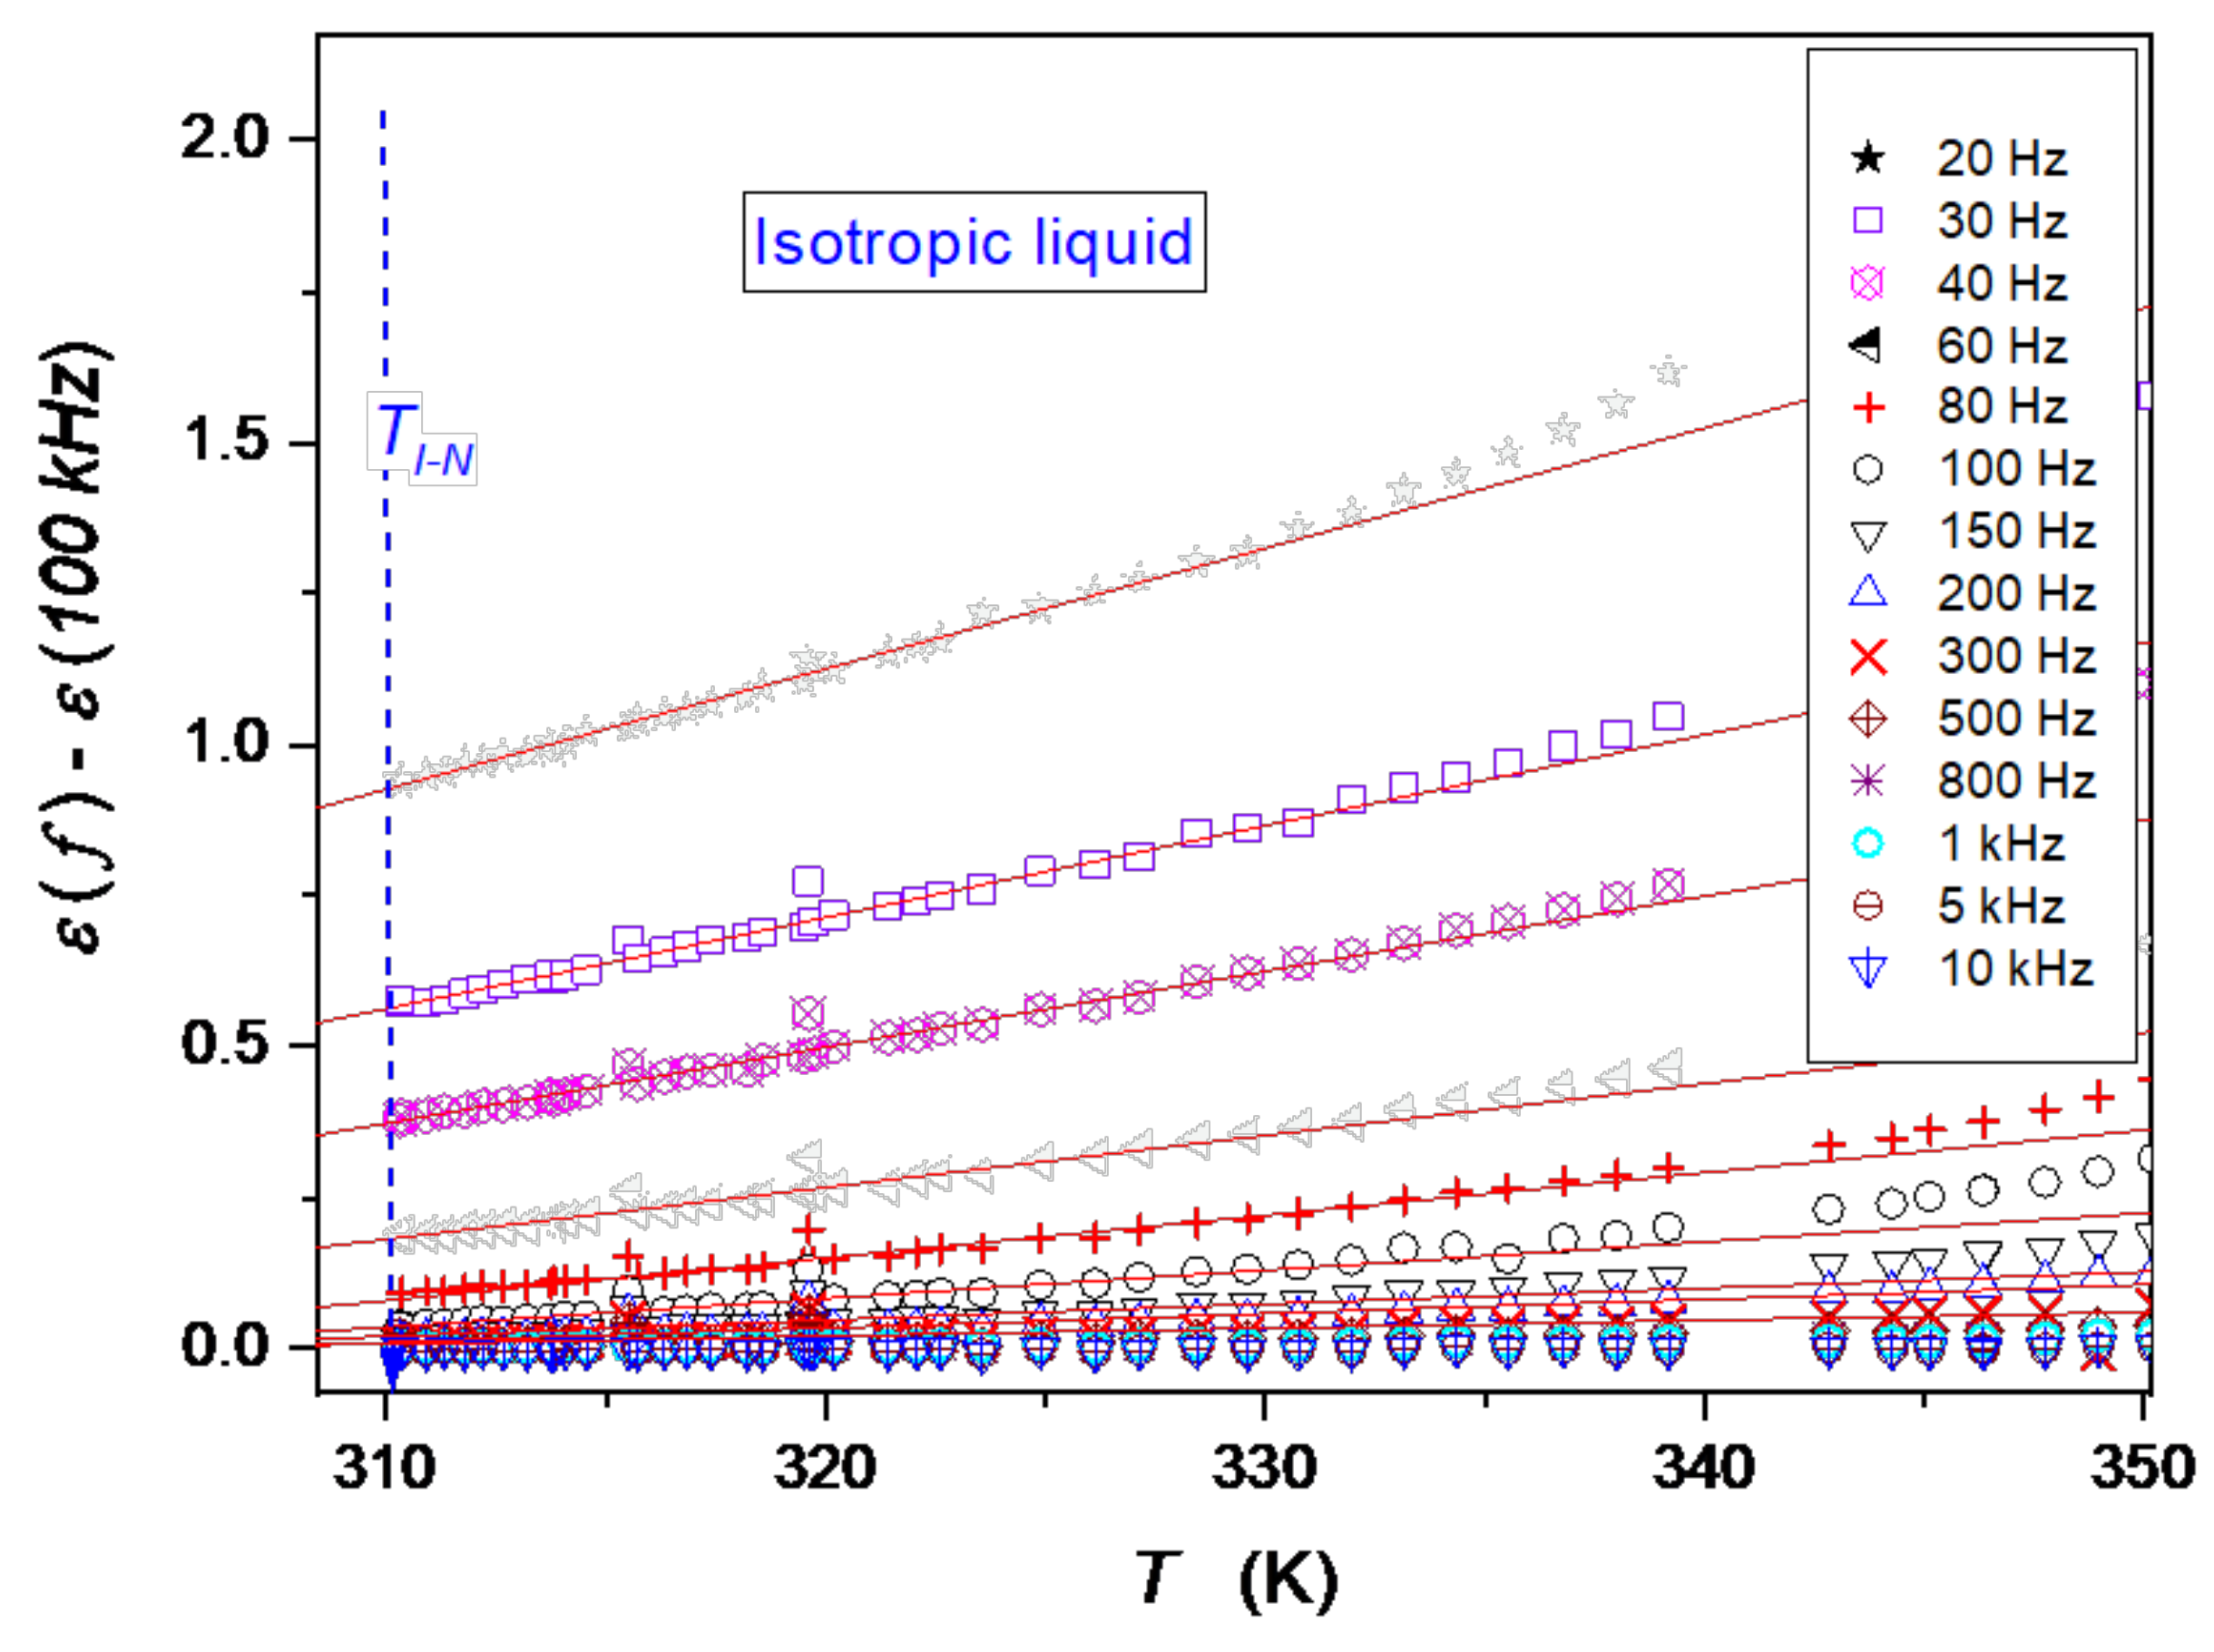
Figure 1 presents the behavior of dielectric constant in the isotropic and nematic phases of liquid crystalline 5CB. The inset in Figure 1 shows the clear manifestation of the pretransitional effect in the isotropic liquid, associated with the crossover: . The discontinuous I-N transition exhibits features of the weakly discontinuous phase transition, i.e., it is associated with the influence of the hidden continuous phase transition at temperature , located only ca. below the clearing temperature . Consequently, on cooling towards in the isotropic liquid phase, pretransitional fluctuations of the subsequent nematic phase appear. Their size and lifetime are described by Equation (1), and 5CB molecules within fluctuations are ordered in the way characteristic for the nematic phase. The latter means the equivalence of and directors, i.e., vectors showing the preferred orientational arrangement of the long molecular axis of molecules [1,2,3]. This feature leads to the random orientation of permanent dipole moments within prenematic fluctuations, and then the cancellation of the related ‘dipolar contribution’ to dielectric constant characterizing fluctuations. Consequently, dielectric constant related to fluctuation is qualitatively smaller than for the ‘chaotic, fludlike’ surrounding: . This leads to the appearance of the crossover temperature, for , for which contributions to the total dielectric constant from prenematic fluctuations and the isotropic liquid surrounding are equal.
The behavior of dielectric constant in the isotropic phase is described via the relation [25,26,27]:
where , . Values of parameters obtained: , , , and . This result is shown as the blue curve in Figure 1.
Experimental data presented in Figure 1 make it possible to calculate the mean value of the dielectric constant in the nematic phase, due to the symmetry of 5CB molecule defined as . It also exhibits a strong pretransitional anomaly, described by the relation [40,41]:
where , . Values of the fitted parameter , , , and .
The experimental results presented in Figure 1 enables the analysis of the order parameter behavior in the nematic phase. According to the Physics of Critical Phenomena and Phase Transitions [22], temperature changes of the order parameter should follow the dependence [40,41]:
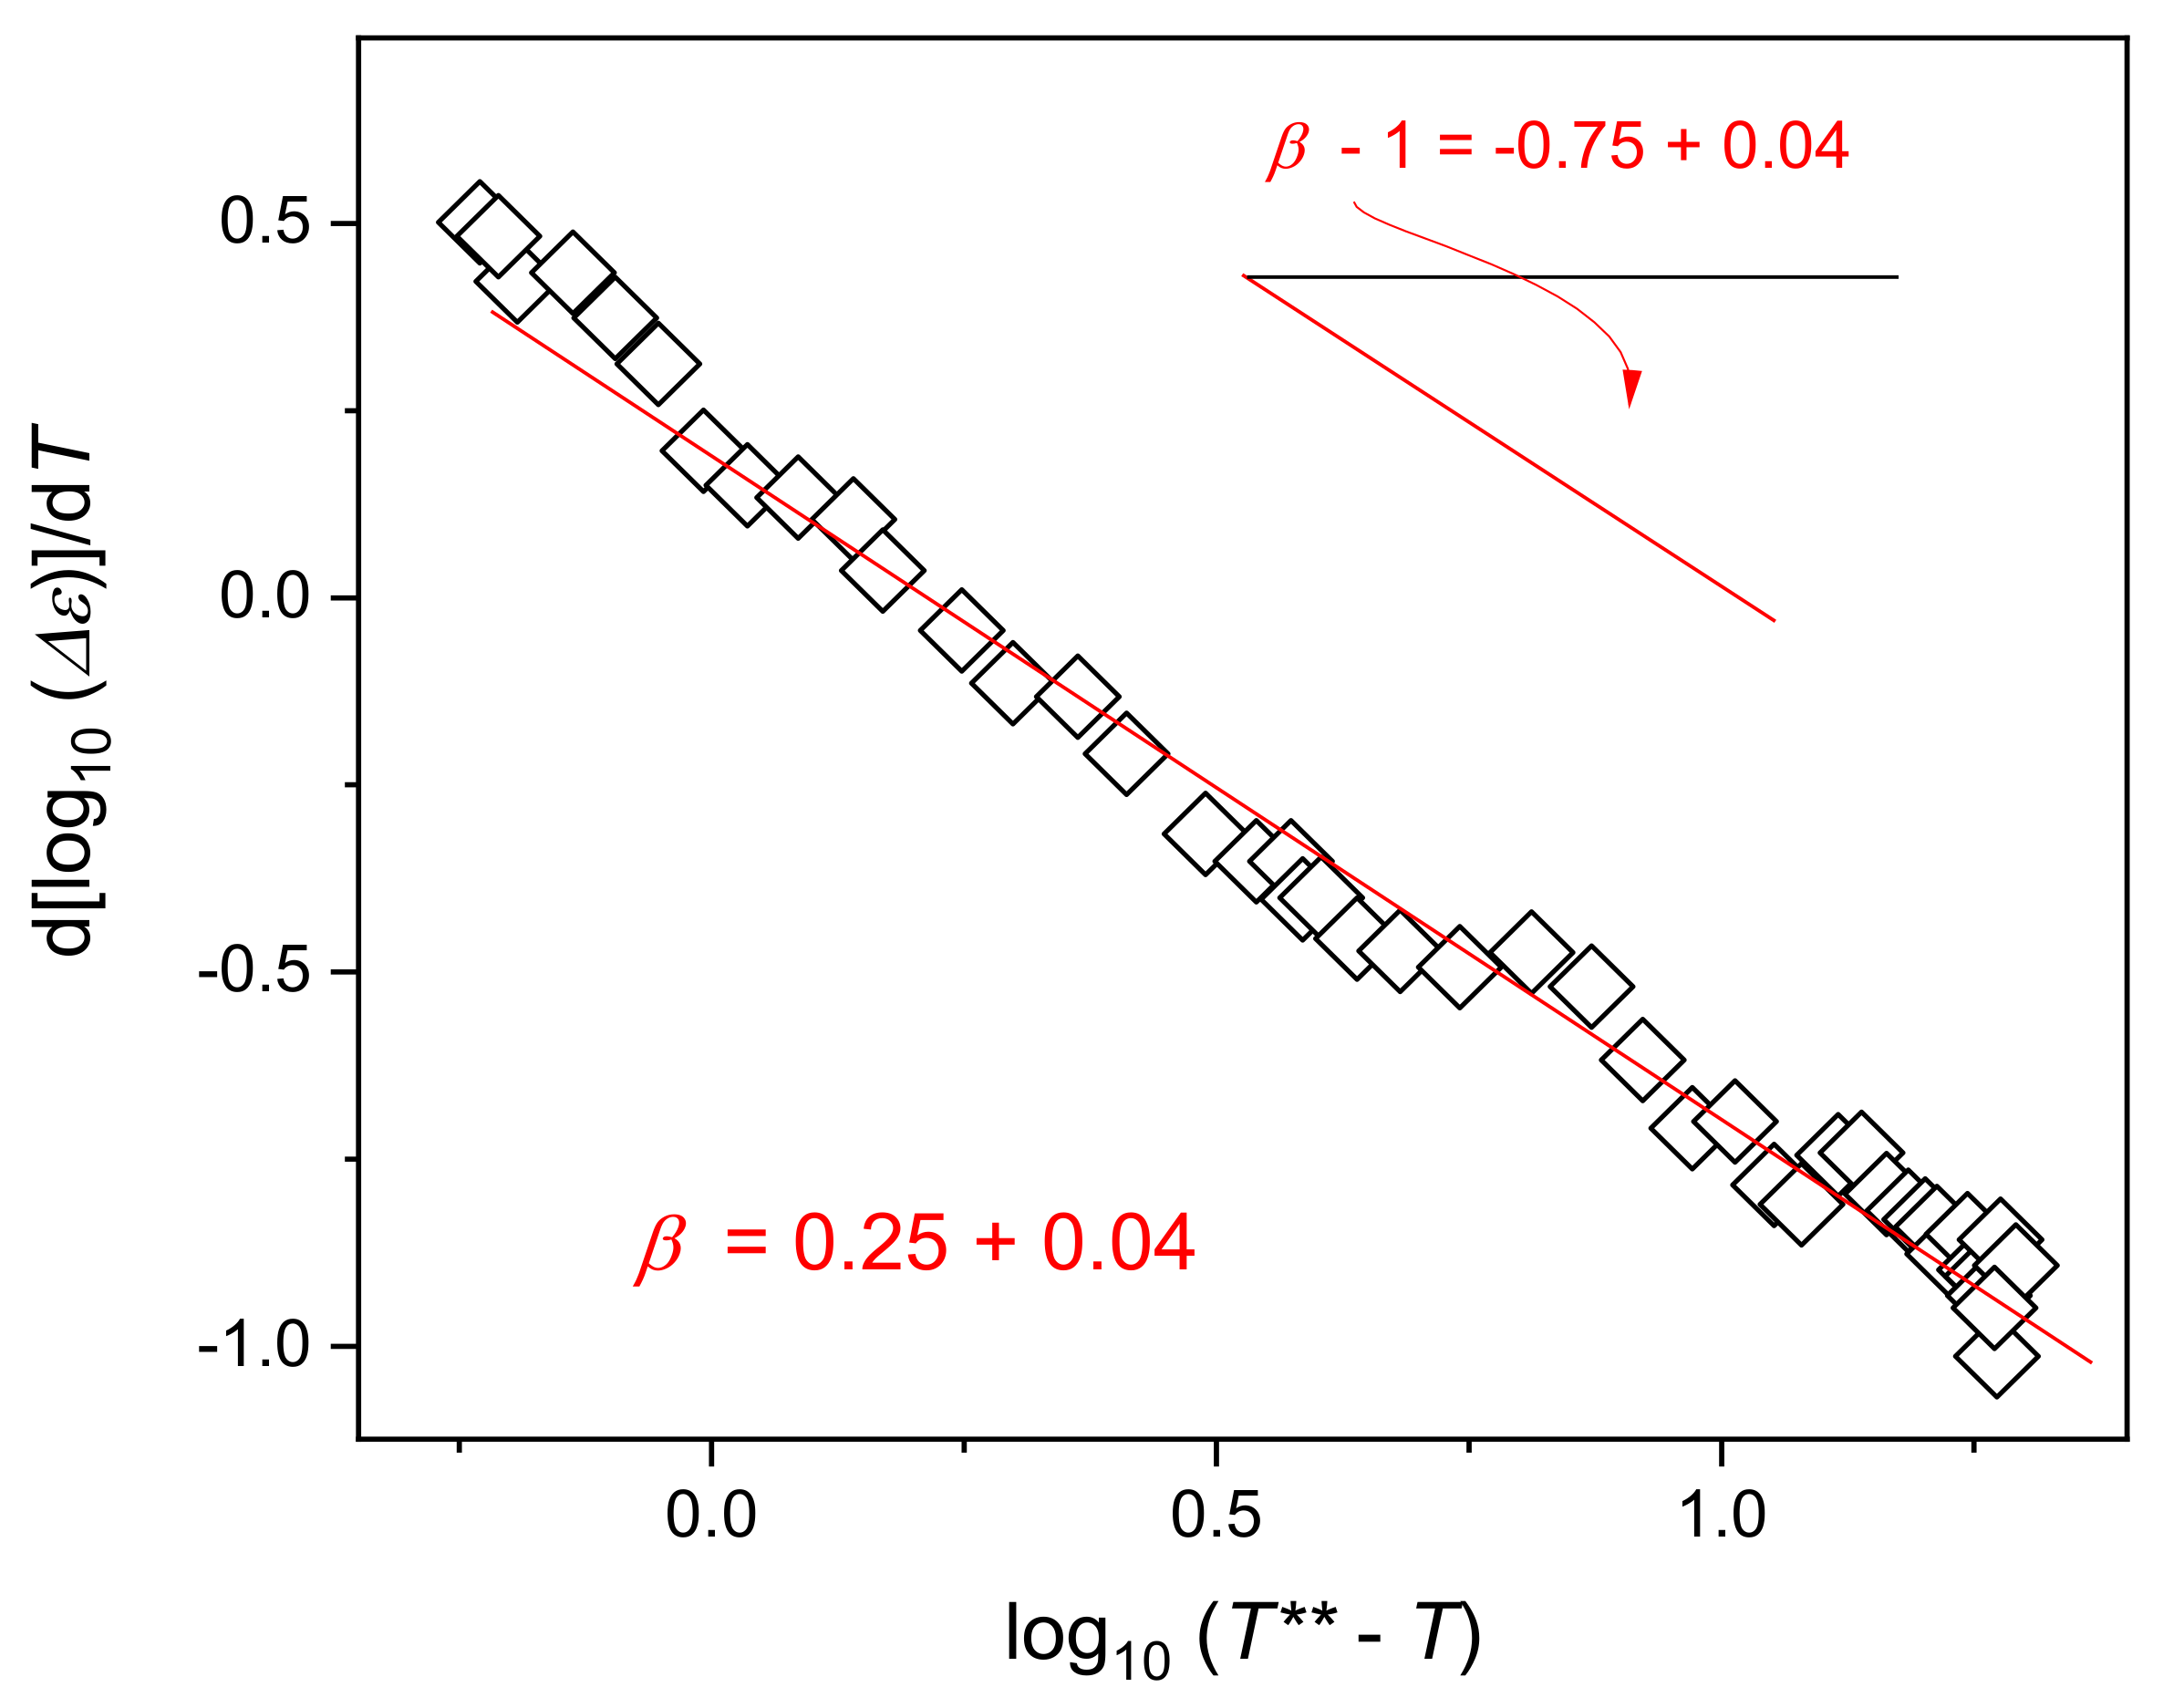
This relation contains three adjustable parameters and has to be used for experimental data that terminate at , i.e. well above the singular temperature . Thus, the domain of the most significant pretransitional changes of is excluded from the analysis, what has to increase the fitting uncertainty. However, one can consider the derivative of experimental data, reducing the number of adjustable parameters:
The application of such analysis reduces the fitting solely to one parameter (). Results are shown in Figure 2.
It is particularly worth stressing that results presented in Figure 1 and Figure 2 prove the dominated impact of the pretransitional behavior for the whole nematic and the isotropic liquid phases. This behavior is clearly linked to the impact of collective pretransitional fluctuations.
Figure 1 also presents the temperature evolution of dielectric constant in the non-oriented supercooled nematic, for which supercooling well below was possible. In the given case, the nematic phase was reached on cooling from the isotropic liquid and the additional DC electric field (U=40 V) was applied only just at the phase transition temperature . This causes that in the nematic phase, changes of follows the pattern close to behavior. Generally, it is expected that on cooling and approach horizontal asymptotes, which can estimate the ‘molecular anisotropy’ for the perfectly ordered sample. For the non-oriented 5CB sample, the supercooling below was possible, and the mentioned tendency for qualitatively changed: the notable decrease of the value of is visible. In the opinion of the author, the link of this phenomenon to the growing impact of topological defects distorting the uniaxial arrangement can be indicated [42]. Such a possibility can show experimental studies and related modeling for 5CB + nanoparticles composites [20,21].
From the application point of view, the impact of ionic impurities on dielectric properties is meaningful, becoming significant for the low frequencies domain. The link between prenematic fluctuations and the impact of ionic contaminants is still poorly evidenced. [43,44,45] Results presented in Figure 1 and Figure 2 show the dominated influence of pretransitional fluctuations on the dielectric constant in the broad surrounding of the I-N ‘clearing’ temperature. The question arises if such impact also extends into the low-frequency domain. Results presented in Figure 3 can respond to this question. In the plot as the reference, the value of dielectric permittivity in the clear static domain , where the influence of the ionic contribution can be neglected, is assumed. It is visible that the presence of prenematic fluctuations leads to the linear behavior of the ionic-related contribution. This means that in the isotropic phase of 5CB the critical-like Equation (7) remains valid also for frequencies below the static domain, and the impact of ionic impurities appears only as an additional linear term. Such simple behavior can be linked to the impact of appearing prenematic fluctuations, what further suggest its reduction for very low frequencies.
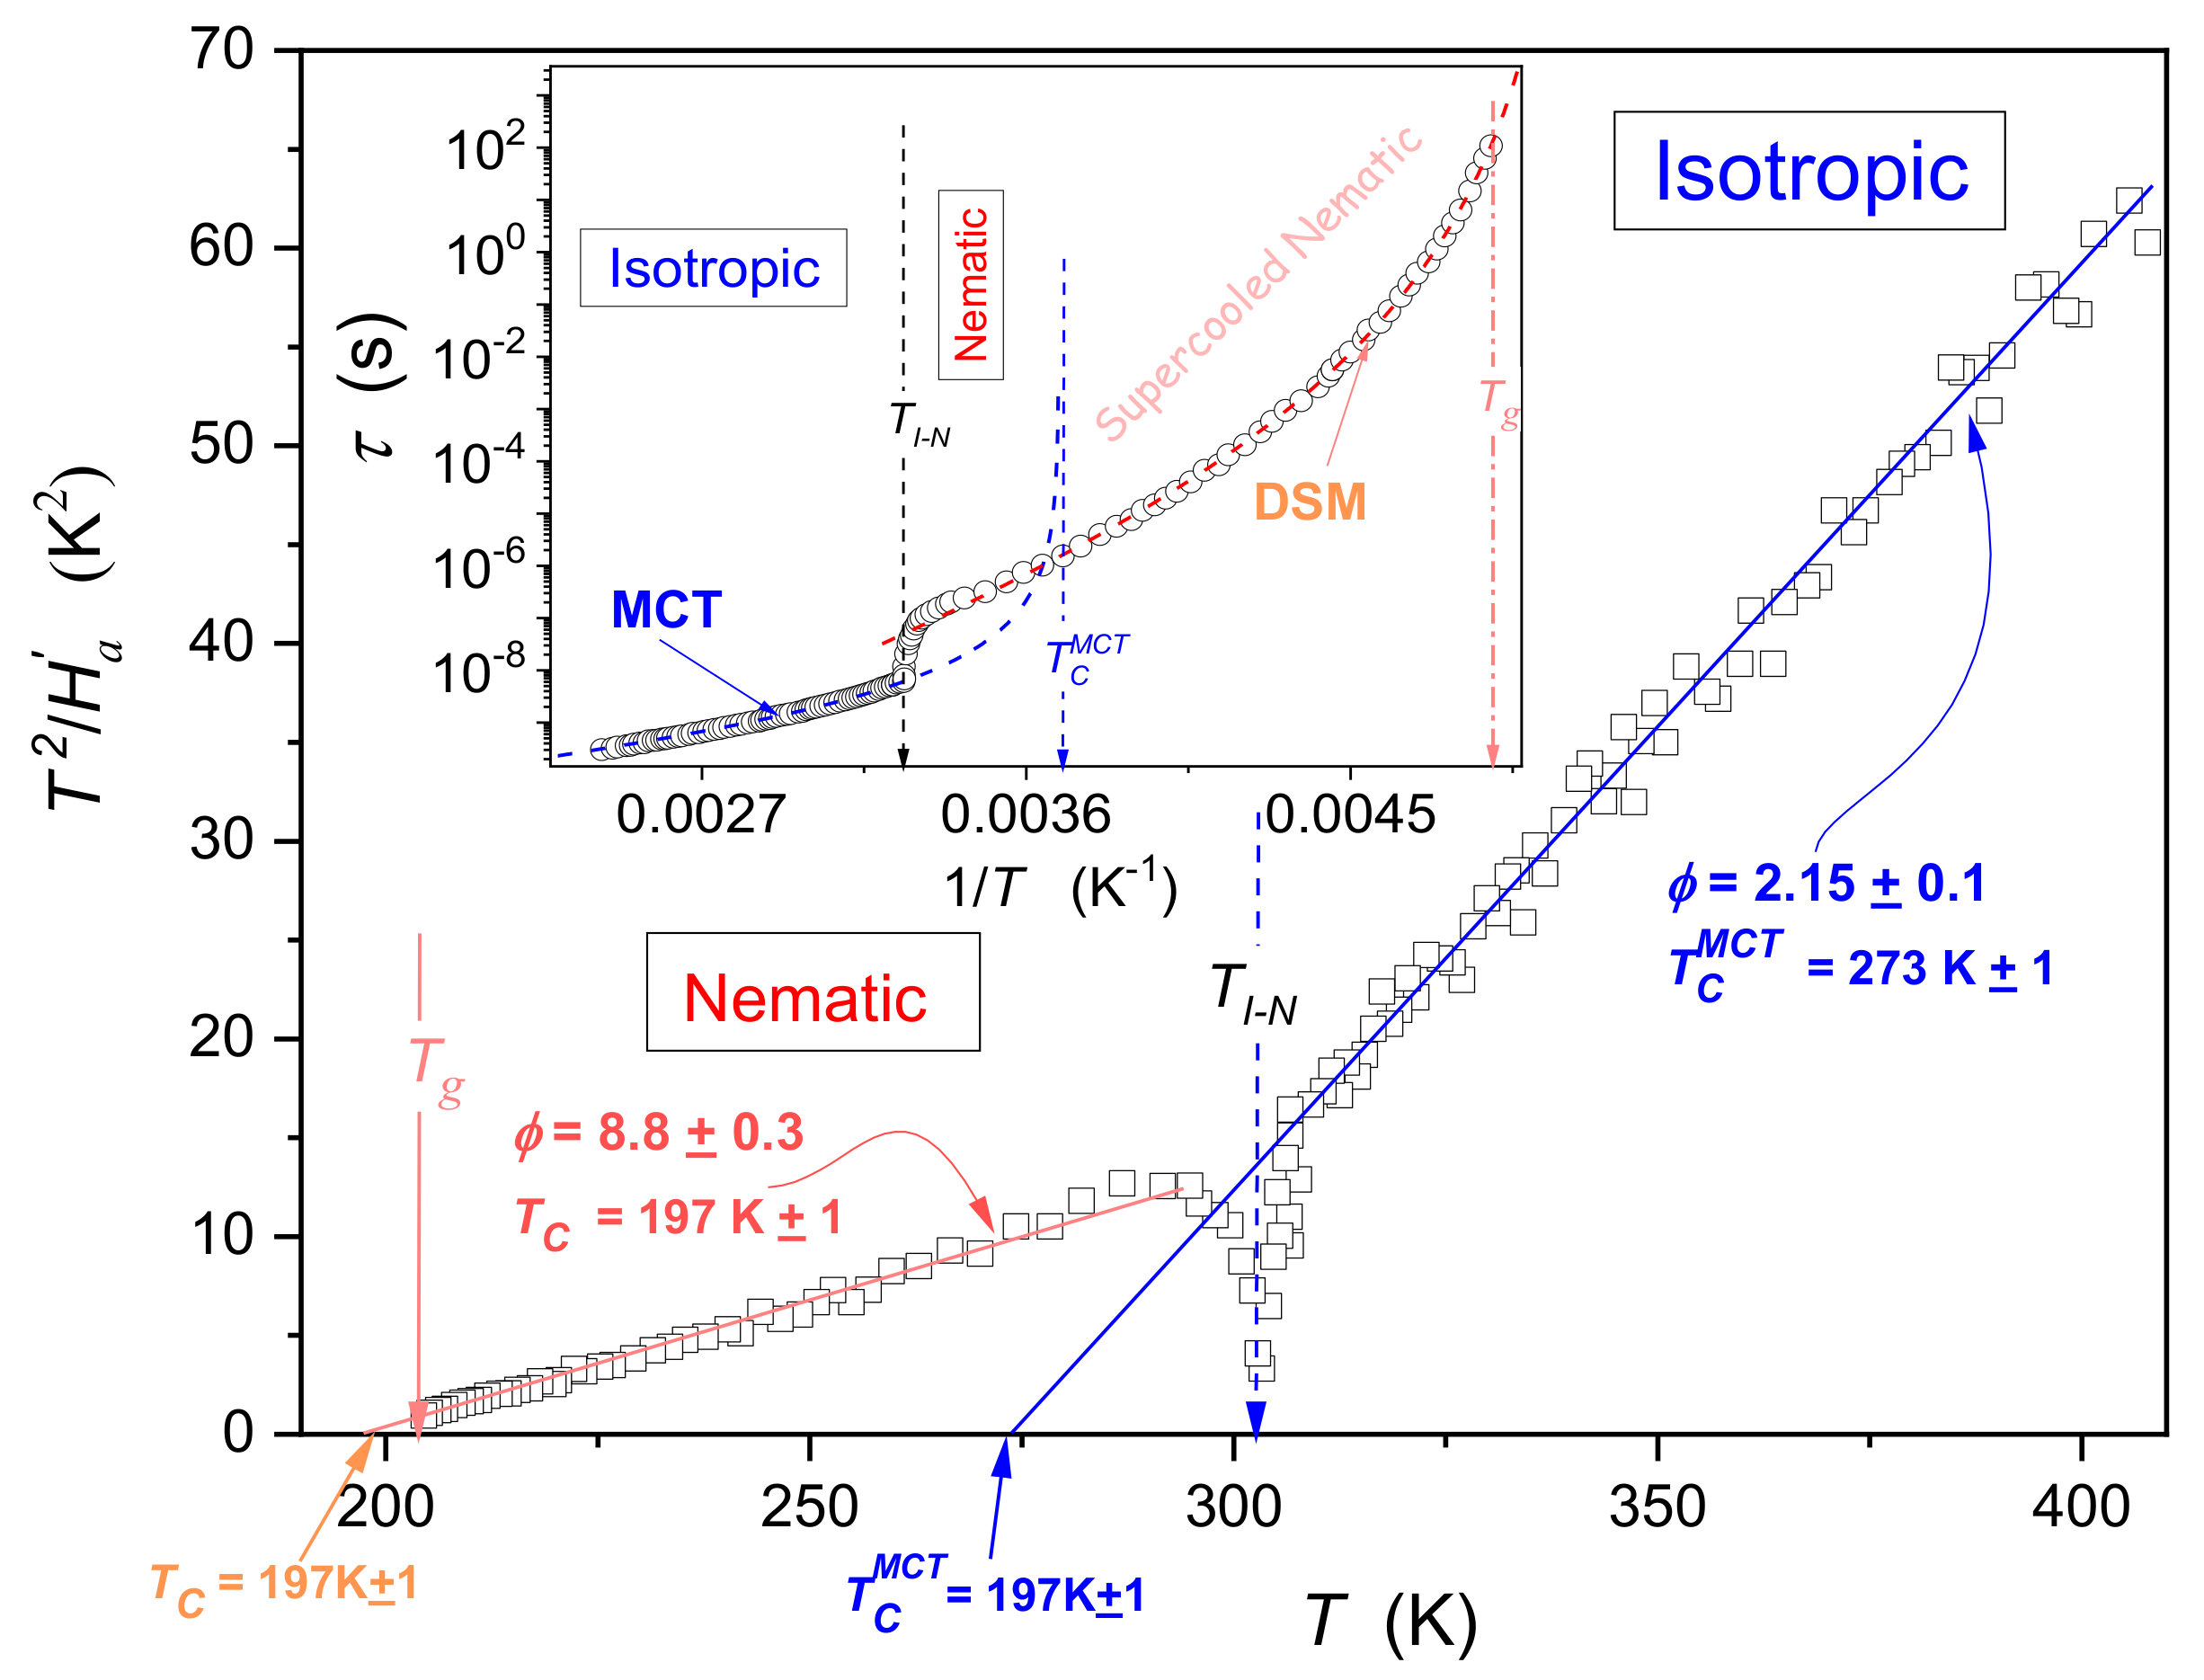
Broadband dielectric spectroscopy studies also deliver essential messages regarding dynamic properties, amongst which the primary relaxation time plays the key role [46] (see the Appendix A). Figure 4 presents the re-analyzed experimental data, first introduced by the author in ref. [38], where the supercooled state of 5CB down to the glass temperature was reached. Such challenging target, in the non-oriented sample, required the special preparation of the sample, namely the deep cleaning leading to the very low electric conductivity (reached by the DC electric field action), deep degassing, and avoiding any ‘dust contaminations” due to operation only is a special lab hood. Particularly noteworthy was the design of the measurement capacitor (made from invar and gold-coated), avoiding any ‘edges’. To reduce the period of measurements in the non-equilibrium metastable state, tests were focused exclusively on the detection of the relaxation time. Experimental data are shown in the inset in Figure 4. The central part of the figure shows the proof for the preference of critical-like dynamics, however associated with the previtreous behavior and the glass transition.
The analysis presented in Figure 4 recalls patterns of dynamics developed for glass-forming systems. The preferred form of the description is revealed due to the application of the distortions-sensitive and derivative-based analysis via the transformation of experimental data introduced in ref. [32]:
Primary relaxation time →→—Activation Enthalpy .
The latter dependence results directly from the general super-Arrhenius (SA) relation, with the temperature-dependent activation energy [50,51,52]:
The direct application of Equation (11) for describing experimental data is not possible because of the unknown general form of evolution, and replacement relations have to be used. The most popular is the Vogel-Fulcher-Tammann (VFT) dependence [48]:
where and is the extrapolated VFT singular temperature. The amplitude . denotes the fragility strength coefficient.
Comparing Equations (11) and (12) one obtains for the VFT approximation . Notwithstanding, there is an extensive evidence for the limited fundamental validity of the VFT relation in supercooled liquids ([51,52] and refs therein). For liquid crystalline compounds the critical like dependence seems to offer the most reliable description [35,38]:
Comparing derivatives of the SA Equation (11) and the ‘critical’ Equation (13) one can show that in the domain where Equation (13) can be applied the following relation should obey for experimental data [32]:
where and the magnitude is for the (apparent) activation enthalpy.
The linear regression analysis for the linear domain found (see Figure 4) yields optimal values of parameters for Equation (13).
Figure 4 shows that in 5CB for the ultraviscous domain, the critical like description is associated with the power exponent . Notable that such behavior was predicted by Colby [49] within the so-called dynamic scaling model (DSM) and suggested as the universal pattern for supercooled glass-forming low-molecular-weight liquids and polymers. Unfortunately, this model-indication was finally not accepted and rejected check-in/out studies by other researchers [53]. However, the DSM-like scaling pattern seems to describe perfectly the primary relaxation time changes in rod-like liquid crystalline glass-formers on approaching the glass temperature [33,34].
It is well established experimentally and theoretically, within the mode-coupling theory (MCT), that the critical-like Equation (13) can also be applied in the high temperature ‘dynamical domain. Such MCT type behavior is associated with , , and the power exponent . Its ability to portray experimental data is expected for [33,34,50,51,52]. Exactly such MCT-type dynamics occur in the isotropic liquid phase of 5CB, as shown in Figure 4. Notably, the presence of the I-N transition manifests as a distortion visible from in the nematic phase to in the isotropic liquid phase.
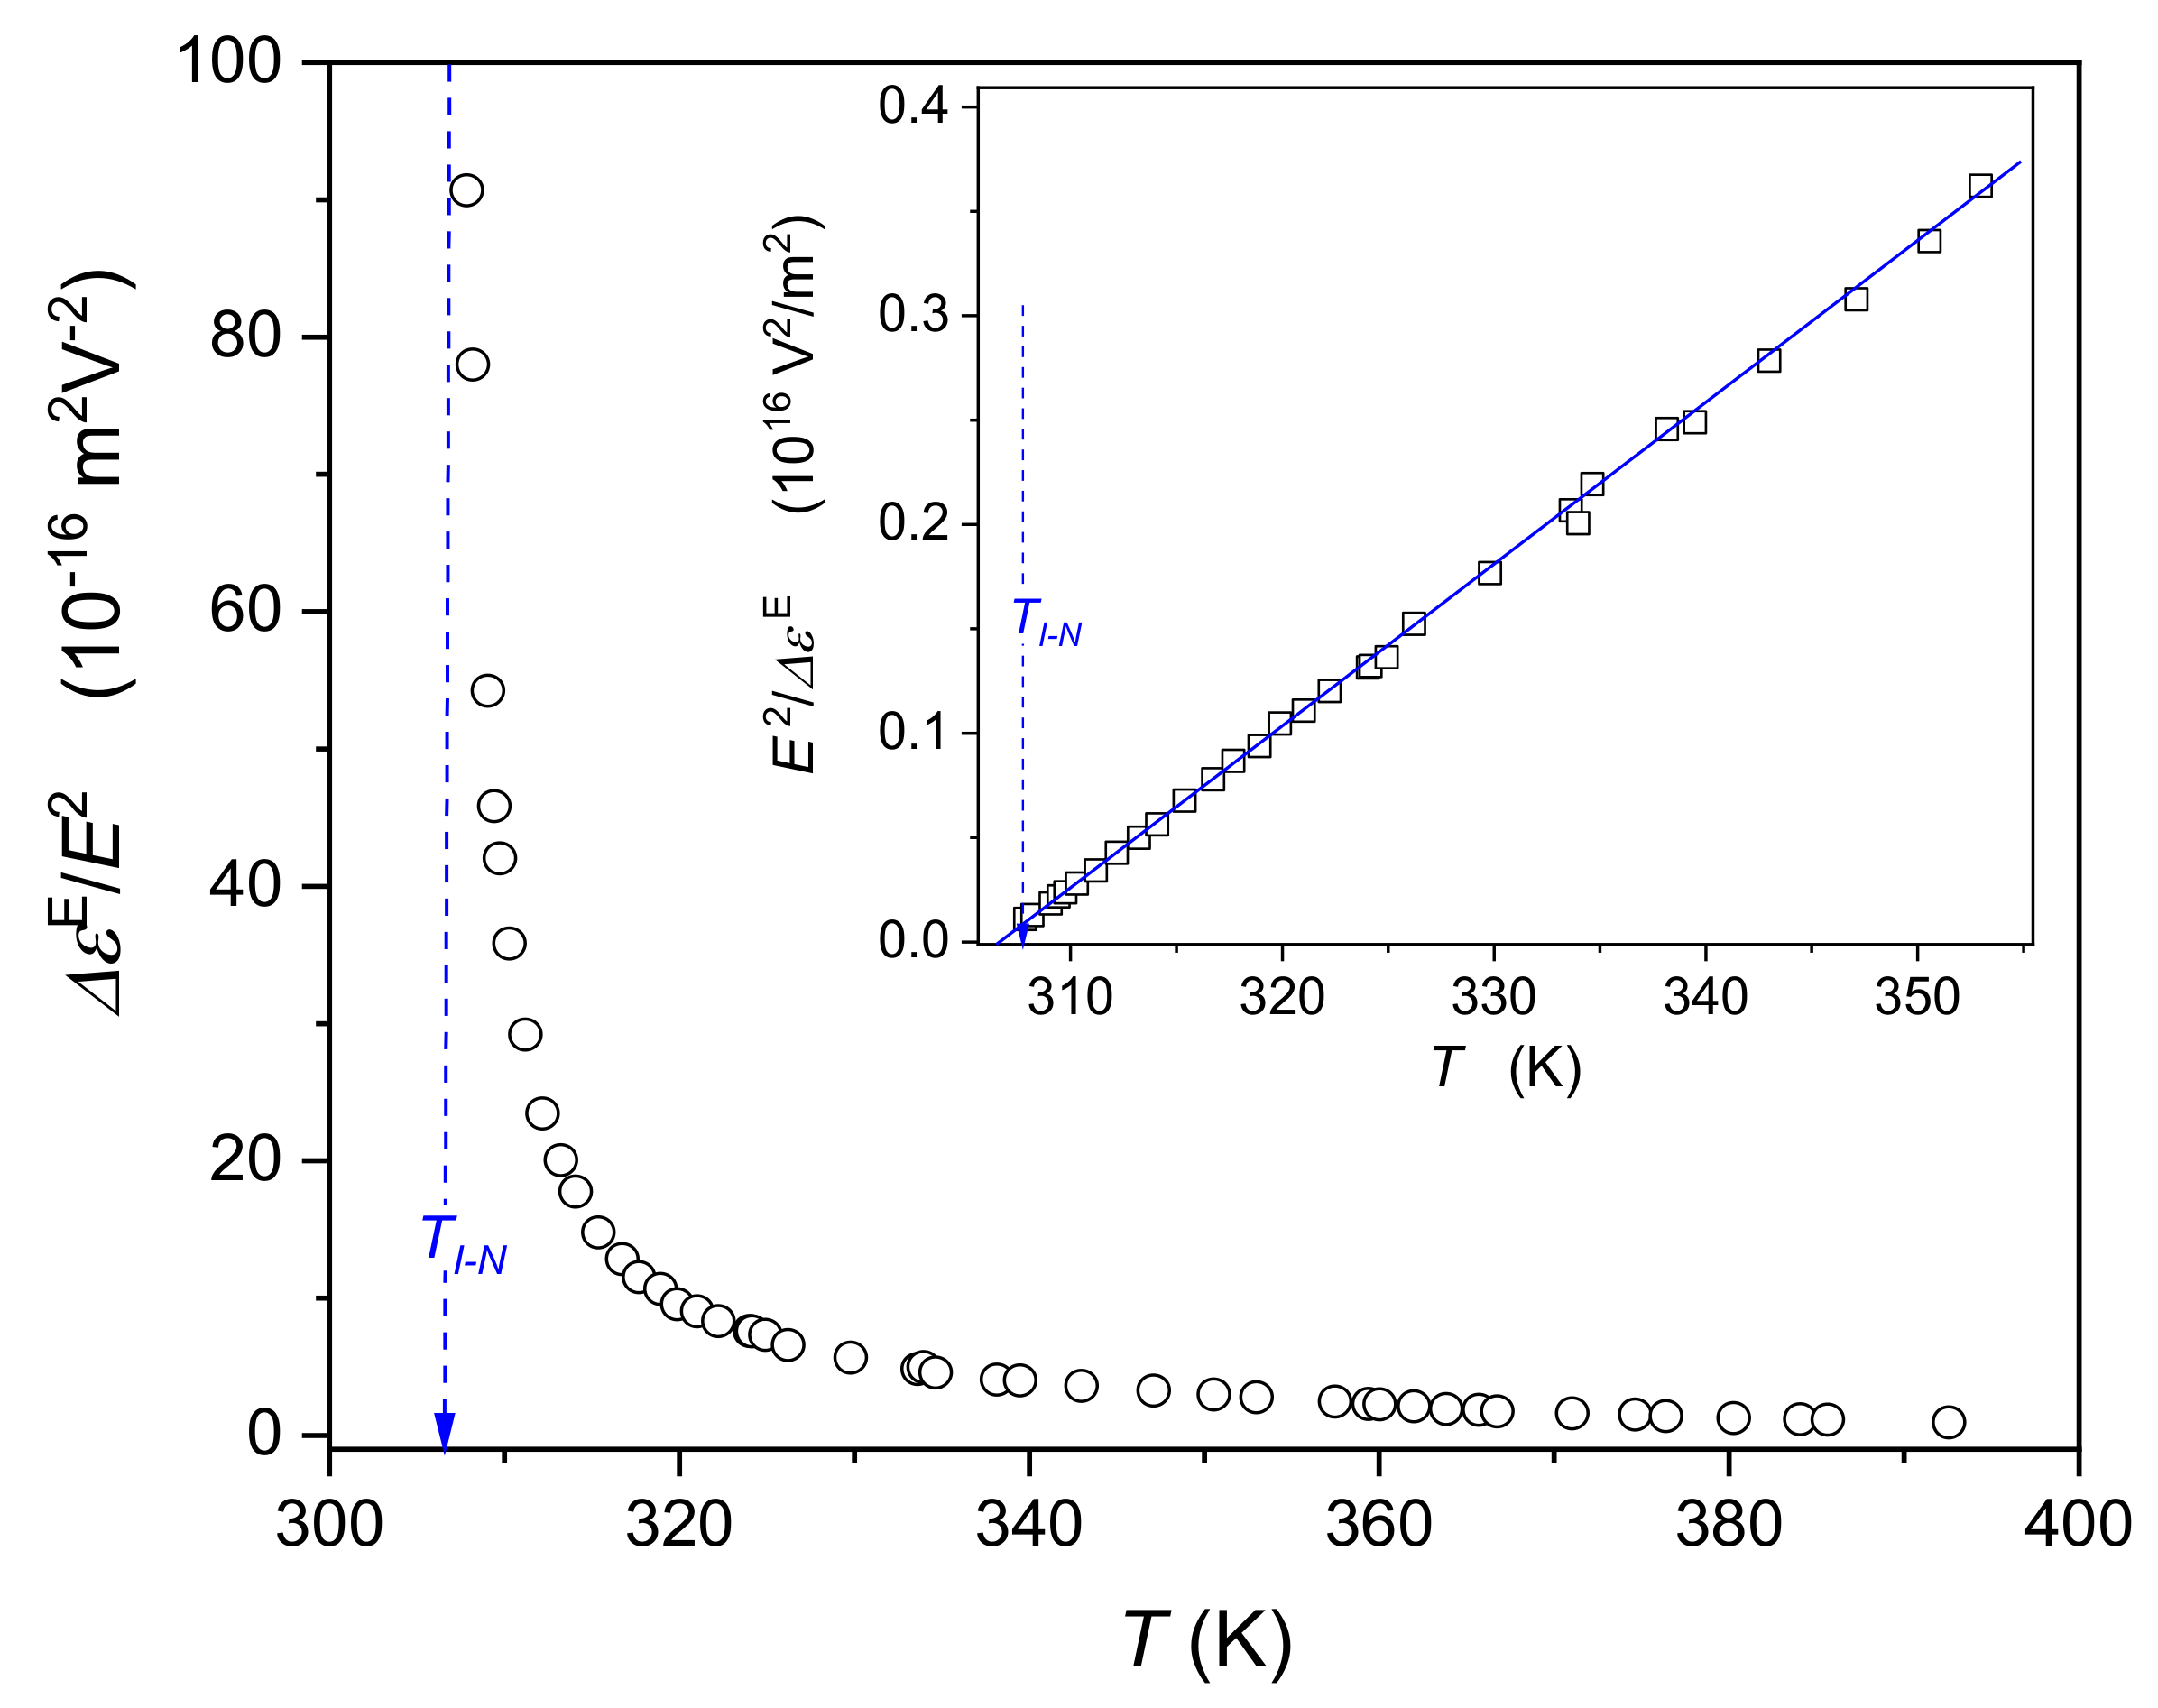
Figure 5 presents a strong electric field (E) related changes of dielectric constant—the nonlinear dielectric effect (NDE)—in the isotropic liquid phase. There are qualitatively different patterns for dielectric constant (the inset in Figure 1) and (Figure 5). This is associated with the fact that dielectric constant detects the averaged arrangement of permanent dipole moments. The definition of NDE directly suggests that in a ‘critical’ system, it registers the contribution solely from pretransitional/precritical fluctuations. Generally, this contribution is described by the relation [36,37,54]:
where the order parameter related susceptibility and for the mean square of the order parameter fluctuations: ; denotes here the critical temperature which for the case of 5CB can be associate with .
In the case of the isotropic phase of the nematic liquid crystal, the rod-like symmetry causes the increase of the number of neighbors what leads to the crossover to the mean-field type behavior for which generally the dimensionality d = 4 is required. For the tricritical case it reduces to d = 3 [22]. Hence, in the isotropic liquid phase: and , where is for the anisotropy of dielectric permittivity for the DC electric field and at the applied to measure radio-frequency. In the case of the low-frequency (LF) NDE [54,55]:
For the LF NDE the time-scale associated with the weak measuring field is qualitatively lower than the lifetime of pretransitional fluctuation, and then during one NDE measurement cycle the avere of few/several prenematic fluctuations is registered.
Results confirming the portrayal by the above relation is shown in Figure 5. Notable is the fair agreement with the temperature behavior for the Cotton–Mouton effect, Kerr effect, or the scattered light (Equation (1)) [1,2,3,4]. However, NDE is the only method for which the measurement frequency can be changed, which also leads to the possibility of the precise determination of for phase transitions not only to nematic but also to different smectic or cholesteric mesophases [55].
4. Discussion
Pentylcyanobiphenyl (5CB) is one of the most classical thermotropic, rod-like, liquid crystalline materials commonly considered as the model LC system and also widely used in applications [3,4,5,6]. It exhibits the simplest liquid crystalline mesophase–nematic, for which solely the spontaneous orientational ordering takes place. The discussion presented in the given report is based on dielectric studies, the research method particularly well focused on detecting unique features of LC materials [1,2,3,4,5,6]. Notably, that the analysis of experimental data explored the innovative distortions-sensitive and derivative-based approach what enabled to reduce or avoid factors, and consequently misleading conclusions [32]. New experimental studies in the isotropic liquid and in the nematic phase yielded clear evidence for exponents (specific heat-related values) and (order parameter related exponent). Such values indicate the tricritical nature [22] for the weakly discontinuous I-N transition in 5CB. One should stress that the tricritical-like description for dielectric constant obeys in the whole tested nematic phase, between and , as well as in the isotropic liquid phase.
It is often claimed that changes of dielectric tensor in the nematic phase are primarily the consequence of nematic ordering of molecules, and thus pretransitional fluctuations in the isotropic phase are also the consequence of that [2,3,4,5,6,12]. This ‘molecular approach’ means that dielectric properties are primarily described by the molecular analysis based on the Kirkwood-Froelich concepts, eventually extending by the Maier-Saupe (MS) model. This lead to dimers, trimers,… and to more complex as ‘cybotactic groups’ appearing in the LC material as the substitute of pretransitional (prenematic fluctuations) [3,4,56,57,58,59,60]. There are also claims that the observed weakly first-order nature of the N–I transition must be traced at the level of molecular interactions because just before the phase transition to the nematic phase the relaxation rate (linked to the relaxation time) strongly decreases from several 10 kHz down to a few kHz. In fact, such behavior is reported as the phenomenon extending in the temperature range [57,58,59]. The ‘molecular approach is also linked to the maximum of in the isotropic liquid phase observed at ca. as the particularly important reference point in explaining phenomena observer in the isotropic liquid phase [58,59].
Commenting on the discussion ‘molecular’ vs. ‘quasi-critical’ approach for describing dielectric properties of LC materials, the author would like to indicate the following issues:
- (i)
- (ii)
- The longest collective relaxations time associated with prenematic fluctuations in the isotropic liquid is equal and for the single-molecule related relaxation time primary relaxation time . This is associated with frequencies (‘relaxations rates’) ~ 1 MHz and ~20 MHz, respectively [38,61]. Values of relaxation rates associated with frequencies <10 kHz for which ‘special molecular processes’ in the immediate vicinity of the clearing temperature was suggested in refs. [57,58] can be expected for relaxation times occurying only in the nematic phase, for [62].
- (iii)
- Notable is the lack of the additional relaxation process emerging in the immediate vicinity of the clearing temperature in the isotropic phase, heuristically indicated in refs. [57,58,59]. This issue is discussed extensively in the Appendix A.
- (iv)
The vast majority of reports show a sharp, discontinuous, I-N transition and no ‘temperature stretching’ for the I-N transition is reported [1,2,3,4,19,28,31,33,38,39,40,41]. In fact, such ‘stretching’ means that the I-N ceases to be the discontinuous phase transition, against the recalled broad experimental evidence. Notwithstanding, such ‘stretched behavior’ can appear under the (very) strong electric field [3,63]—much higher than one used for NDE tests. It can also appear due to admixtures/impurities as the consequence of the biphasic region [22,64,65] between the isotropic liquid and the nematic phase, in ref. [57] the latter was declared to be absent. However, a definitive statement regarding the biphasic region is possible only after supplementary visual observations [64,65].
One can add here that the ‘quasi—(tri)critical’ approach does need poorly-defined ‘cybotactic’ groups [1,2,3]. It can explain and describe in a consistent way, temperature evolutions of dielectric constant, nonlinear dielectric effect, Kerr Effect, Cotton-Mouton effect, (see above). Finally, the ‘quasi-critical’ scenario explains the isomorphism of the pretransitional behavior observed in studies as the function of temperature and pressure [66,67,68,69,70]. Notable, that evolutions of in the isotropic liquid and , , in the nematic are completely described, be ‘quasi-critical’ relations. Their changes on approaching the I-N transition, or rather and singular temperatures, can be well explained by prenematic (isotropic liquid phase) or pre-isotropic (nematic phase) fluctuations which correlation length (and the volume occupied by them in the sample) and the lifetime increase according to relations [22,41]:
and
where is for the isotropic liquid related extrapolated temperature of the hypothetical continuous phase transition () and denotes the nematic phase-related extrapolated temperature of the hypothetical continuous phase transition ()
Finally, worth addressing is the still popular [1,2,3,4] Haller relation [14]. It assumes the clearing temperature as the reference Equations (4) and (5), instead of the temperature of the (hypothetical) continuous phase transition . This is the reason of the ‘strange and scattered’ values of the ‘exponent’ , which has to be influenced by the value of the discontinuity .
Regarding dynamics, it follows patterns developed for supercooled and glass-forming liquids. Notably, that this also covers non-supercooled domains within the nematic phase and isotropic liquid. Pretransitional fluctuations distort the glassy dynamics patterns only in the surrounding of . Supercooling of 5CB down to the glass transition is a challenging experimental task: usually, it crystallizes at [3,4]. However, also above Tm the dynamics exhibit the previtreous character associated with the glass transition hidden in the supercooled state at . These facts are worth stressing because, in basic monographs on the Physics of Liquid Crystals [1,2,3,4,5], the crucial role of and as origins of ‘far impact singularities’ governing key static and dynamic dielectric properties is omitted.
Author Contributions
The presented research results are related only to A.D.-R. The author have read and agreed to the published version of the manuscript.
Funding
This report was prepared due to the support of the National Centre for Science (NCN, Kraków, Poland) grant OPUS ref. 2017/25/B/ST3/02458.
Conflicts of Interest
The authors declare no conflict of interest.
Appendix A
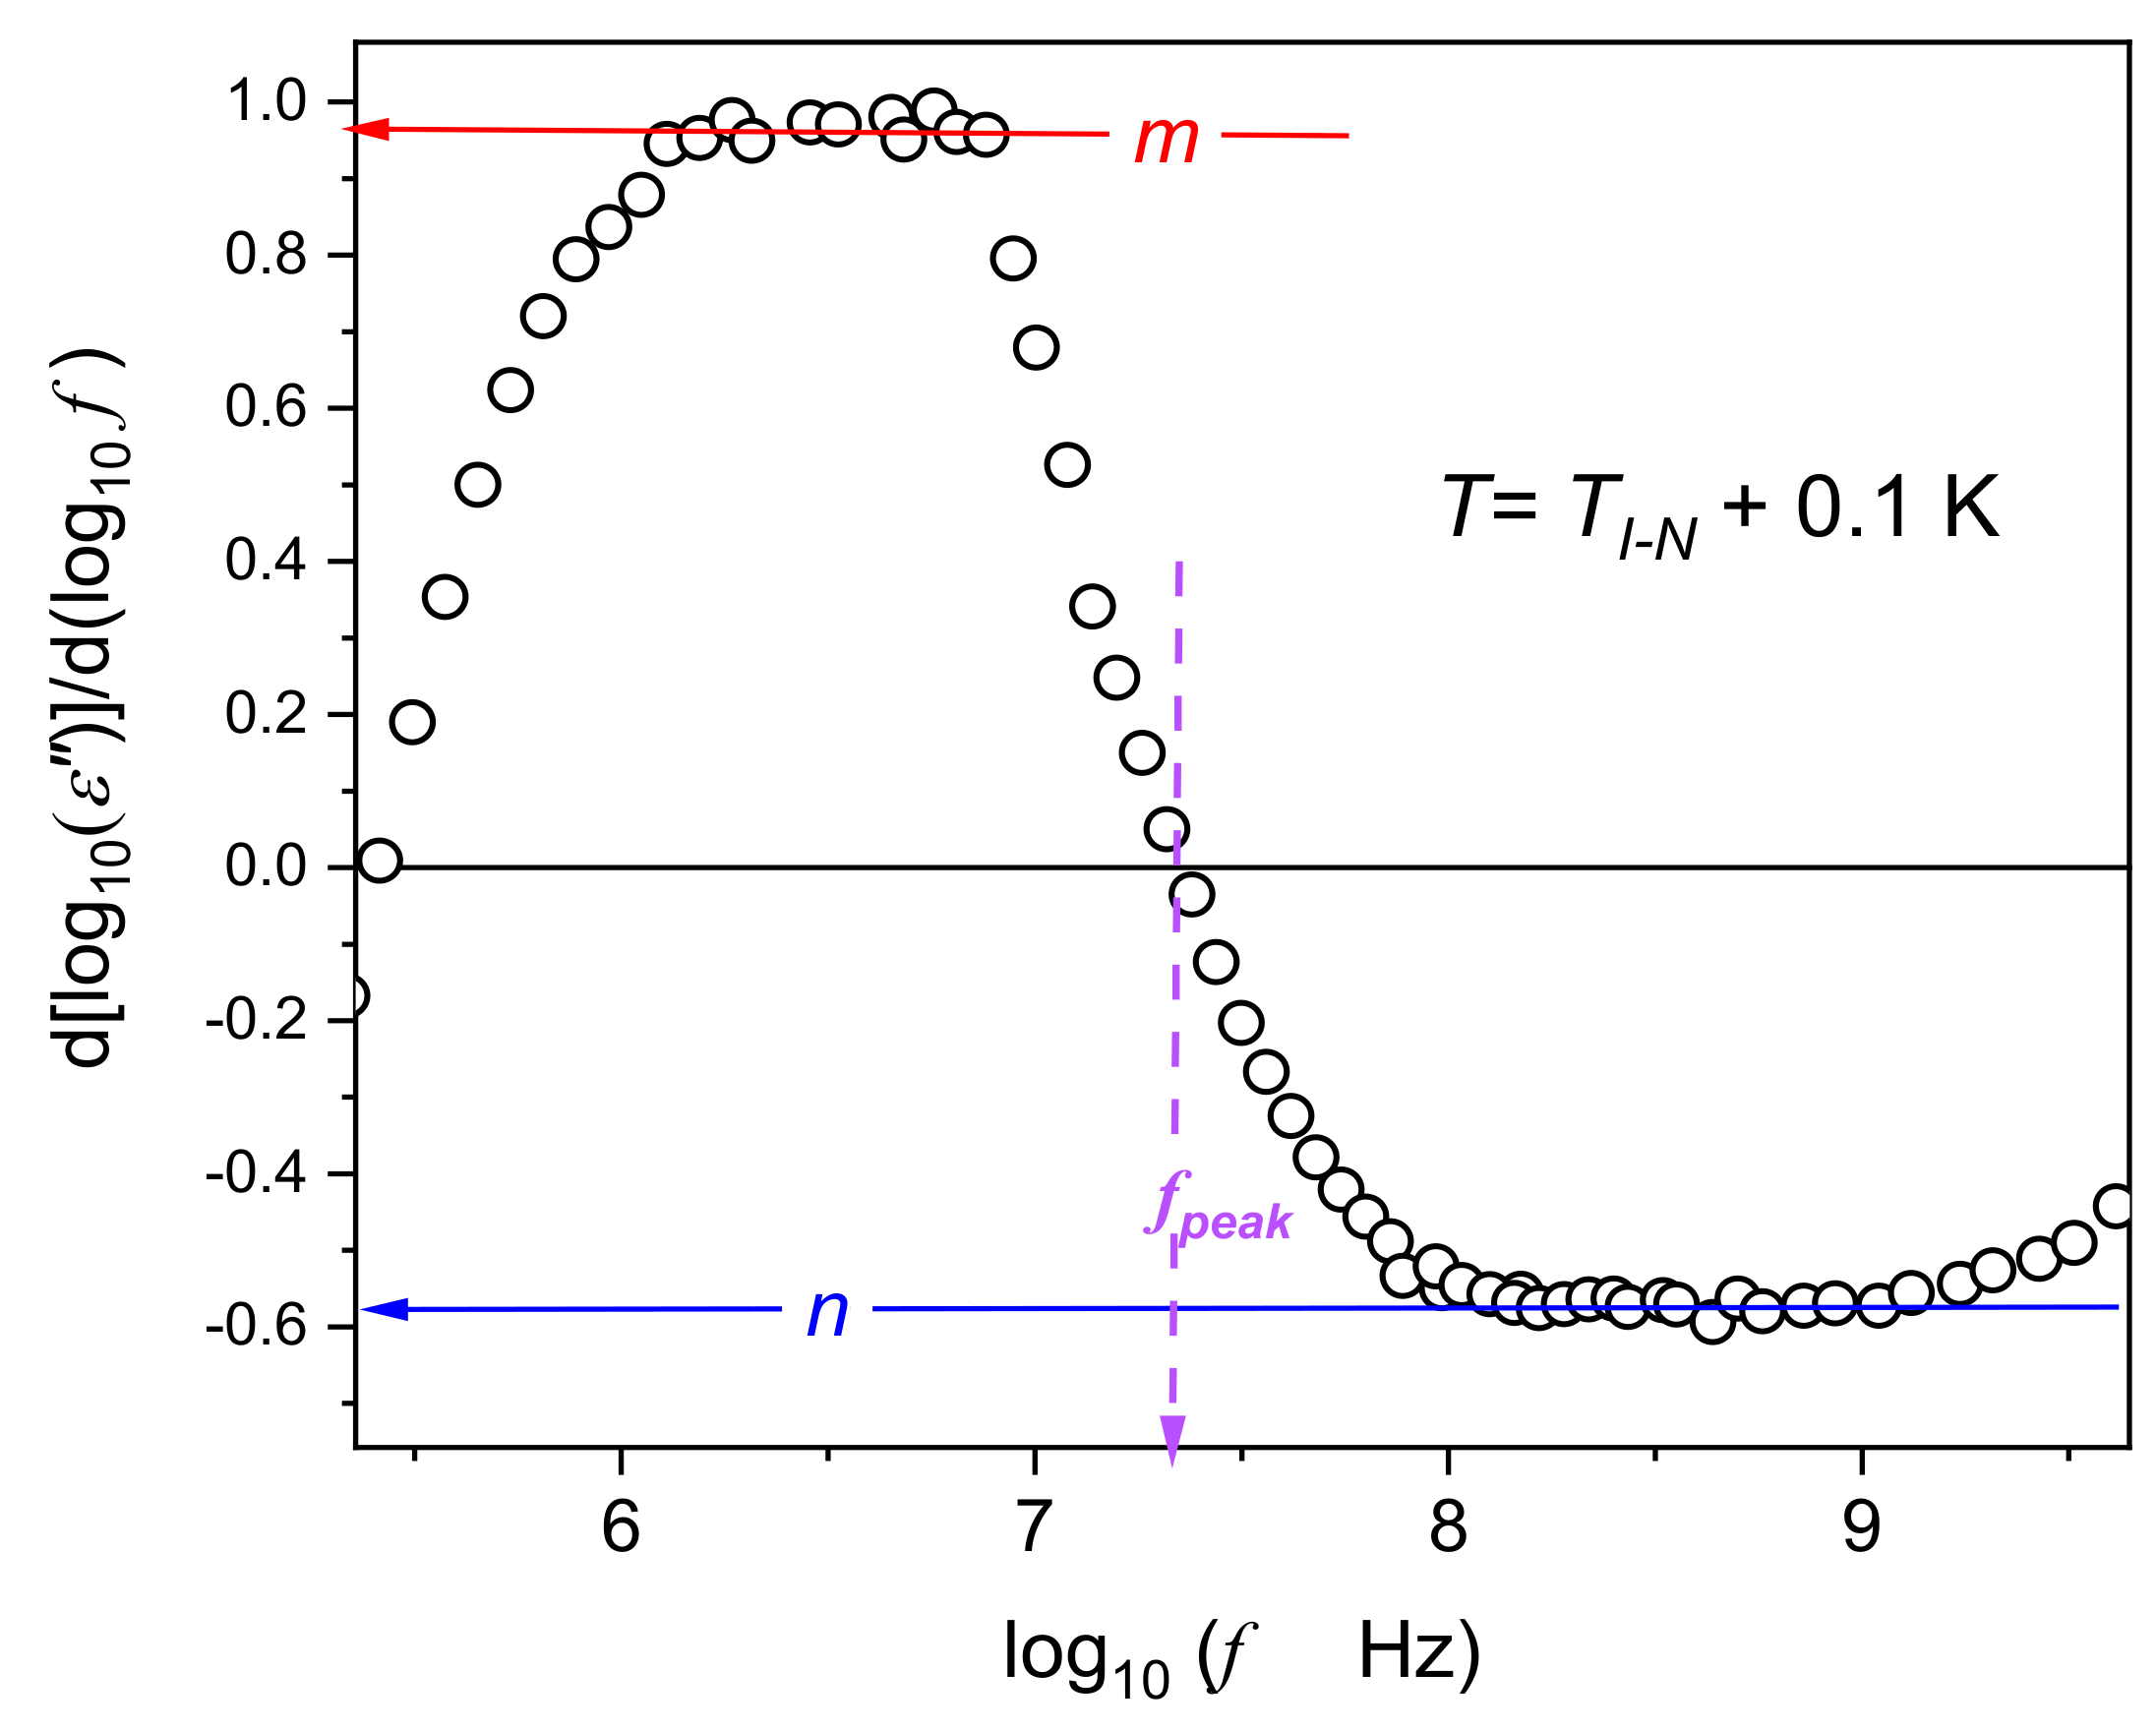
Figure A1 shows the evolution of the imaginary part of dielectric permittivity () in the isotropic liquid phase of 5CB. The spectrum consists of the primary relaxation loss curve and for the low-frequency domain—the ionic DC conductivity part. The applied log-log scale in the inset shows characteristic linear domains. For the primary relaxation curve, they are associated with the distribution of relaxation times for the high-frequency () and the low-frequency () parts of the primary loss curve. Such behavior was first indicated in ref. [71]:
Exponents/coefficients m and n describe the distribution of relaxation times. The reference is related to the single relaxation time Debye process, for which . The DC electric conductivity is determined as .
Figure A1.
Changes of the imaginary part of dielectric permittivity in the isotropic liquid phase of 5CB. The inset shows experimental data in the log-log scale to visualize the Jonsher scaling (Equations (A1) and (A2)). The same data are presented in the semi-log scale in the central part of the figure, to show the temperature evolution of the height of the loss curve maximum, which follows Equation (A3). The primary (alpha, structural) relaxation time is determined from the primary loss curve frequency via the condition .

The central part of the plot is given in the semi-log scale, to show the temperature dependence of the loss curve peak height. It is described by the relation resembling Equation (7), for the pretransitional anomaly of dielectric constant, namely:
Notable that in Figure A2, only a single relaxation process is visible, also near the clearing temperature. An additional (absent) relaxation process should manifest as the deformation of the primary loss curve. The lack of such extra-process confirms the distortions sensitive and derivative-based plot shown in Figure A2. Namely, recalling Equations (A1) and (A2) one obtains:
The scenario based on Equations (A4) and (A5) offer a reliable way of determining the values of the distribution coefficients m and n. It also provides a precise estimation of the peak frequency, coupled to the primary relaxation time:
Figure A2.
The derivative-based and distortions-sensitive analysis of the primary relaxation loss curve (Equations (A4)–(A6)) in the isotropic phase of 5CB, the immediate vicinity of the clearing temperature. The plot explores experimental data from Figure A1. Notable is the clear manifestation of the Jonsher’s scaling (Equations (A1)–(A4)), although in a limited range of frequencies. There are no hallmarks of an additional relaxation process.

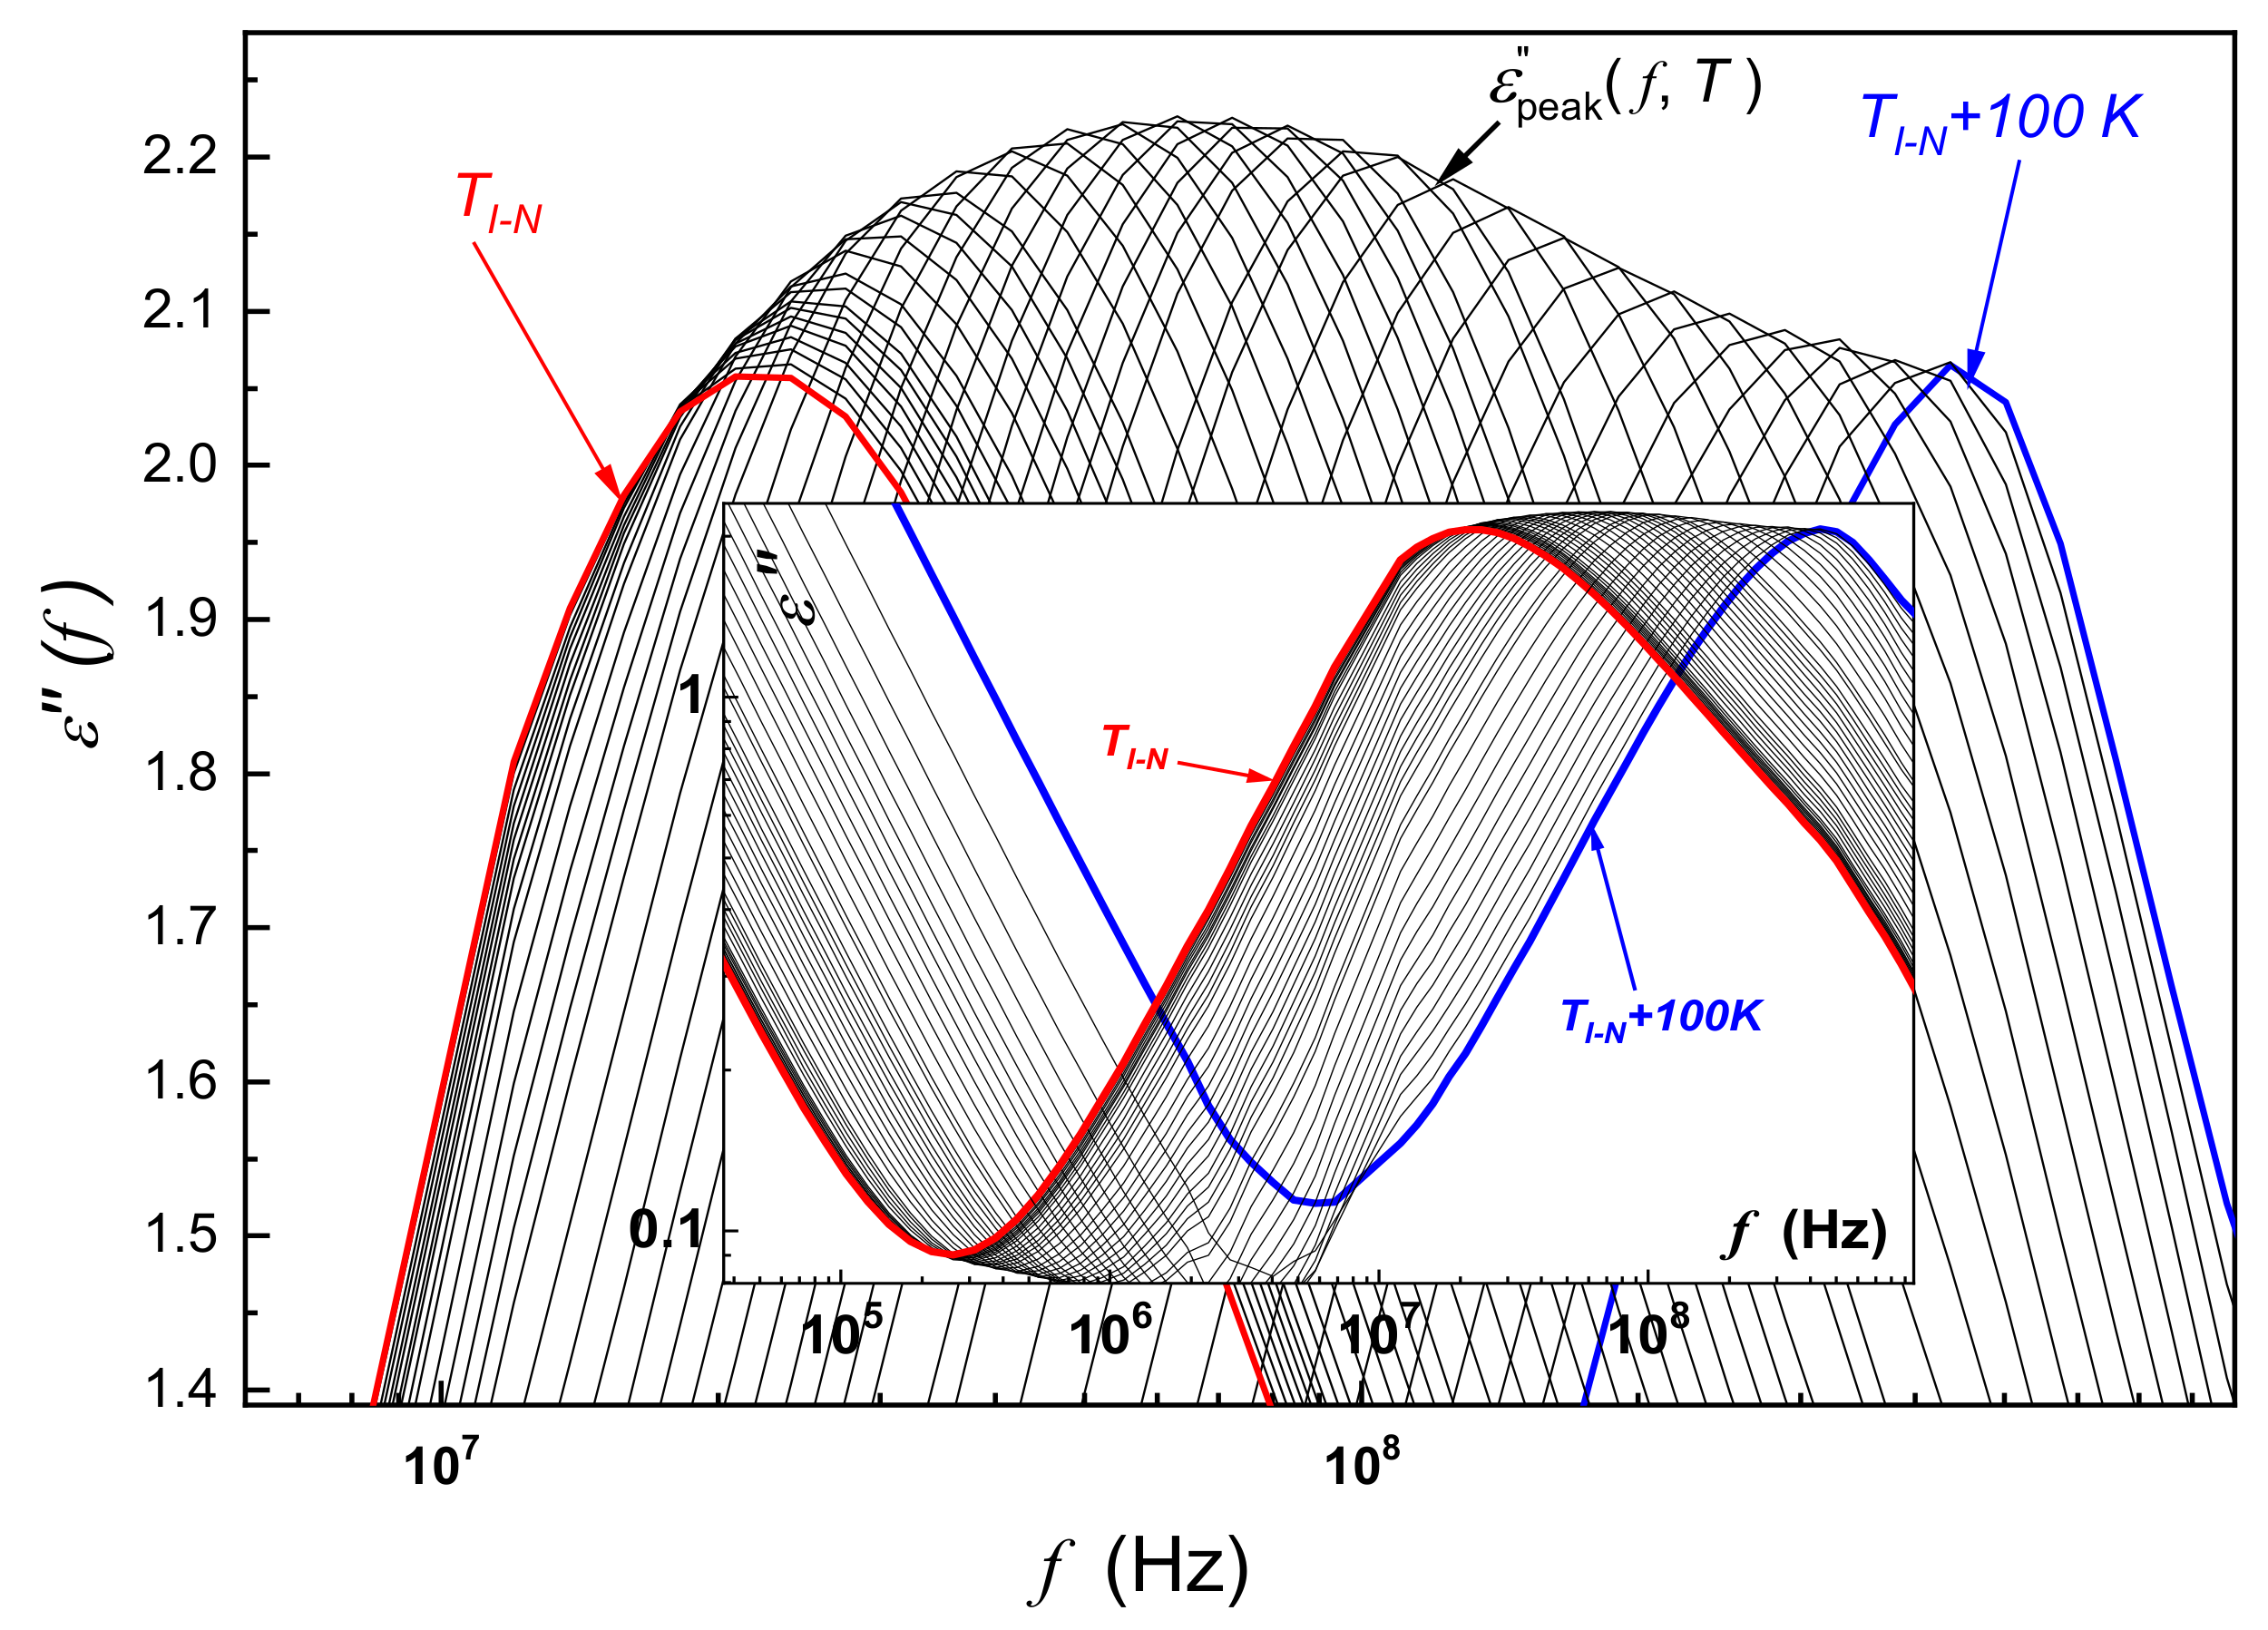
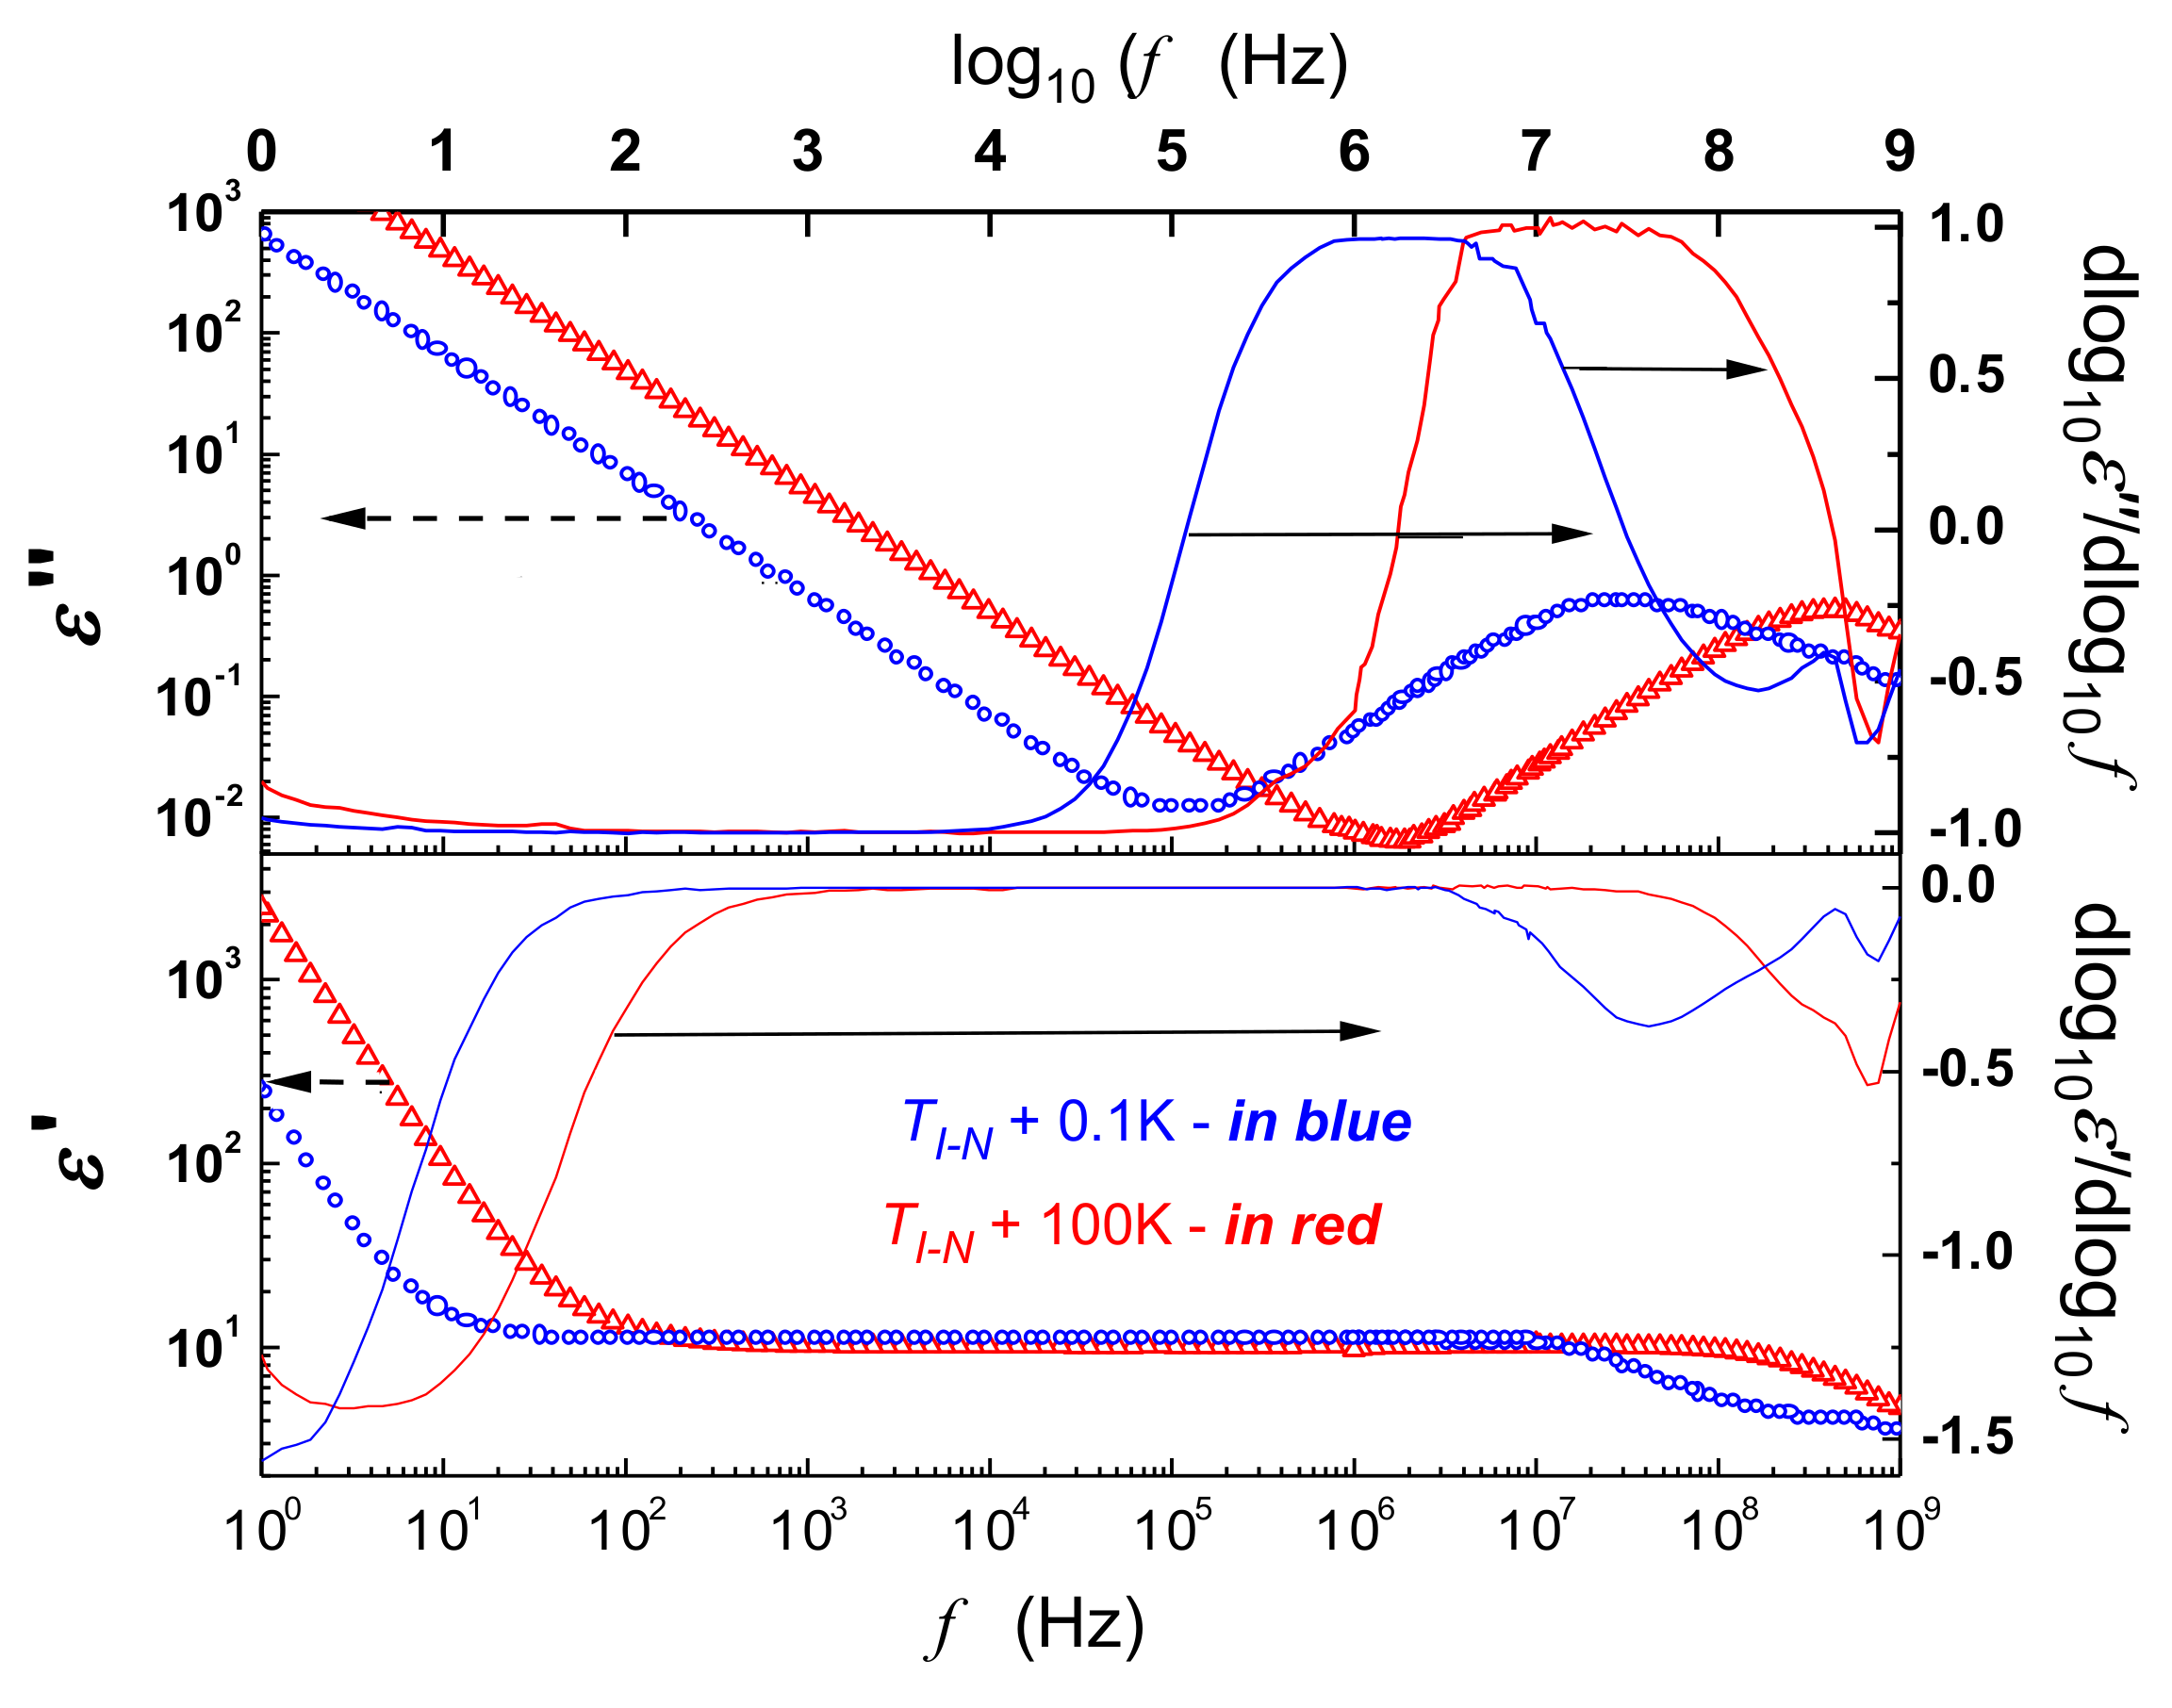
The above discussion is focused on the primary relaxation process. The insight into the spectrum of the real () and imaginary () parts of dielectric permittivity, for the broad frequency range extending from 1 Hz to 1 GHz, is shown in Figure A3. The focus of these studies is searching for relaxation phenomena in the range 10 kHz–1 KHz suggesting in the immediate vicinity of the clearing temperature in refs. [57,58,59]
Figure A3.
Broadband dielectric spectra for the real and imaginary parts of the dielectric permittivity spectrum in the isotropic liquid phase of 5CB. The tested range of frequencies extends from () to (). Results are for the immediate vicinity of the I-N clearing temperature (blue) and remote from the I-N discontinuous phase transition (red). For data horizontal parts are for the frequency-independent dielectric constant . To reveal subtle features of spectra results of the derivative analysis of experimental data are also presented (solid curves, the right scale). Links between results/data and the left & right scales are indicated by arrows.

Results presented in Figure A3 are for (blue) and (red). The picture contains experimental data (left scale) and their derivatives (right scale). The latter can reveal even subtle feature of detection processes. Regarding the real part of dielectric permittivity, the horizontal section is for dielectric constant where the frequency shift does not change the value of . The distortions-sensitive derivative analysis of experimental data in the lower part of the plot (the right scale, solid curve) shows that in the immediate vicinity of the clearing temperature, the static domain extends from ca. from to . Only for lower frequencies, the gradual impact of ionic impurities becomes more significant.
The results presented in the upper part of Figure A3 shows that for lower frequencies follows only the DC-conductivity related pattern, i.e., . Such behavior is additionally confirmed by the derivative-based and distortions-sensitive analysis (solid curves, the right scale). In the immediate vicinity of it extends from ca. down to even .
Concluding, results presented above show no hallmarks of an additional low-frequency relaxation process in the range between 10 KHz and 1 kHz, indicated in the immediate vicinity of the I-N clearing temperature in ref. [57].
References
- de Gennes, P.G. The Physics of Liquid Crystals; Oxford University Press: Oxford, UK, 1974. [Google Scholar]
- Chandrasekhar, S. Liquid Crystals; Cambridge: New York, NY, USA, 1992. [Google Scholar]
- Demus, D.; Goodby, J.; Gray, G.W.; Spiess, H.-W.; Vill, V. Handbook of Liquid Crystals; Wiley-VCH: Weinheim, Germany, 1998. [Google Scholar]
- Collings, P.J.; Goodby, J.W. Introduction to Liquid Crystal. Chemistry and Physics; CRC Press: Boca Raton, FL, USA, 2020. [Google Scholar]
- Selinger, J.V. Introduction to the Theory of Soft Matter. From Ideal Gases to Liquid Crystals; Springer: Berlin, Germany, 2015. [Google Scholar]
- Castellano, J.A. Liquid Gold. The Story of Liquid Crystals Displays and the Creation of an Industry; World Sci. Pub.: Singapore, 2005. [Google Scholar]
- Hirst, L.S.; Chiras, G. Liquid crystals in living tissue. Nature 2017, 544, 164–165. [Google Scholar] [CrossRef] [PubMed]
- Chen, R.H. Liquid Crystal Displays. Fundamental Physics and Technology; Wiley: Hoboken, NJ, USA, 2011. [Google Scholar]
- Guo, D.-Y.; Chen, C.-W.; Li, C.-C.; Jau, H.-C.; Lin, K.-H.; Feng, T.-M.; Wang, C.-T.; Bunning, T.J.; Khoo, I.C.; Lin, T.-H. Reconfiguration of three-dimensional liquid-crystalline photonic crystals by electrostriction. Nat. Mat. 2020, 19, 94–101. [Google Scholar] [CrossRef] [PubMed]
- de Gennes, P.G. Phenomenology of short range order effect in the isotropic phase in nematic materials. Phys. Lett. A 1969, 30, 454–455. [Google Scholar] [CrossRef]
- Vertogen, G.; de Jeu, W.H. Thermotropic Liquid Crystals. Fundamentals; Springer: Berlin, Germany, 2012. [Google Scholar]
- Dunmur, D.A.; Fukuda, A.; Luckhurst, R. Physical Properties of Liquid Crystals: Nematics; INSPEC (Independent and Reliable Product Testing): London, UK, 2000. [Google Scholar]
- Ranjkesh, A.; Moghadam, M.; Choi, J.-C.; Kim, B.; Ko, J.H.; Zakerhamidi, M.S.; Kim, H.-R. Physical model for temperature-dependent dielectric properties of anisotropic nematic liquid crystals. Phys. Chem. Chem. Phys. 2019, 20, 19294–19306. [Google Scholar] [CrossRef]
- Haller, I. Thermodynamic and static properties of liquid crystals. Prog. Solid State Chem. 1975, 10, 103–110. [Google Scholar] [CrossRef]
- Rasna, M.V.; Cmok, L.; Evans, D.R.; Mertelj, A.; Dhara, S. Phase transitions, optical, dielectric and viscoelastic properties of colloidal suspensions of BaTiO3 nanoparticles and cyanobiphenyl liquid crystals. Liq. Cryst. 2015, 42, 1059–1067. [Google Scholar] [CrossRef]
- Dhar, R.; Yadav, N.; Dąbrowski, R. Effect of alumina nanoparticles on dielectric permittivity, electrical conductivity, director relaxation frequency, threshold and switching voltages of a nematic liquid crystalline material. Liq. Cryst. 2014, 41, 1803–1810. [Google Scholar]
- Li, J.; Gauzia, S.; Wu, S.-T. High temperature-gradient refractive index liquid crystals. Opt. Express 2004, 12, 2002–2010. [Google Scholar] [CrossRef] [Green Version]
- Madhavi Latha, D.; Pisipati, V.G.K.M.; Pardhasaradhi, P.; Datta Prasad, P.V.; Venkata, R.D. Estimation of order parameter from different models in symmetric dimeric liquid crystals. Liq. Cryst. Today 2014, 23, 54–60. [Google Scholar] [CrossRef] [Green Version]
- Janik, M.; Rzoska, S.J.; Drozd-Rzoska, A.; Zioło, J. Pretransitional behavior in the isotropic phase of a nematic liquid crystal with the transverse permanent dipole moment. J. Chem. Phys. 2006, 124, 144907. [Google Scholar] [CrossRef]
- Starzonek, S.; Rzoska, S.J.; Drozd-Rzoska, A.; Czupryński, K.; Kralj, S. Impact of ferroelectric/superparaelectric nanoparticles on phase transitions and dynamics in nematic liquid crystal. Phys. Rev. E 2017, 96, 022705. [Google Scholar] [CrossRef] [PubMed] [Green Version]
- Drozd-Rzoska, A.; Starzonek, S.; Rzoska, S.J.; Kralj, S. Nanoparticle-controlled glassy dynamics in nematogen-based nanocolloids. Phys. Rev. E 2019, 99, 052703. [Google Scholar] [CrossRef] [PubMed]
- Anisimov, M.A. Critical Phenomena in Liquids and Liquid Crystals; Gordon and Breach, Reading: Boca Raton, FL, USA, 1992. [Google Scholar]
- Bradshaw, M.J.; Raynes, E.P. Pre-transitional effects in the electric permittivity of cyano-nematics. Mol. Cryst. Liq. Cryst. Lett. 1981, 72, 73–78. [Google Scholar] [CrossRef]
- Thoen, J.; Menu, G. Temperature dependence of the static relative permittivity of octylcyanobiphenyl (8CB). Mol. Cryst. Liq. Cryst. 1983, 97, 163–176. [Google Scholar] [CrossRef]
- Drozd-Rzoska, A.; Rzoska, S.J.; Zioło, J. Critical behaviour of dielectric permittivity in the isotropic phase of nematogens. Phys. Rev. E 1996, 54, 6452–6456. [Google Scholar] [CrossRef]
- Drozd-Rzoska, A.; Rzoska, S.J.; Zioło, J. Critical behavior of dielectric permittivity and nonlinear dielectric effect in the isotropic phase of nematogens. In Proceedings of the Liquid Crystals: Physics, Technology, and Applications, Zakopane, Poland, 3–8 March 1997; Volume 3318, pp. 218–222. [Google Scholar]
- Drozd-Rzoska, A.; Rzoska, S.J. Quasi-critical behaviour of “linear” and “nonlinear” dielectric permittivity in the isotropic phase of nematogens. Mol. Cryst. Liq. Cryst. 1999, 330, 25–29. [Google Scholar] [CrossRef]
- Sridevi, S.; Prasad, S.K.; Rao, D.S.S.; Yelamaggad, C.V. Pretransitional behaviour in the vicinity of the isotropic–nematic transition of strongly polar compounds. J. Phys. Condens. Matt. 2008, 20, 465106. [Google Scholar] [CrossRef]
- Jadżyn, J.; Świergiel, J.; Bauman, D.; Dąbrowski, R.; Czupryński, K.; Sokołowska, U. Pretransitional dielectric properties of nematogenic 4-cyano-phenyl-4’-n-heptylbenzoate. Phase Transit. 2009, 2009. 82, 409–419. [Google Scholar] [CrossRef]
- Sarvamangala, M.; Vijay Kumar, M.; Khene, S.M.; Basavaraj, S.D.; Shankar Rao, S.; Krishna Prasada, S. Anomalous dielectric behavior in the nematic and isotropic phases of a strongly polar–weakly polar binary system. Phase Transit. 2013, 86, 454–462. [Google Scholar] [CrossRef]
- Drozd-Rzoska, A.; Pawlus, S.; Rzoska, S.J. Pretransitional behavior of dielectric permittivity on approaching a clearing point in mixture of nematogens with antagonistic configurations of dipoles. Phys. Rev. E 2001, 64, 051701. [Google Scholar] [CrossRef]
- Drozd-Rzoska, A.; Rzoska, S.J. Derivative-based analysis for temperature and pressure evolution of dielectric relaxation times in vitrifying liquids. Phys. Rev. E 2006, 73, 041502. [Google Scholar] [CrossRef] [PubMed]
- Drozd-Rzoska, A. Heterogeneity-related dynamics in isotropic n-pentylcyanobiphenyl. Phys. Rev. E 2006, 73, 022501. [Google Scholar] [CrossRef] [PubMed]
- Drozd-Rzoska, A.; Rzoska, S.J.; Paluch, M. Universal, critical-like scaling of dynamic properties in symmetry-selected glass formers. J. Chem. Phys. 2009, 129, 184509. [Google Scholar] [CrossRef] [PubMed]
- Rzoska, S.J.; Drozd-Rzoska, A. Dual field nonlinear dielectric spectroscopy in a glass forming EPON 828 epoxy resin. J. Phys. Condens. Matt. 2011, 24, 035101. [Google Scholar] [CrossRef]
- Drozd-Rzoska, A.; Rzoska, S.J.; Martinez-Garcia, J.C. Nonlinear dielectric effect in supercritical diethyl ether. J. Chem. Phys. 2014, 141, 094907. [Google Scholar] [CrossRef]
- Rzoska, S.J.; Drozd-Rzoska, A.; Starzonek, S. Nonlinear Dielectric Effect in Critical Liquids. In Nonlinear Dielectric Spectroscopy; Richert, R., Ed.; Springer: Berlin Germany, 2018. [Google Scholar]
- Drozd-Rzoska, A. Glassy dynamics of liquid crystalline 4′-n-pentyl-4-cyanobiphenyl (5CB) in the isotropic and supercooled nematic phases. J. Chem. Phys. 2009, 130, 234910. [Google Scholar] [CrossRef]
- Drozd-Rzoska, A.; Rzoska, S.J.; Zioło, J.; Jadżyn, J. Quasi-critical behavior of the low-frequency dielectric permittivity in the isotropic phase of n-pentylcyanobiphenyl. Phys. Rev. E 2001, 63, 052701–052704. [Google Scholar] [CrossRef]
- Rzoska, S.J.; Zioło, J.; Sułkowski, W.; Jadżyn, J.; Czechowski, G. Fluidlike behavior of dielectric permittivity in a wide range of temperature above and below the nematic-isotropic transition. Phys. Rev. E 2001, 64, 052701. [Google Scholar] [CrossRef]
- Rzoska, S.J.; Drozd-Rzoska, A.; Mukherjee, P.K.; Lopez, D.O.; Martinez-Garcia, J.C. Distortions-sensitive analysis of pretransional behavior in n-octyloxycyanobiphenyl (8OCB). J. Phys. Cond. Matter 2013, 25, 245105. [Google Scholar] [CrossRef] [Green Version]
- Črešnar, D.; Kyrou, C.; Lelidis, I.; Drozd-Rzoska, A.; Starzonek, S.; Rzoska, S.J.; Kutnjak, Z.; Kralj, S. Impact of Weak Nanoparticle Induced Disorder on Nematic Ordering. Crystals 2019, 9, 171. [Google Scholar] [CrossRef] [Green Version]
- Naoito, H.; Yokoyama, Y.; Murakami, S.; Imai, M.; Okuda, M.; Sugimura, S.A. Dielectric Properties of Nematic Liquid Crystals in Low Frequency Regime. Mol. Cryst. Liq. Cryst. A 1995, 262, 249–255. [Google Scholar] [CrossRef]
- Chandel, V.S.; Manohar, S.; Shukla, J.P.; Manohar, R.; Prajapati, A.K. Low frequency dielectric relaxation and optical behaviour of a nematic liquid crystal 4-methyl n-(2′-hydroxy, 4′-n-hexadecyloxy)-azobenzene. Mater. Sci. Pol. 2012, 30, 290–296. [Google Scholar] [CrossRef]
- George, A.K.; Al Raii, T.A. Low Frequency Dielectric Relaxation Studies in the Nematic Phase of a Cyanobiphenyl Liquid Crystal. Int. J. Innov. Engn. Technol. 2019, 13, 1–5. [Google Scholar]
- Kremer, F.; Schoenhals, A. Broadband Dielectric Spectroscopy; Springer: Berlin, Germany, 2010. [Google Scholar]
- Götze, W.; Sjögren, L. The mode coupling theory of structural relaxations. J. Comp. Theor. Trans. 1995, 24, 801. [Google Scholar] [CrossRef]
- Donth, E.J. The Glass Transition: Relaxation Dynamics in Liquids and Disordered Materials; Springer: Berlin, Germany, 2001. [Google Scholar]
- Colby, R.H. Dynamic scaling approach to glass formation. Phys. Rev. E 2000, 61, 1783–1792. [Google Scholar] [CrossRef]
- Drozd-Rzoska, A.; Rzoska, S.J.; Pawlus, S.; Martinez-Garcia, J.C.; Tamarit, J.-L. Evidence for critical-like behavior in ultraslowing glass-forming systems. Phys. Rev. E 2010, 82, 03150. [Google Scholar] [CrossRef]
- Martinez-Garcia, J.C.; Rzoska, S.J.; Drozd-Rzoska, A.; Martinez-Garcia, J.A. Universal description of ultraslow glass dynamics. Nat. Comm. 2013, 4, 1823–1832. [Google Scholar] [CrossRef] [Green Version]
- Martinez-Garcia, J.C.; Rzoska, S.J.; Drozd-Rzoska, A.; Martinez-Garcia, J.; Mauro, J.C. Divergent dynamics and the Kauzmann temperature in glass forming systems. Sci. Rep. 2014, 4, 5160. [Google Scholar] [CrossRef] [Green Version]
- Richert, R. Scaling vs. Vogel–Fulcher-type structural relaxation in deeply supercooled materials. Physica A 2000, 287, 26–36. [Google Scholar] [CrossRef]
- Rzoska, S.J. Kerr effect and nonlinear dielectric effect on approaching the critical consolute point. Phys. Rev. E 1993, 48, 1136–1143. [Google Scholar] [CrossRef]
- Drozd-Rzoska, A.; Rzoska, S.J.; Czupryński, K. Phase transitions from the isotropic liquid to liquid crystalline mesophases studied by linear and nonlinear” static dielectric permittivity. Phys. Rev. E 2000, 61, 5355–5360. [Google Scholar] [CrossRef] [PubMed]
- de La Fuente, M.R.; Dunmurr, D. Dielectric properties of liquid crystals. In Liquid Crystals pp Fundamentals; Goodby, J.W., Collings, P.J., Kato, T., Tschierske, C.H., Gleeson, F., Raynes, P., Eds.; VCH-Wiley: Weinhem, Germany, 2014. [Google Scholar]
- Wolarz, E.; Bauman, D.; Jadżyn, J.; Dąbrowski, R. Prenematic self-assembling of mesogenic molecules in isotropic liquid and orientational order in nematic phase. Acta Phys. Polon. A 2011, 120, 447–452. [Google Scholar] [CrossRef]
- Jadżyn, J.; Sokołowska, U.; Déjardin, J.L. Temperature behavior of the electric field-induced entropy increment within a homologous series of nematogenic compounds. J. Phys. Chem. B 2008, 112, 9050. [Google Scholar]
- Ginovska, M.; Czechowski, G.; Dejardin, J.-L.; Jadżyn, J.; Hellemans, L. Static and dynamic dielectric effects of the isotropic to nematic transition in 7CB. Liq. Cryst. 2005, 32, 625–631. [Google Scholar] [CrossRef]
- Bauman, D.; Jadżyn, J.; Wolarz, E.; Modlińska, A.; Dąbrowski, R. Dielectric and orientational properties of nematogenic 4-n-octyl(4’-cyanophenyl)benzoate. Opto-Electron. Rev. 2010, 78, 68–70. [Google Scholar] [CrossRef]
- Drozd-Rzoska, A.; Rzoska, S.J.; Paluch, M.; Pawlus, S.; Ziolo, J.; Santangelo, P.G.; Roland, C.M.; Czupryński, K.; Dąbrowski, R. Mode coupling behavior in glass-forming liquid crystalline isopentylcyanobiphenyl. Phys. Rev. E 2005, 71, 011508. [Google Scholar] [CrossRef] [Green Version]
- Brückert, T.; Urban, S.; Würflinger, A. Dielectric studies of octyloxy-cyanobiphenyl (8OCB) under high pressure. Ber. Bunsenges. Phys. Chem. 1996, 100, 1133–1137. [Google Scholar]
- Nicastro, A.J.; Keyes, P.H. Electric-field-induced critical phenomena at the nematic-isotropic transition and the nematic-isotropic critical point. Phys. Rev. A 1984, 30, 3156–3160. [Google Scholar] [CrossRef]
- Rzoska, S.J.; Zioło, J. The nonlinear dielectric effect applied to study the pretransitional effects in the isotropic phase of the MBBA-benzene solutions. Acta Phys. Polon. A 1990, 78, 915–919. [Google Scholar]
- Rzoska, S.J.; Zioło, J. Critical properties in the vicinity of the critical consolute point for the 4-methoxybenzylidene-4′butylaniline-isooctane solution. Liq. Cryst. 1992, 11, 9–14. [Google Scholar] [CrossRef]
- Drozd-Rzoska, A.; Rzoska, S.J.; Zioło, J. The quasi-critical behavior of dielectric permittivity in the isotropic phase of smectogenic n-cyanobiphenyls. Phys. Rev. E 2000, 61, 5349–5354. [Google Scholar] [CrossRef] [PubMed]
- Drozd-Rzoska, A.; Rzoska, S.J.; Zioło, J. High pressure studies of the low-frequency nonlinear dielectric effect in the isotropic phase of octyl- and dodecyl-cyanobiphenyls. Phys. Rev. E 1997, 55, 2888–2891. [Google Scholar] [CrossRef]
- Drozd-Rzoska, A.; Rzoska, S.J.; Zioło, J. The fluidlike and critical behavior of the isotropic–nematic transition appearing in linear and nonlinear dielectric studies. Acta. Phys. Polon. 2000, 98, 431–437. [Google Scholar]
- Drozd-Rzoska, A.; Rzoska, S.J.; Zioło, J.; Czupryński, K. Temperature and pressure studies of the isotropic–mesophase transitions discontinuity by static nonlinear dielectric effect. Mol. Cryst. Liq. Cryst. 2001, 366, 2173–2177. [Google Scholar] [CrossRef]
- Rzoska, S.J.; Mukherjee, P.K. The influence of pressure on isotropic–smectic A transition. Phys. Rev. E 2002, 65, 051705. [Google Scholar]
- Jonsher, A.K. The universal dielectric response. Nature 1977, 267, 673–675. [Google Scholar]
Figure 1.
The temperature evolution of dielectric constant () in the isotropic liquid and nematic mesophases of pentylcyanobiphenyl (5CB). In the nematic phase, components related to the long () and short-axis () of the rod-like molecule are shown. The evolution of the mean dielectric permittivity in the nematic phase is calculated via the relation [1,2,3]. Pretransitional anomalies in the isotropic liquid and for the mean in the nematic region are described by Equations (6)–(8). The inset shows the ‘focused’ pretransitional effect in the isotropic liquid phase. Experimental data in blue are for the non-oriented sample: note supercooling well below the melting temperature .

Figure 2.
Results of the derivative-based analysis of the order parameter in the nematic phase of 5CB (see Equation (10). They strongly indicate the tricritical value of the order parameter exponent , well beyond the mean-field value exponent [3,22].

Figure 3.
The experimental temperature dependence of the low-frequency, ionic–related, behavior of the real part of dielectric permittivity in the isotropic phase of 5CB. As the ‘non-ionic’ reference dielectric constant for the frequency was assumed [39].
Figure 3.
The experimental temperature dependence of the low-frequency, ionic–related, behavior of the real part of dielectric permittivity in the isotropic phase of 5CB. As the ‘non-ionic’ reference dielectric constant for the frequency was assumed [39].

Figure 4.
The evolution of the primary relaxation time in pentylcyanobiphenyl (5CB), from the isotropic liquid down to the glass temperature (the inset). The central part of the plot shows results of the distortions-sensitive analysis (Equation (14)) focused on the validity of the critical-like behavior (Equation (13)), indicated by linear domains. The linear regression fits yield parameters for Equation (13) given in the plot. They are used for portraying via Equation (13) experimental data presented in the inset. The magnitude is for the normalized apparent activation enthalpy. MCT means ‘mode-coupling theory’ [47,48], and ‘DSM’ is for the ‘Dynamical Scaling Model’ [49]. These models are developed for glass-forming liquids in the high- and low-temperature dynamical domains. The glass temperature is estimated via the condition [48].

Figure 5.
Nonlinear dielectric effect (NDE), describing changes of dielectric constant under the strong electric field, in the isotropic liquid phase of 5CB. The inset shows the reciprocal of experimental data from the central part of the plot, revealing the form of temperature evolution (Equations (1) and (16)).

© 2020 by the author. Licensee MDPI, Basel, Switzerland. This article is an open access article distributed under the terms and conditions of the Creative Commons Attribution (CC BY) license (http://creativecommons.org/licenses/by/4.0/).
Share and Cite
MDPI and ACS Style
Drozd-Rzoska, A. ‘Quasi-Tricritical’ and Glassy Dielectric Properties of a Nematic Liquid Crystalline Material. Crystals 2020, 10, 297. https://doi.org/10.3390/cryst10040297
AMA Style
Drozd-Rzoska A. ‘Quasi-Tricritical’ and Glassy Dielectric Properties of a Nematic Liquid Crystalline Material. Crystals. 2020; 10(4):297. https://doi.org/10.3390/cryst10040297
Chicago/Turabian StyleDrozd-Rzoska, Aleksandra. 2020. "‘Quasi-Tricritical’ and Glassy Dielectric Properties of a Nematic Liquid Crystalline Material" Crystals 10, no. 4: 297. https://doi.org/10.3390/cryst10040297
Note that from the first issue of 2016, this journal uses article numbers instead of page numbers. See further details here.