Article

Characterising the Influence of First-Year Wheat Cultivar on Pseudomonas Selection and Function in a Take-All Infected Field

1
School of Biological Sciences, University of Reading, Whiteknights, Reading RG6 6AJ, UK
2
School of Biosciences and Birmingham Institute of Forest Research, University of Birmingham, Edgbaston, Birmingham B15 2TT, UK
3
NIAB Cambridge, Cambridge CB3 0LE, UK
4
Soil Research Centre, School of Archaeology, Geography, and Environmental Science, University of Reading, Whiteknights, Reading RG6 6AB, UK
5
Protecting Crops and the Environment, Rothamsted Research, Harpenden AL5 2JQ, UK
6
John Innes Centre, Norwich Research Park, Norwich NR4 7UH, UK
7
Sustainable Soils and Crops, Rothamsted Research, Harpenden AL5 2JQ, UK
*
Author to whom correspondence should be addressed.
Crops 2023, 3(3), 195-208; https://doi.org/10.3390/crops3030019
Submission received: 8 May 2023 / Revised: 25 June 2023 / Accepted: 29 June 2023 / Published: 13 July 2023

Abstract

:
Wheat, the world’s most widely cultivated crop, is highly susceptible to Take-all disease caused by the soil ascomycete fungus Gaeumannomyces tritici (Gt). Crop rotations using different wheat cultivars can influence Take-all build up (TAB) in the following year’s wheat crop. The exact mechanism for this is unknown, but there may be a bacterial biocontrol component associated with TAB control. We cultured and characterised Pseudomonas isolates from the rhizosphere and endosphere of second-year field-grown wheat, in plots which, in the previous season, had been used to culture High-TAB cultivar Hereward or Low-TAB cultivar Cadenza. Analysis of two bacterial loci, wsm and fecB, showed that these genes were significantly and differentially associated with first-year wheat-planting regime: wsm was more abundant within the High-TAB Hereward-derived isolates, while fecB was more prevalent within the Low-TAB Cadenza-derived isolates. These findings were supported by a gyrB phylogenetic analysis and an in vitro Gt antagonism assay. These data show that the wheat cultivar grown in the first year plays an especially important role in the selection of the associated Pseudomonas spp. found in the second-season wheat-root environment, emphasising the importance of understanding agronomic practice in improving plant health and food security.

1. Introduction

Bread wheat, Triticum aestivum, is one of the four most important crops globally. Wheat is highly susceptible to Take-all disease, caused by the soil-borne ascomycete fungus Gaeumannomyces tritici (Gt). The disease causes huge economic losses in wheat crop yield and quality [1,2]. Currently, there are a lack of effective fungicide treatments and resistant cultivars to treat this disease. Historically, crop rotation using non-graminaceous species was used to manage Take-all disease [3]. Soil fumigation with methyl bromide has also been used for the control of Take-all disease, but this chemical is now banned due to its negative effects on the environment and human health [4,5]. However, given the great demand for wheat and the lack of economically attractive break crops, wheat is commonly grown in short rotations, resulting in the increased establishment of Take-all disease and associated crop losses. As such, there is a great need to establish alternative practices, which includes biological control approaches for tackling plant diseases.
Take-all decline occurs after a severe outbreak of the disease in very susceptible wheat or barley monoculture fields, which ultimately leads to reduced disease severity in subsequent wheat [1,4]. The disease suppression is thought to be achieved by a build-up in antagonistic microorganisms [6], such as populations of fluorescent Pseudomonas spp. [7]. Pseudomonas spp. are bacteria that colonise the root environment of many different plant species and can enhance plant growth via the secretion of molecules such as iron-scavenging siderophores as well as anti-fungal compounds such as phenazine, pyoluteorin and pyrrolnitrin, along with hydrogen cyanide, a volatile metalloenzyme inhibitor [7,8,9]. Pseudomonas spp. such as P. aureofaciens and P. chlororaphis produce phenazine-1-carboxylic acid (PCA) and derivatives such as 2-hydroxyphenazine-1-carboxylic acid and phenazine-1-carboxamide, respectively, as they have additional genes that modify PCA [10]. Pseudomonas chlororaphis YB-10 significantly promoted the growth of wheat seedlings via indole acetic acid and siderophore production and increased activities of the wheat defence-related enzymes [9]. Control of Take-all disease by P. fluorescens 2-79 and P. fluorescens CHAO was achieved via the production of PCA and 2,4-diacetylphloroglucinol (Phl), respectively [11]. KwakWeller [4] reported that Take-all decline was achieved after a period of wheat monoculture due to an increase in the population of the antibiotic 2,4-Diacetylphloroglucinol (DAPG) producing fluorescent Pseudomonas spp. However, in another study, it was found that contrasting wheat cultivars displayed differential ability to tolerate root colonisation by DAPG-producing bacteria due to potential phytotoxicity [12]. Furthermore, McMillan [13] showed the differential ability of wheat cultivars to support Take-all build up (TAB). As such, cultivars were classified as either Low-TAB (L-TAB) or High-TAB (H-TAB). For example, Cadenza and Xi-19 are both L-TAB cultivars, while Hereward is a H-TAB variety. However, the molecular basis of this differential TAB trait is not known [14]. The H-TAB wheat variety Hereward supported a Pseudomonas spp. population with traits antagonistic to other bacteria. However, the L-TAB inoculum builder wheat variety Cadenza supported Pseudomonas spp. that were better adapted to host communication and nutrient acquisition [15].
In this work, we build on previous work by Mauchline [15] and test the hypothesis that wheat variety grown in the first year impacts the selection of root-associated Pseudomonas isolates in the second year of wheat cultivation. We test this by analysing the population diversity, Gt suppressive capacity as well as the presence or absence of gene loci associated with rhizosphere colonisation in Pseudomonas strains isolated from the roots of second-year wheat. We supplement this approach with in planta assays to demonstrate the efficacy of isolates to suppress Gt.

2. Materials and Methods

2.1. Sample Collection and Bacterial Isolation

A total of 411 Pseudomonas isolates were collected from the root systems of wheat plants from the second year of a two-year field trial run in 2010–2012 at the Rothamsted Research experimental farm, UK. The field design is fully described in Mauchline [15], and consisted of four main blocks each divided into two main plots, with Hereward and Cadenza grown in the first year (Table S1). In the second year, the two main plots were divided into 8 split plots, which were over-sown with a range of wheat cultivars, but only those plots over-sown with Hereward and Xi-19 were sampled (Table S2). As such, four replicates of four planting combinations were sampled: Hereward/Hereward (HH), Hereward/Xi19 (HX), Cadenza/Hereward (CH) and Cadenza/Xi19 (CX). Isolates were purified from the rhizosphere and endosphere of wheat plants as previously described by Mauchline [15], and this isolate collection forms the basis of the current study. Nineteen of these isolates were previously genome sequenced [15]. In total, 103 isolates were collected from CH, 116 from CX, 84 from HH and 108 from HX planting combinations. Furthermore, CH comprised 49 rhizosphere and 54 endosphere isolates; CX 59 rhizosphere and 57 endosphere isolates; HH 43 rhizosphere and 41 endosphere isolates; and HX 60 rhizosphere and 48 endosphere isolates.

2.2. Growth Conditions and Media

Pseudomonas bacteria were grown at 27 °C in King’s medium B broth (KB, for 16 h with shaking at 2000 rpm) or on agar plates (1.5% agar, King’s medium B, KBA) [16] for 48 h. The Gt isolate was grown on potato dextrose agar (PDA) (Oxoid) at 24 °C for seven days. For subsequent Gt assays, 0.5 cm agar plugs were taken from the hyphal leading edge and transferred to KBA plates.

2.3. In Vitro Gt Inhibition Studies

Gaeumannomyces tritici (Gt) isolate 16-LH-15d, 16/6/17 used in this work was isolated from Long Hoos 4 field at Rothamsted. The plate inhibition assay was performed on KBA where 5 µL of an overnight bacterial culture was spotted 1 cm from the edge of the plate. Three bacteria were used per plate and a fourth spot used non-inoculated KB as a control. The spots were allowed to soak into the agar until dry before placing a 0.5 cm plug of Gt at the centre of the plate. Three replicates were prepared for each combination.
Using the average inhibition zone (cm) of the three treatment replicates, the isolates were classified into three classes of inhibition zone: Class 1 = 0–0.5 cm; class 2 = 0.5–1 cm; and class 3 = >1 cm. The class 3 isolates were then challenged in 1:1 setup with the fungus to validate their Gt growth-inhibiting activity. Again, 5 µL of bacterial culture was spotted 1 cm away from the edge of the plate with the fungal plug placed at the centre. A non-inoculated 5 µL of KB was spotted as a control, and each treatment was replicated three times. The plates were incubated at 24 °C and the distance between the edges of bacterial colonies and fungal mycelium after 7 days was computed using ImageJ software [17].

2.4. DNA Extraction

DNA template for PCR was prepared from bacterial colonies using a TE buffer extraction method. Briefly, 1 mL of bacterial broth from an overnight KB culture, prepared from a single colony, was transferred into an Eppendorf tube and centrifuged at 13,000 rpm for 3 min (Microfuge, SCF2, Stuart). The supernatant was discarded, and the pellets were re-suspended in 200 µL of TE buffer (1 M Tris HCl—0.5 M EDTA pH 8). After vortexing, the cell suspension was heated at 100 °C for 10 min on a heating block (Heat block, VWR Scientific). The tubes were chilled on ice for 10 min, followed by a second centrifugation (13,000 rpm for 3 min). The supernatant containing the DNA was then transferred to sterile tubes. Template DNA was either used immediately in a PCR or stored at −20 °C for later use.

2.5. PCR and DNA Sequencing

Primers for amplifying gyrB, phzCD, phl, wsm and fecB genes are shown in Table 1. The wsm and fecB primers were designed in this study using NCBI primer design tool; gyrB sequences were from Yamamoto [17], phl and phzCD sequences were from Raaijmakers [11]. PCR was performed in 50 µL reactions containing 25 µL of 2X master mix (PCR Biosystems), 16 µL H2O, 2 µL of each primer (10 µM) and 5 µL of template DNA. The PCR amplification conditions were as follows: initial denaturation 94 °C for 5 min, 35 cycles of denaturation at 94 °C 1 min, annealing at 63–70 °C for 30 s, extension at 72 °C for 2 min and a final extension step at 72 °C for 7 min. The annealing temperature for isolate 24E/2 was 58 °C.
All PCR products were run on a 1% agarose gel in 0.5X TBE buffer at 90 V for 40 min and were visualised using the G-Box gel documentation system. For sequencing, PCR-amplified products using the primers gyrB SF and gyrB SR [18] were purified using a PCR purification kit (Qiagen) and processed by Eurofins Genomics.

2.6. Sequence Analysis

The resulting sequences were aligned in BioEdit software and were searched using BLASTN with default settings to ensure their identity as Pseudomonas spp. [19]. The phylogenetic tree was constructed using the Neighbour Joining method (NJ) after alignment with MUSCLE using Geneious Prime 2019.0.4 (http://www.geneious.com). The node support was evaluated on 100 bootstrap replications. The gyrB sequences of P. fluorescens strains SBW25 and F113 were included as references for comparison and the gyrB sequence of P. aeruginosa PAO1 was used as the out-group.

2.7. Seed Sterilisation

Wheat (Triticum aestivum) seeds of cultivars Cadenza and Hereward were surface sterilised via immersion in a 2.5% (v/v with sterile deionised water (SDW)) solution of bleach for 3 min followed by 3 rinses in SDW. The seeds were allowed to air dry for up to 3 h in a class 2 safety cabinet (Labogene) [20].

2.8. In Planta Assays

In total, 1 mL of the overnight culture of selected bacterial isolates was pelleted via centrifugation at 5000 rpm for 8 min. The pelleted cells were washed twice in 1 mL phosphate-buffered saline (PBS) and the Optical Density (OD600) was adjusted to 0.1 in PBS. Twelve seeds were soaked in bacterial suspension in sterilised 50 mL tubes and placed in an orbital shaker set at 200 rpm, 27 °C for 1 h. After this time, the seeds were left to air dry for 2 h. Sterile 50 mL Falcon tubes were prepared for seed transplantation with the addition of 5 g sterile fine vermiculite. For each test isolate, 3 replicates were prepared with one seed placed 1 cm below the vermiculite surface. Each tube was watered with 25 mL SDW and covered with parafilm. The tubes were incubated in a temperature-controlled room set at 21 °C with 16 h light–dark cycle and 70% humidity. Sterile seeds soaked in PBS were used as a control. The parafilm was removed from all treatments after 5 days. The seedlings were watered with 5–10 mL SDW on day 6 and day 13 and harvested at day 21. Following harvest, seedling biomass, shoot height, root length and fresh weight was measured.

2.9. In Planta Gt Antagonistic Assay

The six most antagonistic isolates to control Gt in an in vitro setup were tested for ability to suppress Gt with an in planta assay. The growth chamber assay was slightly modified from the methods described by [6]. Briefly, sterile seeds of Cadenza and Hereward were soaked in bacterial OD600 0.1. Five Gt plugs (0.5 cm) were placed 2 cm below the sown seed in sterile vermiculite. Initial analysis showed that 5 plugs was sufficient to cause disease symptoms. One seed was sown per 50 mL Falcon tube and watered and incubated as above. The percentage of infected roots was determined by comparing the total number of roots and the infected roots.

2.10. Statistical Analysis

GENSTAT (17th edition, VSN International Ltd., Hemel Hempstead, UK) was used to analyse the data. The category class 1–3 inhibition zone data were analysed by fitting a generalised linear model (GLM) to account for the blocks in the experiment and to test the main effects and interactions between the factors year 1 (H or C cultivar), year 2 (H or Xi-19 cultivar) and Niche (Rhizosphere (R) or Endosphere (E)). ANOVA was also performed on the inhibition zone data of isolates, which was averaged per plot. A Poisson distribution was assumed, and a log link function was incorporated. The fitted model was Block+ (Year 1*Year 2*Niche). There was no evidence of over-dispersion for this model (F pr. < 0.001 with dispersion parameter estimated to be 0.231 from the residual deviance). Predicted means on the log scale were used or obtained to enable comparisons using the standard error of the difference (SED) between means on the residual degrees of freedom from the model, along with the least-significant difference (LSD) at the 5% level of significance. GLM was fitted to the PCR data for both genes. The fitted model was Block+ (Year 1*Year 2*Niche). There was no evidence of over-dispersion for the data using this model for either gene and the outcomes of each locus were analysed separately. A GLM was used to analyse the infected root data. The model fitted was cultivar*Isolate with the total number of roots as the binomial total. For the in planta assay mixed model, Restricted Maximum Likelihood variance components were used to analyse the plant biomass data.

3. Results

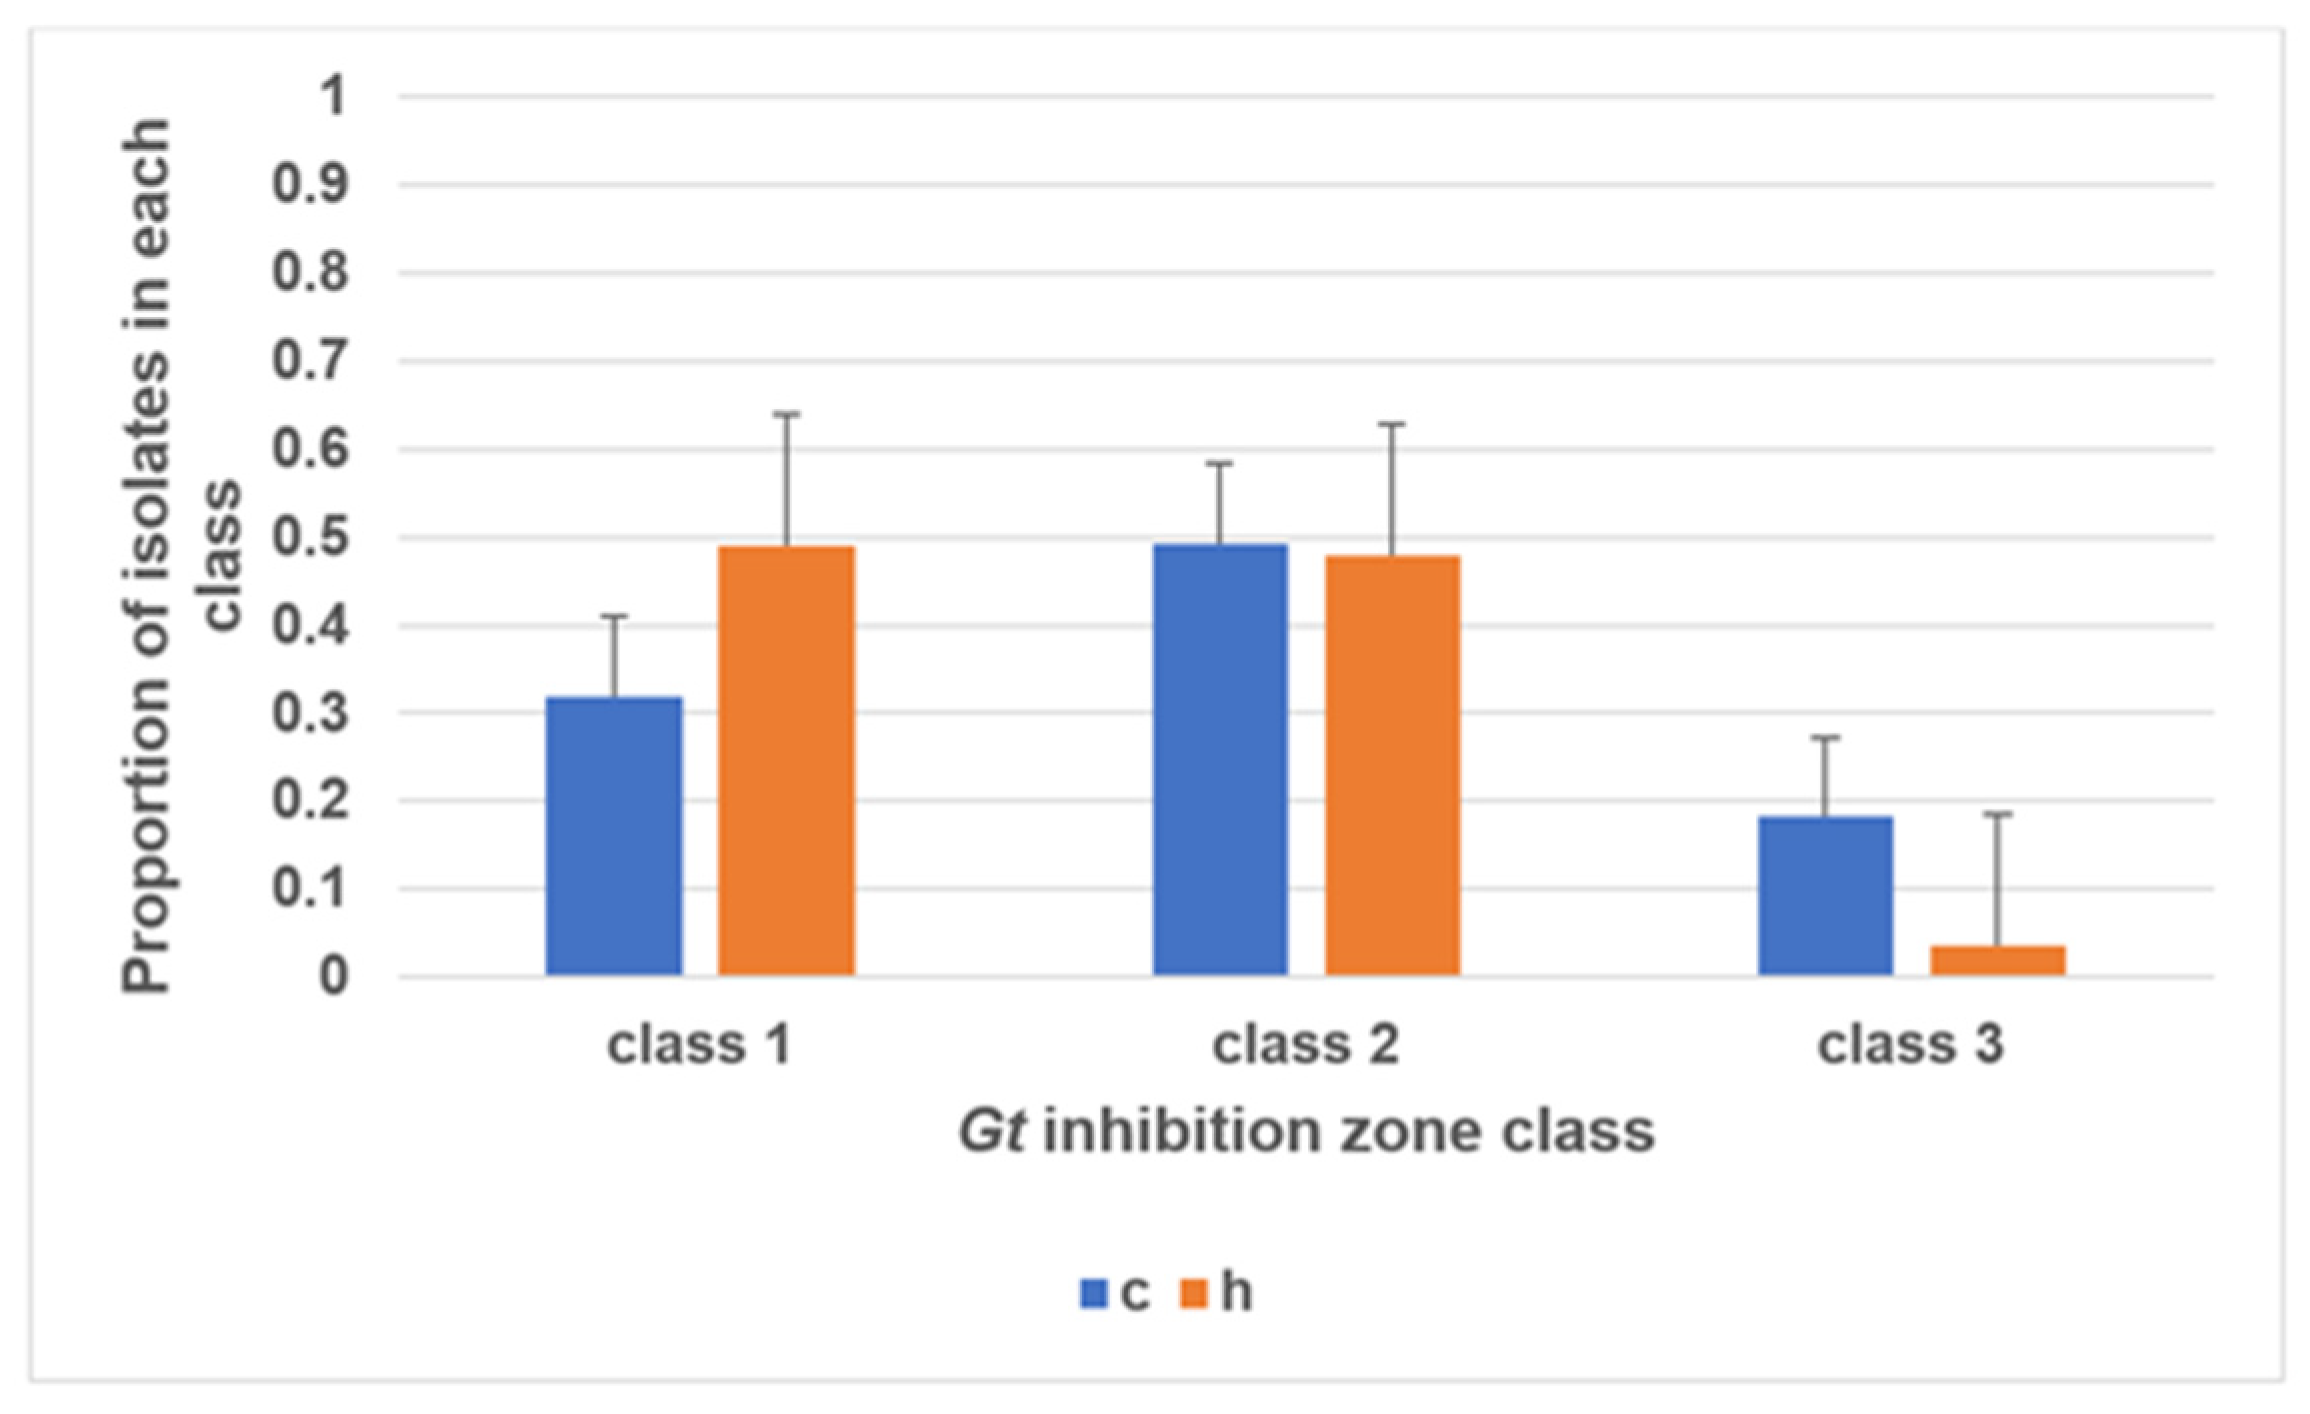
3.1. Screening of Isolates for Gt Antagonism and Classification of Potency

Pseudomonas isolates were phenotypically and genotypically screened to examine whether wheat-planting regime influenced their selection in the root microbiome. The isolates were profiled for Gt antagonism using a two-stage in vitro antagonism screen. In the first stage, Gt was inoculated in the centre of a Petri dish and three randomly selected isolates were separately inoculated to challenge the fungus in a spatially separated manner. The resultant inhibition zone measurements were grouped into three classes. There were 164 class 1 isolates (0–0.5 cm), 200 class 2 isolates (0.5–1 cm) and 47 class 3 isolates (>1 cm) (Table S3). Out of the 47 class 3 isolates, 40 (85%) were from the year 1 Cadenza background and 7 (15%) were from the year 1 Hereward background. This equates to 18.2% of first-year Cadenza isolates and 3.6% of first-year Hereward isolates being class 3 inhibitors. In addition, a higher proportion of first-year Hereward isolates (49%) were assigned as class 1 inhibitors compared with first-year Cadenza isolates (32%) (Figure 1). The 47 class 3 isolates were further challenged in a 1:1 setup with Gt to confirm their antagonistic ability. The six isolates (24E-2, 24E-4, 25R-7, 28R-9, 30R-11, 44E-7) displaying the strongest antagonism of Gt came from a diverse range of field plots (Table 2). Four of the six isolates were from the Cadenza/Xi-19 (C, Xi-19) planting combination, with one isolate from Hereward/Hereward (H, H) and one from Hereward/Xi-19 (H, Xi-19) planting combinations (Tables S3 and S4).
The regression analysis of the category class 1–3 data showed some evidence of a two-way interaction between year 1 and year 2 factors (F = 4.86 on 1 and 410, d.f.; p = 0.028) (Tables S5 and S6 and Figures S1 and S2), but no effect of niche. Secondly, ANOVA analysis on the average inhibition zone data per plot showed the main effect was driven by year 1 cultivar (F = 0.031, d.f. = 1) regardless of which variety was grown in year 2 or niche (Table S7). The most antagonistic isolates (with the largest inhibition zone values) were largely derived from a Cadenza background in year 1 as opposed to Hereward (Table S8).

3.2. Biomarker Screening to Differentiate Antagonistic Bacteria

PCR screening of the six strongest antagonistic isolates along with the least antagonistic isolate 37R/15, for genes relating to the production of 2,4-diacetylphloroglunicol (DAPG) and phenazine-1-carboxylic acid using primers corresponding to genes involved in their biosynthesis, namely, phl for DAPG and phzCD for phenazine-1-carboxylic acid, revealed that none of these isolates produced a PCR amplicon for either gene. Pseudomonas protegens strain Pf-5 (Phl+) was included as a positive control for the 2,4-DAPG gene. We then extracted the wsm (coding for lipopolysaccharide synthesis) and fecB (coding for a ferric citrate ABC transporter solute binding protein, involved in Fe uptake) gene sequences from the 19 P. fluorescens-sequenced genomes [15]. PCR screening of the 411 isolates using the wsm and fecB degenerate primers was performed and isolates were scored for the presence or absence of these genes. For both genes, the wheat grown in the first year had a strong selection effect (p < 0.001, F-test, Table S9). It was found that the wsm locus was more associated with first-year Hereward, whereas fecB-encoding strains were more prevalent in first-year Cadenza (p < 0.001, F-test) (Table S10). Furthermore, when considering the interaction between niche and first-year cultivar, it was found that for first-year Cadenza-derived plants fecB and wsm genes were more prevalent in rhizosphere as opposed to endosphere isolates (Figure S3). The opposite was found to be the case for first-year Hereward-derived plants.

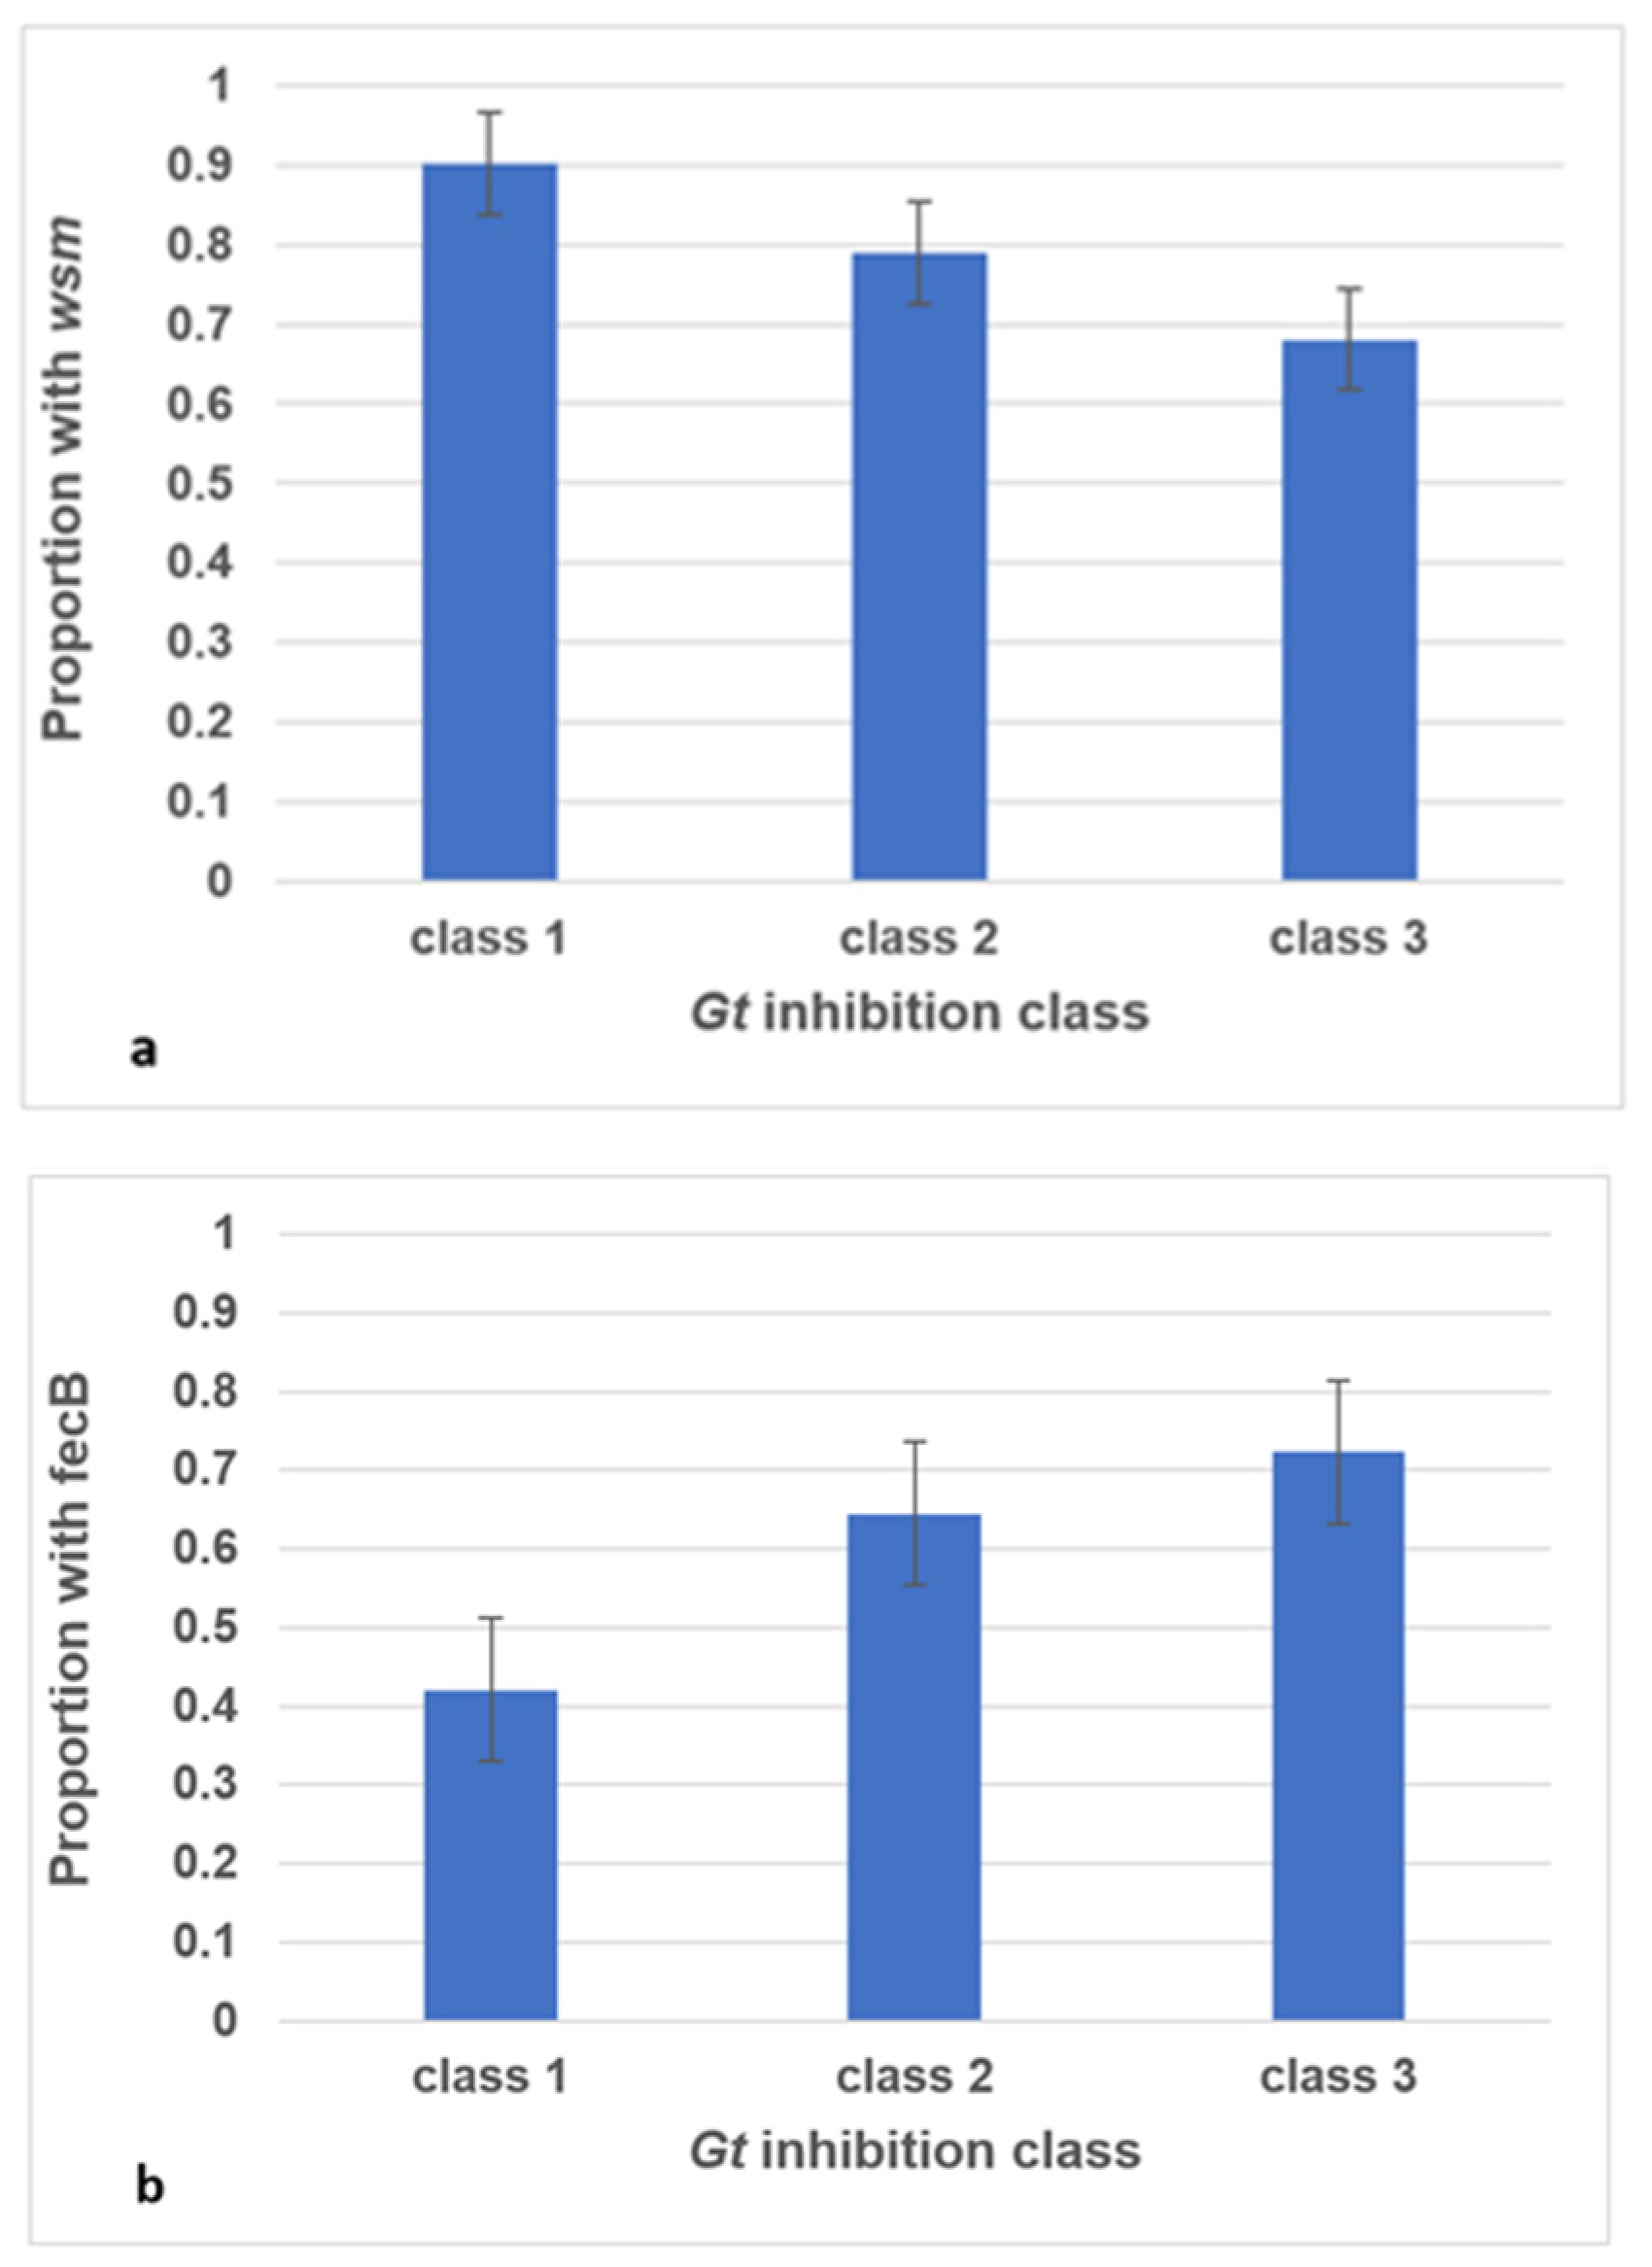
3.3. fecB and wsm Incidence Correlate with Fungal Inhibition
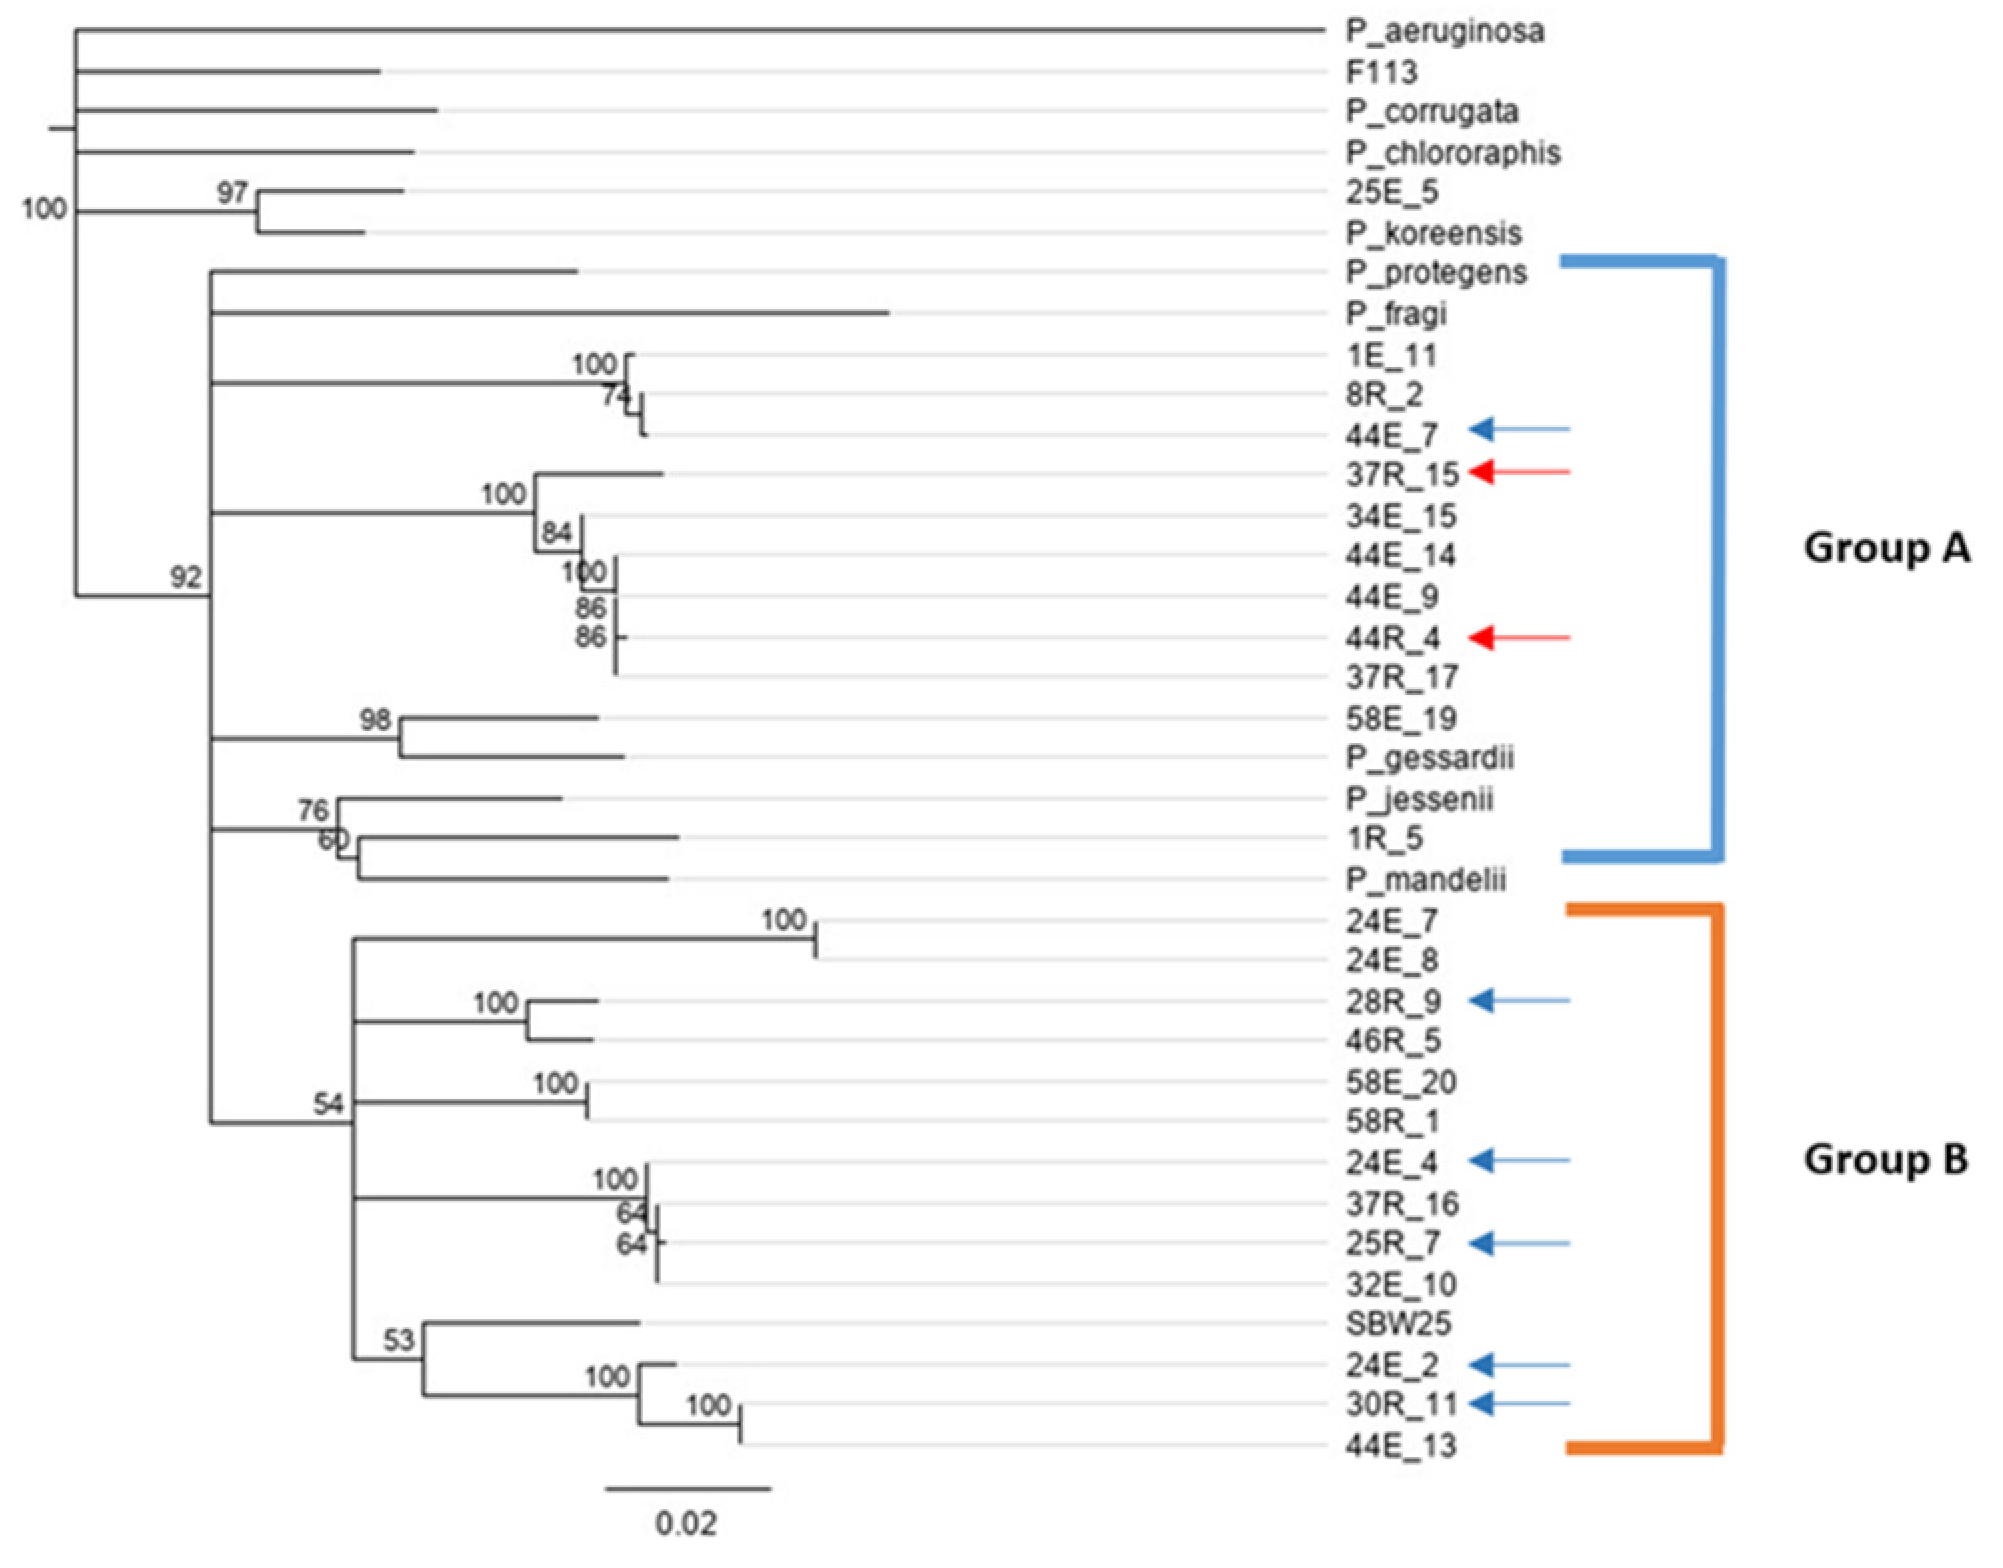
When comparing the presence of fecB and wsm and pathogen suppression, we found that a positive correlation existed with the presence of fecB and the ability of isolates to supress Gt. The opposite was found to be the case with the presence of wsm (Figure 2, Pearson correlation: inhibition category versus fecB: 0.231681, inhibition zone diameter versus fecB: 0.284845; inhibition category versus wsm: −0.19152, inhibition zone diameter versus wsm: −0.16932).

3.4. gyrB Phylogeny

A subset of 25 Pseudomonas isolates were genotypically characterised using the gyrase B subunit (gyrB) gene (Table 1) to further investigate the relationship between the planting combinations, Pseudomonas phylogeny and the Gt antagonism pattern of the isolate. This included the six strongest antagonists, the two weakest antagonists and 17 strains randomly chosen to cover the different planting combinations and niches. Pseudomonas aeruginosa was included as an outgroup and SBW25 and F113 were also included for comparison. The phylogenetic tree of the gyrB sequences shows that the isolates grouped into two clusters: group A, with the least antagonistic isolates, as well as group B, which was primarily made up of Gt-antagonistic isolates (Figure 3). This observation implies that the antagonistic status of isolates is deep-rooted and associated with the core genome of Pseudomonas, as it can be discriminated by phylogeny when based on a housekeeping gene whose function is unrelated to Gt suppression. In group A, there were 12 isolates, 9 derived from year 1 Hereward and 3 from year 1 Cadenza, while group B comprised 13 isolates, 9 from year 1 Cadenza and 4 from year 1 Hereward (Table 3). We also correlated the relationship between Gt inhibition, presence or absence of wsm/fecB as well as gyrB genotype for these 25 isolates (12 derived from first-year Hereward and 13 from first-year Cadenza). It was found that 85% of the first-year Cadenza-derived isolates possessed the fecB gene, whereas for first-year Hereward-derived isolates this was only 42%. However, for the wsm gene, 92% and 75% of first-year Cadenza and Hereward isolates, respectively, possessed this gene.

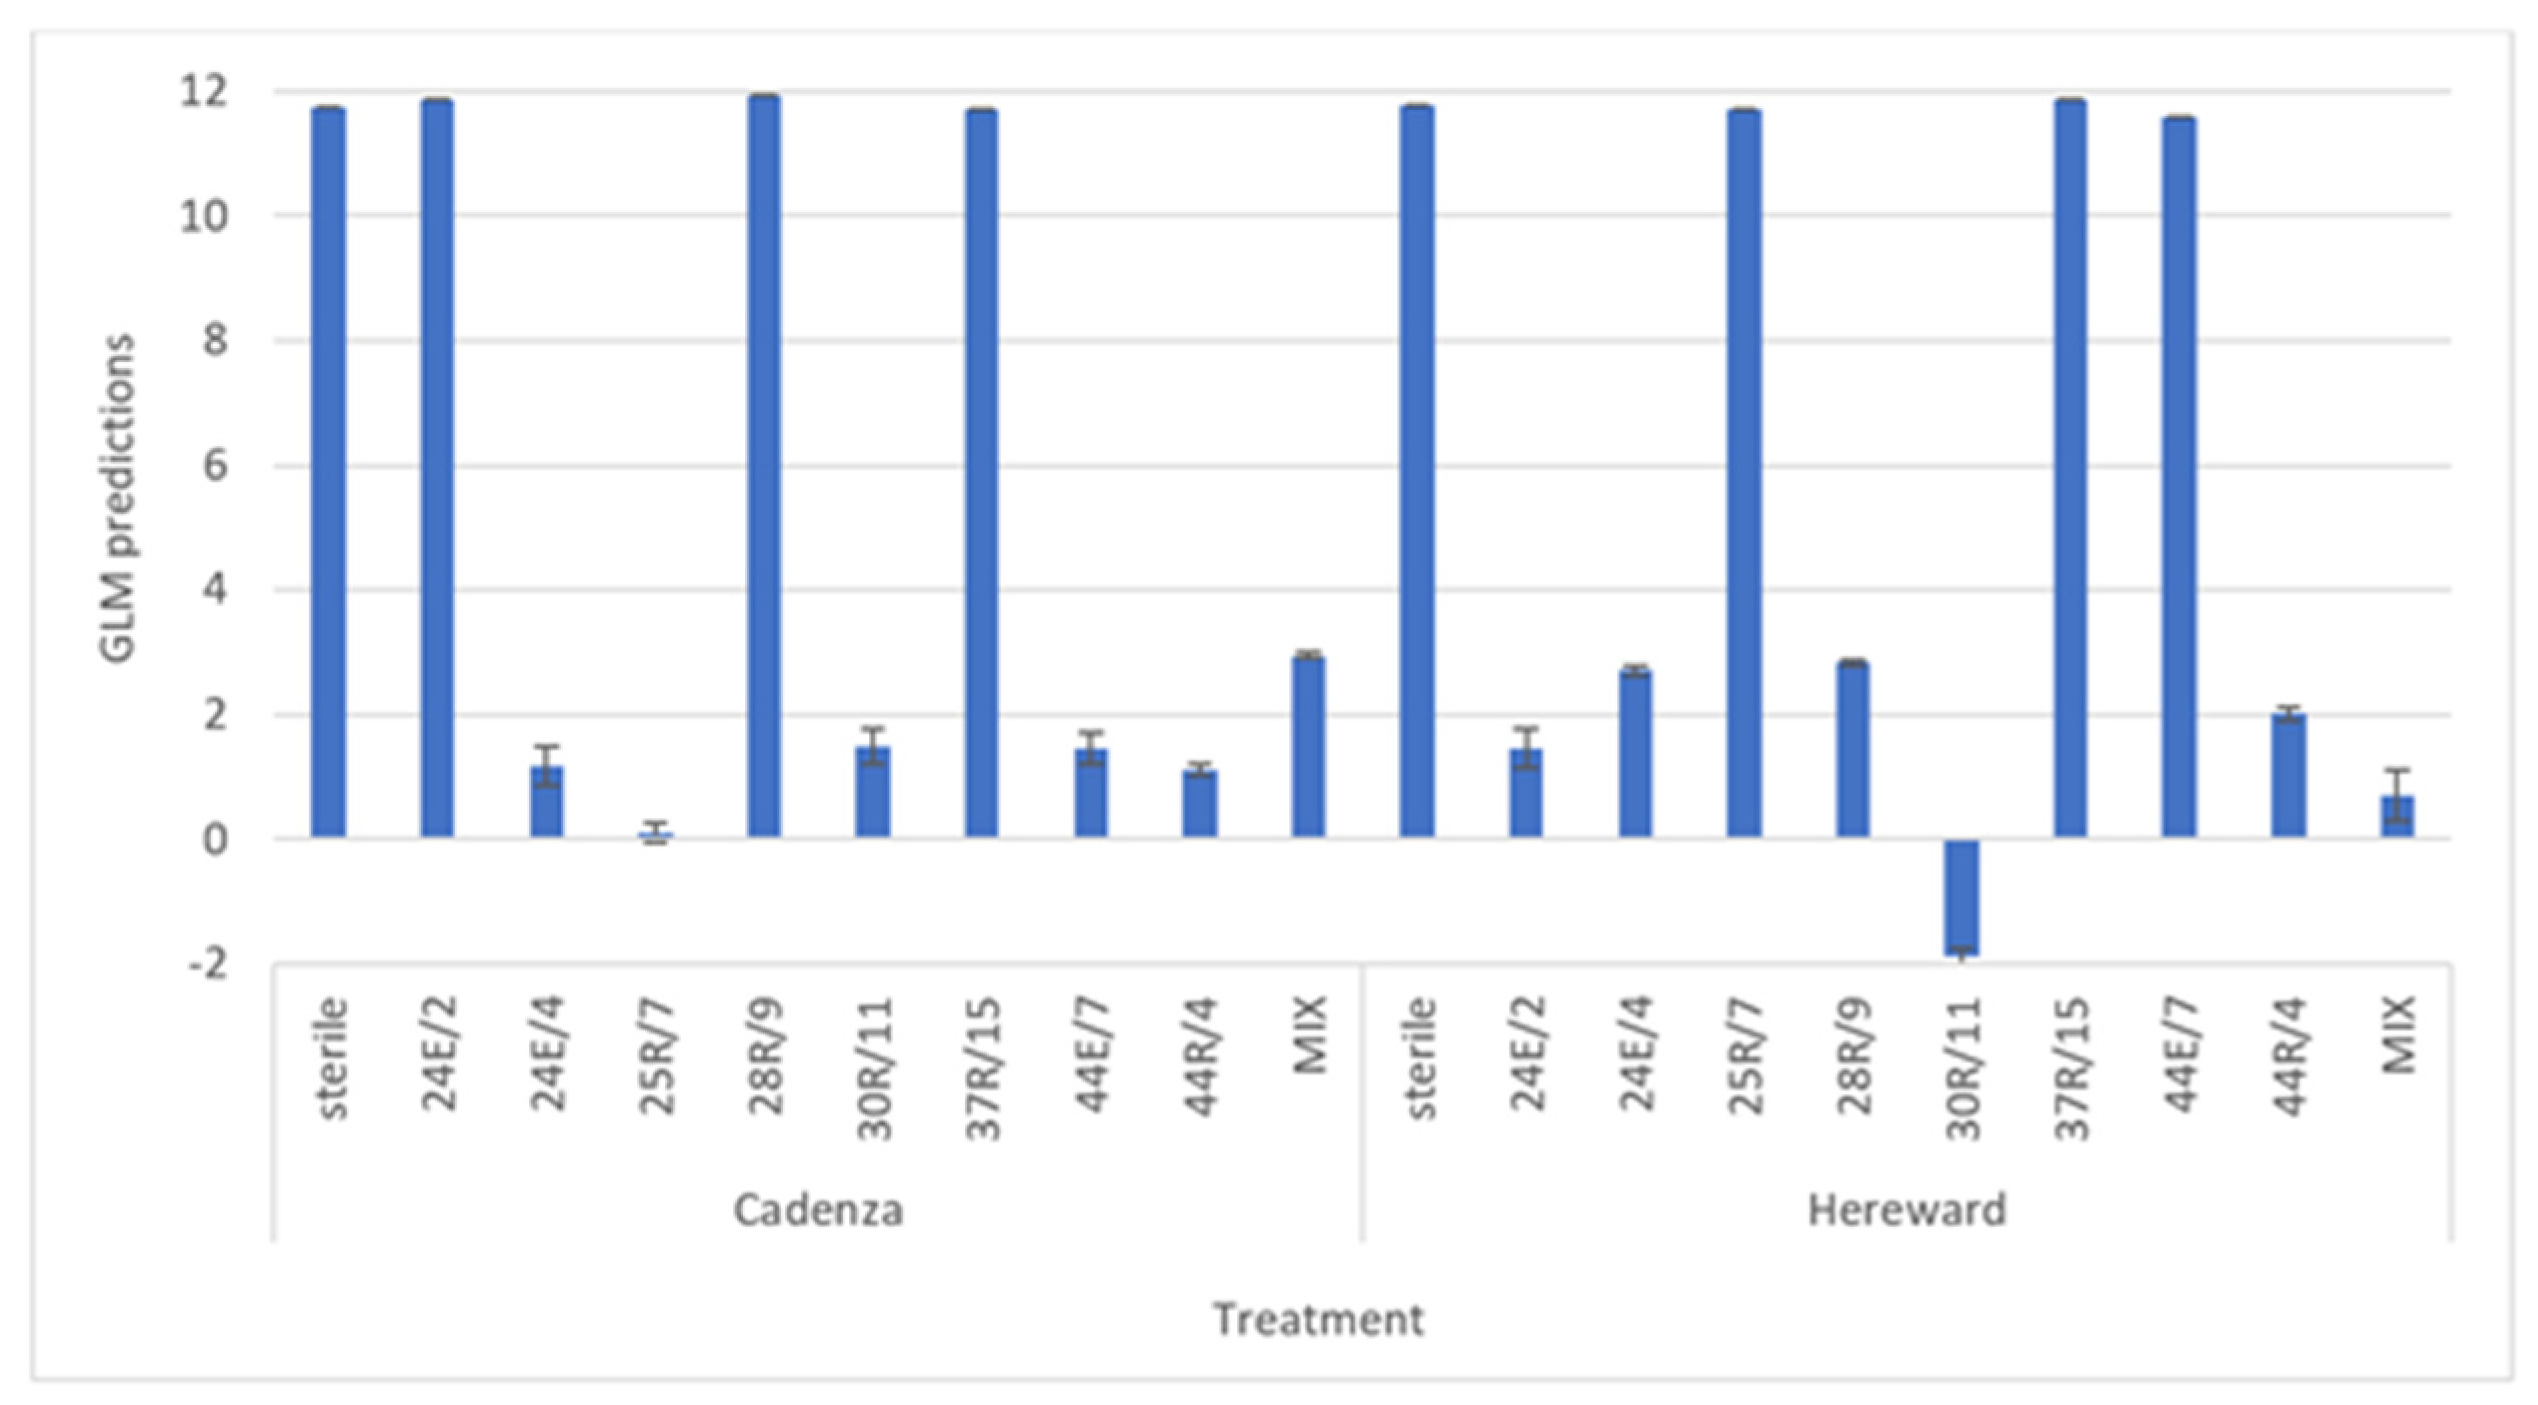
3.5. In Planta Take-All Disease Control Assays

Six Pseudomonas isolates displaying strong Gt antagonism as well as two control isolates with poor Gt-suppression capacity were selected for in planta assays with cultivars Hereward and Cadenza in the presence or absence of Gt. In addition, a mixture of all six antagonistic isolates as well as a no-bacterial-inoculant treatment (sterile) was set up. When wheat was grown without Gt inoculation, the roots were healthy, and no blackening was observed. The mixture of six isolates reduced the number of infected roots in comparison to the no-Pseudomonas (sterile) control (Figure 4). There was a significant difference in the number of infected roots between the two cultivars in the presence of the isolates (F = 0.031) (Table S11). In the Gt-only infected treatments, the mean disease levels were high regardless of cultivar: those for Cadenza were 11.754 (s.e. = 93.6) and those for Hereward 11.762 (s.e. = 75.57). When assessing the prediction from the regression model, inoculation of either wheat cultivar with isolates 24E/4 and 30R/11 led to a reduced root infection for Cadenza and Hereward (Table S12). Although both isolates were derived from year 1 Cadenza selection, this finding demonstrates that isolates selected by Cadenza can provide protection to another wheat cultivar. With regard to the control inoculants, it was found that 37R/15 was unable to prevent Gt disease; however, control isolate 44R/4 resulted in reduced disease for both cultivars.

4. Discussion

Here, we show that first-year Cadenza cropping selects for pseudomonads with the ability to suppress Gt to a greater extent than isolates from first-year Hereward in the subsequent wheat crop. There are a wide range of mechanisms deployed by pseudomonads to antagonise Gt. In many fluorescent Pseudomonas spp., PCA and Phl antibiotics have been identified as the main determinants of biocontrol against soil-borne plant pathogens such as Take-all disease [21]. None of the isolates tested in this study had any of these antibiotic genes, suggesting these are not the only modes of action for Gt suppression by pseudomonads. Indeed, Yang [10] reported that 13 fluorescent Pseudomonas isolates controlled Gt in vitro and under greenhouse conditions, and none of the isolates had phlD, prnC and pltB, the genes involved in the biosynthesis of DAPG, pyrrolnitrin and pyoluteorin antibiotics, respectively. Furthermore, Yang [5] showed that a viscosin-like cyclic lipopeptide of P. fluorescens strain HC1-07 was linked to growth inhibition of Gt. However, wheat-seed treatment with P. synxantha (formerly P. fluorescens) 2-79, which naturally produces the antibiotic phenazine-1-carboxylic acid and encodes the biosynthesis of the antibiotic pyrronitrin, suppressed both Take-all and Rhizoctonia root rot of wheat [22]. The correlation analysis of phenotypic loci by Mauchline [15] placed Pseudomonas populations into two groups: those that were primarily derived from first-year Hereward and effective for actinomycete suppression, with genes for viscosin, type IV pili, Wsm lipopolysaccharide production and LapA/BapA adhesin operons, whereas those primarily from first-year Cadenza had genes for hemophore, acetoin catabolism, as well as siderophore production and secretion, but with limited predicted antibacterial capability. Mazzola and Gu [23] investigated a range of wheat cultivars for the establishment of Rhizoctonia-suppressive apple orchard soils. They highlighted that host genotype is an important factor in establishing disease-suppressive soils through supporting the colonisation of a specific population of pseudomonads. The finding that more isolates that we identified as class 3 inhibitors were found in pseudomonads isolated from first-year Cadenza plants, and that more isolates of class 1 inhibitors were found in pseudomonads isolated from first-year Hereward plants suggests that the observed bacterial selection is implicated in the in planta antagonism of the Take-all fungus, and that host genotype is an important factor in our study. In addition, the wsm locus was more associated with isolates derived from first-year Hereward, while fecB was more associated with isolates derived from first-year Cadenza. As such, the first-year wheat seems to be implicated in the selection of the associated Pseudomonas spp. in our experimental system, which agrees with the results of the correlation analysis by Mauchline [15]. In addition, we found that more fecB-encoding isolates were present in the rhizosphere than the endosphere of first-year Cadenza-derived plants and that this trend was reversed for first-year Hereward-derived plants. One possible explanation for this is that in a L-TAB situation the fungal inoculum is controlled in the rhizosphere environment and does not enter the root system to cause disease. However, in a H-TAB situation, where there is a higher fungal load in the root system, it is possible that the host plant selects for a higher proportion of fecB-encoding microbes in this niche as a last line of defence. The observation that 72% of class 3 Gt antagonists possess the fecB gene as opposed to 42% of class 1 antagonists provides evidence that the fecB gene is implicated in the control of Gt and that the microbially mediated suppression of the fungus in the L-TAB environment is not necessarily dependent on the production of secondary metabolites such as DAPG or phenazine. This observation could prove to be important if bacterial antibiotic molecules are also phytotoxic. As such, the competition for nutrients offers an alternative strategy for pathogen biological control. The phylogenetic analysis of the gyrB gene showed that the isolates with the largest inhibition zones grouped separately from those with smaller inhibition zones. It was found that 11/13 of group B isolates were antagonistic to Gt and that 9 out of the 11 antagonistic isolates in group B possessed the fecB gene. In comparison, in group A 4/11 isolates were antagonistic to Gt, with all 4 of these isolates possessing the fecB gene. These observations suggest that the presence of fecB is associated with Gt suppression and that an interaction with first-year wheat cropping regime influences this phenomenon. The presence or absence of fecB could be used to develop a possible molecular indicator of Gt antagonism potential in a given isolate, or in a microbial community. Furthermore, this grouping agreed with the inhibition zone data, which showed that isolates from first-year Cadenza had larger inhibition zones than those from first-year Hereward. In addition, isolates derived from the (H, H) planting scheme were associated with the smallest Gt inhibition zone. This suggests that Cadenza selects for antagonistic Pseudomonas isolates in the development of the L-TAB status. Given the selective association of highly Gt-antagonistic species of Pseudomonas with Cadenza, which are also positive for the fecB genotype, it follows that iron deprivation could be implicated as a mechanism for Take-all disease control within the rhizosphere. Comparative genomics, transcriptomics and mutagenesis of candidate genes for isolates designated as inhibitory to Gt will enhance understanding of factors leading to differential fungal inhibition.
The in planta study showed that regardless of wheat cultivar, inoculation with the synthetic community of six isolates resulted in a consistent reduction in Gt disease for both wheat cultivars. This might be due to a combined or synergistic effect achieved by the mixture. We also found that S4E/4, 30R/11 and 44R/4 were consistently able to suppress disease build up. It was interesting that the control isolate 44R/4 (fecB-negative and did not suppress Gt in vitro) was associated with reduced Gt disease in planta regardless of crop genotype. This isolate could be associated with alternative mechanisms of Gt suppression, such as activation of innate plant defence pathways, and highlights the importance of a holistic approach to biocontrol of plant pathogens. However, Mehrabi [24] demonstrated that increased richness of Pseudomonas mixtures resulted in a reduction in Take-all inhibition under in vitro conditions. This was thought to be due to increased competition between isolates. In our study, isolates 24E/2, 24E/4, 25R/7, 28R/9 and 44E/7, which were among the most antagonistic isolates, gave positive PCR diagnostic bands for wsm and fecB loci, indicating the importance of these loci in host colonisation and pathogen suppression, respectively. In addition, the gyrB phylogeny indicated a clustering of five of these isolates in group B, indicating high genetic similarity between these isolates (i.e., low species richness), and the high Take-all suppression with the most complex inoculum suggests that they are not antagonistic to each other. However, more research is required to determine whether or not this is the case. On the other hand, Jousset [25] stated that genetically dissimilar microbial communities are better equipped to combat pathogen invasion by providing greater resource competition through more efficient utilisation of resources and that increasing the genotypic richness could also result in a greater range of antifungal metabolite production. As such, it is not clear what the best strategy is for the development of synthetic microbial communities for Gt suppression.
Interestingly, Yu [26] demonstrated that deletion of a 90 bp sequence upstream of the divergently orientated phzX and phzR promoters resulted in the up-regulation of phenazine production and associated improvement in Take-all disease inhibition, biofilm formation, extracellular DNA release and suppression. As such, an alternative approach for biocontrol could be the amendment of pseudomonads to be more effective nutrient scavengers. For example, transformation of microbes with genes for high-affinity metal-uptake ABC transporters is an alternative and more subtle way of enhancing inoculants as opposed to diversifying the secondary metabolite production of inoculants. This could be a good strategy, as microbes better equipped for nutrient scavenging would likely be highly competitive rhizosphere colonisers and potentially suppress pathogen development through niche exclusion. However, it is likely that many biotic and abiotic factors need to be considered and in future work it will be interesting to explore relationships between Pseudomonas isolate phylogenetic distance and compatibility for the optimisation of synthetic microbial communities for Gt suppression.

Supplementary Materials

The following supporting information can be downloaded at: https://www.mdpi.com/article/10.3390/crops3030019/s1, Table S1. Field layout of Great Harpenden 2 (GH2) at Rothamsted in the first year.; Table S2. Field layout of Great Harpenden 2 (GH2) at Rothamsted in the second year; Table S3. Inhibition zone class data for the 411 bacterial isolates on Gaeumannomyces tritici; Table S4. Great Harpenden 2 (GH2) treatment structure; Table S5. Accumulated analysis of deviance from generalised linear model of Pseudomonas isolates’ inhibition zone class on Gaeumannomyces tritici; Table S6. Table of predicted means from generalised linear model analysis for Pseudomonas isolates’ inhibition zone class on Gaeumannomyces tritici; Table S7. ANOVA analysis of averaged Pseudomonas isolates’ inhibition zone on Gaeumannomyces tritici per plot; Table S8. Table of means from ANOVA analysis of averaged Pseudomonas isolates’ inhibition zone data on Gaeumannomyces tritici per plot; Table S9. Generalised linear model table of accumulated deviance for Pseudomonas isolates’ wsm gene PCR outcome; Table S10. Generalised linear model table of accumulated deviance for Pseudomonas isolates’ fecB gene PCR outcome; Table S11. Accumulated analysis of deviance from generalised linear model on Gaeumannomyces tritici-infected wheat root data; Table S12. Prediction from the regression model on the reduction of Gaeumannomyces tritici wheat root infection by Pseudomonas isolates; Figure S1. Proportion of Gaeumannomyces tritici inhibiting Pseudomonas isolates associated with the four planting combinations, (c, h), (c, x), (h, h) and (h, x); Figure S2. Proportion of Gaeumannomyces tritici inhibiting Pseudomonas isolates associated with first-year wheat cultivars Cadenza (c) or Hereward (h) and niche; Figure S3. Proportion of Gaeumannomyces tritici inhibiting Pseudomonas isolates possessing wsm (a) and fecB (b) genes associated with first-year wheat cultivar Cadenza (C) or Hereward (H) and niche.

Author Contributions

M.A.Z., V.M., T.H.M. and R.W.J. conceived the study. M.A.Z. performed the experiments. M.A.Z., M.R., T.H.M. and V.M. performed data analysis. M.A.Z., M.R., V.M., L.J.S., K.H.-K., J.G.M., T.H.M. and R.W.J. contributed to the experimental design, interpretation of results and preparation of the article. M.R., M.A.Z. and T.H.M. wrote the manuscript. All authors have read and agreed to the published version of the manuscript.

Funding

M.A.Z. was funded by the Ministry of Higher Education (MOHE) and the Ministry of Agriculture and Fisheries Wealth and Water Resources (MAFWR), Oman. K.H.-K. and V.M. acknowledges funding from BBSRC ISP Designing Future Wheat (BBS/E/C/000I0250) and K.H.-K. from BBSRC ISP Delivering Sustainable Wheat (BB/X011003/1). J.G.M. received funding from Biotechnology and Biological Sciences Research Council: BBS/E/J/000PR9797. T.H.M. acknowledges support from the bilateral BBSRC-Embrapa grant on “Exploitation of the rhizosphere microbiome for sustainable wheat production” (BB/N016246/1); “S2N—Soil to nutrition—Work package 1—Optimizing nutrient flows and pools in the soil-plant-biota system” (BBS/E/C/000I0310) and “Growing Health” (BB/X010953/1) Institute Strategic Programmes. M.R. and R.W.J. acknowledge funding from BBSRC (BB/P006272/1) and the Plant Bacterial Diseases programme (BB/T010568/1).

Data Availability Statement

The datasets supporting the conclusions of this article are included within the article and its Supplementary Materials.

Acknowledgments

We thank Stephen Powers and Kirsty Hassall at Rothamsted Research for assistance with statistical analysis.

Conflicts of Interest

The authors declare no conflict of interest.

References

  1. Jenkyn, J.F.; Gutteridge, R.J.; White, R.P. Effects of break crops, and of wheat volunteers growing in break crops or in set-aside or conservation covers, all following crops of winter wheat, on the development of take-all (Gaeumannomyces graminis var. tritici) in succeeding crops of winter wheat. Ann. Appl. Biol. 2014, 165, 340–363. [Google Scholar] [CrossRef]
  2. McMillan, V.E.; Gutteridge, R.J.; Hammond-Kosack, K.E. Identifying variation in resistance to the take-all fungus, Gaeumannomyces graminis var. tritici, between different ancestral and modern wheat species. BMC Plant Biol. 2014, 14, 212. [Google Scholar] [CrossRef]
  3. Cook, J.R. Take-all of wheat. Physiol. Mol. Plant Pathol. 2003, 62, 73–86. [Google Scholar] [CrossRef]
  4. Kwak, Y.-S.; Weller, D.M. Take-all of wheat and natural disease suppression: A review. Plant Pathol. J. 2013, 29, 125–135. [Google Scholar] [CrossRef] [PubMed]
  5. Yang, M.-M.; Wen, S.-S.; Mavrodi, D.V.; Mavrodi, O.V.; von Wettstein, D.; Thomashow, L.S.; Guo, J.-H.; Weller, D.M. Biological control of wheat root diseases by the CLP-producing strain Pseudomonas fluorescens HC1-07. Phytopathology 2014, 104, 248–256. [Google Scholar] [CrossRef] [PubMed] [Green Version]
  6. Gardener, B.B.M.; Weller, D.M. Changes in populations of rhizosphere bacteria associated with take-all disease of wheat. Appl. Environ. Microbiol. 2001, 67, 4414–4425. [Google Scholar] [CrossRef] [PubMed] [Green Version]
  7. Liu, B.; Qiao, H.; Huang, L.; Buchenauer, H.; Han, Q.; Kang, Z.; Gong, Y. Biological control of take-all in wheat by endophytic Bacillus subtilis E1R-j and potential mode of action. Biol. Control 2009, 49, 277–285. [Google Scholar] [CrossRef]
  8. Rainey, P.B. Adaptation of Pseudomonas fluorescens to the plant rhizosphere. Environ. Microbiol. 1999, 1, 243–257. [Google Scholar] [CrossRef]
  9. Xu, W.; Xu, L.; Deng, X.; Goodwin, P.H.; Xia, M.; Zhang, J.; Wang, Q.; Sun, R.; Pan, Y.; Wu, C.; et al. Biological control of Take-All and growth promotion in wheat by Pseudomonas chlororaphis YB-10. Pathogens 2021, 10, 903. [Google Scholar] [CrossRef]
  10. Yang, M.-M.; Mavrodi, D.V.; Mavrodi, O.V.; Bonsall, R.F.; Parejko, J.A.; Paulitz, T.C.; Thomashow, L.S.; Yang, H.-T.; Weller, D.M.; Guo, J.-H. Biological control of Take-all by fluorescent Pseudomonas spp. from Chinese wheat fields. Phytopathology 2011, 101, 1481–1491. [Google Scholar]
  11. Raaijmakers, J.M.; Weller, D.M.; Thomashow, L.S. Frequency of antibiotic-producing Pseudomonas spp. in natural environments. Appl. Environ. Microbiol. 1997, 63, 881–887. [Google Scholar] [CrossRef] [Green Version]
  12. Yang, M.; Mavrodi, D.V.; Thomashow, L.S.; Weller, D.M. Differential response of wheat cultivars to Pseudomonas brassicacearum and Take-All decline soil. Phytopathology 2018, 108, 1363–1372. [Google Scholar] [CrossRef] [PubMed] [Green Version]
  13. McMillan, V.E.; Hammond-Kosack, K.E.; Gutteridge, R.J. Evidence that wheat cultivars differ in their ability to build up inoculum of the take-all fungus, Gaeumannomyces graminis var. tritici, under a first wheat crop. Plant Pathol. 2010, 60, 200–206. [Google Scholar]
  14. McMillan, V.E.; Canning, G.; Moughan, J.; White, R.P.; Gutteridge, R.J.; Hammond-Kosack, K.E. Exploring the resilience of wheat crops grown in short rotations through minimising the build-up of an important soil-borne fungal pathogen. Sci. Rep. 2018, 8, 9550. [Google Scholar] [CrossRef] [PubMed]
  15. Mauchline, T.H.; Chedom-Fotso, D.; Chandra, G.; Samuels, T.; Greenaway, N.; Backhaus, A.; McMillan, V.; Canning, G.; Powers, S.J.; Hammond-Kosack, K.E.; et al. An analysis of Pseudomonas genomic diversity in take-all infected wheat fields reveals the lasting impact of wheat cultivars on the soil microbiota. Environ. Microbiol. 2015, 17, 4764–4778. [Google Scholar] [CrossRef] [Green Version]
  16. King, E.O.; Ward, M.K.; Raney, D.E. Two simple media for the demonstration of pyocyanin and fluorescin. J. Lab. Clin. Med. 1954, 44, 301–307. [Google Scholar] [PubMed]
  17. Schneider, C.A.; Rasband, W.S.; Eliceiri, K.W. NIH Image to ImageJ: 25 years of image analysis. Nat. Methods 2012, 9, 671–675. [Google Scholar] [CrossRef]
  18. Yamamoto, S.; Kasai, H.; Arnold, D.L.; Jackson, R.W.; Vivian, A.; Harayama, S. Phylogeny of the genus Pseudomonas: Intrageneric structure reconstructed from the nucleotide sequences of gyrB and rpoD genes The GenBank accession numbers for the sequences determined in this work are: gyrB, D37926, D37297, D86005–D86019 and AB039381–AB039492; rpoD, D86020–D86036 and AB039493–AB039624. Microbiology 2000, 146, 2385–2394. [Google Scholar]
  19. Altschul, S.F.; Gish, W.; Miller, W.; Myers, E.W.; Lipman, D.J. Basic local alignment search tool. J. Mol. Biol. 1990, 215, 403–410. [Google Scholar] [CrossRef]
  20. Weller, D.M. Suppression of Take-all of wheat by seed treatments with fluorescent Pseudomonads. Phytopathology 1983, 73, 463. [Google Scholar] [CrossRef] [Green Version]
  21. Mavrodi, D.V.; Mavrodi, O.V.; Parejko, J.A.; Bonsall, R.F.; Kwak, Y.-S.; Paulitz, T.C.; Thomashow, L.S.; Weller, D.M. Accumulation of the antibiotic phenazine-1-carboxylic acid in the rhizosphere of dryland cereals. Appl. Environ. Microbiol. 2012, 78, 804–812. [Google Scholar] [CrossRef] [PubMed] [Green Version]
  22. Zhang, J.; Mavrodi, D.V.; Yang, M.; Thomashow, L.S.; Mavrodi, O.V.; Kelton, J.; Weller, D.M. Pseudomonas synxantha 2-79 transformed with pyrrolnitrin biosynthesis genes has improved biocontrol activity against soilborne pathogens of wheat and canola. Phytopathology 2020, 110, 1010–1017. [Google Scholar] [CrossRef] [PubMed]
  23. Mazzola, M.; Gu, Y.-H. Wheat genotype-specific induction of soil microbial communities suppressive to disease incited by Rhizoctonia solani anastomosis group (AG)-5 and AG-8. Phytopathology 2002, 92, 1300–1307. [Google Scholar] [CrossRef] [PubMed] [Green Version]
  24. Mehrabi, Z.; McMillan, V.E.; Clark, I.M.; Canning, G.; Hammond-Kosack, K.E.; Preston, G.; Hirsch, P.R.; Mauchline, T.H. Pseudomonas spp. diversity is negatively associated with suppression of the wheat take-all pathogen. Sci. Rep. 2016, 6, 29905. [Google Scholar] [CrossRef] [Green Version]
  25. Jousset, A.; Rochat, L.; Lanoue, A.; Bonkowski, M.; Keel, C.; Scheu, S. Plants respond to pathogen infection by enhancing the antifungal gene expression of root-associated bacteria. Mol. Plant-Microbe Interact. 2011, 24, 352–358. [Google Scholar] [CrossRef] [Green Version]
  26. Yu, J.M.; Wang, D.; Ries, T.R.; Pierson, L.S., III; Pierson, E.A. An upstream sequence modulates phenazine production at the level of transcription and translation in the biological control strain Pseudomonas chlororaphis 30-84. PLoS ONE 2018, 13, e0193063. [Google Scholar] [CrossRef]
Figure 1. Proportion of Gaeumannomyces tritici (Gt) inhibited by Pseudomonas isolates associated with first-year wheat cultivar Cadenza (c) or Hereward (h). The inhibition zone measurements were grouped into three classes: class 1 (0–0.5 cm), class 2 (0.5–1 cm) and class 3 (>1 cm). Values are the mean of 3 replicates and error bars are the standard error of the mean.
Crops 03 00019 g001
Figure 2. Proportion of Gaeumannomyces tritici (Gt) inhibiting Pseudomonas isolates possessing wsm (a) and fecB (b) genes. Values are the mean of 3 replicates and error bars are the standard error of the mean.
Crops 03 00019 g002
Figure 3. gyrB phylogeny of the 25 Pseudomonas isolates from field GH2 in comparison with Pseudomonas fluorescens SBW25 and F113. Pseudomonas aeruginosa PAO1 was used as an outgroup. The tree was constructed using the Neighbour Joining Method after alignment with MUSCLE using Geneious Prime. The numbers on the nodes indicate bootstrap probabilities. The bar is the nucleotide substitution per site. The six most antagonistic isolates are indicated with blue arrows and the two least antagonistic isolates are indicated with red arrow. Group A represents the least antagonistic isolates, group B represents the most antagonistic isolates. Supplementary Table S3 describes the isolate naming pattern.
Crops 03 00019 g003
Figure 4. Effect of Pseudomonas isolates on 21-day-old wheat root seedlings infected with Gaeumannomyces tritici (Gt), cultivar Cadenza and Hereward. Treatments included Gt with sterile seeds and in combination with the isolates 24E/2, 24E/4, 25R/7, 30R/11, 28R/9, 44E/7, mixture of the six along with two least effective antagonists 37R/15 and 44R/4. Values are the mean of 3 replicates and error bars are the standard error of the mean. GLM: generalised linear model.
Crops 03 00019 g004
Table 1. Primers and PCR conditions used in this study.
LocusPrimer NamePrimer SequenceTm (°C) Product Size (bp)
wsmwsmF 5′ GGCAAYGCCGARHTSATCC 3′63603
wsmR 5′ GCACCARCGSTCYTTRTAYTCRCGGTC 3′
fecBfecBF 5′ TGATCGTSGCCGACCTCAAYCG 3′70455
fecBR 5′ CCACARCGGCTGCTTGCTCCAG 3′
gyrBgyrBF 5′ CAGGAAACAGCTATGACCAYGSNGGNGGNAARTTYRA 3′63888–891
gyrBR 5′ TGTAAAACGACGGCCAGTGCNGGRTCYTTYTCYTGRCA 3′
gyrBgyrBSF 5′ CAGGAAACAGCTATGACC 3′n/an/a
gyrBSR 5′ TGTAAAACGACGGCCAGT 3′
phlPhl2a 5′ GAGGACGTCGAAGACCACCA 3′67745
Phl2b 5′ ACCGCAGCATCGTGTATGAG 3′
phzCDPCA2a 5′ TTGCCAAGCCTCGCTCCAAC 3′671150
PCA3b 5′ CCGCGTTGTTCCTCGTTCAT 3′
Table 2. List of six Pseudomonas isolates with most antagonistic activity against Gaeumannomyces tritici after in vitro growth inhibition assay.
No.Isolate *Planting CombinationMean Inhibition Zone (cm)Gt 1:1 Antagonistic Assay
124E-2(C, Xi-19)1.24Crops 03 00019 i001
224E-4(C, Xi-19)1.05Crops 03 00019 i002
325R-7(C, Xi-19)1.10Crops 03 00019 i003
428R-9(H, Xi-19)1.08Crops 03 00019 i004
530R-11(C, Xi-19)1.23Crops 03 00019 i005
644E-7(H, H)1.44Crops 03 00019 i006
* Number = field plot, E = Endosphere, R = Rhizosphere, wheat cultivar C: Cadenza, H: Hereward.
Table 3. The identification was based on BLAST outcomes in NCBI. Class: inhibition zone class 1 (0–0.5 cm), class 2 (0.5–1 cm) and class 3 (>1 cm); Y1: year 1; Y2: year 2.
NoIsolateClassY1Y2wsmfecBIdentified as
25E/51CXi01Pseudomonas R-42020
1E/112HH11Pseudomonas fluorescens
8R/21CH11Pseudomonas orientalis
44E/73HH11Pseudomonas orientalis
37R/151HH10Pseudomonas sp. GH1-PS70
34E/152HXi11Pseudomonas sp. RZ109
44E/141HH10Pseudomonas marginalis
44R/41HH10Pseudomonas sp. Ra3
44E/93HH10Pseudomonas marginalis
37R/171HH10Pseudomonas sp. RZ109
58E/191CH00Pseudomonas sp. GH1-PS43
1R/51HH00Pseudomonas sp. GH1-PS83
24E/73CXi11Pseudomonas poae
24E/81CXi11Pseudomonas poae
28R/93HXi11Pseudomonas orientalis
46R/53CH11Pseudomonas orientalis
58E/202CH11Pseudomonas sp. GH1-PS43
58R/11CH11Pseudomonas sp. GH1-PS43
24E/43CXi11Pseudomonas salmonii
37R/162HH10Pseudomonas fluorescens
25R/73CXi11Pseudomonas sp.
32E/103HH11Pseudomonas poae 36C8
24E/23CXi11Pseudomonas sp. R-41739
30R/113CXi00Pseudomonas orientalis
44E/132HH11Pseudomonas fluorescens
Disclaimer/Publisher’s Note: The statements, opinions and data contained in all publications are solely those of the individual author(s) and contributor(s) and not of MDPI and/or the editor(s). MDPI and/or the editor(s) disclaim responsibility for any injury to people or property resulting from any ideas, methods, instructions or products referred to in the content.

