Neural Net-Based Approach to EEG Signal Acquisition and Classification in BCI Applications


LIASD Lab., Department of Computer Science, University of Paris 8, 93526 Saint-Denis, France
*
Author to whom correspondence should be addressed.
Computers 2019, 8(4), 87; https://doi.org/10.3390/computers8040087
Submission received: 15 October 2019
/
Revised: 1 December 2019
/
Accepted: 2 December 2019
/
Published: 4 December 2019
(This article belongs to the Special Issue Machine Learning for EEG Signal Processing)
Abstract
:The following contribution describes a neural net-based, noninvasive methodology for electroencephalographic (EEG) signal classification. The application concerns a brain–computer interface (BCI) allowing disabled people to interact with their environment using only brain activity. It consists of classifying user’s thoughts in order to translate them into commands, such as controlling wheelchairs, cursor movement, or spelling. The proposed method follows a functional model, as is the case for any BCI, and can be achieved through three main phases: data acquisition and preprocessing, feature extraction, and classification of brains activities. For this purpose, we propose an interpretation model implementing a quantization method using both fast Fourier transform with root mean square error for feature extraction and a self-organizing-map-based neural network to generate classifiers, allowing better interpretation of brain activities. In order to show the effectiveness of the proposed methodology, an experimental study was conducted by exploiting five mental activities acquired by a G.tec BCI system containing 16 simultaneously sampled bio-signal channels with 24 bits, with experiments performed on 10 randomly chosen subjects.
1. Introduction
In the last decade, electroencephalographic (EEG) signal analysis has attracted interest because of its informative content, and actually holds an important place in several research fields, such as in medicine, assistance of elderly people, biometrics, and other research areas. In biometrics, for example, there has been interest in the context of identification and authentication of individuals in order to increase security [1,2]. In this context, EEG records the brain’s electrical activity by measuring the voltage fluctuations on the scalp surface via simple placement of electrodes on the skin. Those signals are related to the subject’s genetic information, making them unique for each individual and stable over time. They can be disturbed by stress and mental state of the individual, making them very difficult to obtain under force and threat. Therefore, brain signals need to be more reliable and secure for identification and biometric authentication. Nowadays, EEG signals are also useful for disabled people and those suffering from mental and psychological disorders. They are exploited in different manners with several tools, ranging from knowledge extraction to classification of brain activities.
Practically, advanced brain–computer interfaces (BCIs) use invasive systems requiring surgical intervention to implant channels that recover signals directly from the cortex. Noninvasive methods using EEG signals have also been implemented. The main problem here is that signals acquired through several different layers of the brain suffer from data loss and noise.
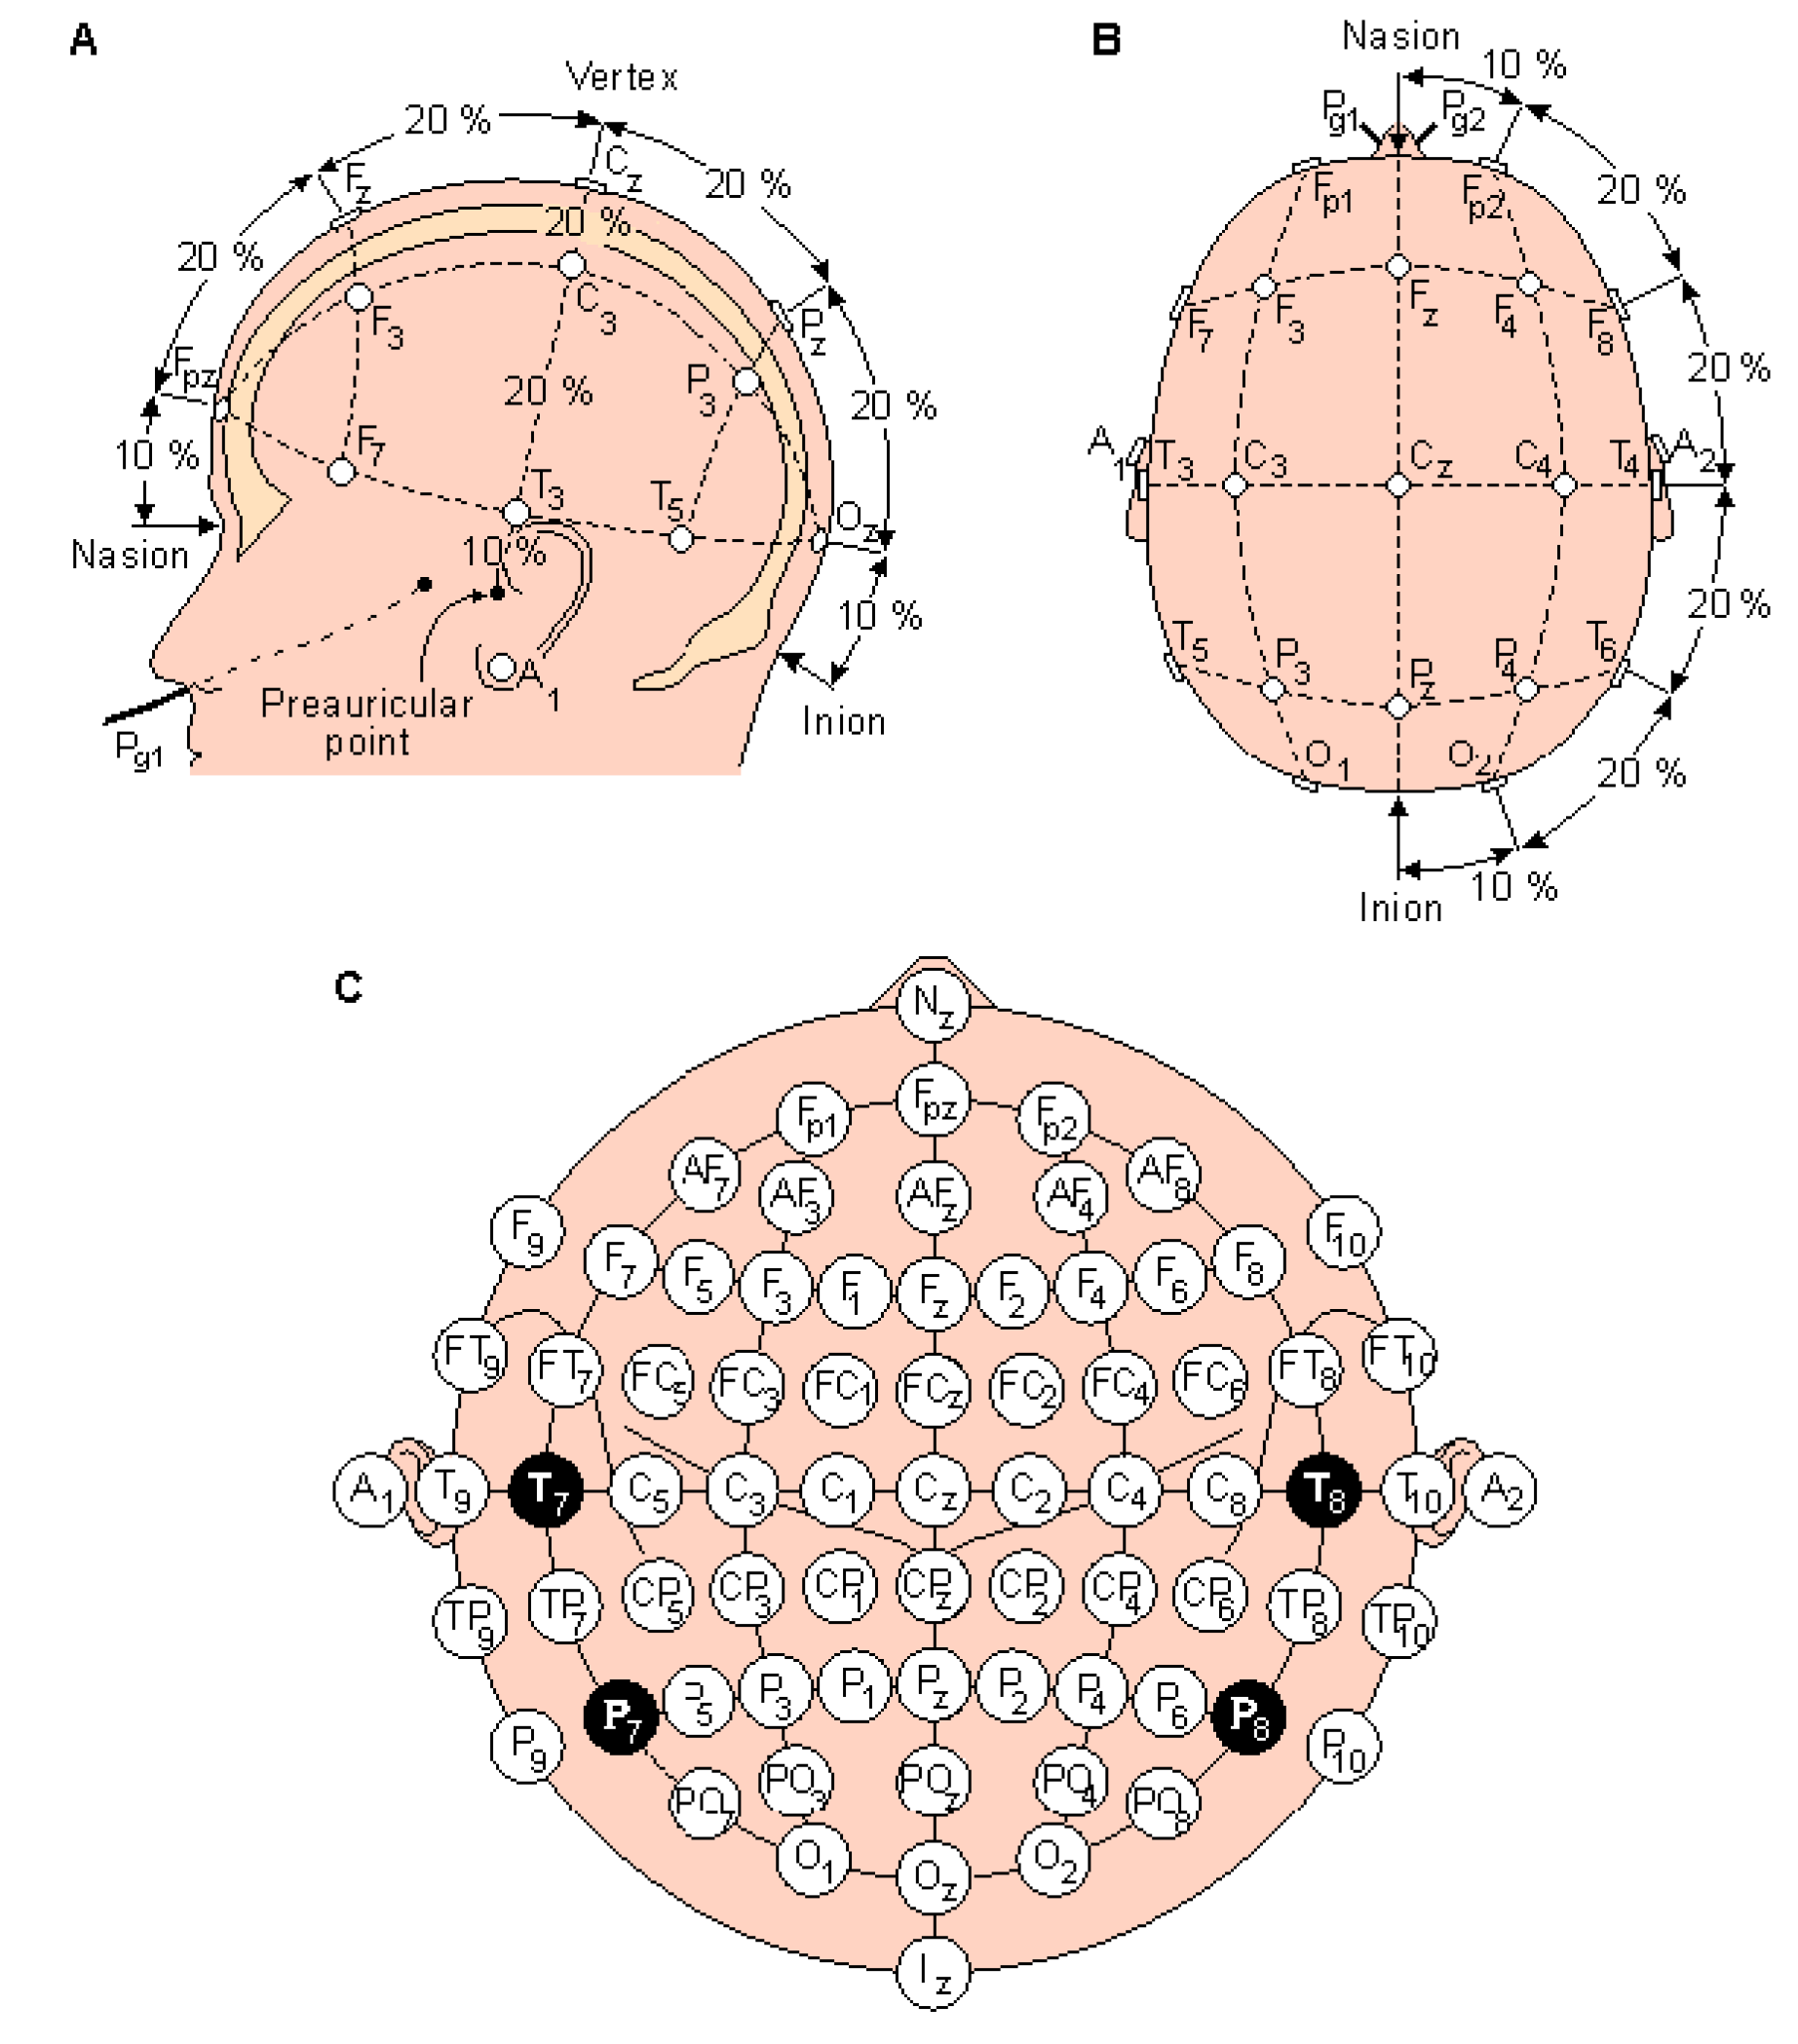
As illustrated in Figure 1, the EEG signal first passes through a helmet placed on the person scalp containing embedded channels, following the international 10-20 medical system [3].
Obtained data from the electrical activity generated by brain structures have different characteristics. The overlapping aspect of electrical activities is due to several million neurons crossing several layers of the brain to reach the scalp. In this direction, brain activity makes some records of EEG oscillating signals with different frequency levels and spectra, where four waveforms can be highlighted. The first level of frequency (8–13 Hz), corresponding to the alpha rhythm, characterizes the state of silent wakefulness, in other words with closed eyes in a state mental rest. The second level, called beta rhythm, has a frequency of 14–30 Hz and appears under conditions of active awakening and sleep. The third level, which is the theta rhythm (4–7 Hz), appears during the installation of a sleep phase, followed by the delta rhythm (0.5–3 Hz), which is characteristic of sleeping adults [4,5,6].
Moreover, it can be noticed that the acquisition process has a significant impact on results. For a particular activity with the same person, acquired data can vary according to their physiological or psychological state [7]. The EEG signal artifact is the result of the parasitic electrical potential generated by the subject’s activities during the execution of a desired task. In order to make the most of these signals, it is important to implement particular methods of feature extraction, such as those based on special and frequency filtering [8,9,10,11,12], followed by a classification process for a better recognition of activities.
The main aspects that should be faced when dealing with signal classification concern the transformation to be applied to the signal, the choice of the features to be evaluated over the transformed data, and finally the classification strategy to be adopted.
The EEG classification is the main procedure when implementing a BCI process, and the expected results depend greatly on it [8,13,14,15,16]. It makes it possible to classify the user’s wishes using a training procedure depending on data characteristics [6,14]. Linear discriminant analysis (LDA) [17], which is commonly used for the BCI system, is suitable for real time implementation and requires only a few computational resources. Similar to LDA, the support vector machine classifier (SVM) [18] provides linear and nonlinear methods and maximizes the distance between the nearest neighborhood samples. Moreover, knowing that EEG signals are very complicated physiological signals to describe, and that feature vectors are not linearly separable, the use of neural networks (NN) seems to be a good candidate for solving many nonlinear problems in BCI research. Thus, with their learning capabilities, they are suitable for data classification and for the multiclass process according to the desired architecture [19,20].
In this paper, we propose an effective classification method based on NNs with unsupervised learning, more specifically on the self-organizing map (SOM), in order to classify five different brain activities recorded on ten subjects. For this purpose, in Section 2 we first introduce the proposed method for data acquisition with a proposed experimental setup. The process of feature extraction and the classification method based on SOM is also presented. Performance and benefits of the proposed method are illustrated according to obtained results in Section 3. Finally, in Section 4, we conclude the presented work.
2. Proposed Method for EEG Data Acquisition and Classification
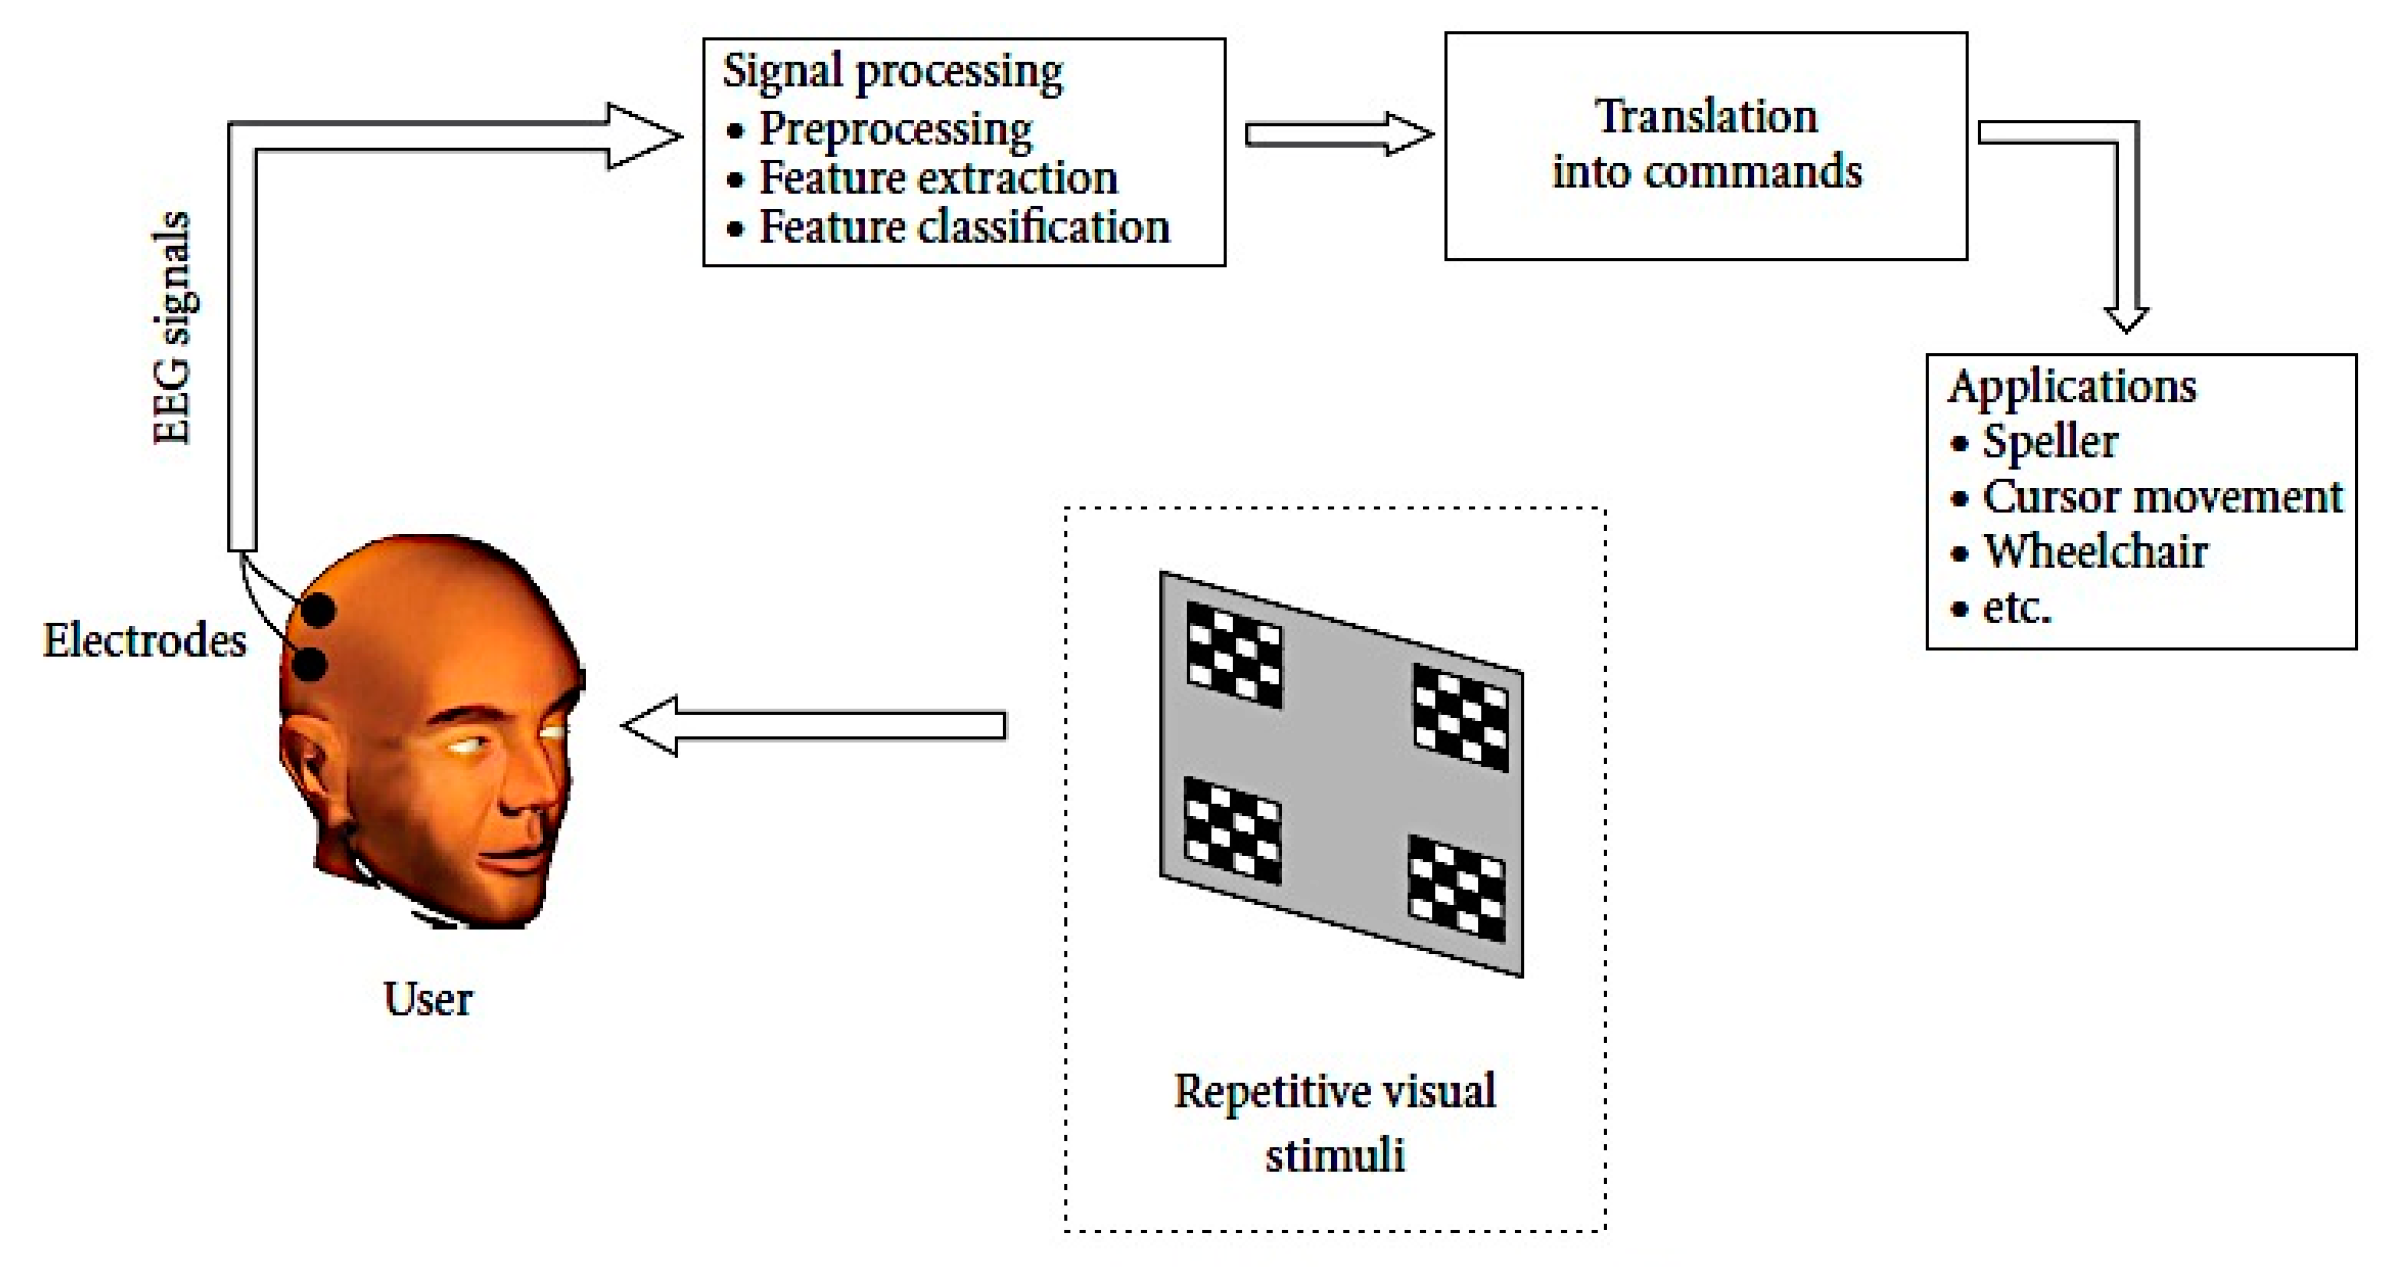
This research work consists of classifying user’s thoughts in order to translate them into commands, such as controlling wheelchairs, cursor movement, or spelling. As is illustrated in Figure 2, our proposed method followed a functional model, as is the case for any BCI, which was achieved through three main phases: data acquisition and preprocessing, feature extraction, and classification of brains activities.
2.1. Data acquisition and Preprocessing
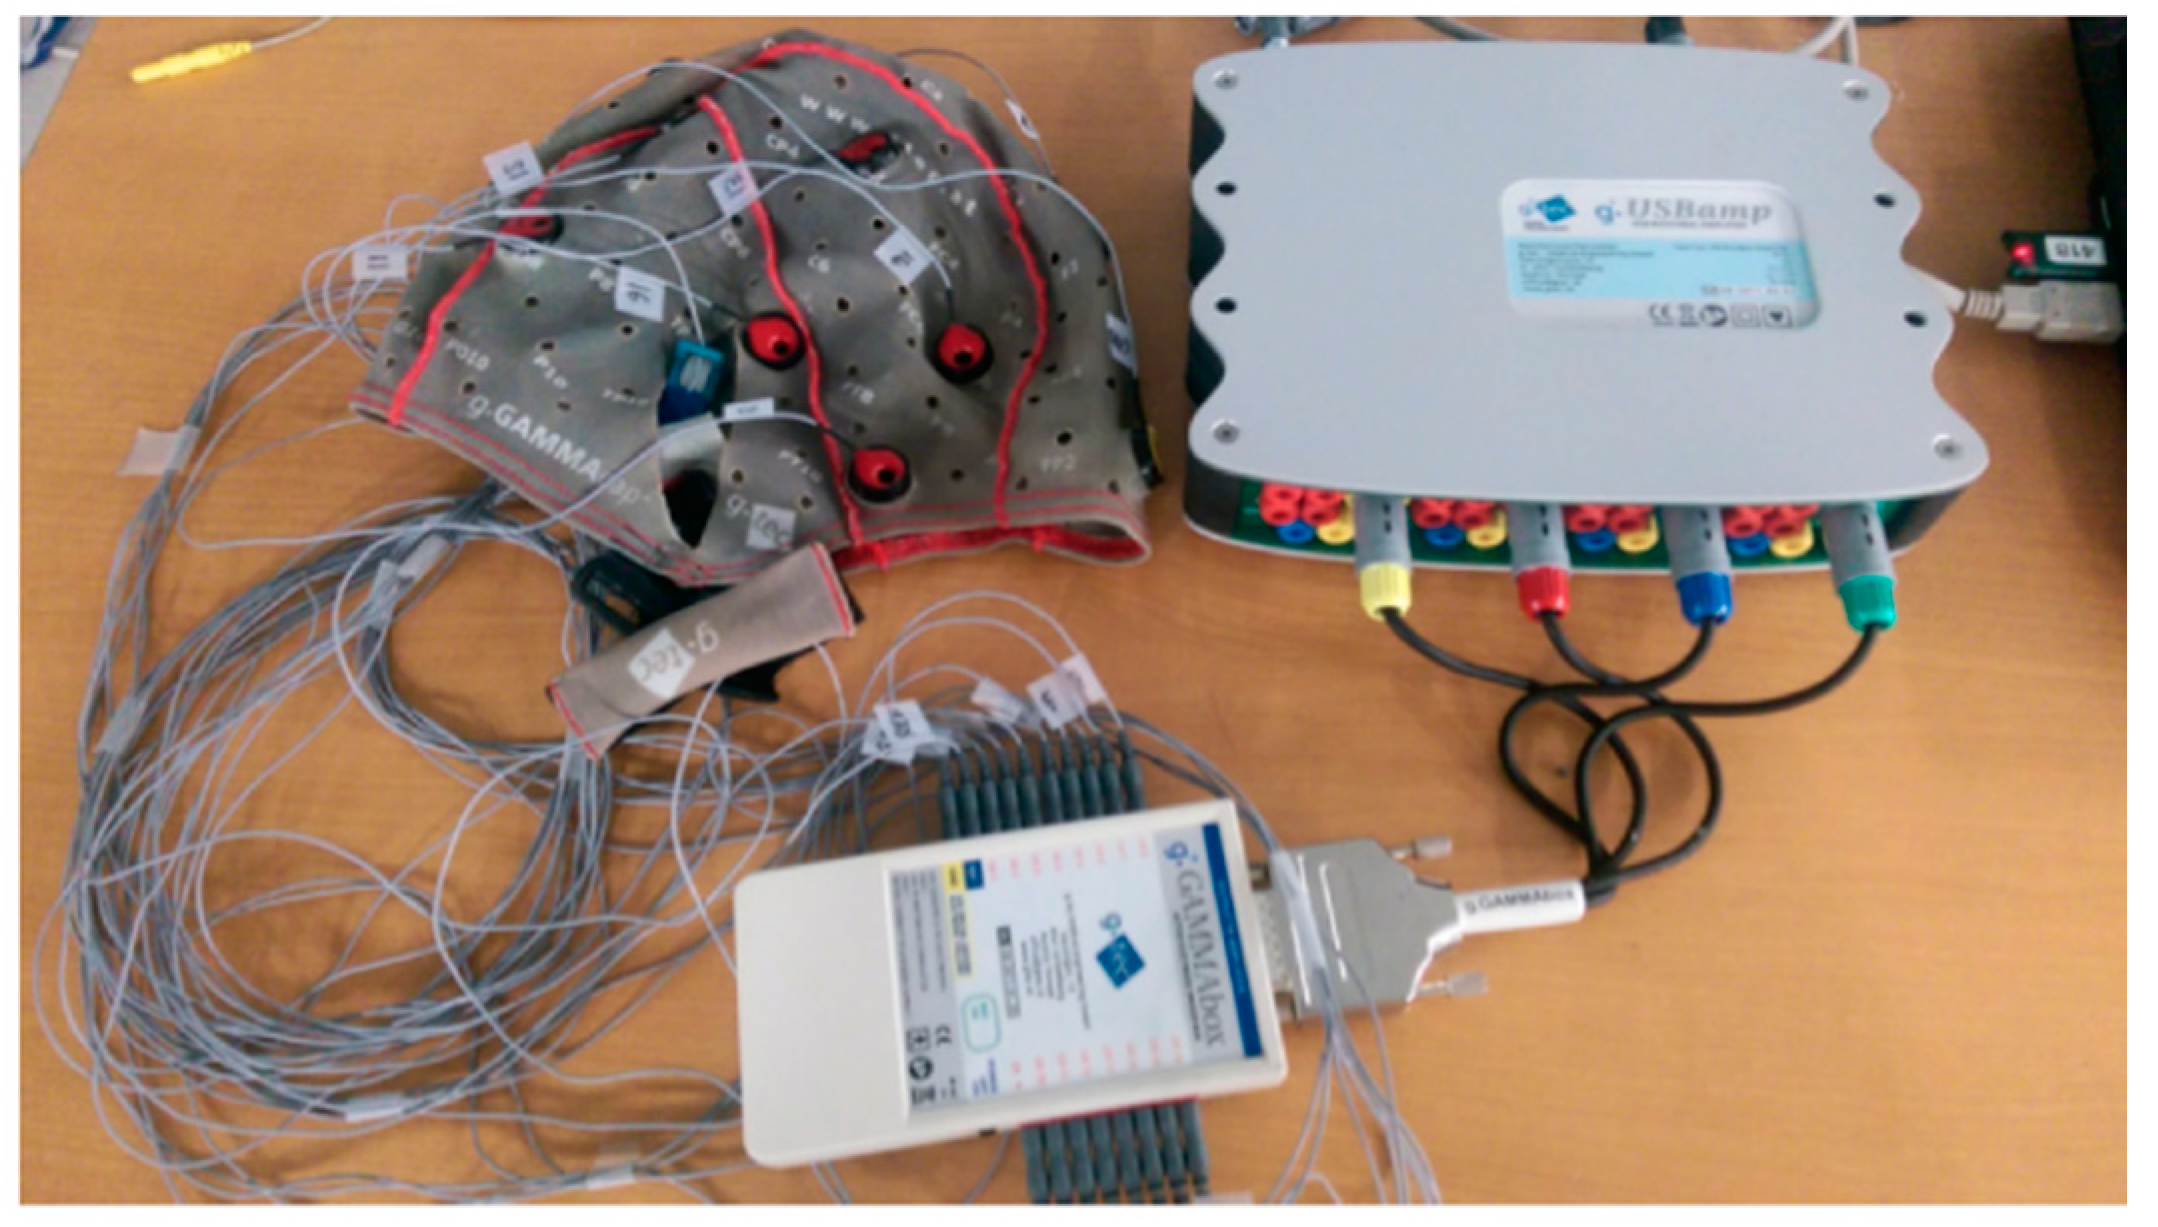
In this first phase, four subjects were enlisted to perform different experiments with different brain activities. For this purpose, G.tec equipment was used for data collection (Figure 3).
The G.tec equipment consists of g.GAMMAsys with 16 simultaneously sampled 24 bit bio-signal channels, including a driver box and a high-performance bio-signal amplifier and acquisition/processing system, called g.USBamp-RESEARCH. The latter is considered as a standard for many different fields of research, such as in BCIs.
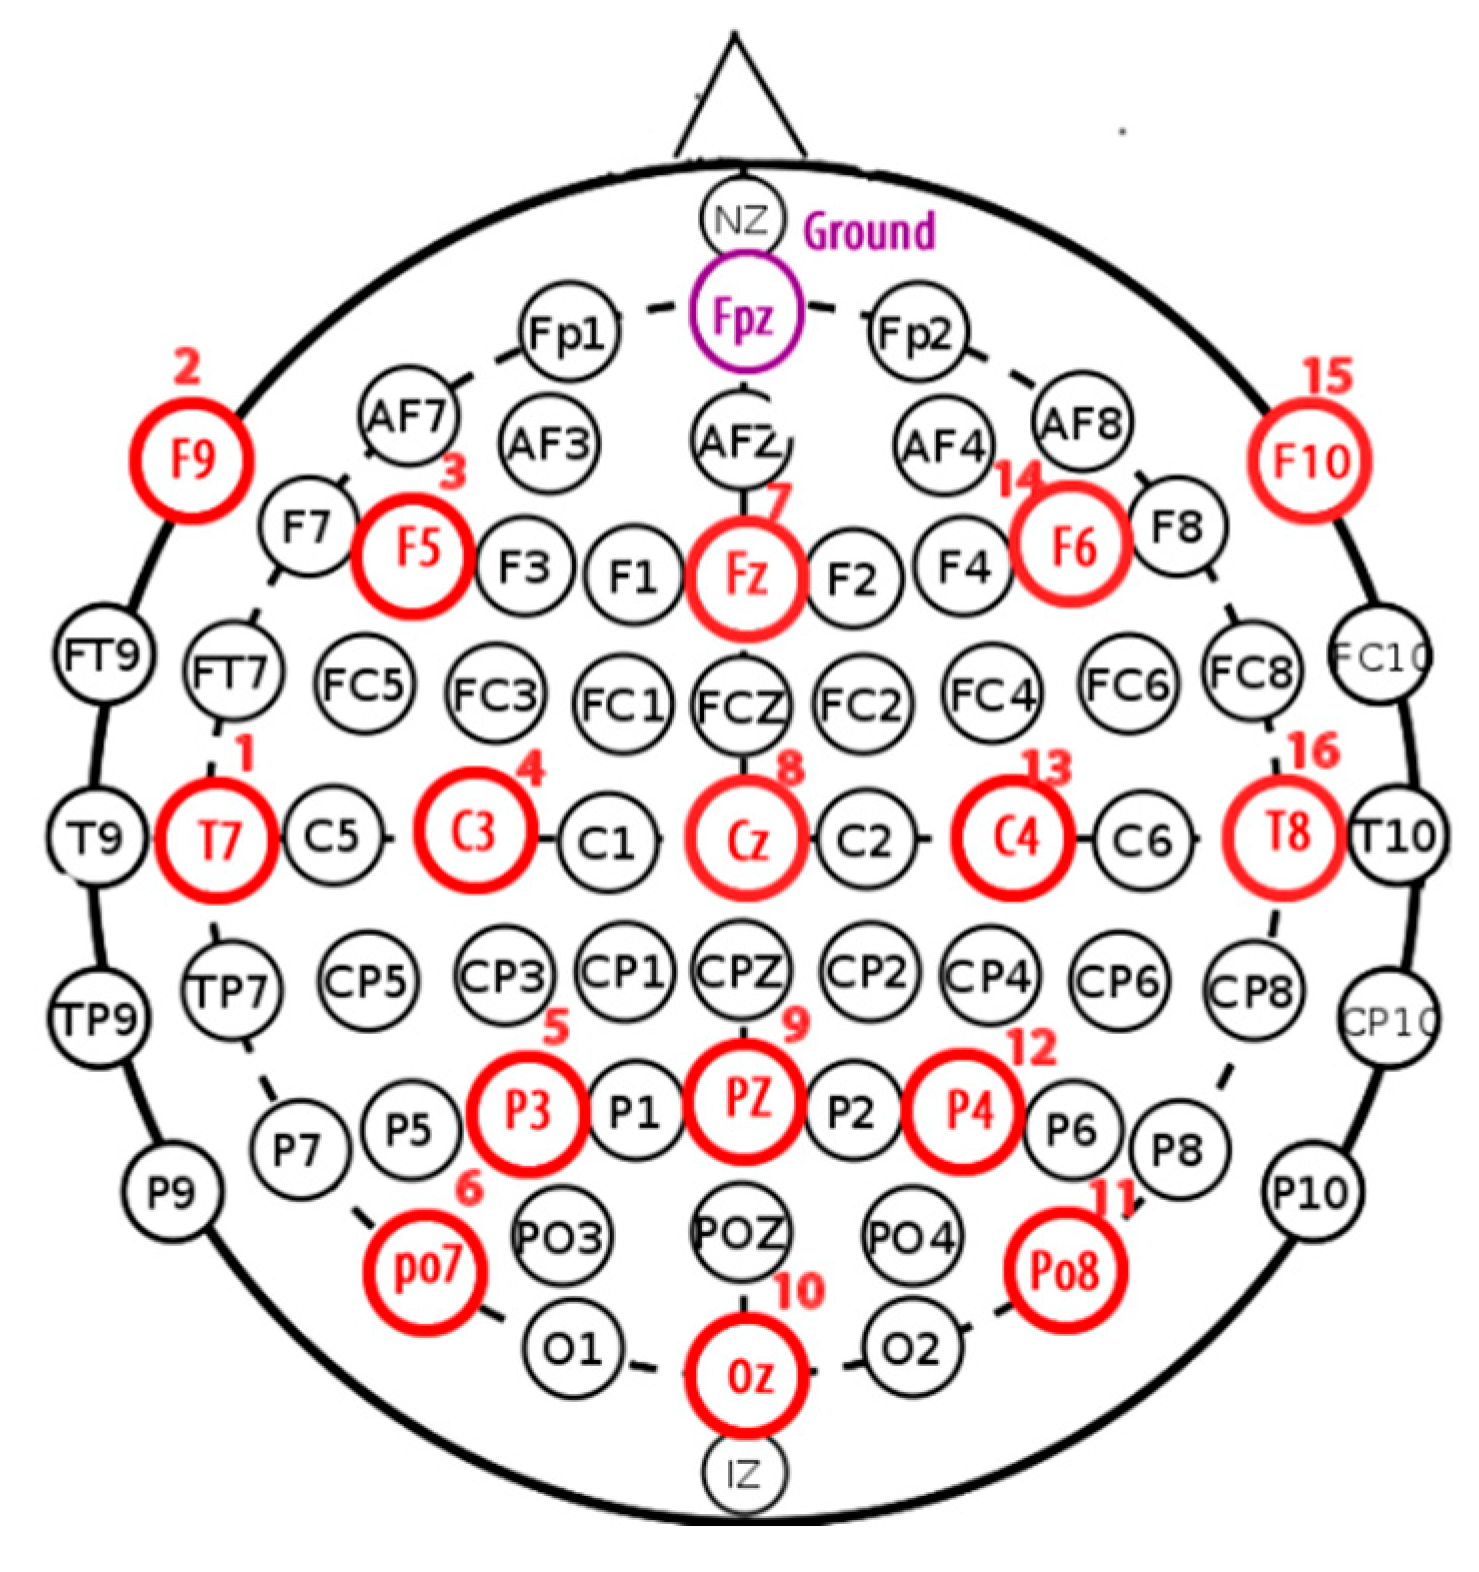
Each subject was equipped with a helmet containing 16 channels, respecting the international 10-20 system (Figure 4), and each channel provided 30,436 samples over 120 seconds.
Table 1 illustrates the nomenclature for the electrode locations corresponding to the name of each location. Electrode names consist of a single letter or multiple letters indicating the location on the head, combined with a number.
Electrode names consist of a single letter or multiple letters indicating the location on the head, combined with a number. The combination of two letters to indicate the electrode location is very intuitive, as it links the electrode label to the anatomical location on the scalp. All these combinations give straightforward labels for all electrode positions. However, as for the 10-20 standard, no rule is complete without some exceptions.
After putting channels on the helmet, a set of measures should be considered to secure experimentations. A ground channel was used in order to measure brain activities, and for proper processing and analysis of the diseases related to the brain, a reference channel was used to reduce the noise ratio or artifacts of EEG recordings by applying a filtering system. An OpenVibe application was used as a tool for data acquisition, processing, classification, and visualization of brain signals. It is an open source software platform.
2.2. Extraction of Features
In general, features of acquired EEG signals are buried away in the noise and are time domain signals with a scattered energy distribution. Extracting these features requires passes the signals through an analysis phase, where signal energy is described as a function of time or frequency. Based on previous studies [21], features extracted in the frequency domain give better results for recognition of mental tasks based on EEG signals.
The spectrum varies over time because it is nonstationary, and even if Fourier functions do not adequately represent nonstationary signals, it can be considered for feature extraction. In this direction, the fast Fourier transform (FFT) can be considered as a solution by applying the discrete Fourier transform (DFT) to the signal and finding its spectrum.
In this work, we introduce a temporal window applied to Fourier functions, which a provide time interval Fourier transform (TIFT), which is a type of time–frequency representation (TFR). The discrete TIFT can be described as below:
where denotes a signal and denotes an L-point window function. As in [12], the TIFT can be defined as the Fourier transform of the product .
The signal is divided into small sequential windows of data frames and an FFT is applied to each one. The generated time–frequency representation of the signal is truncated into short data frames by multiplying it by a window, so that the edified signal is zero outside the data frame. For feature extraction, we implement the most commonly used method, root mean square error (RMSE) [22,23]. The latter is computationally efficient and quick, and can be defined by the following formula:
where is the ith component of the FFT applied to EEG signal with points.
2.3. Brains Activity Classification
Classification of brain activities aims to discriminate different tasks according to data provided during the feature extraction phase. For this purpose, we propose an adaptive classifier for mental tasks that employs two phases of implementation: learning and clustering.
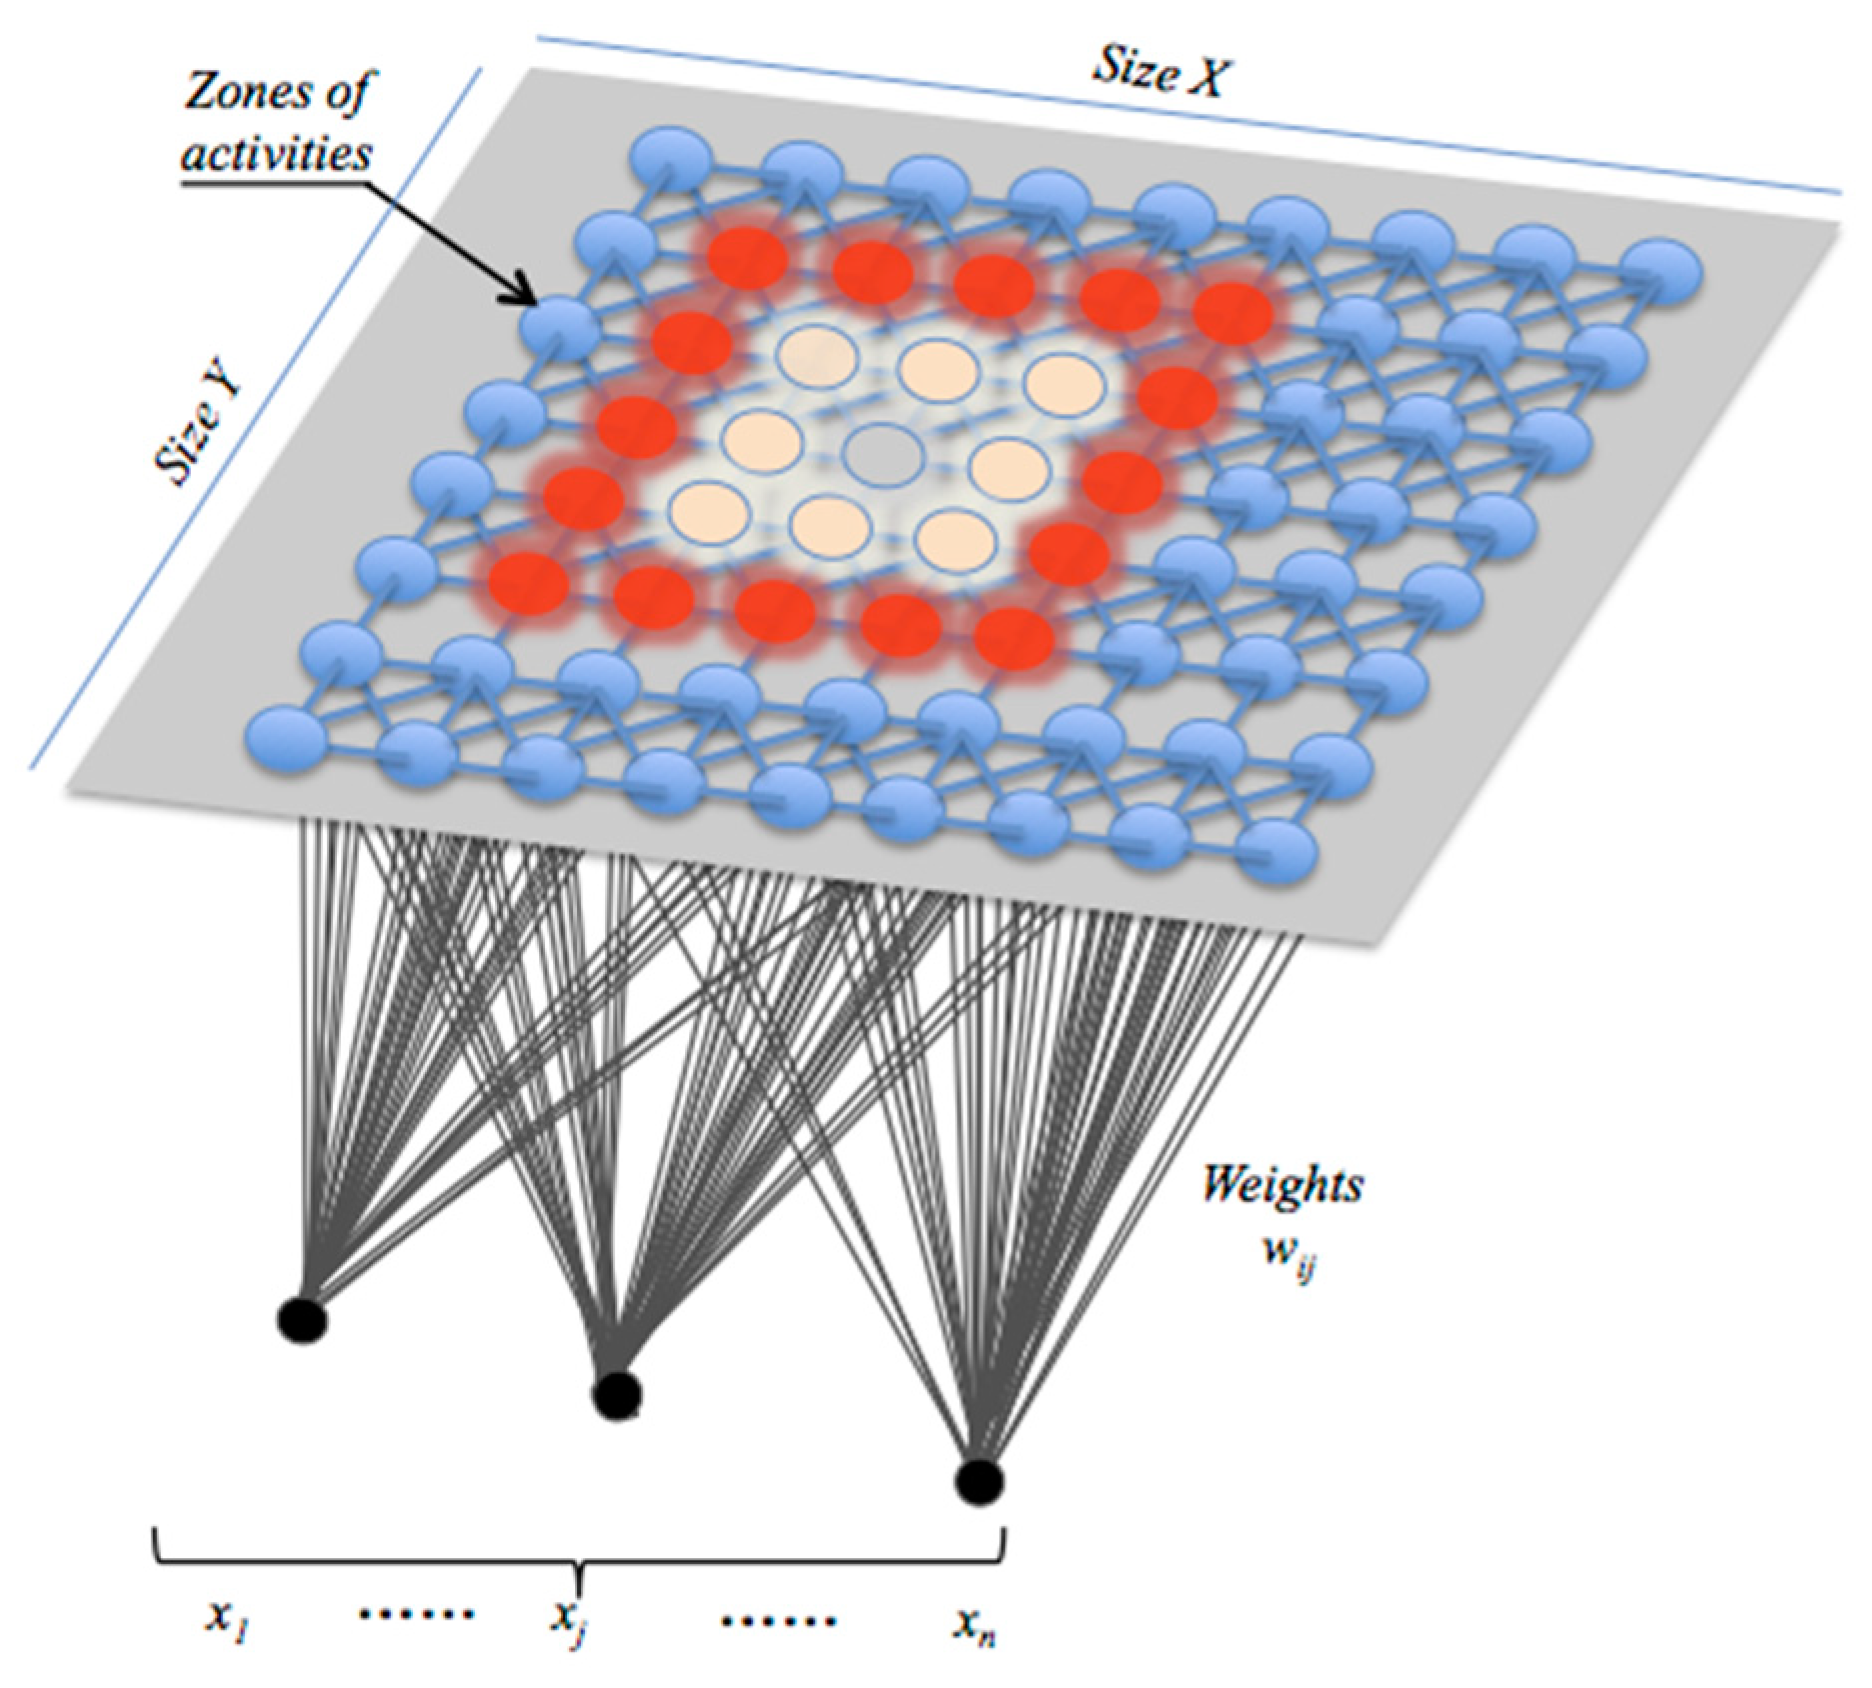
The learning phase implements a learning process based on a self-organizing map (SOM) and computes data according to a random and cyclic algorithm, which begins in our case by initializing whole activities associated with each BCI sensor. Developed by Kohonen, SOM is organized around a set of interconnected processing neurons intended for competing signals [24]. The SOM network belongs to the category of unsupervised learning networks, and does not require any human intervention. As is illustrated in Figure 5, it can map the input data space spanned by onto a one- or a two-dimensional array of neurons. It also represents a clustering concept by grouping similar data together, reducing data dimensions at the end and displaying similarities among data. Once received, the network learns that data until satisfying an error criterion. Input variable values are gradually adjusted in an attempt to preserve neighborhood relationships that exist within the input data set. The neuron location in the map is very important, and as it gets closer to the input object, the vector weights of the winning neuron are adjusted along with its neighbors.
Thus, weight updates for a given node , knowing that is the winner labeled as the best-matching unit (BMU), follow the rule defined below:
The neighborhood function decreases according to the step index , so that:
where
represents the Euclidian distance between neurons and on the map.
The value of the learning rate decreases according to the step index ( is the maximum number of iterations), as follows:
The coefficient determines the neighborhood radius around the winning neuron, so that:
The following parameters , , and are initialized in order to produce the best map of the neural net as quickly as possible.
The Euclidean distance between each selected BMU and its neighbors is calculated until stabilization of the neighborhood function is achieved. Once the learning is complete, the output of each SOM network is determined by membership degrees of the considered activities.
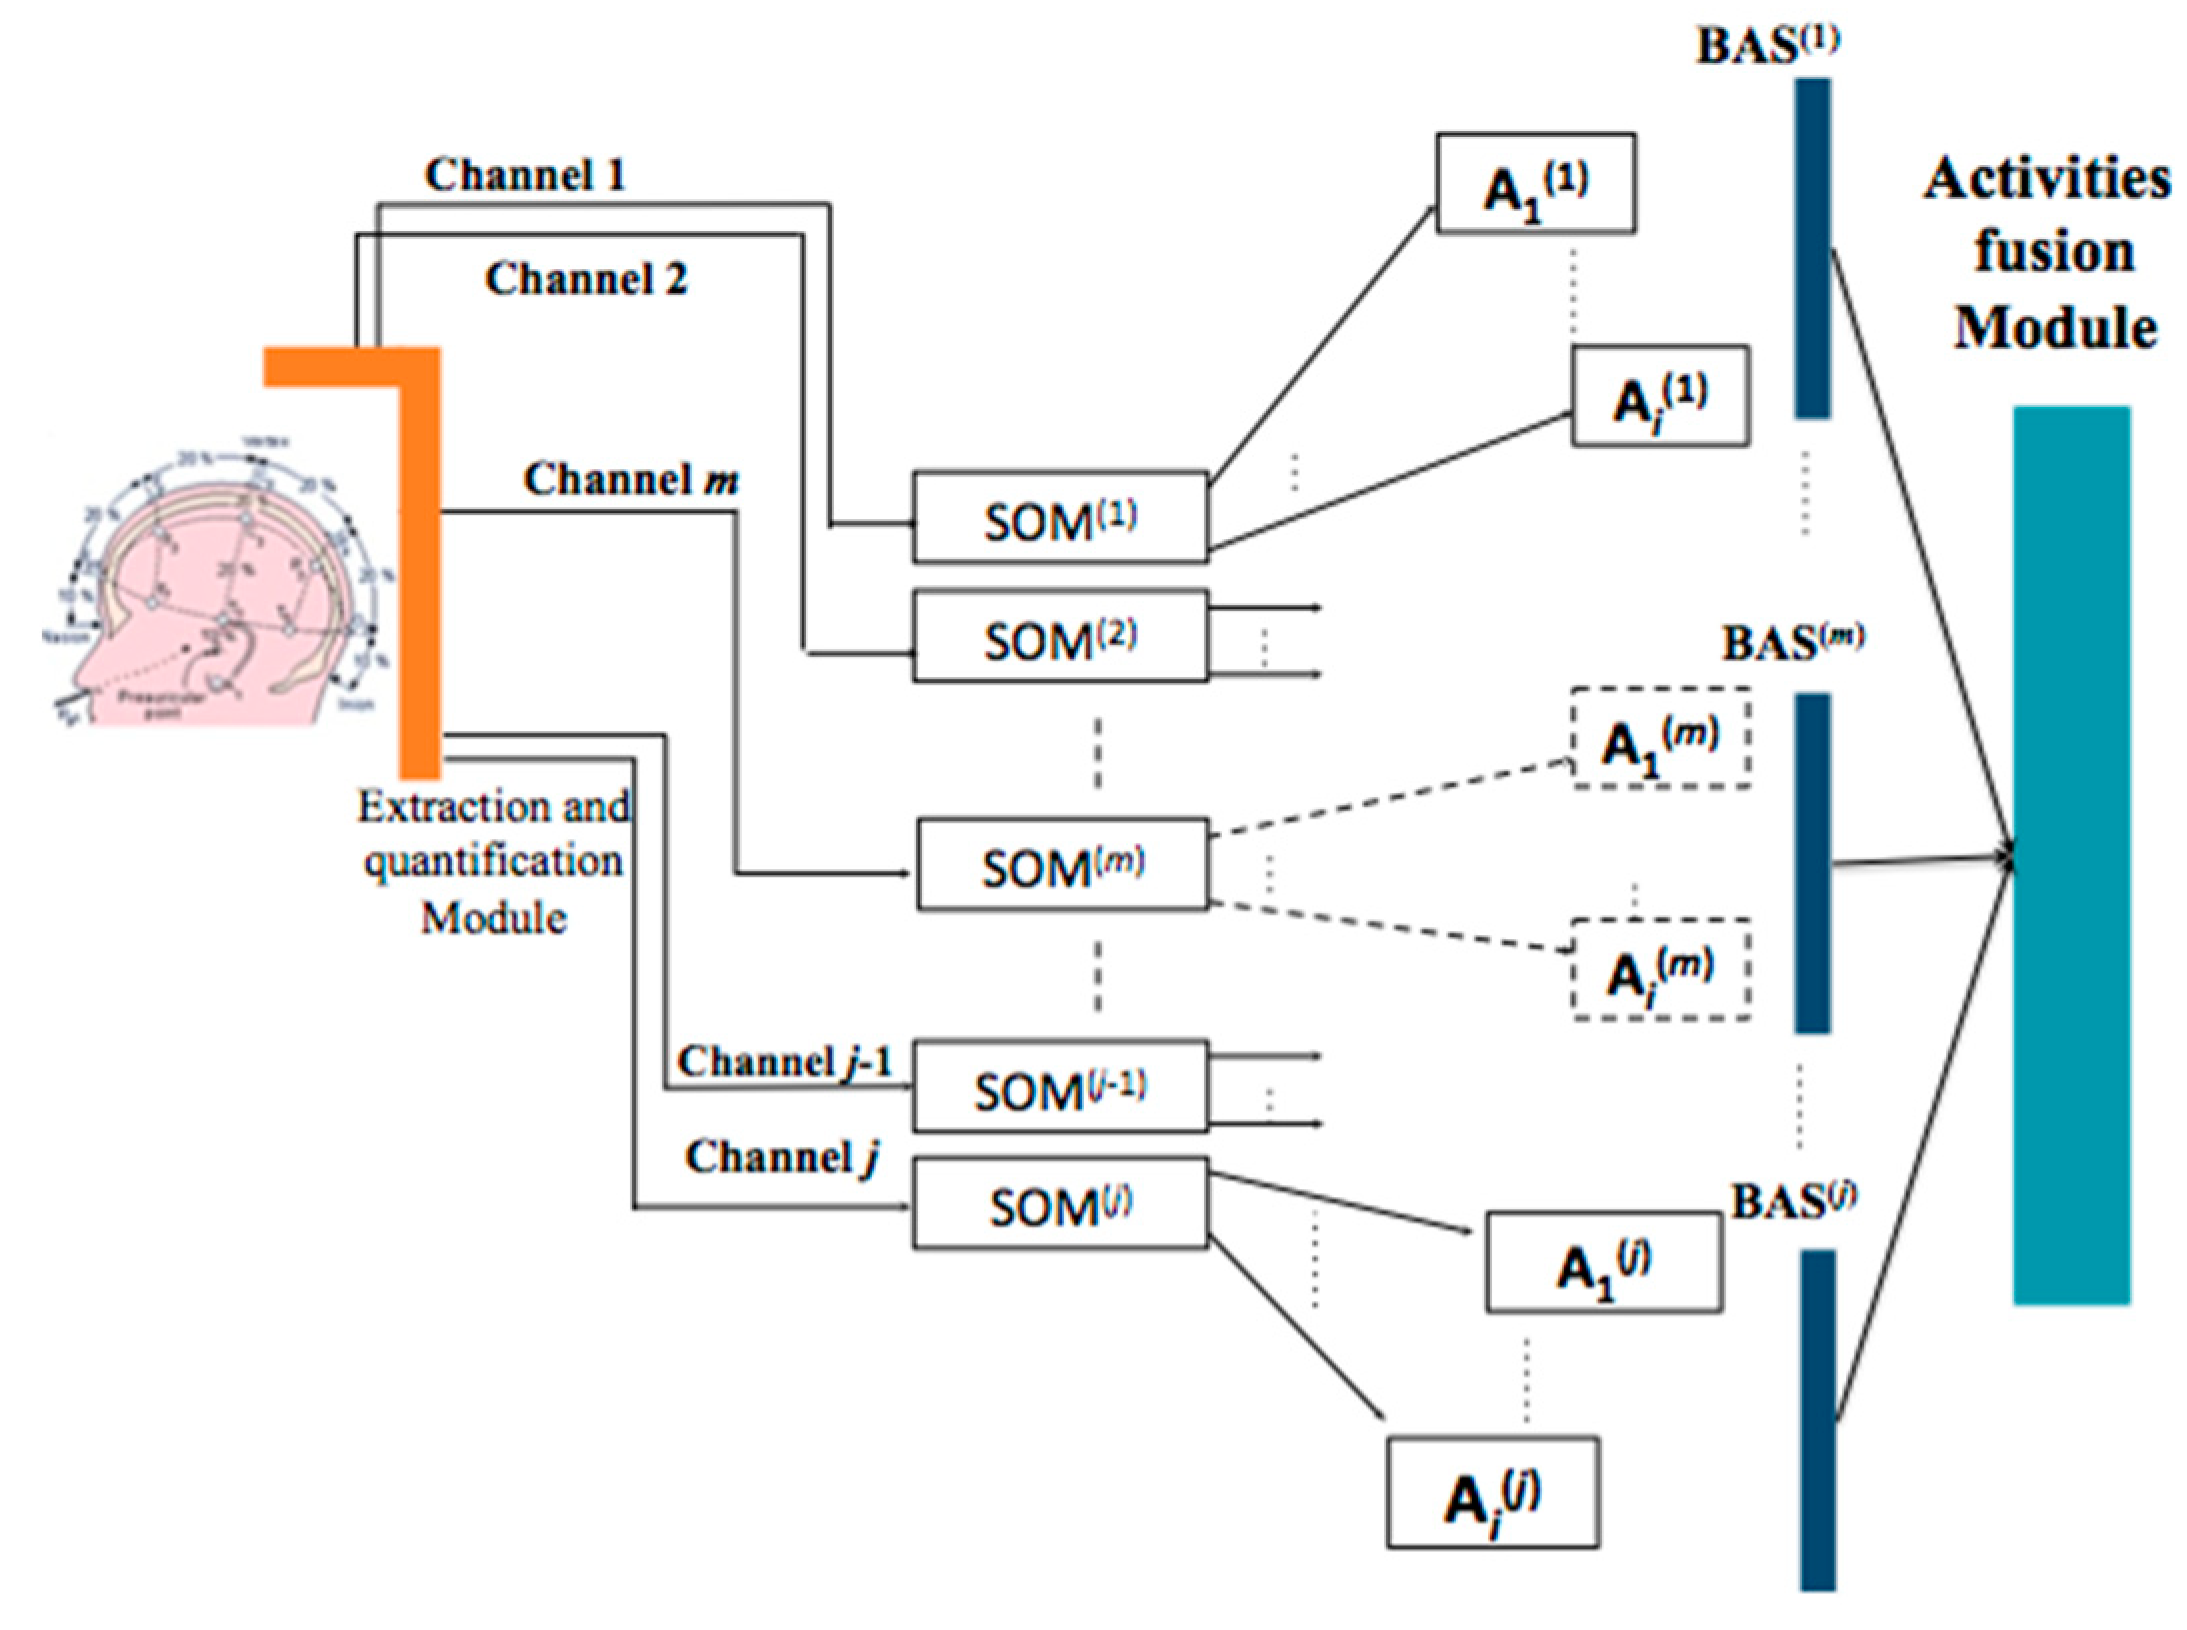
As illustrated in Figure 6, the proposed classifier consists of a set of 16 SOM networks, with each one associated with a given channel. Each SOM network generates its own map containing whole activities that are supposed to be classified.
In our case, we considered five activities, as illustrated in Table 2. The proposed classifier architecture integrates two more layers, implementing best activities selection (BAS) and fusion functions.
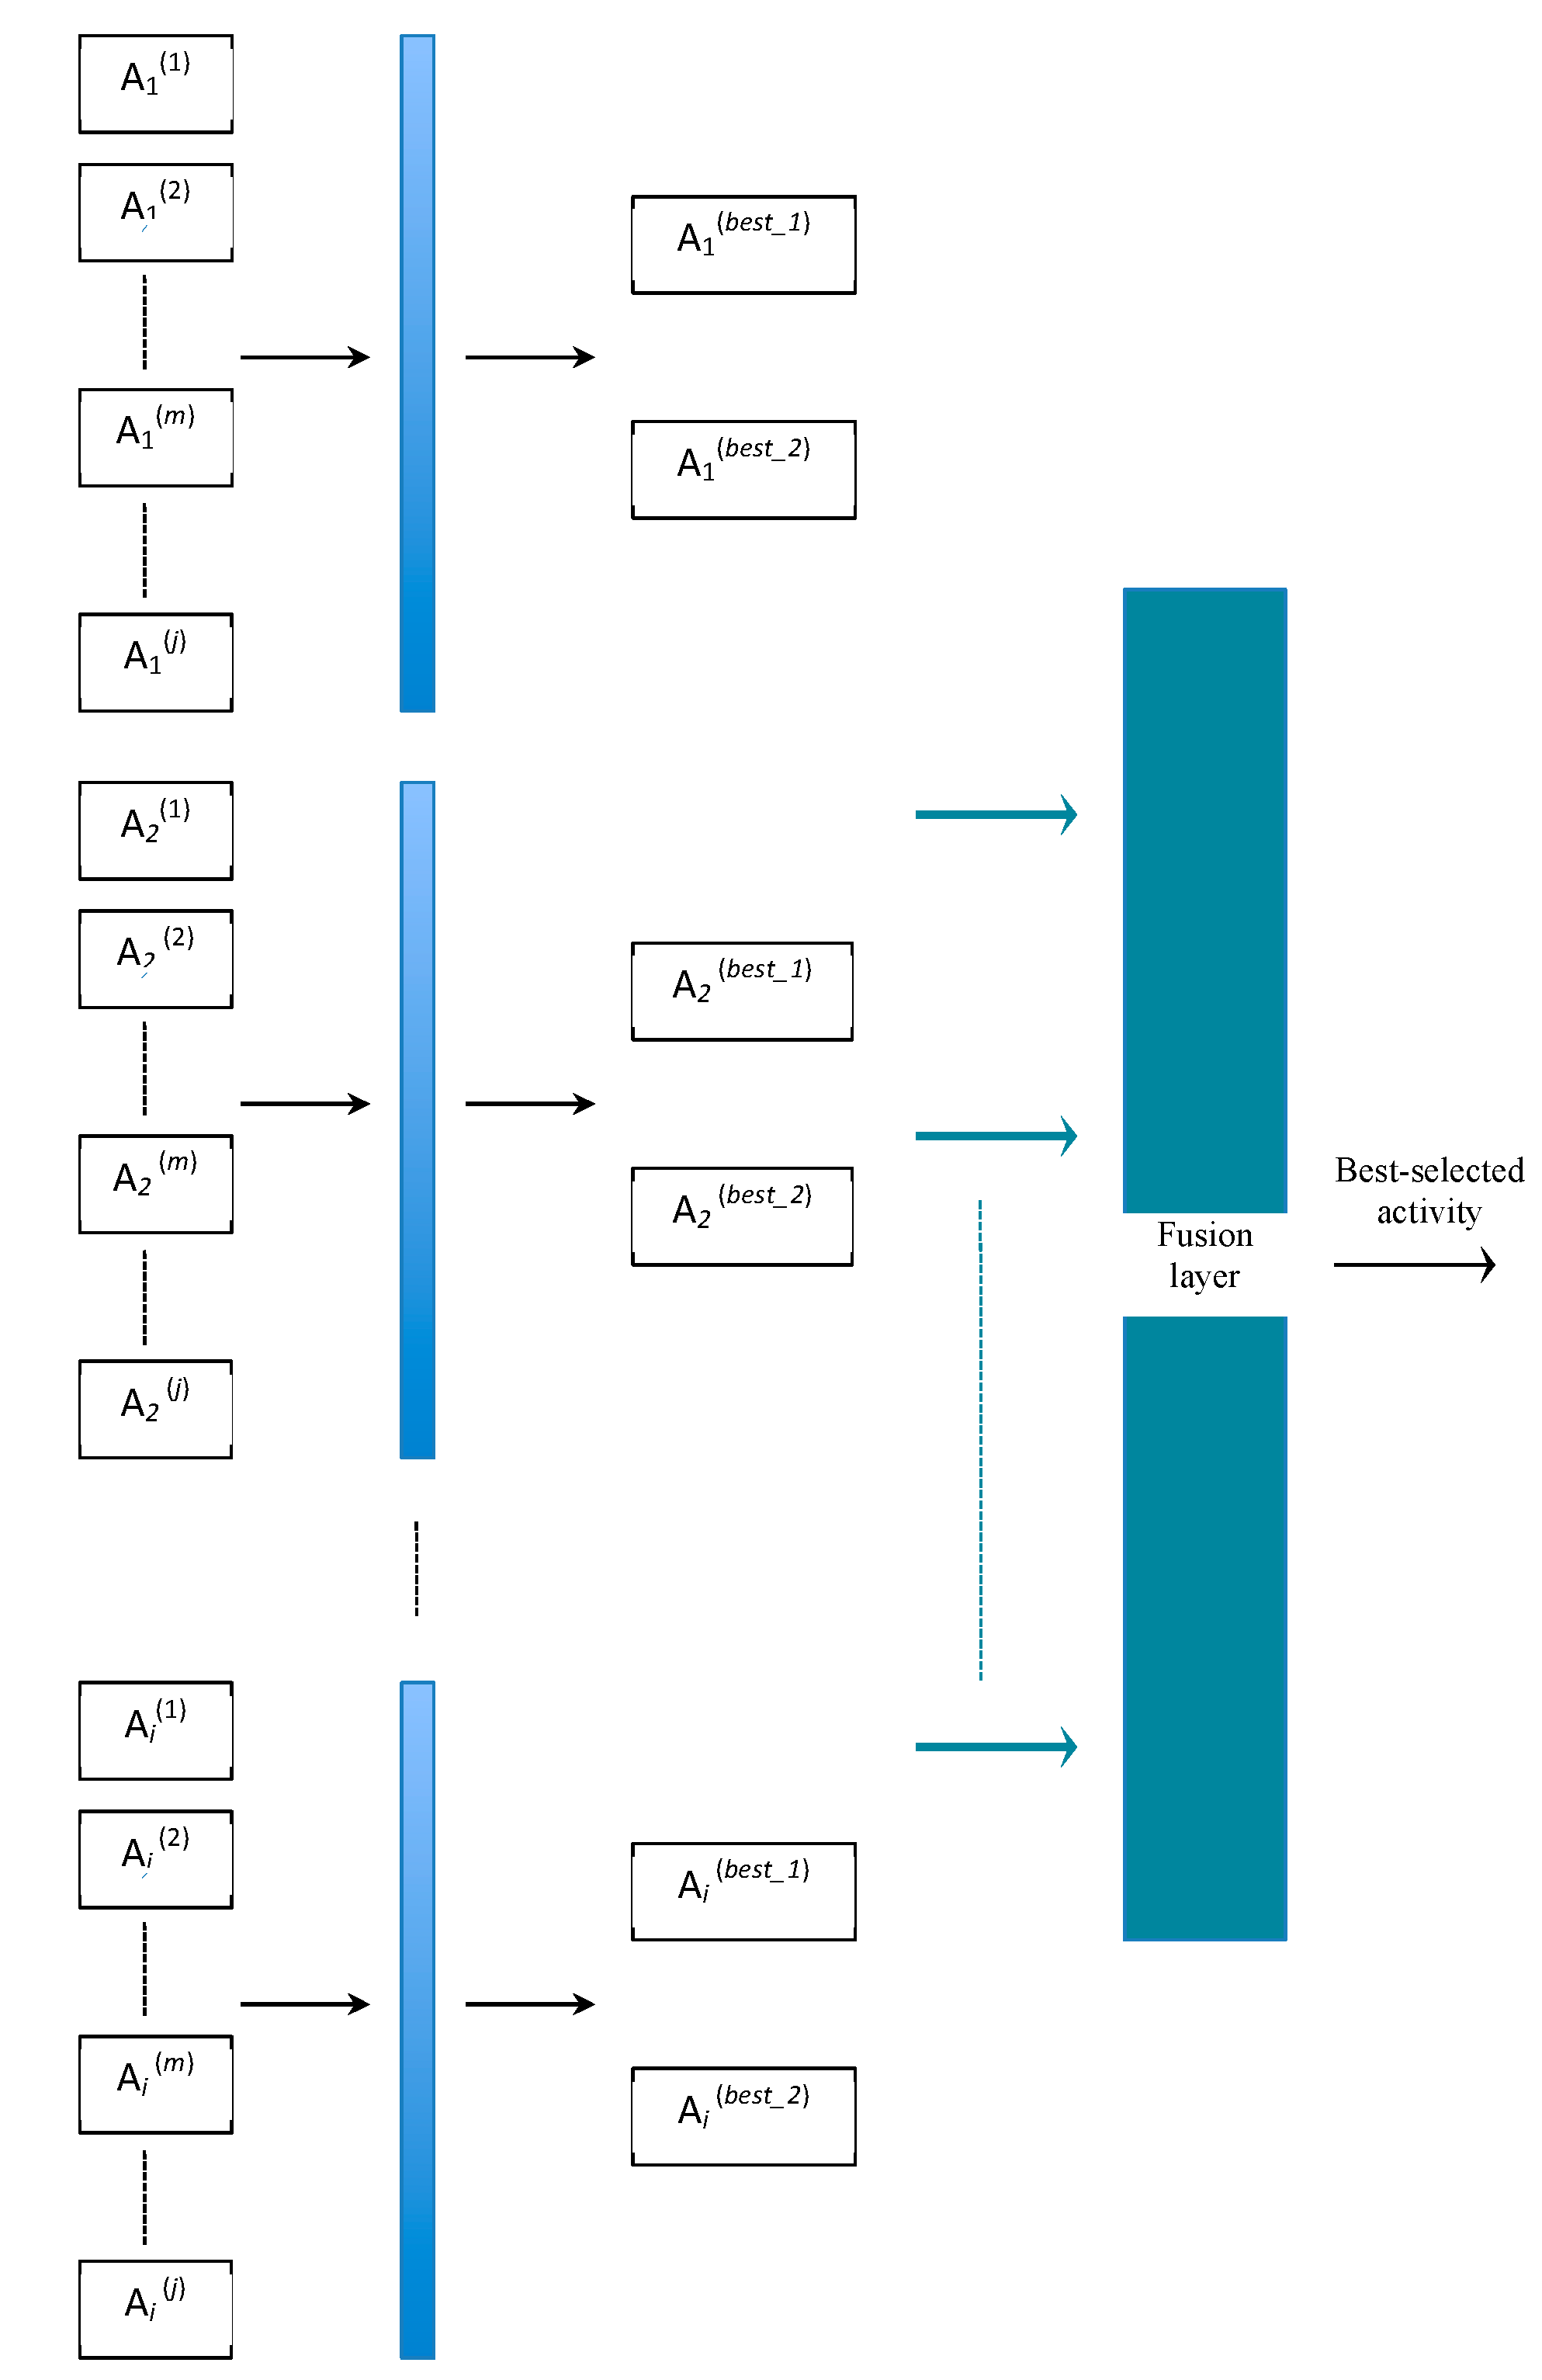
The selection layer corresponding to the best activities selection (BAS) layer generates the best activity according to the level of membership degree of each activity ( and indicates different indices associated with activities and maps. In this layer, a couple of the best activities () with higher percentages of appearance are selected for each map (Figure 7). In fact, when people try to do two things at the same time, each half of the brain focuses on a separate task. That is why it is so hard for people to multitask and why people are more inclined to make irrational decisions when it comes to choosing from a long list of items. Studies conducted by Charron and Koechlin [25] on more than 30 subjects consisting of monitoring their brain activity by performing a letter-matching test using imaging techniques concluded that the brain was able to control switching between the two hemispheres when carrying out dual functions, but accuracy suffered when a third was added.
The fusion layer is a decision-making layer that calculates the real activity using the mean method for each activity generated by each map (Figure 7). This is done according to the following formula:
where is the number of maps.
3. Experimental Results and Discussion
As announced previously, we propose an effective classification method based on the SOM in order to classify five different brain activities recorded from ten subjects: conversing, reading a text written in English, watching a video with sound, resting, and working on solving a mathematical equation. In this section, in order to illustrate different behaviors of the brain, we will consider only results related to three activities, namely working (solving a mathematical problem), resting, and watching a video. Thus, without relying on a scientific basis, one would tend to say that when solving a mathematical problem, the brain would be in intense activity and neurons would generate EEG signals, during the rest period they would be inactive, and for the third activity of watching a video, only the visual cortex would react.
Note that the notion of a raw signal insinuates the possibility that signals are noisy and contain artifacts that can contaminate the quality of classification of activities. These unwanted signals mainly originate from environment noise, experimental error, and physiological artifacts. Furthermore, the environment artifacts and experiment error, which come from external factors, are classified as extrinsic artifacts, whereas the physiological body itself, such as eye blinking, muscle activity, and heartbeat, can be categorized as intrinsic artifacts.
Therefore, it is necessary to pass the signals through a filtering phase in order to extract specific characteristics of each activity for identification.
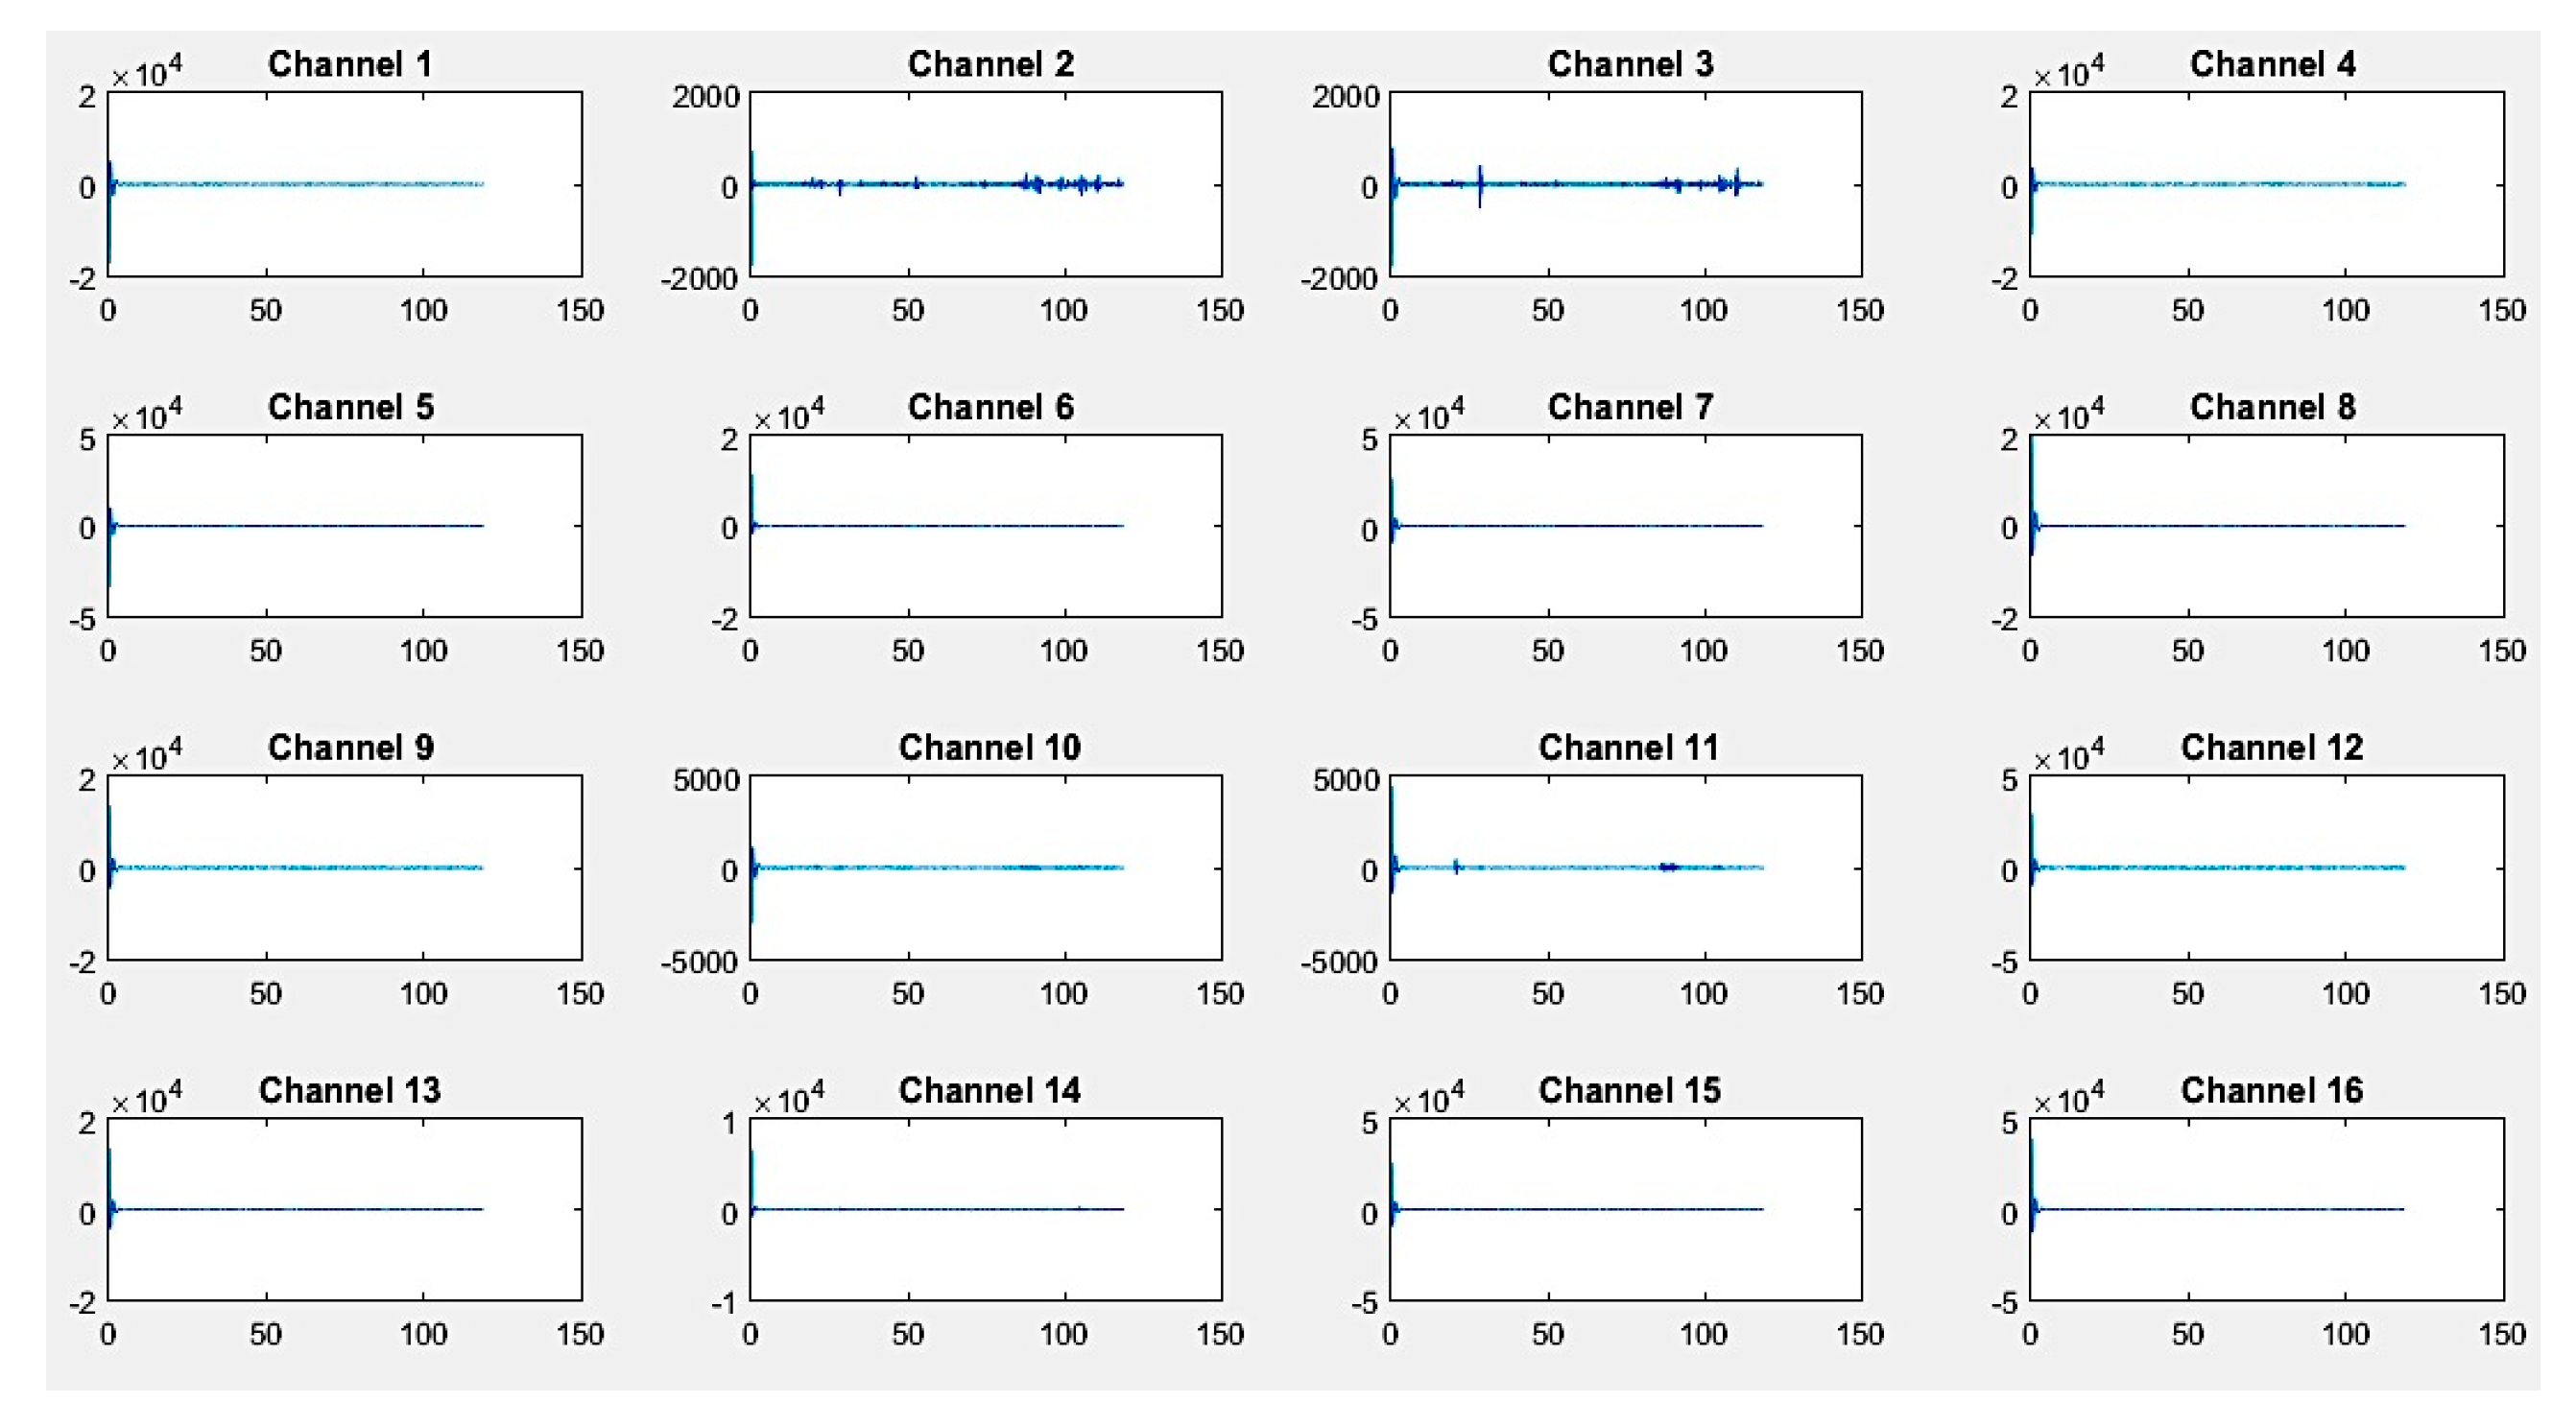
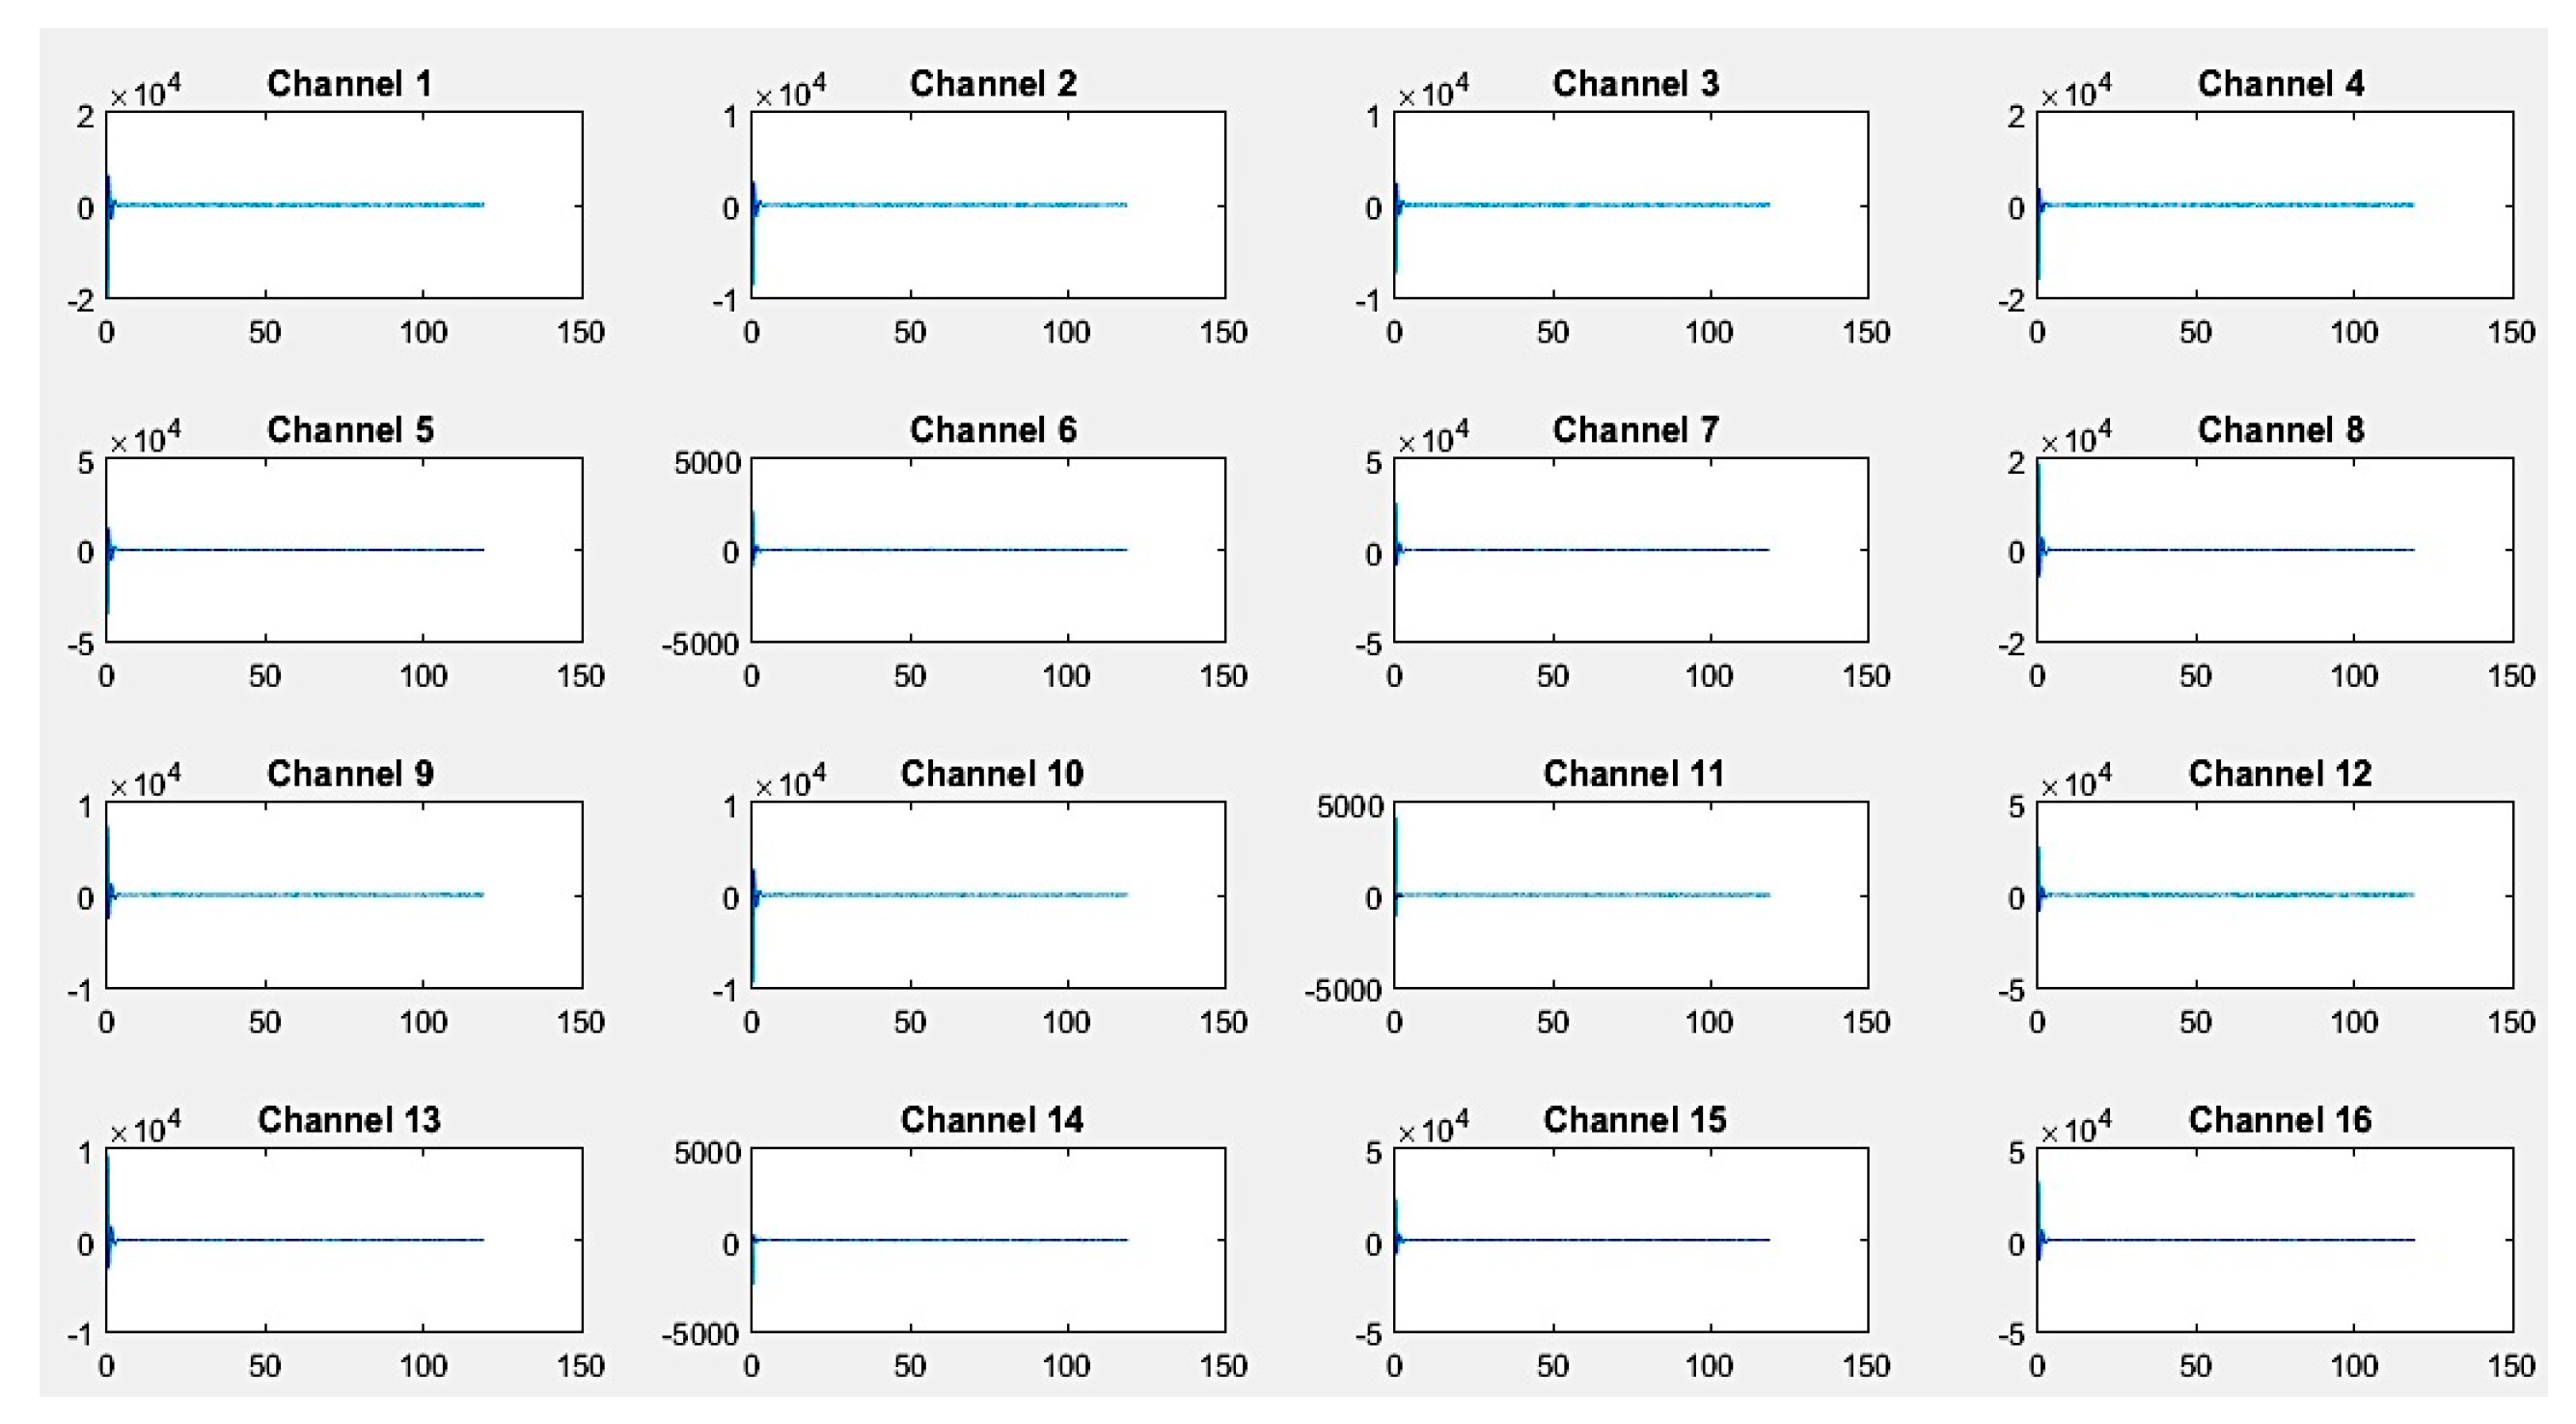
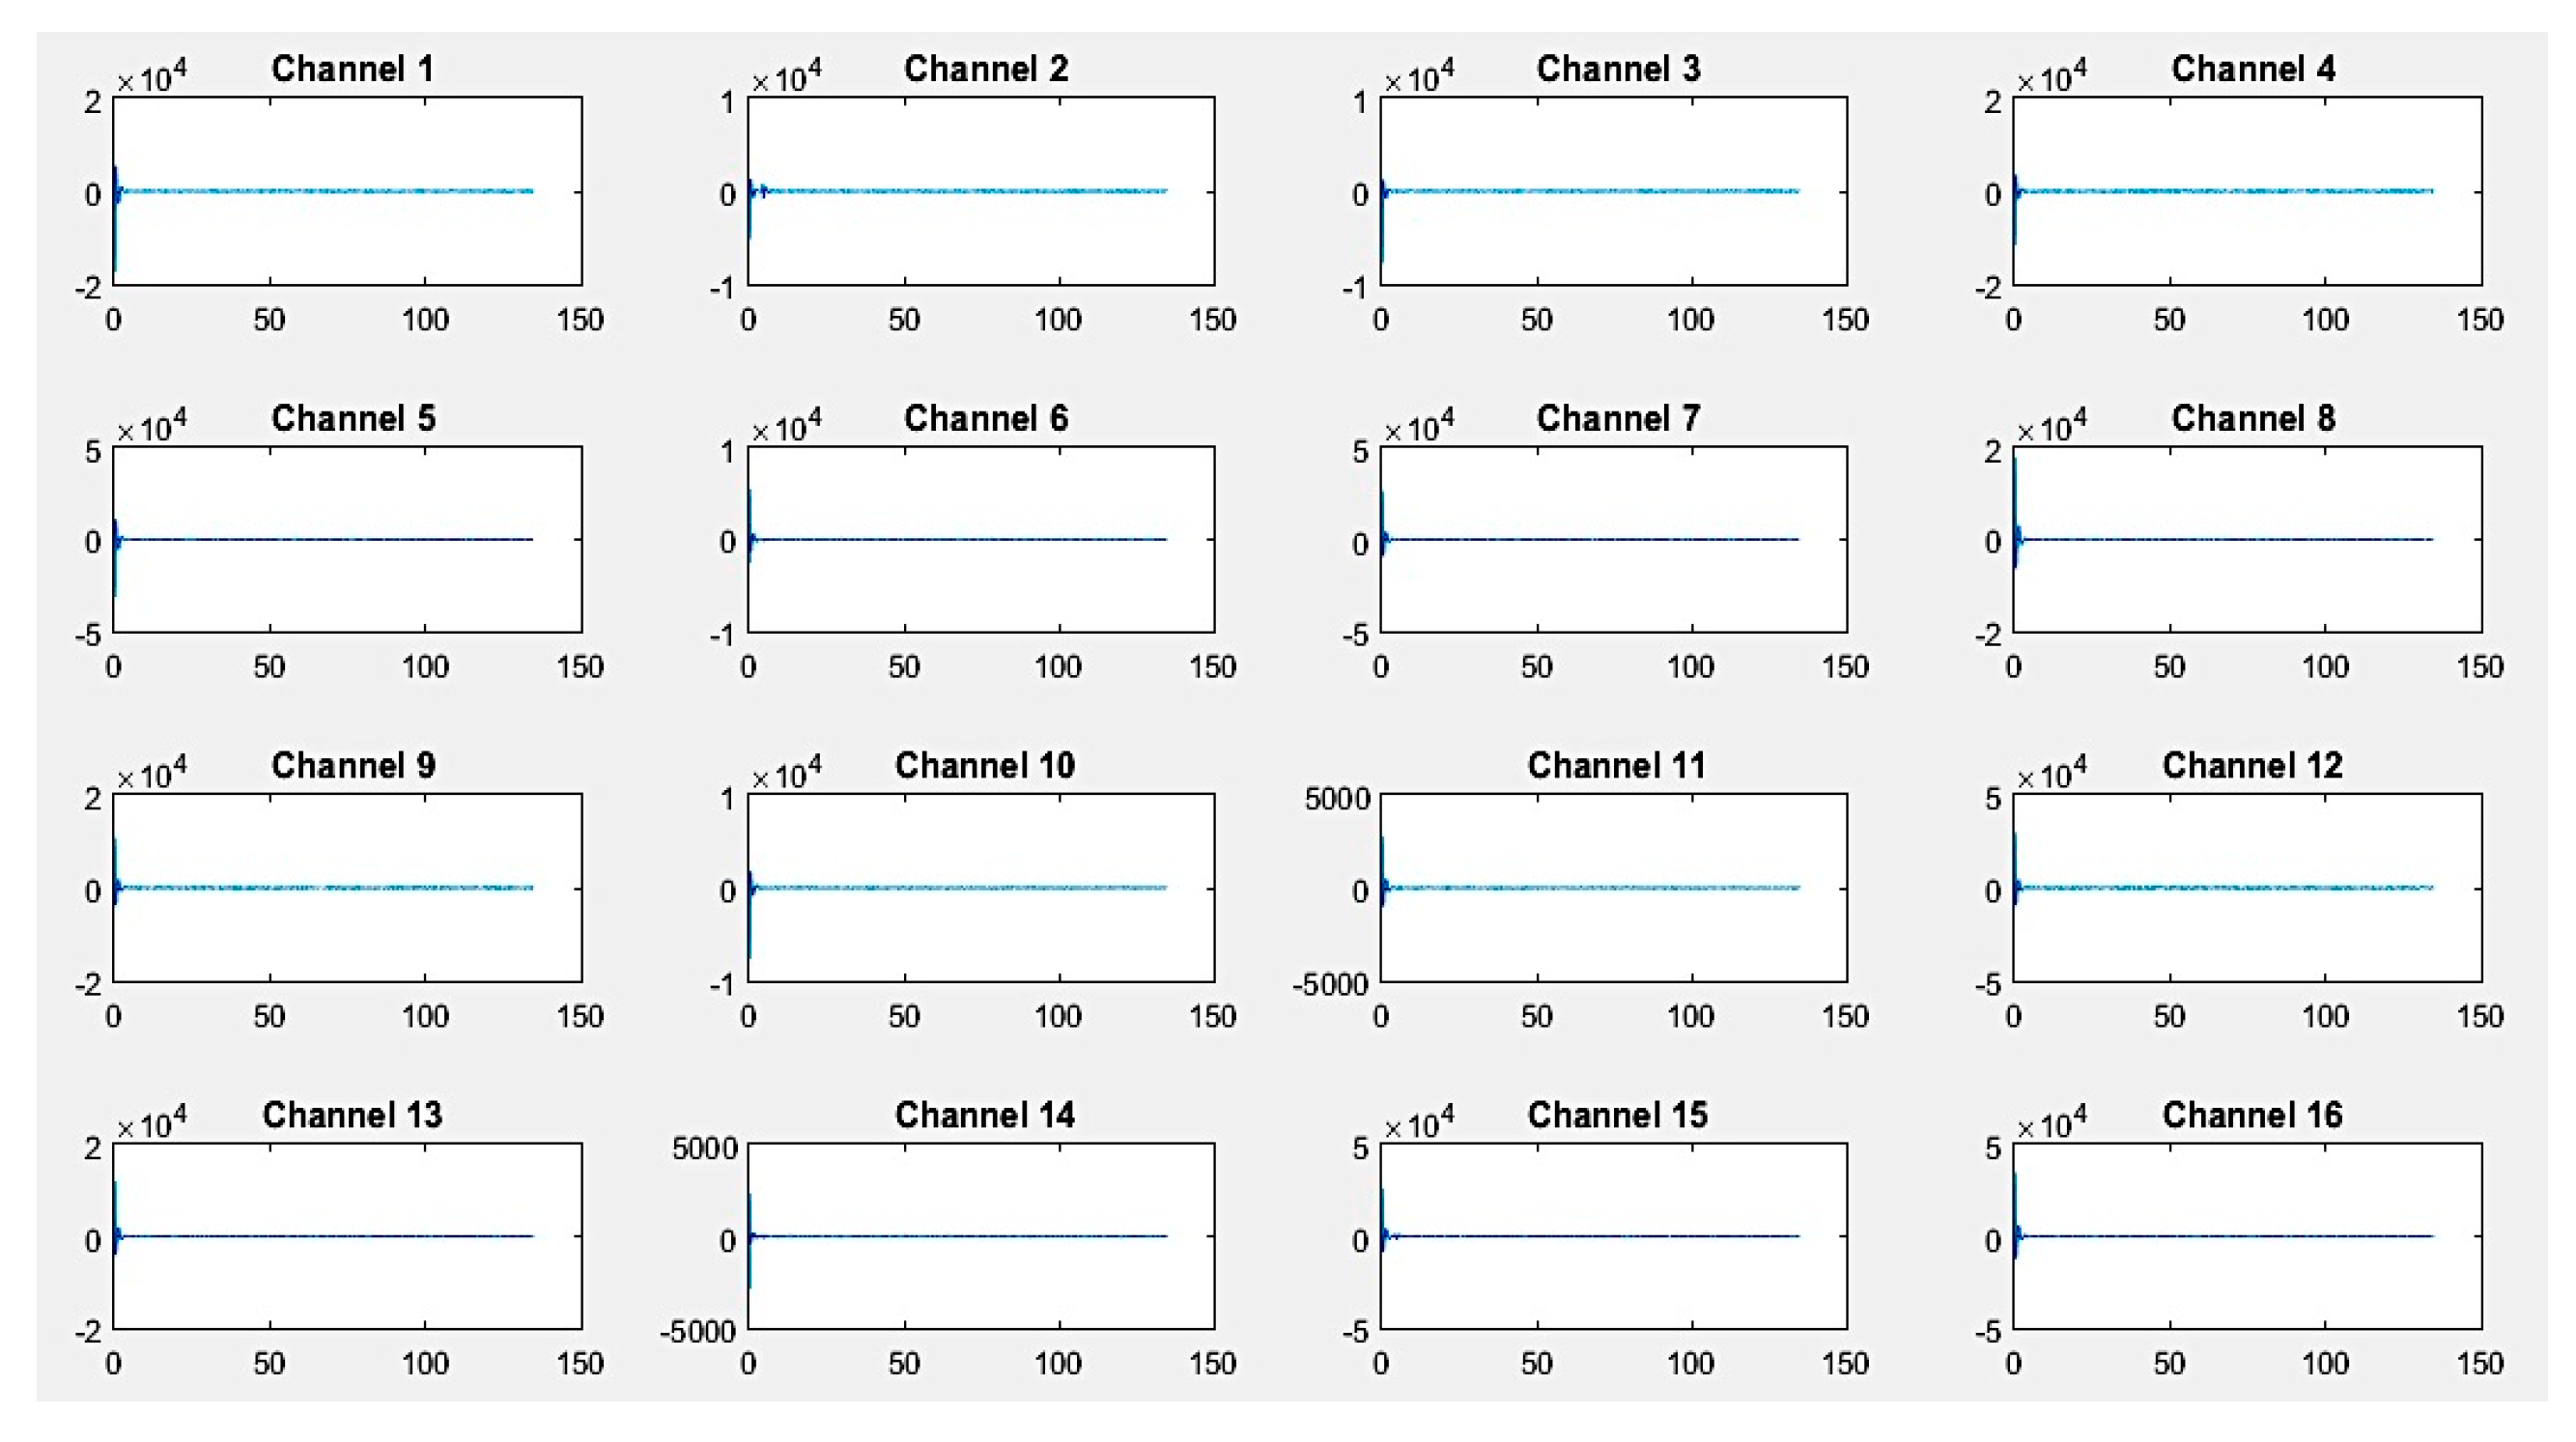
First, recordings of raw EEG signals were recovered by the G.tec experimental device over a period of 120 seconds and are shown in Figure 8, Figure 9 and Figure 10. These signals represent the amplitude in microvolts according to the time of acquisition in seconds.
If we closely look to the different EEG signals perceived during experimentation, one can note that the correct positioning of electrodes can reflect real activities in the brain. Thus, as an example in the first activity, "solving a mathematical problem", the most sensitive electrodes correspond to channels 2, 3, 10, and 11 are associated with the active parts of the brain.
On the other hand, in the third activity, "watching a video", we notice at first glance a particular sensitivity in channels 2–4, 9, 11, 12, and 14. For the second activity, "resting", we note that there are some disturbances on all channels, but without any particular sensitivity.
The noninvasive method for raw signal acquisition is essential for data analysis. This implies significant data loss and artifacts that must be filtered. For this purpose, a quantization method using a fast computation FFT technique combined with RMSE for feature extraction were applied conjointly to improve the quality of the acquired data.
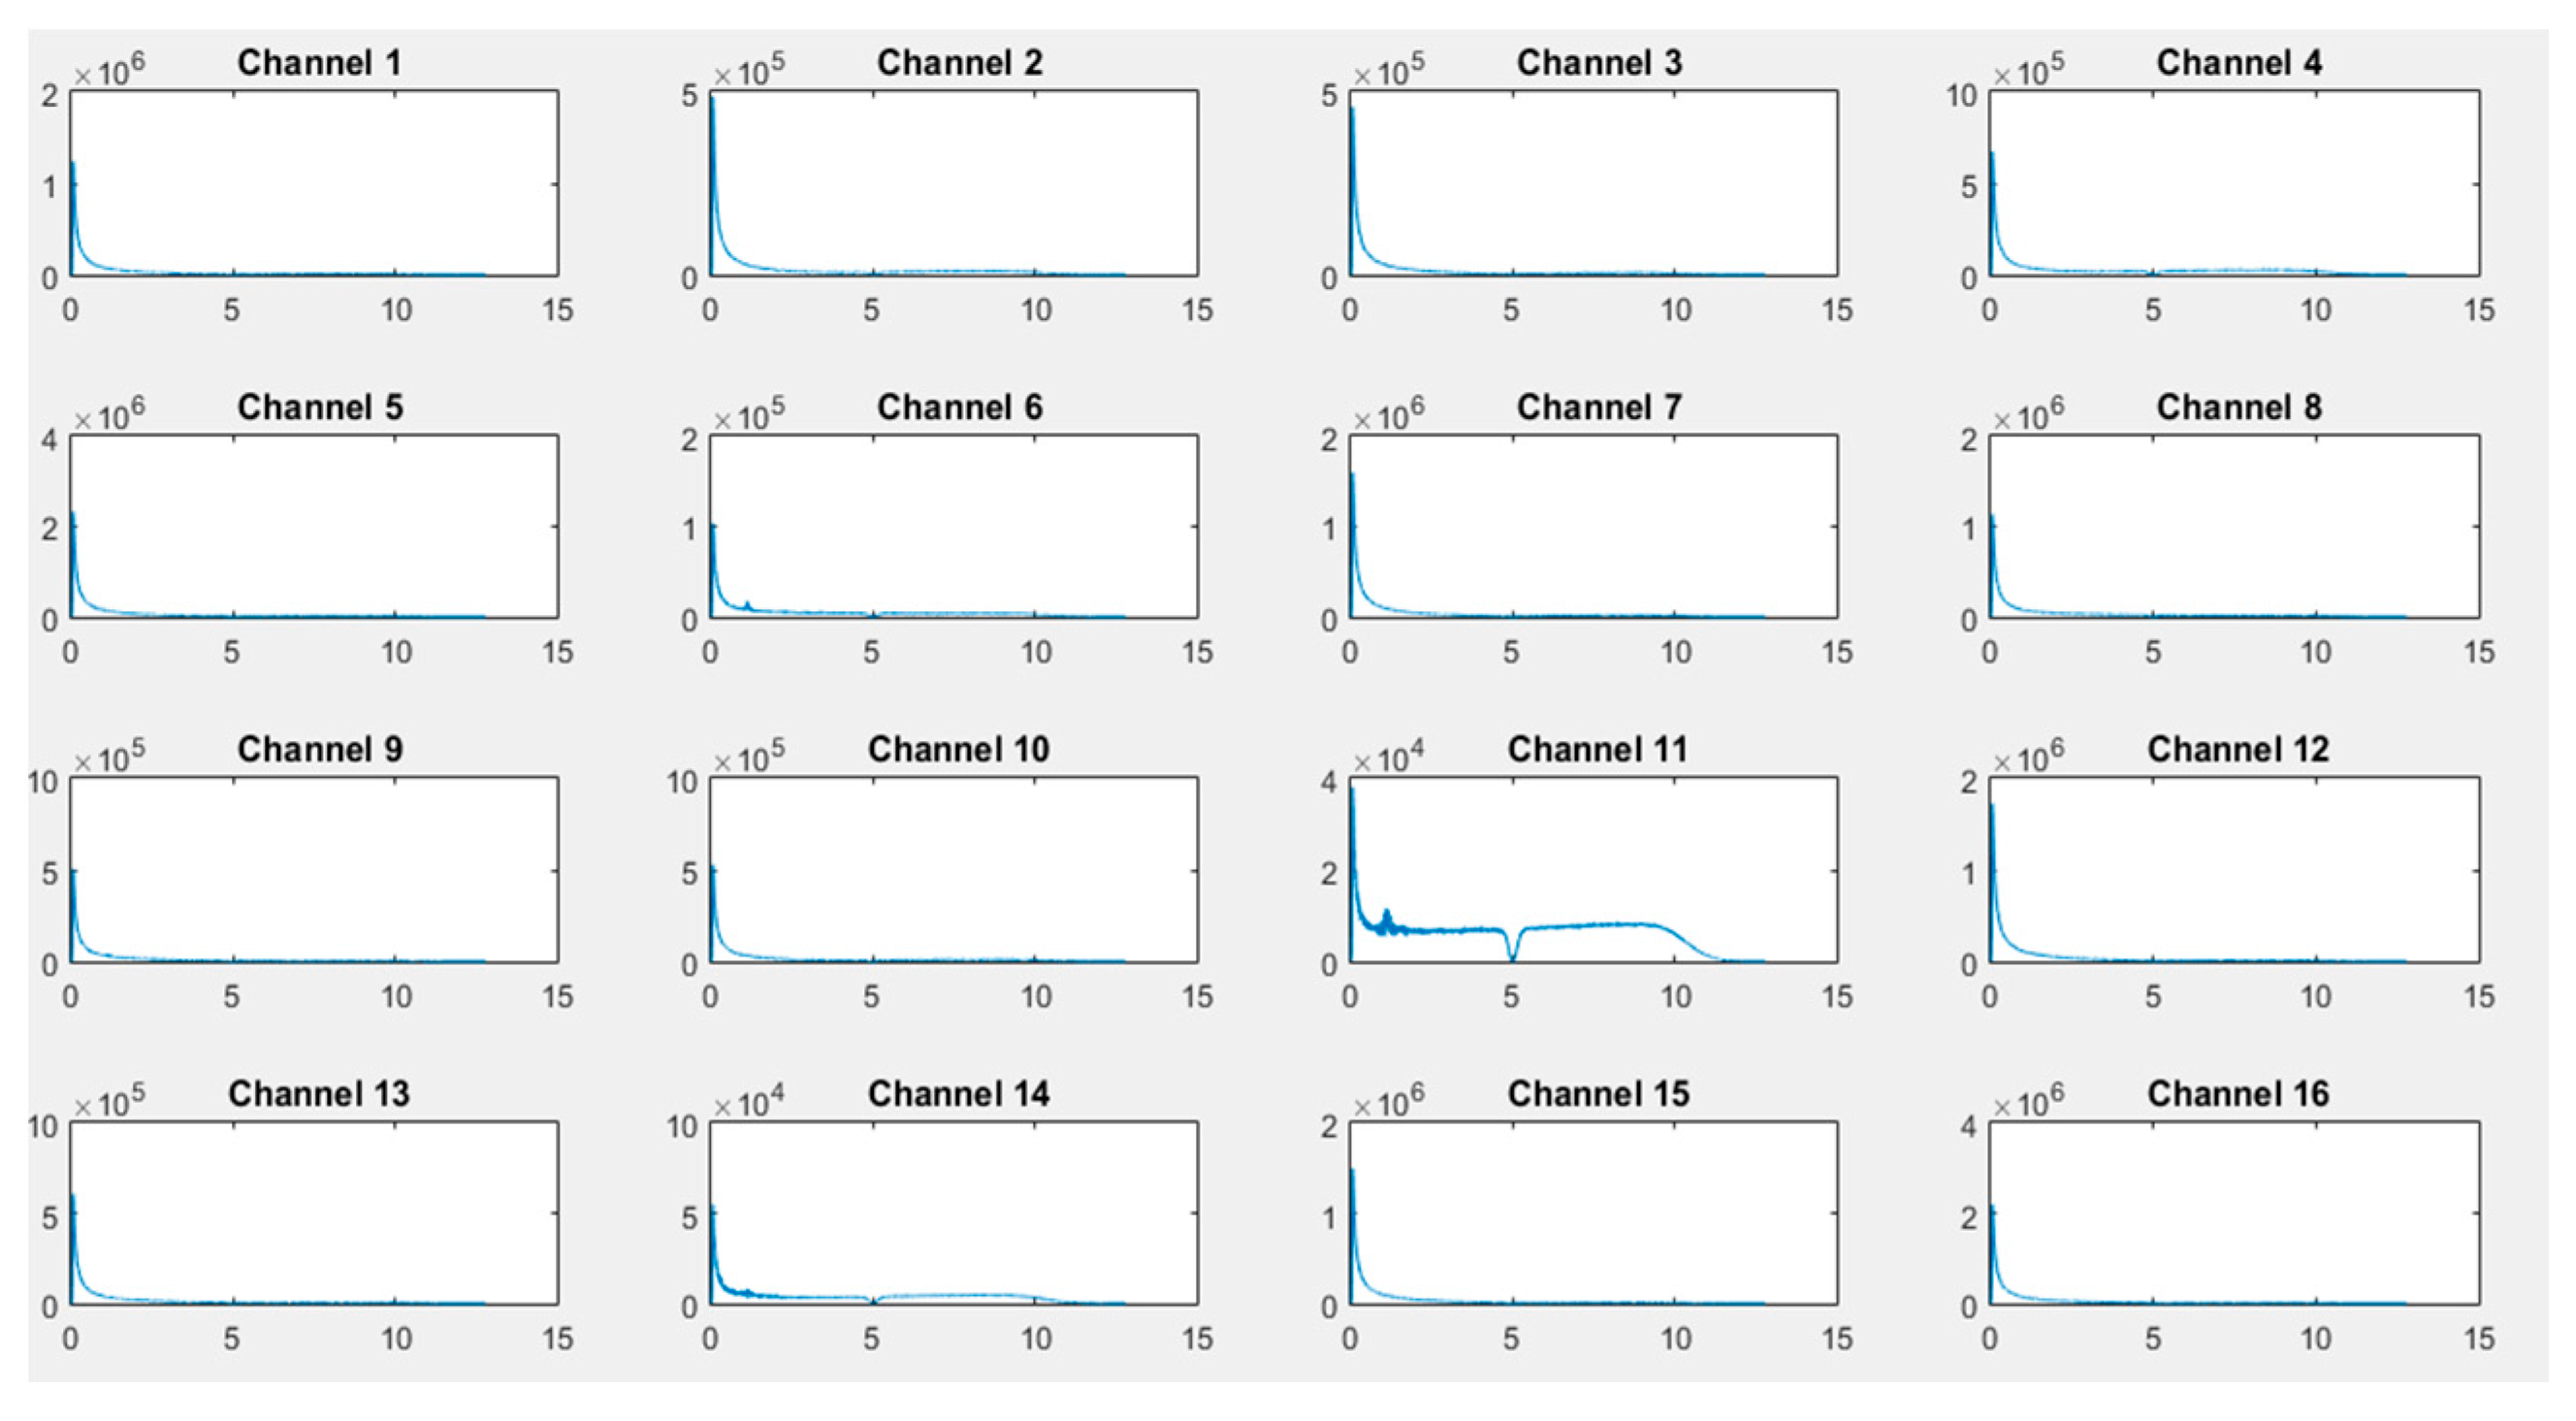
As illustrated in Figure 11, Figure 12 and Figure 13, transformed FFT data applied on collected raw signals show that the frequency spectrum of EEG signals exists and the difference of dominant frequencies among different activities can easily be observed, leading to a best classification of activities (the x-axis is in Hz and the Y-axis, i.e., the signal amplitude, is in microvolts).
The analyzed results for EEG signals for different states show that the amplitude of the EEG wave changes with the subject’s activities. Each brain lobe is associated with a different human function. The frontal lobe is concerned with reasoning, parts of speech and movement, emotions, and problem-solving. The parietal lobe is concerned with perception of stimuli, such as touch and pain, and the occipital lobe is concerned with vision. Therefore, it is important to know the involvement of the two brain hemispheres (left and right), as well as the involvement of each region of the brain during different tests [26].
In the case of the activity "solving a mathematical problem", the most requested channels 1, 2, 3, 6, 11, and 14 are located on the frontal, occipital, and parietal parts of the brain (Figure 11). These channels concern T7, F9, F5 PO7, PO8, and F6, respectively, as illustrated in Figure 4.
In the same direction, we can deduce that the majority of the brain parts are sensitive (frontal, parietal, occipital, central), with a flat line shown for the temporal part, which concerns language, visual, and verbal memory, which is not activated. Thus, for the second activity "resting", according to obtained results (Figure 12), only channels 2, 4, 6, 9, 10, 11, and 14 are activated, corresponding to F9, C3, PO97, PZ, OA, PO8, and F6, respectively (Figure 4). The same analysis can be made for the third activity "watching a video", where channels 2, 3, 6, 9, 10, and 14 are activated. These channels concern the occipital lobe of the brain. Obtained results confirm that regions of the brain located at F9, F5, PO7, OA, PO8, and F6 are concerned with vision activity.
By way of comparison, when a subject was asked to solve a mathematical problem, frontal and parietal lobes were activated, and at rest the subject was asked to relax by visualize a candle and to try to immobilize the flame (for individuals who found it difficult to do relax). This explains the activation of the occipital part by OZ (channel 11). We can deduce that even during rest, the brain goes to sleep but channels are activated with insignificant intensities.
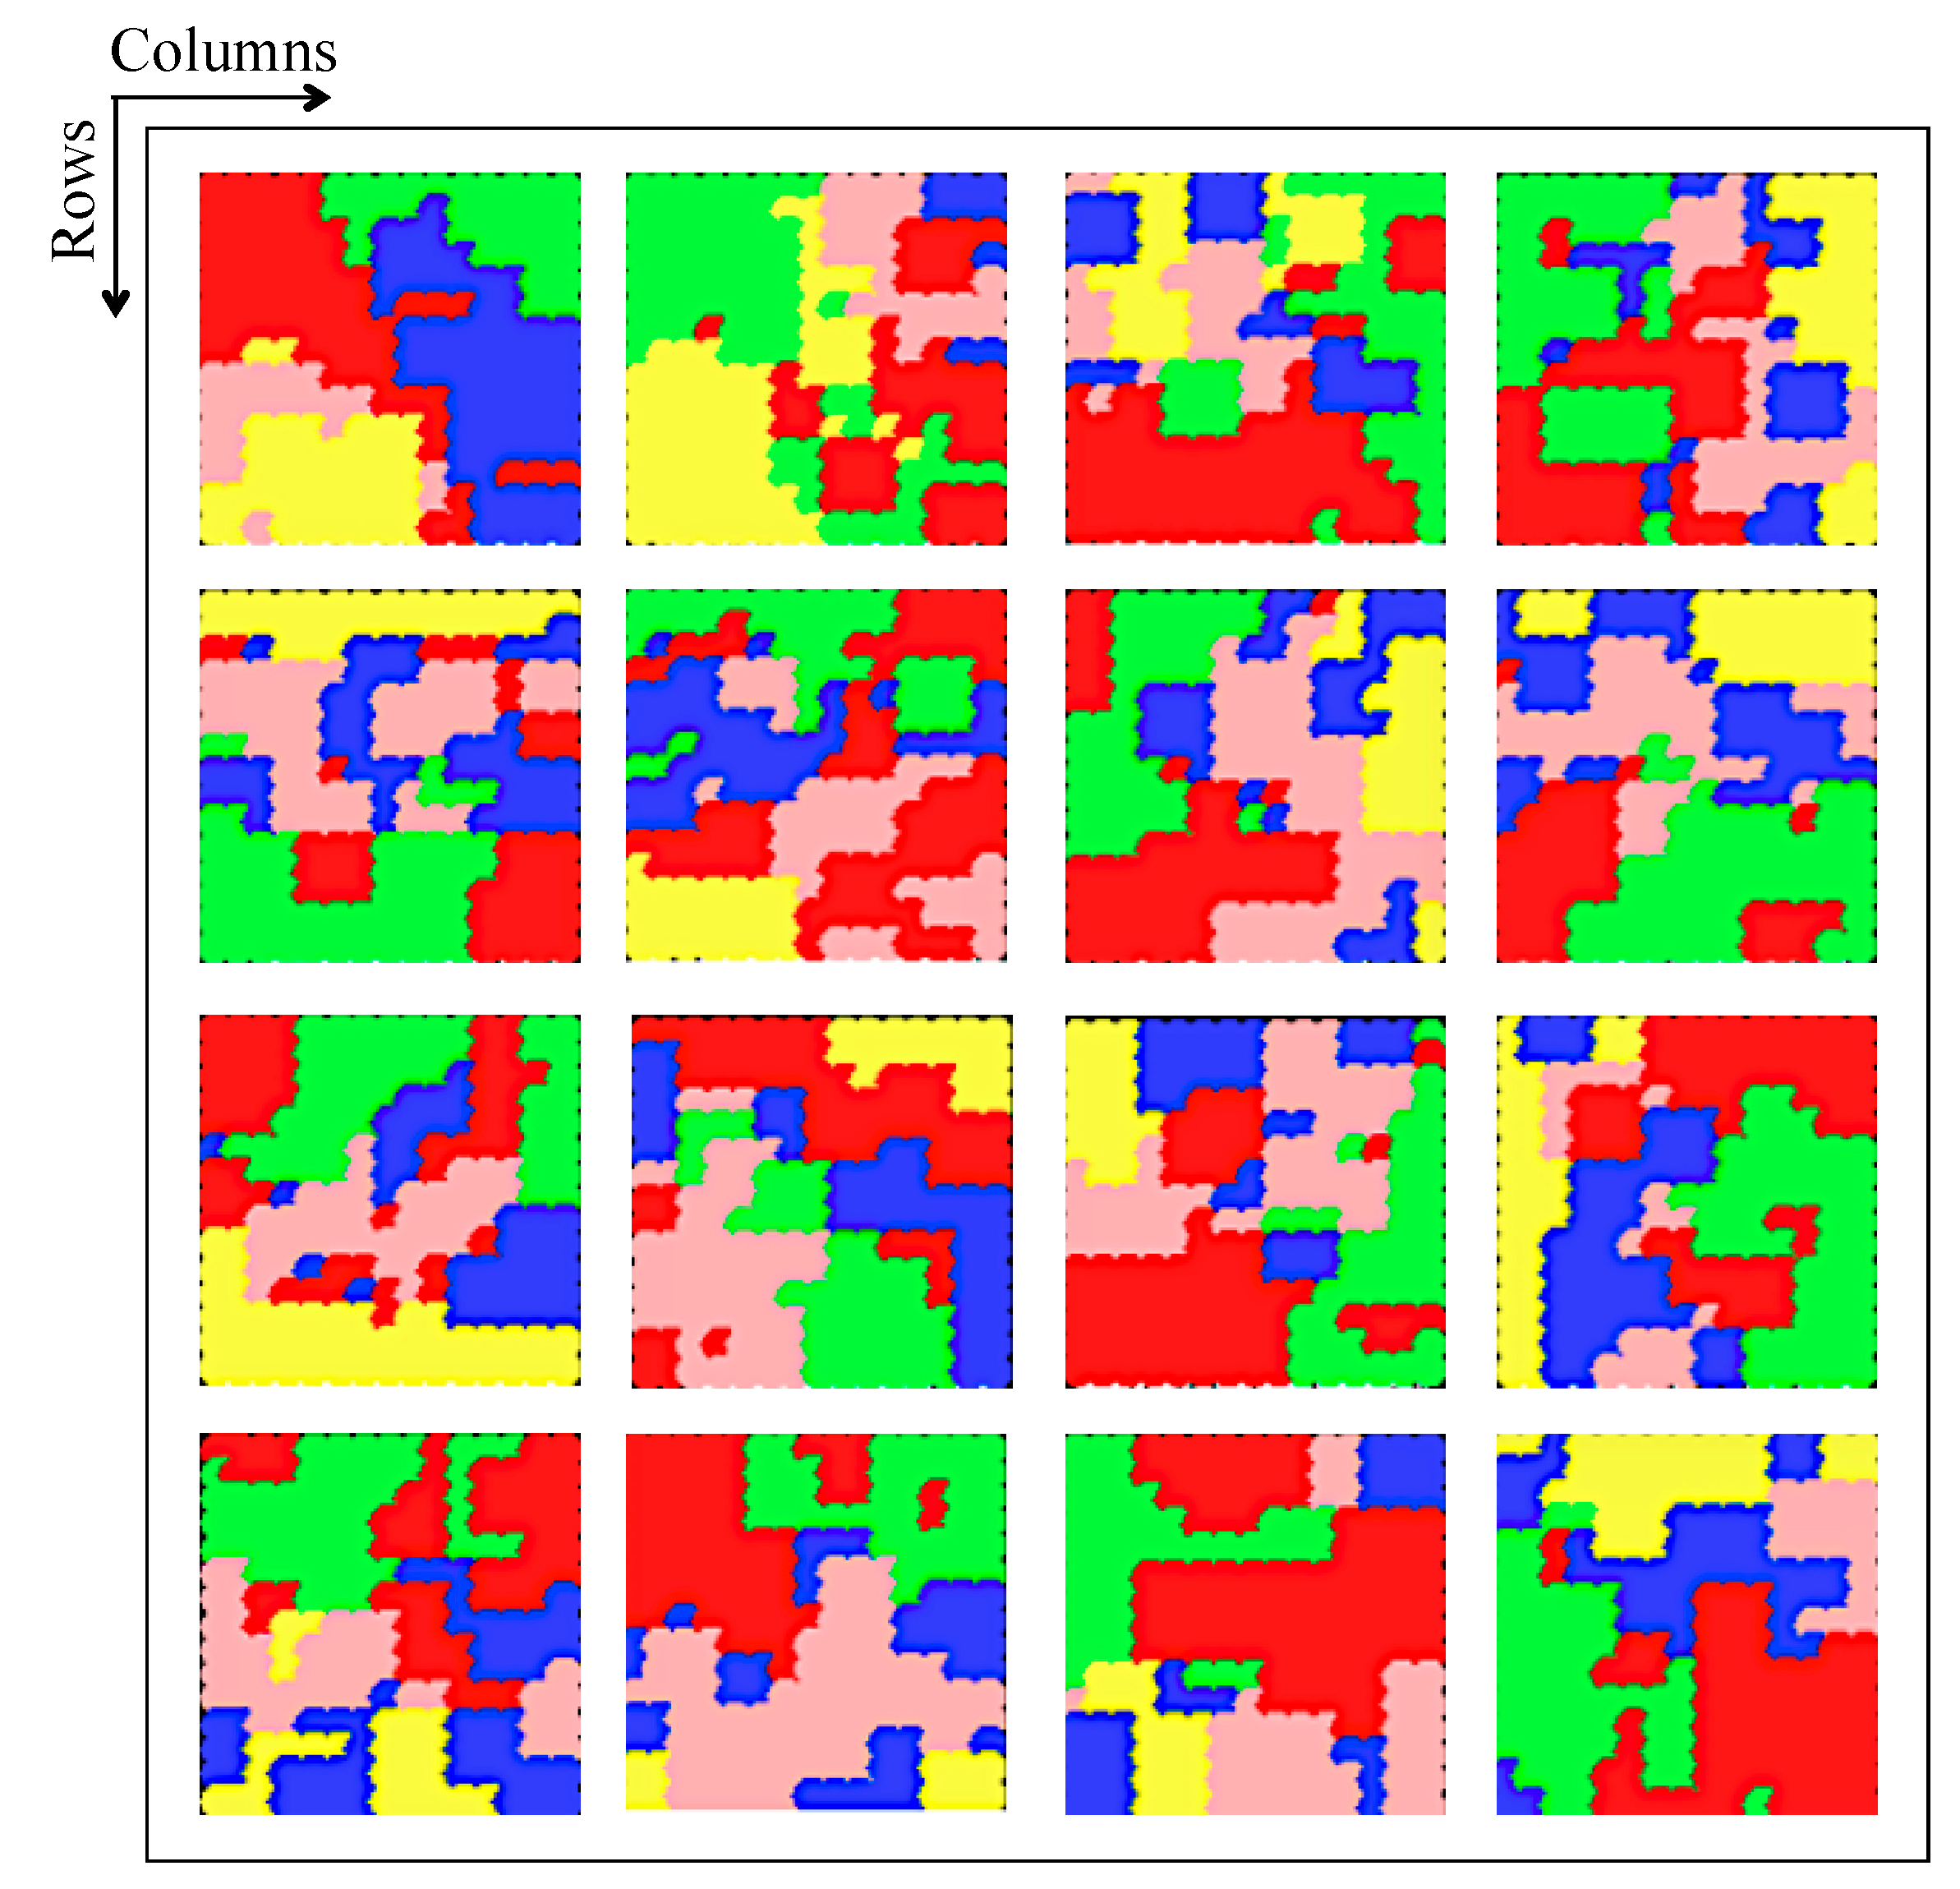
Figure 14 illustrates results of classification of brain activities using SOM nets. In this experiment, we implement 16 SOM nets corresponding to 16 channels to identify and classify 5 activities represented by different colors (Table 3).
The proposed classifier generates 16 maps, each of them based on a superposition of masks representing different activities. It contains weights for input class identification using training data. Some neurons can be activated in a single activity or in more than one activity. In our case, the classifier has five probabilities, one for each activity. In this situation, the activity with higher probability is assigned to the input and generates an output.
The masks are constructed based on the known class of the training dataset. After SOM is trained with the dataset, the features belonging to a specific activity are presented to the network and the corresponding outputs for that set is then summed up. Results can be viewed as a matrix (Figure 14), in order to illustrate the amount of activation of the individual neurons in a specific class.
These results show the effectiveness of the proposed approach throughout the data processing chain. They are very promising results. For example, the activity "converse" involves all parts of the brain at different intensities, confirming the results shown below for the corresponding red colors that appear in all SOM nets. The "watching a video" activity involves the occipital and temporal lobes, represented here by the color green. Indeed, channels 10 (PO8) and 16 (T8), located in the occipital and temporal lobes, respectively, confirm this, as shown in Figure 4.
The activation of SOM for the whole training dataset does not provide much information, as the data for the five classes are mixed. These data start to make sense when they are separated according to the classes, as shown in Figure 14. The training dataset was chosen for this figure in order to have a figure with different colors. These tasks form five probabilities. Some neurons are active only in a selected class; these neurons have a probability of 1 for that class and zero for the others. On the other hand, some neurons are not active in any of the three classes; these neurons have zero probability for all classes.
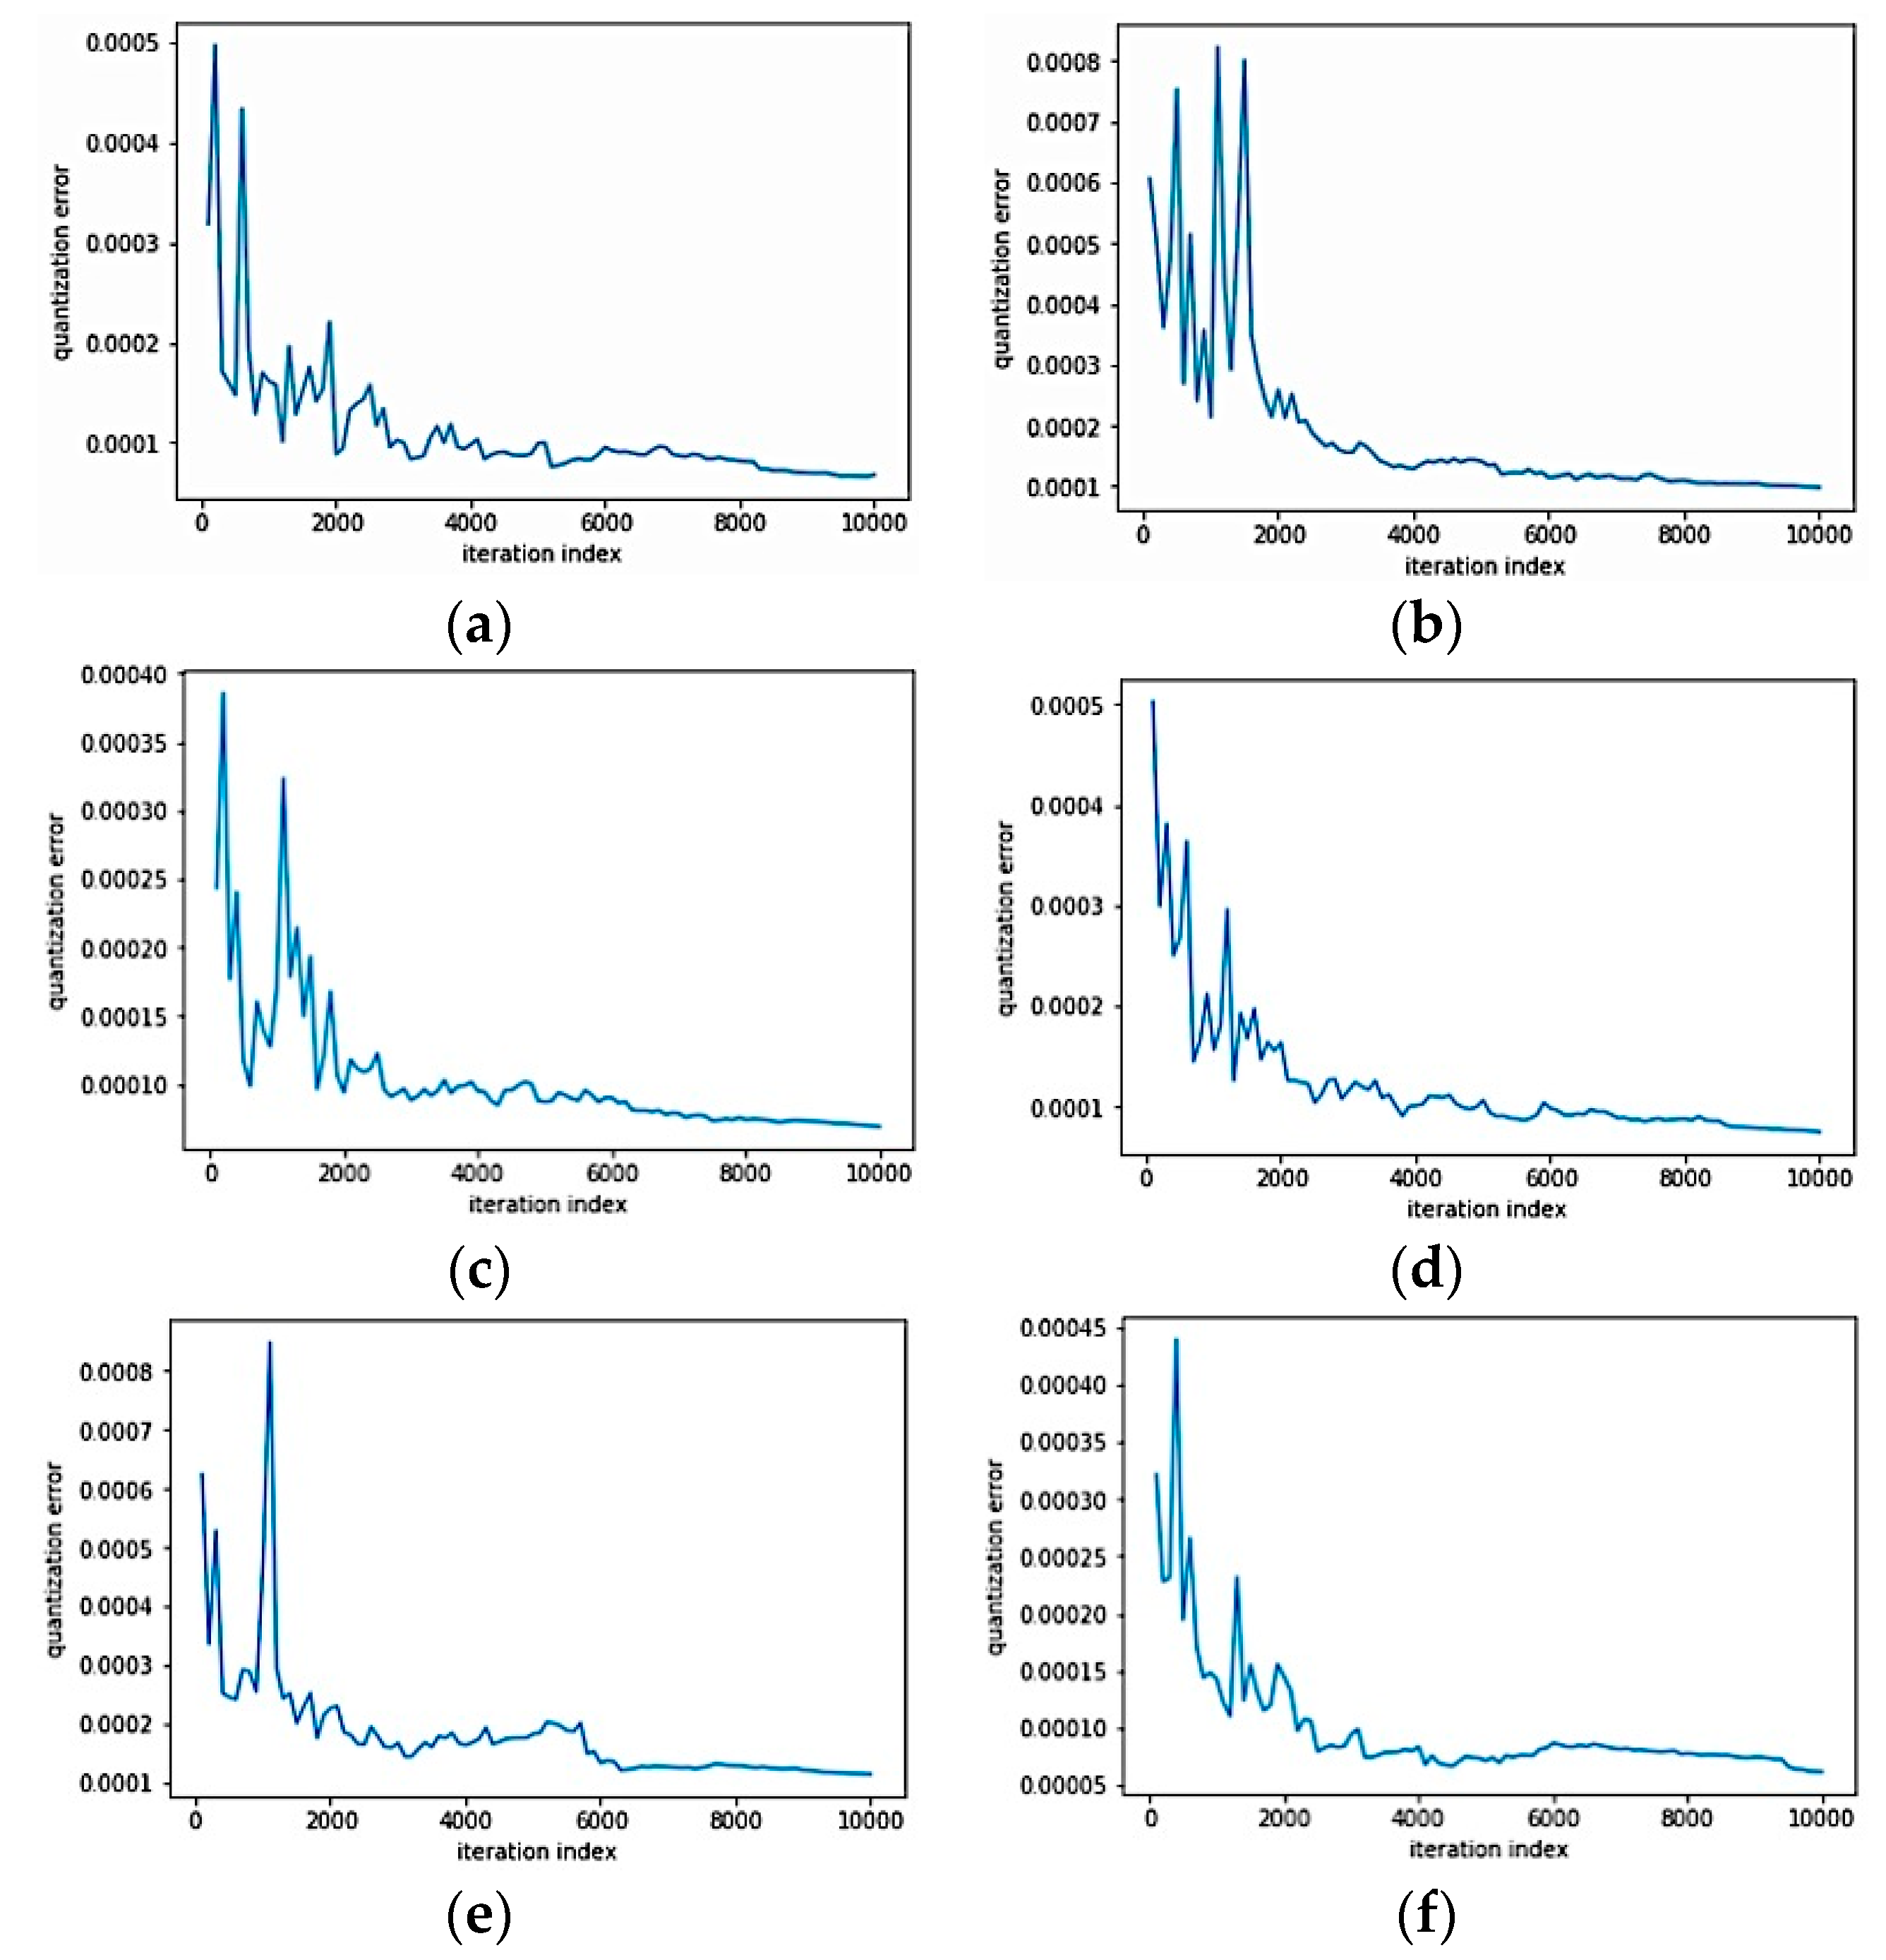
The above results were obtained by subdividing the dataset into two bases: training and test bases, with a rate of 70% and 30%, respectively. For each subject, more than 20,480 training samples were processed, namely 14336 samples for training and 6144 samples for the test. The learning errors for channels 1, 2, 5, 6, 11, and 12 during SOM classification are illustrated in Figure 15.
4. Conclusions
In this paper, we experimented with a training protocol for EEG signal classification. For this purpose, 10 subjects aged between 20 and 26 years old were selected. Five activities were considered: conversing, reading, working, watching a video, and resting. Noninvasive EEG methods were implemented for 2 minutes each to extract cerebral activities, and the acquired data were subjected to treatments in order to allow classification, resulting in a BCI system that can identify different activities.
To improve the classification mechanism, we proposed a classification model based on the SOM neural network, whose inputs represent the whole brain activities recorded by 16 sensors placed on the skull according to the 10-20 System. In this work, artifacts and noise of the extracted EEG signals were filtered by a FFT-based quantization method and characteristics were extracted using a RMSE model.
As illustrated in different figures, the obtained results show that the proposed model is efficient. In fact, from the sensitivity of the sensors, the proposed mechanism is able to detect and elaborate treatments, and at the end is able to determine the intentions of the selected subjects. However, in future works, real-time test batteries need to be conducted to find out if the proposed approach performs well. The idea is to consider the user’s thoughts with a visual interpretation, such as neurofeedback. Furthermore, we are working on the adjunction of BCI signals with biometrics to improve the quality of authentication and identification of individuals. An access management application via password interpretation is in the process of being implemented.
Author Contributions
Conceptualization, K.C. and Y.T.; methodology, K.C.; software, K.C.; validation, K.C., Y.T., L.B. and B.D.; writing—original draft preparation, K.C.; writing—review and editing, K.C., Y.T., L.B. and B.D.
Funding
This research received no external funding.
Conflicts of Interest
We declare no conflicts of interest.
References
- Thorpe, J.; van Oorschot, P.C.; Somayaji, A. Pass-Thoughts: Authenticating with our Minds. In Proceedings of the Workshop on New security Paradigms, Lake Arrowhead, CA, USA, 20–23 September 2005; pp. 45–56. [Google Scholar]
- La Rocca, D.; Campisi, P.; Scarano, G. Eeg biometrics for individual recognition in resting state with closed eyes. In Proceedings of the International Conference of Biometrics Special Interest Group (BIOSIG), Darmstadt, Germany, 6–7 September 2012; pp. 1–12. [Google Scholar]
- Jasper, H. Report of the committee on methods of clinical examination, in electroencephalography. Electroencephalogr. Clin. Neurophysiol. 1958, 10, 370–375. [Google Scholar]
- Bashashati, A.; Fatourechi, M.; Ward, R.K.; Birch, G.E. A survey of signal processing algorithms in brain-computer interfaces based on electrical brain signals. J. Neural Eng. 2007, 4, R32–R57. [Google Scholar] [CrossRef] [PubMed] [Green Version]
- Nicolas-Alonso, L.F.; Gomez-Gil, J. Brain computer interfaces, a review. Sensors 2012, 12, 1211–1279. [Google Scholar] [CrossRef] [PubMed]
- Bueno, L.; Bastos, F.; Teodiano, F. A self-organizing maps classifier structure for brain computer interfaces. Research on Biomedical Engineering 2015, 31, 232–240. [Google Scholar] [CrossRef]
- Gruzelier, J.H.; Foks, M.; Steffert, T.; Chen, M.J.L.; Ros, T. Beneficial outcome from EEG-neurofeedback on creative music performance, attention and well-being in school children. Biol. Psychol. 2014, 95, 86–95. [Google Scholar] [CrossRef] [PubMed]
- Lotte, F.; Bougrain, L.; Cichocki, A.; Clerc, M.; Congedo, M.; Rakotomamonjy, A.; Yger, F. Review of classification algorithms for EEG-based brain-computer interfaces: A 10 year update. J. Neural Eng. 2018, 15, 031005. [Google Scholar] [CrossRef] [PubMed] [Green Version]
- Shahidand, S.; Prasad, G. Bi-spectrum based feature extraction technique for devising a practical Brain-Computer Interface. J. Neural Eng. 2011, 8, 025014. [Google Scholar]
- Boubchir, L.; Touati, Y.; Daachi, B. EEG Error Potentials Detection and Classification using Time-Frequency Features for Robot Reinforcement Learning. In Proceedings of the 37th Annual International Conference of the IEEE Engineering in Medicine and Biology Society, Milan, Italy, 25–29 August 2015; pp. 1761–1764. [Google Scholar]
- Daachi, B.; Gergondet, P.; Boubchir, L.; Kheddar, A. Expliciting SSVEP Misclassifications with Extra-Brain Activities using Time- Frequency EEG Analysis. In Proceedings of the 14th IEEE International Conference on Rehabilitation Robotics, Singapore, 11–14 August 2015; pp. 1020–1025. [Google Scholar]
- Akrami, A.; Solhjoo, S.; Motie-Nasrabadi, A.; Golpayegani, M.R.H. EEG-Based Mental Task Classification: Linear and Non-Linear Classification of Movement Imagery. In Proceedings of the IEEE 27th Annual Conference of Engineering in Medicine and Biology, Shanghai, China, 17–18 January 2006; pp. 4626–4629. [Google Scholar]
- Touati, Y.; Boubchir, L.; Chenane, K.; Daachi, B. On the Brain Activity Misclassification: SSVEP-based Analysis. In Proceedings of the International Conference on Bioengineering for Smart Technologies, (BioSMART), Dubai, UAE, 4–7 December 2016. [Google Scholar]
- Chenane, K.; Touati, Y.; Boubchir, L.; Daachi, B. Algorithms of Control by Thought in Robotics: Active and Passive BMIs Based on Prior Knowledge. In Proceedings of the 6th IEEE International Conference on Biomedical Robotics and Biomechatronics, Singapore, 26–29 June 2016; pp. 221–226. [Google Scholar]
- Vento, M. A long trip in the charming world of graphs for Pattern Recognition. Pattern Recognit. 2015, 48, 291–301. [Google Scholar] [CrossRef]
- Jiang, J.; Jiang, T.; Zhai, S. A novel recognition system for human activity based on wavelet packet and support vector machine optimized by improved adaptive genetic algorithm. Phys. Commun. 2014, 13, 211–220. [Google Scholar] [CrossRef]
- Bharne, P.P.; Kapgate, D.A. Review of Classification Techniques in Brain Computer Interface. Int. J. Comput. Sci. Eng. 2014, 2, 68–72. [Google Scholar]
- Lei, X.; Yang, P.; Yao, D. An empirical Bayesian framework for brain-computer interfaces. IEEE Trans. Neural Syst. Rehabil. Eng. 2009, 17, 521–529. [Google Scholar] [CrossRef] [PubMed]
- Li, Y.; Guan, C.; Li, H.; Chin, Z. A self-training semi-supervised SVM algorithm and its application in an EEG-based brain computer interface speller system. Pattern Recognit. Lett. 2008, 29, 1285–1294. [Google Scholar] [CrossRef]
- Hazrati, M.K.; Erfanian, A. An online EEG-based brain-computer interface for controlling hand grasp using an adaptive probabilistic neural network. Med Eng. Phys. 2010, 32, 730–739. [Google Scholar]
- Vidaurre, C.; Krämer, N.; Blankertz, B.; Schlögl, A. Time domain parameters as a feature for EEG-based brain-computer interfaces. Neural Netw. 2009, 22, 1313–1319. [Google Scholar] [CrossRef]
- Williston, K. Digital Signal Processing World Class Design, Newnes; Elsevier Inc.: Amsterdam, The Netherlands, 2009; ISBN 978-1-85617-623-1. [Google Scholar]
- Singh, P.; Joshi, S.; Patney, R.; Saha, K. Fourier-Based Feature Extraction for Classification of EEG Signals Using EEG Rhythms. CircuitSyst. Signal Process. 2016, 35, 370–3715. [Google Scholar]
- Kohonen, T. The self-organizing map. Proc. IEEE 1990, 78, 1464–1480. [Google Scholar] [CrossRef]
- Charron, S.; Koechlin, E. Divided Representation of Concurrent Goals in the Human Frontal Lobes. Science 2010, 328, 360–363. [Google Scholar] [CrossRef] [PubMed]
- Adjouadi, M.; Cabrerizo, M.; Yaylali, I.; Jayakar, P. Interpreting EEG functional brain activity. IEEE Potentials 2004, 23, 8–13. [Google Scholar] [CrossRef]
Figure 1.
Electroencephalographic (EEG) electrodes following the international 10–20 system; (A) left the head; (B) above the head; (C) location and nomenclature of electrodes.
Figure 1.
Electroencephalographic (EEG) electrodes following the international 10–20 system; (A) left the head; (B) above the head; (C) location and nomenclature of electrodes.

Figure 2.
Proposed functional model.

Figure 3.
G.tec equipment for experimentation.

Figure 4.
EEG electrodes location.

Figure 5.
Self-organizing map (SOM) net architecture.

Figure 6.
Architecture of the proposed classifier.

Figure 7.
Selection and fusion layers.

Figure 8.
EEG raw signal recordings for the activity “working”.

Figure 9.
EEG raw signal recordings for the activity “resting”.

Figure 10.
EEG raw signal recordings for the activity “watching a video”.

Figure 11.
Feature extraction for the activity “working”.

Figure 12.
Feature extraction for the activity “resting”.

Figure 13.
Feature extraction for the activity “watching a video”.

Figure 14.
Brain activity distribution using SOM net.

Figure 15.
Learning results for the SOM net; (a) Channel 1; (b) Channel 2; (c) Channel 5; (d) Channel 6; (e) Channel 11; (f) Channel 12.
Figure 15.
Learning results for the SOM net; (a) Channel 1; (b) Channel 2; (c) Channel 5; (d) Channel 6; (e) Channel 11; (f) Channel 12.


Table 1.
Nomenclature for Electrode Locations.
| Channel Number | Electrode Number |
|---|---|
| Channel 1 | T7 (Temporal) |
| Channel 2 | F9 (Frontal) |
| Channel 3 | F5 (Frontal) |
| Channel 4 | C3 (Central) |
| Channel 5 | P3 (Parietal) |
| Channel 6 | PO7 (between parietal and occipital) |
| Channel 7 | FZ (between frontal and zero or midline) |
| Channel 8 | CZ (between central and zero midline) |
| Channel 9 | PZ (between parietal and zero or midline) |
| Channel 10 | OZ (between occipital and zero or midline) |
| Channel 11 | PO8 (between parietal and occipital) |
| Channel 12 | P4 (Parietal) |
| Channel 13 | C4 (Central) |
| Channel 14 | F6 (Frontal) |
| Channel 15 | F10 (Frontal) |
| Channel 16 | T8 (Temporal) |
Table 2.
Brain activities.
| Activity | Interpretation |
|---|---|
| Conversation | An English conversation is conducted between the subject and another person |
| Reading | The subject reads a text written in English |
| Watching video | The subject watches a documentary with sound |
| Resting | The subject is supposed to be in relaxation phase |
| Working | The subject solves a mathematical equation |
Table 3.
Brain activities.
| Activity | Color |
|---|---|
| Conversation: An English conversation is conducted between the subject and another person | Red |
| Reading: The subject reads a text written in English | Blue |
| Watching video: The subject watches a documentary with sound | Green |
| Resting: The subject is supposed to be in relaxation phase | Yellow |
| Working: The subject solves a mathematical equation | Pink |
© 2019 by the authors. Licensee MDPI, Basel, Switzerland. This article is an open access article distributed under the terms and conditions of the Creative Commons Attribution (CC BY) license (http://creativecommons.org/licenses/by/4.0/).
Share and Cite
MDPI and ACS Style
Chenane, K.; Touati, Y.; Boubchir, L.; Daachi, B. Neural Net-Based Approach to EEG Signal Acquisition and Classification in BCI Applications. Computers 2019, 8, 87. https://doi.org/10.3390/computers8040087
AMA Style
Chenane K, Touati Y, Boubchir L, Daachi B. Neural Net-Based Approach to EEG Signal Acquisition and Classification in BCI Applications. Computers. 2019; 8(4):87. https://doi.org/10.3390/computers8040087
Chicago/Turabian StyleChenane, Kathia, Youcef Touati, Larbi Boubchir, and Boubaker Daachi. 2019. "Neural Net-Based Approach to EEG Signal Acquisition and Classification in BCI Applications" Computers 8, no. 4: 87. https://doi.org/10.3390/computers8040087
Note that from the first issue of 2016, this journal uses article numbers instead of page numbers. See further details here.