
Rethinking Densely Connected Convolutional Networks for Diagnosing Infectious Diseases
by
 , , , and
Prajoy Podder
1,
Fatema Binte Alam
1,
M. Rubaiyat Hossain Mondal
1,
Md Junayed Hasan
2 ,
,
Ali Rohan
2,* and
Subrato Bharati
1,3
1
Institute of ICT, Bangladesh University of Engineering and Technology (BUET), Dhaka 1205, Bangladesh
2
National Subsea Centre, School of Computing, Robert Gordon University, Aberdeen AB10 7AQ, UK
3
Department of Electrical and Computer Engineering, Concordia University, Montreal, QC H3G 1M8, Canada
*
Author to whom correspondence should be addressed.
Computers 2023, 12(5), 95; https://doi.org/10.3390/computers12050095
Submission received: 21 March 2023
/
Revised: 26 April 2023
/
Accepted: 28 April 2023
/
Published: 2 May 2023
(This article belongs to the Special Issue Machine and Deep Learning in the Health Domain)
Abstract
:Due to its high transmissibility, the COVID-19 pandemic has placed an unprecedented burden on healthcare systems worldwide. X-ray imaging of the chest has emerged as a valuable and cost-effective tool for detecting and diagnosing COVID-19 patients. In this study, we developed a deep learning model using transfer learning with optimized DenseNet-169 and DenseNet-201 models for three-class classification, utilizing the Nadam optimizer. We modified the traditional DenseNet architecture and tuned the hyperparameters to improve the model’s performance. The model was evaluated on a novel dataset of 3312 X-ray images from publicly available datasets, using metrics such as accuracy, recall, precision, F1-score, and the area under the receiver operating characteristics curve. Our results showed impressive detection rate accuracy and recall for COVID-19 patients, with 95.98% and 96% achieved using DenseNet-169 and 96.18% and 99% using DenseNet-201. Unique layer configurations and the Nadam optimization algorithm enabled our deep learning model to achieve high rates of accuracy not only for detecting COVID-19 patients but also for identifying normal and pneumonia-affected patients. The model’s ability to detect lung problems early on, as well as its low false-positive and false-negative rates, suggest that it has the potential to serve as a reliable diagnostic tool for a variety of lung diseases.
1. Introduction
Human beings have been suffering from several types of pulmonary diseases, such as influenza, congestive obstruction pulmonary disease (COPD), tuberculosis, pneumonia, lung cancer, etc., for many decades, and new, more severe, and contagious diseases are developing in the human body with the advancement of time. Though disease detection and treatment technology have advanced a lot, this technology is not yet capable of mitigating the effects of all types of diseases. With the increasing number of emerging new diseases, it cannot beat the race. There are several types of coronaviruses that exist in nature as pathogenic viruses by being alive in different types of animals, and they existed many years ago. Such pathogenic viruses became a global issue after the outbreak of Severe Acute Respiratory Syndrome Corona Virus (SARS-CoV) in 2003 and, consequently, Middle East Respiratory Syndrome Corona Virus (MERS-CoV) in 2012 [1]. Later, the coronavirus caused a massive outbreak in modified form, known as COVID-19, in China in December 2019 [2,3]. After that, this severe disease spread worldwide within a very short time. In February 2020, the World Health Organization (WHO) declared this disease a global pandemic due to its high causality and mortality around the world [4]. Up to August 2021, more than 219 million people have been infected by COVID-19, and among them, 4.55 million deaths have occurred due to this severe disease [5]. In addition, the genome of COVID-19 has been mutated, resulting in several waves of infection and death in various countries, making this illness one of the most lethal menaces to humanity.
Compared to other infectious diseases, the transmission rate of COVID-19 is extremely high, and the rate of transmission is growing as new varieties of the disease arise. This rate is expected to continue to rise. Quick and accurate patient identification is critical to halting the spread of COVID-19, and it must be accomplished as soon as possible using the readily accessible, easy diagnostic procedure. COVID-19 can now be identified using Real-Time Reverse Transcription-Polymerase Chain Reaction (RT-PCR), in which a brief sequence of DNA or RNA is generated or amplified and evaluated [6]. However, establishing, operating, and maintaining the RT-PCR procedure is quite challenging, especially for developing and underdeveloped countries, as huge costs, good infrastructure, and well-trained experts are required. Keeping the patient isolated until the result is another challenging issue, as the time required to obtain the result is around 5–6 h [6]. The circumstances stated above may be acceptable if the sensitivity of the RT-PCR is satisfactory, but the actual condition is similar. Fang et al. [7] showed that the sensitivity of the RT-PCR test is approximately 71%, which is not in the satisfactory range. As a result, more research is being conducted to come up with a simple method with better accuracy that can be used quickly and does not require a lot of work.
Chest X-rays are the most used approach for pulmonary disorders, and if COVID-19 can be detected using this method, it will represent a paradigm shift in COVID-19 detection [8] Due to the widespread usage of chest X-rays and the availability of infrastructure and skilled technical employees, COVID-19 detection will be made easier in practically all countries worldwide. The scenario will be enhanced if COVID-19 can be detected automatically from chest X-ray images. Numerous studies have been published demonstrating the automatic detection of COVID-19 utilizing X-ray image analysis and deep learning (DL) techniques. However, overall detection accuracy, notably the differentiation between normal, pneumonia, and COVID-19 requires improved X-ray image precision. The potential for misdiagnosis is one of the main dangers associated with the lower accuracy of data-driven diagnosis. Any infectious disease that the AI system incorrectly diagnoses could result in improper therapy, treatment delays, or missed opportunities for early intervention. The health and well-being of the patient may suffer significantly as a result. Confidence in technology may decline if AI-driven diagnosis is less reliable than human diagnosis. Malpractice claims against healthcare providers that rely on the technology are legal repercussions that could result from an inaccurate AI-based diagnosis. This might make healthcare more expensive and further lower public confidence in the technology. Consequently, continual research and development are required to raise the accuracy of these systems. The performance of the current DL models depends on the datasets, and different data samples yield different results when applied. Therefore, there is a need for ongoing research in this area to create a model that is appropriate for various datasets. This research proposed two DL-based models, DenseNet 169 and DenseNet 201, and examined them using the confusion matrix, accuracy, specificity, recall, F1-score, ROC, and AUC curves. Additionally, the proposed models have been assessed in terms of epochs, training and testing accuracy, and loss. Finally, the new models have been compared to several other recent models to demonstrate how much more accurate they are at forecasting the future. The main contributions of this paper are encapsulated as follows:
- This research proposes a novel technique for detecting COVID-19 by adjusting the hyperparameter to optimize the proposed pre-trained DenseNet architecture.
- A dataset with 3312 X-ray images is used with the combination of three distinct databases.
- A novel modified version of DenseNet is formed where we have added several new layers for optimization purposes. The optimized DenseNet architecture is applied to the X-ray images, and the performance of the model is evaluated by several performance metrics in classifying COVID-19-affected, pneumonia-affected, and normal patients.
This paper is outlined as follows: The related work of this research is introduced in Section 2. Then, in Section 3, materials and methods are along with datasets, data preprocessing, the DenseNet architecture, and performance metrics. Moreover, the description of the proposed architecture is presented in Section 4. Finally, in Section 5 and Section 6, we look at the proposed models and draw a conclusion.
2. Related Works
Numerous studies have been conducted to find the most effective DL-based models for correctly detecting COVID-19 in X-ray images [8,9,10,11,12,13,14,15,16,17,18,19,20,21,22,23,24,25,26,27,28,29,30,31,32,33]. However, computed tomography (CT) scanning is more expensive and time-consuming than traditional X-ray imaging. Therefore, in some cases, models based on X-ray imaging with high accuracy are used to identify COVID-19 in patients. Although several models demonstrate promising accuracy, these models are still not fully implementable for all sorts of data sets. As a result, further research into the development of COVID-19 detection models based on DL remains an open question. The results of this investigation were compared to some of the most popular and well-known models.
COVID-19 detection model based on DL from chest X-ray has been developed using various architectures such as VGG-16, VGG-19, ResNet-50, ResNetV2, InceptionV3, DenseNet-121, DenseNet-161, DenseNet-169, DenseNet-201, and others. Different DL models for COVID-19 detection have been presented in Table 1, and a brief description is also given in the following.
A. K. Das et al. [8] developed a model in which automatic detection of COVID-19 was shown by ensemble learning with a convolutional network using 538 COVID-19 and 468 non-COVID-19 X-ray images. The accuracy was found to be 91.6%, and in this work, DenseNet-201, ResNet-50-V2, and Inception-V3 were also adopted to compare the accuracy with the proposed models. The data that were considered to propose a new model were not -perfect, and the accuracy was also not good enough for practical deployment.
S. Albahli et al. [9] performed a simulation on 15,498 X-ray images which were classified as healthy normal, pneumonia, and COVID-19 using pre-trained DenseNet, Inception-V3, and Inception-ResNet-V4. The DenseNet model showed maximum accuracy with 92%, while the accuracies of Inception-V3 and Inception-ResNet-V3 were 83.47% and 85.57%, respectively, and such performance was not fully satisfactory.
I.D. Apostolopoulos et al. [10] used 1427 X-ray images, where 224 images of COVID-19, 700 images of bacterial pneumonia, and 504 images of normal conditions were present. In this research, five different types of models: VGG-19, Inception, MobileNet-V2, Xception, and Inception-ResNet-V2, were considered to distinguish three classes. The accuracy varied from 92.85% to 93.48%, and the maximum accuracy was found using VGG-19, which requires more improvement.
C. Polat et al. [11] proposed two classes based DL model called nCov-NET after modifying the DenseNet-161 model. For developing this model, 299 X-ray images of COVID-19 and 1522 X-ray images of non-COVID-19 patients were considered. Though the accuracy was 97%, this model could not distinguish between COVID pneumonia and bacterial (non-COVID) pneumonia, which is the most important fact as, most often, due to not confirming the type of pneumonia, providing treatment protocol is delayed.
R. M. Webbe et al. [12] proposed a new deep convolutional network-based algorithm called DeepCOVID-XR to find out COVID-19 from X-ray images considering 5853 patient X-ray images. The dataset was collected from the U.S. Clinical Dataset, but the accuracy was not up to the mark. This work showed an accuracy of only 83%.
H. Quan et al. [13] developed a model known as DenseCapsNet, in which a DL framework was designed using a convolutional neural network and capsular network. Using 750 chest X-ray images, the accuracy of detecting COVID-19 was found to be 90.7%, which was not good enough, and the number of data considered in this work was not well enough.
A hybrid method was introduced named DCCNet by Ayalew et al. [14], which could detect COVID-19 from the chest X-ray images dataset. The model depicts the best performance with overall training accuracy of 99.97% by utilizing CNN and Histogram of Orientated Gradients (HOG). Although it showed higher accuracy, it was only proposed for diagnosing COVID positive cases; instead, it failed to detect other similar lung disorders. The overall performance was compared with standalone models used in that study in terms of computational times as well as training and validation accuracy.
N. Indumathi et al. [15] conducted recent research for the prediction of COVID-19 using ML algorithms in a district of Tamil Nadu state in south India. The overall system was proposed to classify into different zones for a particular period from March to July 2020. The COVID-19-impacted areas are divided into different zones by the algorithms, including danger, medium, and secure zones. In recent work, a DenseNet was applied to classify lung diseases. In this case, the DL model was applied to a CT scan dataset with 1043 images and two separate X-ray datasets with 5935 and 5002 images, respectively [16].
S. Gite et al. [17] proposed a new lung disease diagnostic DL model for detecting tuberculosis (TB) from X-ray images. Four segmentation techniques, namely, FCN, U-Net, U-Net++ lung segmentation, and SegNet, were applied to the dataset, where U-Net++ lung segmentation performed the best with more than 98% lung segmentation accuracy. The dataset used here contains two datasets: 138 X-ray images, including 58 TB infected cases, and 662 X-ray images from Shenzhen Hospital with 336 TB cases. Several studies reported the application of artificial intelligence and DL for the case of healthcare, including COVID-19 [27,28,29,30,31,32,33,34,35,36,37,38]. One interesting study compared a multilayer network technique with a single network for the case of COVID-19 vaccinations; however, they did not consider disease diagnosis [35]. Another study proposed a technique that converts a ResNet into a multilayer network, allowing analysis of the related ResNet using the theory of complex networks. However, the proposed model was not used in the study on any dataset related to infectious diseases [36]. DL techniques demand a substantial amount of data for training and evaluation. Due to the lack of generalization, DL models trained on restricted datasets are unreliable. Literature indicates that data augmentation approaches can be utilized to tackle problems with tiny datasets [26]. In addition, the majority of the currently available research works [27,28,29,30] focus on the binary classification of COVID-19, whereas only a few studies [31,32,33,34] deal with the multiclass classification of COVID-19.
Analyzing the issues associated with the papers mentioned above, it is noticed that this work will advance the field from the present state of knowledge for predicting COVID-19 from chest X-ray datasets. With a new architecture tuned to X-ray images combined from multiple datasets, the models will overcome the limitations of existing architectures suitable for a single dataset. To propose a COVID-19 detection model based on DL, adequate training and testing data must be available, as well as the capacity to distinguish between normal, COVID-19, and bacterial pneumonia with the best possible accuracy. This research has provided a modified framework of the DenseNet-169 and DesneNet201 models that were constructed utilizing a significant amount of data and can accurately recognize normal, COVID-19, and pneumonia.
3. Materials and Methods
3.1. Dataset
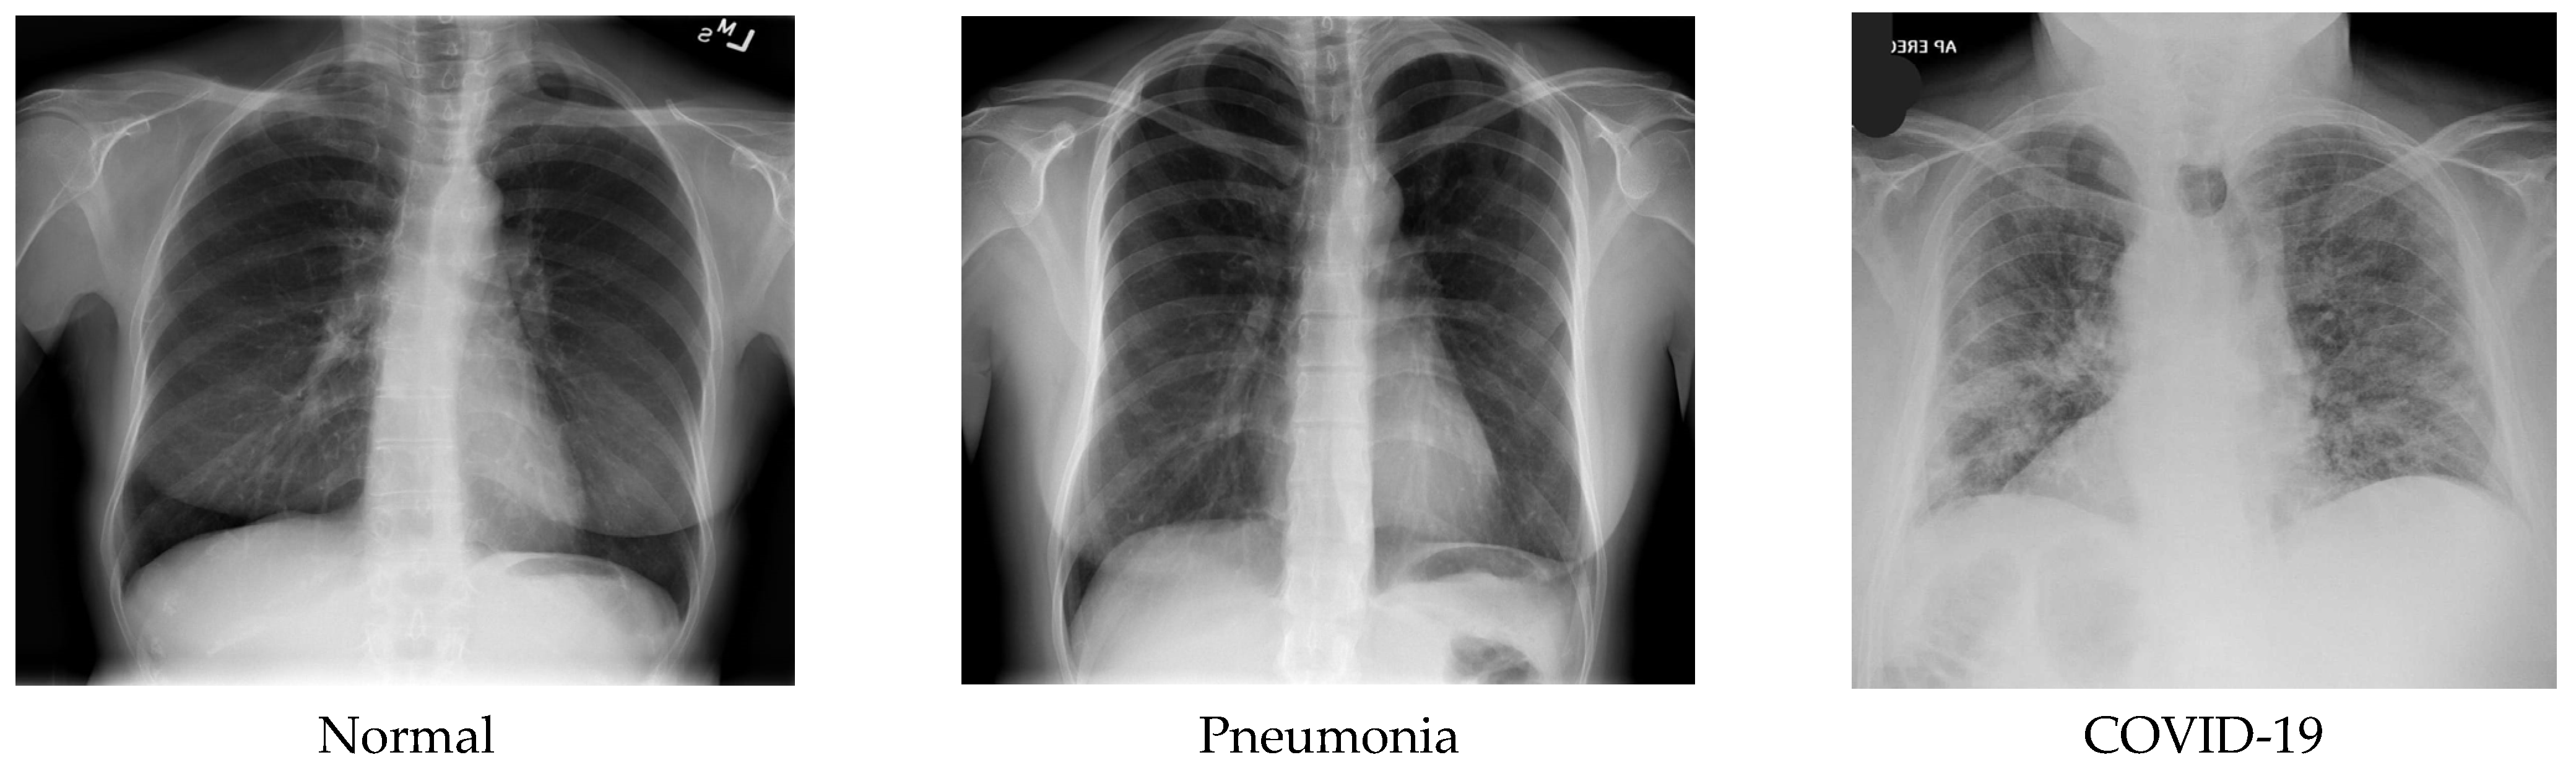
A data set of X-ray scanned images has been assembled in the three-level classification. One with the label “Non-COVID-19 X-ray”, another class labeled “COVID-19 X-ray”, and the last one labeled “pneumonia Chest X-ray” were used for trial-and-error purposes. The dataset consists of 3312 images, of which pneumonia-affected and normal patient X-rays were 694 images each, and COVID-19-affected patients’ X-rays were 1924 images from publicly available primary datasets [22,23]. Among these, 2020 random images have been selected. Afterward, the whole dataset was split into 85% for training and 15% for testing. Note that some of the most prominent biases in X-ray imaging datasets are demographic bias, illness prevalence bias, data collection bias, labeling bias, and technical bias concerning equipment conditions. Biases in X-ray image datasets can have a major impact on the performance of DL models, resulting in erroneous diagnoses, inequities in treatment, and decreased faith in the technology. To maintain the fairness of the proposed model, these biases were reduced by forming a novel dataset from the combination of two separate X-ray imaging datasets. Furthermore, the dataset was divided into three classes without a significantly high sample imbalance between classes. When looking at the chest X-ray data set, it can be noticed that these three categories seem to be closely related. Figure 1 shows some sample images of the dataset.
3.2. Data Preprocessing and Augmentation
The performance of deep neural networks usually improves as the amount of data available in the dataset increases. In ML, data preprocessing is the process of preparing data from a dataset into an efficient format. Data augmentation is a technique that improves the variety of data for training models without increasing the number of training samples. However, augmentation of data not only enables the model to learn a greater variety of features that increase the size of the dataset but also assists in preventing the model from overfitting. Image augmentation allows us to add more data images to the current dataset without spending more time adding data manually. Transformed versions of images in the training dataset include a range of operations from the field of image manipulation, such as zooms, rotations, shifts, flips, and many more. Image data augmentation is only applied to the training dataset and not to the test dataset. These tasks can be performed using Keras, which is a DL library that provides the ability to use data augmentation automatically when training a model. Image augmentation is achieved by using the Image Data Generator class.
In this study, data augmentation is also used with 15° rotation, a sheer range of 0.1, a zoom range of 0.1, horizontal and vertical flipping are permitted, and the mode to fill new pixels as the “next” mode for better robustness and broader data. The databases consist of various dimensions of images, which were resized to 224 × 224 pixels. Table 2 summarizes our experimental dataset split into training and testing images.
3.3. Transfer Learning
Transfer learning is a type of machine learning in which learned and existing neural networks are used as the foundation for another model. DenseNet uses a unique approach called “skip connections” between layers, which allows for better reuse and propagation of features throughout the network. This dense connectivity pattern reduces the number of parameters required to train the model, improves its accuracy, and helps prevent overfitting. However, it is important to note that this approach is not related to the transmission of information between people. This strategy discards significant data and retrains the model’s existing knowledge while adapting it to new tasks. Finally, it trains the following model with new data until it converges to a higher value.
3.4. DenseNet Architecture
Dense blocks were initially proposed by Gao Huang et al. [18] in the DenseNet model, one of the new discoveries in Convolutional Neural Networks (CNN), which is designed to perform image classification using densely connected layers through dense blocks with each other. DenseNet model input consists of the RGB image, shape −1, 3, 224, 224, and the format of shape is B (batch size), C (channel), H (height), W (width), passed through a stack of layers consisting of concatenated attributes, combining the output of all the previous layers with the future layers. This connectivity pattern is the main idea behind DenseNet models. For example, suppose the input of a layer X3 = H3 ([X0, X1, X2]) is the output from its previous layers, such as X2, X1, X0, and the original input, all combined to make one deep feature map with the same spatial resolution but a different number of filters. Combining dense blocks all in a row continually with each other will result in very deep inputs. The architecture is divided into dense blocks with all the successive layers in each block in such a way that uses one-by-one convolution to preserve the spatial resolution, but it shrinks the depth of the feature map, followed by max pooling to reduce the feature map size. There are different DenseNets, such as DenseNet-121, DenseNet-169, DenseNet-201, DenseNet-264, etc., among which this study employed DenseNet-169 consisting of 169 layers, and DenseNet-201 consists of 201 layers with more than 20 M parameters.
DenseNets require fewer parameters compared to traditional CNNs because there are no redundant feature maps. If the structure of DenseNets is seen, it is divided into dense blocks where the feature map dimensions remain constant inside a block having different filters.
A dense block concatenates multiple inputs into a single tensor, where a composite function of three sequential operations occurs: batch normalization (BN), followed by a rectified linear unit (ReLU) activation function, which is used as training gradients deteriorate because of the rate of unsaturated nonlinear functions, and a 3 × 3 convolution (Conv). The vital part of convolutional networks is down-sampling, which divides the network into dense blocks where 1 × 1 convolution (Conv) can be introduced as a bottleneck layer before 3 × 3 convolution (Conv) to reduce the number of input feature maps in which computational efficiency is improved and finally, concatenation is performed. There is a transition layer between two dense blocks in which batch normalization, rectified linear unit (ReLU) activation function and a 1 × 1 convolution followed by a 2 × 2 average pooling layer. A transition layer between dense blocks reduces the number of features. Initially, before entering the first dense block, a convolution with a kernel size of 7×7 followed by a 3 × 3 max pooling is performed. Then the dense block 1 × 1 Conv and 3 × 3 Conv layers followed by one pixel to keep the feature map size fixed. Between two blocks, 1 × 1 Conv and 2 × 2 average pooling as transition layers are used to reduce the volume of the dense block’s output size by half. At the end of the final dense block, a global average pooling with some activation functions along with dropout layers is performed, and then softmax classification is attached.
In the basic DenseNet model, dense blocks as well as the transition layer, consist of an unsaturated nonlinear activation function called ReLU (rectified linear unit), which is often employed in convolutional networks. The activation function mainly determines which neuron will produce the matching output from a specific input. The following Equation (1) shows the mathematical form of the activation function [19], where r is denoted as the input,
A convolutional neural network has a deeply connected layer in its hidden layer in which every layer receives input from all the neurons of its prior layer. Initially, the input layer is provided to the model, and then a dense layer followed by a ReLU activation function is added. The dense layer is implemented as a dot product of input shape (X) and weights matrix (W) added with bias (b), as shown in Equation (2).
The most vital component of a neural network is the convolutional layer, which has different types of weighted filters to produce different feature maps by a convolution operation. Suppose the input image is represented as X matrices and a filter represented as f matrices perform mathematical operations of these matrices point-multiplication addition that outputs Z, so the mathematical expression will be .
For the case where the input image has dimensions of , the number of filters is , the filter size is , the stride length is and the length of zero padding is , then the resulting output volume will be of size where:
The convolutional layer uses parameter sharing, which means that each filter uses the same set of weights (parameters) and K biases. This results in a total of weights and K biases for the layer. To produce the output volume, the layer convolves each filter with the input volume using a valid convolution operation with a stride of S, adding a specific bias term to that filter. The resulting output volume has a depth of K, with each depth slice of size [21].
Width and height are computed equally by symmetry. The term will be based on the number of layers and filters in dense blocks and transition layers. Convolution neural networks also perform some operations in the pooling layers, from which average pooling entails calculating an average for every patch on the feature map. During each training phase, a generalized technique is used to increase the accuracy by preventing the model from being overfitted. Dropping off neurons can be applied to hidden neurons but does not consist of forward and back propagation in a neural network. This process temporarily does not allow some neurons to emit with a certain probability, and other than that neurons probability of [20], both learning and training have been performed. The dropout layer should be placed before the ReLU or after the other activation function.
3.5. Performance Metrics
To propose any model, its performance must be evaluated first based on some standard parameters. If the new models satisfy all the benchmarks of the parameters that are considered, then the proposed model can certainly be declared as an implementable model. The proposed models in this research have been evaluated using confusion matrices such as accuracy, sensitivity or recall, specificity, precession, F1-score, and ROC curves.
A confusion matrix is a tabular form of representation of a predictor’s performance in which each item denotes the number of predictions produced by the model in which the classes were properly or incorrectly categorized. It also allows measuring the performance of the model by accuracy, recall, precision, and AUC-ROC curve.
Accuracy (ACC) is the calculation of all the truly recognized cases. It is identified as the number of all true predictions divided by the total number of the dataset. Accuracy can be computed as follows:
Here, TP = true positive, TN = TRUE NEGATIVE, FP = false positive, and FN = false negative. Sensitivity, or recall, is for measuring a classifier’s completeness by identifying True Positives. It is calculated as the number of true positive values divided by the total number of positives. Recall can be computed as follows:
Specificity is measured as the number of true negative values divided by the total number of true negative and false positive data.
Precision is denoted as a positive predictive value. Precision is calculated as the number of true positive predictions divided by the total number of positive predictions. Precision can be computed as follows:
The F1 score is a combination of precision and recall. The formula of the F1 score is denoted as:
The ROC (receiver operating characteristic) curve is a graph known as a receiver work function that suggests the overall performance type of a version based primarily on parameters including a true positive and false positive rate. AUC (area under the curve) is evaluated for both training and testing epochs.
These are typical machine learning assessment measures, including DL-based disease categorization tasks. Specificity assesses a model’s ability to accurately identify genuine negatives or the fraction of actual negatives correctly detected by the model. Specificity is crucial in illness classification because it allows us to assess how effectively the model can identify healthy persons who do not have the condition. The ability of a model to accurately identify real positives, also known as sensitivity, is measured by the recall, which is the proportion of actual positives correctly detected by the model. In the context of illness classification, recall is crucial because it allows us to assess how effectively the model can identify individuals with the condition while avoiding false positives. Precision assesses a model’s ability to detect genuine positives or the fraction of anticipated positives that are truly positive. Precision is crucial in the context of illness classification because it allows us to assess how effectively the model can identify individuals who have the condition without incorrectly labeling healthy persons as positive. The F1 score is a harmonic mean of precision and recall that gauges a model’s ability to balance precision and memory. When the dataset is unbalanced, i.e., when one class has considerably more samples than the other, the F1 score is a relevant assessment statistic. In the context of illness classification, the F1 score is crucial since it allows us to assess the model’s overall performance in recognizing both positive and negative instances. We can gain a more comprehensive understanding of the DL-based disease classification model’s performance by evaluating specificity, recall, precision, and the F1 score, including its ability to accurately identify both positive and negative cases, avoid false positives and false negatives, and balance precision and recall. This data is crucial for establishing if the model is appropriate for usage in clinical settings, where accuracy and dependability are critical.
4. Proposed Architecture
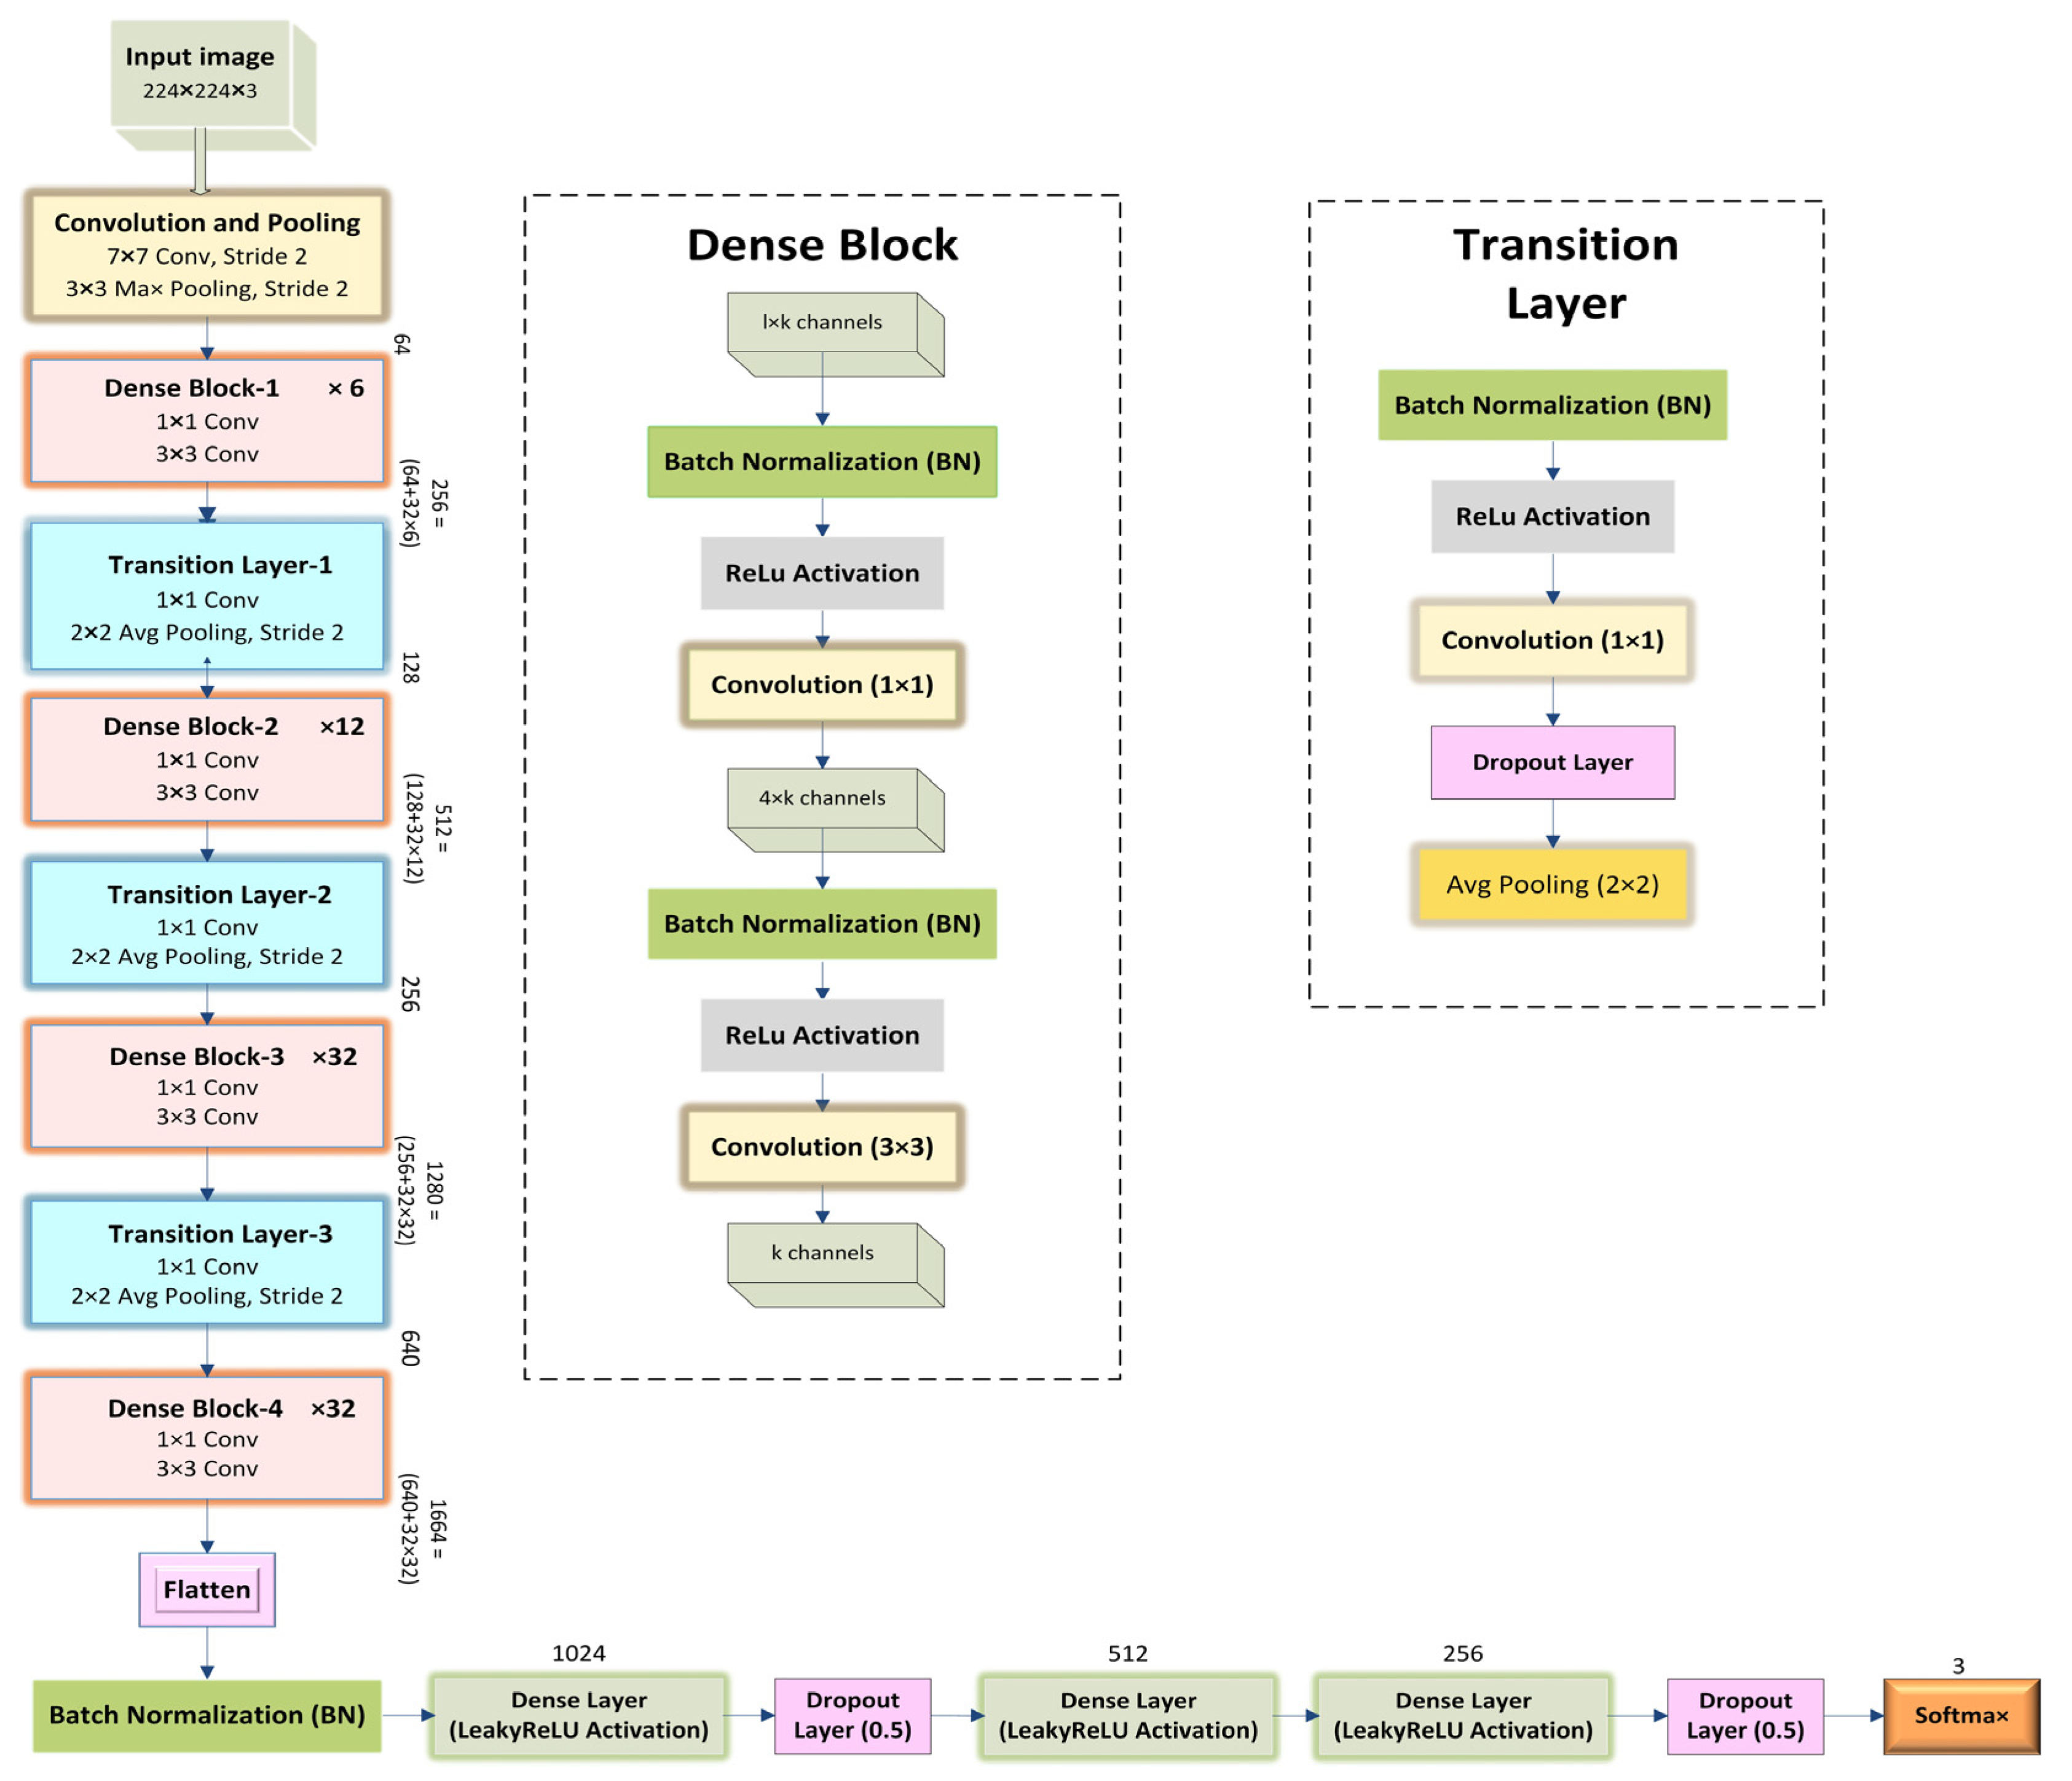
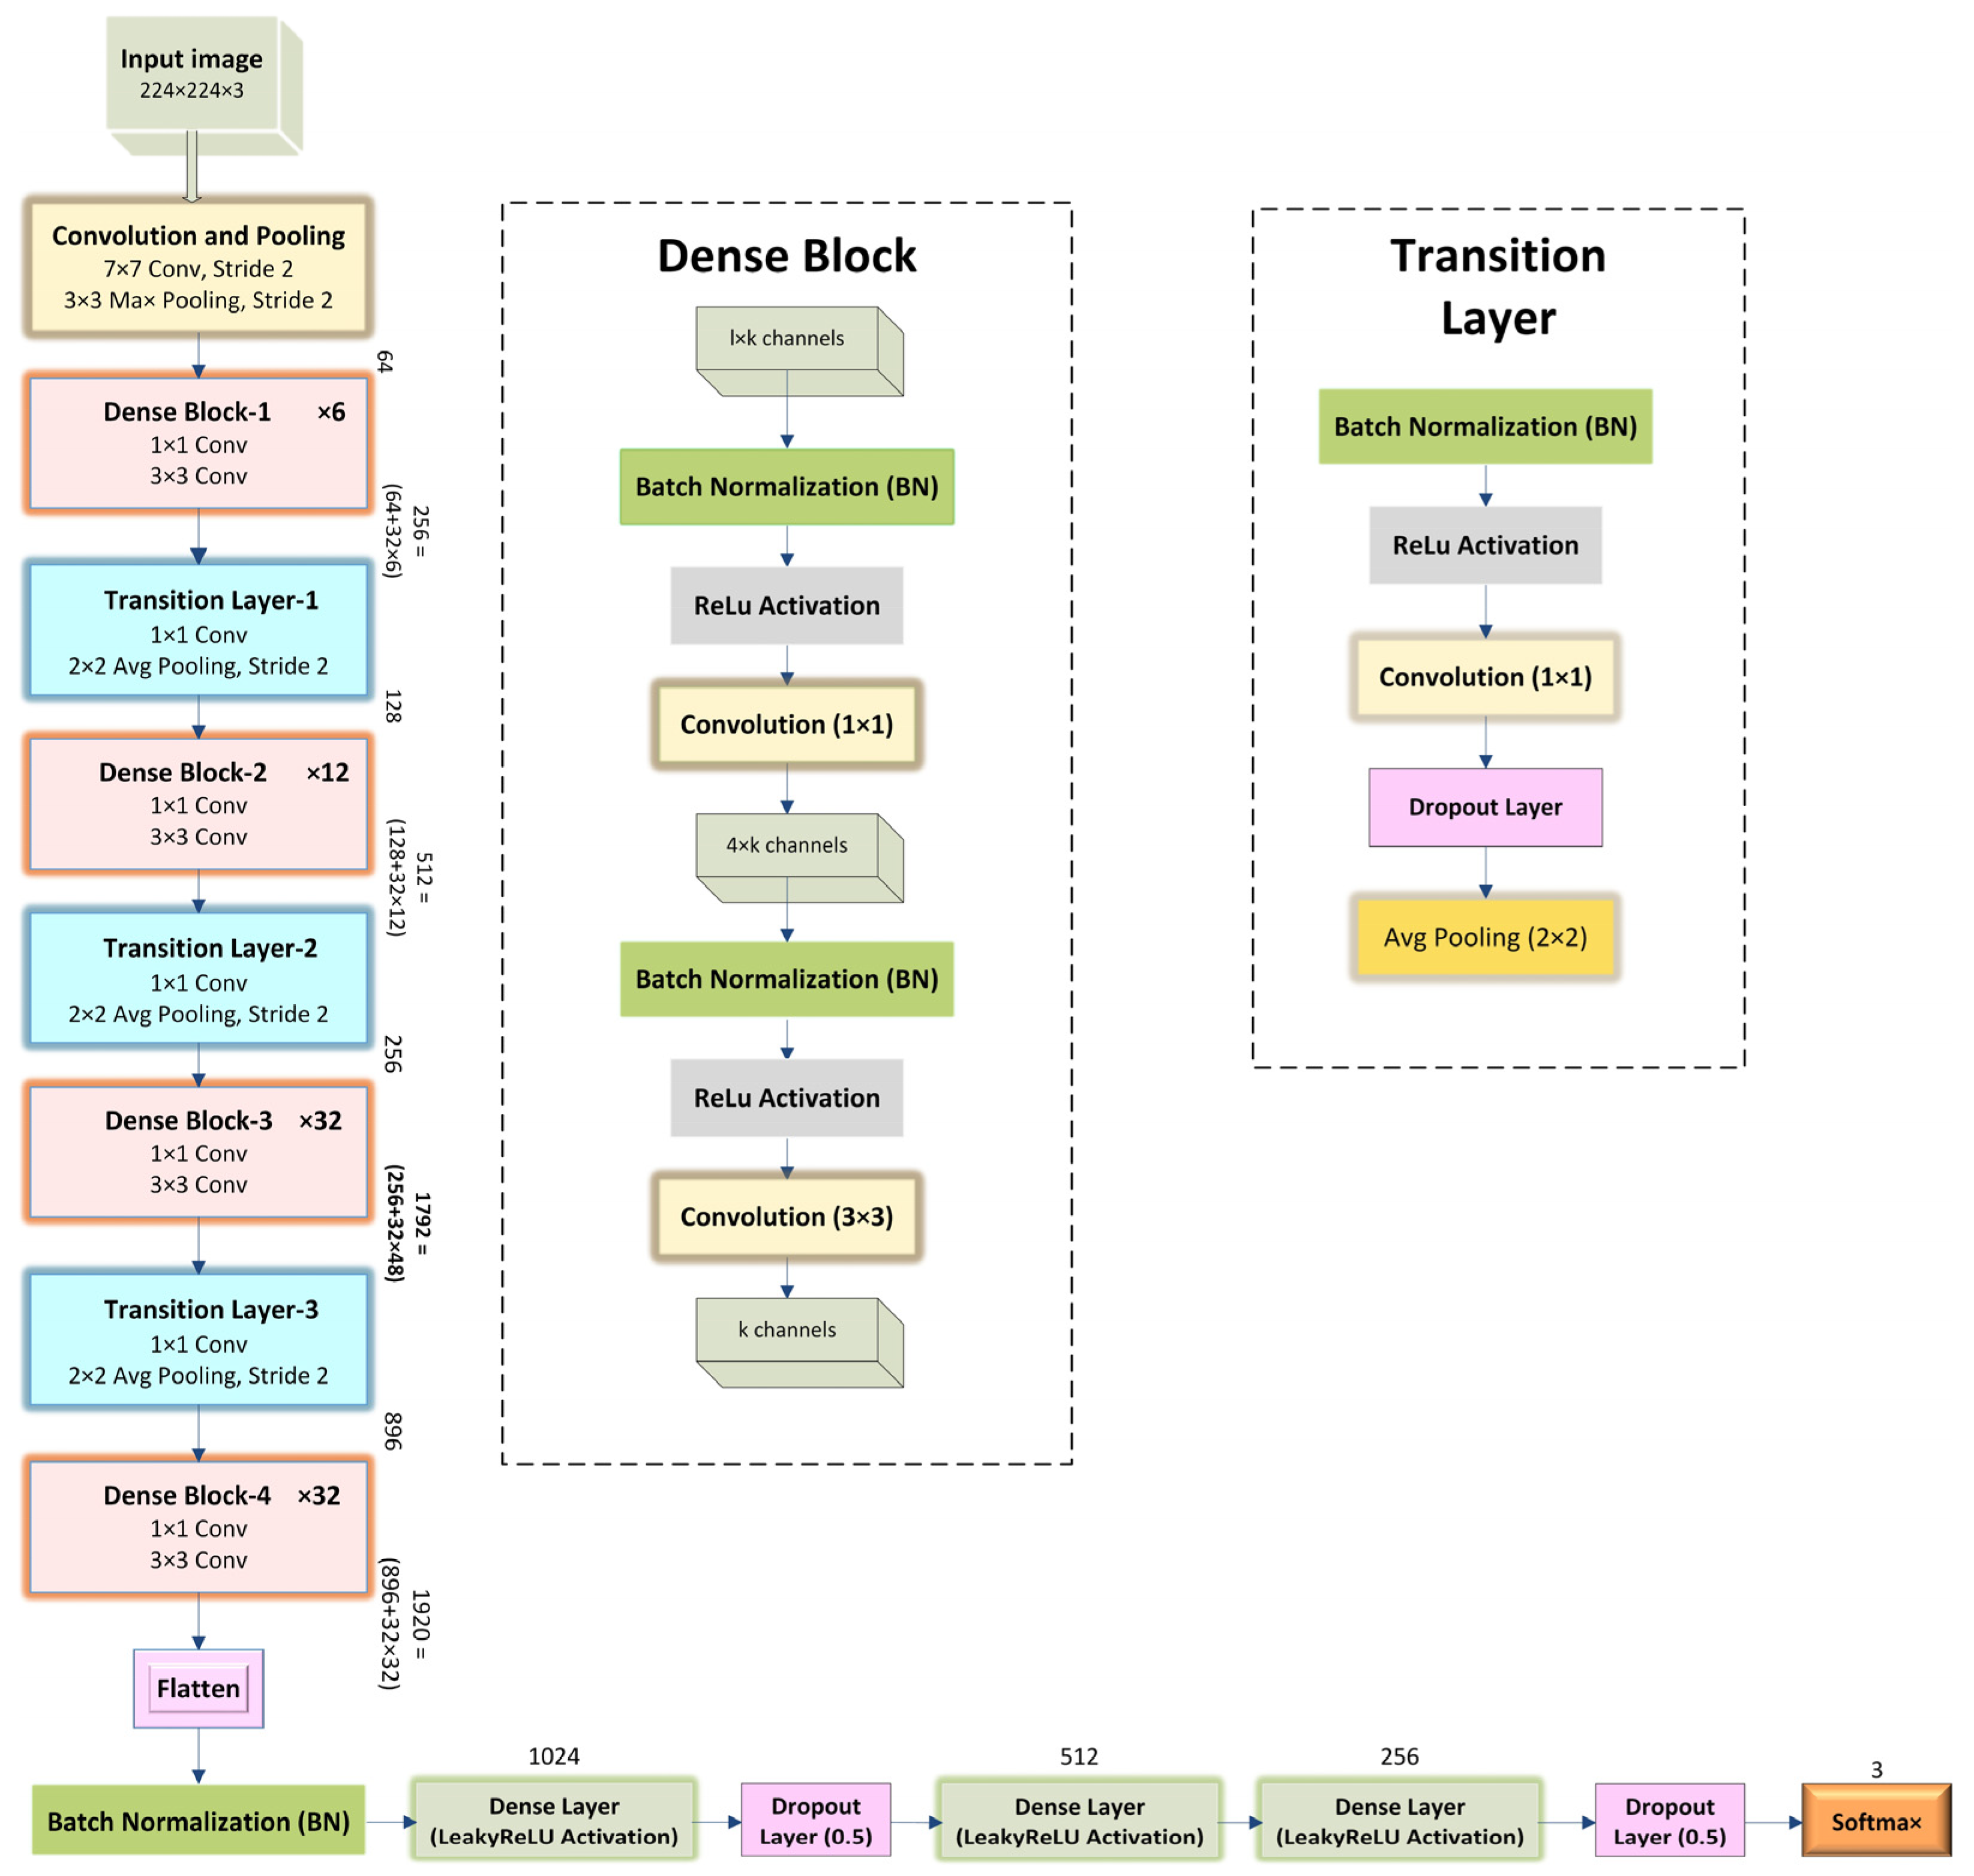
A densely connected neural network is a stack of continual layers from which hidden layers extract features. In this research, the DenseNet architecture is one of the highway networks to increase the depth of the convolutional neural network by stacking on more subsequent convolutional layers. The depth of the model will be controlled with 1 × 1 convolutions and pooling layers. This model comprised two parts of the network. Firstly, feature extraction uses DenseNet-169 and DenseNet-201—secondly, fully connected layers with a softmax activation function for the classification. Figure 2 and Figure 3 depict the overall architecture of the proposed models. There is some tuning of hyperparameters in the classification stage. After the feature extraction part, the output nodes from the final dense block have been flattened, and batch normalization has been conducted. After that, each node maps into a column vector with 1024 rows using the LeakyReLU activation function, followed by a 0.5 dropout layer. Then the fully connected layer transforms this column vector of 512 rows using the ReLU activation function, followed by another fully connected layer which reduces the column vector to 256 rows. The third fully connected layer employs a sigmoid activation function. Again, a dropout layer with a 0.5 dropout probability is applied before the last fully connected layer to the training dataset. The last fully connected layer using a softmax activation function, maps the column vector into a column vector with 3 rows, equivalent to the number of three classes. Additional layers in the classification stage were trainable, whereas the weights from the feature extraction phase were left frozen in the pretrained DenseNet. With each successive epoch, the training accuracy began to increase according to the unique arrangement of the layers and parameter efficiency in the classification phase. The resulting training accuracy improved by resolving the vanishing gradient problem by including Nadam optimization techniques and several dropouts in these layers. Nesterov’s Adaptive Movement Estimation (Nadam) is applied here to train the model in less time and more efficiently with a dynamic learning rate. In the transfer learning scheme, three neurons in a fully connected layer, a softmax layer, and a new classification layer with three classes such as normal, pneumonia, and COVID-19, are used.
Initially, to aid in data generation, X-ray images are resized to 224 × 224, and data augmentation is also applied. After that, the experimental dataset is segregated into two parts (training and testing). Afterward, the dataset is trained using the proposed models. The data was trained up to 30 epochs with an initial learning rate of 0.002, and the batch size was 64. The best accuracy for the proposed model was observed within 30 epochs. The overall accuracy of the model was observed based on some performance metrics. The summarization of the results of sample images from the classification layer is identified correctly and incorrectly by a confusion matrix.
5. Results and Discussion
This section describes the experimental results based on performance metrics. The implementations of the architectures were performed by Google Collaboratory, known as Google Colab, which is an open-source cloud-based platform to write and execute arbitrary Python code to be used for experimental purposes. Moreover, for the experiment, ML libraries such as Numpy, Scipy, Scikit-learn, Matplotlib, etc., were used. Various optimizers have been examined based on DL and the CNN framework to obtain the greatest accuracy in the proposed model. Because ML and DL approaches are stochastic models in general, experiments were carried out for numerous runs, multiple optimizers, and learning rates to ensure the robustness of the proposed models. In this work, different optimizers such as Nadam, Adam, and SGD are considered. Table 3 shows that the Nadam optimizer performs the best for our proposed models. Moreover, the learning rate is varied for the Nadam optimizer. Table 4 shows that the learning rate of 0.003 is the best for the proposed models with the Nadam optimizer. Next, the models were trained and evaluated with multiple runs. The mean of the performance metrics was calculated across all runs. The higher the number of runs, the more accurate the estimation of the model’s performance and variability. Table 5 shows the performance metrics for multiple runs of the proposed models. Table 5 indicates that the results for runs 1 through 4 do not differ significantly. In the remaining experiments, Nadam, with a learning rate of 0.003, was used, and a single run was considered. Finally, the model was compiled, and the model was saved.
The proposed classification model of COVID-19 is contrasted with contender models utilizing distinctive confusion matrix-based measurements. These measurements are accuracy as shown in Figure 4 and Figure 5, precision, F1 score, sensitivity, specificity, precision, and ROC curve. The primary objective of this research is to use X-ray scans to determine whether patients have been impacted by COVID-19 positivity, COVID-19 negativity, or pneumonia. The dataset is divided into four categories: true positive (TP), false positive (FP), true negative (TN), and false negative (FN), as indicated by the confusion matrix in Figure 6. In some cases, individuals may not be directly affected by COVID-19 or pneumonia, but their outcomes or overall health status can still be affected. Moreover, in some cases, patients were found to have COVID-19 or pneumonia but were found to be unaffected.
Patients’ actual classes may or may not correspond to their test results. There should be some numerical metrics used to validate the proposed model’s performance. Since this is a three-level classification model, the TP, TN, FP, and FN values are not derived directly, as they are in a binary classification problem. These values were determined separately for each class. The cell in the confusion matrix designated by the column and row for the positive class contains TP, for which both the actual and anticipated classes are normal. Second, the rows and columns that show cells in the negative class are called FN. They have a real class for normal people and a predicted class for people with pneumonia or COVID-19. Third, cells identified by the column for positive class contain FP and rows for negative class, where the actual class for pneumonia or COVID-19-affected patient differs from the predicted class for a normal patient. Finally, cells outside the row and column for the positive class contain TN with the actual class for COVID-19 or pneumonia patients and the predicted class for COVID-19 or pneumonia patients. A wrong prediction within the negative class is still called a true negative. The overall performance evaluation of this proposed model is shown in Table 6 and Table 7.
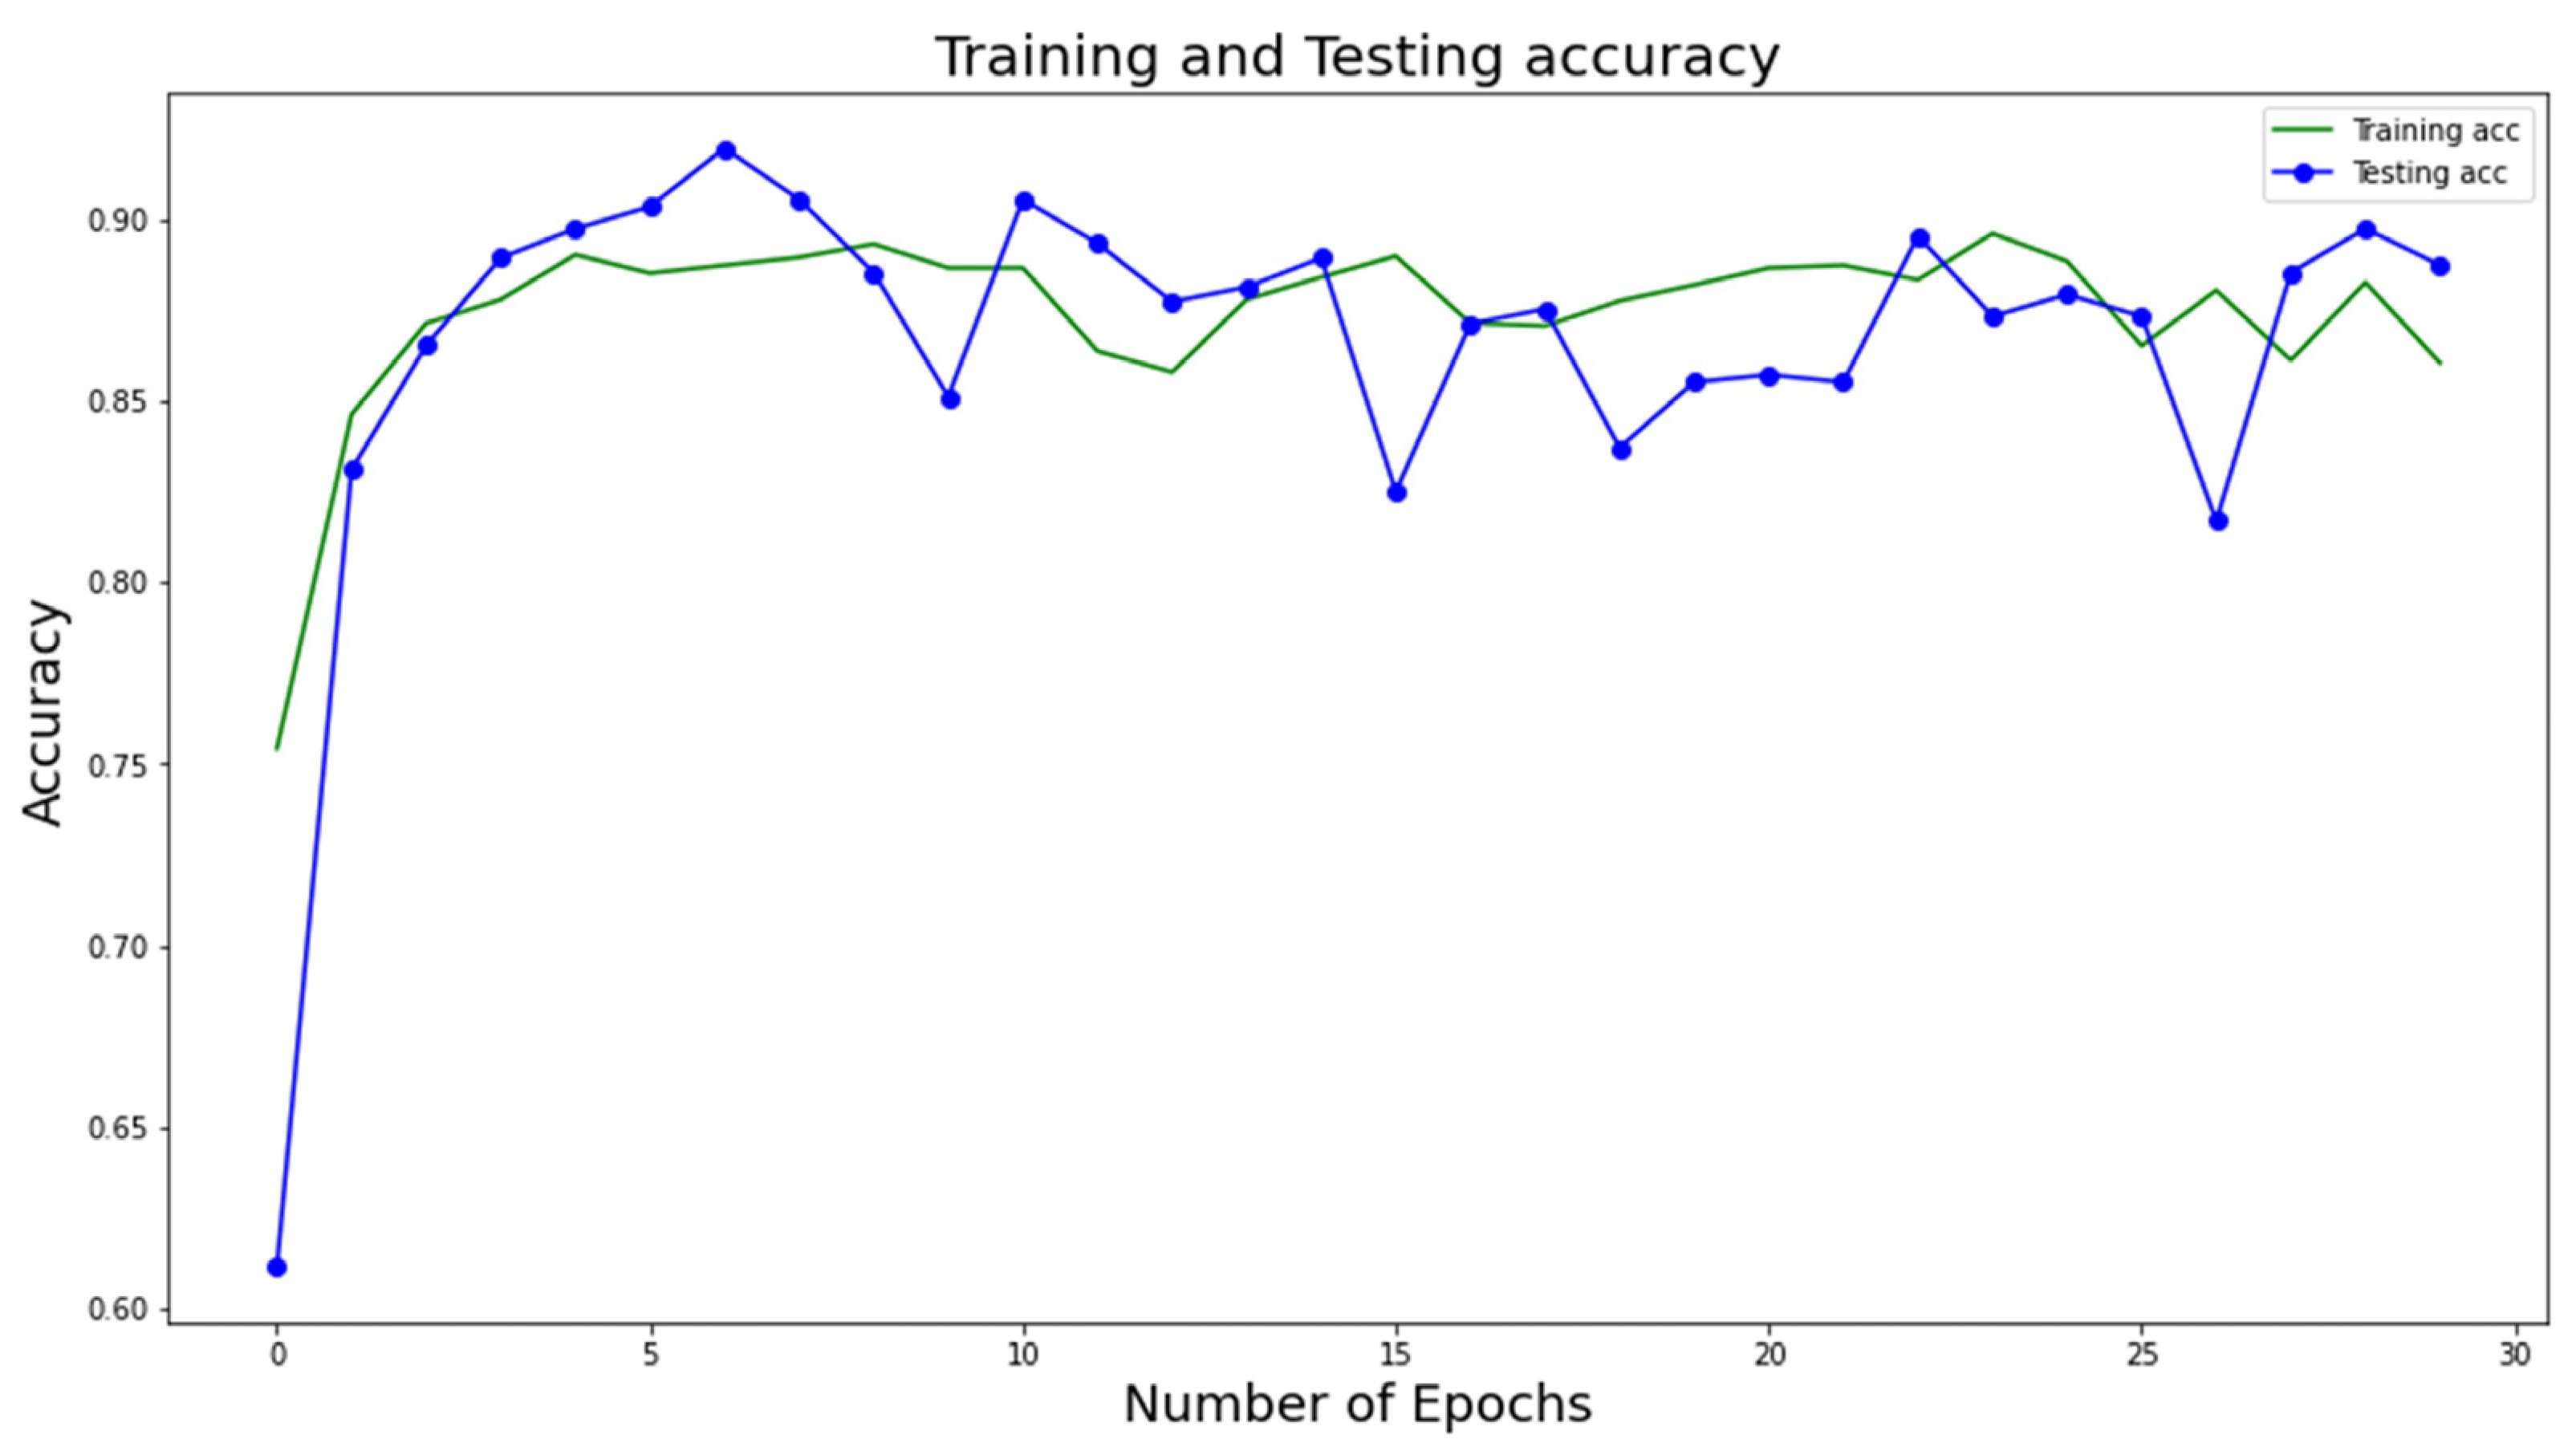
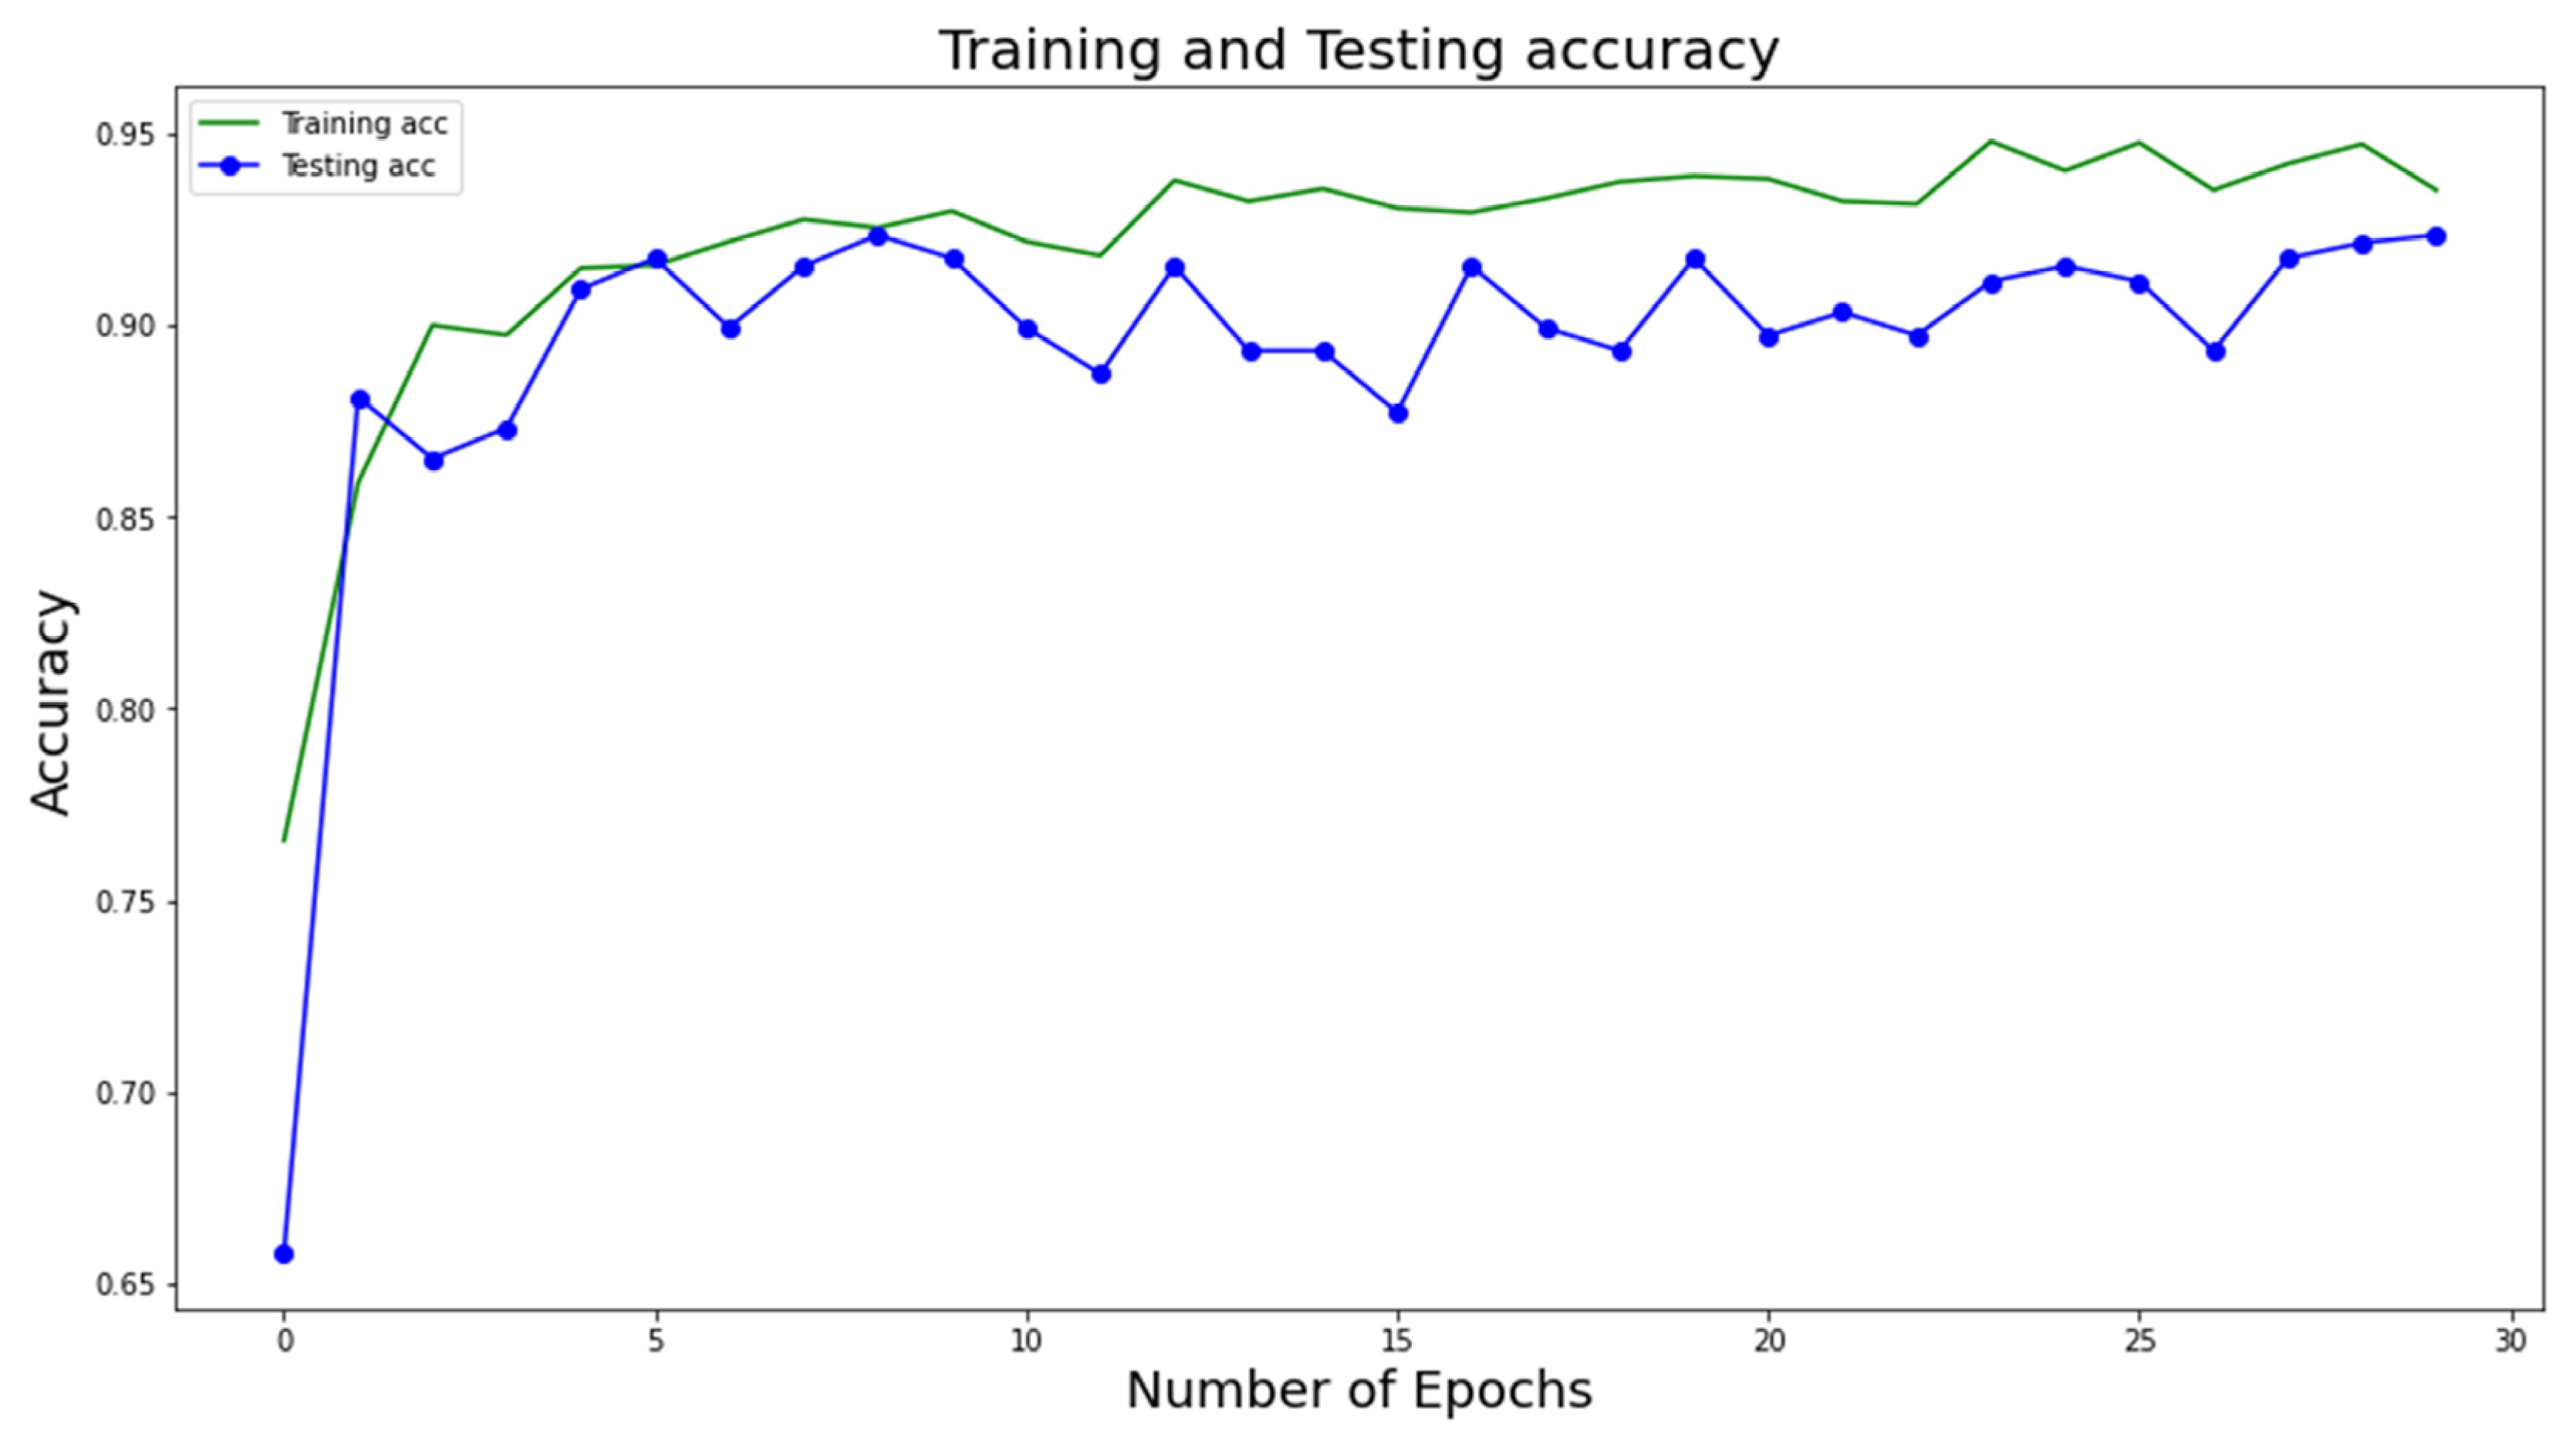
The numeric values of Table 6 and Table 7 are calculated from the above-mentioned performance measures. Figure 4 and Figure 5 show the training and testing accuracy of the proposed DL model with respect to the number of epochs. Note that the accuracy values are calculated at several epochs during the training phase to evaluate the model’s performance on the testing data. This allows the model’s performance to be tracked over time and detects any overfitting or underfitting. We can find the epoch at which the model obtains the best accuracy on the testing data by tracking the testing accuracy values at different epochs. This epoch is then utilized to choose the final model for deployment because it marks the point in the model’s ability to generalize to new data.
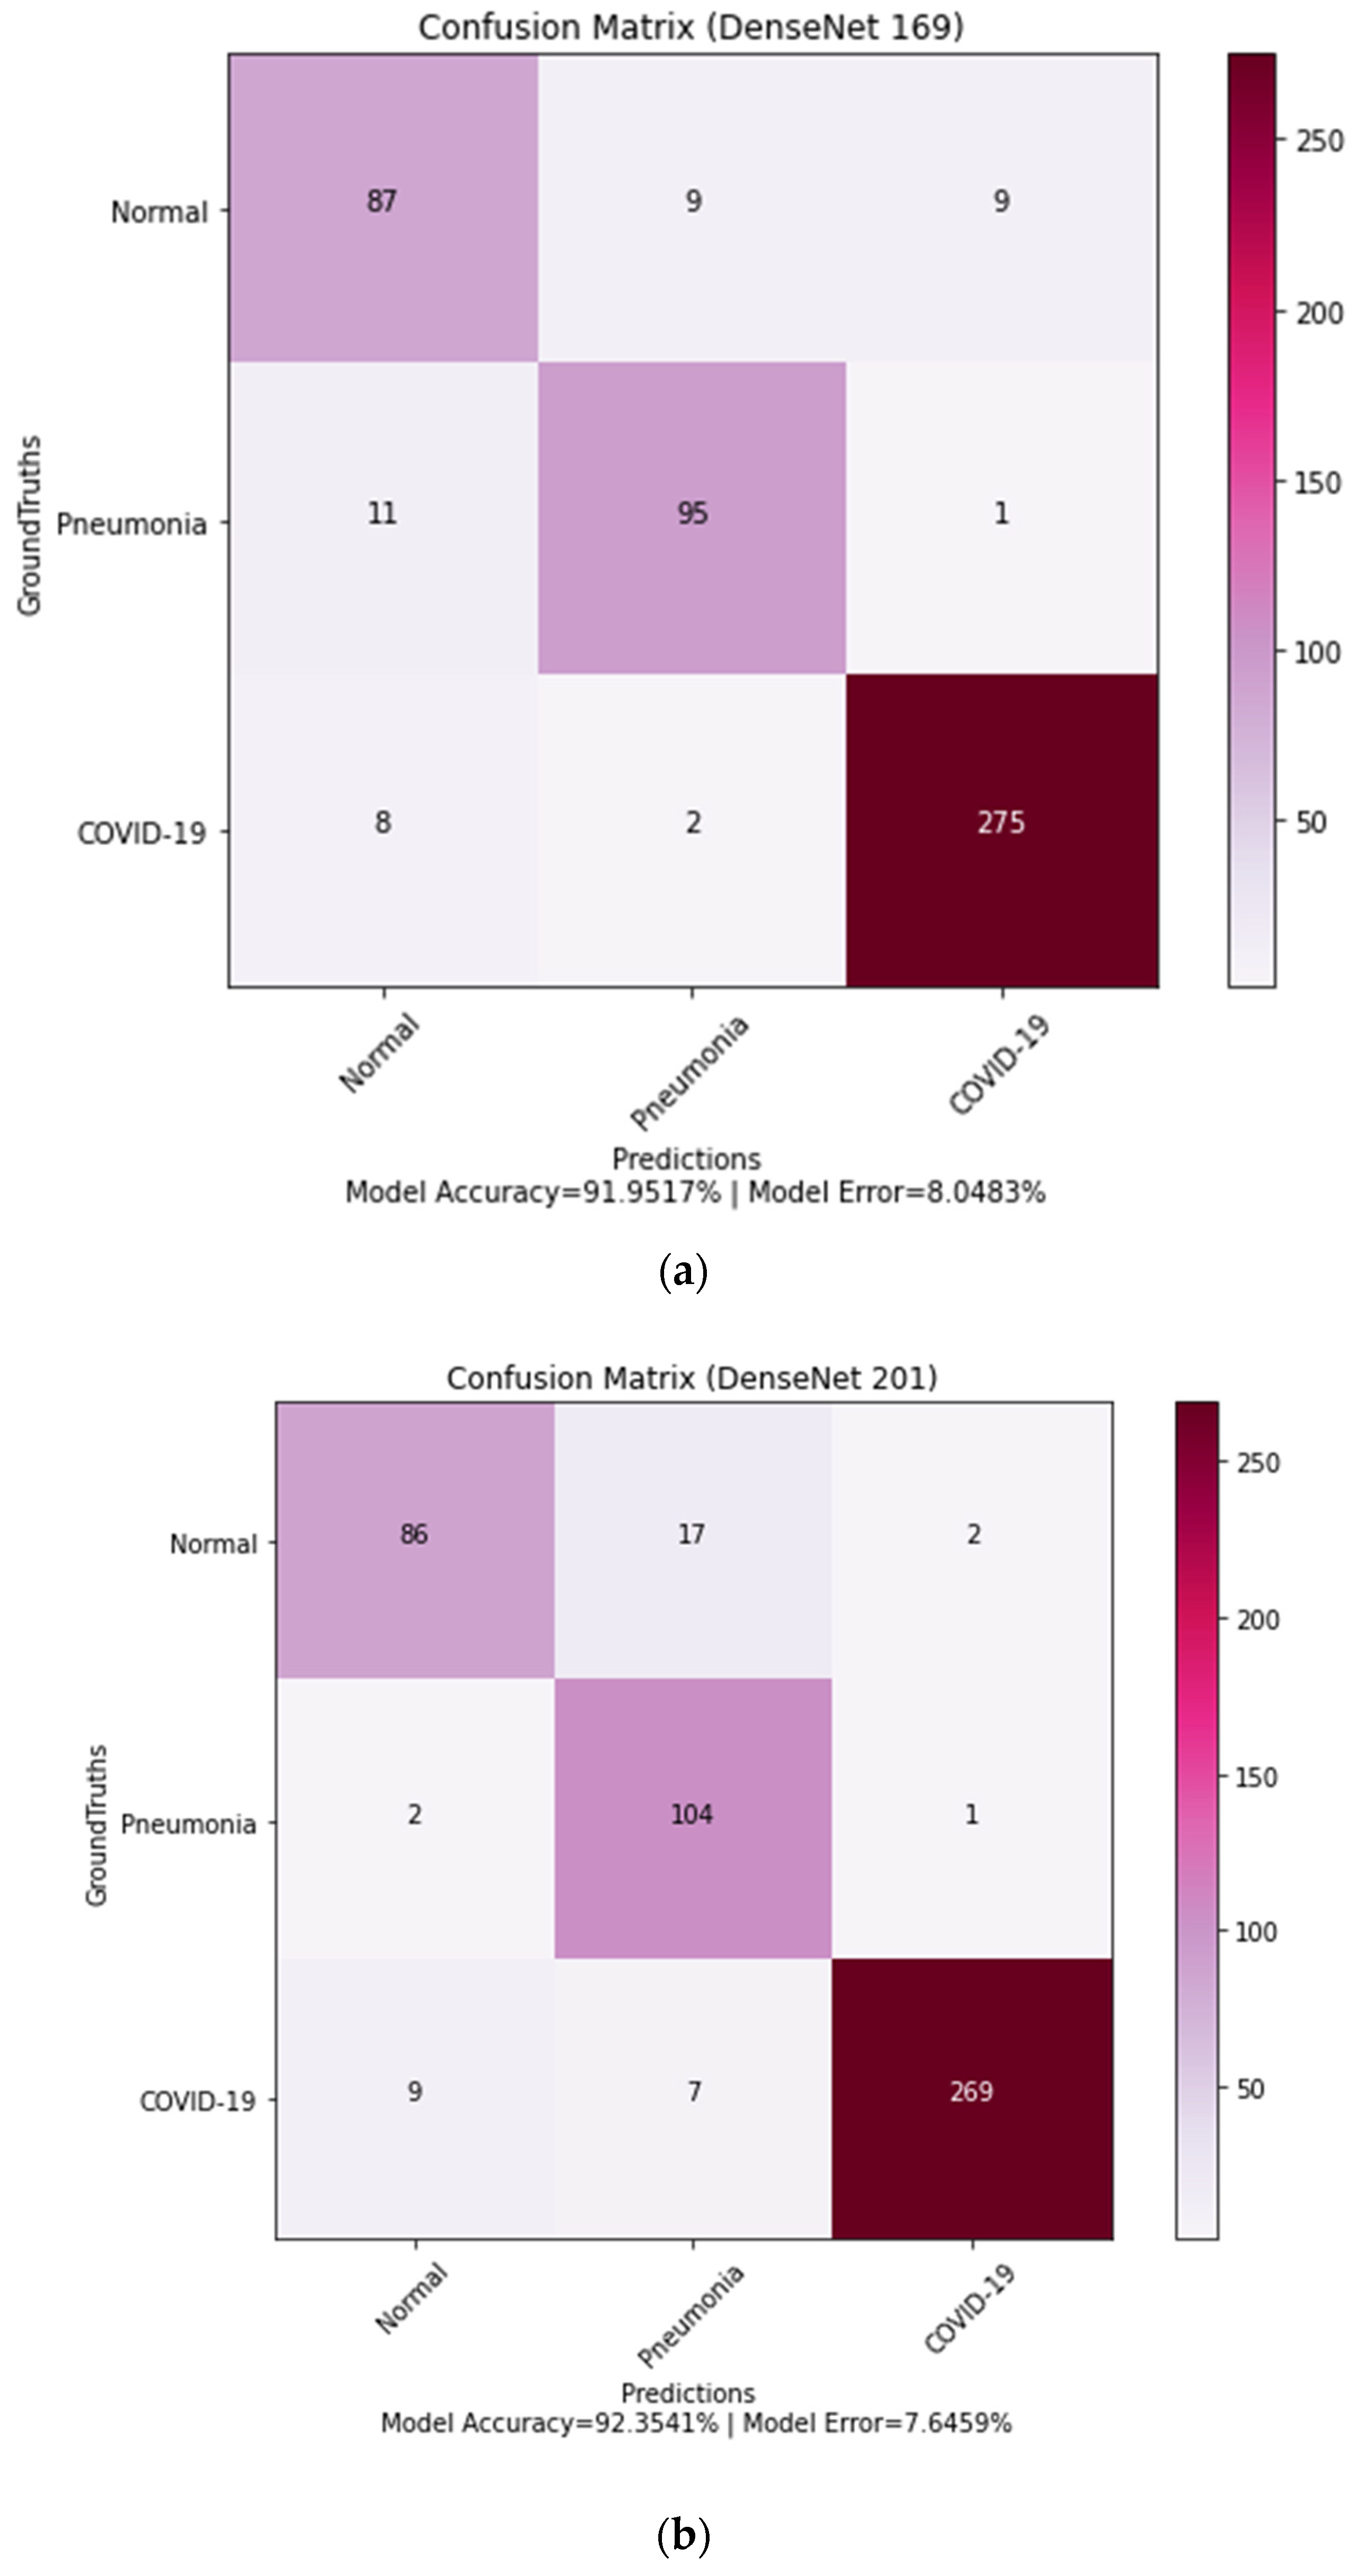
Figure 6 presents the confusion matrix from which TP, TN, FP, and FN can be calculated, which are useful metrics in the data-driven diagnosis of lung diseases. Since the dataset contains three different classes, the values for TP, TN, FP, and FN are calculated for each individual class from the confusion matrix. When the “normal” case is considered, the FP indicates the model wrongly predicts an individual to be normal and not have COVID-19 or non-COVID-19 pneumonia. FN, in the case of the “COVID-19” class, arises when the model fails to detect the existence of COVID-19 in individuals who have the condition. Similarly, for the “non-COVID-19 pneumonia” class, FN occurs as the model fails to detect non-COVID-19 pneumonia. Any case that involves the undetection of lung disease can be dangerous. Such mistakes can have major effects on the diagnosis and treatment of lung diseases. Other categorization problems include misclassifying distinct types of lung diseases or failing to discriminate between disease stages or severity. These mistakes can also have serious consequences for patient care and results. The different values of FP, FN, etc., metrics can be observed in Figure 6a,b. For example, the metrics for the normal class for DenseNet-169 can be obtained from Figure 6a as: TP = 87, TN = 95 + 1 + 2 + 275 = 373, FN = 9 + 9 = 18, FP = 11 + 8 = 19. Similarly, the metrics for the normal class for DenseNet-201 can be obtained from Figure 6b as: TP = 86, TN = 104 + 1 + 7 + 269 = 381, FN = 17 + 2 = 19, FP = 9 + 2 = 11. By combining the metrics for each individual class, a single measure is obtained for the whole model.
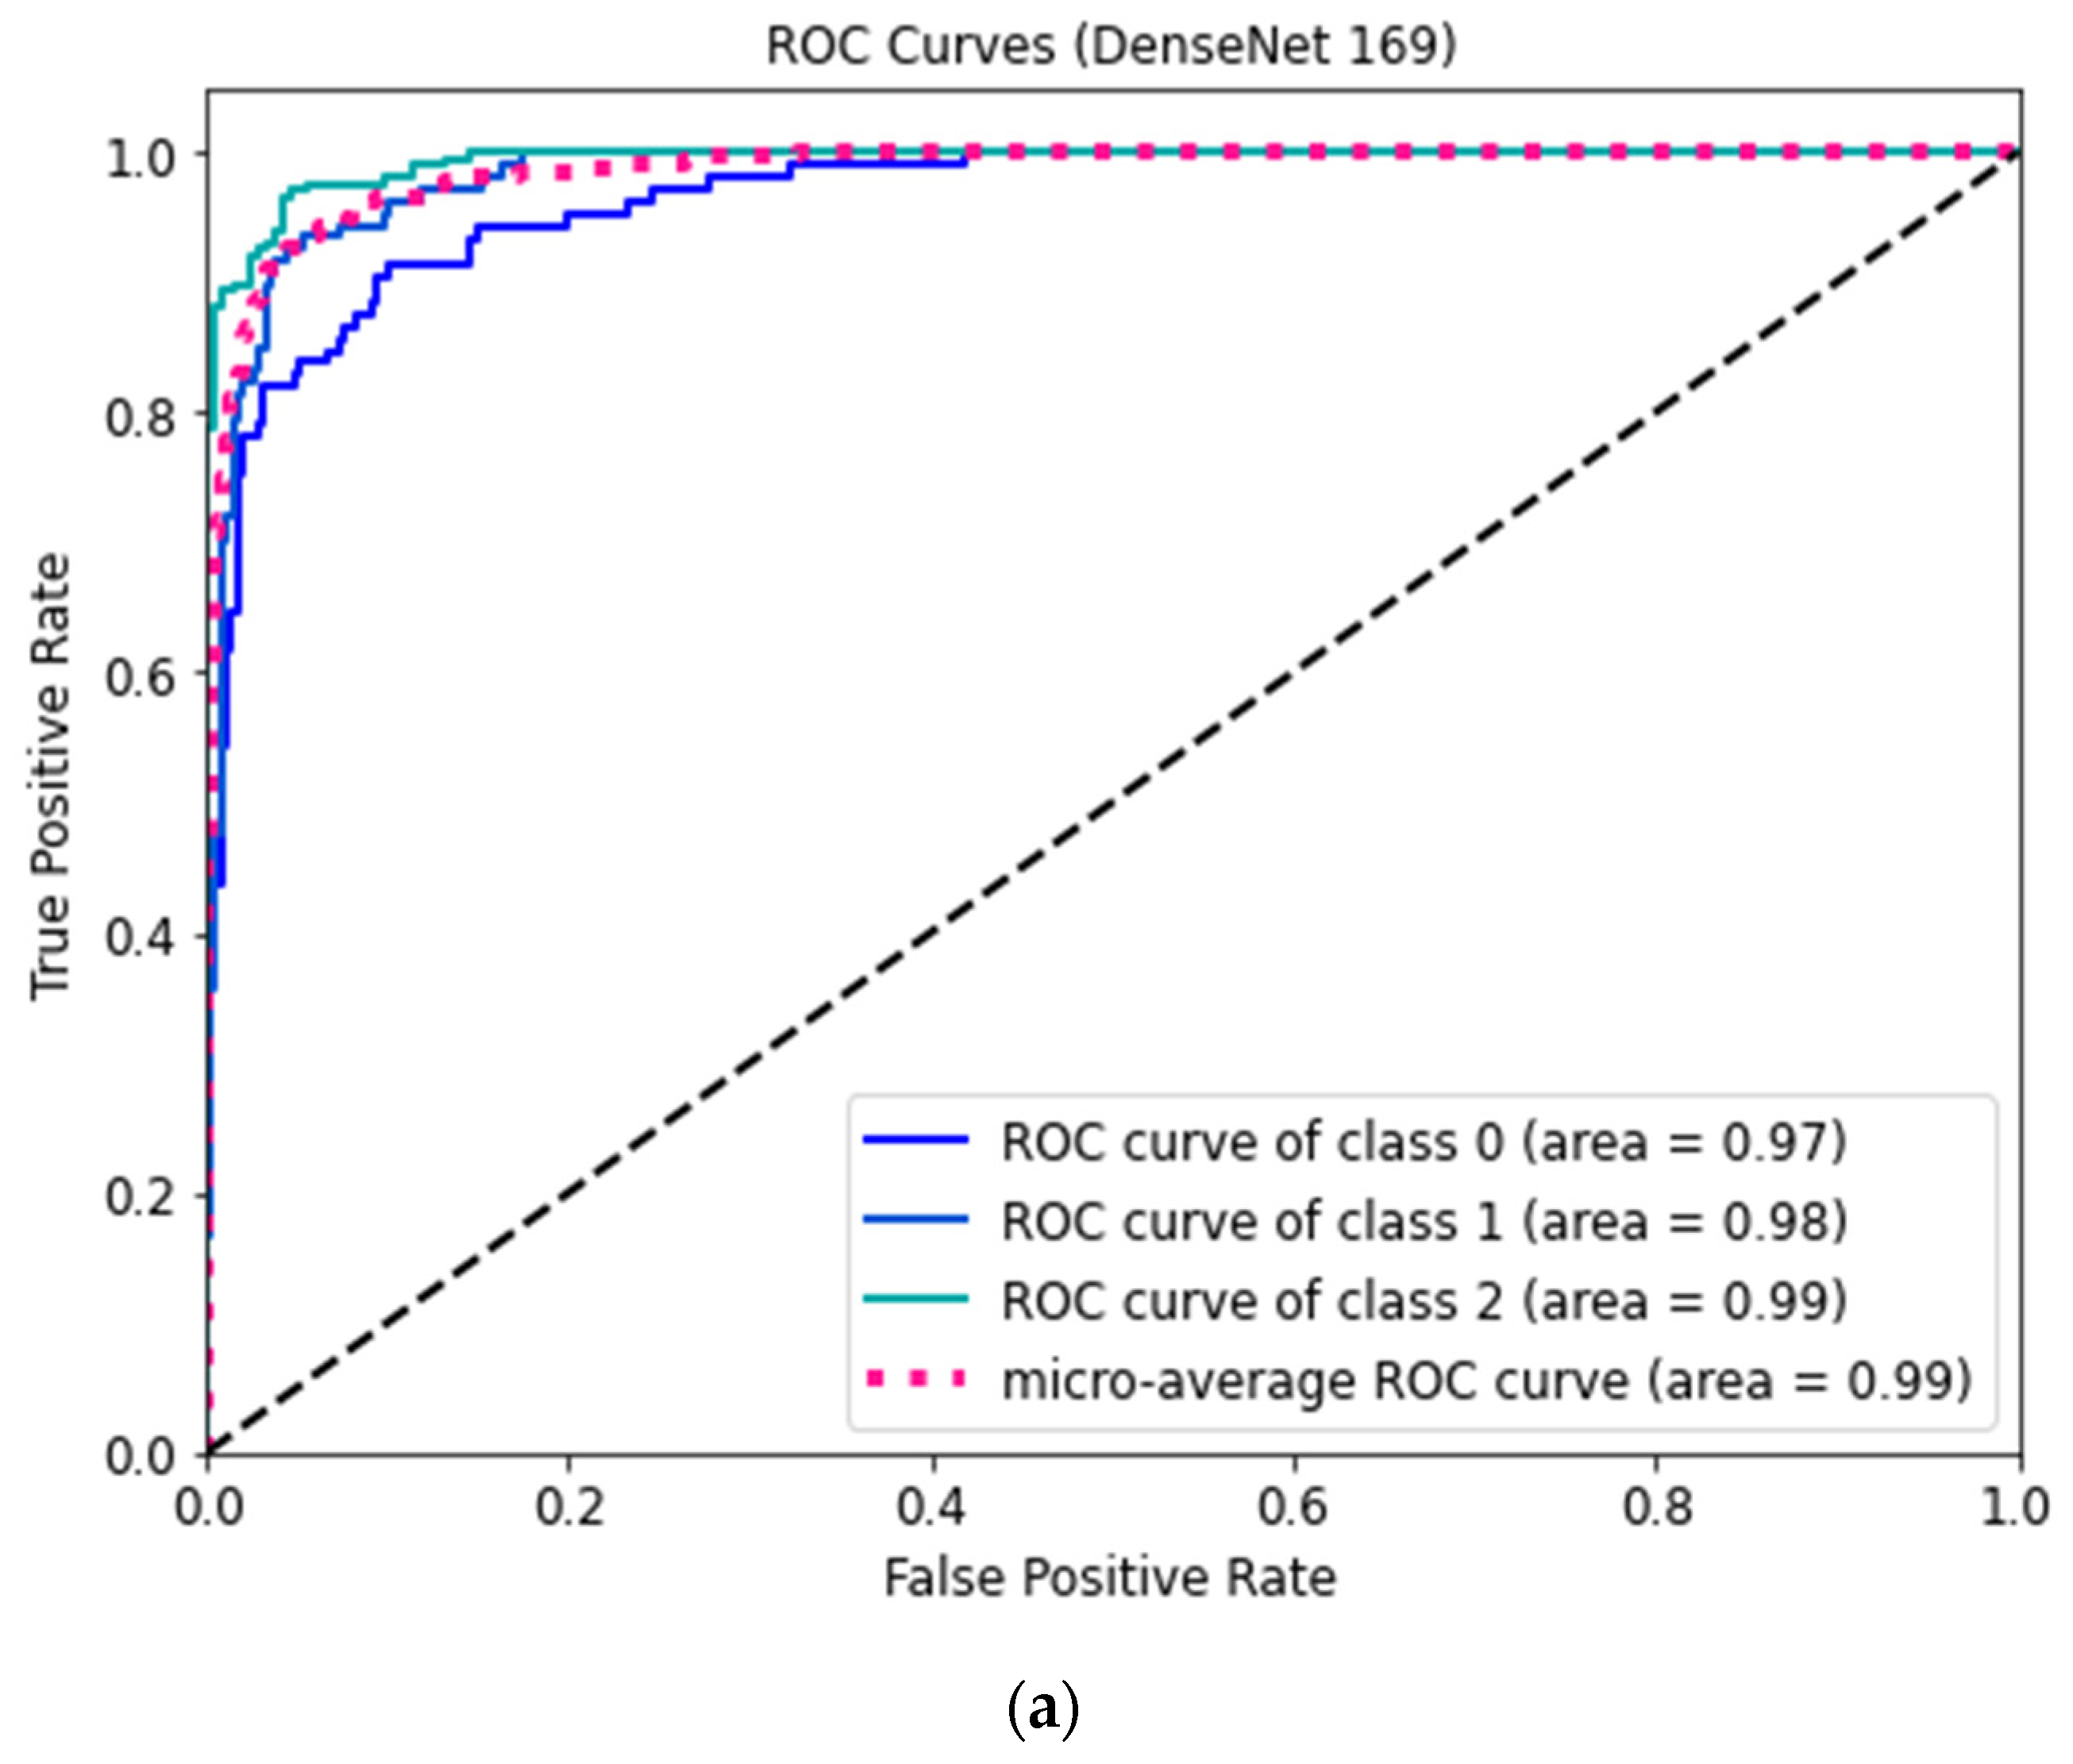
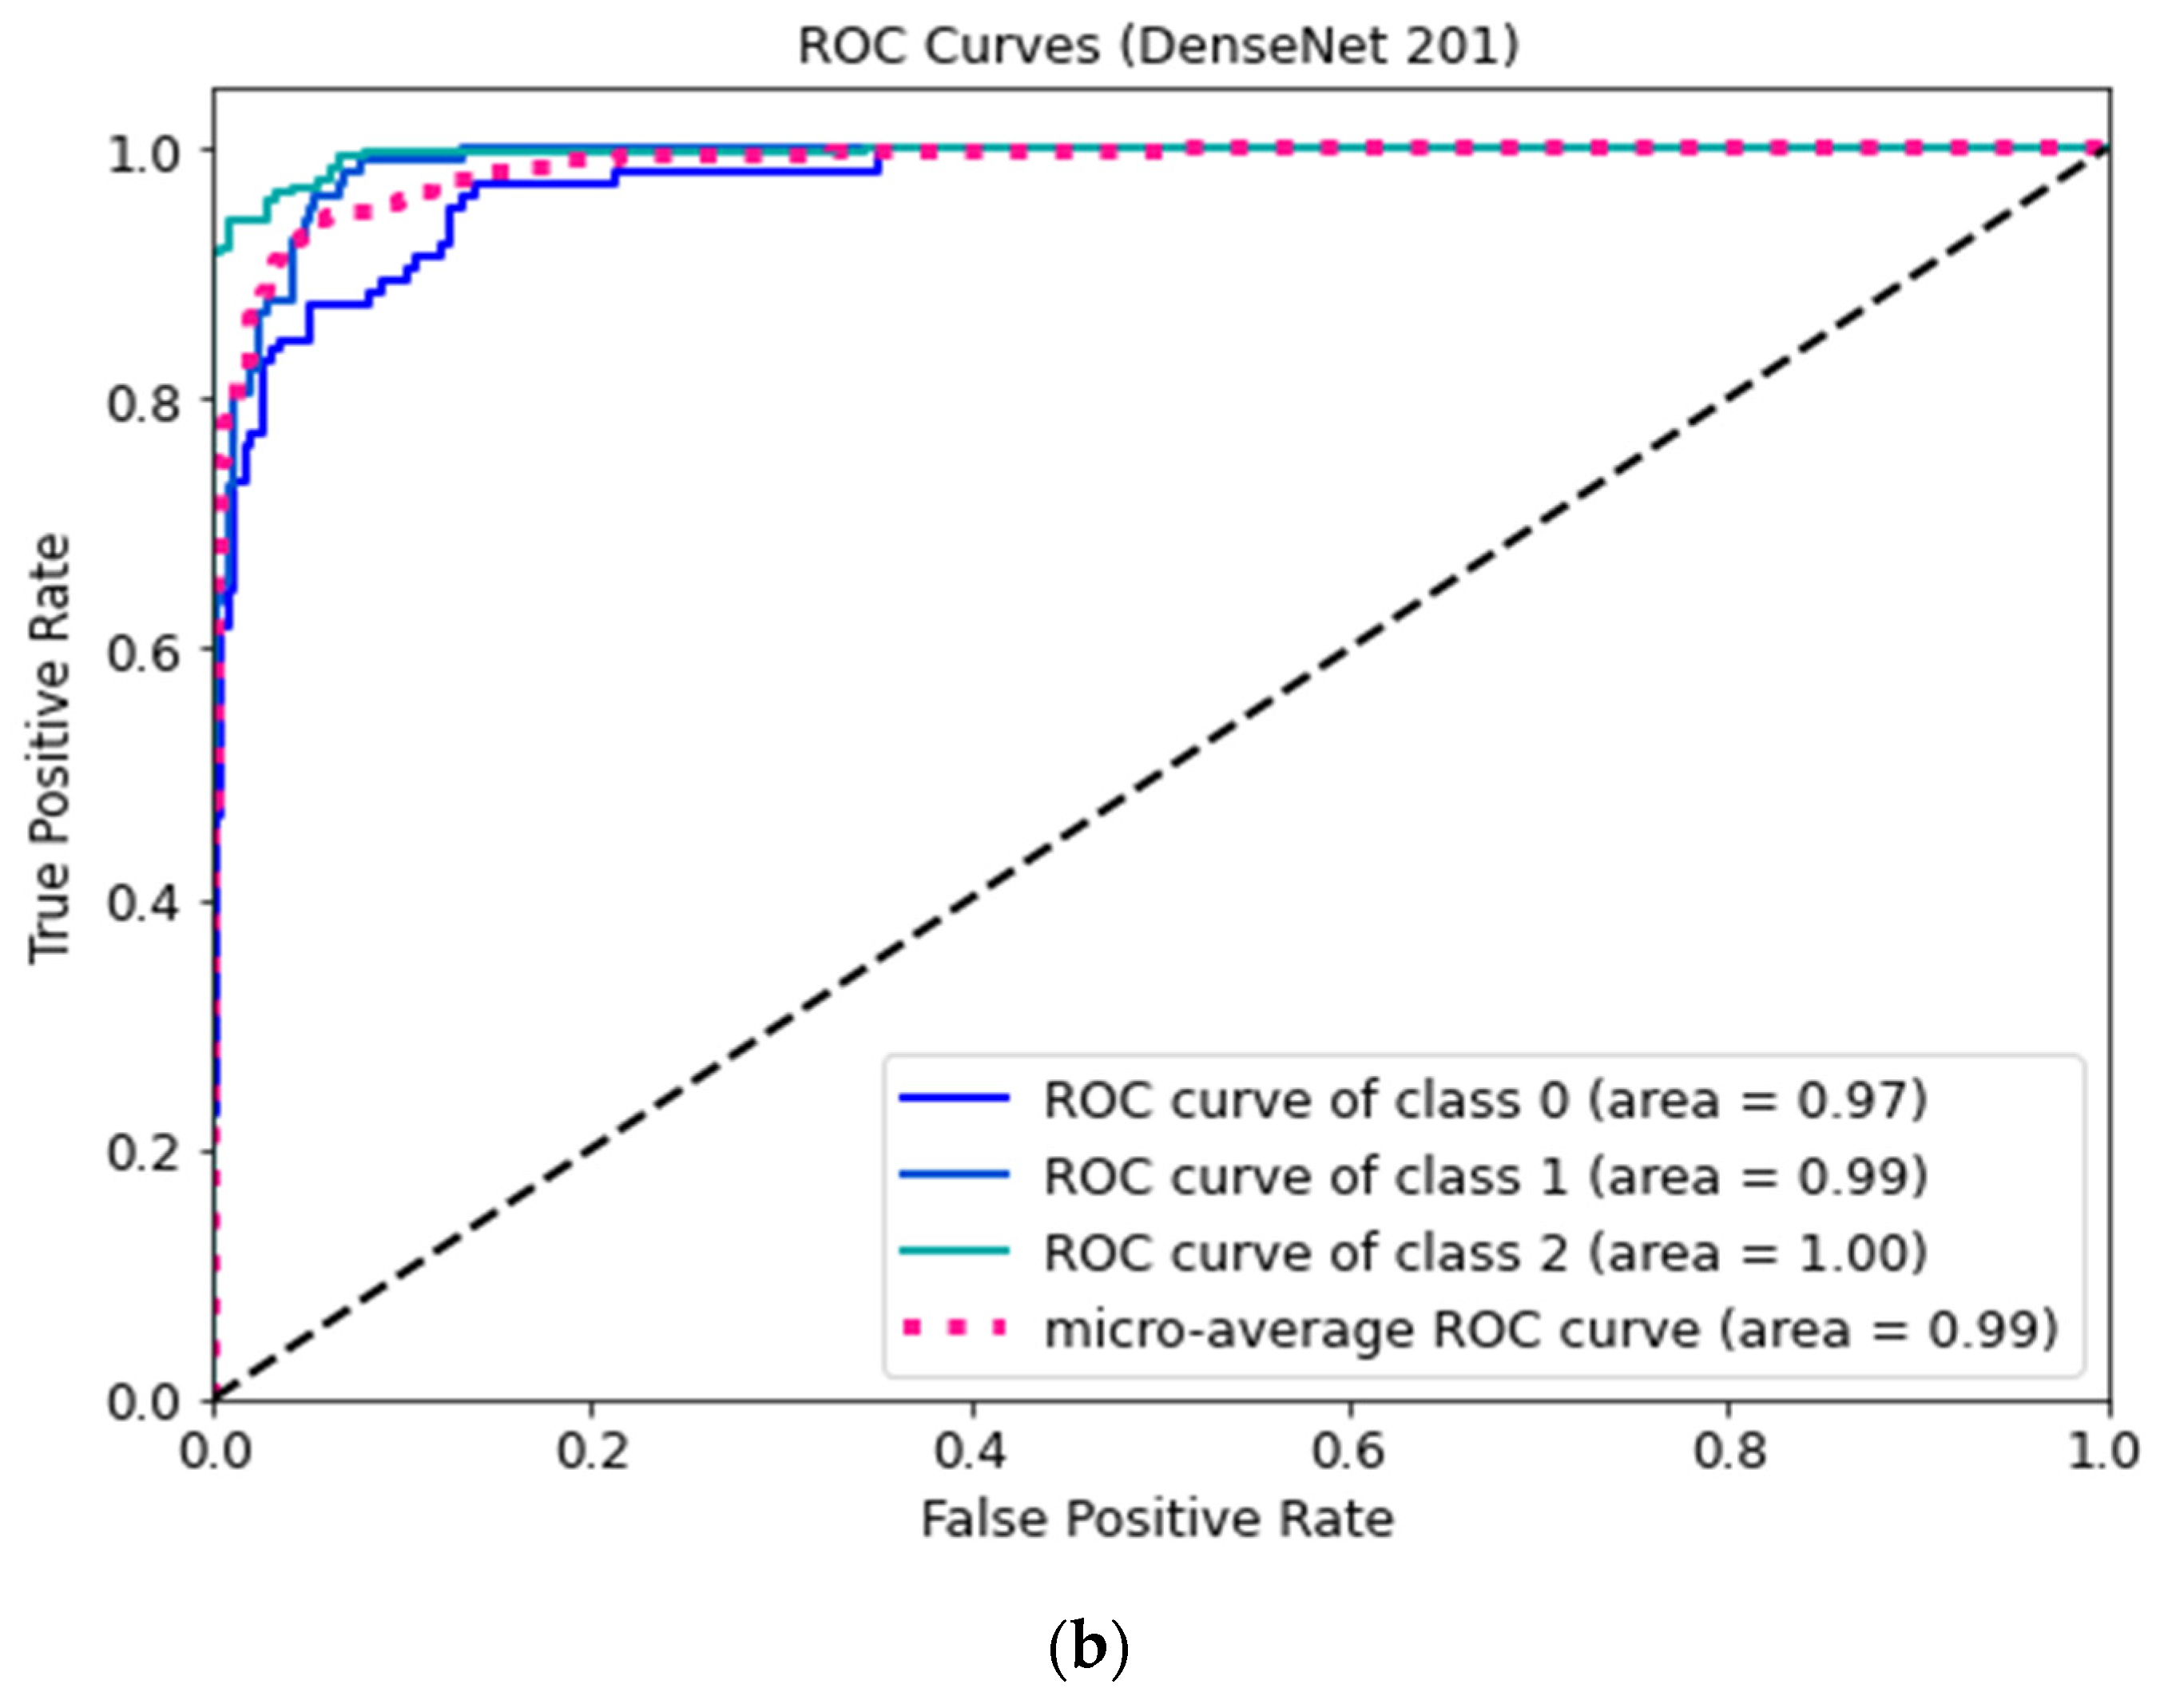
Figure 7 shows the ROC curves for three classes of the proposed DenseNet 169 and DenseNet 201 models.
The figures show that the model obtains higher accuracy, recall, precision, F1 score, specificity, and loss values at the 30th epoch and that the whole model is computationally efficient due to its high speed. It is advised in medical research to reduce all false positive and false negative cases so that diseases are not incorrectly classified. The number of incorrectly diagnosed instances is recommended to be reduced, as any incorrect diagnosis can be potentially dangerous. After assessing the confusion matrices, the proposed architectures could reliably classify approximately 92% of the cases. The confusion matrices demonstrate fewer false positive and false negative cases of three types of lung datasets categorization with more correctly predicted cases. As a result, the architecture may be appropriate for reliably diagnosing lung diseases.
In order to compare the proposed models with the baseline models, DL architectures, such as VGG-16, AlexNet, and RestNet, were applied to the same dataset. Table 8 indicates that the proposed models with the Nadam optimizer outperform the baseline models. Table 9 shows the comparison of different models of References [8,9,12,13] with the proposed models in terms of performance metrics.
The ROC curve shows the classification performance of the model on two cases true positive and false positive rates. Figure 7a,b demonstrate that the COVID-positive case (class 2) performed considerably better on the DenseNet-169 and DenseNet-201 models compared to other cases. Consequently, the over-fitting phenomenon is minimized in these optimized structures. These could be employed to reliably classify COVID-positive, healthy, and pneumonia-affected cases. It can be seen from the comparisons in Table 5 that the proposed architectures offer a better evaluation of the model with all basic metrics. However, other relevant research in the literature has certain drawbacks in measuring the model’s performances, including all parameters. Hence, for the cases considered, our proposed models outperformed existing models in comparison. The model can be applicable for classifying other related lung illnesses. Many hospitals now lack skilled doctors to diagnose many types of lung infections. Therefore, the proposed models can be used as a backup strategy for correctly diagnosing respiratory problems. The model-building technique is visually oriented as the most effective way to assess its generalization as a medical decision support system. This architecture can bring a revolutionary change in the field of medical technology as the world is now technology dependent.
The research has a few limitations as well. Firstly, the overall model accuracy has to be improved to around 99–100%. Another limitation is that the proposed model includes three class classifications, and it should classify more diseases similar to COVID-19. Furthermore, a GUI based on the proposed models can be deployed, allowing medical experts to identify and isolate COVID-19 patients immediately. In the future, it is planned to develop a more accurate model to detect COVID-19 correctly. Thus, the limitations of the architecture can be overcome by more optimized models in the future.
6. Conclusions
In this paper, a model is proposed for three class classifications of COVID-19 diagnosis compared with normal and healthy patients’ X-ray images as well as non-COVID pneumonia-affected patients with the help of DenseNet-169 and DenseNet-201. The proposed model classifies the X-ray images with training and testing datasets with an overall model accuracy of 91.95% and 92.35% for DenseNet-169 and DenseNet-201, respectively. The proposed architectures are both computationally and parameter efficient. The additional layer arrangements and hyperparameter adjustments enabled both models to obtain higher accuracy. Comparative analysis indicates that the mentioned optimized algorithms outperform other well-known DL models considerably better. In the future, confidence intervals can be calculated for the proposed models to evaluate their robustness. Moreover, the proposed models may be applied to datasets with more than three classes.
Author Contributions
P.P.—Conceptualization, Methodology, Writing—original draft, Writing—review and editing; F.B.A.—Conceptualization, Methodology, Writing—original draft, Writing—review and editing, M.R.H.M.—Investigation, Validation, Writing—review and editing; M.J.H.—Conceptualization, Methodology, Writing—review and editing, Supervision, A.R.—Conceptualization, Methodology Writing—review and editing, Supervision; S.B.—Data Curation, Software, Visualization, Resources. All authors have read and agreed to the published version of the manuscript.
Funding
This research received no external funding.
Institutional Review Board Statement
Not applicable.
Informed Consent Statement
Not applicable.
Data Availability Statement
The data that support the findings of this study are available upon request to [email protected] (M.R.H.M).
Conflicts of Interest
The authors declare no conflict of interest.
References
- Hui, D.S.; Azhar, E.I.; Madani, T.A.; Ntoumi, F.; Kock, R.; Dar, O.; Ippolito, G.; McHugh, T.D.; Memish, Z.A.; Drosten, C.; et al. The continuing 2019-nCoV epidemic threat of novel coronaviruses to global health—The latest 2019 novel coronavirus outbreak in Wuhan, China. Int. J. Infect. Dis. 2020, 91, 264–266. [Google Scholar] [CrossRef] [PubMed]
- Burki, T.K. Coronavirus in China. Lancet 2020, 8, 238. [Google Scholar] [CrossRef] [PubMed]
- Rosa, K.; Lee, Y.; Luo, R.; Kirpitch, A.; Rothenberg, R.; Hyman, J.; Yan, P.; Chowell, G. Real time forcasts of the COVID-19 epidemic in China from 5th February to February 24th, 2020. Infect. Dis. Model 2020, 5, 256–263. [Google Scholar]
- World Health Organizarion—WHO. Pneumonia of Unknown Cause in China; World Health Organization: Geneva, Switzerland, 2020. [Google Scholar]
- COVID-19 Update by WHO, September, 2021. Available online: https://covid19.who.int/ (accessed on 23 April 2023).
- Coman, V.M.; Landt, O.; Kaiser, M.; Molenkamp, R.; Meijer, A.; Chu, D.; Bleicker, T.; Brünink, S.; Schneider, J.; Schmidt, M.L.; et al. Detection of 2019 novel coronavirus (2019-nCoV) by real-time RT-PCR. Eur. Surveill. 2020, 25, 2000045. [Google Scholar]
- Fang, Y.; Zhang, H.; Xie, J.; Lin, M.; Ying, L.; Pang, P.; Ji, W. Sensitivity of Chest CT for COVID-19: Comparison to RT-PCR. Radiology 2020, 296, E115–E117. [Google Scholar] [CrossRef] [PubMed]
- Das, A.K.; Ghosh, S.; Thunder, S.; Dutta, R.; Agarwal, S.; Chakrabarti, A. Automatic COVID-19 detection from X-ray images using ensemble learning with convolutional neural network. Pattern Anal. Appl. 2021, 24, 1111–1124. [Google Scholar] [CrossRef]
- Albahli, S.; Ayub, N.; Shiraz, M. Coronavirus disease (COVID-19) detection using X-ray images and enhanced DenseNet. Appl. Soft Comput. 2021, 110, 107645. [Google Scholar] [CrossRef]
- Apostolopoulos, I.D.; Mpesiana, T.A. COVID-19: Automatic detection from X-ray images utilizing transfer learning with convolutional neural networks. Phys. Eng. Sci. Med. 2020, 43, 635–640. [Google Scholar] [CrossRef]
- Polat, C.; Karaman, O.; Karaman, C.; Korkmaz, G.; Balcı, M.C.; Kelek, S.E. COVID-19 diagnosis from chest X-ray images using transfer learning: Enhanced performance by debiasing dataloader. J. X-ray Sci. Technol. 2021, 29, 19–36. [Google Scholar] [CrossRef]
- Webbe, R.M.; Sheng, J.; Dutta, S.; Chai, S.; Dravid, A.; Barutcu, S.; Wu, Y.; Cantrell, D.; Xiao, N.; Allen, B.; et al. DeepCOVID-XR: An Artificial Intelligence Algorithm to Detect COVID-19 on Chest Radiographs Trained and Tested on a Large, U.S. Clinical Data Set. Radiology 2021, 299, E167–E176. [Google Scholar] [CrossRef]
- Quan, H.; Xu, X.; Zheng, T.; Li, Z.; Zhao, M.; Cui, X. DenseCapsNet: Detection of COVID-19 from X-ray images using a capsule neural network. Comput. Biol. Med. 2021, 133, 104399. [Google Scholar] [CrossRef] [PubMed]
- Ayalew, A.M.; Salau, A.O.; Abeje, B.T.; Enyew, B. Detection and classification of COVID-19 disease from X-ray images using convolutional neural networks and histogram of oriented gradients. Biomed. Signal Process. Control 2022, 74, 103530. [Google Scholar] [CrossRef]
- Indumathi, N.; Shanmuga Eswari, M.; Salau, A.O.; Ramalakshmi, R.; Revathy, R. Prediction of COVID-19 outbreak with current substantiation using machine learning algorithms. In Intelligent Interactive Multimedia Systems for e-Healthcare Applications; Springer: Singapore, 2022; pp. 171–190. [Google Scholar]
- Podder, P.; Das, S.R.; Mondal, M.R.H.; Bharati, S.; Maliha, A.; Hasan, M.J.; Piltan, F. LDDNet: A Deep Learning Framework for the Diagnosis of Infectious Lung Diseases. Sensors 2023, 23, 480. [Google Scholar] [CrossRef]
- Gite, S.; Mishra, A.; Kotecha, K. Enhanced lung image segmentation using deep learning. Neural Comput. Appl. 2022, 1–15. [Google Scholar] [CrossRef]
- Huang, G.; Liu, Z.; van der Maaten, L.; Weinberger, K. Densely connected convolutional networks. In Proceedings of the IEEE Conference on Computer Vision and Pattern Recognition, Honolulu, HI, USA, 21–26 July 2017. [Google Scholar]
- Alzubaidi, L.; Zhang, J.; Humaidi, A.; Al-Dujaili, A.; Duan, Y.; Al-Shamma, O.; Santamaría, J.; Fadhel, M.; Al-Amidie, M.; Farhan, L. Review of deep learning: Concepts, CNN architectures, challenges, applications, future directions. J. Big Data 2021, 8, 1–74. [Google Scholar] [CrossRef] [PubMed]
- CS231n: Deep Learning for Computer Vision. Available online: https://cs231n.github.io/convolutional-networks/#conv (accessed on 22 September 2021).
- Si, L.; Xiong, X.; Wang, Z.; Tan, C. A deep convolutional neural network model for intelligent discrimination between coal and rocks in coal mining face. Math. Probl. Eng. 2020, 2020, 2616510. [Google Scholar] [CrossRef]
- Available online: https://drive.google.com/drive/folders/1NLjyns6qJcQE8zZ8OZ-xfNMatcLLnMJO (accessed on 10 April 2022).
- Wang, L.; Lin, Z.Q.; Wong, A. COVID-net: A tailored deep convolutional neural network design for detection of COVID-19 cases from chest X-ray images. Sci. Rep. 2020, 10, 19549. [Google Scholar] [CrossRef]
- Bharati, S.; Podder, P.; Mondal, M.; Prasath, V.B. CO-ResNet: Optimized ResNet model for COVID-19 diagnosis from X-ray images. Int. J. Hybrid Intell. Syst. 2021, 1–2, 71–85. [Google Scholar] [CrossRef]
- Bharati, S.; Podder, P.; Mondal, M.; Gandhi, N. Optimized NASNet for diagnosis of COVID-19 from lung CT images. In International Conference on Intelligent Systems Design and Applications; Springer: Cham, Switzerland, 2020; pp. 647–656. [Google Scholar]
- Akter, S.; Shamrat, F.M.; Chakraborty, S.; Karim, A.; Azam, S. COVID-19 detection using deep learning algorithm on chest X-ray images. Biology 2021, 10, 1174. [Google Scholar] [CrossRef]
- Mahmud, T.; Rahman, M.A.; Fattah, S.A. CovXNet: A multi-dilation convolutional neural network for automatic COVID-19 and other pneumonia detection from chest X-ray images with transferable multi-receptive feature optimization. Comput. Biol. Med. 2020, 122, 103869. [Google Scholar] [CrossRef]
- Umair, M.; Khan, M.S.; Ahmed, F.; Baothman, F.; Alqahtani, F.; Alian, M.; Ahmad, J. Detection of COVID-19 Using Transfer Learning and Grad-CAM Visualization on Indigenously Collected X-ray Dataset. Sensors 2021, 21, 5813. [Google Scholar] [CrossRef]
- Abbas, A.; Abdelsamea, M.M.; Gaber, M.M. Classification of COVID-19 in chest X-ray images using DeTraC deep convolutional neural network. Appl. Intell. 2021, 51, 854–864. [Google Scholar] [CrossRef] [PubMed]
- Khasawneh, N.; Fraiwan, M.; Fraiwan, L.; Khassawneh, B.; Ibnian, A. Detection of COVID-19 from Chest X-ray Images Using Deep Convolutional Neural Networks. Sensors 2021, 21, 5940. [Google Scholar] [CrossRef] [PubMed]
- Hussain, E.; Hasan, M.; Rahman, M.A.; Lee, I.; Tamanna, T.; Parvez, M.Z. CoroDet: A deep learning based classification for COVID-19 detection using chest X-ray images. Chaos Solitons Fractals 2021, 142, 110495. [Google Scholar] [CrossRef] [PubMed]
- Ozturk, T.; Talo, M.; Yildirim, E.A.; Baloglu, U.B.; Yildirim, O.; Acharya, U.R. Automated detection of COVID-19 cases using deep neural networks with X-ray images. Comput. Biol. Med. 2020, 121, 103792. [Google Scholar] [CrossRef] [PubMed]
- Khan, E.; Rehman, M.Z.U.; Ahmed, F.; Alfouzan, F.A.; Alzahrani, N.M.; Ahmad, J. Chest X-ray Classification for the Detection of COVID-19 Using Deep Learning Techniques. Sensors 2022, 22, 1211. [Google Scholar] [CrossRef]
- Kadhim, Y.A.; Khan, M.U.; Mishra, A. Deep Learning-Based Computer-Aided Diagnosis (CAD): Applications for Medical Image Datasets. Sensors 2022, 22, 8999. [Google Scholar] [CrossRef]
- Bonifazi, G.; Breve, B.; Cirillo, S.; Corradini, E.; Virgili, L. Investigating the COVID-19 vaccine discussions on Twitter through a multilayer network-based approach. Inf. Process. Manag. 2022, 59, 103095. [Google Scholar] [CrossRef]
- Amelio, A.; Bonifazi, G.; Cauteruccio, F.; Corradini, E.; Marchetti, M.; Ursino, D.; Virgili, L. Representation and compression of Residual Neural Networks through a multilayer network based approach. Expert Syst. Appl. 2023, 215, 119391. [Google Scholar] [CrossRef]
- Bharati, S.; Mondal, M.R.H.; Podder, P. A Review on Explainable Artificial Intelligence for Healthcare: Why, How, and When? IEEE Trans. Artif. Intell. 2023, 1–15. [Google Scholar] [CrossRef]
- Hasan, M.J.; Uddin, J.; Pinku, S.N. A novel modified SFTA approach for feature extraction. In Proceedings of the 2016 3rd International Conference on Electrical Engineering and Information Communication Technology (ICEEICT), Dhaka, Bangladesh, 22–24 September 2016; IEEE: Piscataway, NJ, USA; pp. 1–5. [Google Scholar]
Figure 1.
Sample images of the dataset.

Figure 2.
Proposed DenseNet-169 architecture.

Figure 3.
Proposed DenseNet-201 architecture.

Figure 4.
Training and testing analysis within 30 epochs: Training and testing accuracy survey of the proposed DenseNet 169.
Figure 4.
Training and testing analysis within 30 epochs: Training and testing accuracy survey of the proposed DenseNet 169.

Figure 5.
Training and testing analysis within 30 epochs: (a) Training and testing accuracy survey of the proposed DenseNet 201.
Figure 5.
Training and testing analysis within 30 epochs: (a) Training and testing accuracy survey of the proposed DenseNet 201.

Figure 6.
Confusion matrix of (a) DenseNet 169 and (b) DenseNet 201.

Figure 7.
ROC curve of (a) DenseNet 169 and (b) DenseNet 201.


Table 1.
Summary of related works.
| Ref | Methods | Images | Classes | Performance | Limitations |
|---|---|---|---|---|---|
| [8] | Ensemble learning with a convolutional network (Adaptation of DenseNet-201, ResNet50V2, and Inception50V3) | 1006 | 2 | Accuracy: 91.6% | Insufficient data. |
| [9] | DenseNet, InceptionV3 and Inception-ResNetV4 | 15,498 | 3 | Accuracy: 92% (DenseNet), 83.47% (InceptionV3), 85.57% (Inception-ResNetV4) | Compared three DL models only. |
| [10] | VGG-19, Inception, MobileNet-V2, Xception and Incdeption-ResNet-V2 | 1427 | 3 | Accuracy: 92.85% to 93.48% (Maximum found by VGG-19) | Insufficient amount of data. |
| [11] | nCov-NET | 1821 | 3 | Accuracy: 97% | There is insufficient data to discriminate between COVID pneumonia and bacterial (non-COVID) pneumonia. |
| [12] | DeepCOVID-XR | 5853 | 2 | Accuracy: 83% | Low accuracy. |
| [13] | DenseCapsNet | 750 | 2 | Accuracy: 90.7% | Insufficient data and unsatisfactory accuracy. |
| [14] | DCCNet | 2200 | 2 | Accuracy: 99.97% | Huge computational time, insufficient data. |
| [15] | Machine learning (ML) algorithms | - | 3 | Divided into COVID-19-impacted areas | Applied for a particular district. |
| [17] | U-Net++ lung segmentation | 138, 662 | 2 | Accuracy: 98% | Only tuberculosis (TB) diagnosis. |
| [25] | NASNet-Mobile and NASNet-Large | 3411 | 2 | Accuracy: 82.42%, 81.06% | Only CT images and low accuracy. |
Table 2.
Summary of our experimental dataset.
| Class | Training Images | Testing Images |
|---|---|---|
| Normal | 589 | 105 |
| Pneumonia | 587 | 107 |
| COVID-19 | 1639 | 285 |
| Total: 3 | 2815 | 497 |
Table 3.
Performance results for different optimizers.
| Optimizer Model | Accuracy | Recall | Loss | Precision | F1-Score |
|---|---|---|---|---|---|
| DenseNet-169 (SGD) | 84.70% | 81.35% | 36.12% | 81.25% | 81.01% |
| DenseNet-169 (Adam) | 88.45% | 86.02% | 29.73% | 86.60% | 85.89% |
| DenseNet-169 (Nadam) | 91.90% | 89.28% | 24.07% | 89.28% | 88.95% |
| DenseNet-201 (SGD) | 85.68% | 82.78% | 33.54% | 82.91% | 82.24% |
| DenseNet-201 (Adam) | 89.76% | 87.41% | 27.15% | 87.94% | 87.08% |
| DenseNet-201 (Nadam) | 92.30% | 89.62% | 22.45% | 90.95% | 90.23% |
Table 4.
Performance results for different learning rates with Nadam optimizer.
| Model | Learning Rate | Accuracy | Recall |
|---|---|---|---|
| DenseNet-169 | 0.003 | 91.90% | 89.28% |
| 0.007 | 88.20% | 88.20% | |
| 0.05 | 72.60% | 63.40% | |
| DenseNet-201 | 0.003 | 92.30% | 89.62% |
| 0.007 | 91.41% | 91.24% | |
| 0.05 | 74.26% | 65.03% |
Table 5.
Results of the proposed DenseNet-169 and DenseNet-201 models for multiple runs.
| Run | Model | Accuracy | Recall | Specificity | Precision | F1-Score |
|---|---|---|---|---|---|---|
| 1 | DenseNet-169 (Nadam) | 91.90% | 89.28% | 92.42% | 89.28% | 88.95% |
| 2 | 92.04% | 89.32% | 92.54% | 89.29% | 89.07% | |
| 3 | 91.97% | 89.35% | 92.49% | 89.35% | 89.02% | |
| 4 | 92.03% | 89.40% | 92.54% | 89.40% | 89.08% | |
| 1 | DenseNet-201 (Nadam) | 92.30% | 89.62% | 95.59% | 90.95% | 90.23% |
| 2 | 92.35% | 89.71% | 95.65% | 91.05% | 90.33% | |
| 3 | 92.35% | 89.67% | 95.64% | 91.00% | 90.33% | |
| 4 | 92.40% | 89.72% | 95.69% | 91.05% | 90.38% |
Table 6.
Performance evaluation of the proposed DenseNet 169.
| Class | Accuracy | Recall or Sensitivity | Specificity | Precision | F1 Score |
|---|---|---|---|---|---|
| Normal (Class:0) | 92.56% | 82% | 95.15% | 83% | 82% |
| Non-COVID-19 pneumonia (Class:1) | 95.37% | 90% | 90.20% | 89% | 89% |
| COVID-19 (Class:2) | 95.98% | 96% | 92.06% | 96% | 96% |
Table 7.
Performance evaluation of the proposed DenseNet 201.
| Class | Accuracy | Recall or Sensitivity | Specificity | Precision | F1 Score |
|---|---|---|---|---|---|
| Normal (Class:0) | 93.96% | 89% | 97.19% | 82% | 85% |
| Non-COVID-19 pneumonia (Class:1) | 94.57% | 81% | 92.13% | 97% | 89% |
| COVID-19 (Class:2) | 96.18% | 99% | 97.60% | 94% | 97% |
Table 8.
Performance comparison with popular baseline models.
| Model | Accuracy | Recall | Specificity | Precision | Loss |
|---|---|---|---|---|---|
| VGG-16 | 84.73% | 82.12% | 87.05% | 84.91% | 43.49% |
| AlexNet | 86.70% | 84.30% | 88.10% | 85.90% | 35.10% |
| ResNet | 88.00% | 86.50% | 89.30% | 87.20% | 46.80% |
| DenseNet-169 (Nadam) | 91.90% | 89.28% | 92.42% | 89.28% | 24.07% |
| DenseNet-201 (Nadam) | 92.30% | 89.62% | 95.59% | 90.95% | 22.45% |
Table 9.
Comparison of the proposed method with the state-of-the-art literature.
| Ref. | Models | Accuracy | Recall or Sensitivity | Specificity | Precision | F1-Score |
|---|---|---|---|---|---|---|
| [8] | Ensemble learning with a convolutional network (Adaptation of DenseNet-201, ResNet50V2, and Inception50V3) | 91.60% | 88.33% | - | - | 91.54% |
| [9] | DenseNet | 92% | 91% | 96% | - | - |
| [9] | InceptionV3 | 83.47% | - | - | - | - |
| [9] | Inception-ResNetV4 | 85.57% | - | - | - | - |
| [12] | DeepCOVID-XR | 83% | 92% | - | - | - |
| [13] | DenseCapsNet | 90.70% | 96% | - | - | 90.9% |
| [24] | CO-ResNet | 90.20% | ||||
| This Paper | DenseNet 169 with Nadam Optimizer | 91.95% | 89.33% | 92.47% | 89.33% | 89% |
| DenseNet 201 with Nadam Optimizer | 92.35% | 89.67% | 95.64% | 91% | 90.33% |
Disclaimer/Publisher’s Note: The statements, opinions and data contained in all publications are solely those of the individual author(s) and contributor(s) and not of MDPI and/or the editor(s). MDPI and/or the editor(s) disclaim responsibility for any injury to people or property resulting from any ideas, methods, instructions or products referred to in the content. |
© 2023 by the authors. Licensee MDPI, Basel, Switzerland. This article is an open access article distributed under the terms and conditions of the Creative Commons Attribution (CC BY) license (https://creativecommons.org/licenses/by/4.0/).
Share and Cite
MDPI and ACS Style
Podder, P.; Alam, F.B.; Mondal, M.R.H.; Hasan, M.J.; Rohan, A.; Bharati, S. Rethinking Densely Connected Convolutional Networks for Diagnosing Infectious Diseases. Computers 2023, 12, 95. https://doi.org/10.3390/computers12050095
AMA Style
Podder P, Alam FB, Mondal MRH, Hasan MJ, Rohan A, Bharati S. Rethinking Densely Connected Convolutional Networks for Diagnosing Infectious Diseases. Computers. 2023; 12(5):95. https://doi.org/10.3390/computers12050095
Chicago/Turabian StylePodder, Prajoy, Fatema Binte Alam, M. Rubaiyat Hossain Mondal, Md Junayed Hasan, Ali Rohan, and Subrato Bharati. 2023. "Rethinking Densely Connected Convolutional Networks for Diagnosing Infectious Diseases" Computers 12, no. 5: 95. https://doi.org/10.3390/computers12050095
Note that from the first issue of 2016, this journal uses article numbers instead of page numbers. See further details here.