
Analyzing Risk Premiums in the Brazilian Power Market: A Quantitative Study


Independent Researcher, 8000 Aarhus C, Denmark
Commodities 2023, 2(4), 382-397; https://doi.org/10.3390/commodities2040022
Submission received: 31 July 2023
/
Revised: 11 September 2023
/
Accepted: 14 September 2023
/
Published: 1 November 2023
(This article belongs to the Special Issue Uncertainty, Economic Risk and Commodities Markets)
Abstract
:This paper conducts an empirical analysis of risk premiums in the Brazilian electricity market, a critical but understudied field. Employing two distinct methodologies—Average Forward Prices and Last Observed Forward Prices—the study calculates risk premiums between spot and forward electricity prices. Our analysis consistently identifies negative risk premiums, which serve as indicators that the market may be underestimating certain types of risk. These underestimations are potentially influenced by inherent market uncertainties, including volatile demand, unpredictable supply, and frequent regulatory shifts. Additionally, we observe a high volatility in risk premiums, signifying a dynamic and ever-changing market where expectations are continuously recalibrated. Such conditions present possible arbitrage opportunities for market actors and underline the need for policymakers to introduce measures mitigating market unpredictability. By focusing on these nuances, this paper enriches the broader discourse on risk premiums in electricity markets and underscores the necessity for further research aimed at devising effective risk management strategies.
1. Introduction
The power market, a crucial component of any nation’s economy, is characterized by its complex dynamics and inherent uncertainties. These uncertainties, stemming from factors such as fluctuating demand, variable supply, and regulatory changes, give rise to what is known as risk premiums. Risk premiums represent the additional returns that investors require to compensate for the risk of an investment. Understanding the occurrence and magnitude of these risk premiums is vital for market participants, policymakers, and investors alike.
In recent years, the Brazilian power market has attracted significant attention due to its unique characteristics. As one of the largest power markets in the world, Brazil boasts a diverse energy mix, with a significant portion of its electricity being generated from renewable sources. However, the market is not without its challenges. It has been subject to regulatory changes, infrastructure constraints, and the impacts of climate change, all of which contribute to its risk profile.
Despite the importance of the Brazilian power market, there is a paucity of research examining the occurrence of risk premiums within it. This paper aims to fill this gap by conducting an empirical analysis of risk premiums in the Brazilian power market. Specifically, we seek to answer the following research questions:
- What factors contribute to the occurrence of risk premiums in the Brazilian power market?
- How have these risk premiums evolved over time?
- What are the implications of these risk premiums for market participants and policymakers?
In answering these questions, this paper hopes to provide valuable insights into the dynamics of the Brazilian power market and contribute to the broader understanding of risk premiums in power markets.
2. Literature Review
The literature on risk premiums in electricity markets is extensive and diverse, providing a rich tapestry of insights that range from foundational theories to innovative methodologies and market-specific analyses. Initially, it is essential to acknowledge the pioneering work of Huisman and Mahieu [1], which set the foundational stage by examining the influence of regime jumps on risk premiums, particularly in volatile markets like electricity. This early work paved the way for more theoretical exploration, notably by Benth and Koekebakker [2], who delivered a comprehensive guide to stochastic modeling in electricity markets with an emphasis on risk premium modeling.
Building on these theoretical foundations, some studies offer a regional perspective. For example, Botterud et al. [3] scrutinized the Nordic electricity market’s risk premiums, providing a valuable comparative analysis of the relationship between spot and futures prices. Complementing this, Weron [4] discussed how risk premiums are integrated into electricity price forecasts, offering a valuable context for the practical application of these models in different market setups.
Recent years have witnessed the introduction of innovative approaches for understanding the dynamics of risk premiums. Notably, Benth, and Ortiz-Latorre [5] developed a pricing measure for generating stochastic risk premiums, applicable even in arithmetic spot models. Janczura [6] furthered this innovation by offering analytic formulas for electricity derivatives based on a three-regime Markov regime-switching model. Benth et al. [7] took a more comprehensive look at electricity spot price dynamics, capturing market seasonality and extreme spikes while noting an overall negative risk premium in base load futures contracts.
Another significant area of focus has been the impact of supply and demand on risk premiums. Jacobs and Pirrong [8] tackled this issue by developing a model that accounts for economic risks not reflected in futures prices, revealing that both supply and demand significantly impact risk premiums. Wei and Lunde [9] offered further methodological advancements with their modified Fama–French regression framework, which is particularly useful for identifying time-varying risk premia in markets where electricity cannot be stored.
Market-specific studies add another layer of complexity. Researchers like Gontijo et al. [10] and Santos et al. [11] focused on the Brazilian electricity market, using methods ranging from classical statistical models to machine learning for assessing short-term electricity prices. Studies by Luz et al. [12] specifically examined the Brazilian forward electricity market, identifying contango behavior and high-risk premiums as key features.
Challenges in integrating renewables into electricity markets have also been a subject of discussion, as noted by Belançon [13]. The literature even offers insights into how risk premiums can be dynamic and conditional on several factors, including holding periods, changes in cost structures, and market maturity and liquidity [14,15,16,17,18].
3. The Brazilian Power Market
The Brazilian electricity market is the largest in Latin America, consuming approximately 611 TWh of power annually, as of 2022 [19]. It operates as an integrated hydrothermal system with a total installed capacity of around 182 GW, as of January 2023, predominantly fueled by hydropower, as shown in Figure 1. The power transmission system covers a vast geographical area, comparable to that of Europe, with long distances between power generation and demand. Many of the hydropower plants are arranged in a cascade.
The Brazilian power system is divided into four interconnected submarkets: Southeast (SE), South (S), Northeast (NE), and North (N), along with one isolated system (non-connected North), each having its own spot price. Most of the power demand, approximately 58%, is concentrated in the southern region, particularly the Southeast submarket, which includes major cities such as Sao Paulo and Rio de Janeiro.
There are two distinct contractual environments in the power market, as shown in Figure 2:
- The regulated market, known as ACR, involves captive consumers purchasing electricity directly from distribution companies.
- The free market, known as ACL, operates as a wholesale environment where consumers can buy energy directly from generators or traders.
Currently, around 40% of consumption takes place in the free market, and prices and auctions available in the regulated market are often used in combination with contracts in the free market.
To ensure a secure power supply, all energy consumption must be supported by power purchase agreements (PPAs) that provide a physical guarantee. The wholesale market, managed by the market operator CCEE, records all PPAs for accounting and settlement purposes [20]. The transmission network and physical dispatch are centrally operated by a system operator (ONS). While the financial revenues for power plants primarily depend on their PPAs and the underlying physical guarantees, the ONS manages the operation of all plants as if they belonged to the same owner.
The spot market in Brazil is of limited significance, primarily serving to balance contractual differences in generation or consumption levels. The settlement price, known as the PLD, closely resembles a spot market price. It is calculated based on forecasts rather than real market data. The NEWAVE and DECOMP computational models, used by the ONS, estimate the optimal dispatch of each power plant, and calculate the probable marginal operating costs (MOC). The PLD is influenced by these forecasts. The scheduling of hydropower plants is subject to stochastic inflows to reservoirs, and the models help in maintaining available water reserves at a secure level for the future.
Traders and market participants engage in short-term deals in the free market to minimize exposure to PLD volatility, reduce settlement risks with CCEE, and leverage market intelligence and weather modeling for a better performance than the realized PLD. The free market allows for negotiations of power prices between consumers and generators/trading companies, making it the primary market for traders without physical assets.
The ACL market caters to two types of consumers:
- Free consumers, with a minimum demand of 0.5 MW, can purchase electricity directly from generators and traders.
- Special consumers, with a minimum demand between 0.5 MW and 1 MW, are allowed to participate in the ACL exclusively if they purchase electricity from renewable energy sources, as part of efforts to promote renewables.
In the short-term free market, contract prices are based on the settlement price plus a premium determined by supply and demand. Prices in the ACL are mostly agreed upon bilaterally and are not publicly disclosed. Companies offering large consumers migration to the ACL advertise significant cost reductions depending on the concession area. ACL contracts typically run for up to 5 years, attracting generators seeking financing, as they offer longer tenors compared to the ACR.
In the ACL, two main types of energy are traded as follows:
- Conventional power, derived from large hydro and thermal technologies.
- Incentivized power, generated from renewable sources, injecting up to 50 MW of power into the grid. Generators and consumers purchasing power from small renewables may benefit from a transportation tariff discount, up to 100% in some cases, but generally 50%. Incentivized energy has a lower liquidity, and it is commonly traded as a SWAP for conventional energy.
In this work, we focus on conventional energy, which is more frequently traded than incentivized energy.
4. Market Data
The forward price data are sourced from Dcide [21], a company that has been conducting weekly surveys of market participants’ future power price expectations since 2011. This results in a consensus curve, which is a collective estimate that should reflect the influence of individual companies. Any observations that deviate significantly from the consensus are penalized. The contracts used in this study include month ahead (M + 1), two months ahead (M + 2), three months ahead (M + 3), a year ahead (A + 1), two years ahead (A + 2), three years ahead (A + 3), and four years ahead (A + 4), all with weekly observations. These contracts are available for both conventional and incentivized energy across all submarkets. In this work, we use the prices for conventional energy in the Southeast submarket as this is the most liquid product.
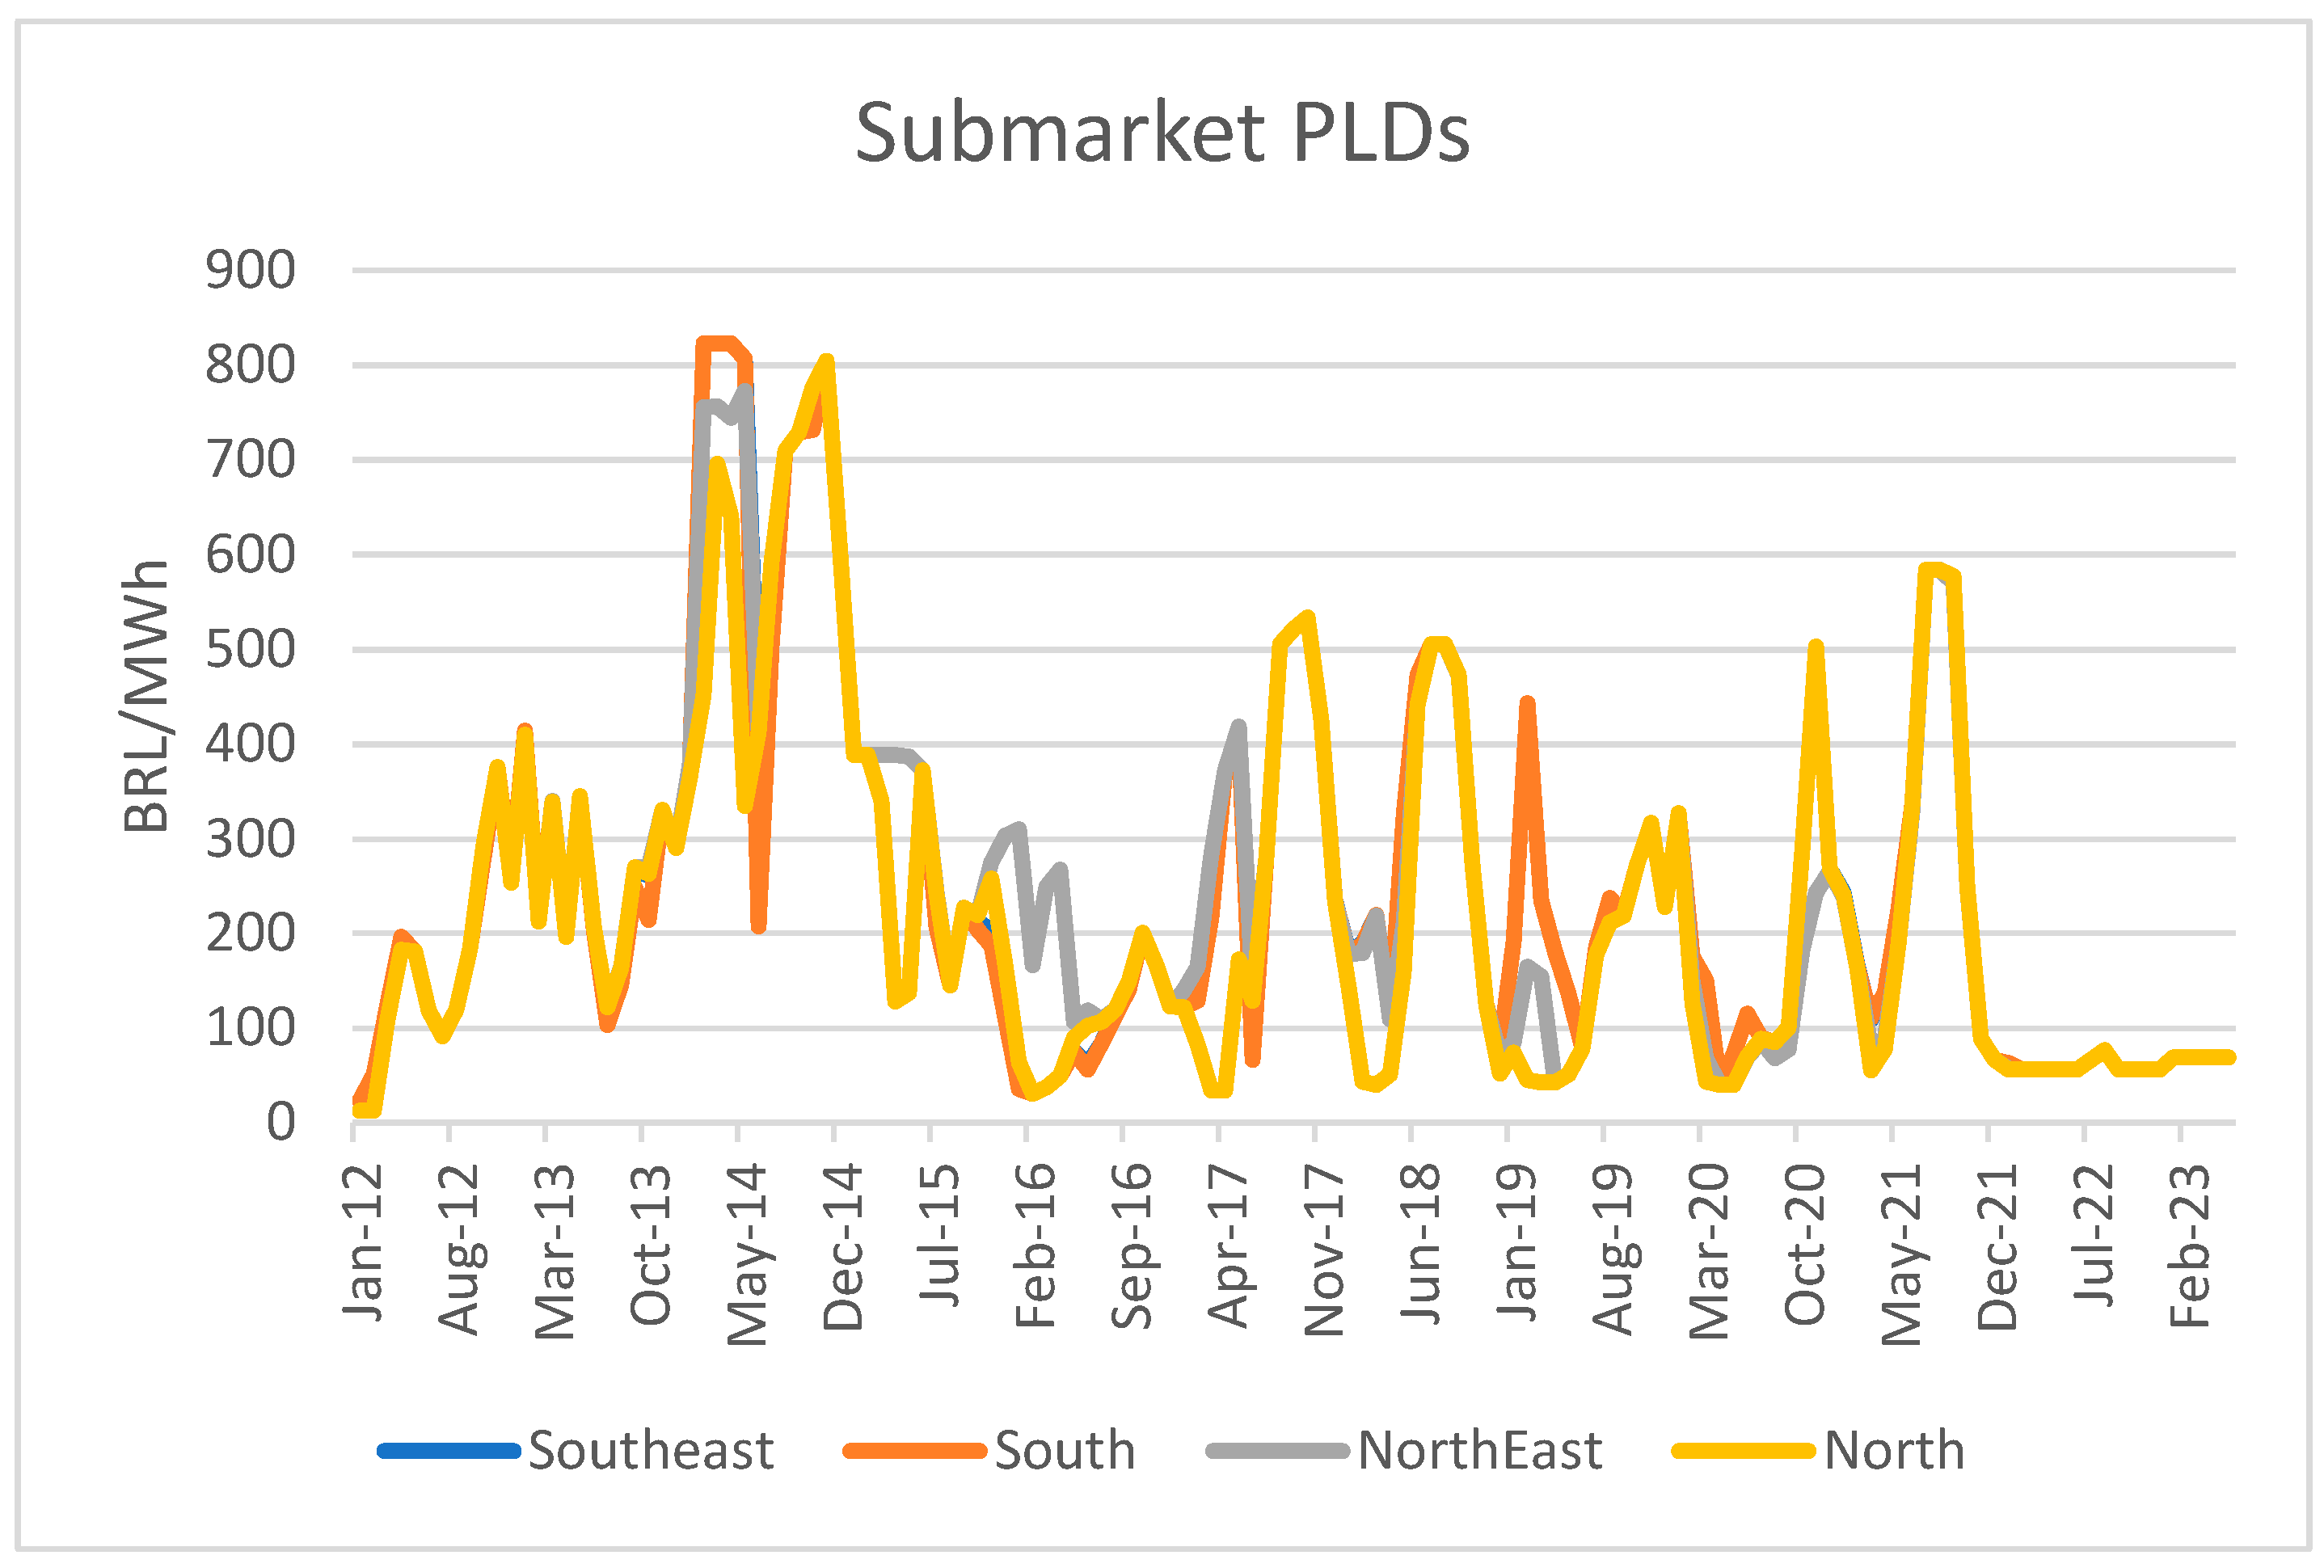
The PLD price data are sourced from the market operator CCEE [22]. The monthly PLD prices from 2012 to 2023 are shown in Figure 3. These prices can be highly volatile and are usually equal across all submarkets but can decouple when congestion occurs.
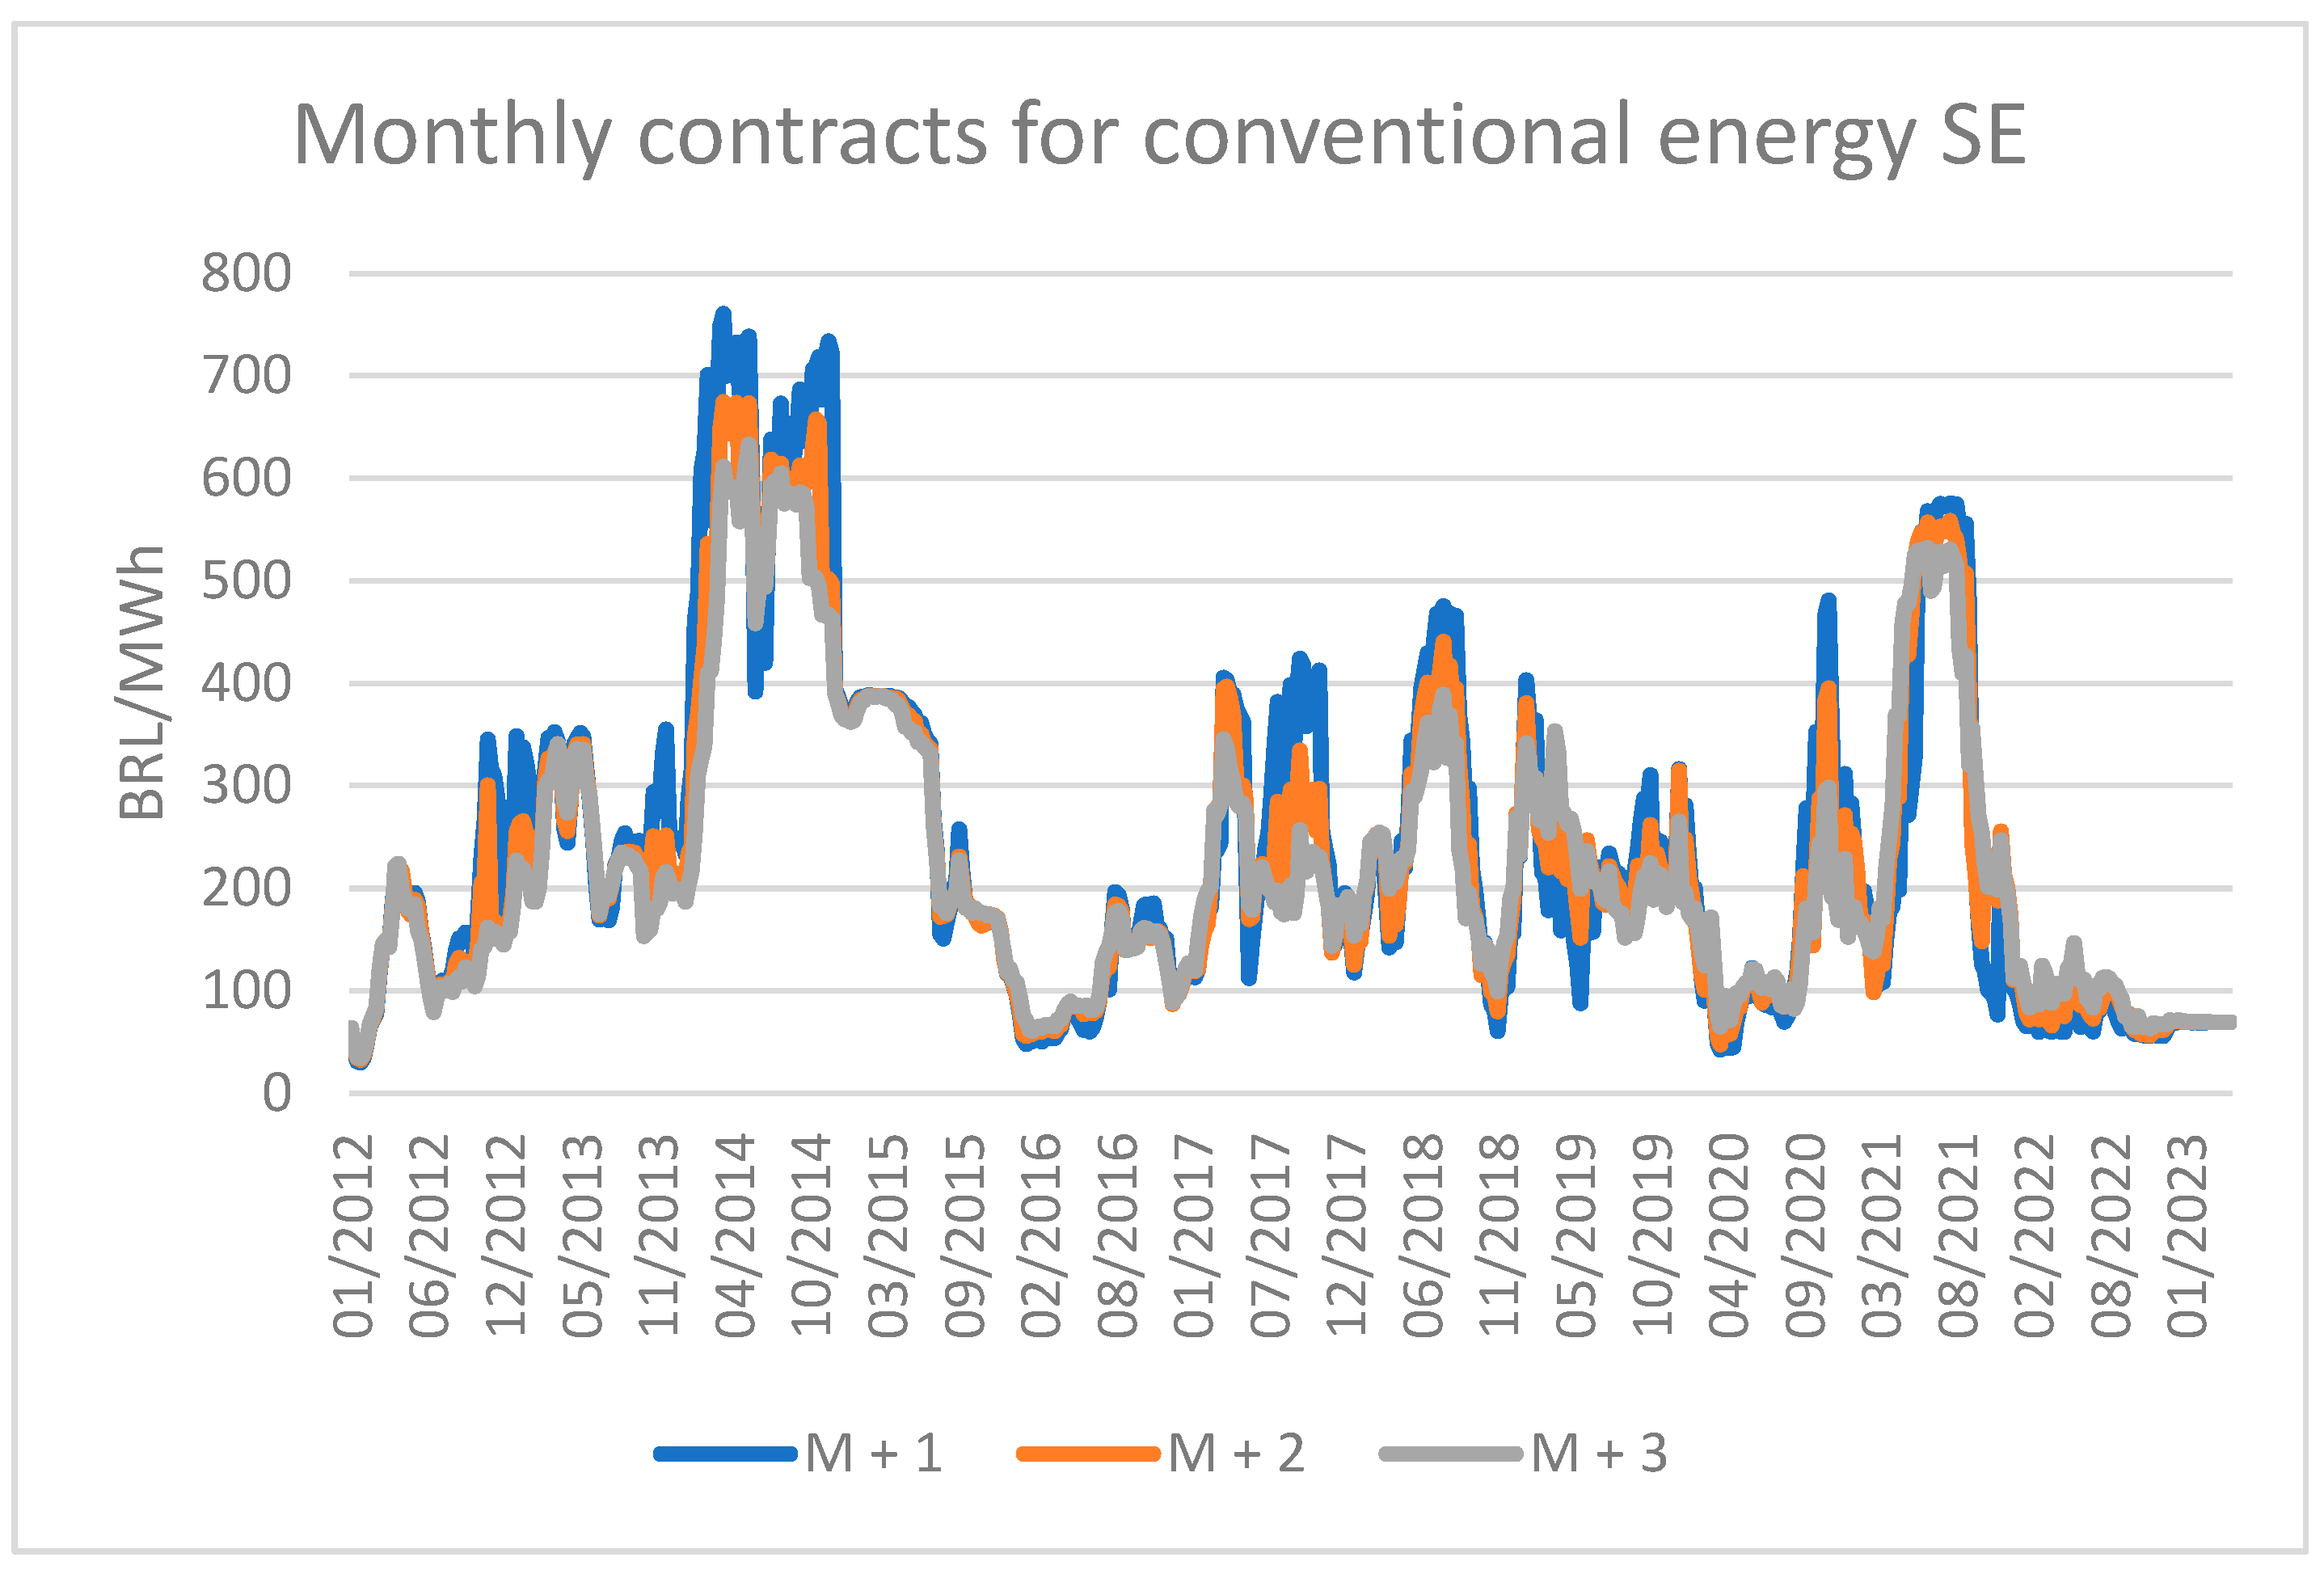
Figure 4 shows the prices for the monthly contracts for conventional energy in the Southeast submarket. These contract prices correlate strongly with the PLDs. Figure 5 shows the prices for the annual contracts in the Southeast submarket, which are less correlated with the PLDs.
As Figure 3, Figure 4 and Figure 5 show, prices have declined substantially since the beginning of 2022. Annual prices have declined to levels not observed previously. The driver has been excellent hydrology, such that reservoir levels are the highest observed in more than 10 years. Additionally, there has been a sharp growth in rooftop PV generation and the commissioning of onshore wind and utility solar.
An Augmented Dickey–Fuller (ADF) test was conducted to assess the stationarity of various time series datasets. The results indicate that the series labeled as ‘M + 1’, ‘M + 2’, ‘M + 3’, and ‘PLD’ are stationary. Conversely, the series designated as ‘A + 1’ through ‘A + 4’ were found to be non-stationary.
Figure 6 displays the weekly Pearson correlation between the monthly contract prices and PLDs for the Southeast submarket. As expected, the correlation between the monthly contracts and the PLDs is strong. The annual contracts were identified to be non-stationary and thus, the Pearson correlation is not applicable.
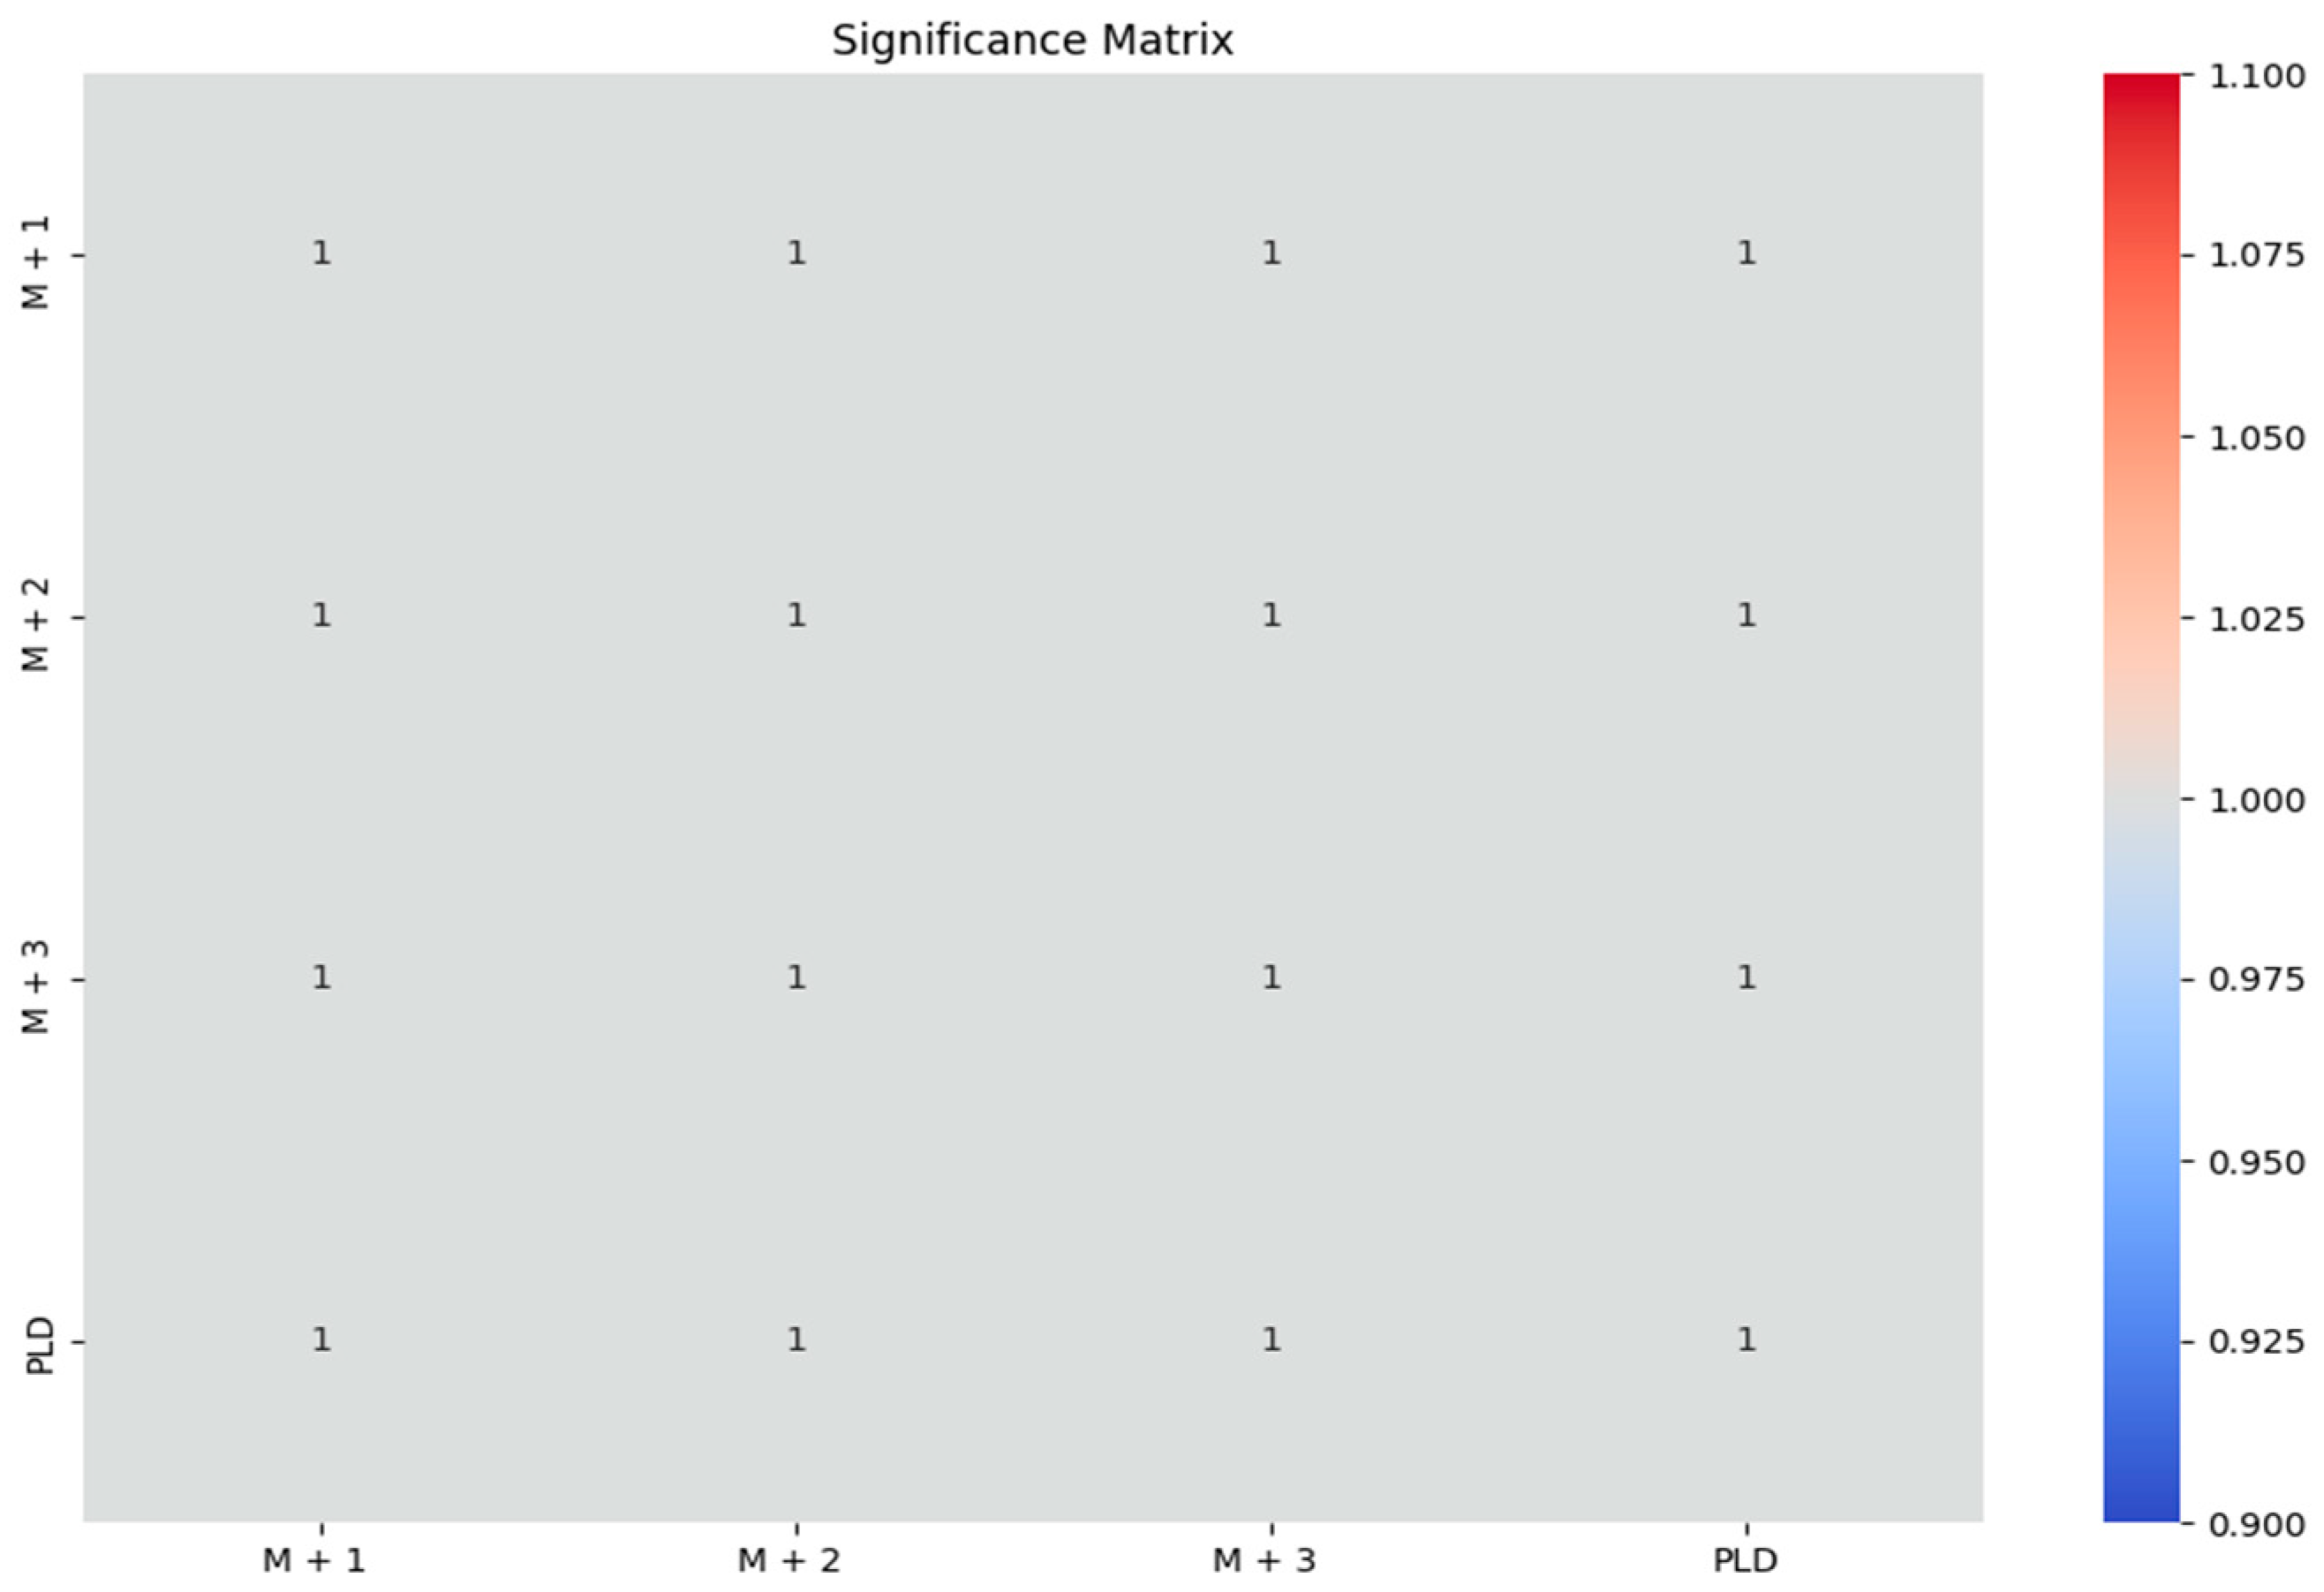
In addition to calculating the correlation between the various prices, we also calculated the p-values associated with each correlation coefficient (Figure 7) and a significance matrix which shows whether each correlation coefficient is statistically significant (p-value < 0.05) or not (Figure 8). The results indicate that all correlations are statistically significant.
5. Results
The analysis of electricity prices often employs two primary methodologies: the average forward prices and the last observed forward prices:
- Average forward prices: The rationale behind using average forward prices is rooted in the Efficient Market Hypothesis (EMH), which posits that all available information is already incorporated into asset prices. Averaging these prices over a period provides a stable and reliable estimate of market expectations, especially useful in volatile markets. This approach is particularly beneficial for capturing long-term market trends and is often used in risk management and investment decisions.
- Last observed forward prices: On the other hand, the use of the last observed forward prices aligns with the semi-strong form of market efficiency, which suggests that asset prices adjust quickly to new public information. This method is valuable for capturing short-term market sentiments and is crucial for real-time risk assessment and trading strategies.
Both methods serve complementary roles, and the ex-ante approach is frequently utilized in the literature [15,23,24,25,26]. While the average forward prices provide insights into long-term market behavior and are useful for hedging strategies, the last observed forward prices offer a snapshot of current market sentiments, useful for short-term trading and immediate operational decisions. Employing both methods for calculating the risk premium allows for a comprehensive understanding of market dynamics, serving the needs of various market participants, from long-term investors to policymakers.
5.1. Methodology
5.1.1. Objective
The objective of this analysis is to compare average forward prices, denoted as F, with average spot prices, denoted as PLD, during the delivery period in the Brazilian electricity market.
5.1.2. Data Collection
We utilize time series data for forward price DF and DPLD as follows:
5.1.3. Calculation of Average Forward Prices
Let T be a generic time step variable, where T = t for monthly contracts M and T = t′ for annual contracts A. Let K be a generic variable representing the contract index K = k for M + k and K = k′ for A + k′.
The average forward prices F for any contract type C (either M or A) and index K at time T are calculated as:
Here, represents the number of observations for contract C+K.
5.1.4. Calculation of Average Spot Prices
The average spot prices, PLD for any contract C+K, are then calculated as:
Here, represents the number of observations for the PLD C+K.
5.1.5. Risk Premium Calculation
The risk premium R for any contract C+K is then calculated as:
5.1.6. Using Last Observed Forward Price
In this approach, we use the last observed forward price before the delivery period for each contract type C (either M or A) and index K. We denote this as .
The risk premium using the last observed forward price is then calculated as:
5.2. Average Forward Prices and Risk Premiums
The Average Forward Prices approach offers a broad view of the market, smoothing out short-term fluctuations to reveal the overall trend. It calculates risk premiums using the average forward prices over a specific period before delivery.
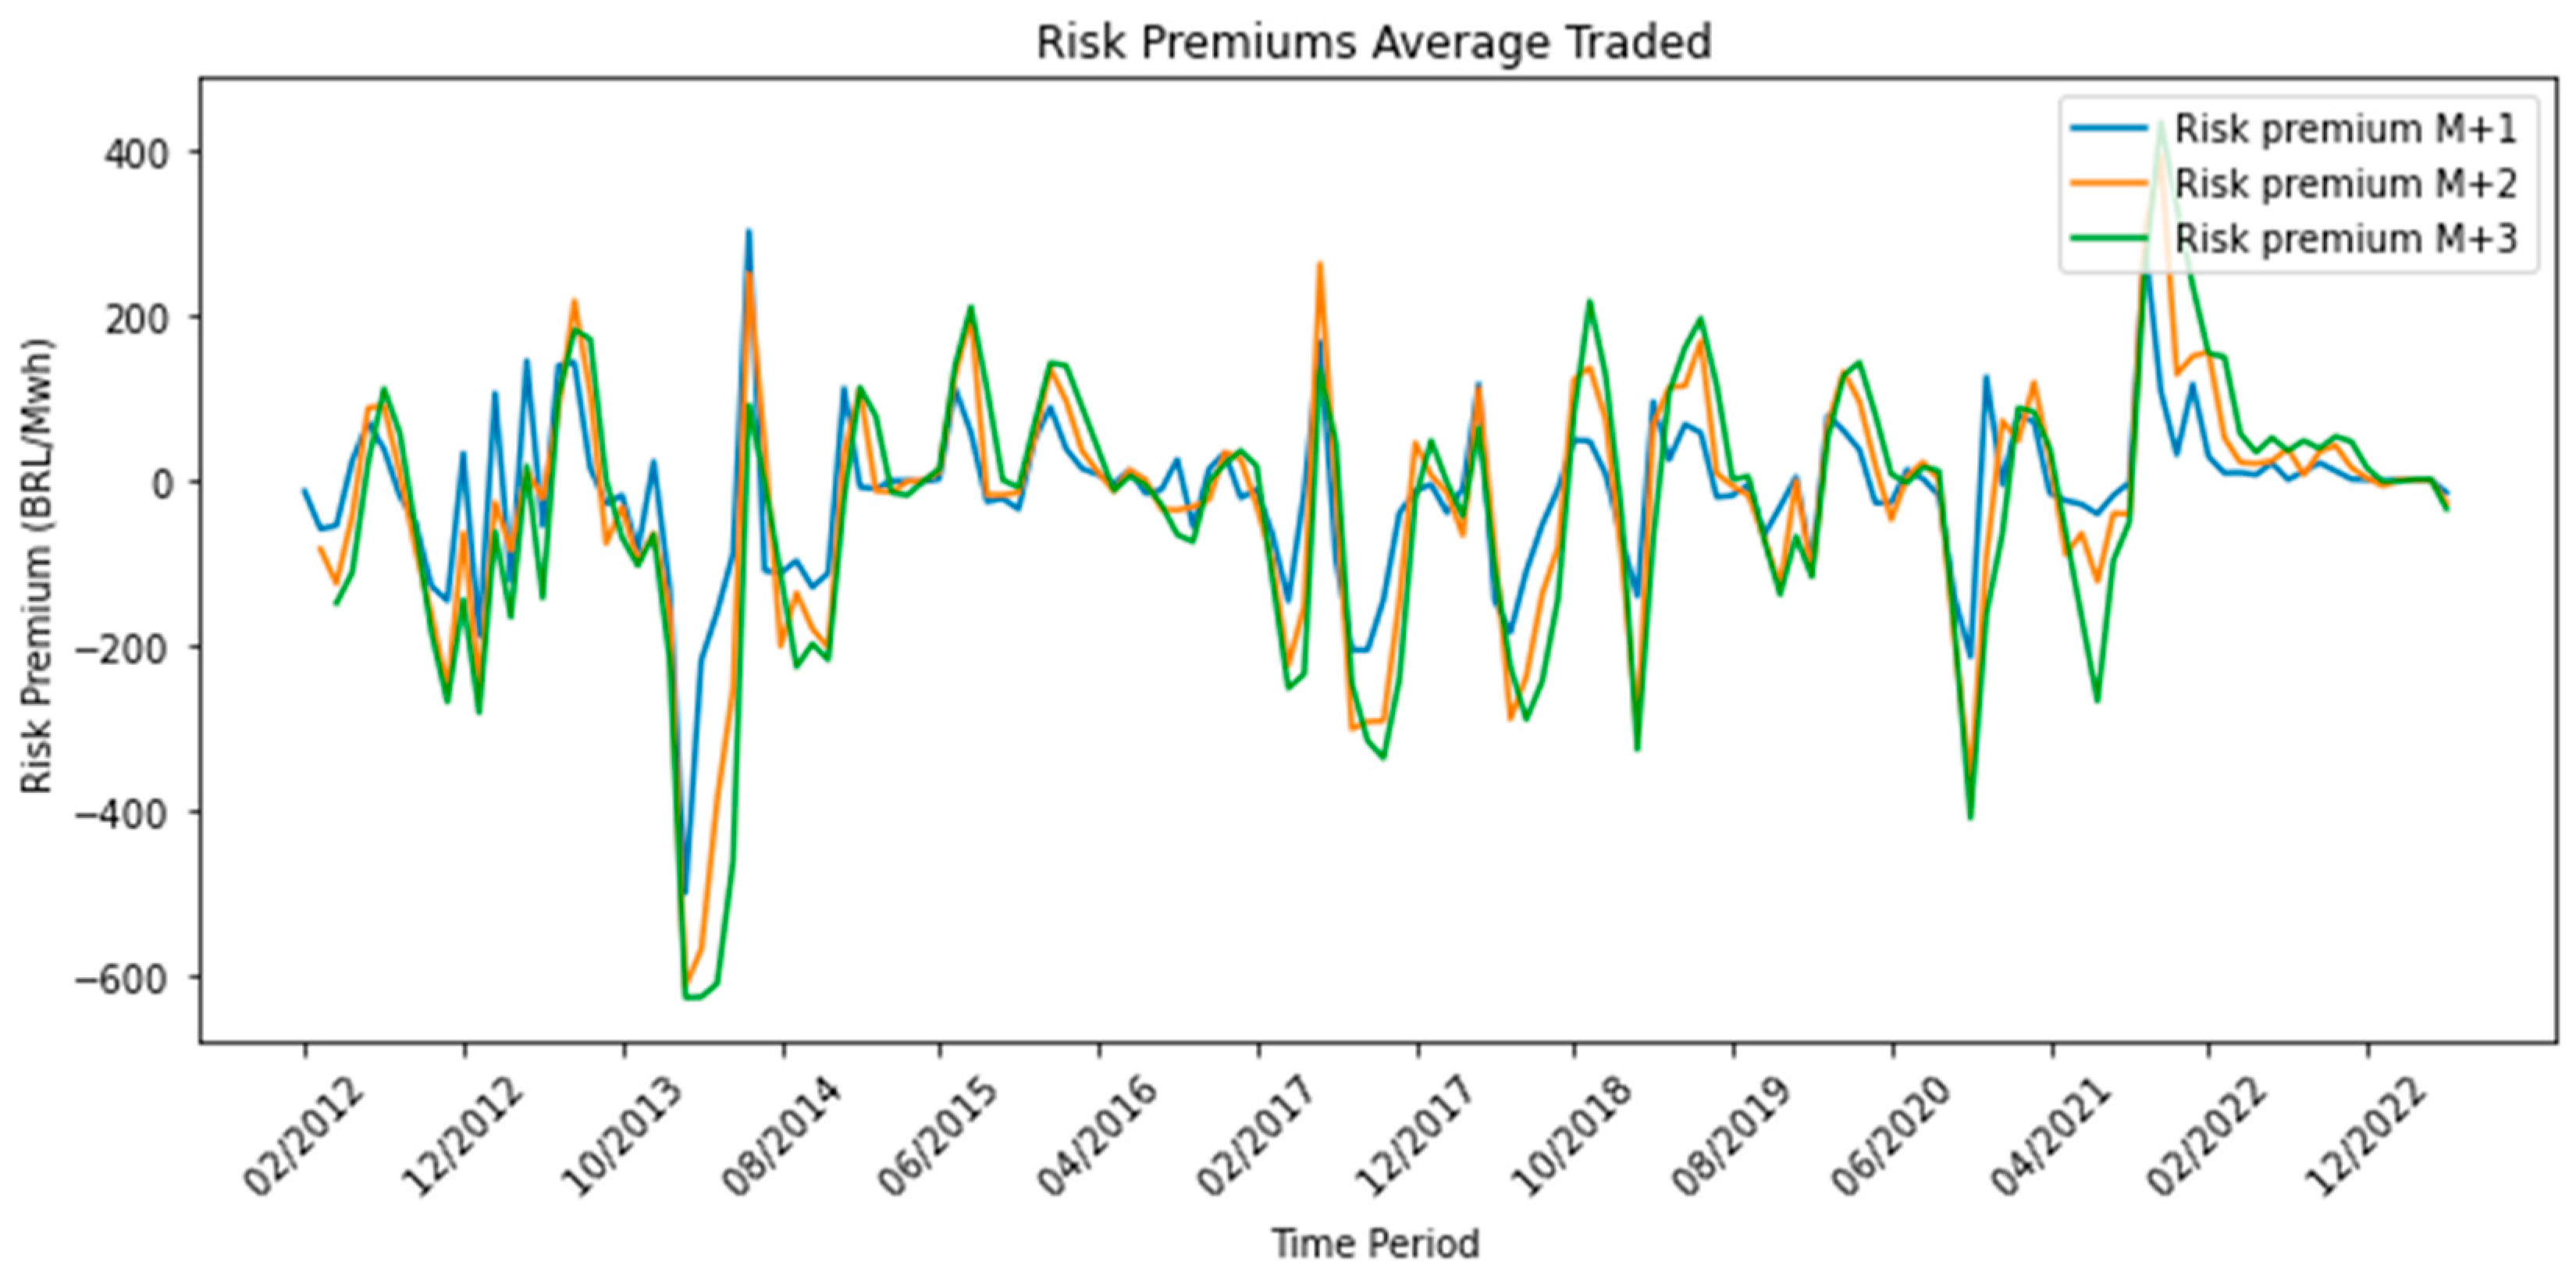
Our analysis revealed intriguing patterns. For monthly contracts of conventional energy in the Southeast submarket from January 2012 to April 2023, the Price of Liquidation of Differences (PLD) consistently exceeded the forward price for all contracts from M + 1 to M + 3 (Table 1). This resulted in negative risk premiums, indicating that the actual market risks were higher than what had been initially priced into the forward contracts. However, these risk premiums were highly volatile, ranging from −625 BRL/MWh to 822 BRL/MWh (Figure 9).
5.3. Last Observed Forward Prices and Risk Premiums
The Last Observed Forward Prices approach, on the other hand, provides a snapshot of the market sentiment just before the delivery date. It uses the last observed forward prices, incorporating the most recent information and market expectations.
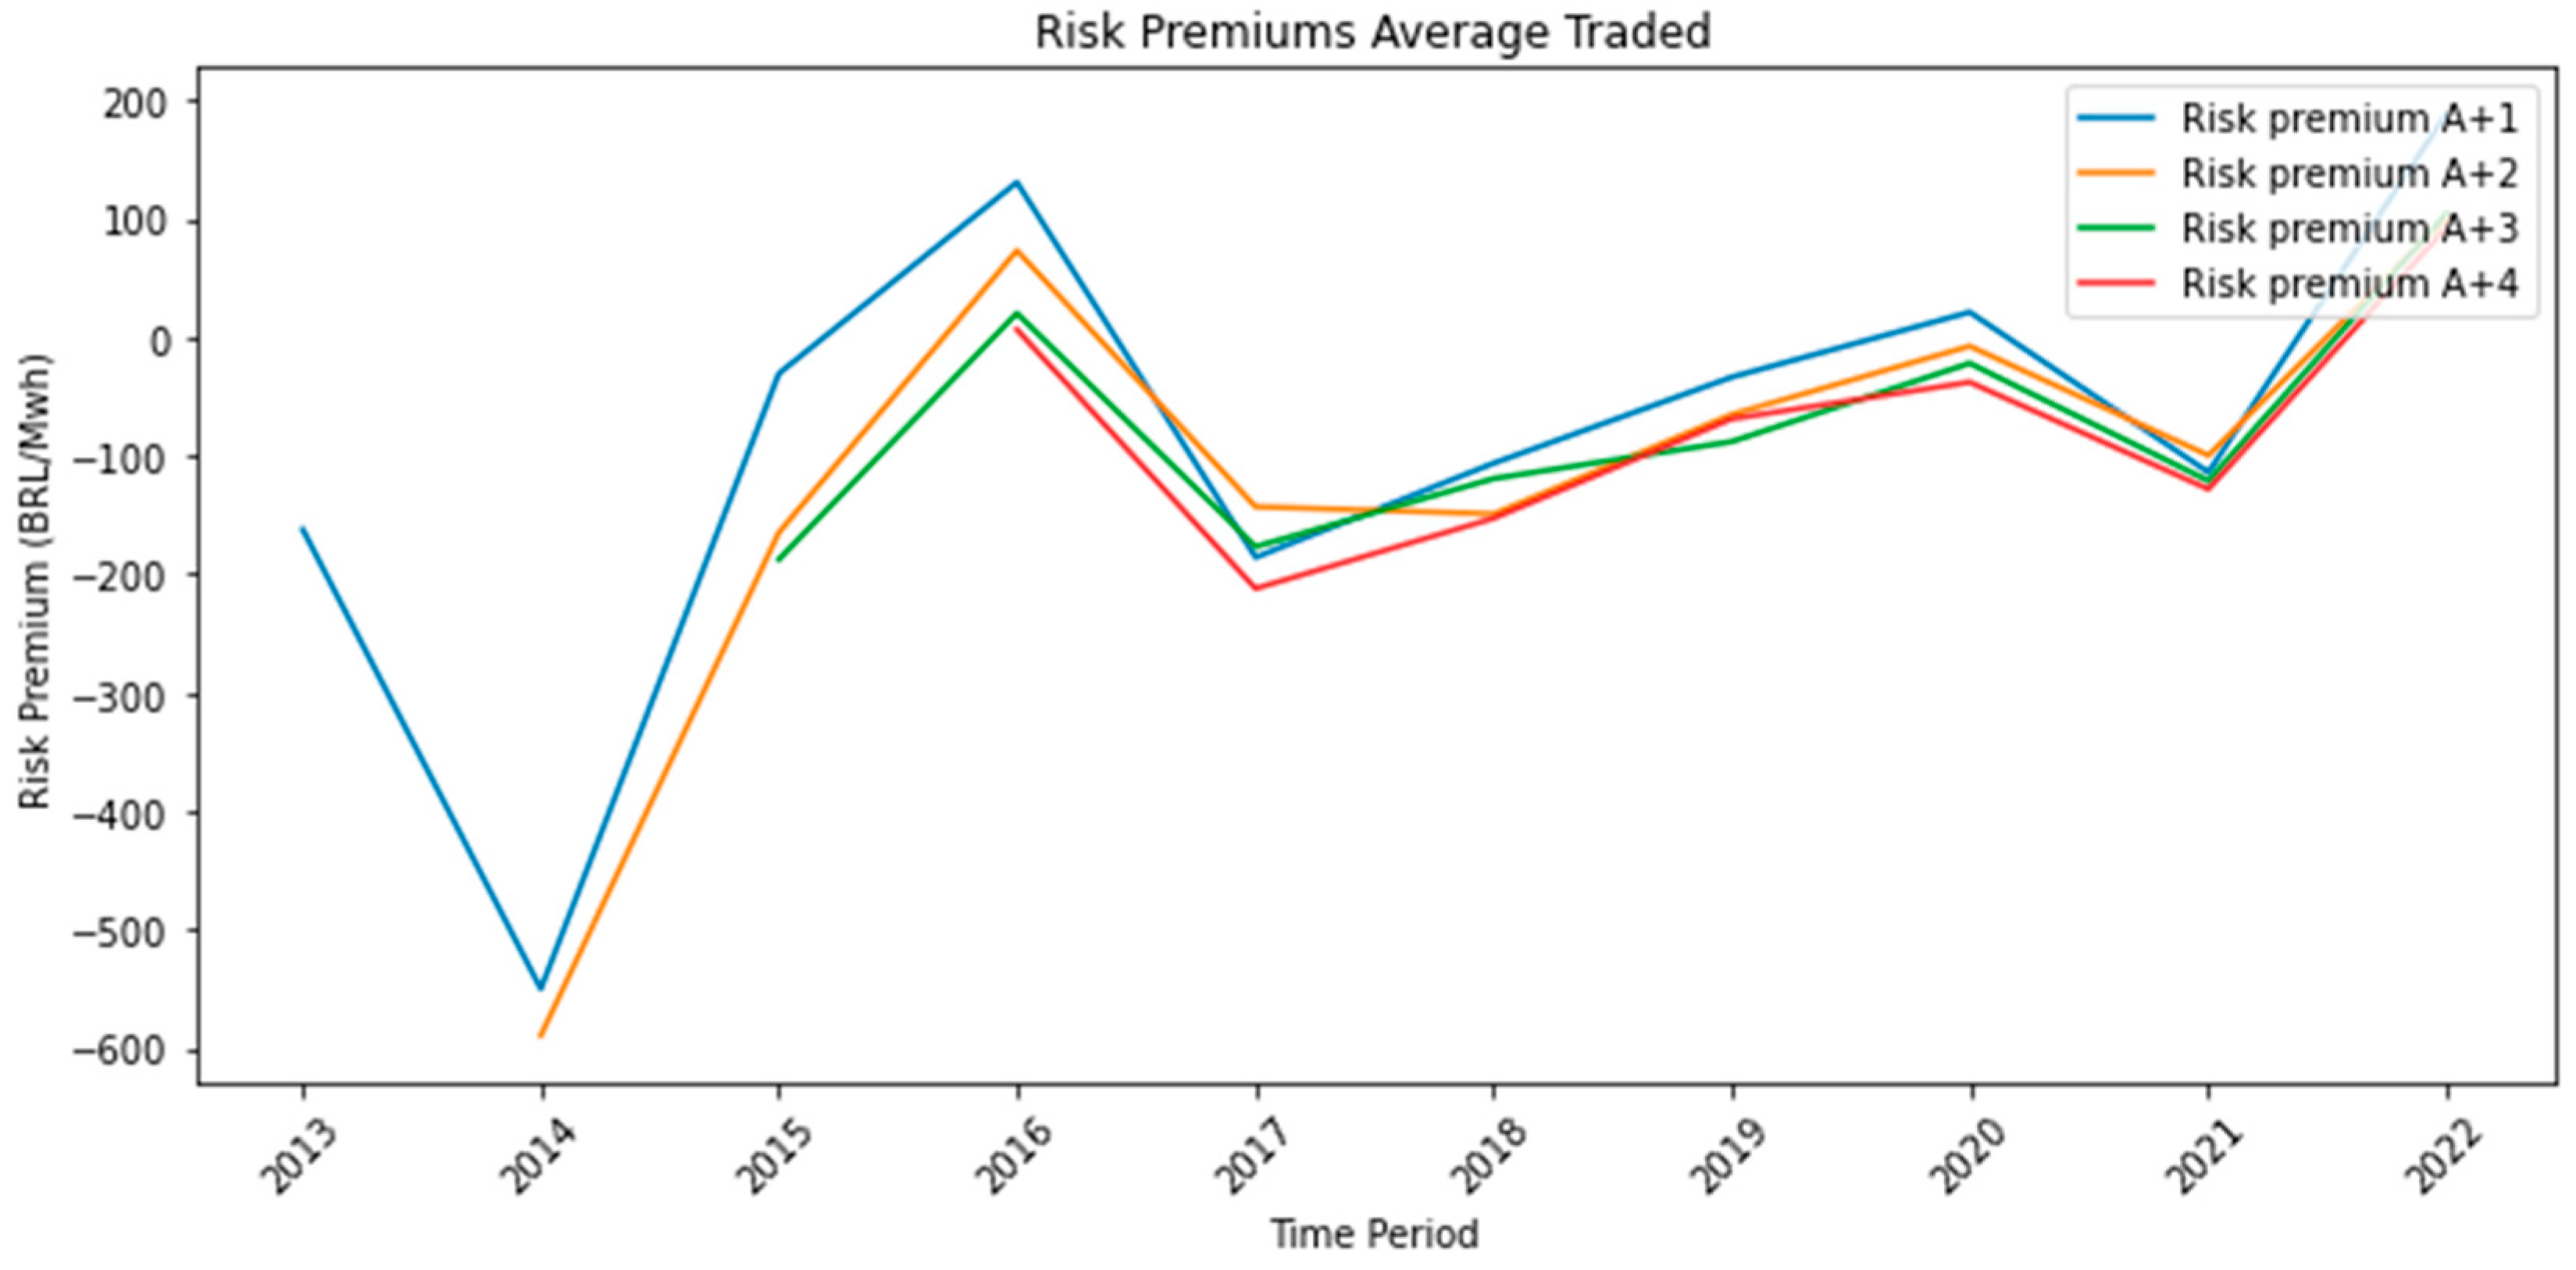
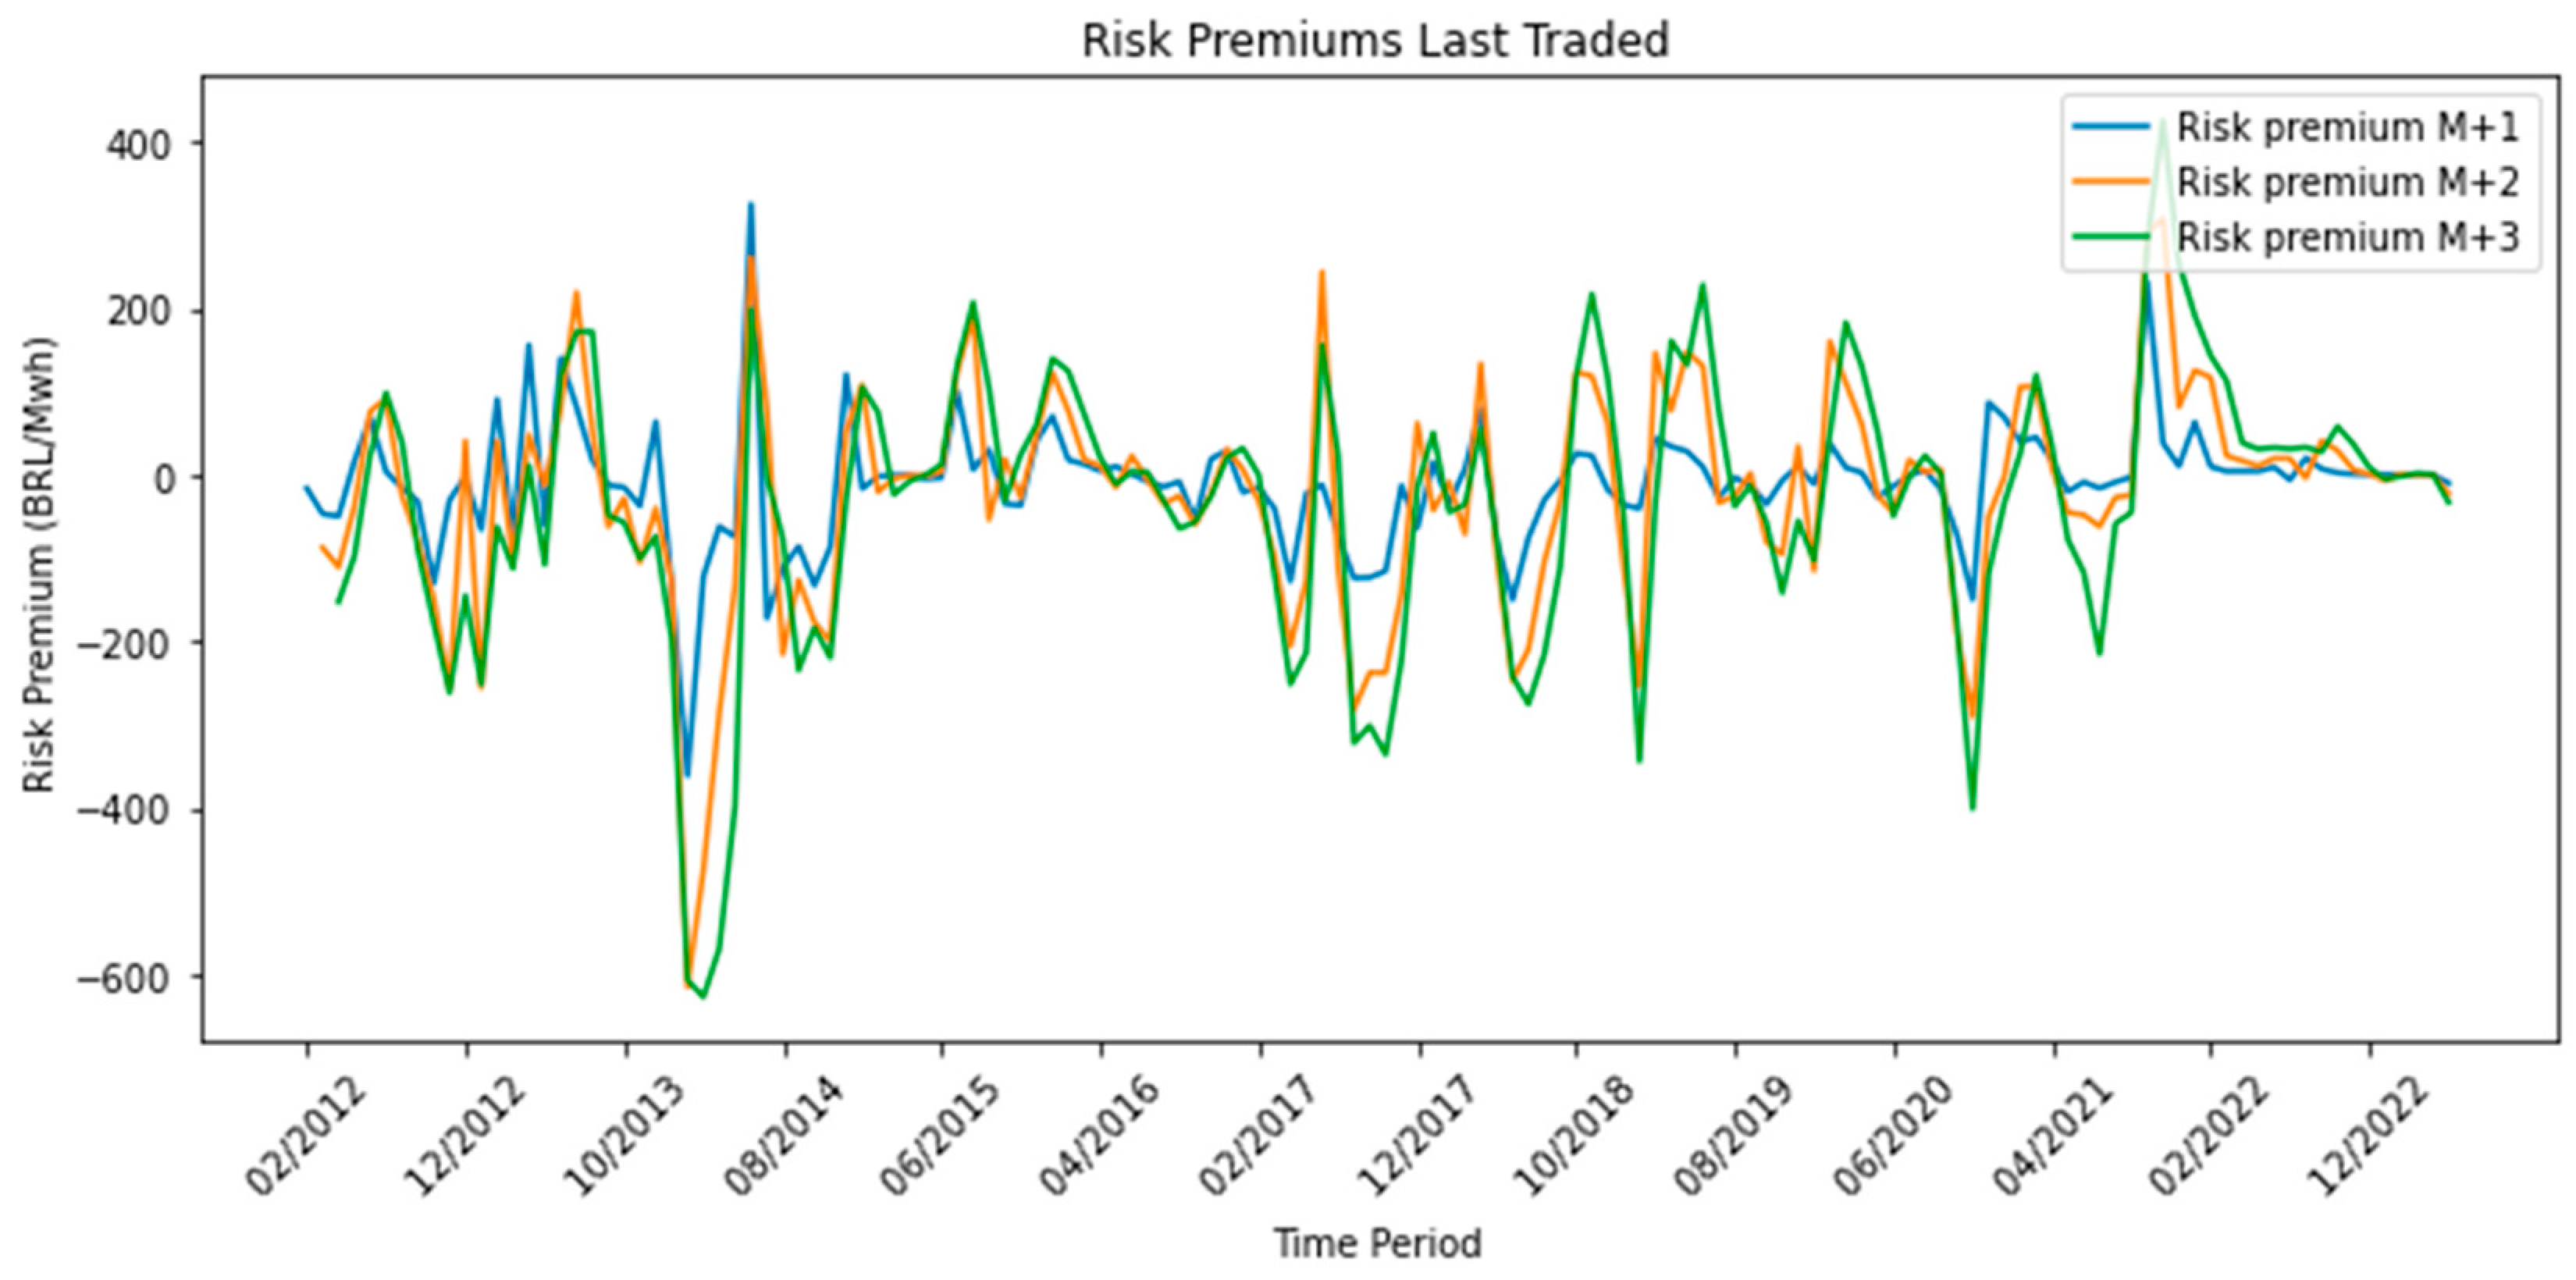
Our findings using this approach were consistent with those from the Average Forward Prices approach. For both monthly and annual contracts, the PLD generally exceeded the forward price, resulting in negative risk premiums (Table 3 and Table 4). However, the risk premiums were slightly lower for the Last Observed Forward Prices approach compared to the Average Forward Prices approach. This suggests that the market may be more efficient and adjusts quickly to new information. Despite this, the risk premiums remained highly volatile, with a similar range as that observed in the Average Forward Prices approach (Figure 11 and Figure 12).
5.4. Assessment of Forward Prices and Risk Premiums
In conclusion, our analysis reveals a consistent occurrence of negative risk premiums in the Brazilian power market, regardless of the approach used. This suggests that the market consistently underestimates the level of risk, leading to lower forward prices than what is realized in the spot market. However, the high volatility of these risk premiums indicates a high level of uncertainty and fluctuation in market expectations.
6. Discussion
Our analysis of risk premiums in the Brazilian power market yielded several key insights that address the research questions posed at the outset of this study.
6.1. Factors Contributing to Risk Premiums
Our findings indicate a consistent pattern of negative risk premiums in the Brazilian power market, defined in this study as the difference between the forward price and the spot price. This adds a layer of empirical evidence to similar observations made by Benth et al. [7]. However, it is crucial to note that our definition of risk premium may differ from that used in other studies, and thus direct comparisons should be made cautiously. Our approach aligns conceptually with theoretical frameworks previously established by scholars such as Benth and Koekebakker [2], although these works might employ different metrics to quantify risk premiums.
Our study extends existing research by suggesting that the negative risk premiums in the Brazilian power market can be situated within the theoretical framework proposed by Jacobs and Pirrong [8]. This framework highlights the significant role that supply, and demand dynamics play in shaping risk premiums. The unique characteristics of the Brazilian power market—including fluctuating demand, variable supply, and frequent regulatory changes—contribute new insights that build upon both global and theoretical contexts provided by the existing literature.
Additionally, we introduce a novel element to the discourse on risk premiums by focusing on the influence of hydroelectric power. This focus addresses a gap in the current literature, which has generally underemphasized the role of specific types of power generation in risk premium formulation.
Our Appendix A further supports these claims by demonstrating a strong correlation between year-ahead contracts’ (A + 1) risk premiums and fundamental data points such as reservoir levels, inflow levels, and demand patterns.
6.2. Evolution of Risk Premiums over Time
In line with findings by Weron [4] and Benth and Ortiz-Latorre [5], our study confirms a high volatility in risk premiums over time. This adds empirical weight to the theoretical models proposed by Janczura [6], indicating a dynamic market where expectations and risk perceptions are continuously updated. Such volatility has been previously observed in different markets, such as the Nordic power market studied by Botterud et al. [3], suggesting that this may be a universal phenomenon within power markets.
6.3. Implications for Market Participants and Policymakers
Our observations about the possibilities for market arbitrage are in accord with the work by Wei and Lunde [9], who offer methodological frameworks for identifying time-varying risk premiums. For policymakers, the findings are particularly salient. The need for more transparent markets and diversified energy sources has been underlined in prior research, notably by Belançon [13]. Our study reinforces these policy implications, emphasizing the necessity to improve market transparency, enhance regulatory stability, and diversify the energy mix to mitigate the impact of unreliable energy sources.
7. Conclusions
This paper undertook a comprehensive empirical analysis to understand the occurrence and dynamics of risk premiums in the Brazilian power market, a market that is both pivotal for the Brazilian economy and yet understudied in the academic literature. Through the utilization of Average Forward Prices and Last Observed Forward Prices, our findings reveal a recurring theme of negative risk premiums. This phenomenon suggests that the market consistently underestimates the level of risk involved, which is likely influenced by a range of factors such as fluctuating demand, variable supply, and the complexities introduced by frequent regulatory shifts.
This study also highlights the high volatility in risk premiums, signaling a market in constant flux, where participants are continually adjusting their expectations based on emerging data. This volatility itself is an important finding, as it suggests that even short-term forecasts may not be reliable indicators of market trends, thereby contributing additional layers of risk.
For market participants, our findings can serve as a guide for potential arbitrage opportunities, as the recurrent negative risk premiums indicate a possibility to profit from the gap between forward and spot prices. However, the high volatility in risk premiums suggests that these opportunities may be short-lived and could change swiftly with market conditions.
Policymakers should take note of this study’s implications for the need to stabilize market uncertainties. Potential policy levers could range from increasing transparency in market operations to creating a more robust regulatory framework that can adapt to rapid changes in market conditions. Diversifying the energy mix could also be a valuable strategy for mitigating the effects of reliance on unpredictable sources like hydroelectric power.
Despite the contributions of this research, it is important to acknowledge its limitations and the need for further studies to delve into the intricacies affecting risk premiums in the Brazilian power market. This could include a more granular analysis of the impact of specific market conditions, regulatory changes, or even global economic factors that may have localized impacts.
In summary, this paper not only contributes to our understanding of risk premiums in the Brazilian power market, but also opens up avenues for further research aimed at better comprehending and managing these premiums. This could lead to a more stable, transparent, and ultimately efficient energy market that benefits both participants and consumers.
Funding
This research received no external funding.
Institutional Review Board Statement
Not applicable.
Data Availability Statement
Conflicts of Interest
The author declares no conflict of interest.
Abbreviations
| A | Year |
| ACR | ‘Ambiente de Contratação Regulada’, which translates to the Regulated Contracting Environment |
| ACL | ‘Ambiente de Contratação Livre’, which translates to Free Contracting Environment |
| CCEE | ‘Câmara de Comercialização de Energia Elétrica’, or the Electric Energy Trading Chamber |
| GW | Gigawatt |
| M | month |
| MWh | Megawatthour |
| N | North |
| NE | Northeast |
| ONS | ‘Operador Nacional do Sistema Elétrico’, or the National Electric System Operator |
| PLD | ‘Preço de Liquidação das Diferenças’, or the Settlement Price for Differences |
| PPA | Power Purchase Agreement |
| S | South |
| SE | Southeast |
Appendix A
Figure A1, Figure A2 and Figure A3 show scatterplots of the annual risk premiums vs. lagged one-year reservoir level, inflow level, and demand levels for the Southeast submarket, respectively. The R-square is highest for the one-year lagged reservoir level at 0.85, followed by the inflow level with an R-square of 0.37 and finally the demand level with an R-square of 0.27.
Figure A1.
Scatterplot of A + 1 risk premiums vs. one-year lagged reservoir levels for the Southeast submarket from 2012 to 2022.
Figure A1.
Scatterplot of A + 1 risk premiums vs. one-year lagged reservoir levels for the Southeast submarket from 2012 to 2022.

Figure A2.
Scatterplot of A + 1 risk premiums vs. on inflow levels for the Southeast submarket from 2012 to 2022.
Figure A2.
Scatterplot of A + 1 risk premiums vs. on inflow levels for the Southeast submarket from 2012 to 2022.

Figure A3.
Scatterplot of A + 1 risk premiums vs. demand levels for the Southeast submarket from 2012 to 2022.
Figure A3.
Scatterplot of A + 1 risk premiums vs. demand levels for the Southeast submarket from 2012 to 2022.

References
- Huisman, R.; Mahieu, R. Regime jumps in electricity prices. Energy Econ. 2003, 25, 425–434. [Google Scholar] [CrossRef]
- Benth, F.E.; Koekebakker, S. Stochastic Modeling of Electricity and Related Markets; World Scientific: Singapore, 2008. [Google Scholar]
- Botterud, A.; Kristiansen, T.; Ilic, M.D. The relationship between spot and futures prices in the Nord Pool electricity market. Energy Econ. 2010, 32, 967–978. [Google Scholar] [CrossRef]
- Weron, R. Electricity price forecasting: A review of the state-of-the-art with a look into the future. Int. J. Forecast. 2014, 30, 1030–1081. [Google Scholar] [CrossRef]
- Benth, F.E.; Ortiz-Latorre, S. A pricing measure to explain the risk premium in power markets. arXiv 2013, arXiv:1308.3378. [Google Scholar] [CrossRef]
- Janczura, J. Pricing electricity derivatives within a Markov regime-switching model. arXiv 2012, arXiv:1203.5442. [Google Scholar]
- Benth, F.E.; Klüppelberg, C.; Müller, G.; Vos, L. Futures pricing in electricity markets based on stable CARMA spot models. arXiv 2012, arXiv:1201.1151. [Google Scholar] [CrossRef]
- Jacobs, K.; Li, Y.; Pirrong, C. Supply, Demand, and Risk Premiums in Electricity Markets. J. Bank. Financ. 2022, 135, 106390. [Google Scholar] [CrossRef]
- Wei, W.; Lunde, A. Identifying Risk Factors and Their Premia: A Study on Electricity Prices. J. Financ. Econom. 2022, nbac019. [Google Scholar] [CrossRef]
- Gontijo, T.S.; Costa, M.A.; Barbosa de Santis, R. Electricity price forecasting on electricity spot market: A case study based on the Brazilian Difference Settlement Price. In Proceedings of the International Conference on Renewable Energy (ICREN 2020), Rome, Italy, 25–27 November 2021; Volume 239. [Google Scholar]
- Santos, M.R.; Braz, D.D.C.; Carvalho, A.C.P.L.F.; Tinós, R.; Paula, M.B.S.; Doretto, G.; Guarnier, E.; Silva Filho, D.S.; Suiama, D.Y.; Ferreira, L.E.; et al. Machine Learning Approach for Trend Prediction to Improve Returns on Brazilian Energy Market. In Proceedings of the IEEE Latin American Conference on Computational Intelligence (LA-CCI), Montevideo, Uruguay, 23–25 November 2022. [Google Scholar]
- Luz, C.P.d.M.S.; Gomes, L.L.; Brandão, L.E.T. Analysis of the Dynamics of the Brazilian Forward Market of Electricity. Rev. Bus. Manag. 2012, 14, 314–334. [Google Scholar] [CrossRef]
- Belançon, M.P. Brazil electricity needs in 2030: Trends and challenges. arXiv 2020, arXiv:2009.11281. [Google Scholar] [CrossRef]
- Mork, E. The dynamics of risk premiums in Nord Pool’s futures market. Energy Stud. Rev. 2006, 14, 170–185. [Google Scholar] [CrossRef]
- Lucia, J.J.; Torró, H. On the risk premium in Nordic electricity futures prices. Int. Rev. Econ. Financ. 2011, 20, 750–763. [Google Scholar] [CrossRef]
- Haugom, E.; Hoff, G.A.; Mortensen, M.; Molnar, P.; Westgaard, S. The forward premium in Nord Pool power market. Emerg. Mark. Financ. Trade 2018, 54, 1793–1807. [Google Scholar] [CrossRef]
- Fleten, S.E.; Hagen, L.A.; Nygard, M.T.; Smith-Sivertsen, R.; Sollie, J.M. The overnight risk premium in electricity forward contracts. Energy Econ. 2015, 49, 293–300. [Google Scholar] [CrossRef]
- Smith-Meyer, E.; Gjolberg, O. The Nordic futures market for power: Finally mature and efficient? J. Energy Mark. 2016, 9, 1–15. [Google Scholar] [CrossRef]
- ONS. Available online: https://www.ons.org.br/ (accessed on 4 July 2023).
- Agora Energiwende. Report on the Brazilian Power System. Available online: https://www.agora-energiewende.de/fileadmin/Projekte/2019/Brazil_Country_Profile/155_CountryProf_Brazil_EN_WEB.pdf (accessed on 1 September 2019).
- Dcide. Available online: https://www.dcide.com.br/ (accessed on 4 July 2023).
- CCEE. Available online: https://www.ccee.org.br/web/guest/precos/painel-precos (accessed on 4 July 2023).
- Viehmann, J. Risk premiums in the German day-ahead Electricity Market. Energy Policy 2011, 39, 386–394. [Google Scholar] [CrossRef]
- Bunn, D.W.; Chen, D. The forward premium in electricity futures. J. Empir. Financ. 2013, 23, 173–186. [Google Scholar] [CrossRef]
- Magalhães, B.G.; Bento, P.M.R.; Pombo, J.A.N.; Calado Mariano, S.J.P.S. Spot price forecasting for best trading strategy decision support in the Iberian electricity market. Expert Syst. Appl. 2023, 224, 120059. [Google Scholar] [CrossRef]
- Bonaldo, C.; Caporin, M.; Fontini, F. The relationship between day-ahead and future prices in electricity markets: An empirical analysis on Italy, France, Germany, and Switzerland. Energy Econ. 2022, 110, 105977. [Google Scholar] [CrossRef]
Figure 1.
The Brazilian power system as of 2023 [19].
Figure 1.
The Brazilian power system as of 2023 [19].

Figure 2.
The regulated and the free markets [20].
Figure 2.
The regulated and the free markets [20].

Figure 3.
Monthly submarket PLDs from 2012 to 2023.

Figure 4.
Monthly contracts for Southeast conventional energy from 2012 to 2023.

Figure 5.
Annual contracts for Southeast conventional energy from 2012 to 2023.

Figure 6.
Weekly Pearson correlation between monthly contract prices and PLDs.

Figure 7.
P-value matrix for each correlation coefficient.

Figure 8.
Significance matrix showing whether each correlation is statistically significant.

Figure 9.
Monthly risk premiums for contracts from M + 1 to M + 3 for the Southeast submarket from 2012 to 2023.
Figure 9.
Monthly risk premiums for contracts from M + 1 to M + 3 for the Southeast submarket from 2012 to 2023.

Figure 10.
Annual risk premiums for contracts from A + 1 to A + 4 for the Southeast submarket from 2012 to 2022.
Figure 10.
Annual risk premiums for contracts from A + 1 to A + 4 for the Southeast submarket from 2012 to 2022.

Figure 11.
Monthly risk premiums for contracts from M + 1 to M + 3 for the Southeast submarket from 2012 to 2023.
Figure 11.
Monthly risk premiums for contracts from M + 1 to M + 3 for the Southeast submarket from 2012 to 2023.

Figure 12.
Annual risk premiums for contracts from A + 1 to A + 4 for the Southeast submarket from 2012 to 2022.
Figure 12.
Annual risk premiums for contracts from A + 1 to A + 4 for the Southeast submarket from 2012 to 2022.


Table 1.
Forward prices, PLDs, and Price Difference (Forward - PLD) for the monthly contracts for conventional energy in the Southeast submarket from January 2012 to April 2023.
Table 1.
Forward prices, PLDs, and Price Difference (Forward - PLD) for the monthly contracts for conventional energy in the Southeast submarket from January 2012 to April 2023.
| Delivery Period | Forward Price M + 1 | PLD | Price Difference (Forward − PLD M + 1) | Forward Price M + 2 | PLD | Price Difference (Forward − PLD M + 2) | Forward Price M + 3 | PLD | Price Difference (Forward − PLD M + 3) |
|---|---|---|---|---|---|---|---|---|---|
| 2012 | 151.64 | 179.68 | −28.05 | 129.79 | 192.9 | −62.80 | 119.13 | 200.10 | −80.97 |
| 2013 | 268.42 | 262.54 | 5.88 | 242.76 | 262.54 | −19.78 | 227.69 | 262.54 | −34.85 |
| 2014 | 586.44 | 690.00 | −103.56 | 492.54 | 690.00 | −197.46 | 421.67 | 690.00 | −268.33 |
| 2015 | 297.52 | 288.11 | 9.4 | 322.71 | 288.11 | 34.60 | 345.32 | 288.11 | 57.2 |
| 2016 | 105.29 | 93.91 | 11.38 | 108.44 | 93.91 | 14.52 | 113.68 | 93.91 | 19.76 |
| 2017 | 256.89 | 323.04 | −66.15 | 222.26 | 323.04 | −100.78 | 195.22 | 323.04 | −127.81 |
| 2018 | 259.64 | 287.83 | −28.19 | 249.76 | 287.83 | −38.07 | 244.88 | 287.83 | −42.95 |
| 2019 | 218.43 | 227.10 | −8.67 | 215.17 | 227.10 | −11.93 | 216.14 | 227.10 | −10.96 |
| 2020 | 159.01 | 177.00 | −17.99 | 137.66 | 177.00 | −39.33 | 140.52 | 177.00 | −36.47 |
| 2021 | 315.65 | 279.61 | 36.05 | 339.98 | 279.61 | 60.37 | 323.00 | 279.61 | 43.39 |
| 2022 | 78.57 | 58.99 | 19.59 | 105.55 | 58.99 | 46.56 | 135.15 | 58.99 | 76.16 |
| 2023 | 68.72 | 69.04 | −0.32 | 67.51 | 69.04 | −1.53 | 68.78 | 69.04 | −0.26 |
| mean | 230.52 | 244.74 | −14.22 | 219.51 | 245.81 | −26.30 | 212.60 | 246.44 | −33.84 |
| min | 37.27 | 30.42 | −498.68 | 41.88 | 30.42 | −611.19 | 43.89 | 30.42 | −625.08 |
| max | 717.88 | 822.83 | 301.18 | 662.41 | 822.83 | 390.40 | 596.40 | 822.83 | 432.95 |
Table 2.
Forward prices, PLDs, and Price Difference (Forward—PLD) for the annual contracts for conventional energy in the Southeast submarket from January 2012 to April 2023.
Table 2.
Forward prices, PLDs, and Price Difference (Forward—PLD) for the annual contracts for conventional energy in the Southeast submarket from January 2012 to April 2023.
| Delivery Period | Forward Price A + 1 (BRL/MWh) | PLD (BRL/MWh) | Price Difference (Forward − PLD A + 1) (BRL/MWh) | Forward Price A + 2 (BRL/MWh) | PLD (BRL/MWh) | Price Difference (Forward − PLD A + 2) (BRL/MWh) | Forward Price A + 3 (BRL/MWh) | PLD (BRL/MWh) | Price Difference (Forward − PLD A + 3) (BRL/MWh) | Forward Price A + 4 (BRL/MWh) | PLD (BRL/MWh) | Price Difference (Forward − PLD A + 4) (BRL/MWh) |
|---|---|---|---|---|---|---|---|---|---|---|---|---|
| 2013 | 100.39 | 262.54 | −162.15 | |||||||||
| 2014 | 140.08 | 690.00 | −549.92 | 100.77 | 690.00 | −589.23 | ||||||
| 2015 | 257.52 | 288.11 | −30.59 | 123.35 | 288.11 | −164.77 | 100.56 | 288.11 | −187.55 | |||
| 2016 | 224.69 | 93.91 | 130.77 | 167.21 | 93.91 | 73.30 | 114.27 | 93.91 | 20.36 | 100.41 | 93.91 | 6.50 |
| 2017 | 137.26 | 323.04 | −185.77 | 179.98 | 323.04 | −143.06 | 146.32 | 323.04 | −176.72 | 110.99 | 323.04 | −212.04 |
| 2018 | 181.53 | 287.83 | −106.30 | 138.81 | 287.83 | −149.02 | 168.54 | 287.83 | −119.29 | 135.02 | 287.83 | −152.81 |
| 2019 | 193.47 | 227.10 | −33.63 | 161.97 | 227.10 | −65.13 | 139.01 | 227.10 | −88.09 | 158.18 | 227.10 | −68.92 |
| 2020 | 198.18 | 177.00 | 21.19 | 169.50 | 177.00 | −7.50 | 155.05 | 177.00 | −21.95 | 139.08 | 177.00 | −37.92 |
| 2021 | 165.68 | 279.61 | −113.93 | 179.94 | 279.61 | −99.67 | 158.51 | 279.61 | −121.10 | 151.44 | 279.61 | −128.16 |
| 2022 | 247.66 | 58.99 | 188.68 | 159.68 | 58.99 | 100.69 | 163.68 | 58.99 | 104.70 | 151.48 | 58.99 | 92.50 |
| mean | 184.65 | 268.81 | −84.17 | 153.47 | 269.51 | −116.04 | 143.24 | 216.95 | −73.70 | 135.23 | 206.78 | −71.55 |
| min | 100.39 | 58.99 | −549.92 | 100.77 | 58.99 | −589.23 | 100.56 | 58.99 | −187.55 | 100.41 | 58.99 | −212.04 |
| max | 257.52 | 690.00 | 188.68 | 179.98 | 690.00 | 100.69 | 168.54 | 323.04 | 104.70 | 158.18 | 323.04 | 92.50 |
Table 3.
Forward prices, PLDs, and Price Difference (Forward—PLD) for the monthly contracts for conventional energy in the Southeast submarket from January 2012 to April 2023.
Table 3.
Forward prices, PLDs, and Price Difference (Forward—PLD) for the monthly contracts for conventional energy in the Southeast submarket from January 2012 to April 2023.
| Delivery Period | Forward Price M + 1 | PLD | Price Difference (Forward − PLD M + 1) | Forward Price M + 2 | PLD | Price Difference (Forward − PLD M + 2) | Forward Price M + 3 | PLD | Price Difference (Forward − PLD M + 3) |
|---|---|---|---|---|---|---|---|---|---|
| 2012 | 158.28 | 179.68 | −21.42 | 138.82 | 192.29 | −53.77 | 115.28 | 200.10 | −84.82 |
| 2013 | 286.04 | 262.54 | 23.50 | 248.59 | 262.54 | −13.94 | 233.88 | 262.54 | −28.66 |
| 2014 | 615.27 | 690.00 | −74.73 | 526.51 | 690.00 | −163.49 | 444.55 | 690.00 | −245.45 |
| 2015 | 294.55 | 288.11 | 6.43 | 320.21 | 288.11 | 32.10 | 342.92 | 288.11 | 54.81 |
| 2016 | 100.40 | 93.91 | 6.48 | 103.76 | 93.91 | 9.85 | 110.28 | 93.91 | 16.37 |
| 2017 | 260.42 | 323.04 | −62.62 | 226.39 | 323.04 | −96.65 | 192.17 | 323.04 | −130.87 |
| 2018 | 267.37 | 287.83 | −20.46 | 256.39 | 287.83 | −31.44 | 250.59 | 287.83 | −37.24 |
| 2019 | 224.00 | 227.10 | −3.10 | 221.81 | 227.10 | −5.29 | 216.02 | 227.10 | −11.08 |
| 2020 | 164.42 | 177.00 | −12.58 | 147.44 | 177.00 | −29.56 | 142.62 | 177.00 | −34.38 |
| 2021 | 312.33 | 279.61 | 32.72 | 337.11 | 279.61 | 57.51 | 328.79 | 279.61 | 49.18 |
| 2022 | 68.86 | 58.99 | 9.88 | 92.66 | 58.99 | 33.68 | 120.93 | 58.99 | 61.94 |
| 2023 | 69.13 | 69.04 | 0.09 | 67.63 | 69.04 | −1.41 | 67.82 | 69.04 | −1.22 |
| mean | 235.09 | 244.74 | −9.65 | 223.94 | 245.81 | −21.87 | 213.82 | 246.44 | −32.62 |
| min | 34.53 | 30.42 | −361.85 | 37.46 | 30.42 | −615.63 | 39.65 | 30.42 | −627.55 |
| max | 760.70 | 822.83 | 325.43 | 674.47 | 822.83 | 307.77 | 632.93 | 822.83 | 426.01 |
Table 4.
Forward prices, PLDs, and Price Difference (Forward—PLD) for the annual contracts for conventional energy in the Southeast submarket from January 2012 to April 2023.
Table 4.
Forward prices, PLDs, and Price Difference (Forward—PLD) for the annual contracts for conventional energy in the Southeast submarket from January 2012 to April 2023.
| Delivery Period | Forward Price A + 1 (BRL/MWh) | PLD (BRL/MWh) | Price Difference (Forward − PLD A + 1) (BRL/MWh) | Forward Price A + 2 (BRL/MWh) | PLD (BRL/MWh) | Price Difference (Forward − PLD A + 2) (BRL/MWh) | Forward Price A + 3 (BRL/MWh) | PLD (BRL/MWh) | Price Difference (Forward − PLD A + 3) (BRL/MWh) | Forward Price A + 4 (BRL/MWh) | PLD (BRL/MWh) | Price Difference (Forward − PLD A + 4) (BRL/MWh) |
|---|---|---|---|---|---|---|---|---|---|---|---|---|
| 2013 | 122.88 | 262.54 | −139.66 | |||||||||
| 2014 | 138.60 | 690.00 | −551.40 | 114.77 | 690.00 | −575.23 | ||||||
| 2015 | 351.48 | 288.11 | 63.37 | 121.73 | 288.11 | −166.38 | 111.86 | 288.11 | −176.25 | |||
| 2016 | 142.23 | 93.91 | 48.32 | 236.46 | 93.91 | 142.55 | 115.33 | 93.91 | 21.42 | 110.86 | 93.91 | 16.95 |
| 2017 | 143.74 | 323.04 | −179.30 | 144.26 | 323.04 | −178.78 | 180.87 | 323.04 | −142.17 | 113.18 | 323.04 | −209.86 |
| 2018 | 174.01 | 287.83 | −113.82 | 142.04 | 287.83 | −145.79 | 142.89 | 287.83 | −144.94 | 164.70 | 287.83 | −123.13 |
| 2019 | 173.55 | 227.10 | −53.55 | 160.25 | 227.10 | −66.85 | 141.32 | 227.10 | −85.78 | 140.06 | 227.10 | −87.04 |
| 2020 | 188.88 | 177.00 | 11.88 | 164.96 | 177.00 | −12.04 | 152.08 | 177.00 | −24.92 | 141.11 | 177.00 | −35.89 |
| 2021 | 184.03 | 279.61 | −95.58 | 171.08 | 279.61 | −108.53 | 155.56 | 279.61 | −124.05 | 149.07 | 279.61 | −130.54 |
| 2022 | 216.26 | 58.99 | 157.28 | 160.24 | 58.99 | 101.26 | 158.36 | 58.99 | 99.38 | 149.50 | 58.99 | 90.52 |
| mean | 183.57 | 268.81 | −85.25 | 157.31 | 269.51 | −112.20 | 144.78 | 216.95 | −72.16 | 138.35 | 206.78 | −68.43 |
| min | 122.88 | 58.99 | −551.40 | 114.77 | 58.99 | −575.23 | 111.86 | 58.99 | −176.25 | 110.86 | 58.99 | −209.86 |
| max | 351.48 | 690.00 | 157.28 | 236.46 | 690.00 | 142.55 | 180.87 | 323.04 | 99.38 | 164.70 | 323.04 | 90.52 |
Disclaimer/Publisher’s Note: The statements, opinions and data contained in all publications are solely those of the individual author(s) and contributor(s) and not of MDPI and/or the editor(s). MDPI and/or the editor(s) disclaim responsibility for any injury to people or property resulting from any ideas, methods, instructions or products referred to in the content. |
© 2023 by the author. Licensee MDPI, Basel, Switzerland. This article is an open access article distributed under the terms and conditions of the Creative Commons Attribution (CC BY) license (https://creativecommons.org/licenses/by/4.0/).
Share and Cite
MDPI and ACS Style
Kristiansen, T. Analyzing Risk Premiums in the Brazilian Power Market: A Quantitative Study. Commodities 2023, 2, 382-397. https://doi.org/10.3390/commodities2040022
AMA Style
Kristiansen T. Analyzing Risk Premiums in the Brazilian Power Market: A Quantitative Study. Commodities. 2023; 2(4):382-397. https://doi.org/10.3390/commodities2040022
Chicago/Turabian StyleKristiansen, Tarjei. 2023. "Analyzing Risk Premiums in the Brazilian Power Market: A Quantitative Study" Commodities 2, no. 4: 382-397. https://doi.org/10.3390/commodities2040022