Article

Finding the Additives Incorporation Moment in Hybrid Natural Pigments Synthesis to Improve Bioresin Properties

by
Bàrbara Micó-Vicent
1,2,*,
Jorge Jordán
2,
Esther Perales
1,
Francisco Miguel Martínez-Verdú
1 and
Francisco Cases
3
1
Colour and Vision Group, University of Alicante, Ctra. San Vicente del Raspeig s/n, 03690 San Vicente del Raspeig (Alicante), Spain
2
Departamento de Estadística e Investigación Operativa Aplicadas y Calidad, Universitat Politècnica de València, Campus d’Alcoi. Pl. Ferràndiz y Carbonell s/n, 03801 Alcoy (Alicante), Spain
3
Departamento de Ingeniería Textil y Papelera, Universitat Politècnica de València, Campus d’Alcoi. Pl. Ferràndiz y Carbonell s/n, 03801 Alcoy (Alicante), Spain
*
Author to whom correspondence should be addressed.
Coatings 2019, 9(1), 34; https://doi.org/10.3390/coatings9010034
Submission received: 23 November 2018 / Revised: 20 December 2018 / Accepted: 24 December 2018 / Published: 9 January 2019
(This article belongs to the Special Issue Binders, Pigments, Dyes and Additives)

Abstract

:
Interest in applications of natural dye applications has increased because of their antibacterial properties and the possibility of extracting them from nature and residues. Using nanoclays as hosts to reinforce natural dye properties has been successfully demonstrated. However, no one has attempted to optimize the polymer matrix and hybrid pigment properties at the same time to ensure the best final properties for bio-composite applications. Using a statistical design for experiments, we propose the best combination of modifiers with the best nanoclay as the host of three natural dyes: chlorophyll, β-carotene, and betanine. Using the L9 Taguchi designs, we learned both the influence of the nanoclay structure, and the addition moment of surfactant, mordant salt, and silane modifiers. FTIR, XRD, DTG, integration sphere spectrophotometer, and UV-aging tests were used to characterize the hybrid pigments and epoxy bioresin composites. The degradation temperatures of the three natural dyes rose and the reinforcement of the stability of three natural dyes to UV–Vis radiation exposure was demonstrated, which avoided the migration of these dyes from bioresin to wet ribbing. Optimal results were obtained with hydrotalcite clay (calcined or not) by using surfactant and mordant before the natural dye, and before or after silane.

1. Introduction

Colorants derived from nature are thought to be safe given their non-toxic, non-carcinogenic, and biodegradable nature. Natural dyes and pigments have often been used as polymer additives for their functional properties, antioxidant, and antimicrobial effects, or their deodorant properties. They should be considered environment-friendly synthetic dye/pigment substitutes. However, natural dye production and industrial applications have several drawbacks such as their low color range, the difficulty of achieving good color reproduction between different natural dye samples, and, most of all, their poor colorfastness. Carotenoids, anthocyanin, betanin, and chlorophylls are most widely used for food, cosmetics, or packaging.
Mordant salts were used in the textile industry to improve colorfastness and textile properties with natural dyes. Recently, biomordants have been employed to improve the properties of natural dyes utilized as polymer additives [1]. The antibacterial activity of wool dyed with natural dyes has been enhanced by alum mordants. The fastness properties, color strength (K/S) values, and antimicrobial properties of samples have been investigated in mordant-type terms. However, this mordant has been used mainly in textile dyeing. In this work, we resorted to a mordant salt to improve the interaction of natural dyes with inorganic nano-clays [2].
β-Carotene and annatto extract present excellent instability against irradiation, which limits their widespread use. Generally, sunlight is the most destructive agent for natural dyes. Therefore, efforts were made to conserve the color of natural organic dyes. Micro-encapsulation and nano-encapsulation are advocated to enhance stability. Natural dyes have been protected using different inorganic compounds, such as nano-clays structures. Dye attachment to clays would define a peculiar “Maya chemistry” to gain stable hybrid pigments or nano-pigments [3]. Aluminosilicate materials with different morphologies, such as platy and tubule nanoclays, may serve as an efficient protective encasing for colored organic substances and nanoparticles [4]. Nanoclays allow natural dyes to be applied in different polymer matrices, which make them soluble in distinct polar mediums. Among the many types of different structured nano-silicates available, a laminar and meso-porous type can be put to good use because of its environmentally-friendly preparation condition since it can be prepared at room temperature in an aqueous solution with a wide range of pH [5].
Sheet clay polarity influences the encapsulated organic dye. To change the nano-clay surface polarity, surface modifiers must be used, such as surfactants or silane-coupling agents. In the resulting organoclays, the π–π interaction between natural dyes, such as β-carotene and the benzene ring of a surfactant, has been found to contribute to enhance stability [6].
Furthermore, polymer matrix properties have been improved using different nano-clay structures. Nano-clay particle exfoliation must be achieved to acquire optimal properties, such as better mechanical, thermal, or barrier properties. Combining organic additives, such as surfactant or silane components, allows the nano-clay surface charge and nano-clay affinity to be changed by opening the clay structure. Organo-clays are one of the best options to ensure clay particle exfoliation in different polymer matrices. Biopolymer matrix properties can be improved by the same method using nano-clays with surfactant/silane additives to ensure biopolymer/clay particle compatibility [7,8].
In previous work, we studied the combination of mordant, silane, and surfactant modifiers using laminar nano-clays and a different pH level, with beta-carontene, betanine, and chlorophyll dyes. The conclusion was that the best optical mechanical and thermal properties were obtained combining silane and surfactant, and any influence was found with the mordant salt [9]. However, there is another important question regarding the effect of the order of the nano-clay modification. In this study, we add all the modifiers before the natural dye incorporation. The initial hypothesis of the present study is that this could affect to the adsorption capacity of the nano-clays. The addition order should also affect the preferent localization of the dye molecules, in the nano-clay surface or the basal space. The nano-clay-additives-natural dyes bond will be different depending on the incorporation moment of all the additives in the synthesis process. For this reason, the aim of the present work was to know the best additive combination for laminar nano-clays with different anion exchange capacities to achieve hybrid nano-pigments with distinct natural dye structures. Our intention was to know the best moment to incorporate each additive (surfactant, mordant, silane, and natural dye) to achieve the best synthesis process performance. We also applied natural hybrid pigments in a biopolymer matrix to obtain optimal properties for natural colored bio-composites. We avoided natural dye migrations from the biopolymer matrix, and we improved thermal and UV–Vis fastness properties. Lastly, we studied the different natural dye interactions with various laminar nano-clays, which gave the best additive combination for an epoxy bio-resin.

2. Materials and Methods

2.1. Materials

We selected three natural dyes as natural hybrid nano-pigments: beetroot red extract (NR) CI.75840 (C24H26N2O13), β-carotene (NO) CI.75130 (C40H56), and copper chlorophyll (NG) CI.75810 (C34H31CuN4Na3O6), supplied by Sensient® (Milwaukee, WI, USA). We used two laminar nanoclays: montmorillonite, with trade name Gel White from Southern Clay Products (Gonzales, TX, USA), hydrotalcite BioUltra anhydrous, ≥99.0%. Both had a different charge ion capacity and were supplied by Sigma-Aldrich (St. Louis, MO, USA). The surfactants were cetylpyridinium bromide (CPB) CAS: 202869-92-9, C21H38BrN·6H2O, 384.44 g/mol, and sodium dodecyl sulfate (SDS) CAS: 151-21-3, CH3(CH2)11OSO3Na, 288.38 g/mol. We used a mordant salt, potassium alum AlK(SO4)2·12H2O, CAS 7784-24-9, 474.39 g/mol, and the coupling agent was (3-Aminopropyl) triethoxysilane H2N(CH2)3Si(OCH3)3, CAS: 13822-56-5, 179.29 g/mol. Lastly, in order to record any changes in pH during the synthesis process, hydrochloric acid (HCl), ACS reagent, was used at 37%. All these agents were supplied by Sigma-Aldrich.
For bio-nanocomposite generation, we used the bioresin whose trade name is GreenPoxy 55, which is an epoxy system with a single hardener where 55% of the molecular structure is of plant origin. Catalyst SD 505 came from SICOMIN Composites (Chateauneuf les Martigues, France).

2.2. Synthesis Method

For the nano-pigment synthesis, we followed the water/organic solvent dispersion method [10]. In this study, clays were dispersed at 1500 rpm for 24 h. Clay dispersions were prepared at 25 g/L in distilled water and ethanol (50/50), and pH was adjusted to 4–5 with HCl due to our previous work results. A calcined hydrotalcite 600 °C for 3 h was added to the experimental design as a new clay. The dye concentration in solutions was 1 × 10⁻³ M in the three natural dyes, and 27 vol.% of clay dispersion was added. Modifiers were added before or after the natural dye at 10% of clay mass. Dye exchange was performed by stirring at 1500 rpm and room temperature for 1 h, and at 600 rpm for 24 h. Solvent separation was performed by centrifuging to obtain the paste-nano-pigment. Then the paste-nano-pigment was washed 3 times by re-dispersing its paste at 400 rpm for 30 min. Lastly, the paste-nano-pigment was cool-dried in an ALPHA 1-2 LDplus lyophilizer (Martin Christ, Osterode am Harz, Germany) for 24 h.

2.3. Design of Experiments

Experiments were conducted by combining the different synthesis factors in order in the Taguchi L9 experiment, instead of the L8 selected in our previous work due to the additional levels for each studied factor. There were three replicates per experiment with one for each natural dye. The block assignments were: 1 for the Natural Green (NG), 2 for the Natural Orange (NO), and 3 for the Natural Red (NR) results (Table 1).

2.4. Biocomposite Generation

Bio-composite materials were handmade by mixing with the commercially recommended catalyst, and using silicon templates to obtain plain rectangular samples. We employed different nano-pigment concentrations of 10%, 5%, 2% and 1%, over the bio-resin mass. The curing process was carried out at 90 °C for 1 h.

2.5. Characterization

The determination of the amount of dye was intercalated in the nano-clay system permit to check the synthesis performance of nano-pigments. For this purpose, we utilized a UV–Vis transmission spectrophotometer (JASCO V650, Easton, MD, USA) to calculate the dye concentration in the separate supernatants. Then we employed the dye adsorbed over the initially added dye (%) as a response to maximize in the DoE analysis.
XRD Bruker D8-Advance equipment (Bruker, Billerica, MA, USA), with a Göebel mirror (Potency: 3000 W, Tension: 20–60 kV and Current intensity: 5–80 mA), was used. Measurements were taken in an oxidant atmosphere at an angular speed of 1°/min, STEP 0.05°, and an angular scan of 2.7°–70°. XRD patterns were obtained to ensure hydrotalcite structure recovery and to find modifications in the crystal structure because of the exchange in the basal space for both nano-clays.
A JASCO FTIR 4700 spectrometer was used at the 0.5 cm−1 resolution. A KBr transmission method and a DLaTGS detector (Jasco, Madrid, Spain) was employed. The measurement frequency range was 7800 and 400 cm−1. The FTIR transmission spectra were analyzed by searching for new bonds among modifiers, natural dyes, and clay structures.
A thermogravimetric analyzer TGA/SDTA 851 (Mettler-Toledo Inc., Columbus, OH, USA) was used to find the degradation temperature of the composite materials (Td). The experimental conditions were a temperature ramp of 5 °C/min within the 20–900 °C interval with oxidant medium N2:O2 (4:1).
For the characterization of the optical properties, a Konica Minolta sphere integrated spectrophotometer (CM-2600d, Tokyo, Japan) was used to obtain the reflectance factors ρ(λ) for the bio-nanocomposites within the 370–740 nm range with the D65 illuminant and the CIE-1964 standard [11] observer. Then a SOLARBOX 1500e RH climatic chamber (ERICHSEN, Hemer, Germany) was used to measure color stability against accelerated UV–Vis exposure. Samples were measured at several exposure time intervals, and color differences were calculated by measuring samples before and after radiation exposure. Color differences ΔEab* were calculated with the colorimetric attributes of the CIELAB color space, which was used as a response to minimize in the DoE analysis.
Lastly, colorant migration was measured by the “Textile Standard: Fastness Tests. Part X12: Rubbing Color Fastness” (ISO 105-X12:2001) [12].

3. Results

3.1. Dye Adsorption

First, we calculated the amount of dye adsorbed by nano-clays as a percentage of the initial concentration in the exchange step. This parameter has been used as a synthesis yield measurement in our previous studies. In general, the adsorption capacity was increased for both nano-clays compared to our last results. As shown in Table 2, in this study, significant differences were found depending on the natural dye and synthesis conditions.
In order to know which factors significantly influenced the amount of adsorbed dye, we employed the experimental analysis design. In our previous study, the silane and surfactant combination was significant too. However, in this work, the ANOVA test showed that the only significant factors with this response were blocks and nano-clay (Table 3), with p-values below 0.05. The first block corresponded to the green samples (NG), the second corresponded to the test with beta-carotene (NO), and the third corresponded to the red samples (NR). Fixing the pH level and combining the addition moment of all the modifiers, decreases the variability in the adoption behavior due to the surfactant and silane interaction. However, this conditions an increase among the differences between the nano-clay and the dye molecule. The maximum amount of loaded dye was achieved with the chlorophyll samples, and the performance in the synthesis process using betanine was the worst. Hydrotalcite clay achieved better adsorption capacity than montmorillonite, and no differences were observed between calcined and non calcined hydrotalcite (Figure 1). As an anionic nano-clay, these results were expected because hydrotalcite was the anionic nano-clay. However, when employing surface modifiers, we loaded a significant amount of the three natural dyes using cationic montmorillonite. With this response, no significant differences appeared, according to the addition moment of the three modifiers.

3.2. X-ray Diffraction

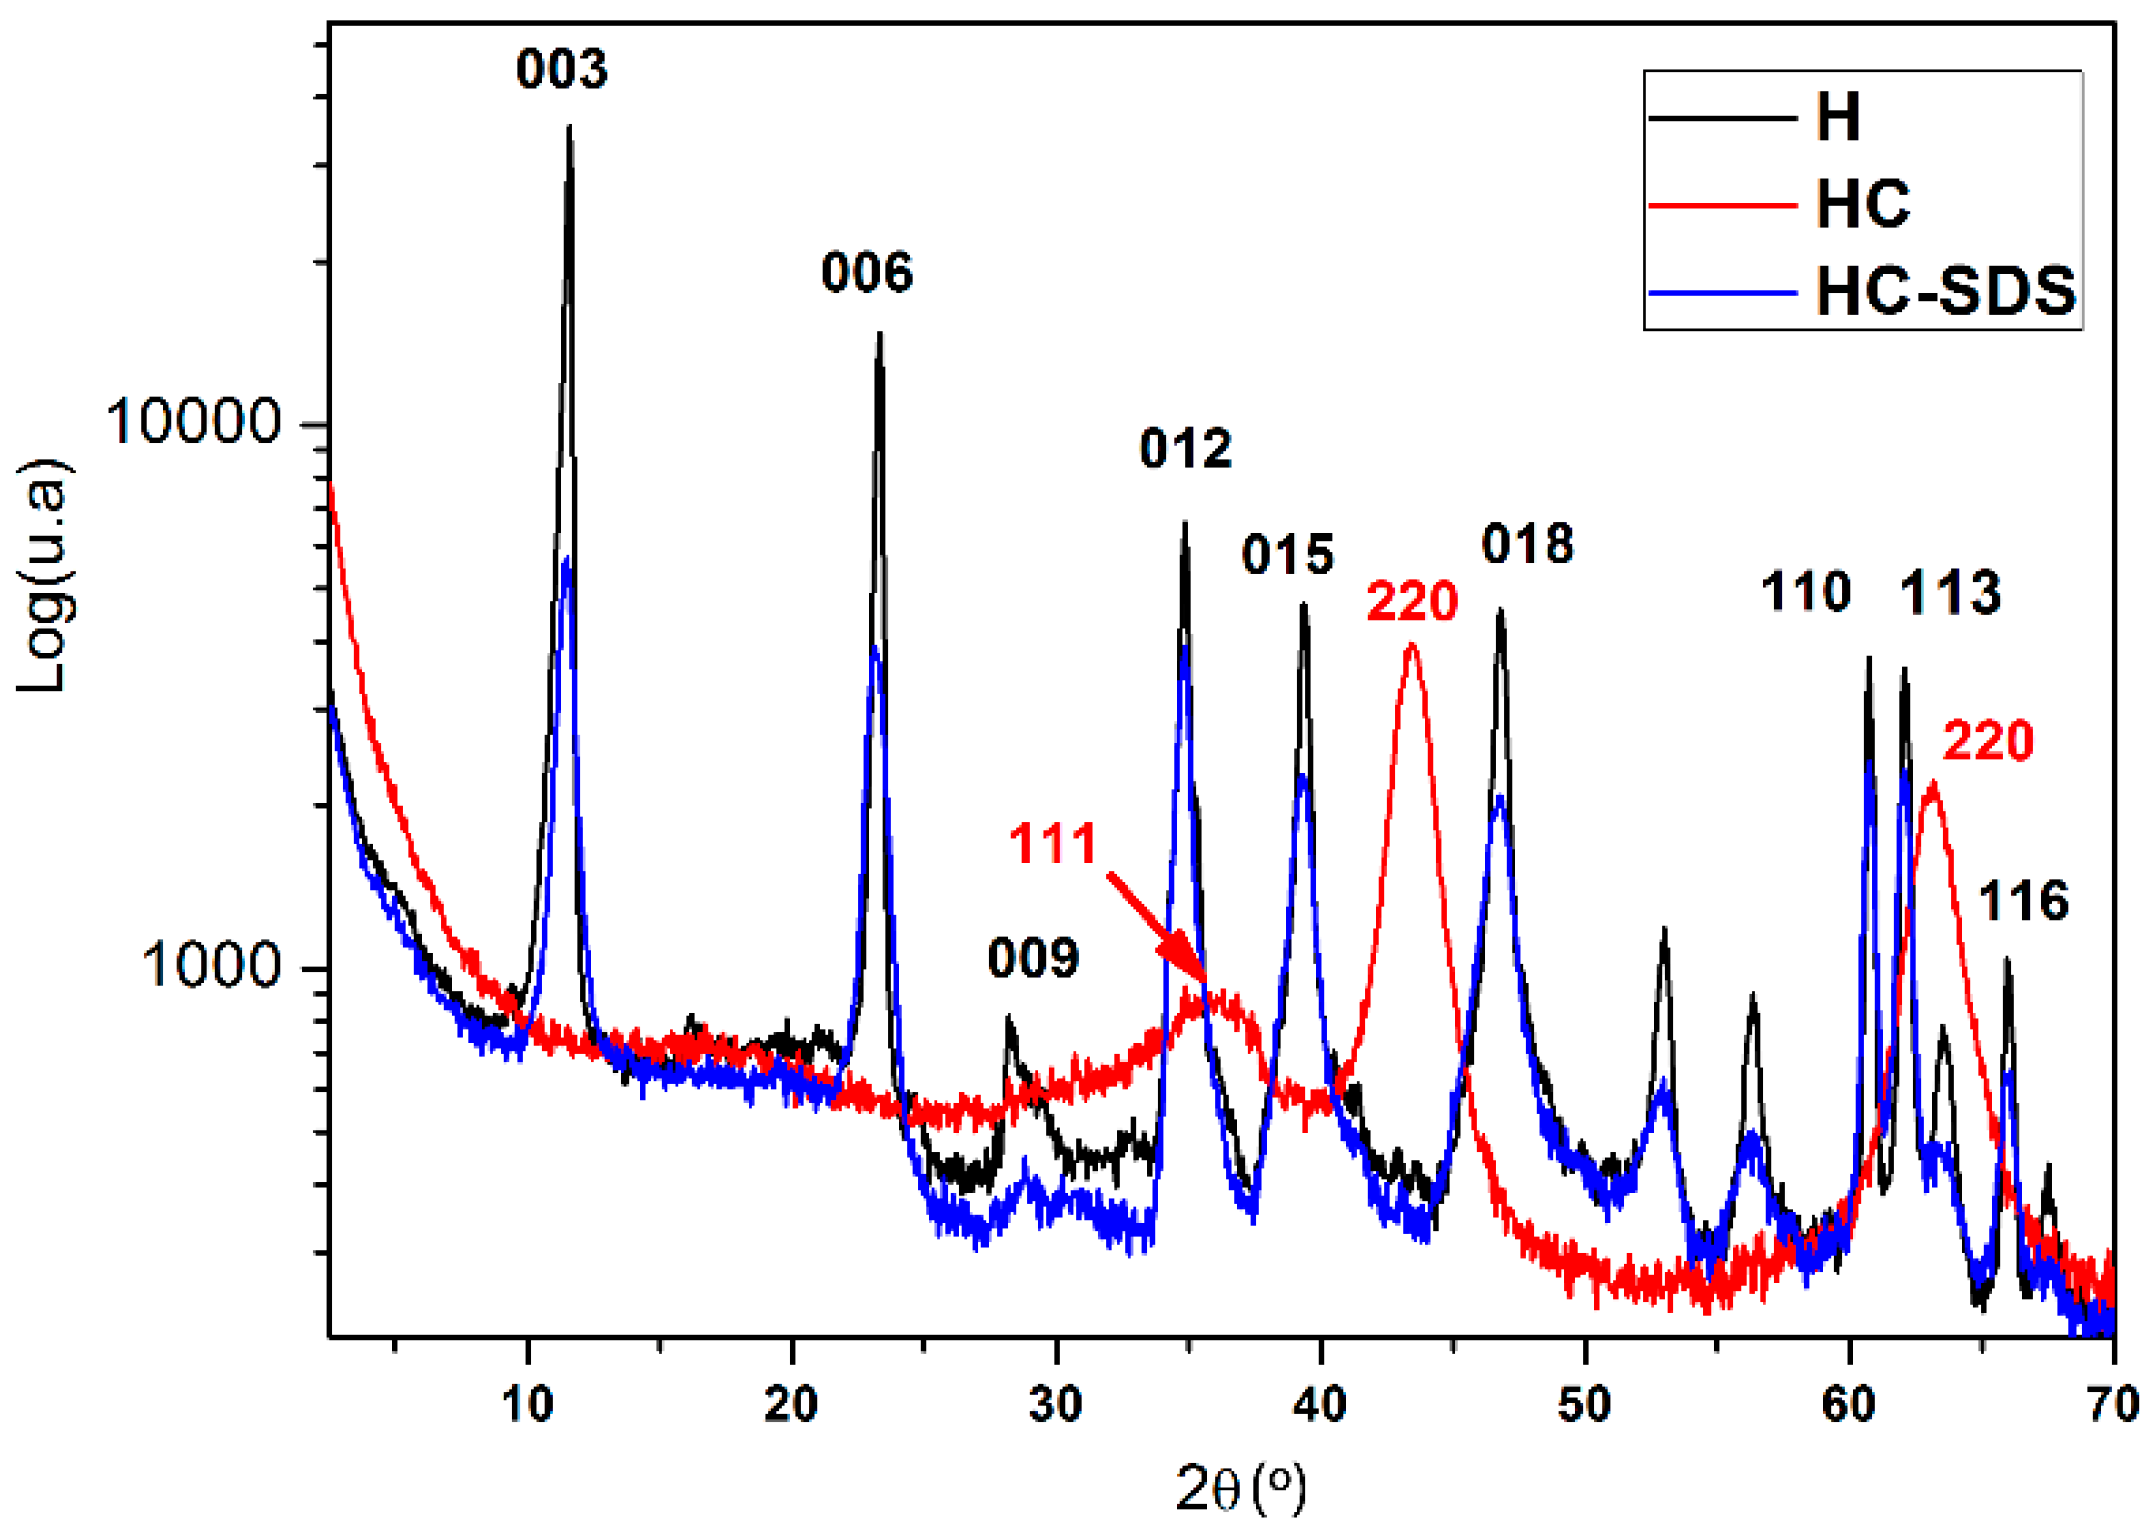
In this section, we look at the analysis done of the diffraction patrons from the original nano-clays, the calcined hydrotalcite HC, and the hybrid pigments synthesized under L9 conditions. First, the hydrotalcite structure was completely destroyed after the calcination process (3 h, 600 °C) and the diffraction peaks showed an amorphous structure of mixed oxide Mg(Al)Ox. The memory form was proven when an anionic surfactant SDS was used to modify hydrotalcite clay [13]. All the diffraction peaks, which corresponded to the original nano-clay H, were once again shown after the wet exchange process (Figure 2).
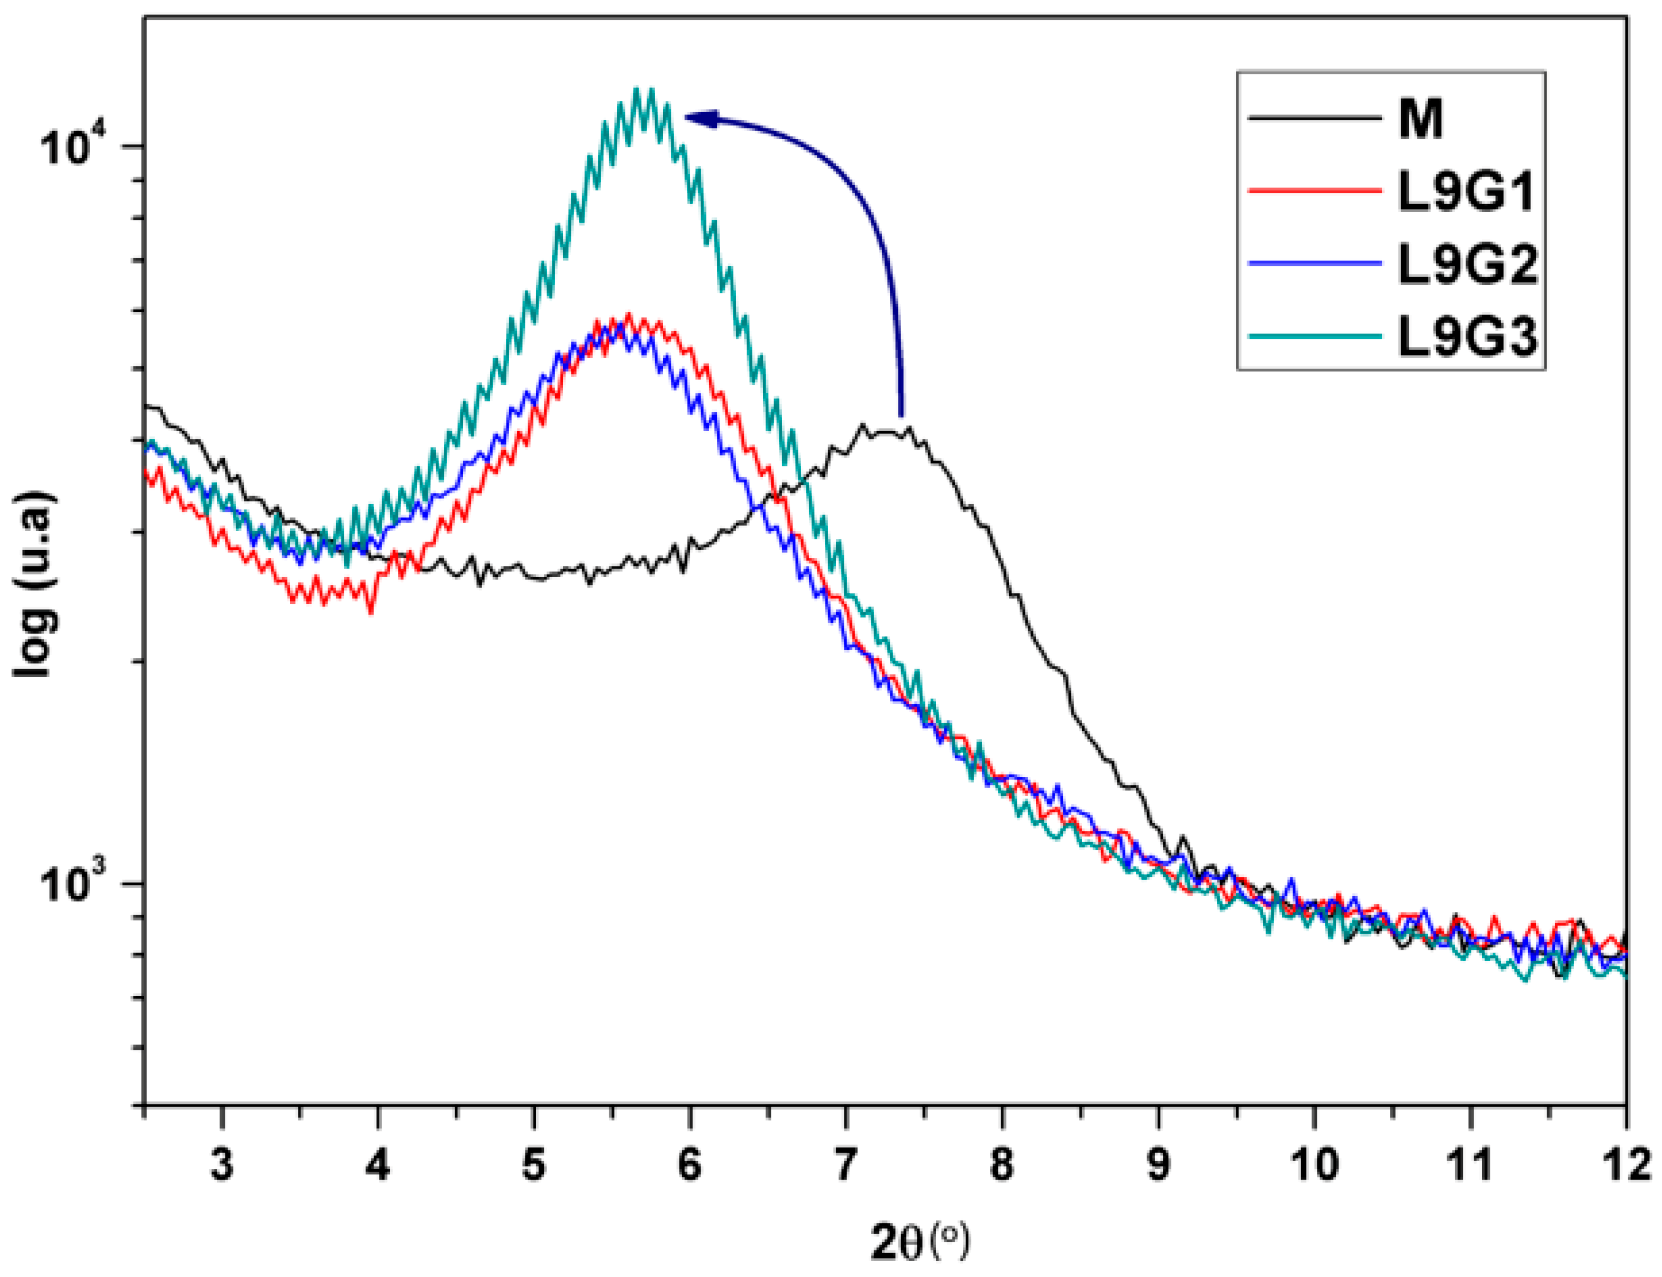
By incorporating the dye into the dispersion of HC, we expected the dye to interact with the clay by changing the crystal structure during the structure reconstruction. Peak shifts with the hydrotalcite (H) patrons can be seen when exchanged under the L9 conditions using the three natural dyes. Figure 3 provides an example of the chlorophyll natural dye (NG). With the original hydrotalcite, the peak shift was significantly low than when the calcined hydrotalcite (HC) was used. However, when the mordant modifier was used (after or before), a shoulder peak appeared, which could have corresponded to a structural modification because part of the mordant salt intercalated into the nano-clay interlayer space, while the dye clay interactions between H and the natural dye took place on the nano-clay surface [
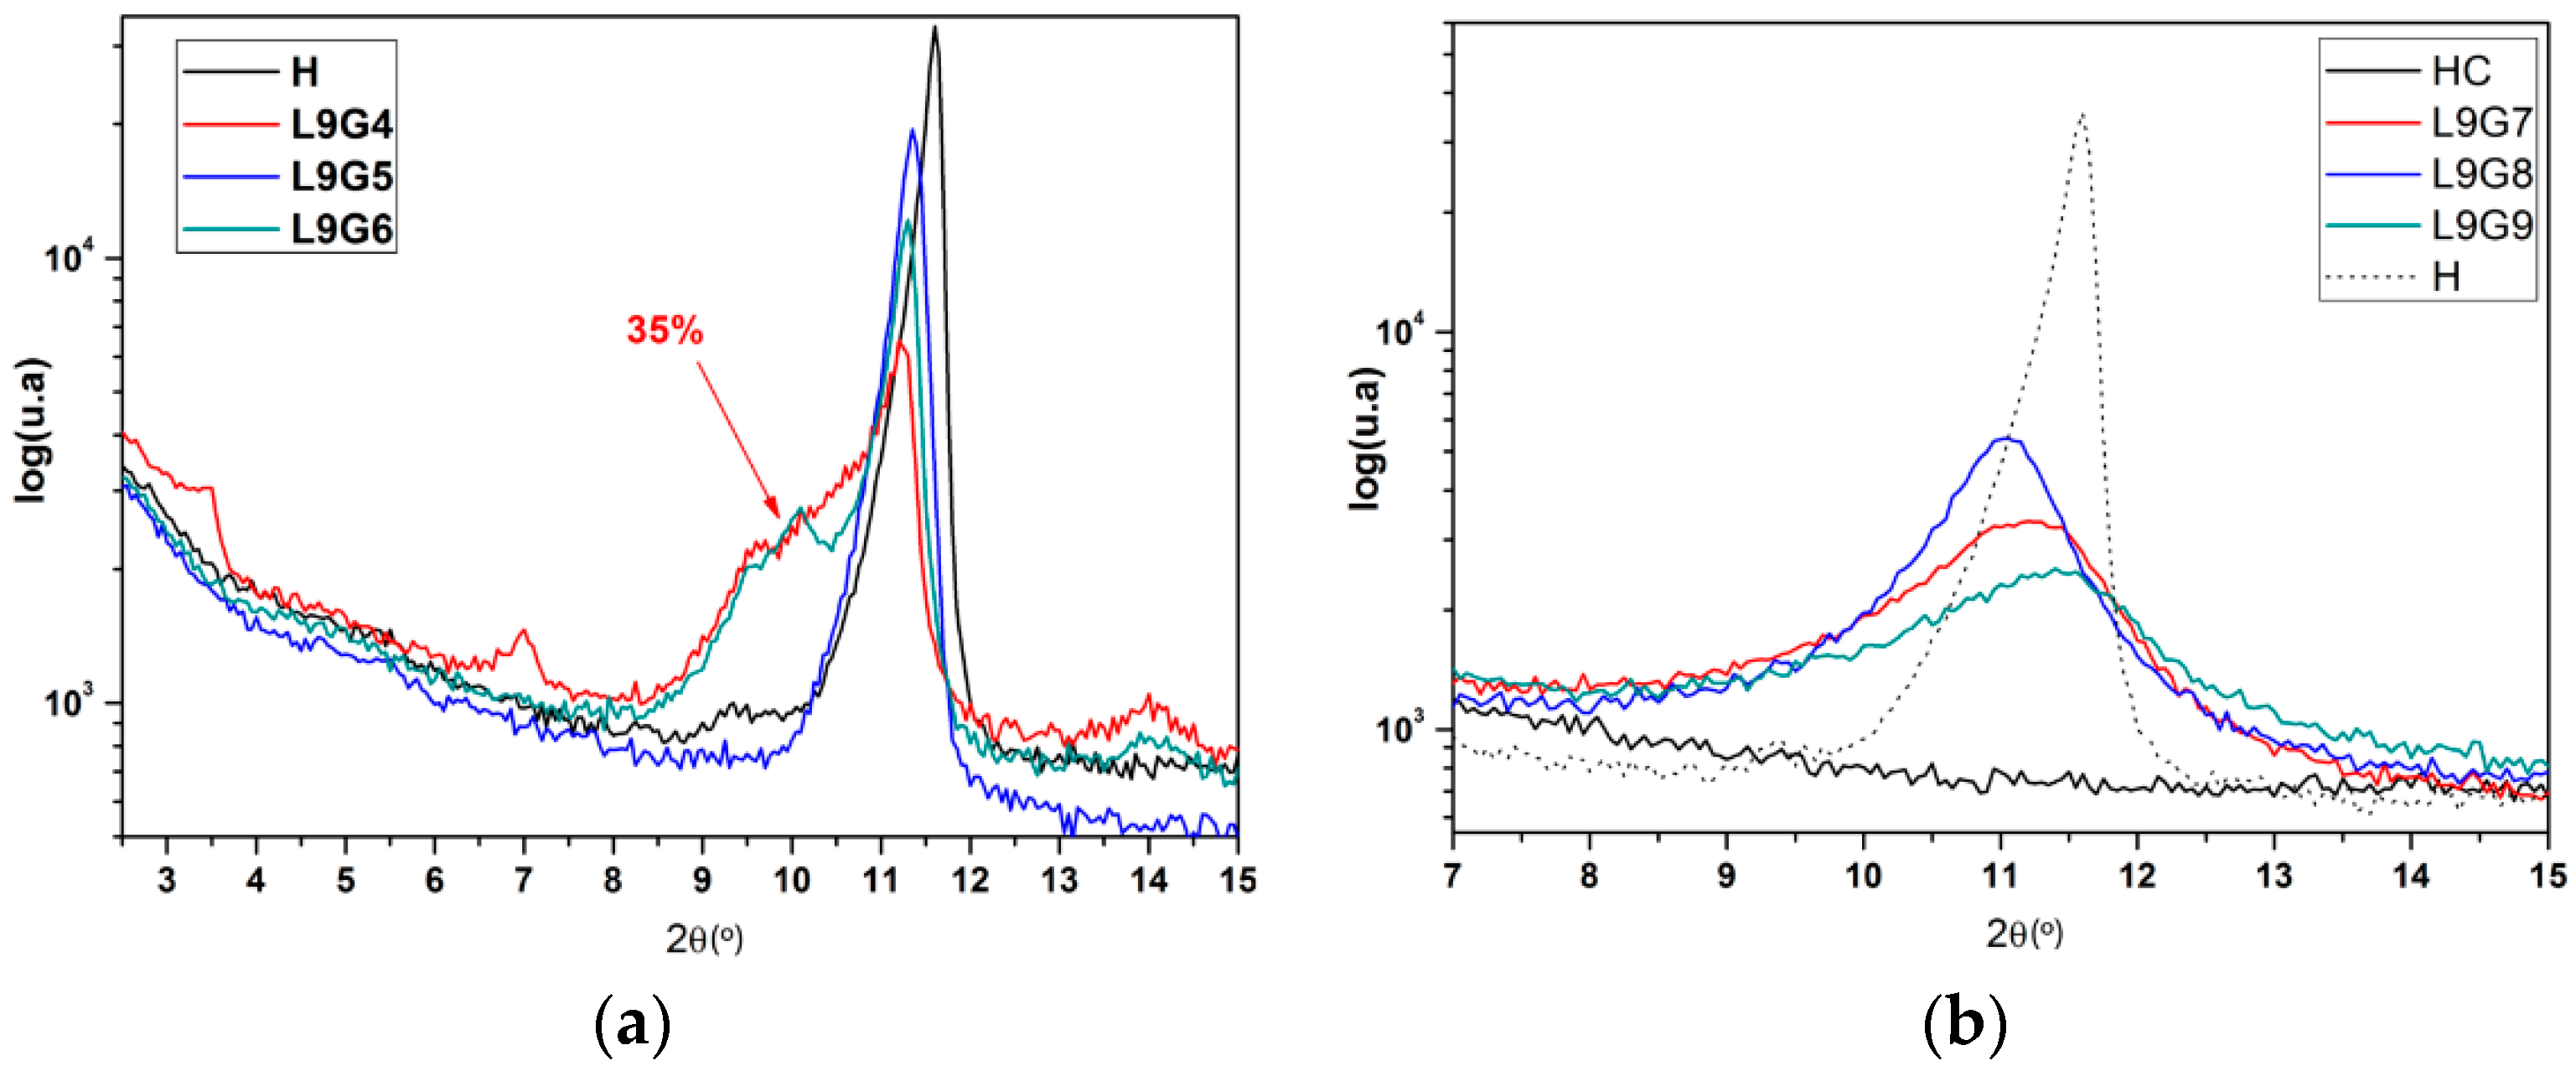
14]. The use of the calcined nano-clay HC allowed the basal space to be modified by increasing the laminar distance. In these samples, no double peak effect appeared such as with the original nano-clay. The peak shift was more intense when the mordant salt was used, as shown by the plotted example L9G8 (Figure 3). In previously calcined Hydrotalcite samples (L9G7-9), there is a peak shift of the samples depending on the addition moment of the surfactant (SDS). As can be observed in Figure 3, samples with SDS added after the dye load, show a left peak shift, which corresponds to a high basal space. A less pronounced shift is shown in the samples with the SDS added before the dye adsorption, and no differences can be observed when there is no surfactant modification. The same pattern can be observed with non-calcined Hydrotalcite samples (L9G4-G6), but it is more difficult to see because of the mordant effect in L9G4 and L9G6 samples, with the double peak that appears because of higher structural changes in the hydrotalcite clay. When employing montmorillonite clay, no structural differences in the three experimental conditions were observed when this clay was used (Figure 4) with the same basal space increasing in all the synthesis conditions.

3.3. FTIR

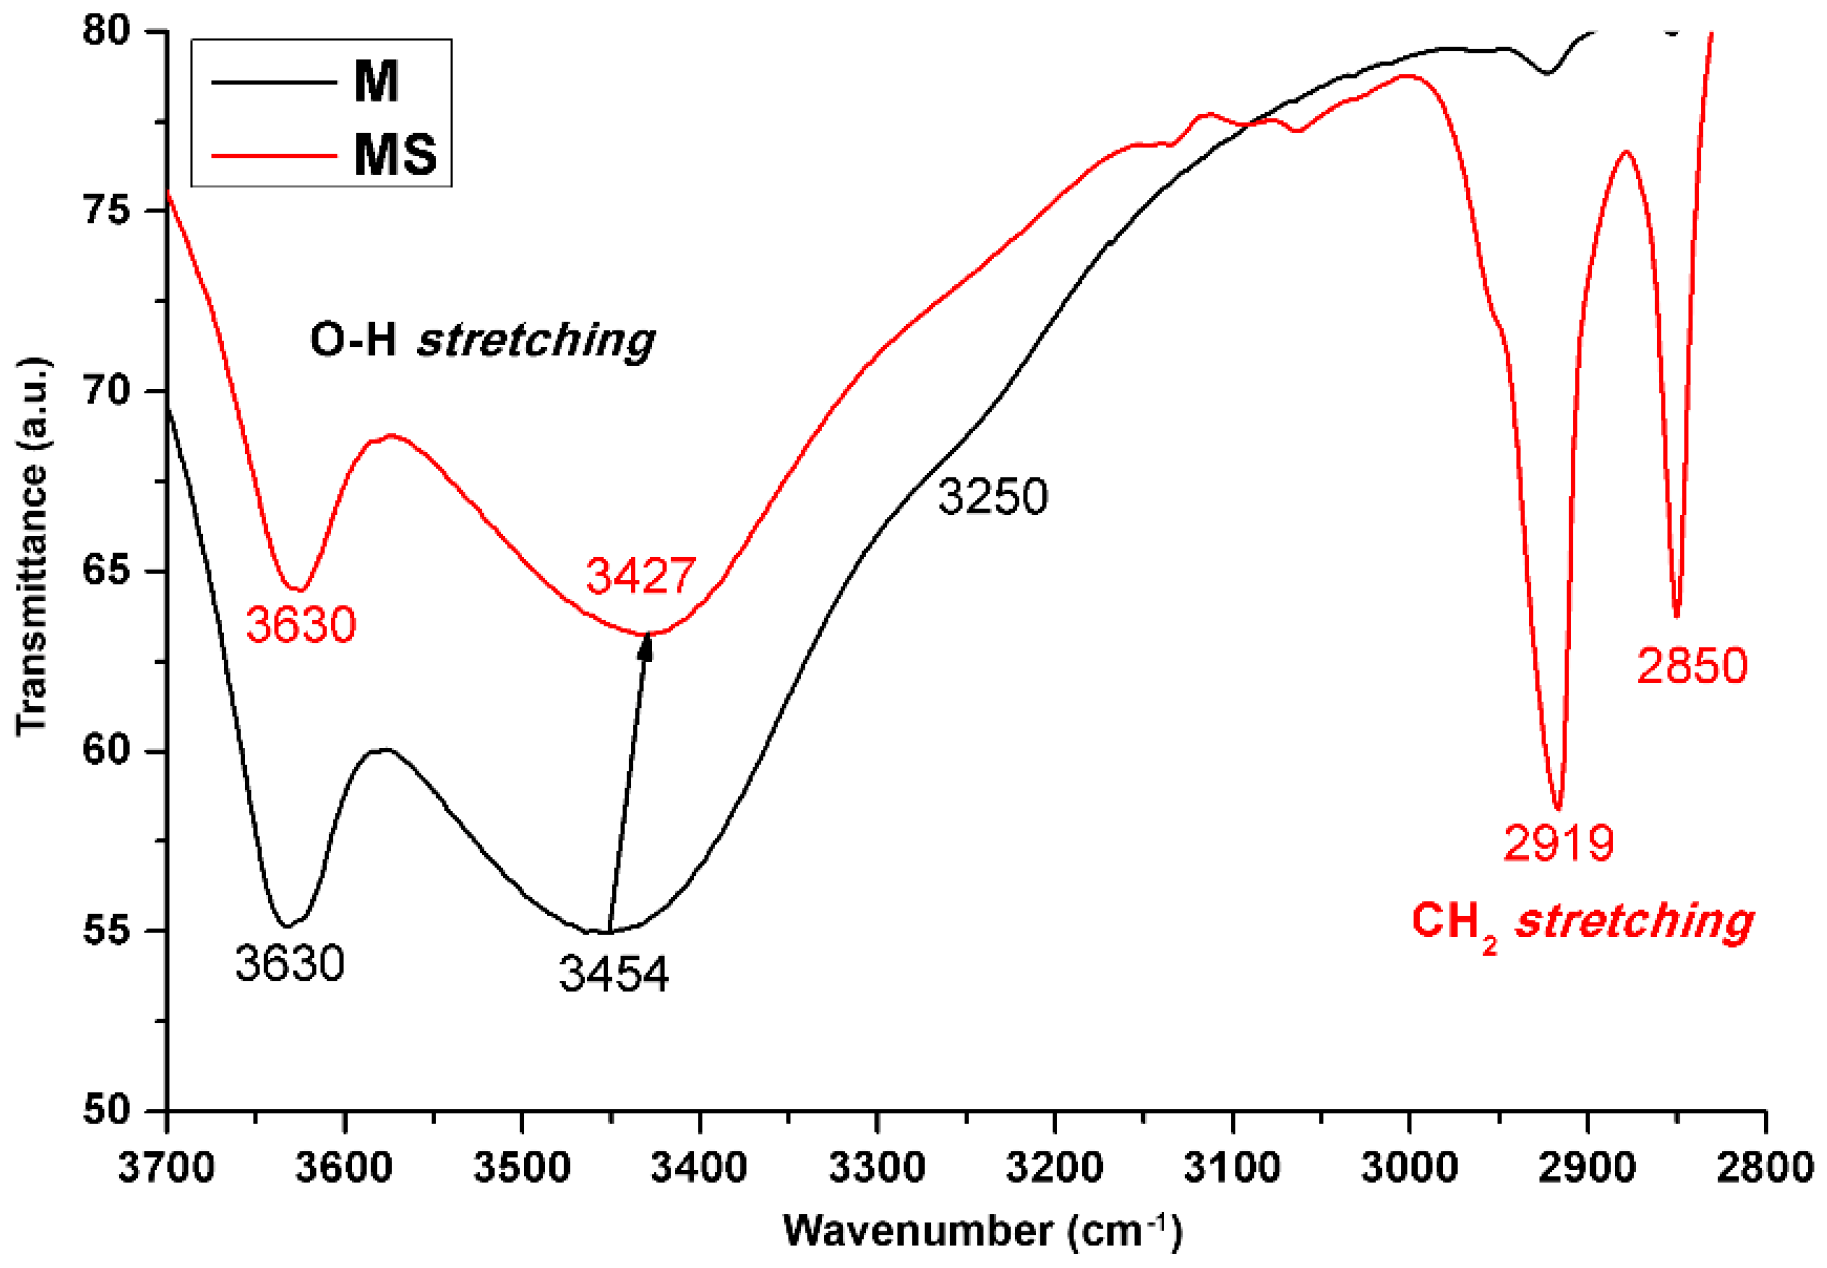
In this analysis, we first searched for the effect on the water molecules adsorbed in the nano-clay structures. In the M nano-clay (Figure 5), bands appeared at 3454 and 3250 cm−1, which corresponded to the symmetric ν ¯ 1   and non-symmetric ν ¯ 3   tensin (stretching) vibrations of bonded water molecules H–O–H, while overtone 2 ν ¯ 2 corresponded to the cation hydration exchange. When montmorillonite was modified with a surfactant (CPB), the band corresponding to the structural water only remained and the overtone disappeared because of the partial cation exchange with CPB. A minor displacement to the structural water bands took place, which indicates that the union of water by hydrogen bridges was weaker with this sample. Moreover, the polarization of the water molecules surrounding the exchange cation increased. The new thin bands (sharp, intense) that appeared in MS at 2850 and 2919 cm−1 were remarkable, and were due to the CPB and M interactions [15].
Then we ran an analysis of the M clay with the NG dye under three different L9G1–L9G3 conditions (Figure 6). In this plot, the first evidence for the dye intercalation into the nano-clay structure was noted at O–H from the decrease in the structural stretching bands associated with water bands/peaks noted for the three samples (3700–3300 cm−1). Hence, an increment in the C–H vibrational bands was observed at 2933 and 2850 cm−1, which was attributed to the presence of NG. This evidence became stronger when the three modifiers were used before the NG exchange under the L9G1 conditions, which was followed by the L9G2 sample where the modifiers were added after NG. The weakest effect was shown when none of them were used (L9G3). There was also evidence for a surrounding change in the NG molecule when it interacted with the nano-clay because no bands were observed at 1630 and 1560 cm−1 (C=C). Another significant change in the M structure was that the band at 1492 cm−1 disappeared. This band could be assigned to a secondary amines N–H bonds deformation, and it has been used before to describe the acid sites of such a nano-clay [16]. This means that these active sites were occupied by the modifiers and NG in the exchange step. When zooming in on the last part of the FTIR analyzed spectrum, a new band at 418 cm−1 was revealed, which could be assigned to the vibration that took place outside the plane of the C–CO bond of the carbonyl group in the NG molecule. This band was more marked when the modifiers were not used or if they were used before the dye exchange. The interactions with that group of the molecule were not allowed when M was exchanged before adding NG.
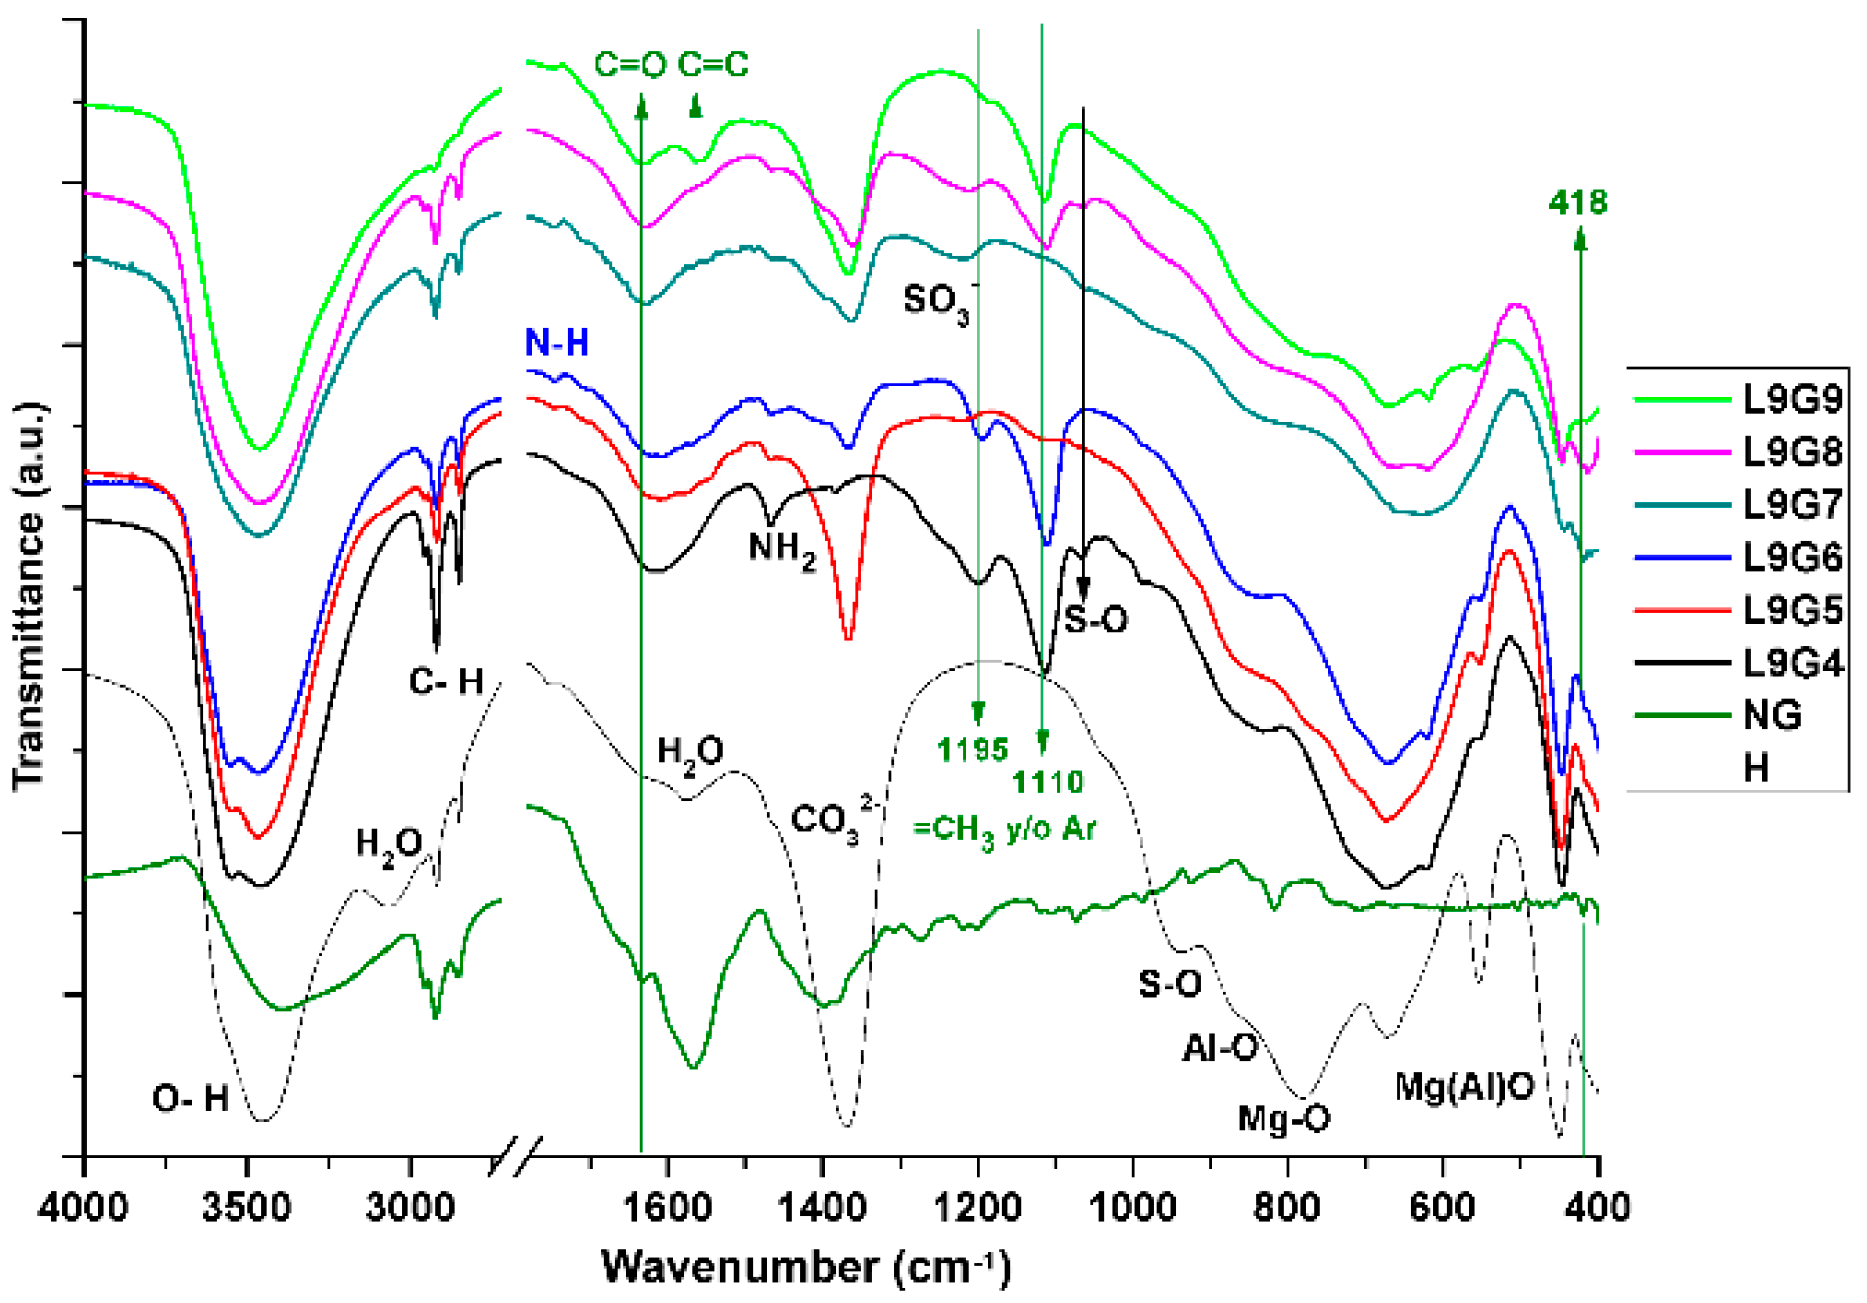
Then we analyzed the H clay with the NG dye under six different conditions including when we directly used the original H clay, L9G4–L9G6, or the calcined clay HC, L9G7–L9G9 (Figure 7). The first conclusion drawn (combined with the XRD patterns) was that, after calcinations, the LDH solid was rebuilt under all the synthesis conditions (L9G7–L9G9). However, some significant structural changes occurred that should be analyzed. First, a low-energy shift in the bands occurred, which corresponded to the metallic oxides known as the Mg–O, Al–O, and Mg(Al)O bonds, which were weaker than in the original H, and the intensity in this band was lower in the HC hybrid pigments.
Some changes also occurred in the H-structural water. In the H-pigments, an increase in shoulder intensity at 3650 cm−1 to form a separate band occurred. This band in the HC pigments was joined to the main peak at 3640 cm−1. Thus, the hydrogen bonds generated changes in the hybrid pigments depending on the calcined process. The disappearing of bands was common with the six hybrid pigments at 3060 cm−1. As such, the hydrogen bonded water to the carbonate anions in the interlayer space. This water was replaced in the whole synthesis process.
It was remarkable that, when HC and silane were used before NG, and the mordant salt was employed after the NG exchange (L9G9), new bands appeared at 1683 and 1560 cm−1 as the substitution of C–H bonds for C=O and C=C led to new interactions between the silane–NH–mordant and the HC nano-clay. Furthermore, new bands appeared in samples L9G4, G6, G8, and G9 at 1195 and 1110 cm−1, which can be assigned to methyl-sulfoxide Ar–SO–CH3.
Lastly, attention should be paid to the evidence noted for the nano-clay carbonate anion substitution. The intensity of the band at 1360 cm−1, which corresponded to the carbonate vibration, reduced in most hybrid samples, or completely disappeared when silane was not used. The surfactant was added beforehand, and when the mordant was employed after NG.
Similar behavior was observed when the FTIR spectrum was studied with all the natural hybrid pigments. Table 4, Table 5 and Table 6 summarize the peak shifts, increments, appearances, and disappearances of new bands as a result of the cation/anion substitutions and natural dye–modifiers–nano-clay interactions. The changes in intensity that maintained the band’s position are indicated with (+) or (−), whereas (*) is used for the samples in which the change/effect was more marked.
In all the samples with a surfactant, intensity changes in the 2920 and 2850 cm−1 bands took place as a result of the new C–H bonds in the hybrid component. Generally, a band shift and a substantial reduction in intensity occurred in the water structural bands in both nano-clays as a result of the anion/cation exchange that took place during the synthesis process. Nano-clay and natural dyes and/or modifier interactions were shown in all the samples. However, the surface or internal interactions were more evident, according to the presence of the nano-clay and modifiers. Pointing to the C–H stretching bands in the hydrotalcite nano-clay modified before with SDS (L9G4), both peaks’ intensity is higher than with samples modified after (L9G5) or without SDS (L9G6). Using previous calcination, this stretching bands only appears in the samples modified with the SDS (L9G7–L9G8), and disappears when we do not use SDS, and use the Silane before the dye adsorption and the mordant salt before. As with XRD results, structural HC changes are more significant with the mordant salt presence.
NH2 formation was shown when the silane modifier was used in all the tested samples. In the NG dye, these interactions should be with the dye COO groups and, as a result, a shift took place in the bands corresponding to this group to the more energetic positions of 1750–1730 cm−1. In addition, new bands appeared at 1190 and 1110 cm−1 when the mordant salt was used, which could be assigned to the Si–O–M and K or Al bonds [17]. Furthermore, the active acid sites from montmorillonite were occupied, and amine formation became more evident when the nano-clay was modified before the natural dye exchange.
The XRD and FTIR results were related and complemented one another. The montmorillonite basal space modification increased when modifiers were used before adding the three natural dyes. The basal space modification by the corresponding anion exchange became clear when combining the XRD and FTIR results, and when the calcined hydrotalcite and SDS as a modifier were employed. When the non-calcined or original Hydrotalcite was used, the structural modification was assigned to the nano-clay surface. Moreover, as the intensity of the bands to bands Si–O or Mg–Al–O lessened, the more basal space was described for that sample.
Lastly, it is worth stressing that Betanine dye and the M or H/HC interactions took place in the N+ nearest group, namely COO. This would explain the bands assigned to the new bonds related with components C–O–C, C=C, and –COOH.

3.4. Degradation Temperature (Td) of Biocomposites

The experimental analysis was run for the L9 results using the first derivative from the temperature curves (TG) [21]. Then the difference between the degradation temperature (Td) from the original bioresin and the Td for the composite materials was calculated. This increment was used from the Td as the response to maximize in the L9 analysis. The tested samples contained the maximum percentage of the hybrid nano-pigment 10% instead of 5% as in our last work. The initial hypothesis is that the thermal properties may be worse with the hybrid pigment increment into the composite because of the agglomeration phenomenon and the increment of the natural dye content that has low thermal stability.
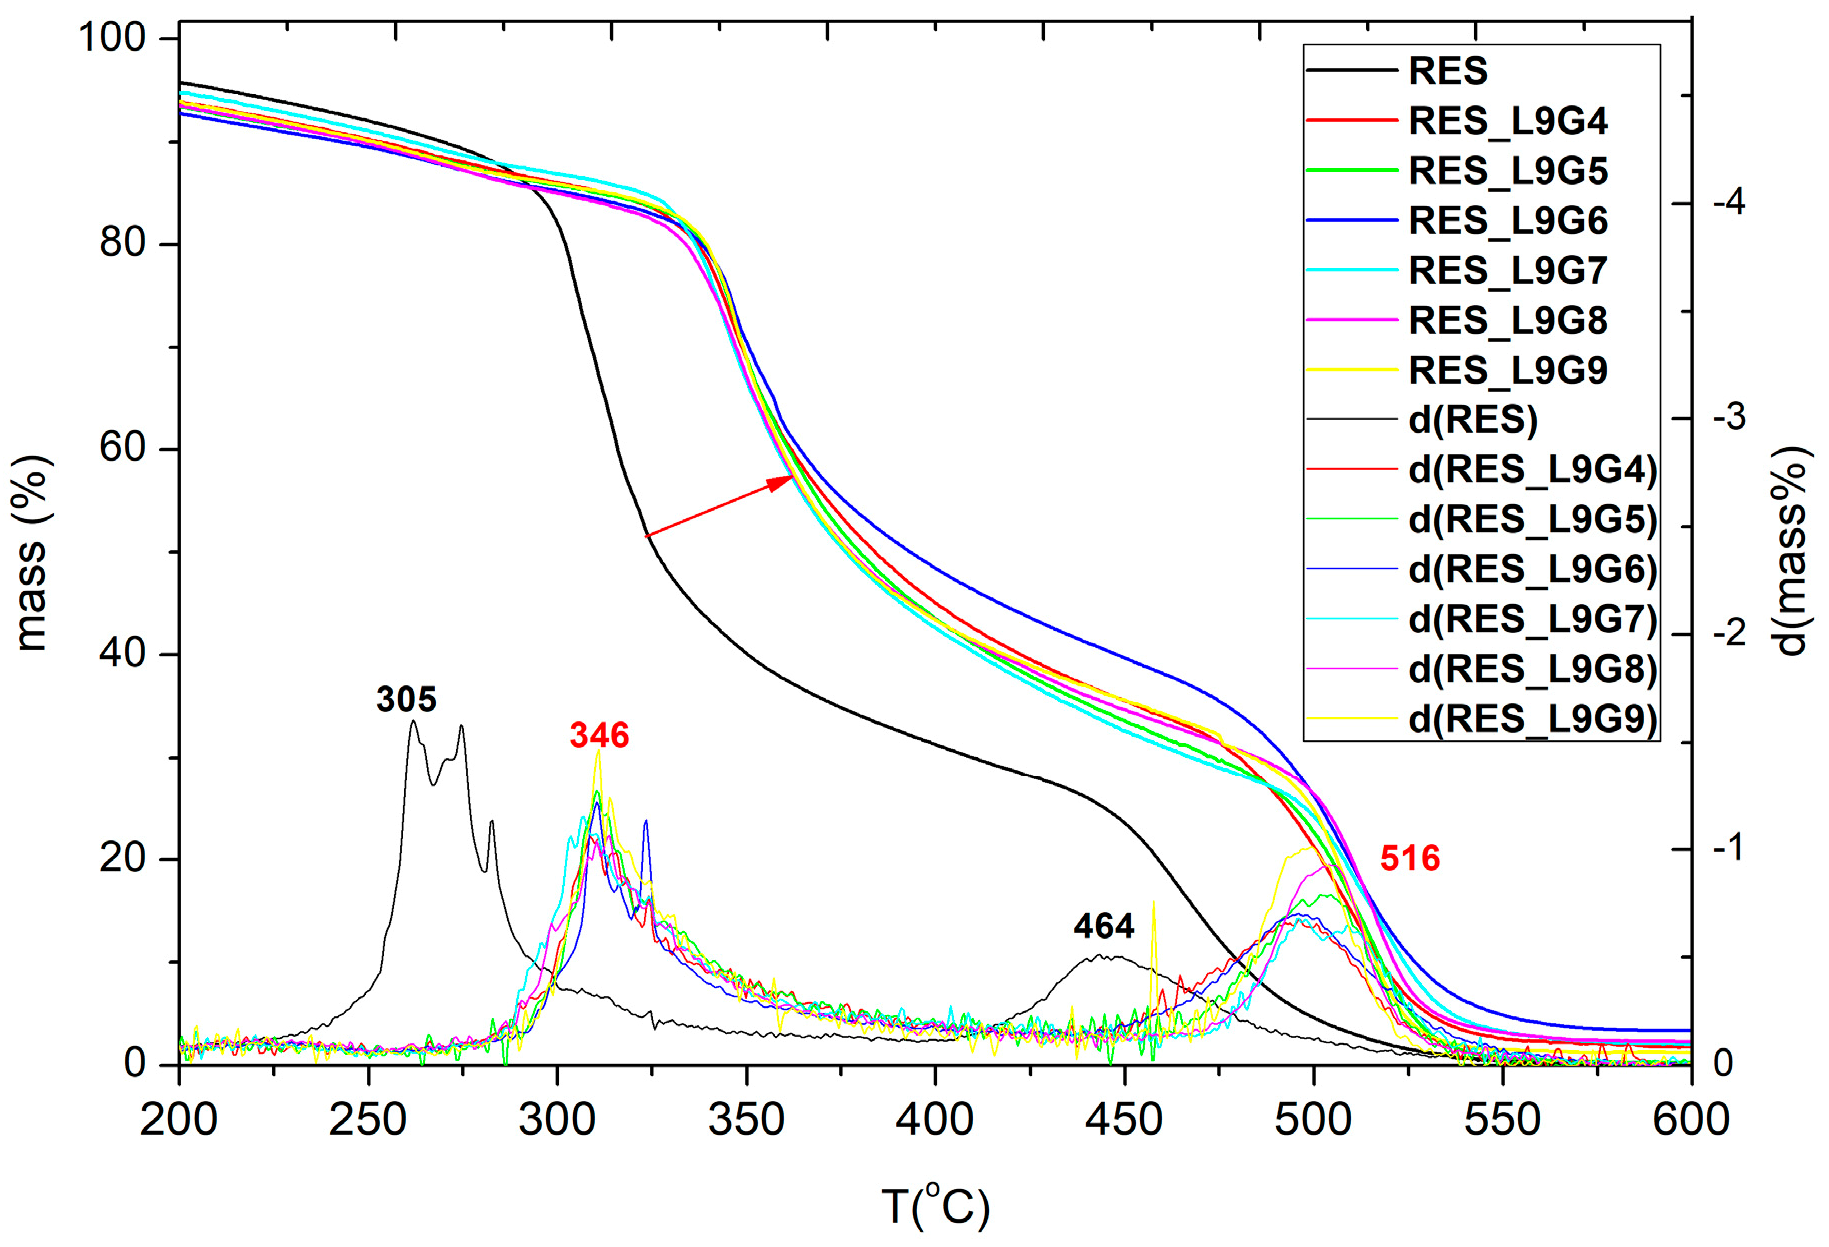
In Figure 8, an example is plotted containing the thermal behavior of the biocomposite materials with 10% of hybrid pigments using chlorophyll dye and hydrotalcite nano-clay, calcined (L9G7–9) or not (L9G4–6). In all samples, the temperature reinforcement is evident. The temperatures of the main mass losses appear at high temperature values in all the tested samples. The same pattern was shown in all the composites with the different hybrid pigments. However, as in previous studies, it is not possible to be sure about the influence of the synthesis parameters without the statistical analysis.
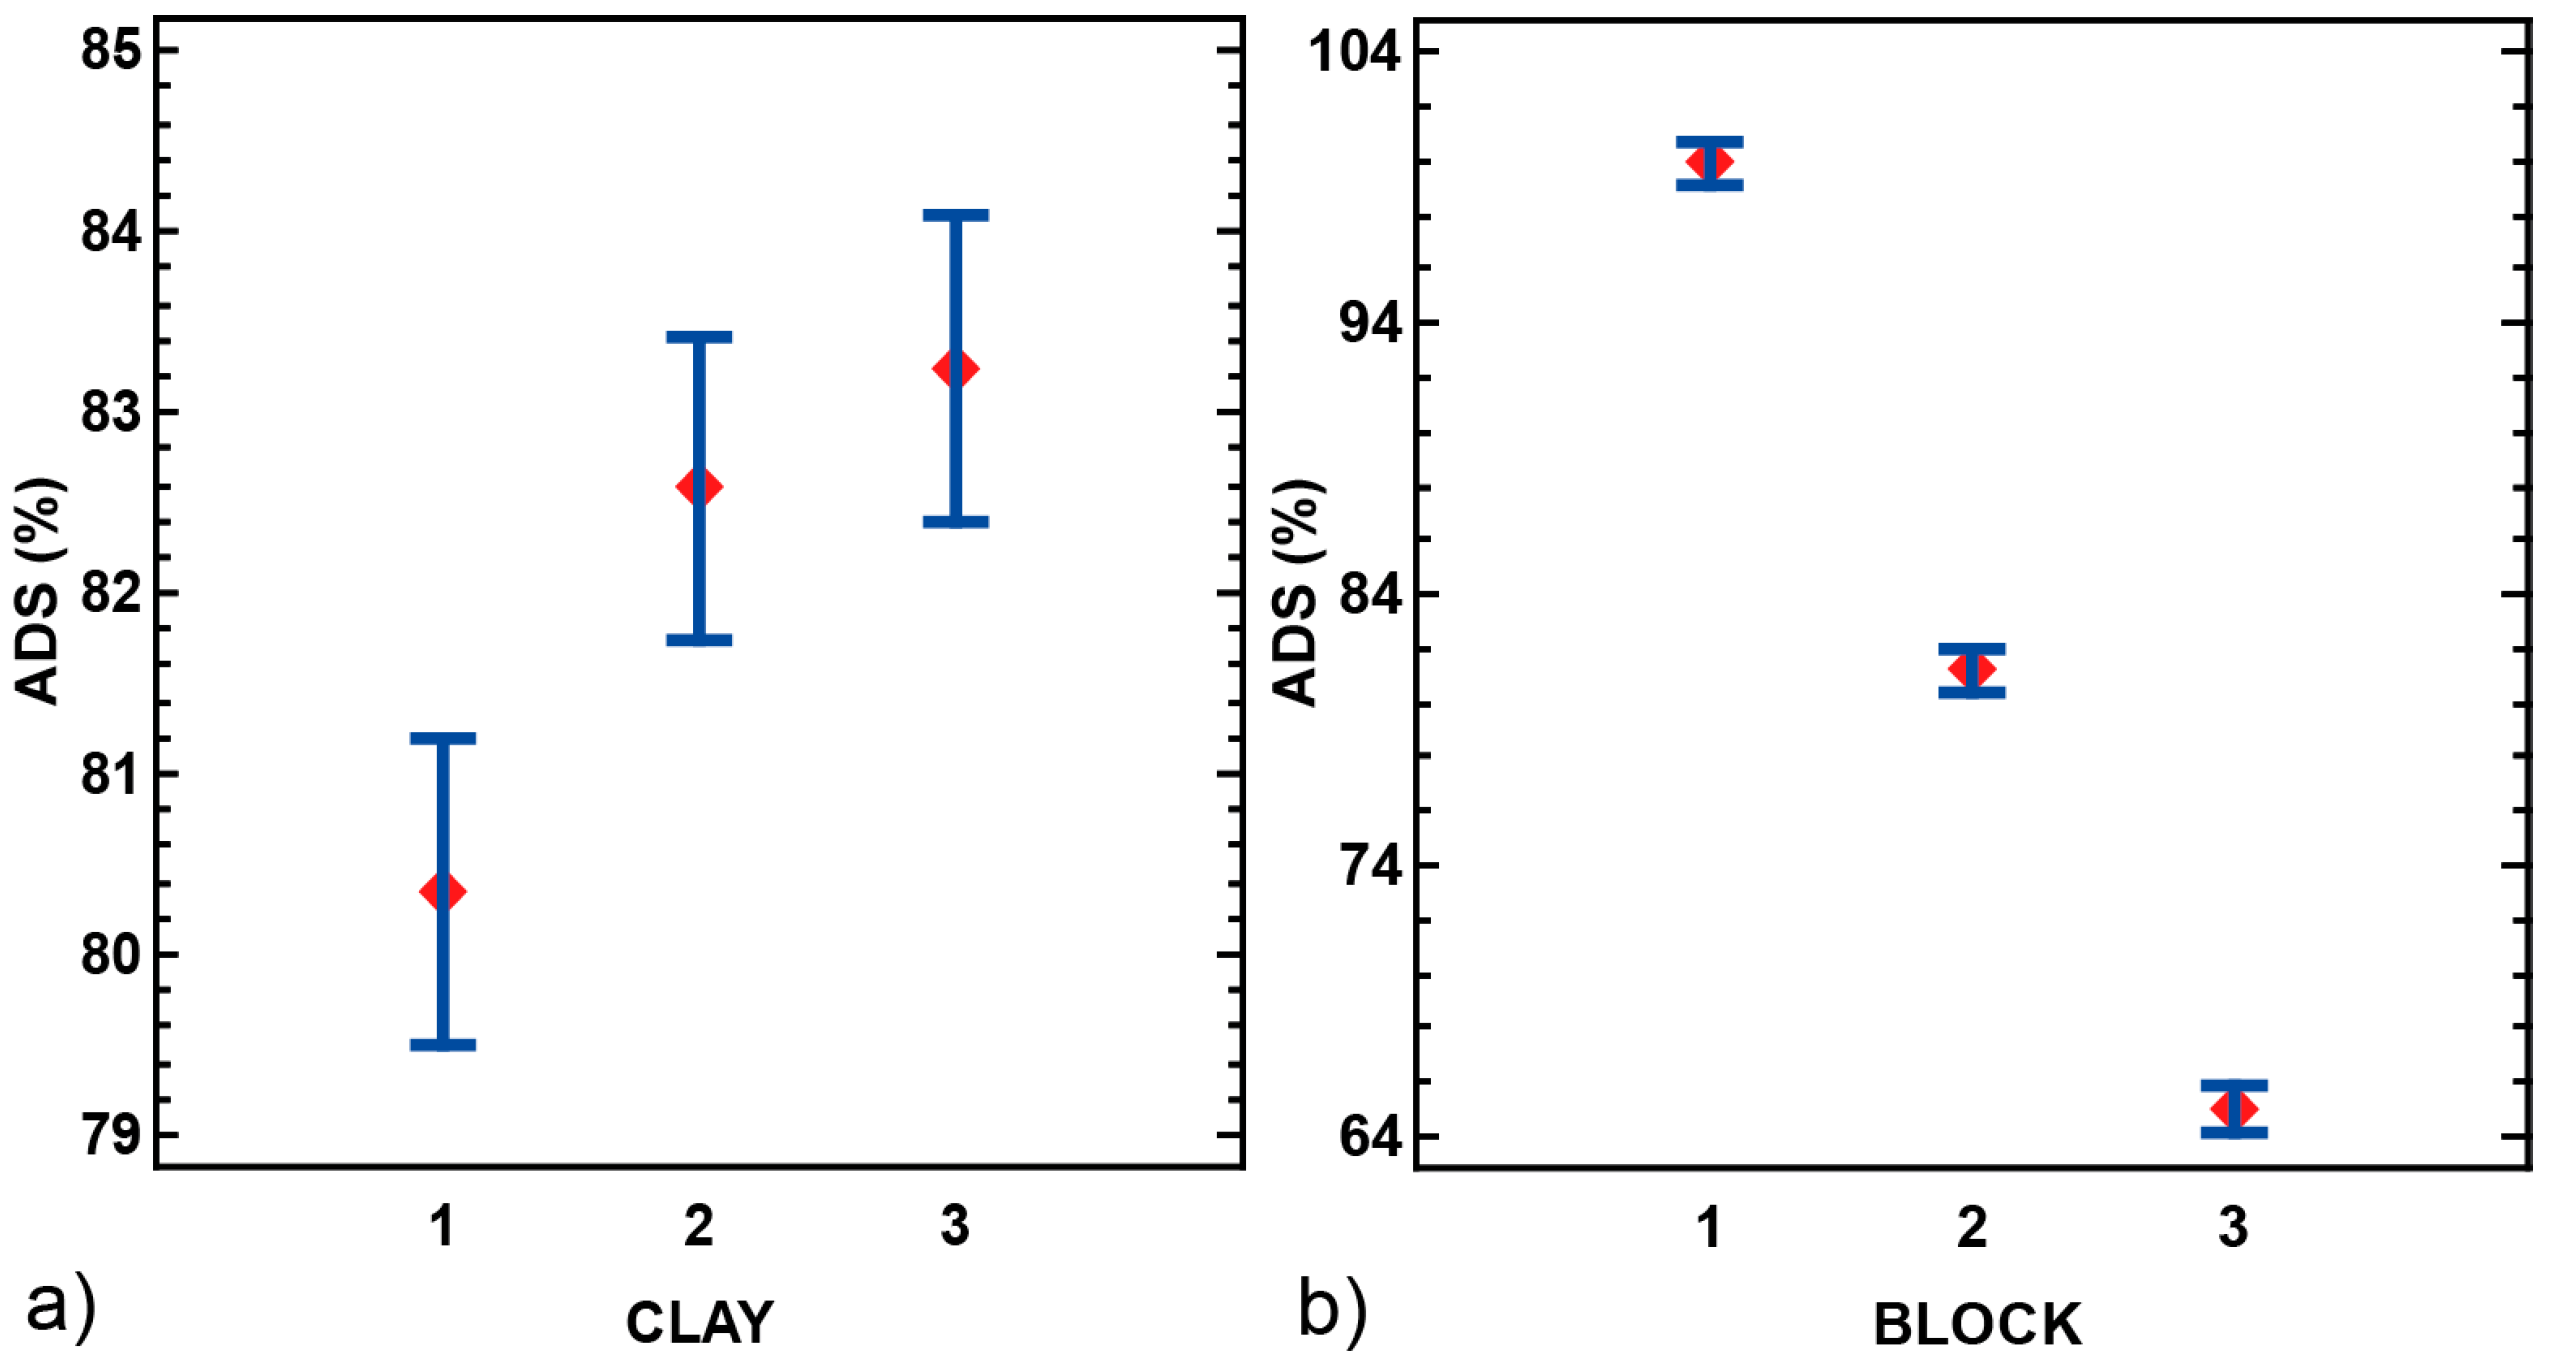
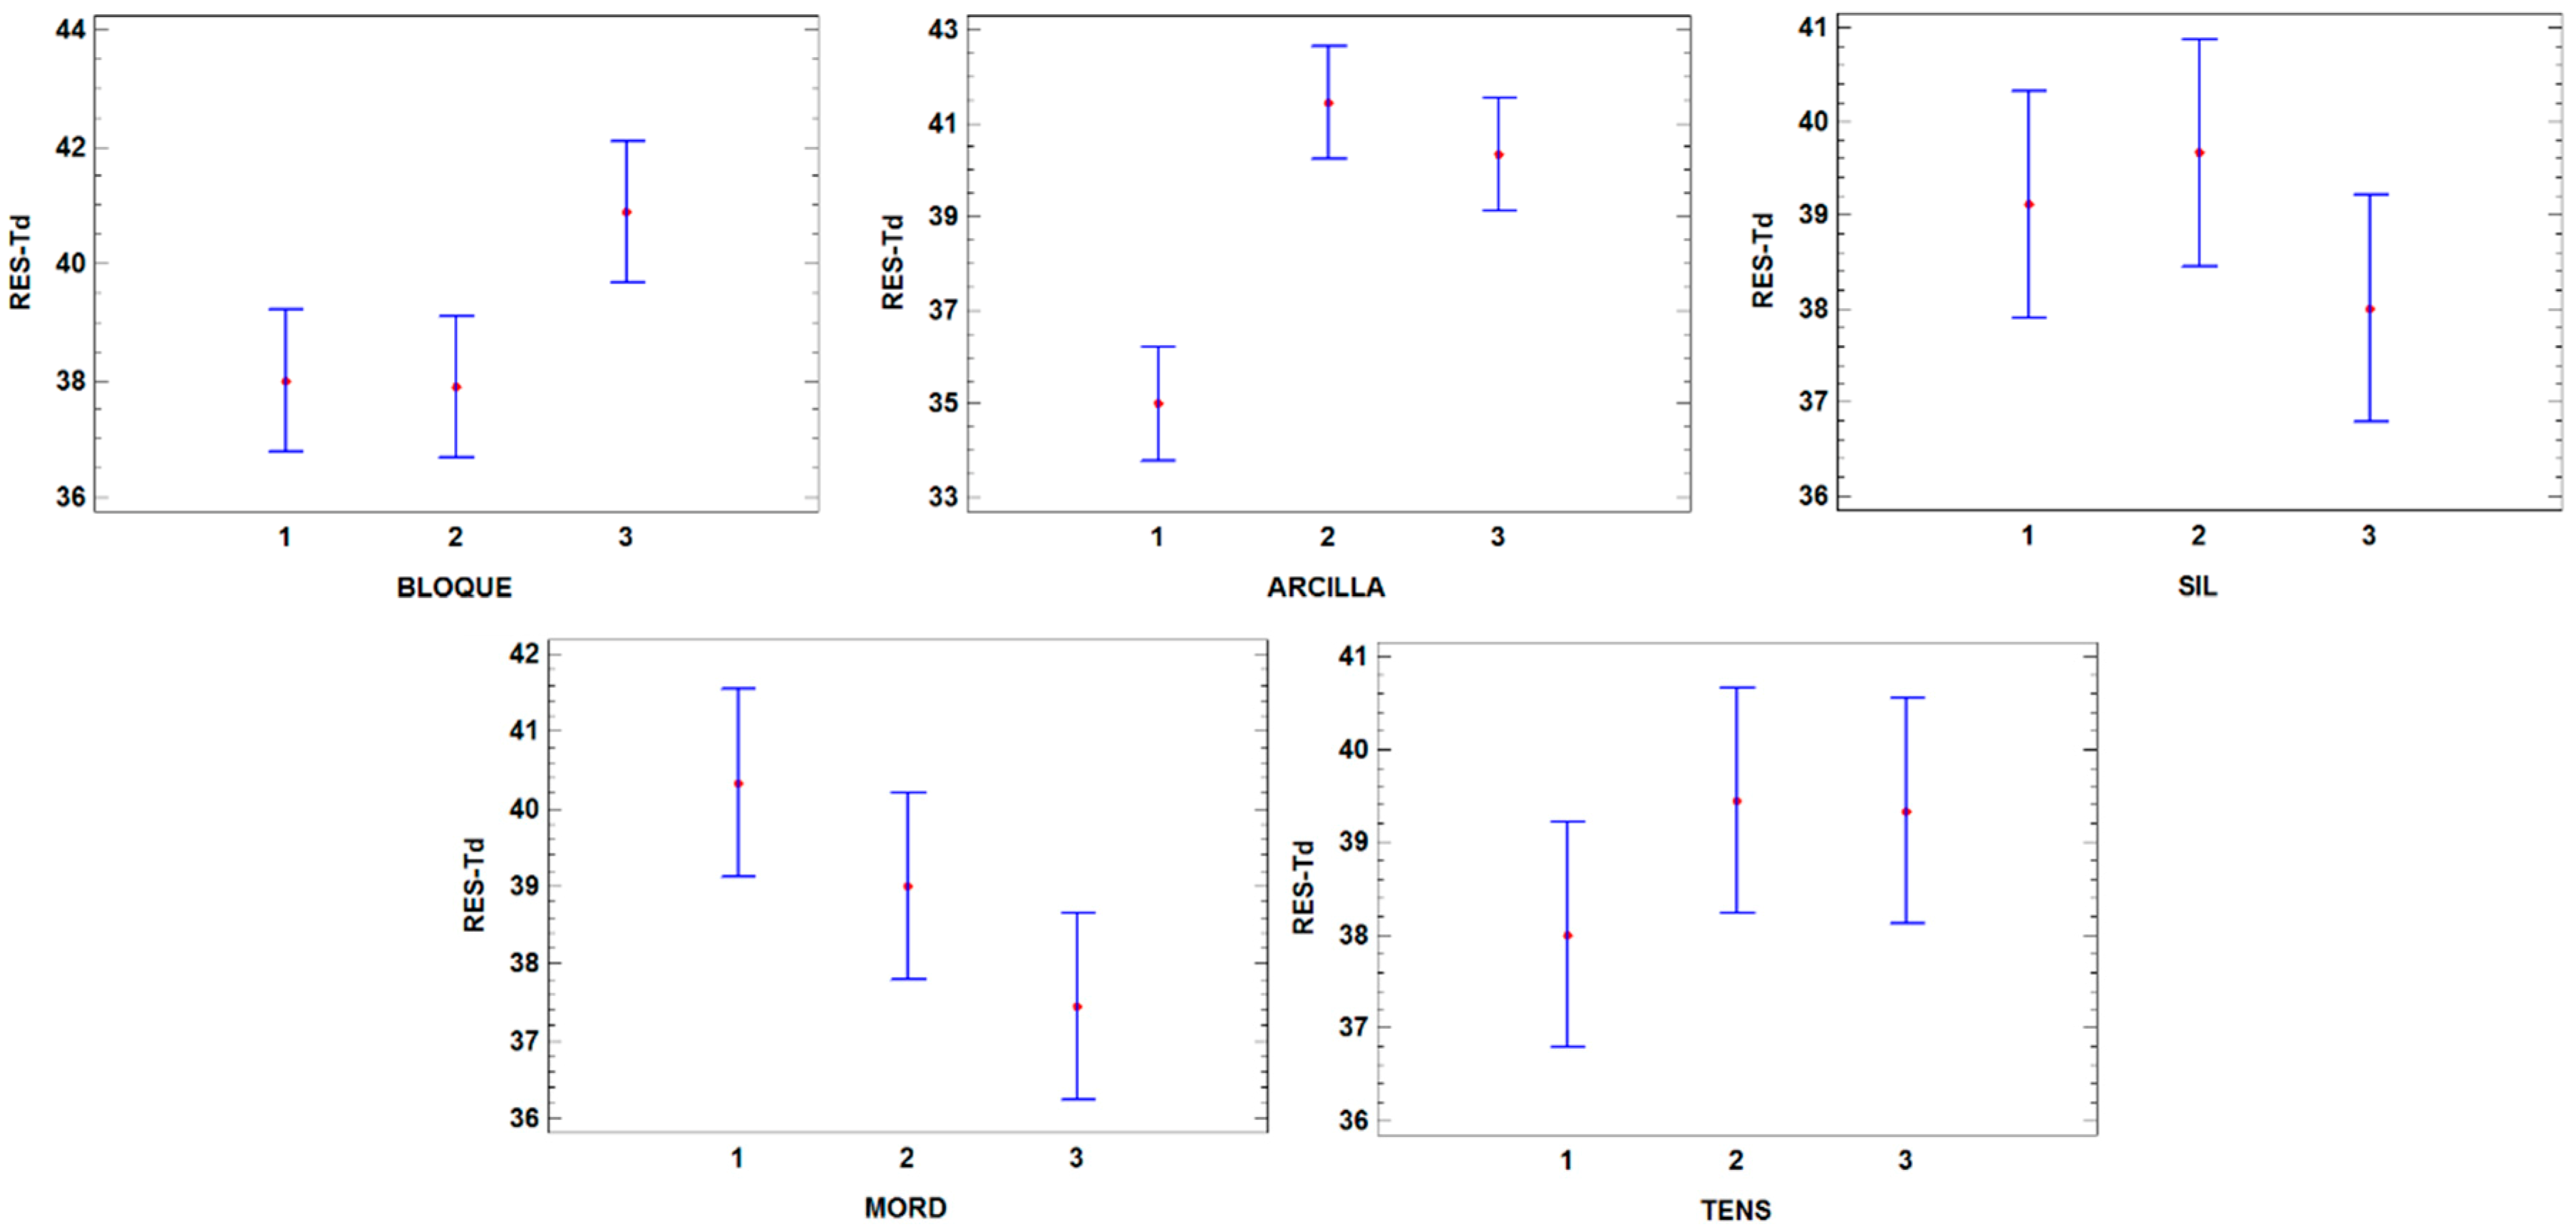
Statistical analysis was performed by including three blocks including one per natural dye: 1-NG, 2-NO, and 3-NR. The Fisher LSD mediums from each factor were represented (Figure 9) and no differences were found between NG and NO. However, using NR proved better for obtaining the maximum Td in the bio-composites. The same behavior was observed in our previous study, but the differences between the natural dyes were too close to be significant because the LSD intervals show little overlap. In this study, the gap between the LSD intervals was clear and bigger than before. This result reinforces the assumption that the betanin is in the dye in which the best biocomposites thermal properties were obtained. Other important findings comparing the previous study include the influence in the mordant salt incorporation, and the addition moment with this component. In our previous results, the mordant salt had no significant effect. However, in view of these results, and in order to obtain optimal thermal properties, we recommend using the mordant salt with the hydrotalcite clay, either calcined or not, before the dye exchange. Moreover, silane should be used after dye adsorption, even though this factor, like the surfactant, is not significant. Surfactant and Silane interactions were significant and negative when they were added together and before the natural dye. For that reason, the recommendation is not to use these components together or use them in different moments after and before the dye adsorption.
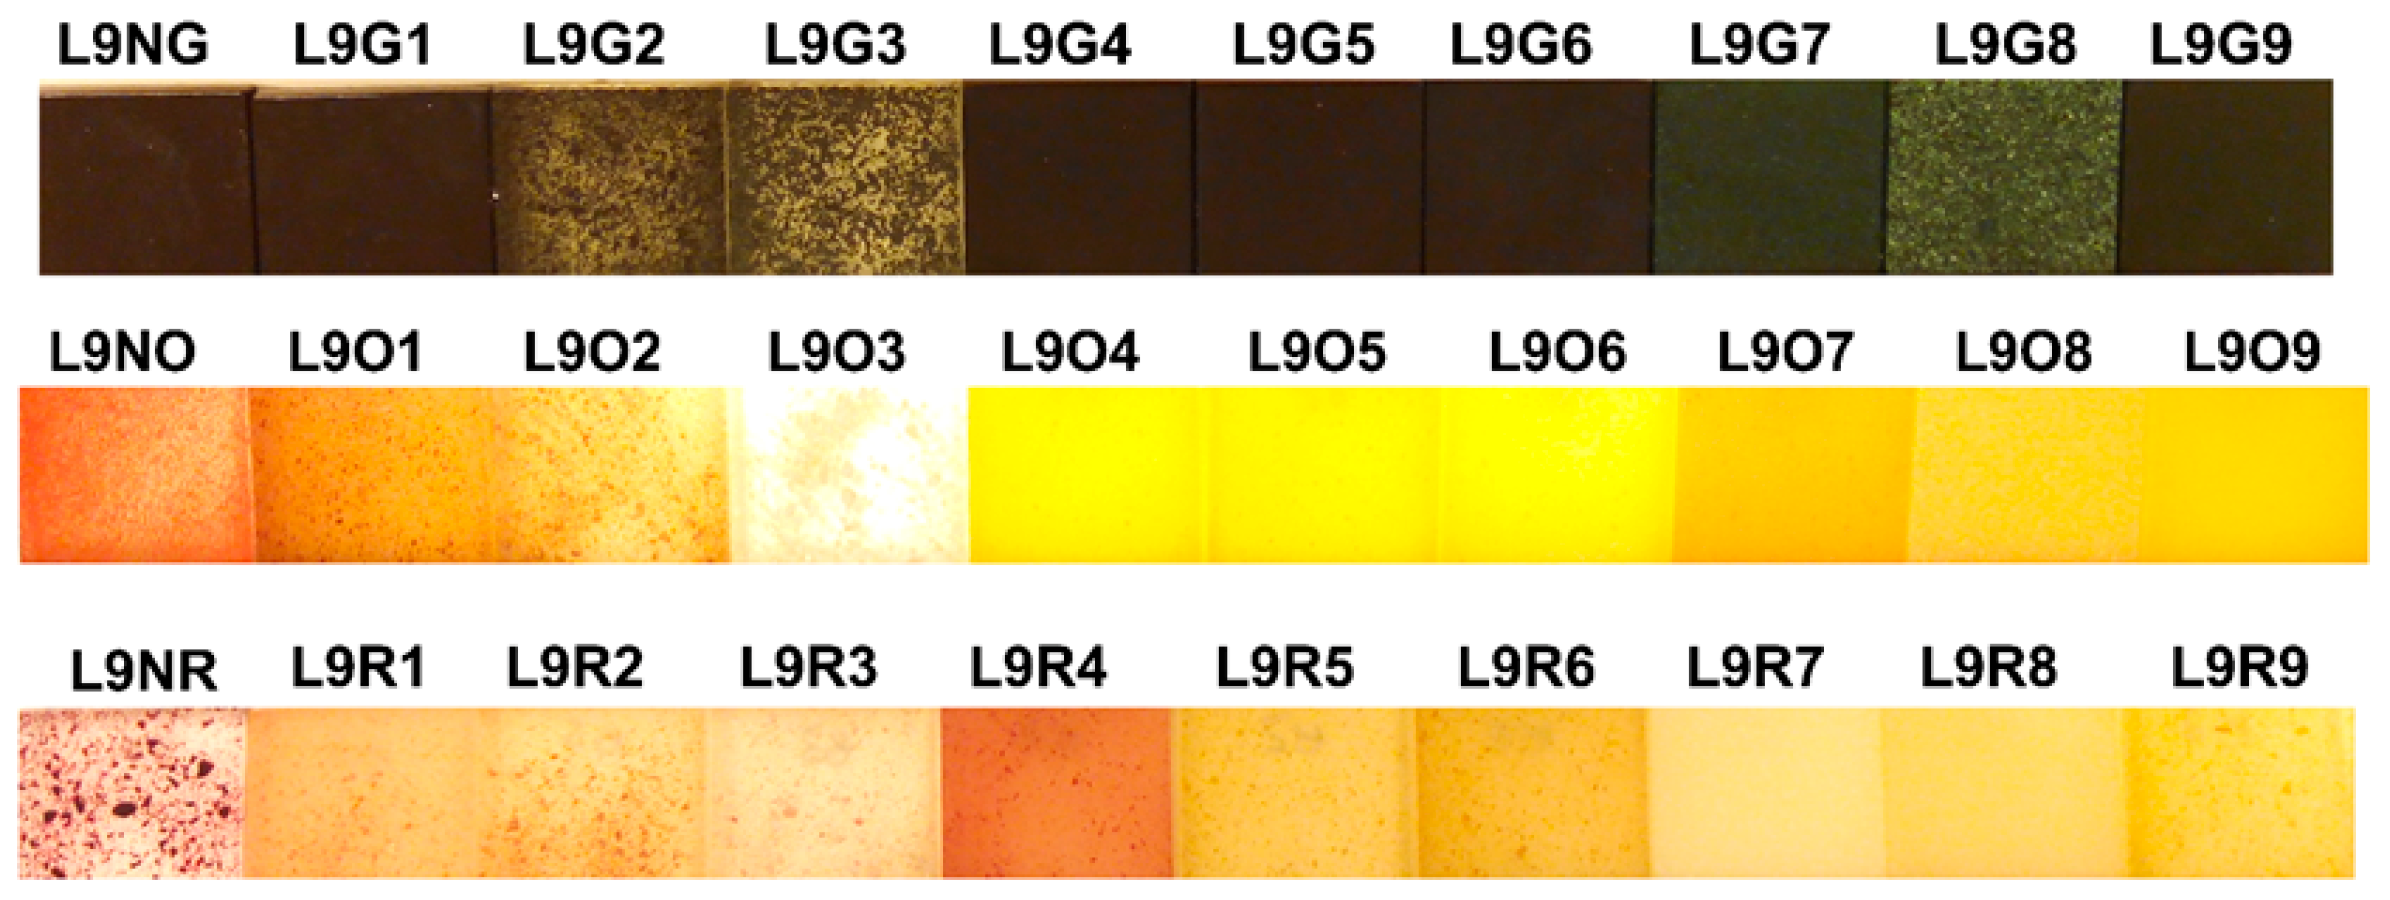
3.5. Color Fastness

When the same natural dyes were used, significant color changes and different textures in the bio-composites were observed, according to the hybrid pigment agglomeration due to the various synthesis conditions employed (Figure 10).
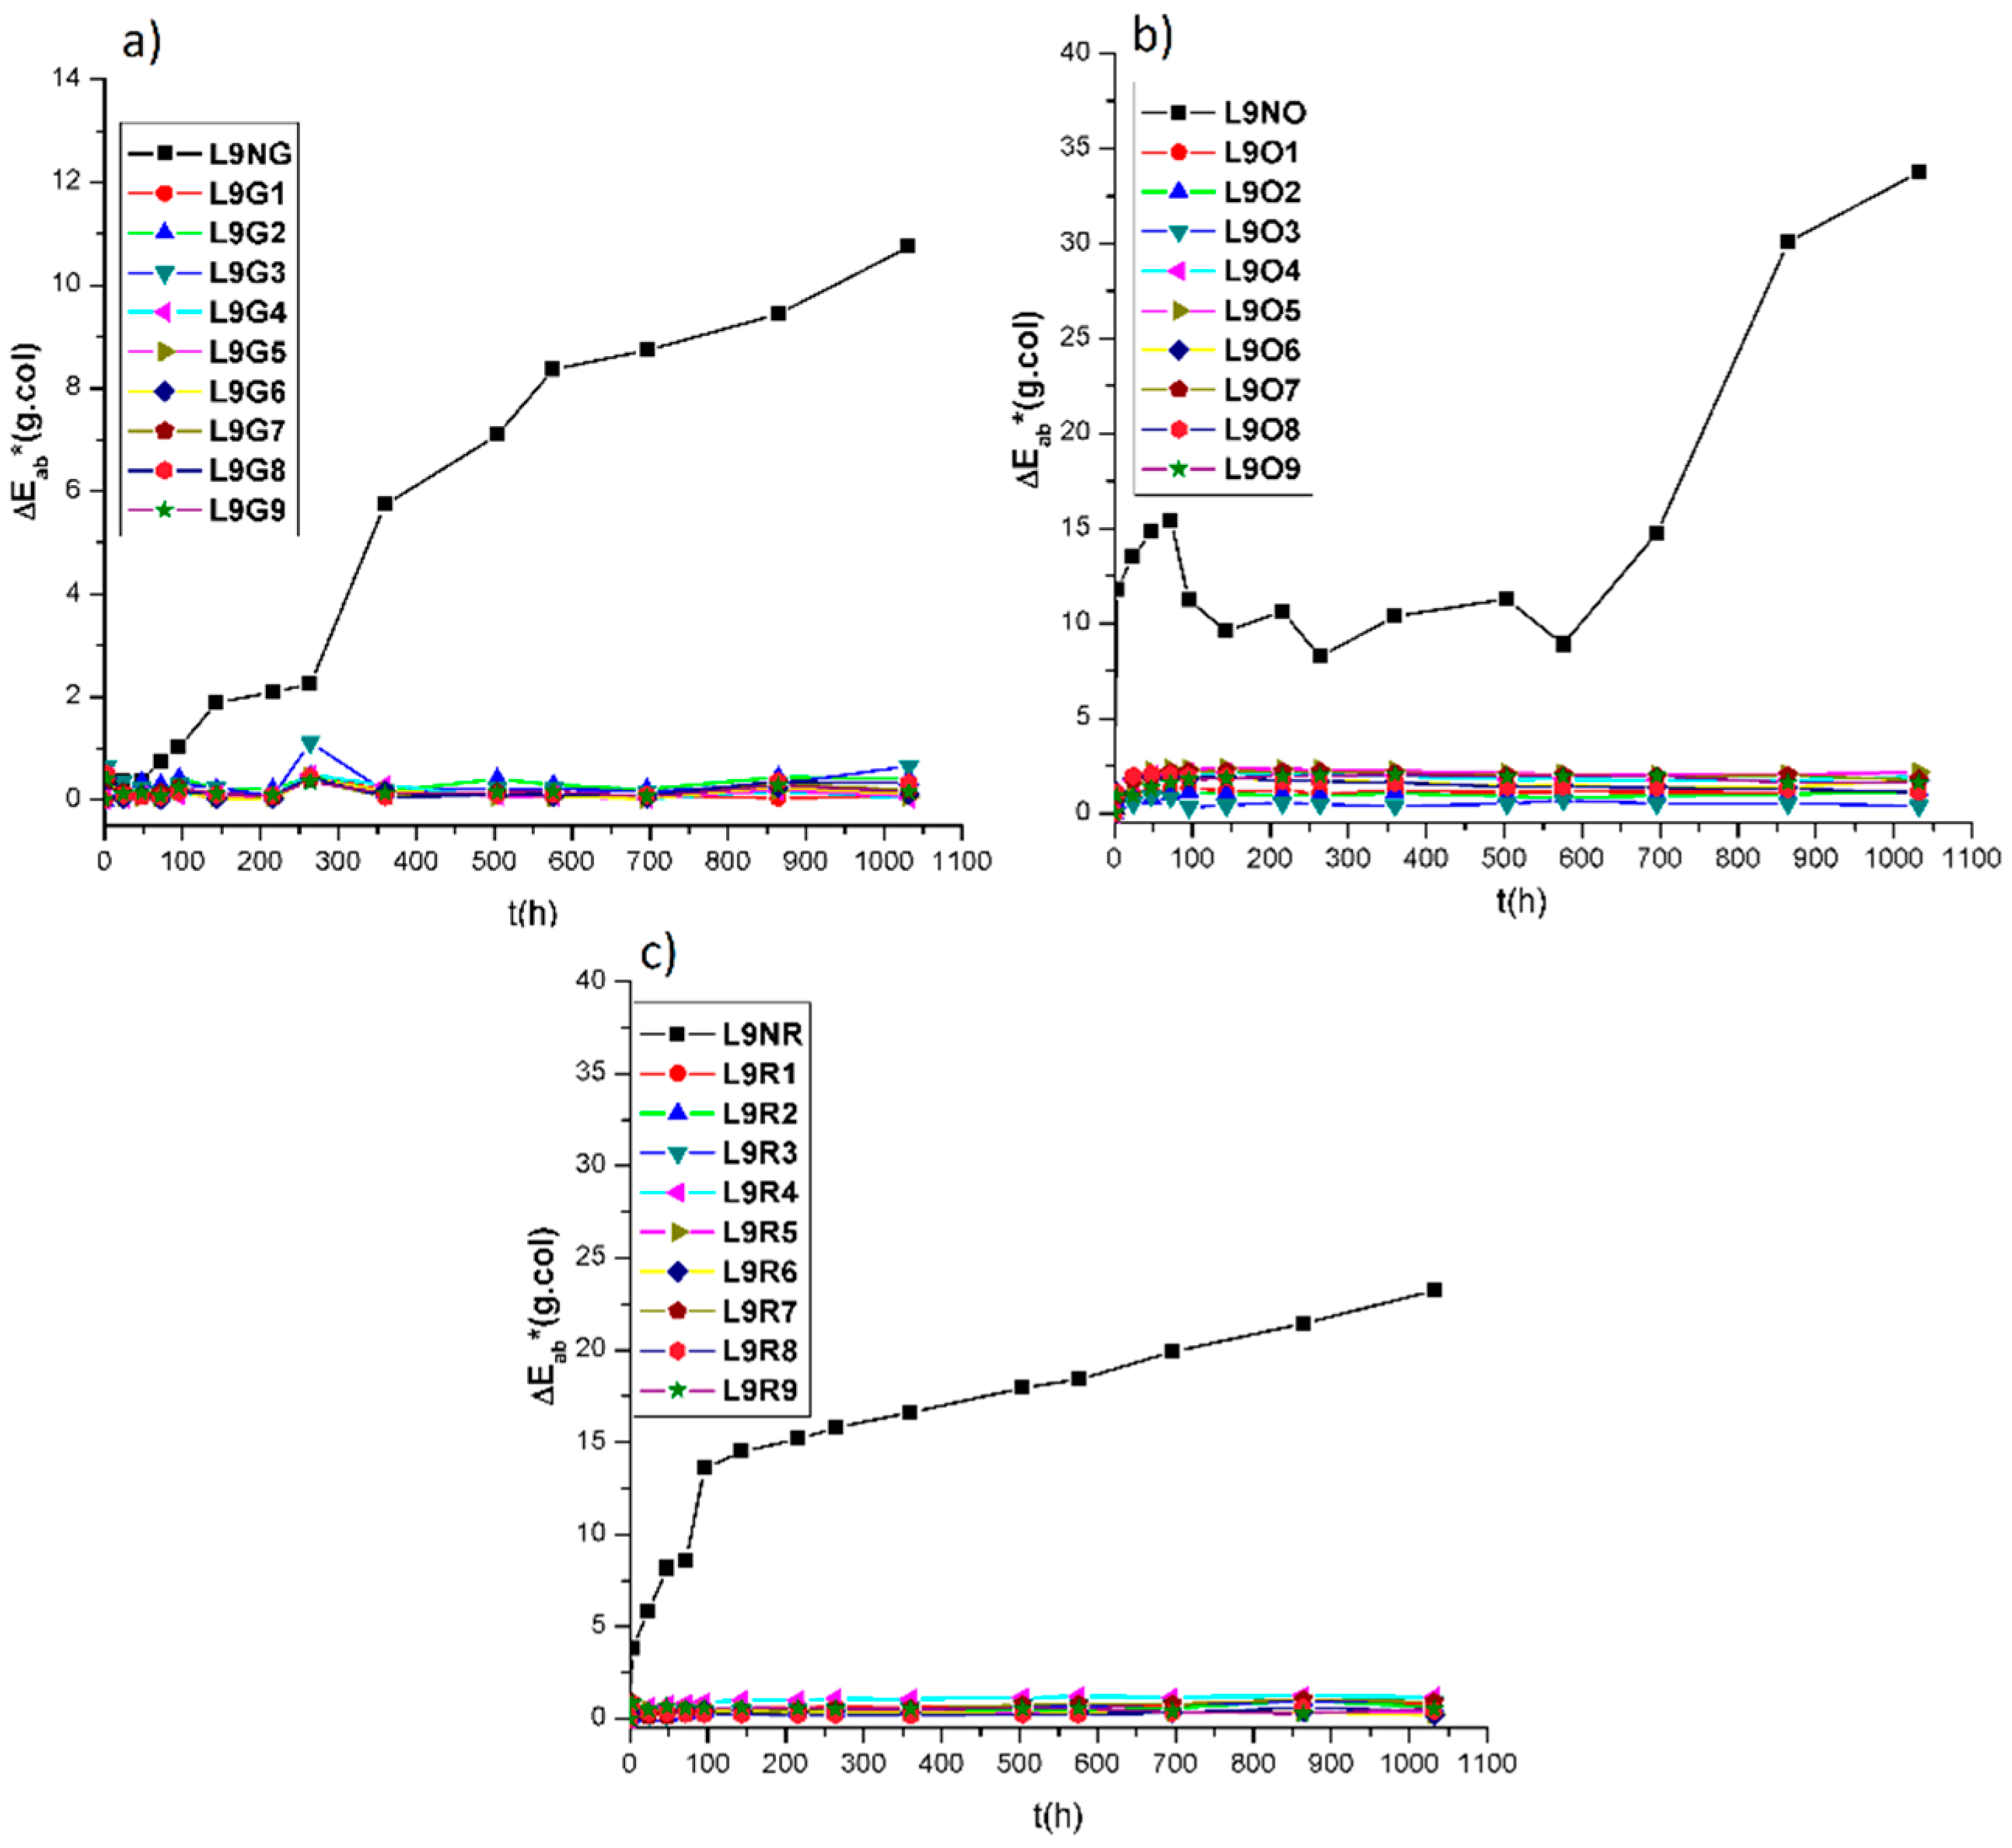
The aging test was controlled by taking color measurements from t0 (initial) using the samples with the 10% hybrid pigment or the original dyes, and not just 5% as in our previous work. We increased the hybrid pigment content because we want to test the new samples in the most unfavorable conditions, with more agglomeration and more natural dye to degradation and loose color properties at different times ti of light exposure. The spectral reflection factors of each sample ρ (%) were measured and used to calculate the CIELAB values, and also color differences by taking the t0 samples colors as references. As 
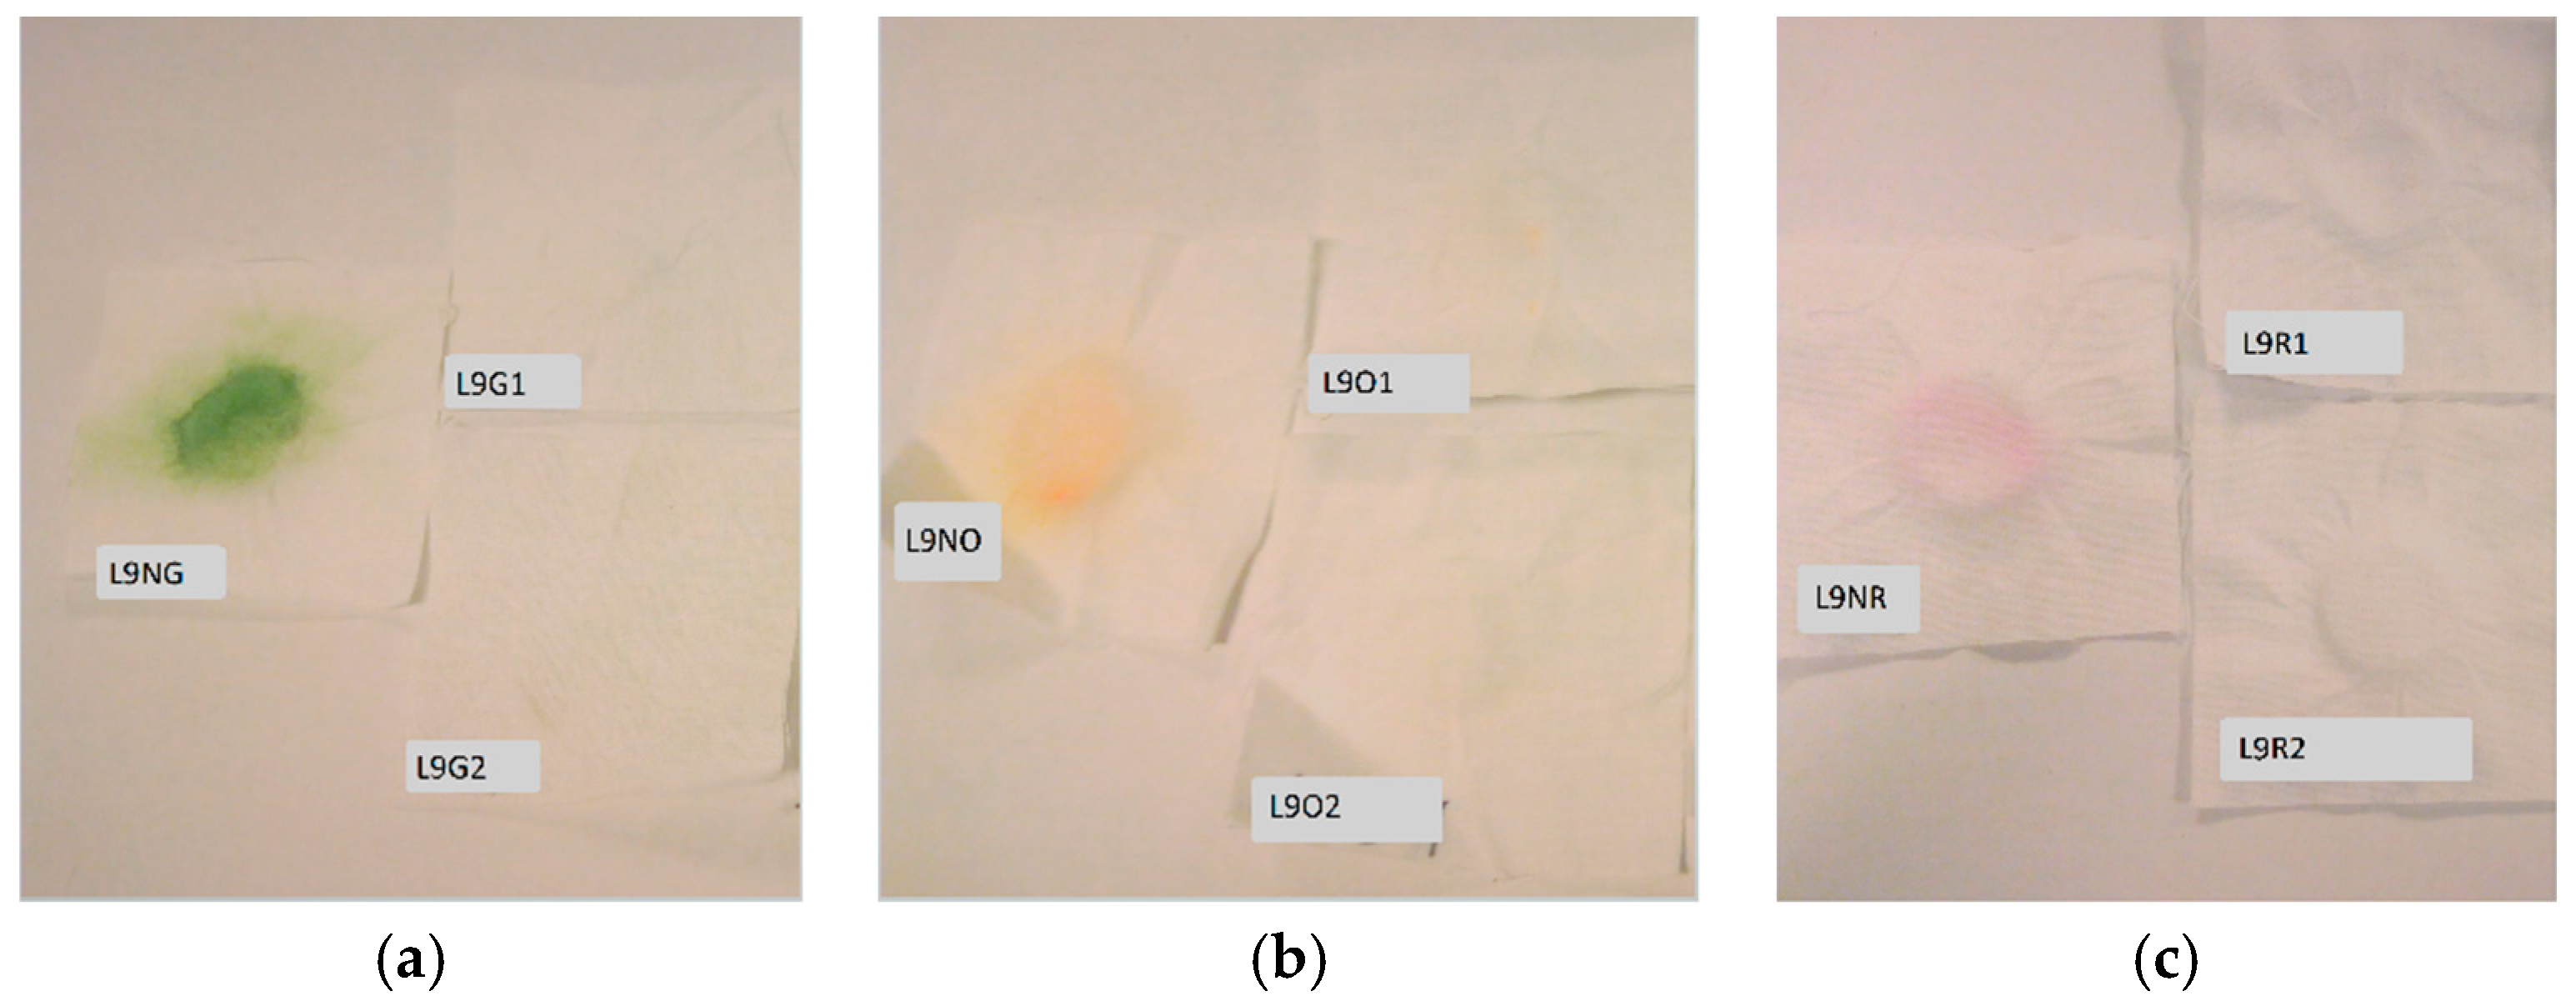
Figure 11 shows, the color UV–Vis fastness of all the natural dyes increased when used as hybrid pigments with both nano-clays. The color differences calculated as ΔEab* (g.col) were significantly bigger for the samples with the original natural dyes, and the differences were bigger than using 5% in our previous results. For 30 min, the color differences of the samples with the original dyes were bigger than 2ΔEab* units, which corresponds to a marked visible change for the human eye.
We expected significant differences with surfactant and nano-clay levels. However, reinforcement depended neither on the addition moment of the modifiers or the nano-clay previously employed. The hybrid pigment increment decreases the differences between the studied samples. The only significant differences were detected from the natural dye source. Figure 12 illustrates how the biggest color differences were obtained using the NO dye, which is followed by the NR dye. The samples with the hybrids pigments from NG were those with the best colorfastness values instead of the NR samples, as with the experiments with 5%. When working with bio-composites with high pigment content, the best colorfastness is going to show using chlorophyll dye.

3.6. Tests for Color Fastness-Part X12: Color Fastness to Rubbing

The last test to be run with the bio-composites was the wet rub-fastness test. The three samples colored using the original natural dyes showed poor wet rub-fastness, which was expected from the technical specification of these structures. The cotton tests were visibly colored/stained when the test was run using samples from the original dyes (Figure 13). There were no visible signs from dye migration in any sample when the test was done using the hybrid pigments from all the experimental conditions. This would explain the maximum fastness values (5) when a standard gray scale was included in all the bio-composites with hybrid pigments. The worst values were obtained from the samples with the original natural dyes (Table 7). One disadvantage of applying natural dyes to an epoxy bio-resin is the wet migration problem, which disappears when they are incorporated into any of the selected nano-clays, independently of the established synthesis conditions.

4. Conclusions

We have proven the following nano-clay structural changes: the interlaminar/basal space changed under almost all the synthesis conditions, but increased in both the nano-clay structures depending on the synthesis conditions. The hydrotalcite changes occurred on the nano-clay surface when replacing part of the carbonate anions. These effects became more evident when the calcined clay was modified before the dye exchange, and the nano-clay structure reconstruction was proven under all the synthesis conditions. The montmorillonite changes were more pronounced when modifiers were used before the natural dye was incorporated. Bands appeared at 1190 and 1110 cm−1 when the mordant salt was used because of nano-clay–mordant–dye interactions.
The statistical design was applied to the experiments to discover the best synthesis conditions. The dye-adsorbed changes that depended on the synthesis conditions reached up to 100%. The Td of the three natural dyes and the bio-resin increased under all the synthesis conditions. This increment became more marked, according to the synthesis conditions. The reinforcement of the stability of the three natural dyes to UV–Vis radiation exposure was also proven, and the migration of these three dyes from the bio-resin to wet ribbing was avoided. Optimal hybrid pigment properties were achieved using hydrotalcite (calcined or not) and three structural modifiers: surfactant and mordant before the natural dye, and before or after the silane agent. These hybrid pigments were optimized for other industrial applications, such as thermoplastic biopolymers for 3D printing filaments, packaging, coatings, inks, etc., by taking advantage of a wide natural color range and improved fastness properties.

5. Patents

A patent has been licensed from the results obtained in this study entitled “Procedure for Optimizing the Synthesis of Hybrid Nanopigments” [22].

Author Contributions

Writing-Original Draft Preparation, B.M.-V.; Methodology, J.J., E.P. and B.M.-V.; Software, J.J. and B.M.-V.; Validation, F.M.M.-V. and F.C.; Formal Analysis, F.M.M.-V., F.C. and B.M.-V.; Investigation, E.P. and B.M.-V.; Resources, F.M.M.-V.; Data Curation, B.M.-V. and J.J.; Writing-Review & Editing, E.P. and B.M.-V.; Supervision, F.M.M.-V. and F.C.; Project Administration, F.M.M.-V., Funding Acquisition, F.M.M.-V., F.C.

Funding

This research was funded by Spanish Agencia Estatal de Investigación (AEI) and the European Union (FEDER funds) (contract MAT2016-77742-C2-1-P) and Spanish Ministry of Economy and Competitiveness (project DPI2015-65814-R).

Conflicts of Interest

The authors declare no conflict of interest.

References

  1. Rather, L.J.; Shabbir, M.; Bukhari, M.N.; Shahid, M.; Khan, M.A.; Mohammad, F. Ecological dyeing of Woolen yarn with Adhatoda vasica natural dye in the presence of biomordants as an alternative copartner to metal mordants. J. Environ. Chem. Eng. 2016, 4, 3041–3049. [Google Scholar] [CrossRef]
  2. Kilinc, M.; Canbolat, S.; Merdan, N.; Dayioglu, H.; Akin, F. Investigation of the color, fastness and antimicrobial properties of wool fabrics dyed with the natural dye extracted from the cone of Chamaecyparis lawsoniana. Procedia-Soc. Behav. Sci. 2015, 195, 2152–2159. [Google Scholar] [CrossRef]
  3. Chiari, G.; Giustetto, R.; Druzik, J.; Doehne, E.; Ricchiardi, G. Pre-columbian nanotechnology: Reconciling the mysteries of the maya blue pigment. Appl. Phys. A 2008, 90, 3–7. [Google Scholar] [CrossRef]
  4. Micó-Vicent, B.; Martínez-Verdú, F.M.; Novikov, A.; Stavitskaya, A.; Vinokurov, V.; Rozhina, E.; Fakhrullin, R.; Yendluri, R.; Lvov, Y. Stabilized Dye–Pigment Formulations with Platy and Tubular Nanoclays. Adv. Funct. Mater. 2018, 28, 1703553. [Google Scholar] [CrossRef]
  5. Kohno, Y.; Inagawa, M.; Ikoma, S.; Shibata, M.; Matsushima, R.; Fukuhara, C.; Tomita, Y.; Maeda, Y.; Kobayashi, K. Stabilization of a hydrophobic natural dye by intercalation into organo-montmorillonite. Appl. Clay Sci. 2011, 54, 202–205. [Google Scholar] [CrossRef] [Green Version]
  6. Kohno, Y.; Asai, S.; Shibata, M.; Fukuhara, C.; Maeda, Y.; Tomita, Y.; Kobayashi, K. Improved photostability of hydrophobic natural dye incorporated in organo-modified hydrotalcite. J. Phys. Chem. Solids 2014, 75, 945–950. [Google Scholar] [CrossRef] [Green Version]
  7. Sanchez-Garcia, M.D.; Lopez-Rubio, A.; Lagaron, J.M. Natural micro and nanobiocomposites with enhanced barrier properties and novel functionalities for food biopackaging applications. Trends Food Sci. Technol. 2010, 21, 528–536. [Google Scholar] [CrossRef]
  8. Salam, H.; Dong, Y.; Davies, I. Development of biobased polymer/clay nanocomposites: A critical review. In Fillers and Reinforcements for Advanced Nanocomposites; Elsevier: Amsterdam, The Netherlands, 2015; pp. 101–132. [Google Scholar]
  9. Micó-Vicent, B.; Jordán, J.; Martínez-Verdú, F.; Balart, R. A combination of three surface modifiers for the optimal generation and application of natural hybrid nanopigments in a biodegradable resin. J. Mater. Sci. 2017, 52, 889–898. [Google Scholar] [CrossRef]
  10. Baena Murillo, E.R.; Micó-Vicent, B.; Martínez-Verdú, F.M. Method for the Synthesis of Nanostructured Hybrid Pigments Having Properties that can be Syntonized. U.S. Patent WO2013110841A1, 1 August 2018. [Google Scholar]
  11. International Commission on Illumination; CIE 15: Technical Report: Colorimetry; The Federal Register: Washington, DC, USA, 2004.
  12. ISO 105-X12 Textiles–Tests for Colour Fastness–Part X12: Colour Fastness to Rubbing; International Organization for Standardization: Geneva, Switzerland, 2001.
  13. Pérez-Ramírez, J.; Abelló, S.; van der Pers, N.M. Memory Effect of activated Mg–Al hydrotalcite: In situ XRD studies during decomposition and gas-phase reconstruction. Chem. Eur. J. 2007, 13, 870–878. [Google Scholar] [CrossRef] [PubMed]
  14. Sommer, A.; Romero, A.; Fetter, G.; Palomares, E.; Bosch, P. Exploring and tuning the anchorage of chlorophyllin molecules on anionic clays. Catal. Today 2013, 212, 186–193. [Google Scholar] [CrossRef]
  15. Ma, Y.; Zhu, J.; He, H.; Yuan, P.; Shen, W.; Liu, D. Infrared investigation of organo-montmorillonites prepared from different surfactants. Spectrochim. Acta Part A Mol. Biomol. Spectrosc. 2010, 76, 122–129. [Google Scholar] [CrossRef] [PubMed]
  16. Liu, D.; Yuan, P.; Liu, H.; Cai, J.; Tan, D.; He, H.; Zhu, J.; Chen, T. Quantitative characterization of the solid acidity of montmorillonite using combined FTIR and TPD based on the NH3 adsorption system. Appl. Clay Sci. 2013, 80, 407–412. [Google Scholar] [CrossRef]
  17. Socrates, G. Infrared and Raman Characteristic Group Frequencies: Tables and Charts; John Wiley & Sons: New York, NY, USA, 2004. [Google Scholar]
  18. Serratos, I.N.; Rojas-González, F.; Sosa-Fonseca, R.; Esparza-Schulz, J.M.; Campos-Peña, V.; Tello-Solís, S.R.; García-Sánchez, M.A. Fluorescence optimization of chlorophyll covalently bonded to mesoporous silica synthesized by the sol–gel method. J. Photochem. Photobiol. A Chem. 2013, 272, 28–40. [Google Scholar] [CrossRef]
  19. Horuz, T.İ.; Belibağlı, K.B. Nanoencapsulation by electrospinning to improve stability and water solubility of carotenoids extracted from tomato peels. Food Chem. 2018, 268, 86–93. [Google Scholar] [CrossRef] [PubMed]
  20. Selvi, J.A.; Rajendran, S.; Sri, V.G.; Amalraj, A.J.; Narayanasamy, B. Corrosion inhibition by beet root extract. Port. Electrochim. Acta 2009, 27, 1–11. [Google Scholar] [CrossRef]
  21. Xie, W.; Gao, Z.; Pan, W.-P.; Hunter, D.; Singh, A.; Vaia, R. Thermal degradation chemistry of alkyl quaternary ammonium montmorillonite. Chem. Mater. 2001, 13, 2979–2990. [Google Scholar] [CrossRef]
  22. Micó-Vicent, B.; Martínez-Verdú, F.M. Procedure for Optimizing the Synthesis of Hybrid Nanopigments. U.S. Spanish Patent ES2568833A1, 4 May 2016. [Google Scholar]
Figure 1. The LSD Fisher means plot (95%) of the adsorption (ADS) differences depending on the levels of the factors: (a) Clay (1: M, 2: H, 3: HC); (b) Block (1: NG, 2: NO, 3: NR).
Coatings 09 00034 g001
Figure 2. Diffraction patterns of the hydrotalcite without calcining (H), the hydrotalcite after the calcination process, 3 h at 600 °C (HC), and the calcined hydrotalcite exchanged with the SDS surfactant (HC-SDS).
Coatings 09 00034 g002
Figure 3. The XRD diffraction patterns of the original hydrotalcite (H), the calcined hydrotalcite (HC), the hybrid pigments with (a) H and the chlorophyll natural dye (L9G4–L9G6), and with (b) HC (L9G7–L9G9).
Coatings 09 00034 g003
Figure 4. The XRD diffraction patterns of the original montmorillonite (M) and the hybrid pigments with M and the chlorophyll natural dye (L9G1–L9G3).
Coatings 09 00034 g004
Figure 5. The FTIR spectrum of the original montmorillonite sample (M), and M-modified with the CPB surfactant (MS).
Coatings 09 00034 g005
Figure 6. The FTIR spectra of the original montmorillonite sample (M), the original chlorophyll NG, and the M-hybrid pigments under different synthesis conditions with the NG dye (L9G1–L9G3).
Coatings 09 00034 g006
Figure 7. FTIR spectrum of the original hydrotalcite sample (H), the original chlorophyll NG, and the H-hybrid pigments under different synthesis conditions with the NG dye (L9G4–L9G9).
Coatings 09 00034 g007
Figure 8. Mass thermal degradation curves (mass (%)) and first derivate d(mass%), for the original bioresin (RES), and composites with 10% of nano-pigment loads from chlorophyll and hydrotalcite clay RES_(L9G4–9).
Coatings 09 00034 g008
Figure 9. Fisher LSD mediums with L9 factors, block, mordant, clay, and silane for the maximum Td.
Coatings 09 00034 g009
Figure 10. Maximum concentrated samples (10%) for the composite materials from the nano-pigments made by the L9 experiments with three natural dyes: NG, NO, and NR.
Coatings 09 00034 g010
Figure 11. The ΔEab*/g.col for the bio-composites with the three natural dyes NG (a), NO (b), and NR (c), and the nano-pigments synthesized under the L9 conditions.
Coatings 09 00034 g011
Figure 12. The means plot for composites color resistance (ΔEab*/g.col) according to dye (BLOCK): 1-NG; 2-NO; and 3-NR.
Coatings 09 00034 g012
Figure 13. Pictures of the standard cotton samples after the rub test tests (UNE EN ISO 105X12 [11]), using the composites colored by the original dyes: (a) NG, (b) NO, and (c) NR), or the hybrid pigments from the L9 synthesis conditions.
Coatings 09 00034 g013
Table 1. Taguchi’s L9 design for analyzing the time to add modifiers: (1) before; (2) after; or (3) absence; and the origin of nano-clays: (1) montmorillonite; (2) hydrotalcite; and (3) calcined hydrotalcite.
No.ClaySurfactantMordantSilane
11111
21222
31333
42123
52231
62312
73132
83213
93321
Table 2. Percentage of the dye adsorbed under different synthesis conditions with natural dyes chlorophyll (NG), beta-carotene (NO), and betanin.
%COL ADS
No. EXP 1NGNONR
1100.0081.1660.37
2100.0077.6061.17
3100.0078.9363.86
4100.0081.8166.43
599.2579.9165.34
6100.0083.1567.35
7100.0083.2067.14
8100.0085.1267.38
9100.0079.9366.38
1 The experimental conditions defined at L9 DoE.
Table 3. Variance analysis for ADD as a percentage of the dye exchanged from what was initially added during the synthesis process. Type III sum of squares.
SourceSum of Squaresfd a Mean SquareF-RateP-Value
Main effects
A:BLOCK5481.4622740.73960.710.0000
B:CLAY41.4842220.74217.270.0057
C:SURF1.2505420.625270.220.8056
D:MORD7.1055623.552781.250.3143
E:SIL7.1642723.582141.260.3115
RESIDUES45.6451162.85282
TOTAL (CORRECT)5584.1126
All the F-Ratios are based on the mean square from the residual error; a: freedom degrees.
Table 4. Summary of the main bands from the montmorillonite (M), chlorophyll dye (NG) samples [18], and the nano-pigments synthesized under the L8 and L9 experimental conditions.
ML9G1L9G2L9G3HL9G4L9G5L9G6L9G7L9G8L9G9
36353560355535553555===
3250==3064=====
2920*+++2920*+2924++29212921=
2850*+++2856======
16401639163816381637163016301630168316831683
1490=1367=
1085945======
1040785======
NGL9G1L9G2L9G3 L9G4L9G5L9G6L9G7L9G8L9G9
3400343034233443 ======
2912*+++ ======
2856*+++ ======
1730174817501749 =====1748
1720=== ======
1656=== ===168316831683
1630163916381638 163016301630===
1565=== ===156015601560
145014681469= *+14601460146014601460=
NEW L9G4L9G5L9G6L9G7L9G8L9G9
1748 1748
1460 1460
1195 1195 1195 11951195
1110 1110 1110−1110−1110
1064 *1064 1064
=: when the band position and intensity was the same; +: when band intensity increased; −: when lessened; *: stronger effect; and empty if there was not found.
Table 5. Summary of the main bands from the montmorillonite (M), β-carotene dye (NO) samples [19], and the nano-pigments synthesized under the L8 and L9 experimental conditions.
ML9O1L9O2L9O3HL9O4L9O5L9O6L9O7L9O8L9O9
36353635−3627−3627356035603560===
34503425−3426−342634523457−34573457−3495−34703458
32503064======
2920*+292029202920292029202920292029202920
2850*++28502856*285028502850−285028502850
1640−1637−16441637162616191615−162816281630
1490−1488−1488=1367===−1363−1365−1365
10851084945======
10401040785======
NOL9O1L9O2L9O3 L9O4L9O5L9O6L9O7L9O8L9O9
34163425−3426−3426 3457−34573457−3495−34703458
2920*+29202920 292029202920292029202920
2850*++2850 *285028502850−285028502850
1632−1637−1644 162616191615−162816281630
1156−1160−1118−1118 ======
1079=== ======
1024104010401040 == = = = =
NEWL9O1L9O2L9O3 L9O4L9O5L9O6L9O7L9O8L9O9
1470−1470−1470 147014701470 14701470
1177111711181118 1210*1210 −121012101210
1110 1110 1110 11101110
=: when the band position and intensity was the same; +: when band intensity increased; −: when lessened; *: stronger effect; and empty if there was not found.
Table 6. Summary table of the main bands from montmorillonite (M), betanine dye (NR) samples [20], and nano-pigments synthesized under L8 and L9 experimental conditions.
ML9R1L9R2L9R3HL9R4L9R5L9R6L9R7L9R8L9R9
36353620363436313560355235583558===
32503064======
2920+29322927*2927292029172917292229282930−2920
285028532850*+28562850285028472855+=
1640−1629−162716241637162616261624163116341633
1490=1367−1372==−1367−1360=
1085−1117−11171080945−921−918−856−847−840−845
10401041785======
915915670670670673635−672−682
NRL9R1L9R2L9R3 L9R4L9R5L9R6L9R7L9R8L9R9
3420340534103416 345234653445346534453432
2935+29322927*2927 29172917292229282930−2920
285028532850*+ 2850285028472855+=
1630−1629−16271624 162616261624163116341633
1460=−1469−1467 14671467146614691466
1420=== 1410===1408=
1156=== 115211521154115011581158
1076=== ======
1024=== 11191024111411221122
NEWL9R1L9R2L9R3 L9R4L9R5L9R6L9R7L9R8L9R9
1117111711171112 1110 111311141114
872 872856867847840842
620 620 617
=: when the band position and intensity was the same; +: when band intensity increased; −: when lessened; *: stronger effect; and empty if there was not found.
Table 7. The gray standard values from the stained cotton samples after running tests for color fastness—Part X12: Color fastness to rubbing (ISO 105-X12:2016 [12]), using the bio-composites colored with the original dyes (NG, NO, and NR), and the hybrid pigments from the L9 conditions.
CodeValueCodeValueCodeValue
NG1NO1–2NR1–2
L9G15L9O15L9R15
L9G25L9O25L9R25
L9G35L9O35L9R35
L9G45L9O45L9R45
L9G55L9O55L9R55
L9G65L9O65L9R65
L9G75L9O75L9R75
L9G85L9O85L9R85
L9G95L9O95L9R95

