
Discharge Characteristics and Mechanisms of Electrolytic Discharge Processing by Jet Mask

1
School of Naval Architecture and Ocean Engineering, Guangzhou Maritime University, Guangzhou 510725, China
2
School of Electro-Mechanical Engineering, Guangdong University of Technology, Guangzhou 510006, China
*
Author to whom correspondence should be addressed.
Coatings 2023, 13(11), 1933; https://doi.org/10.3390/coatings13111933
Submission received: 9 October 2023
/
Revised: 4 November 2023
/
Accepted: 10 November 2023
/
Published: 12 November 2023
(This article belongs to the Special Issue Heat Treatment and Surface Engineering of Tools and Dies)
Abstract
:As a novel microfabrication method, electrochemical discharge machining has remarkable effects on the forming and processing of brittle and hard materials and non-conductive materials, but little research has been done on the electrochemical discharge mode in the jet state. To fulfil the potential of this technology, innovative research on the discharge characteristics and mechanism of electrochemical discharge machining in the jet mask is proposed. A high-speed camera observation experiment was set up to record the process of the jet flow column discharge formation and penetration. Changes in the electric field of the electrolytic jet channel were analysed by simulation software, and the morphology of the machined micro-pits was observed using a microscope. A mathematical derivation of the dielectric electric field in the gas–liquid two-phase jet column reveals the mechanism of discharge channel formation in the jet state. The experiments show that when the processing voltage is 400 V, a stable continuous spark appears, realizing the unique characteristics of a large-gap long-distance discharge and a flat small circle-shaped discharge mark produced at the bottom of the crater. The actual field strength within the bubble of this model obtained by mathematical derivation is approximately 61.5 kV/cm greater than the critical field strength for air bubble breakdown in the standard state, where bubble breakdown occurs in the discharge.
1. Introduction
Electrochemical discharge machining (ECDM) is an emerging non-traditional hybrid micromachining method that can be used for subtractive machining of all materials, regardless of their thermal and electrical conductivity, hardness, and reflectivity [1,2,3]. ECDM integrates the characteristics of two non-traditional machining processes, namely electrical discharge machining (EDM) and electrochemical machining (ECM). The combined effect of EDM and electrochemical etching results in a 30%–40% increase in processing rates compared to electrochemical machining (ECM) and electrodeposition machining alone [4,5].
Applying a potential in electrolytic processing leads to the hydrolysis of the electrolyte. It subsequently releases bubbles of oxygen and hydrogen from the auxiliary and tool electrodes, respectively [6,7,8]. The coalescence of the hydrogen bubbles completely covers the surface of the tool electrode with an insulating gas film. Furthermore, due to the high electric potential, the insulating gas film breaks down, which triggers a spark discharge from the tool electrode. The heat energy released by the spark discharge removes unwanted material from the working surface through melting and vaporisation phenomena [9,10].
According to Singh and Dvivedi, tool electrodes with microcavities help in the growth of stable and thin bubbles on the bottom surface of the tool electrode [11,12,13,14,15]. To control the discharge impact during electrochemical discharge processing, scholars have provided some modifications in tool configurations by employing composite-based tool electrodes and using different dielectrics based on a mixture of biodegradable content and nanopowder [16,17,18,19,20].
Although electrochemical processing has good prospects for application, most of the research is still in the early exploration stage and has less application in production practice. This is mainly because there are many factors affecting the electrochemical processing process, as mentioned above, and the grasp of the influence of these factors on the processing law is not comprehensive enough [21,22,23].
The discharge mechanism and processing effect of electrochemical discharge machining have been studied to varying degrees, but little research has been done on jet-electrochemical discharge machining.
ECDM is where the tool is immersed in the electrolyte, and the machining voltage is relatively small. Jet-ECDM is where the electrolyte is sprayed from the tool nozzle onto the workpiece. The tool nozzle is not immersed in the electrolyte. Jet-ECDM is a combination of microfine electrolysis and liquid jetting. Under an applied high voltage, when the gap is filled with a conductive medium, the discharge breakdown becomes very easy, forming a stable discharge channel and enabling large-gap long-distance discharge. Jet-ECDM does not have the process of bubble formation of air film; the discharge is not caused by the breakdown of the air film and does not have the typical prerequisites for ECDM.
There is a clear difference in the modelling of Jet-ECDM and ECDM, so detailed documentation of the Jet-ECDM discharge phenomenon is required. The discharge principle is investigated by analysing the morphological excavation characteristics of the machined workpiece, combined with simulation modelling and mathematical derivation. This paper is dedicated to the above, providing a new methodological and theoretical basis for ECDM.
2. Discharge Experimental Research on Jet-ECDM
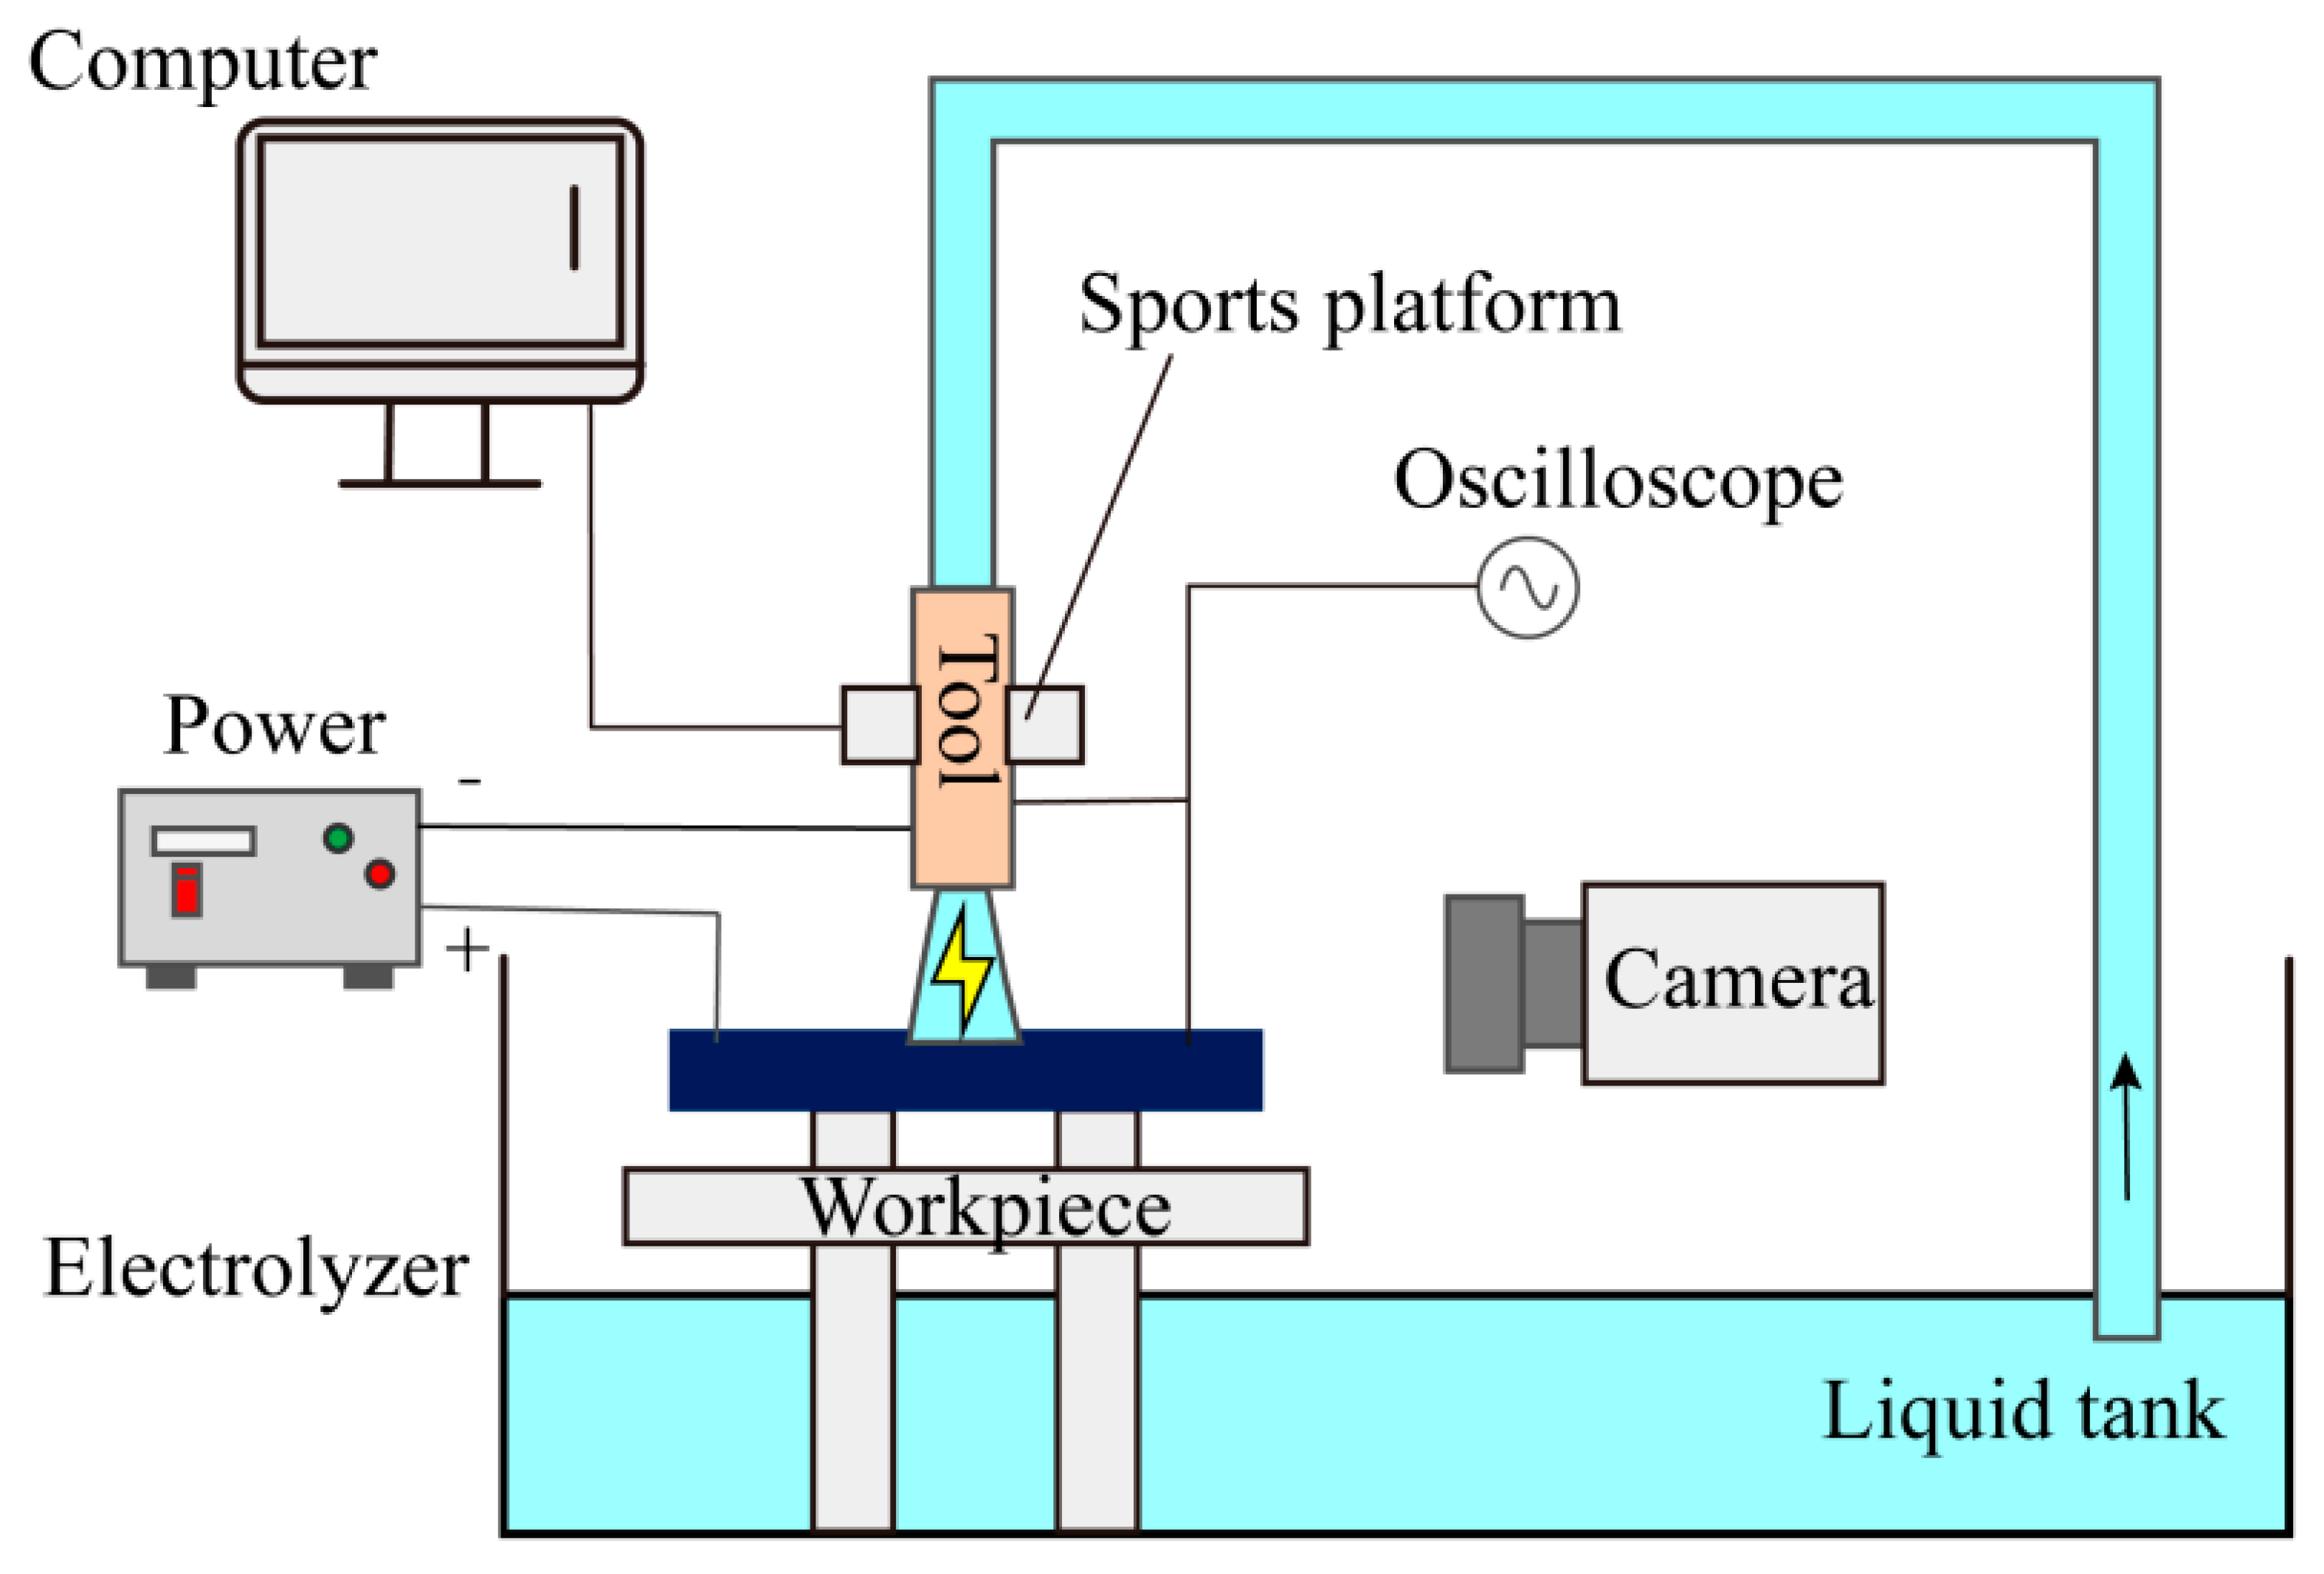
Figure 1 shows the experimental setup of the Jet-ECDM. The machine consists mainly of the machine linear module, the work feeder with a servo motor, and the worktable. The machine is mounted on a rigid marble base, which has a large vibration resistance, poor thermal conductivity, and a coefficient of thermal expansion. To prevent small vibrations in the surroundings from being transmitted to the machine, an adjustable damping pad is installed under the base.
The machine control section mainly consists of servo motors, a miniature encoder system, a motion control card, and the virtual instrument development platform. The human–machine interface was programmed using LabVIEW [24,25,26].
The electrolyte circulation system consists of a circulation tube, pressure control valve, pressure gauge, and reservoir and is an important part of the Jet-ECDM equipment. The pulsed high-voltage power supply has excellent characteristics such as reliable accuracy and outstanding stability. Under the control of the human–machine interaction, the sports platform can be moved along the x, y, and z axes to complete the precise machining of the workpiece. At the same time, fluctuations in current and voltage during online machining can be monitored in real-time with a digital oscilloscope.
2.1. Discharge Phenomena during Jet-EDCM
To study the discharge characteristics as well as to ensure the accuracy of the experiment, the stainless steel workpiece was first pretreated by washing the workpiece surface with acetone, alcohol, and deionized water, in turn, and drying it on a dryer to remove impurities from the workpiece surface. The experimental design of the Jet-ECDM was carried out under the following processing conditions: (1) voltage frequency of 1 kHz, (2) voltage duty cycle of 50%, (3) processing time of 30 s, (4) electrolyte mass concentration of 15%, (5) applied voltage of 400 V, (6) processing gap (i.e., nozzle to workpiece distance) of 2.5 mm, (7) mask plate diameter of 500 μm, and (8) mask plate thickness of 50 μm.
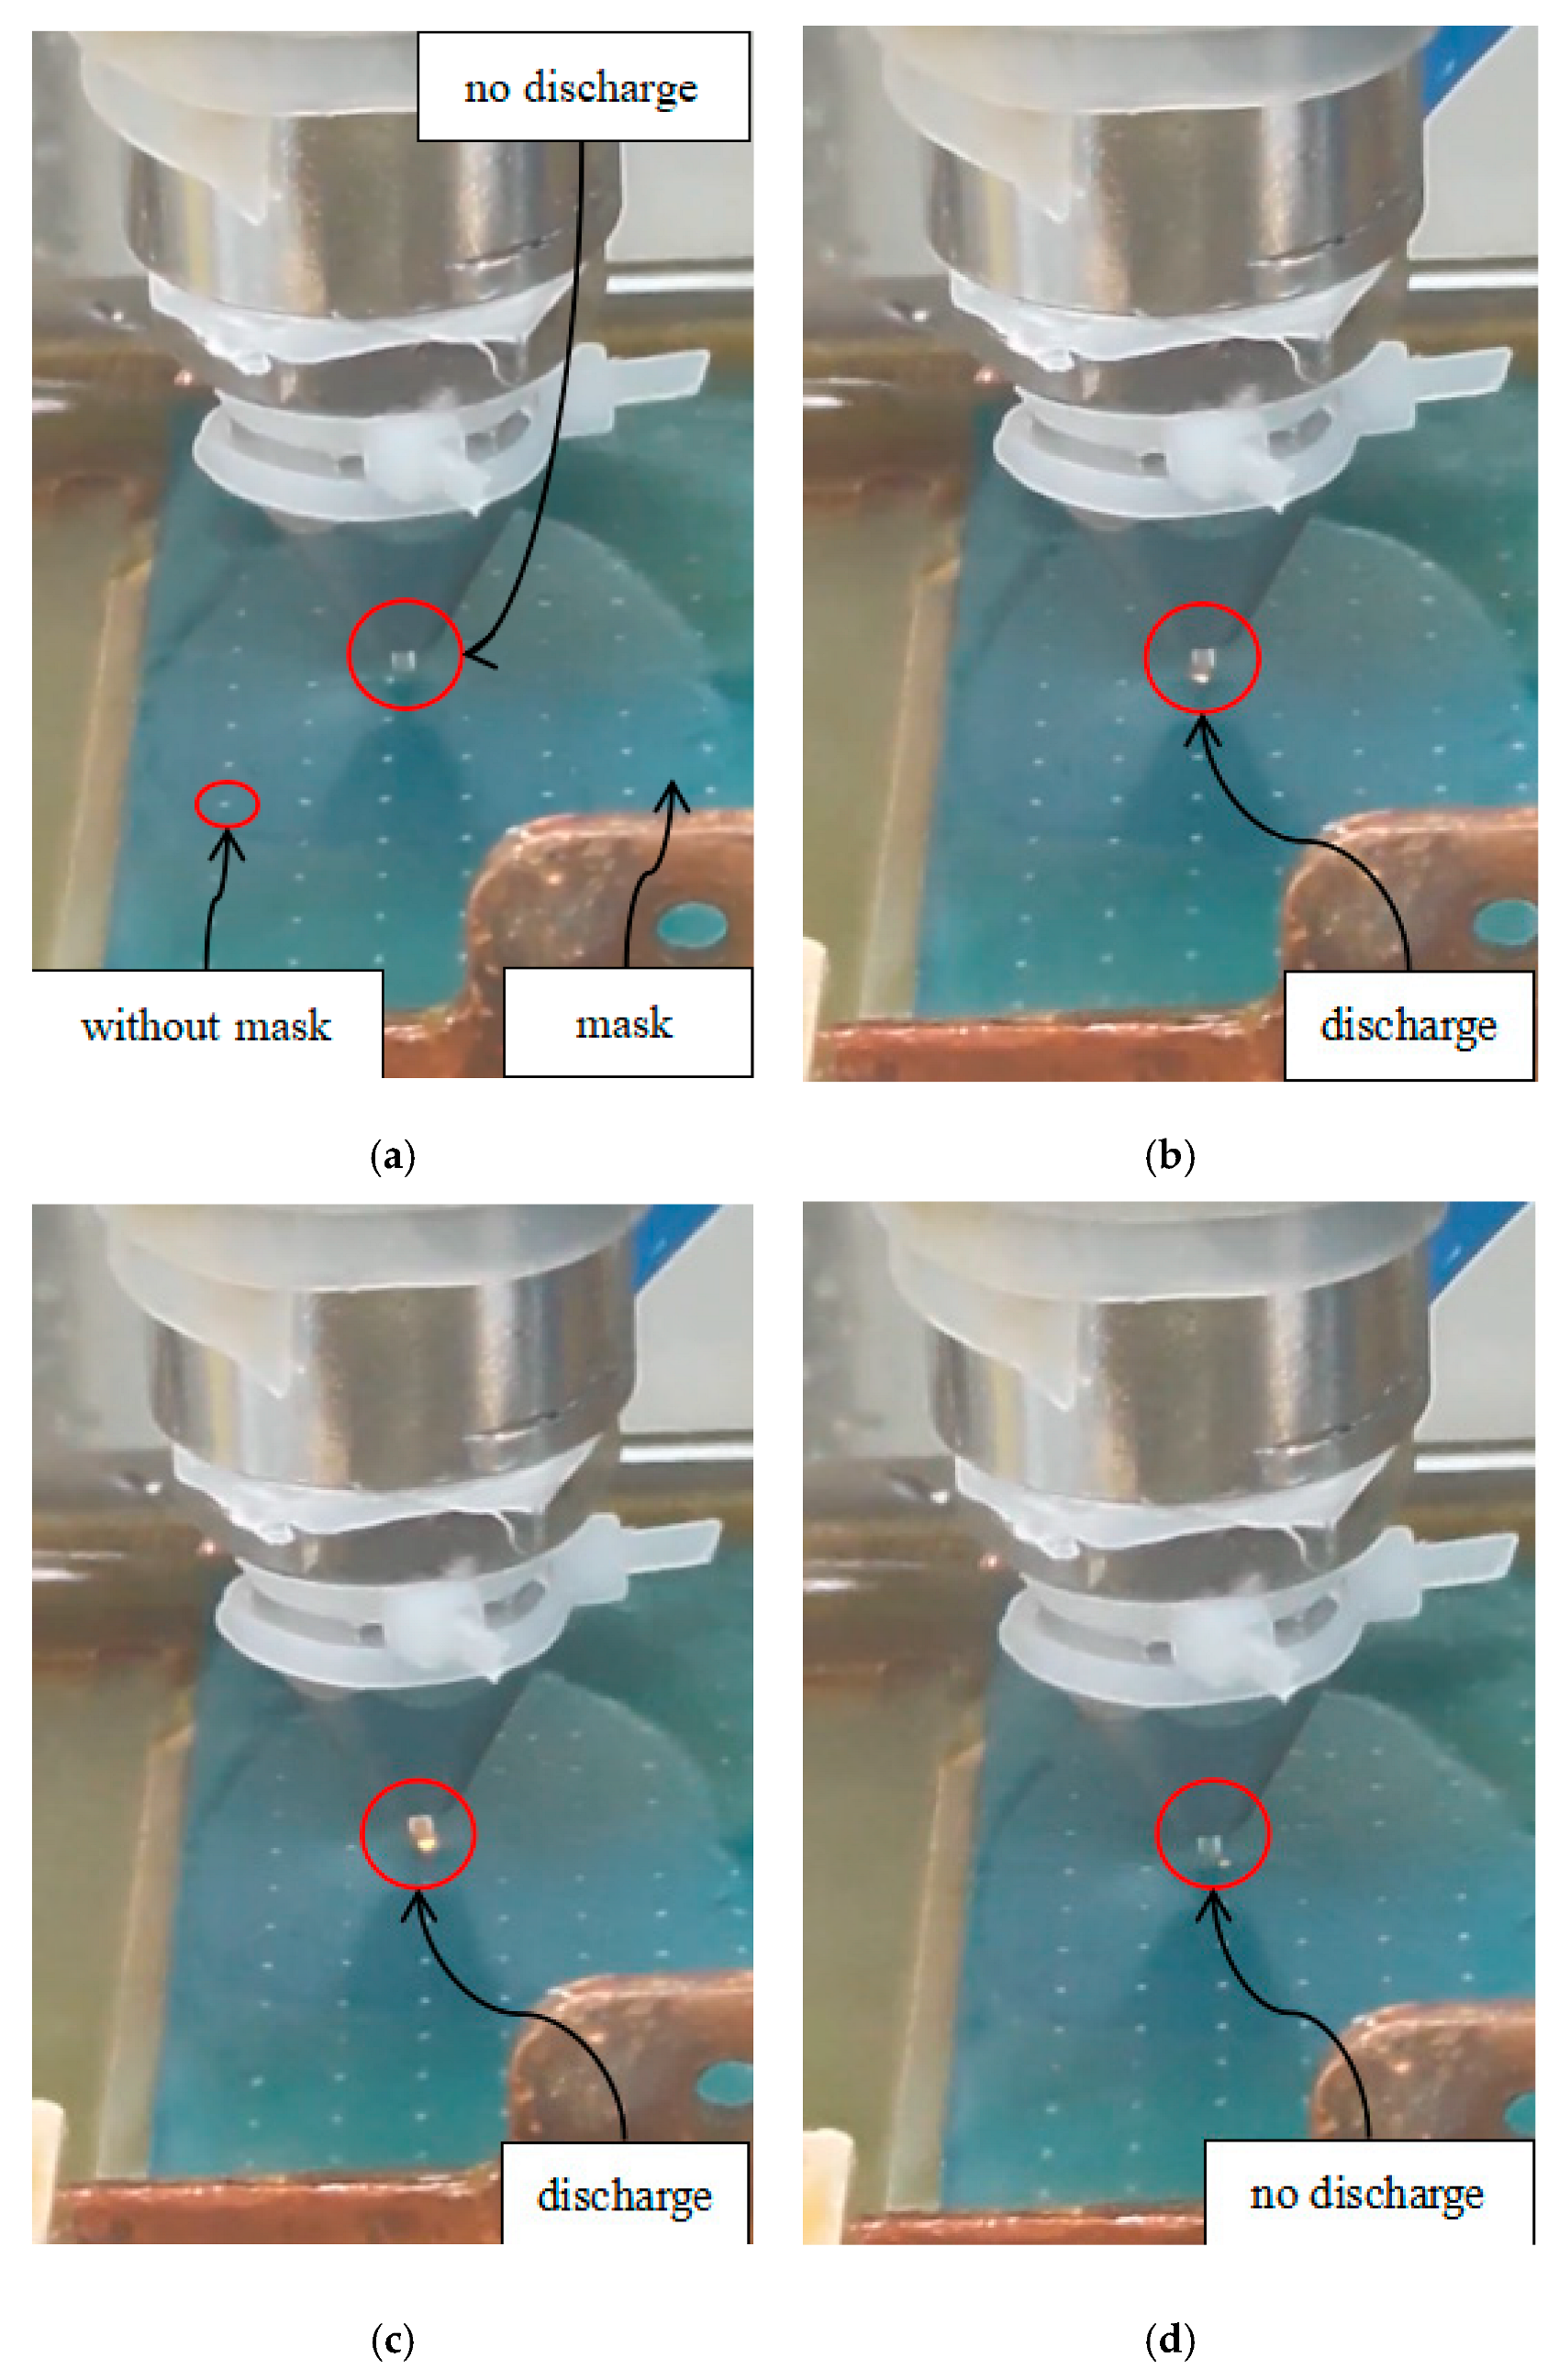
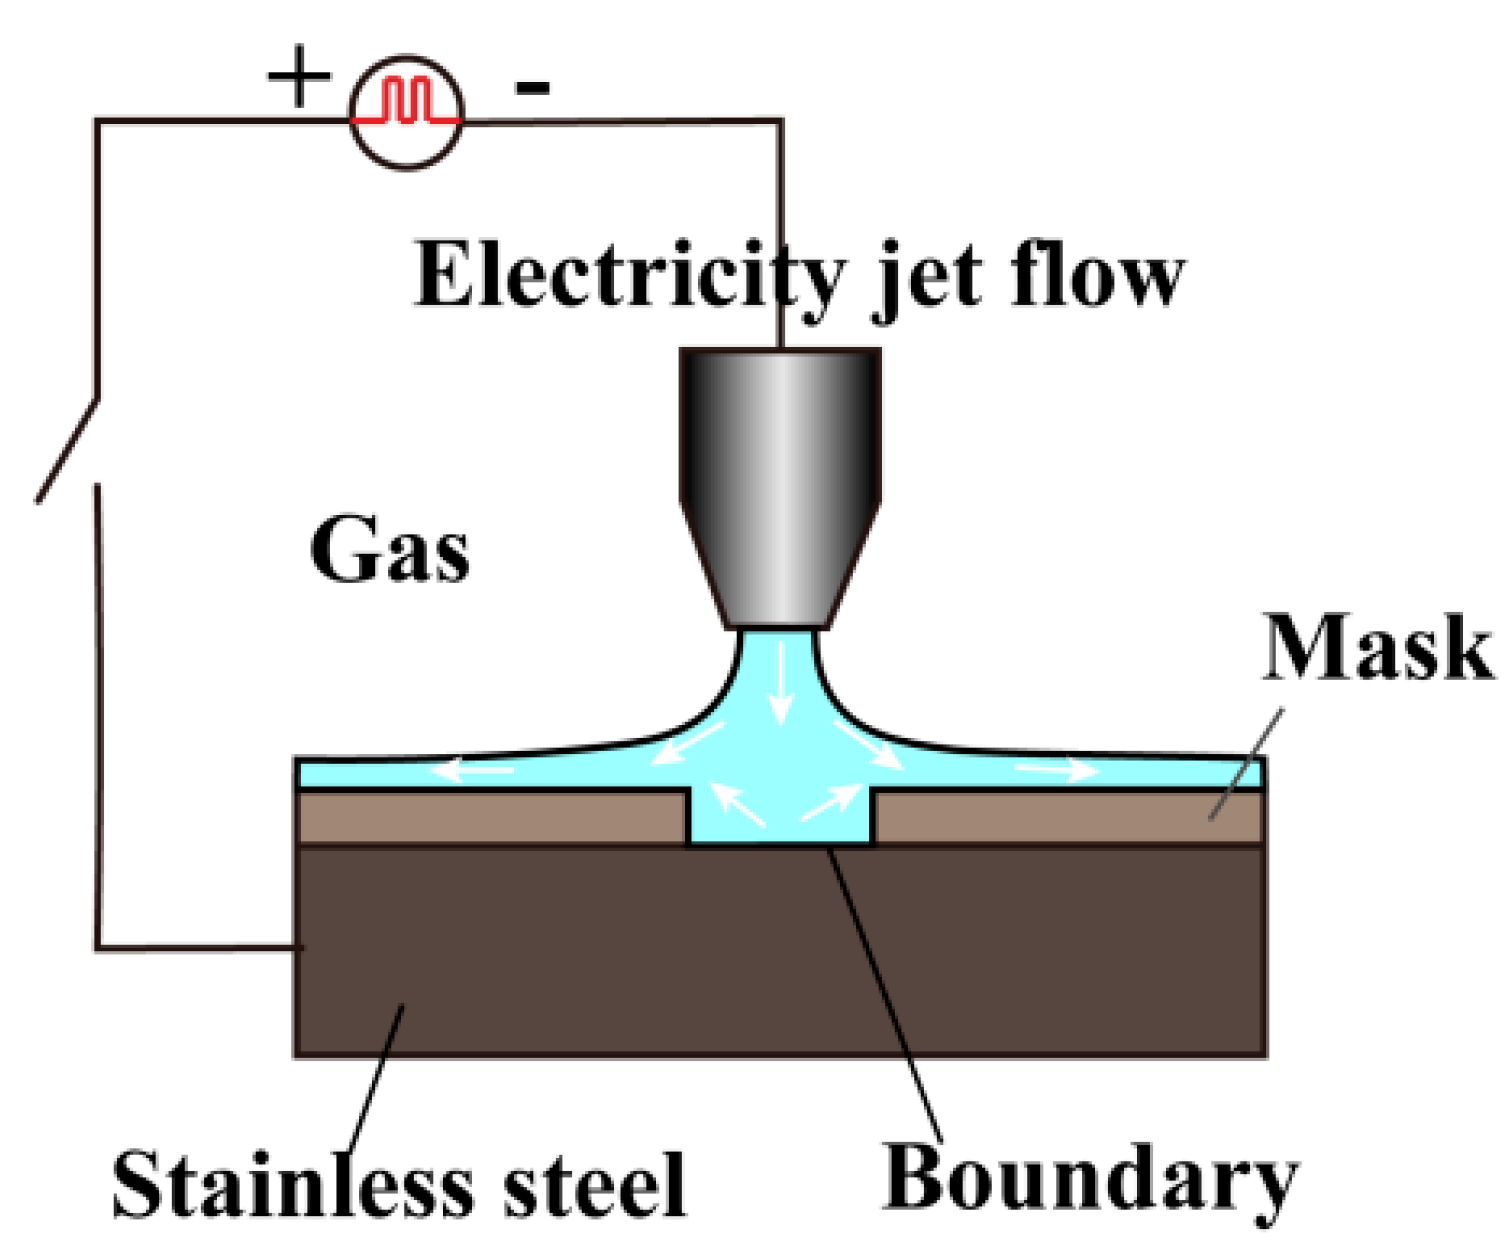
In the experimental equipment, the nozzle tool was connected to the negative terminal of the power supply (−), and the stainless steel workpiece was connected to the positive terminal of the power supply (+). The characteristics of the jet electrolytic discharge during processing were observed, and the discharge process is shown in Figure 2.
As can be seen in Figure 2, the discharge has the following characteristics: when the tool electrode moves from right to left, no discharge occurs in the mask-covered area of the stainless steel workpiece material, as shown in Figure 2a,d. When the tool electrode moves above the workpiece without the mask coverage, the discharge occurs in the jet, as shown in Figure 2b,c.
The jet machining experiments were repeated by varying the two process parameters of peak pulse voltage, U, and machining gap, d, respectively. The discharge characteristics for different processing voltages, U, and different processing gaps, d, are shown in Table 1.
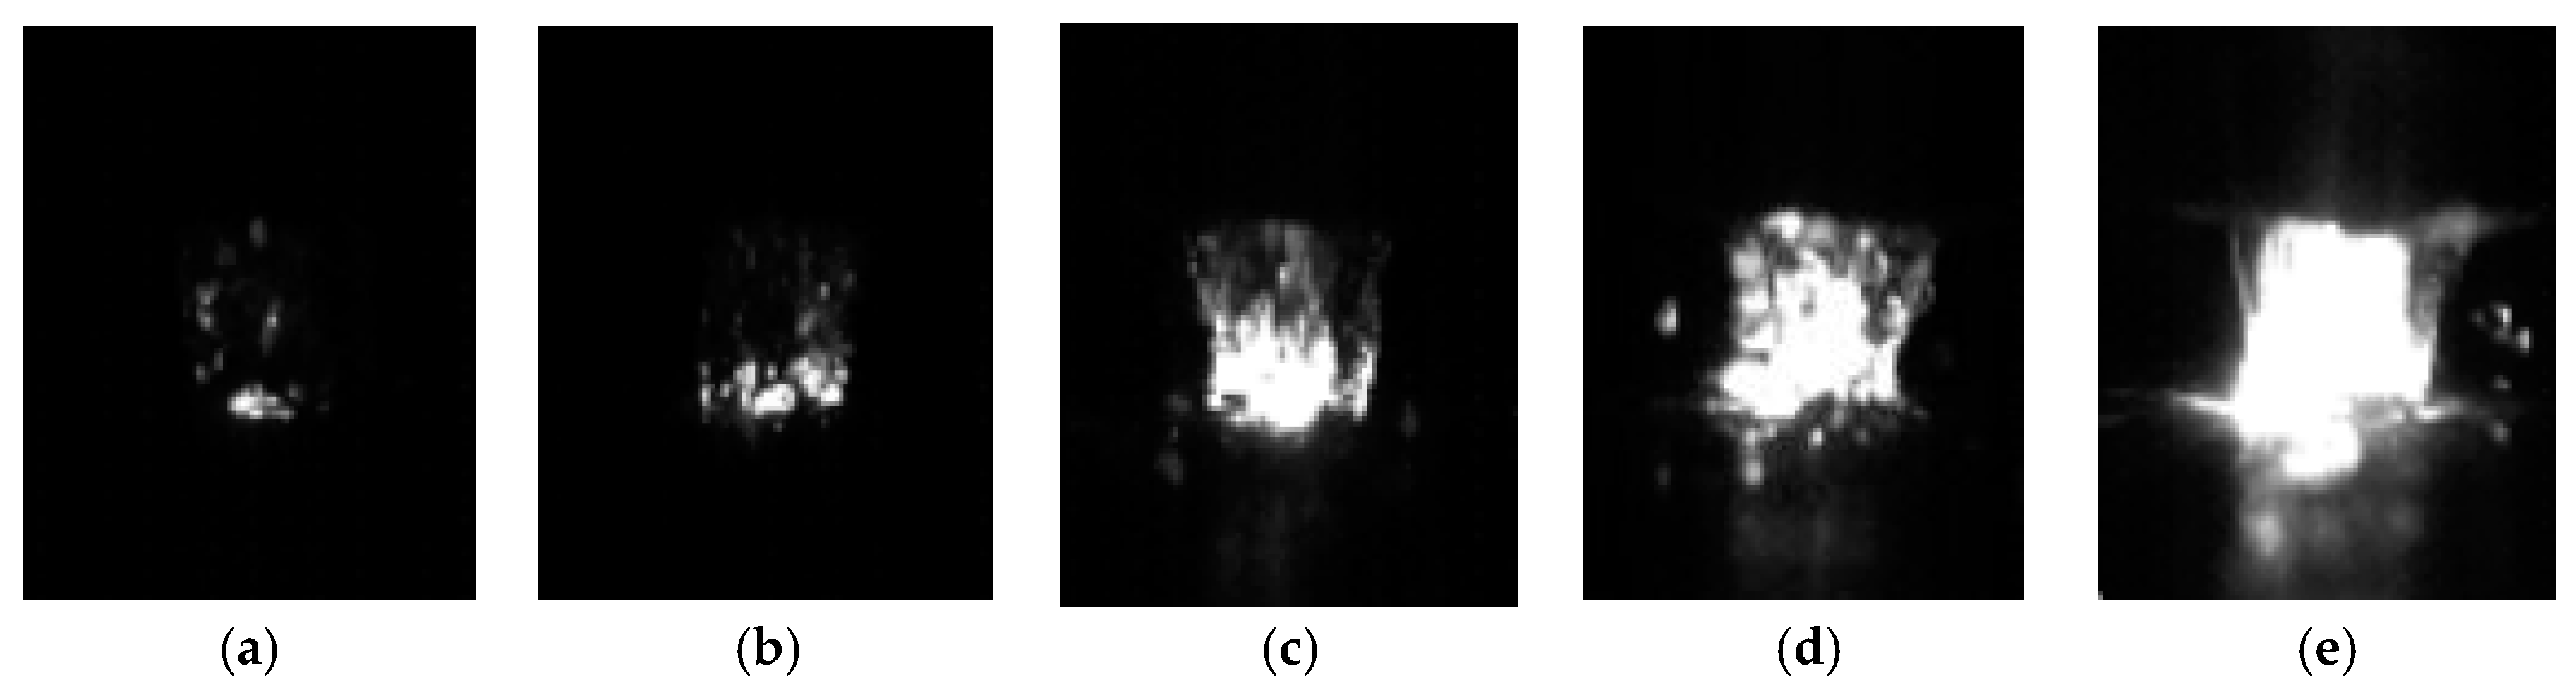
To better observe the discharge phenomenon and to avoid the influence of light and reflected light from the jet, a high-speed camera was used to take pictures in a dark room environment with the same photo interval of 25 μs/frame, and the discharge process is shown in Figure 3.
As can be seen in Figure 3, within the gas–liquid two-phase jet column, the discharge at the initial stage is mainly concentrated in the middle of the bottom of the column, where no discharge channel is formed, but rather presents discrete discharge points (Figure 3a,b). As time increases, the number of discrete discharge points gradually increases, spreading across the bottom and middle of the jet column (Figure 3c,d), and eventually, the discharge channel of the jet column is realized between the two poles (Figure 3e), completing the discharge process.
2.2. Characterisation of Crater Morphology under Discharge Conditions
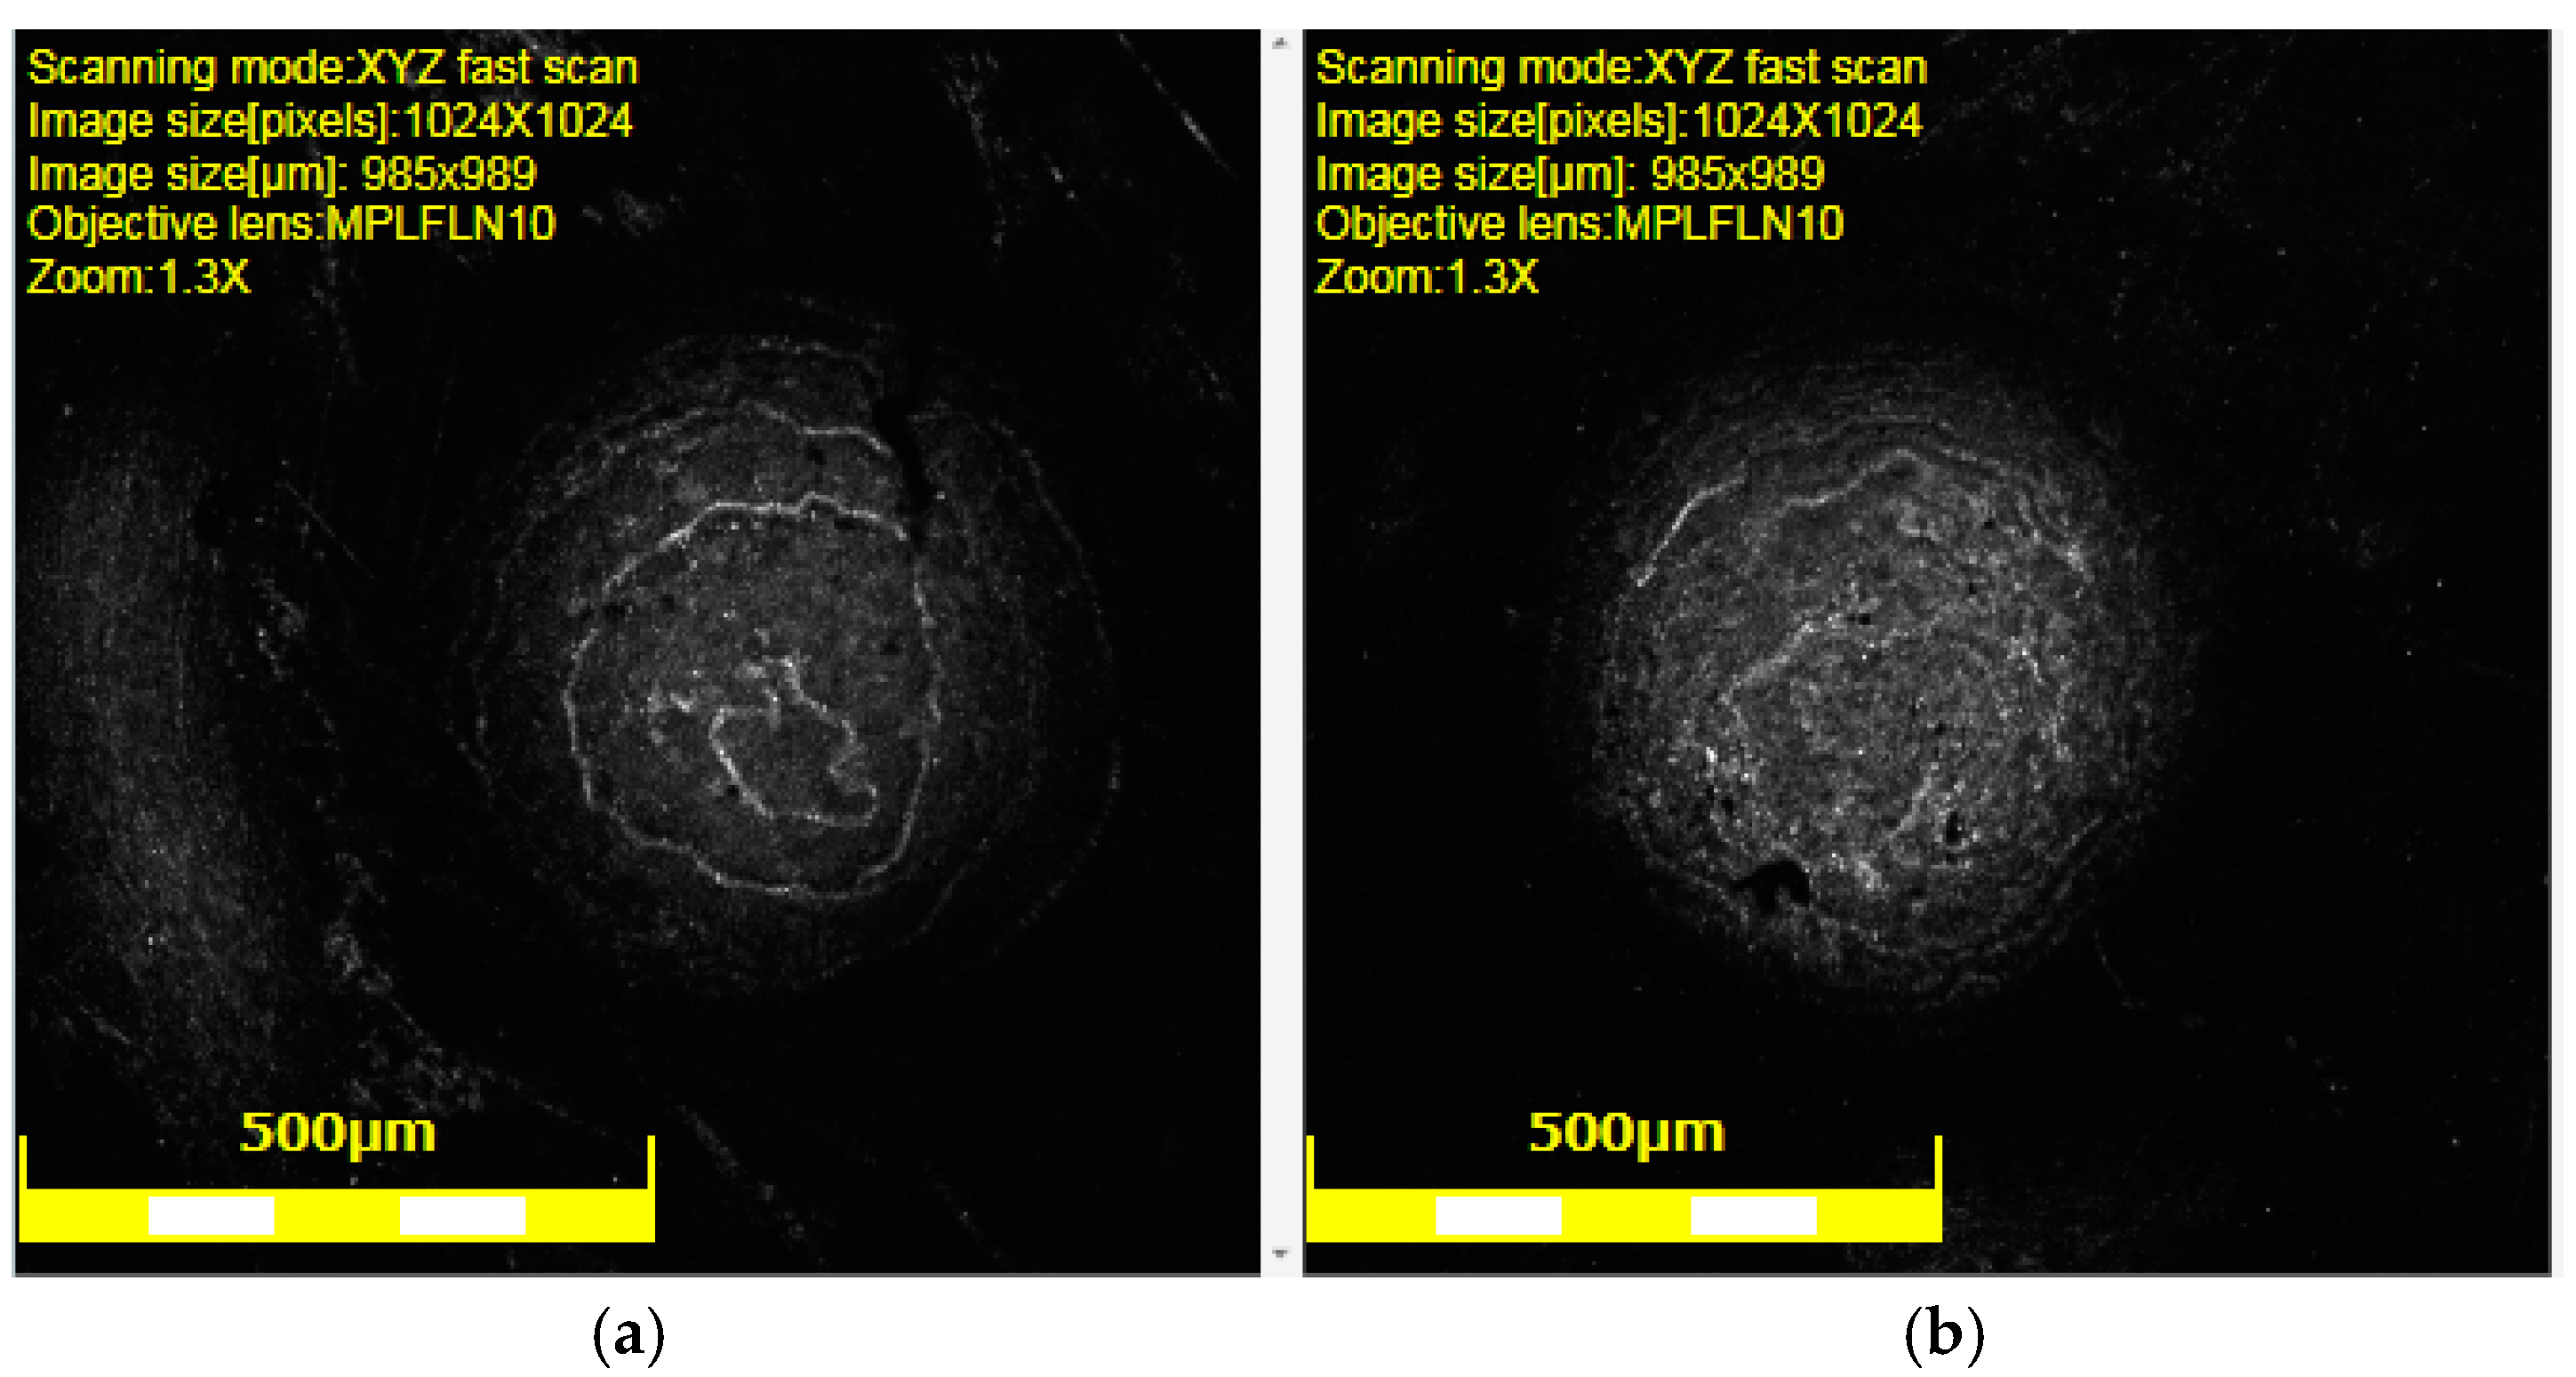
According to the discharge characteristics of jet electrolytic discharge compound machining, when the distance between the nozzle and the workpiece (machining gap) is fixed, the corresponding voltage can produce a stable and continuous discharge within a certain range. The machining experiments were carried out using the above process parameters, and the morphological characteristics of the machined structure were analysed using an Olympus optical microscope, as shown in Figure 4.
As shown in Figure 4, the workpiece first appears as a ring-like structure at the beginning of machining, with obvious discharge marks at the bottom of the crater over time. As the machining time increases, the discharge channels begin to build up, and a stable discharge is formed. By only turning down the machining voltage, for example, setting the machining voltage to 50 V, and keeping other machining conditions unchanged, the morphology of the machined crater does not show the special pattern of the ring-like structure [27,28,29,30].
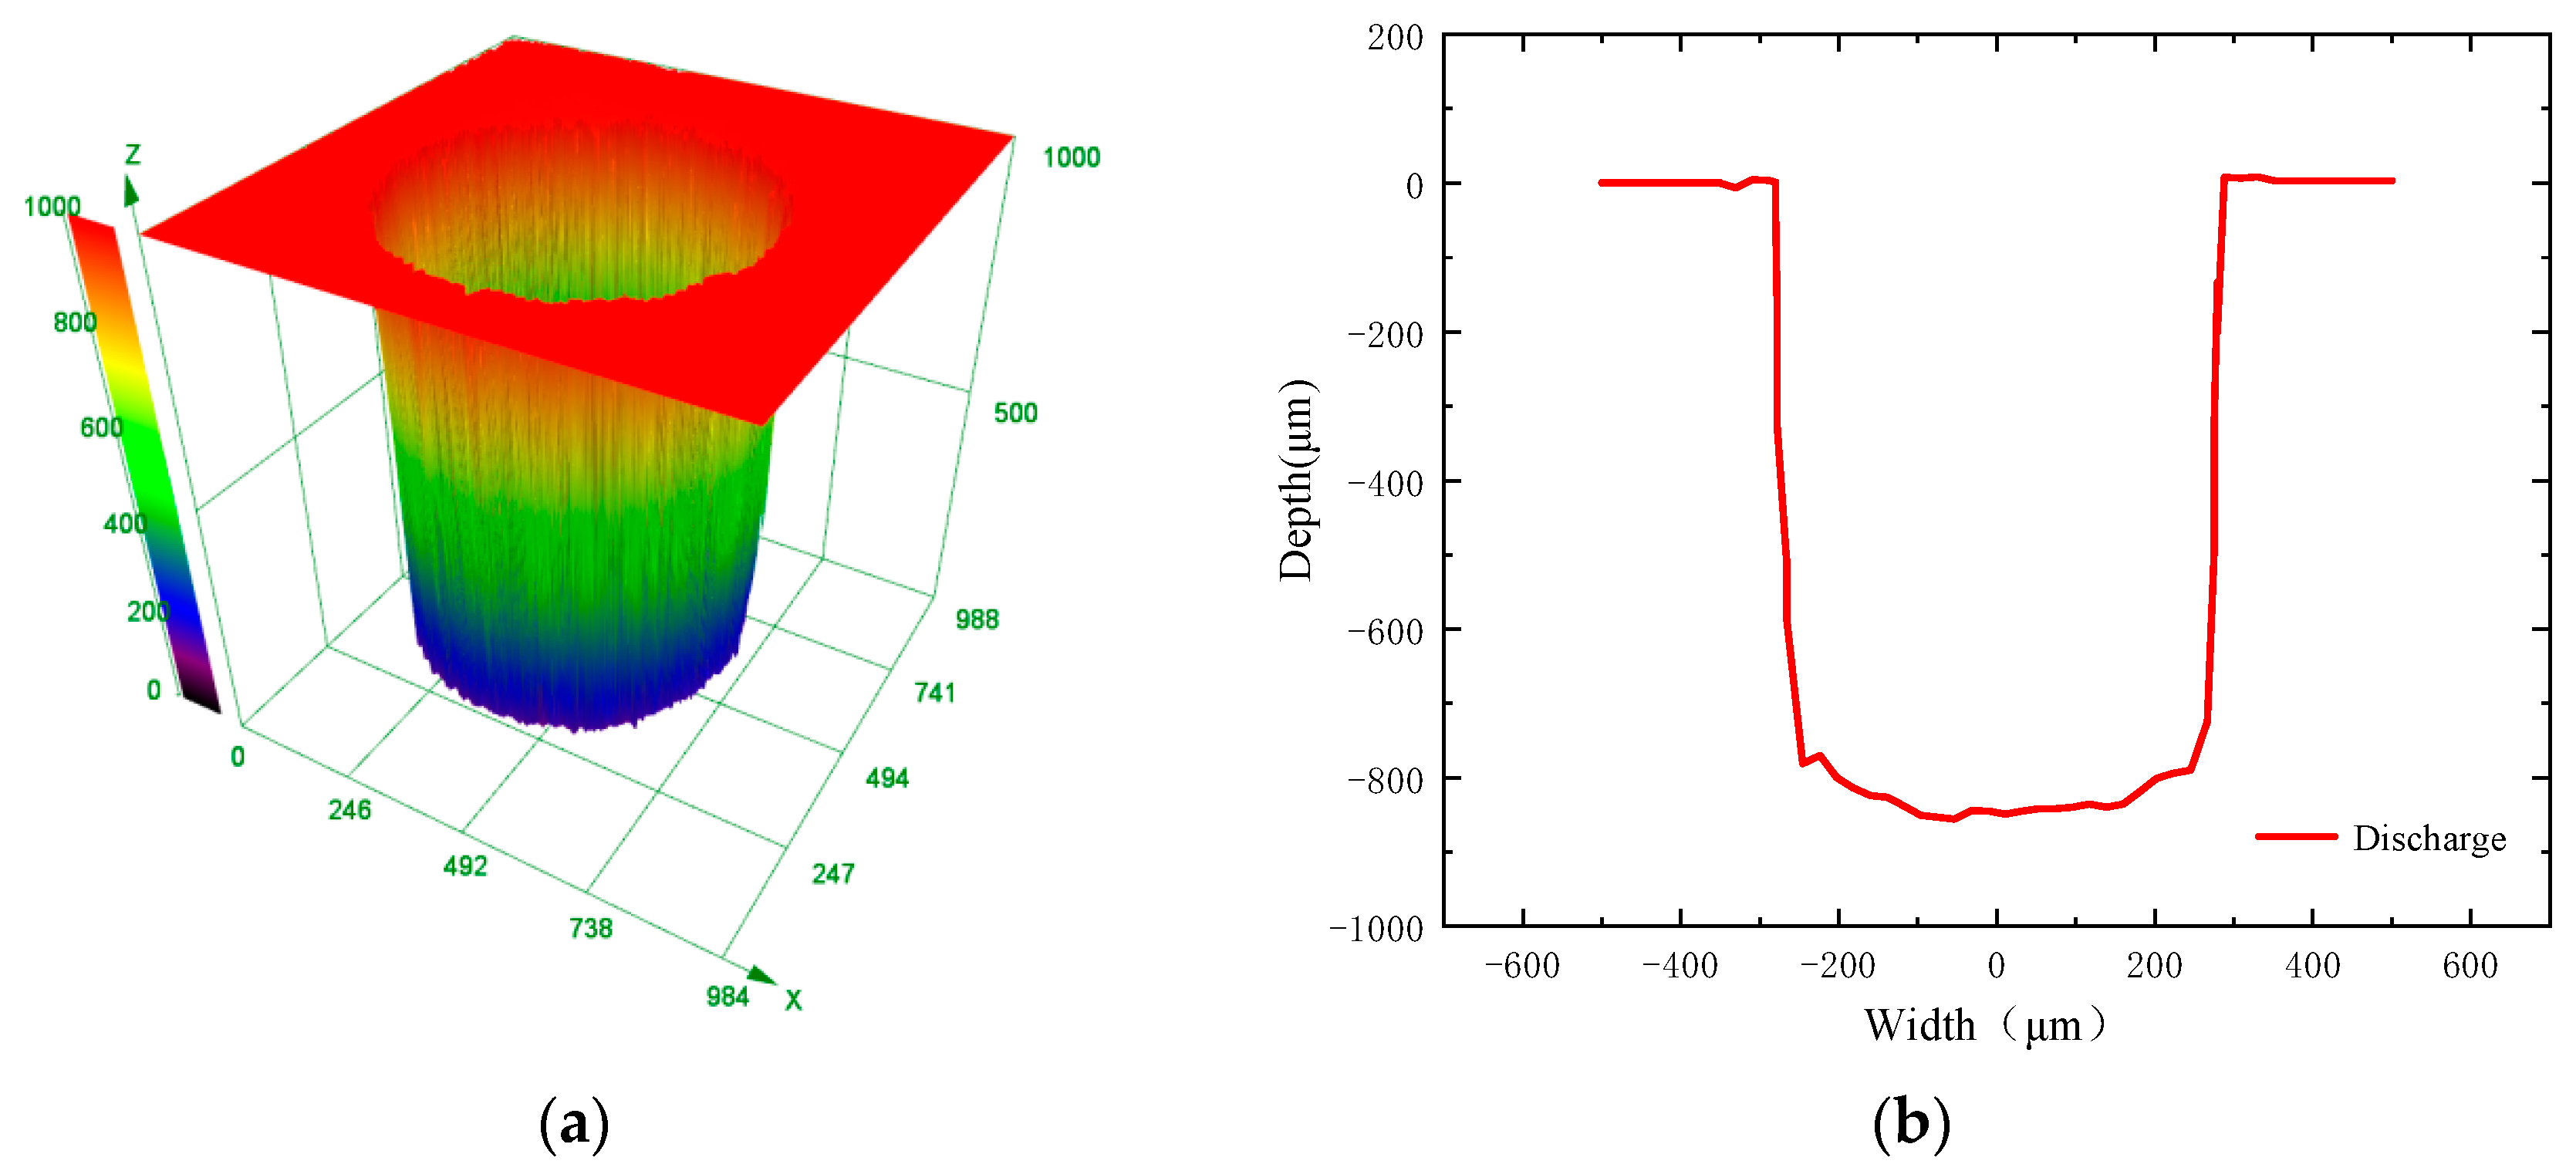
A three-dimensional morphological measurement of the crater is shown in Figure 5.
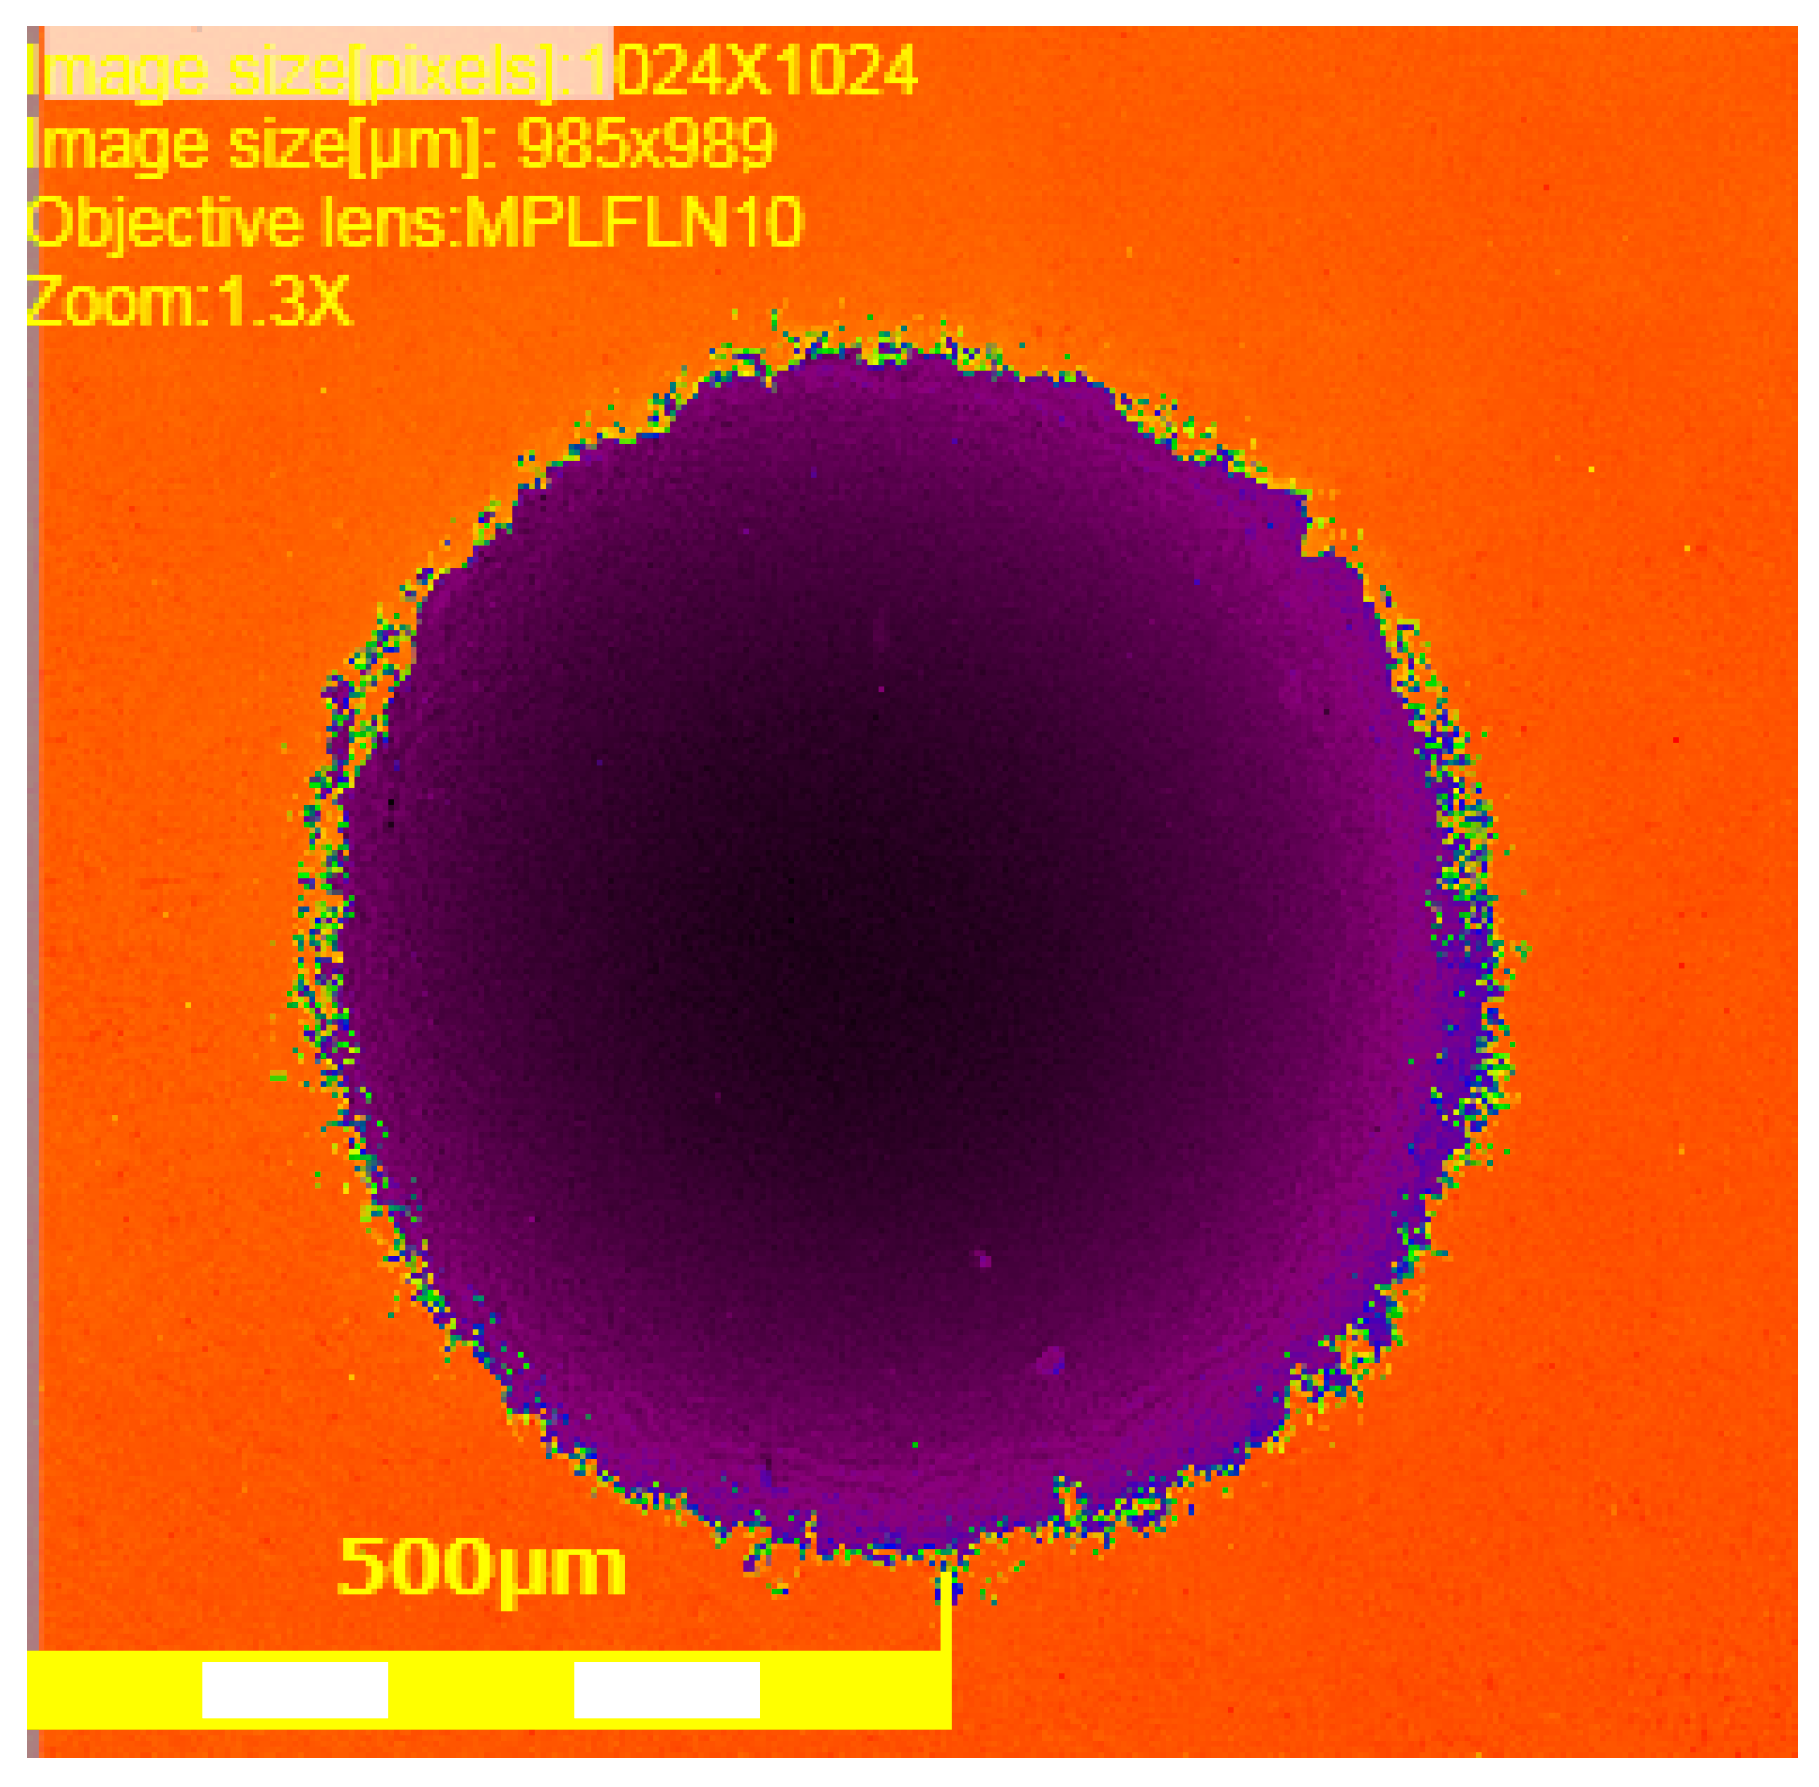
Figure 5 shows the 3D colour, and the depth and width dimensions of the pits, respectively. It can be seen from the figure that the side walls of the pits processed by the jet mask electrolytic discharge are steep and straight, and the bottom is flat, with better processing quality. Further analysis of the 2D colour diagrams of the pits is shown in Figure 6.
The mask plate has a good constraint on the shape of the machined workpiece, and the machined craters are well-rounded. Although the edge part of the blue oil mask is slightly broken, the mask can still play a constraint role, especially in that the width of the size can be effectively controlled.
3. Electric Field Simulation Analysis Study of Jet-ECDM
The creation and development of a liquid discharge (liquid dielectric breakdown) is an extremely complex process in which discharge channels are formed with a series of events such as ionisation, collision, drift, compounding, and adsorption. A column of pressurised electrolyte in a conical nozzle is sprayed onto the mask, which ensures that the mask is tightly covered with the workpiece. At the same time, the high-velocity electrolyte is ejected through the micro-hole onto the exposed workpiece surface, where a discharge will occur when sufficient voltage is applied between the conical nozzle and the workpiece. Under the combined effect of electrolytic processing, anode dissolution, and discharge channel ablation, craters of a certain shape are formed.
3.1. Modelling Multi-Physics Field Coupling
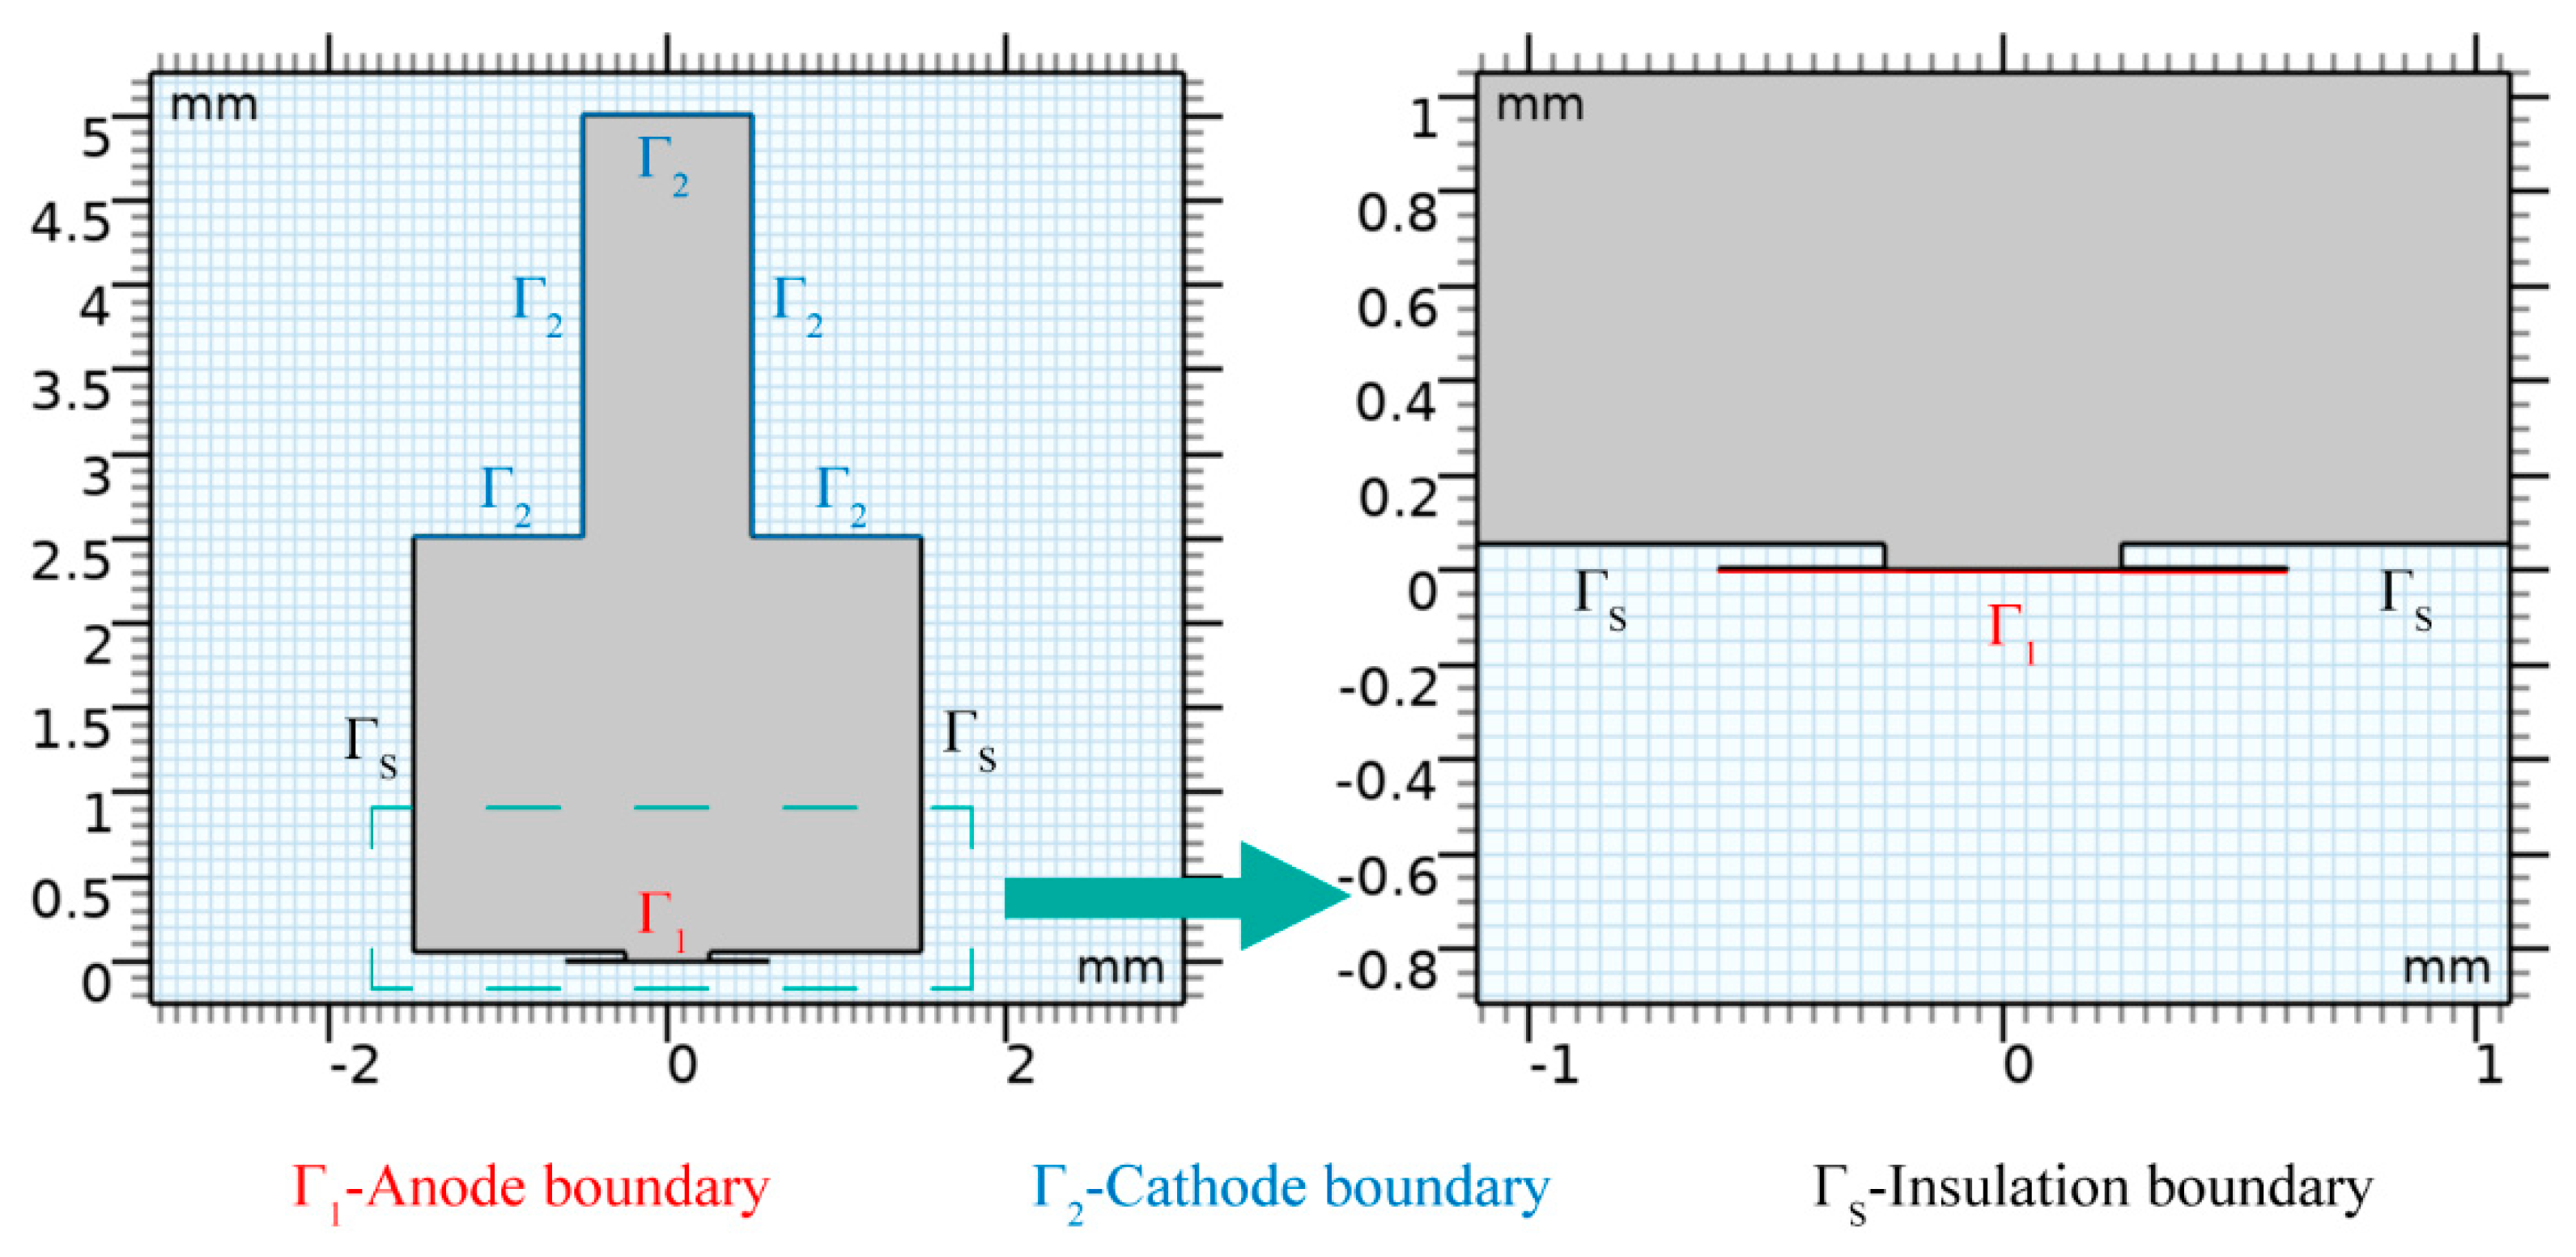
In the pre-processing phase, the geometric model of the machining area is first drawn, and then the individual physical fields are added in turn. The simulation analysis is carried out using COMSOL 6.1 software, mainly using the electrochemical module. The electrochemical module, in turn, uses the corrosion, deformed geometry module, which is based on two main blocks: the primary current distribution and the deformation geometry. In the primary current distribution, relevant parameters such as electrolyte, insulation, electrode surface, and initial values are set. The electrolyte fills the simplified geometry space, the insulation boundary is mainly the mask area boundary, and the model is simplified as shown in Figure 7.
The simulation requires the following assumptions to be made about the model: the electrolyte conductivity is stable and constant; the temperature of the electrolyte is stable and constant [31]; and the current efficiency is 100% [32]. The relevant initial values to be set in the pre-processing stage are shown in Table 2.
According to the above assumptions, the electric field is simplified to a constant electric field, and the electric field at any point, P(x,y), in the processing region, Ω, conforms to the Laplace equation.
Laplace Equation Boundary Conditions:
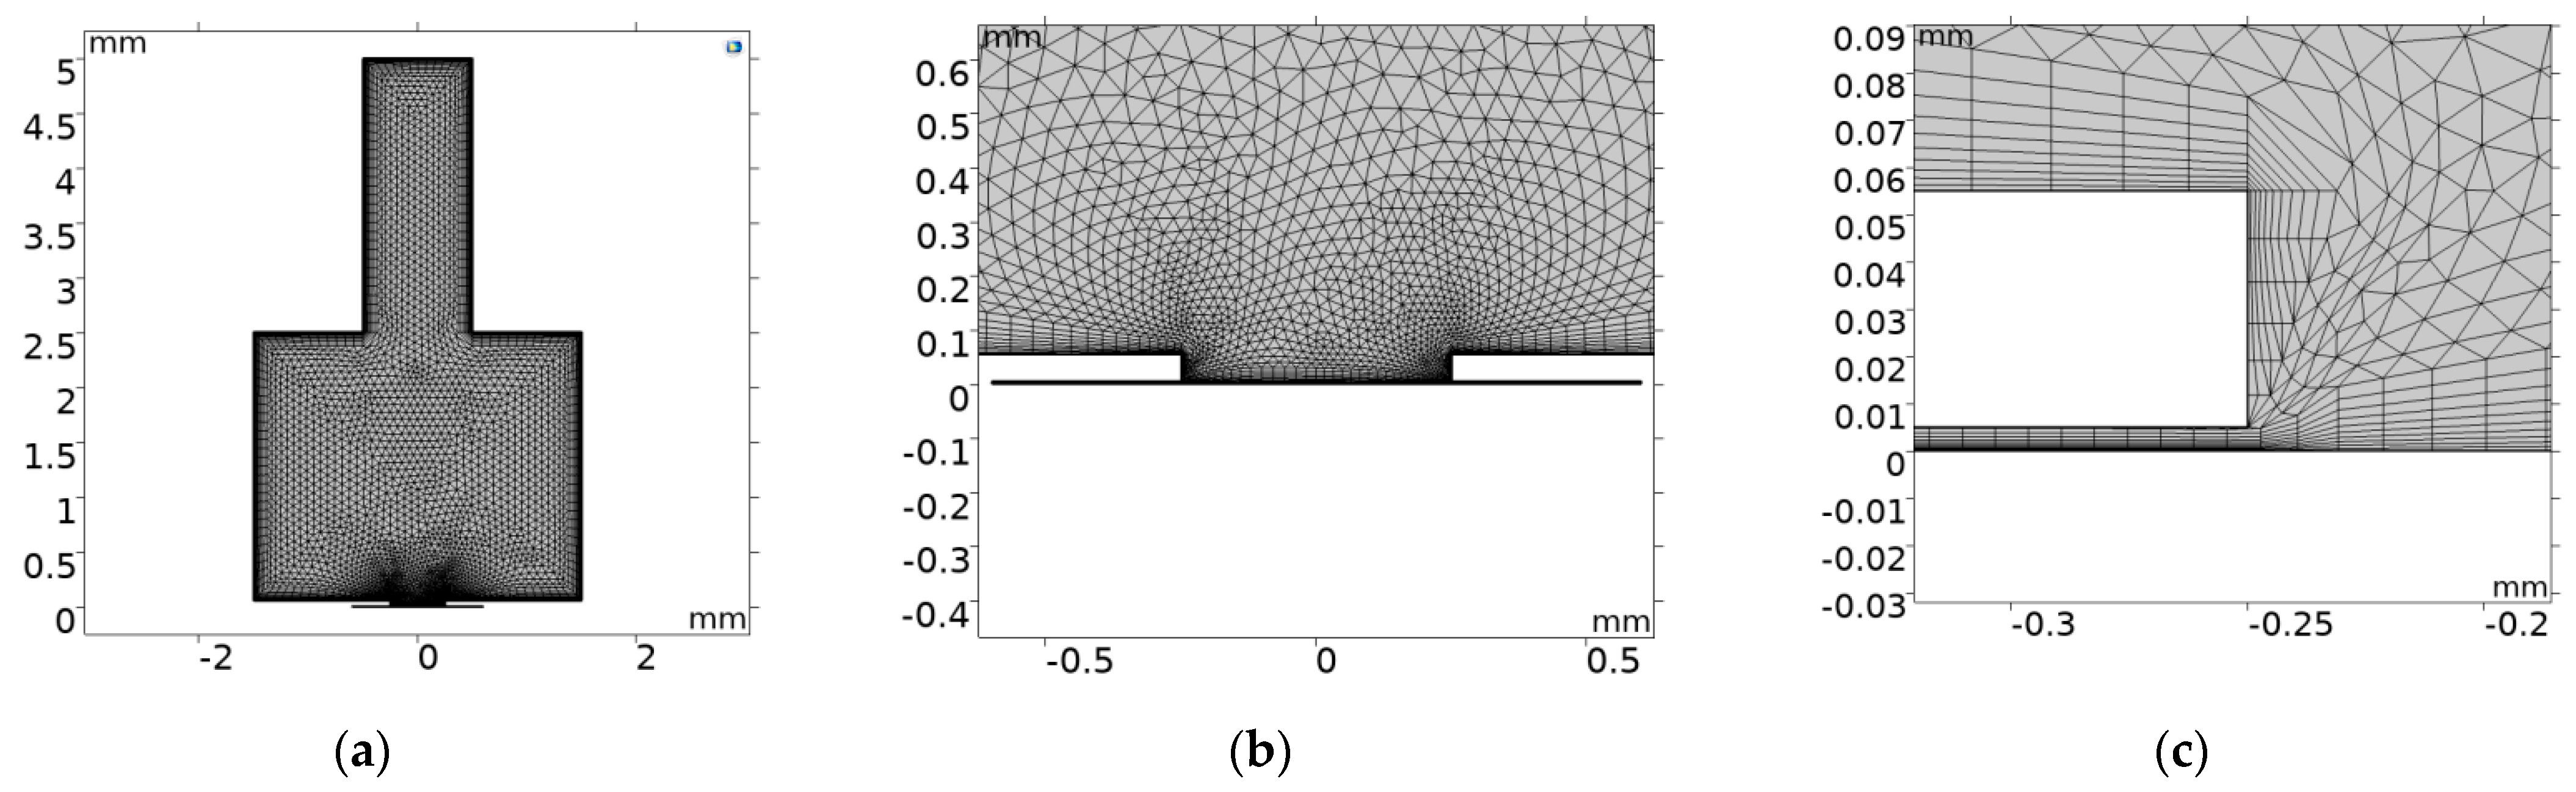
After the pre-processing is complete, the meshing is carried out. Good or bad meshing will affect the accuracy of the simulation results. To improve the quality of the meshing, the geometric boundary is divided into layers, the rest of the area is a free-dissecting triangular mesh, and the mesh around the anode is refined. The mesh at the mask hole is more finely cut, thus ensuring the accuracy of the simulation results. To make the calculation easier to converge, a gap of 5μm is set between the mask and the anode, as shown in Figure 8. After completing the meshing, the simulation model is solved. The experimental factor scan speed is equated to the calculation time in the simulation and is uniformly set to t = 1 s with a time step of 0.1 s.
Post-processing of the simulation results was carried out after the completion of the calculations. The trends in electrolyte potential, electrolyte current density, anode dissolution rate, and anode profile were mainly obtained from the calculation results of the electrochemical module to provide some guidance for subsequent experimental processing.
3.2. Simulation Analysis of Electric Field Distribution
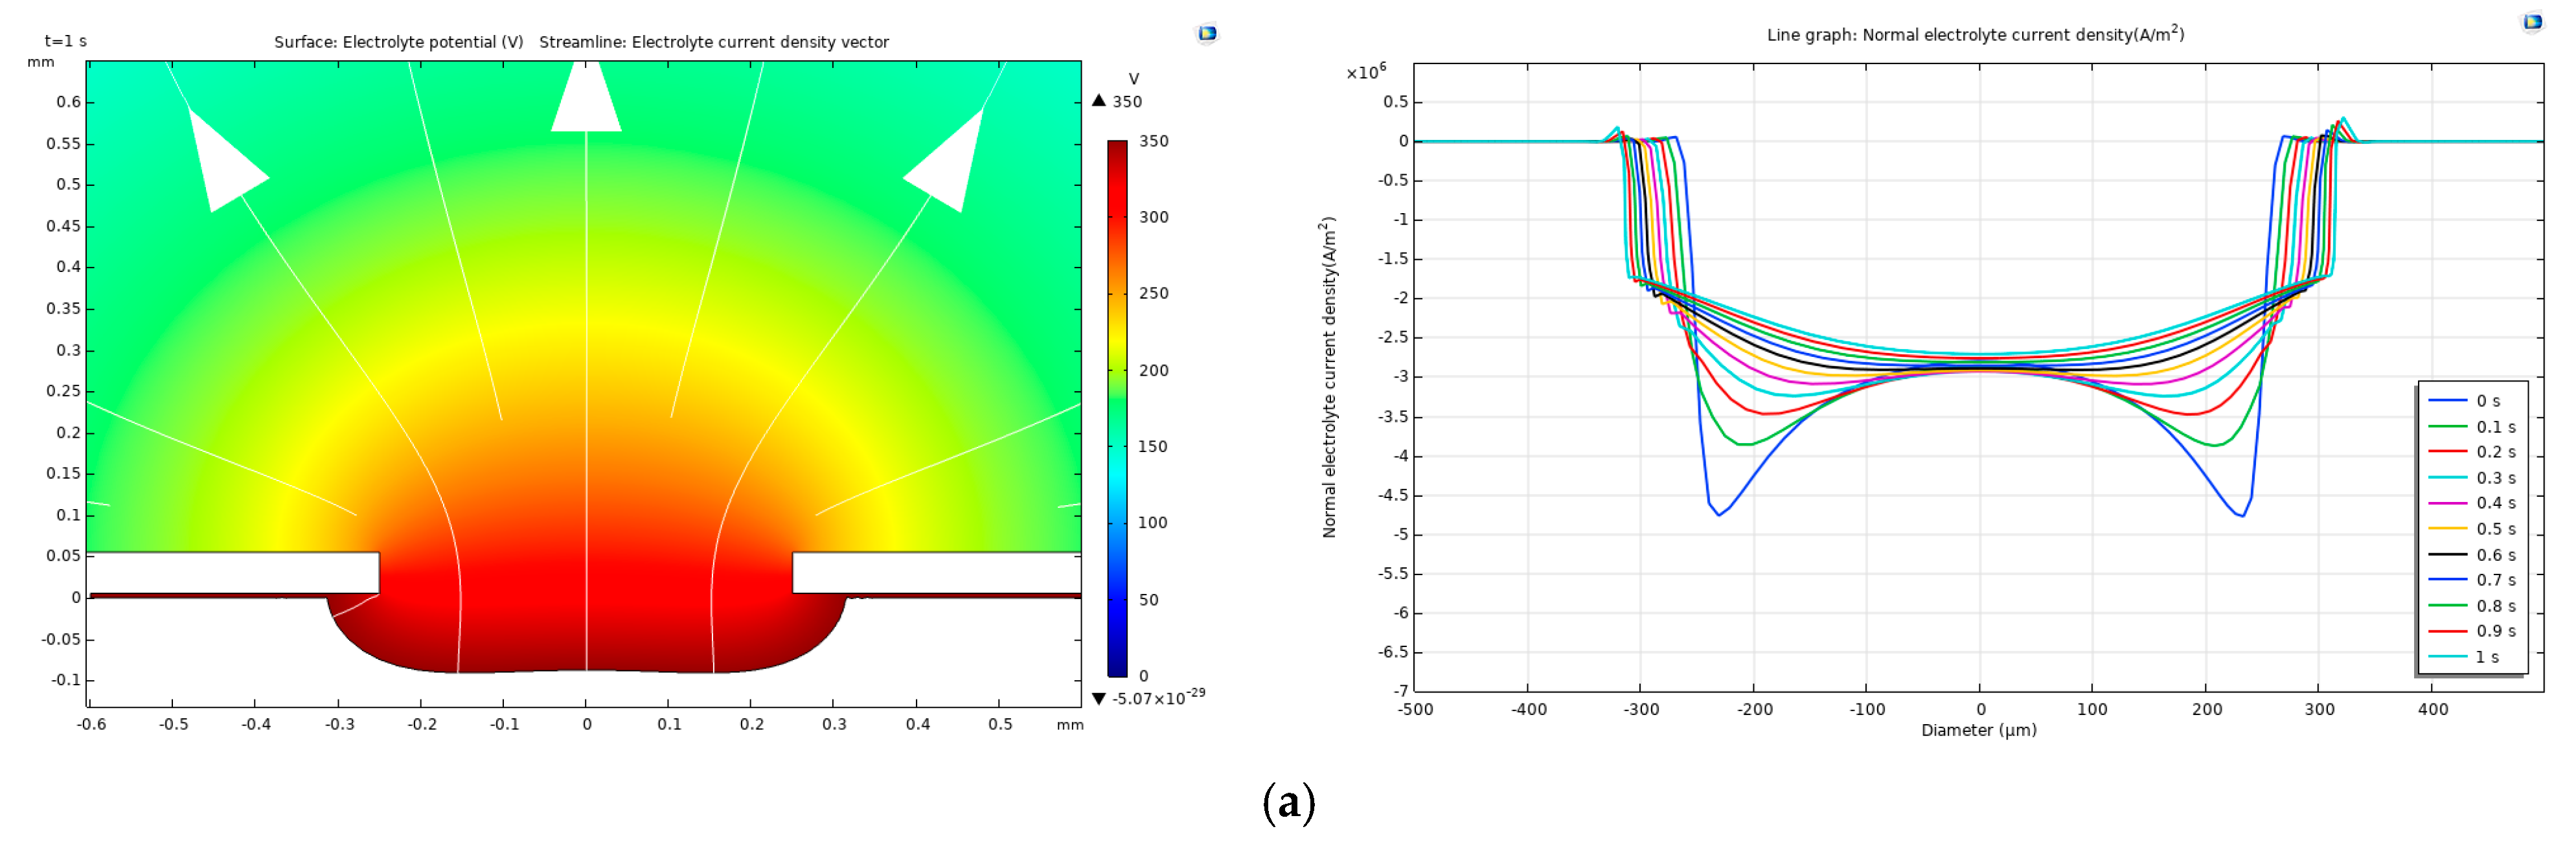
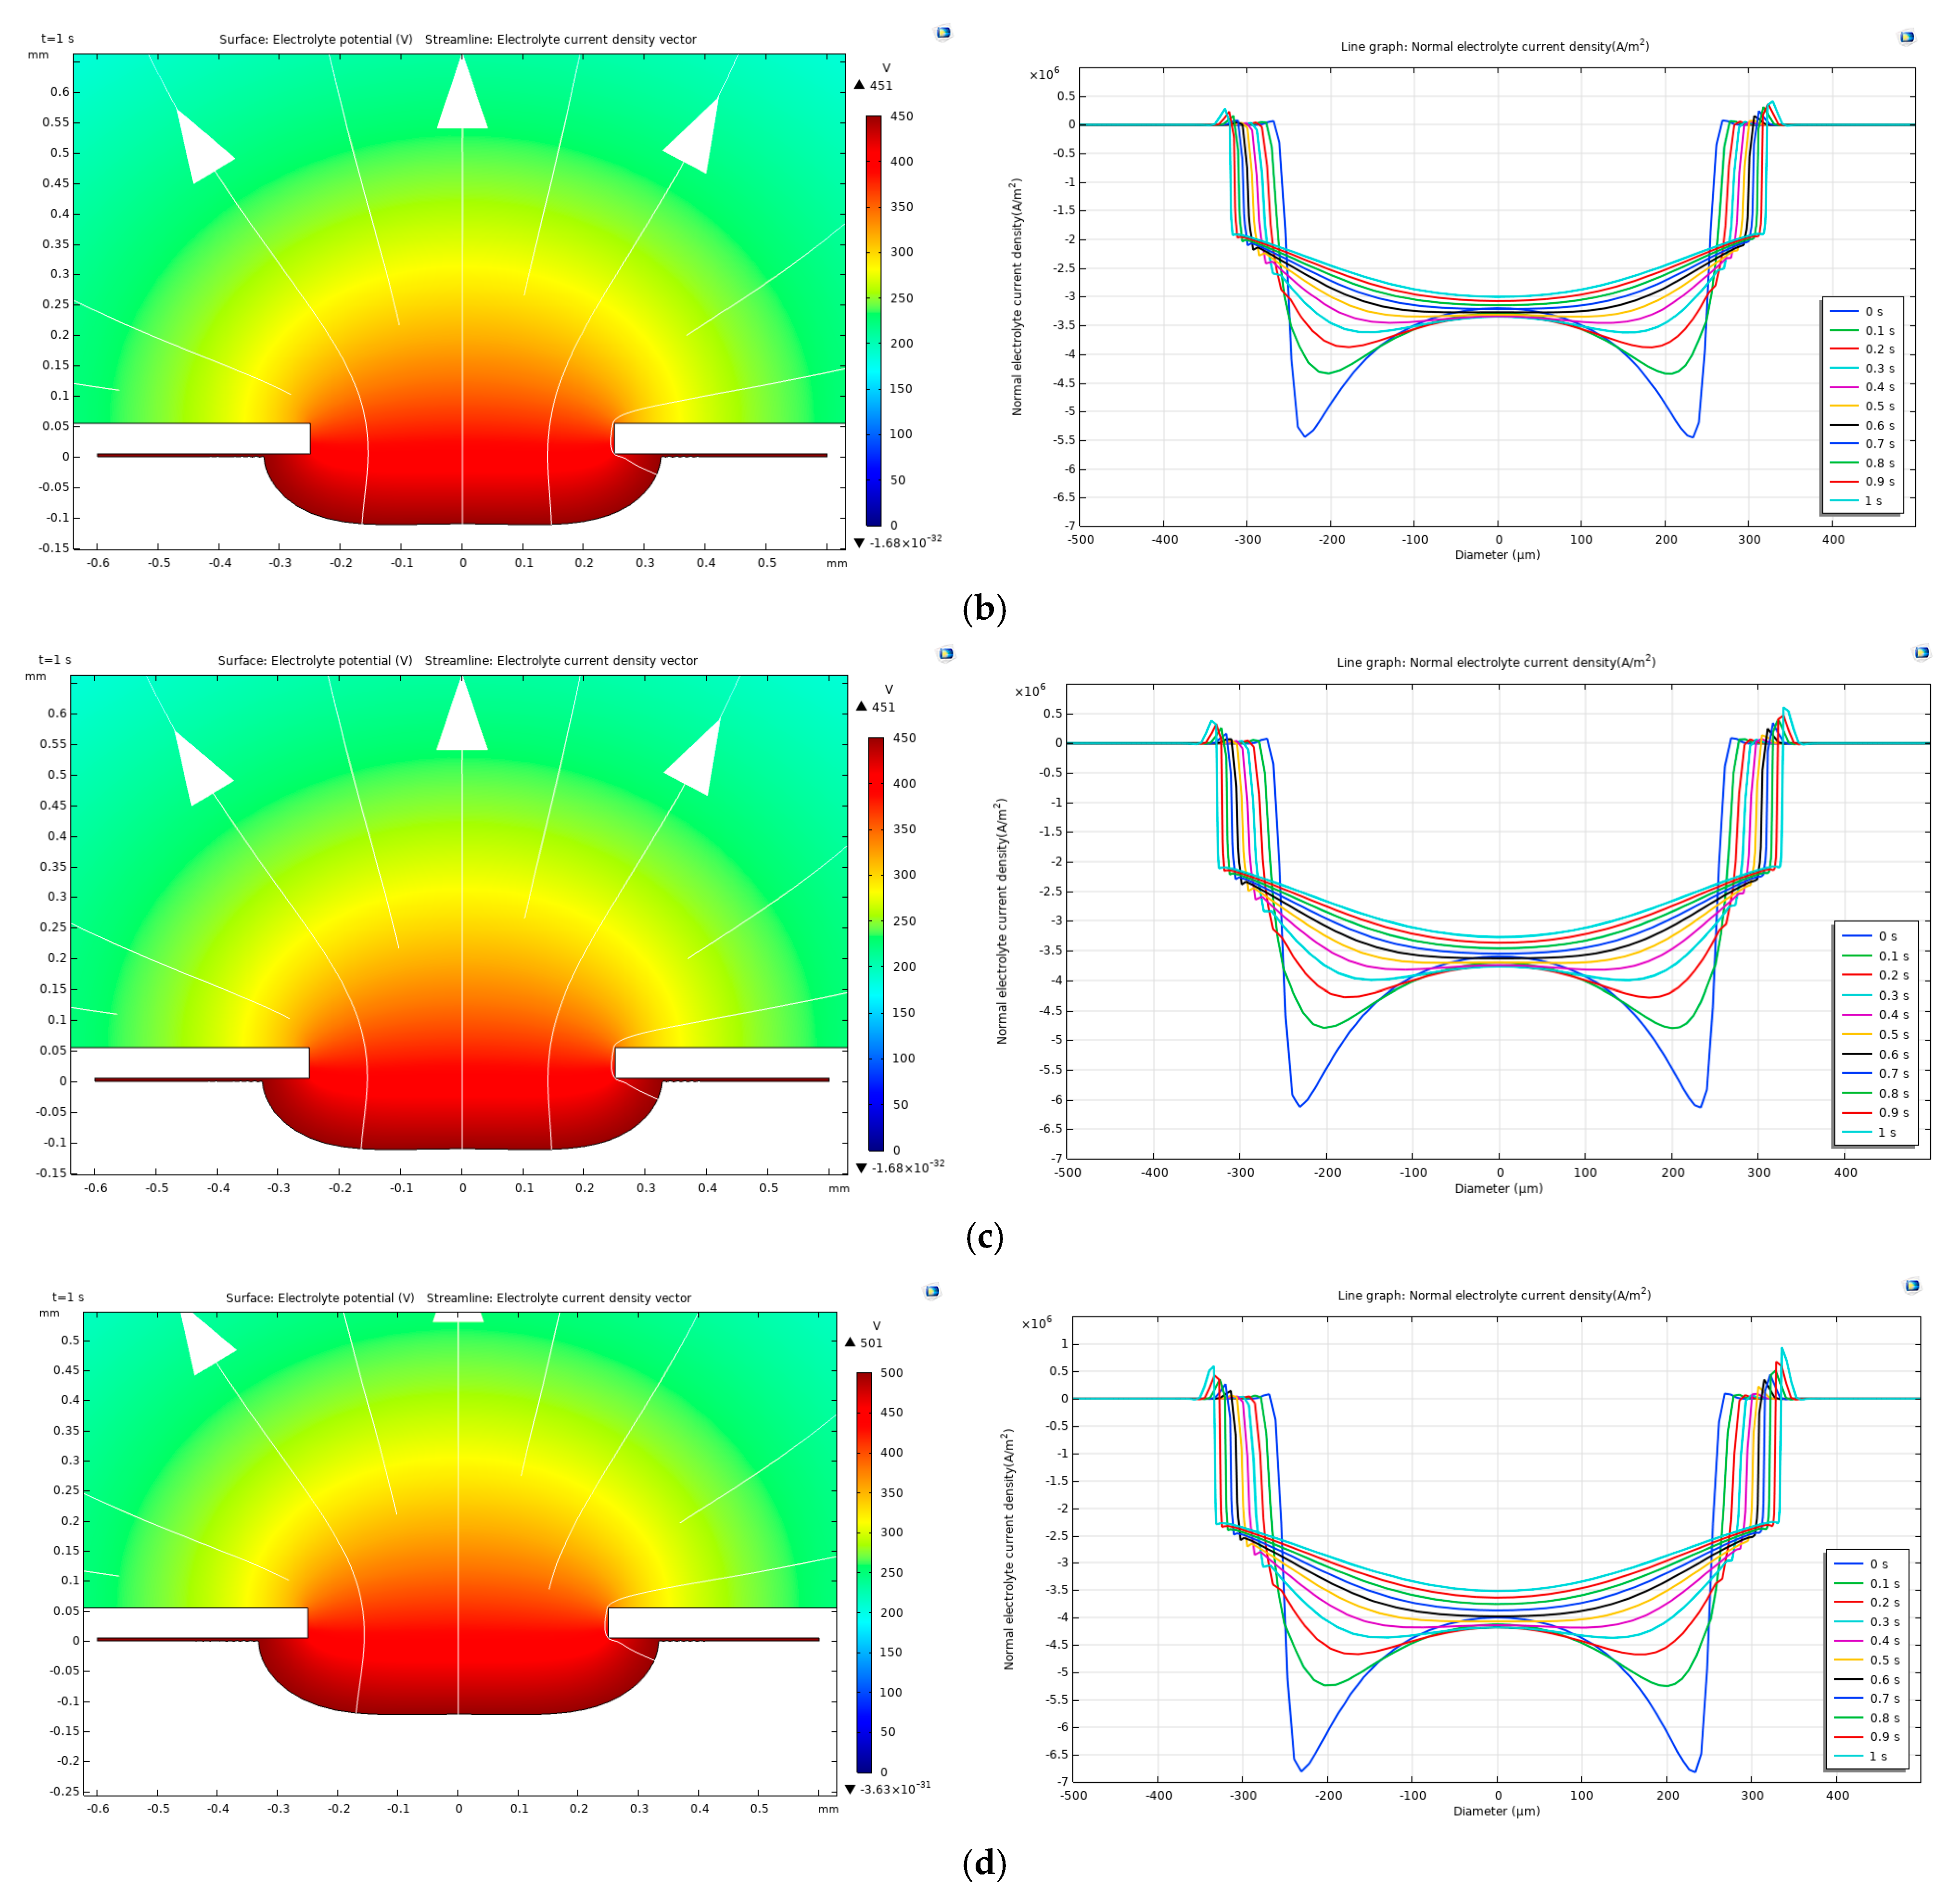
Voltage values of 350, 400, 450, and 500 V were chosen for the electric field simulation analysis. For post-processing, the potential cloud plot at the last time point (t = 1 s) and the (interval time 0.1 s) current density plots at different time points were selected, as shown in Figure 9.
As can be seen from the potential cloud, the electric field line starts from the anode and enters along the normal direction of the cathode. The potential inside the micro-hole is evenly distributed in size and gradually decreases along the direction of the electric field line, i.e., the potential is highest at the edge of the anode. As the blue oil mask covers most of the stainless steel surface, these areas are insulated; only the area of the gouge hole directly below the tool nozzle, where the metal is exposed, can be conducted, and the closer to the centre point of the mask hole, the greater the electric field strength. On the other hand, the discharge channel tends to develop along the shortest distance under the influence of the electric field factor, so the discharge channel will be the first to be piloted at the location of the bottom mask hole. The higher the applied voltage, the higher the average voltage inside the micro via. As can be seen from the current density graph, at a constant voltage, the current density at the bottom of the micro via decreases as the simulation time increases, i.e., at the beginning of the simulation, the current density is at its maximum, and the current density at the edge of the hole is greater than the current density around it. As time increases, the current density at the bottom of the blind micro-hole is gradually uniform.
4. Discharge Mechanism Analysis of Jet-ECDM
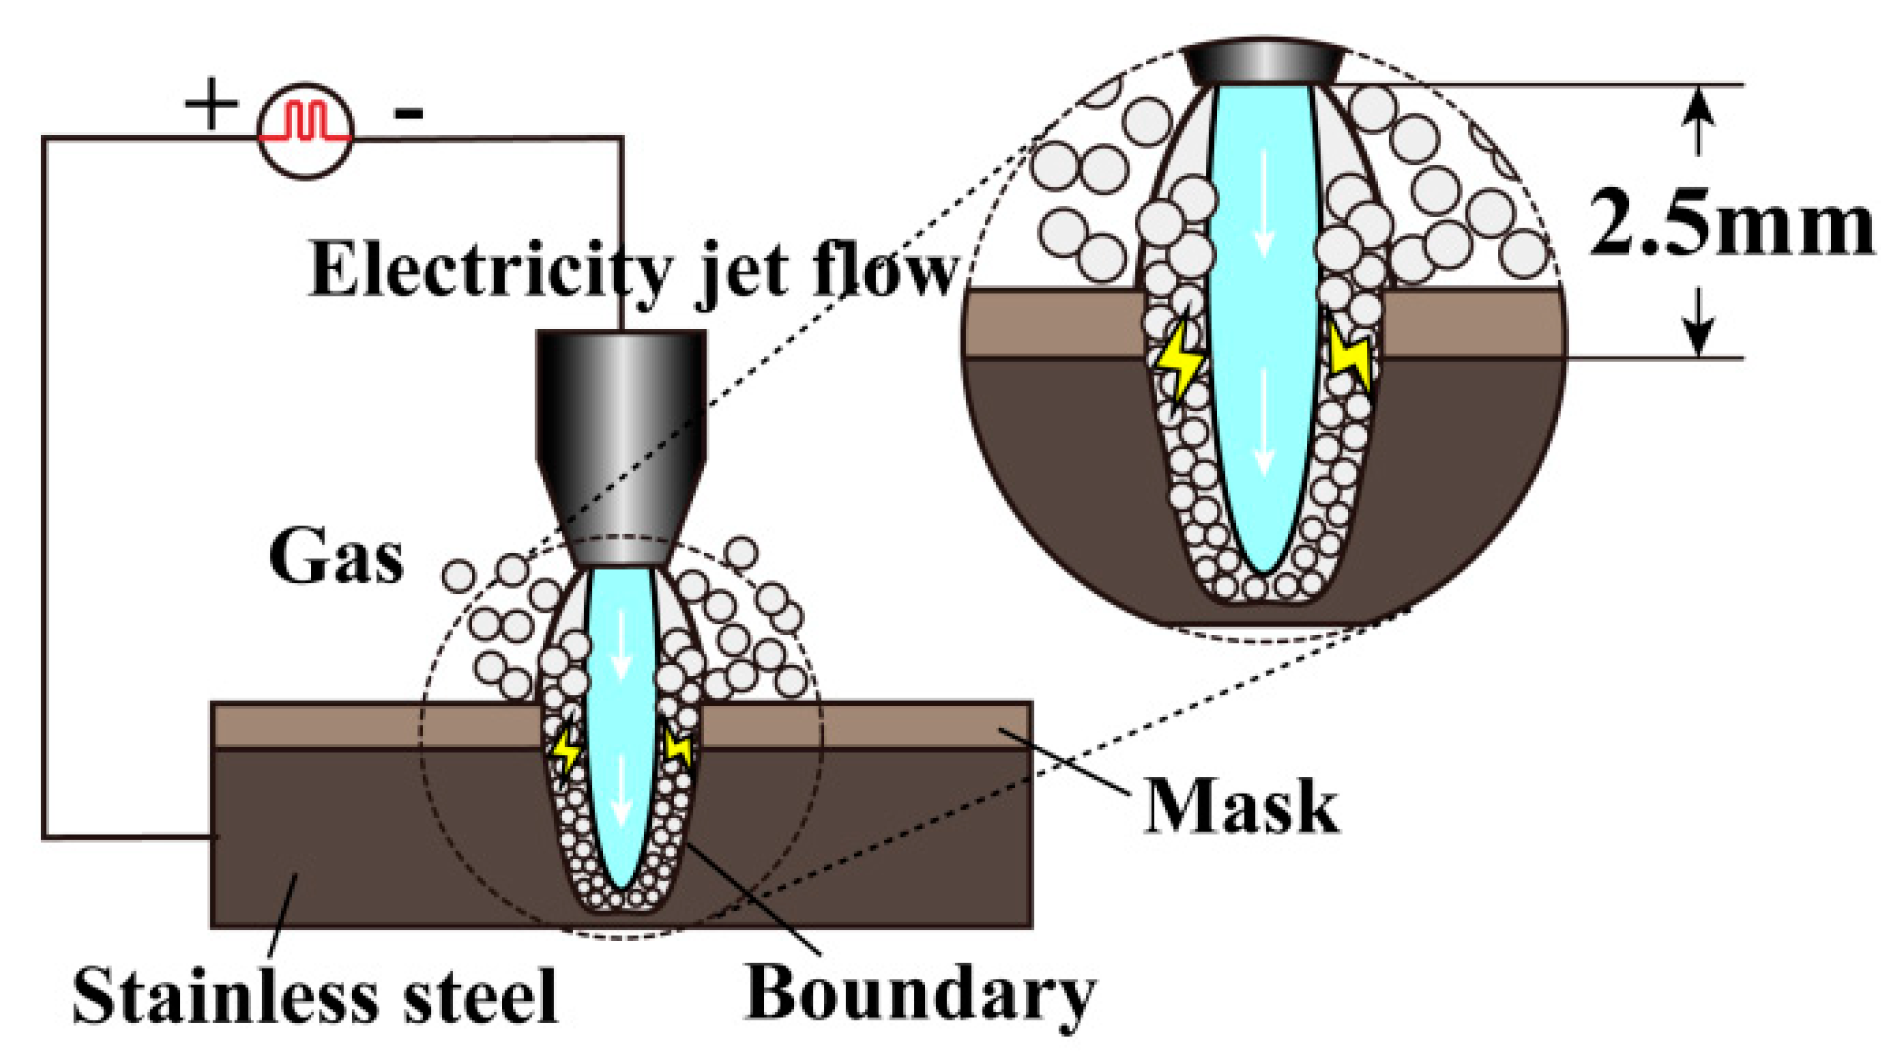
A model of a flow column for pulsed jet electrolytic discharge machining is shown in Figure 10.
The perturbation case is not considered in the model, and the liquid jet between the two is simplified to a cylinder with a steady flow and a homogeneous morphology. Around its periphery is air, and the air and liquid electrical jets have a strict boundary (gas–liquid boundary). The thick grey arrows represent the direction of the jet, where the electrolyte is ejected from top to bottom under high voltage and pressure conditions, working on the stainless steel workpiece directly below.
In the processing of stainless steel under the action of jet electrolytic discharge, the electrolytic reaction occurs first when the electrolyte jet reaches the surface of the workpiece, i.e., the removal of material from the surface of the anode workpiece is based on electrochemical dissolution between the electrodes, a special oxidation–reduction process. The oxidation process takes place on the surface of the anode workpiece, and the reduction process takes place on the surface of the cathode tool.
The metal dissolution and oxygen precipitation reactions that occur at the anode surface are described by Equations (3)–(5).
The cathode surface is dominated by the hydrogen precipitation reaction, described by Equation (6).
From Equations (3)–(6), we can see that the redox process is accompanied by the precipitation of gas. A part of the gas generated is dissolved in the electrolyte, and the rest escapes in the form of bubbles; the bubble generation efficiency, V(t), can be expressed as
In Equation (7), M(t) is the volume of bubbles escaping per unit of time. N(t) is the total volume of gas produced per unit of time.
The bubble generation efficiency, V(t), is dependent on the type of gas generated and the current density, e.g., V(t) for hydrogen at a current density of 1 A cm−2 is about 0.8. It can be seen that a significant portion of the gas generated is converted into bubbles that escape.
On the other hand, as the electrolyte is ejected from the top down when the jet reaches the processing surface, the liquid column will undergo a wave-like separation due to the force, resulting in a vortex motion, and the air at the gas–liquid boundary will easily be caught in the jet due to the vortex effect and form bubbles, the jet is dispersed in a trumpet shape (trapezoid) from top to bottom, and the more irregular the jet pattern is against the workpiece, the more bubbles are caught at the bottom of the liquid column.
Assuming that the electrolyte is incompressible, both the gravitational and viscous forces of the electrolyte are negligible during the variation of the bubble. Then, according to the Navier–Stoke equation, the bubble formation process in spherical coordinates can be expressed as
Ur(t,r) indicates the radial velocity of the electrolyte at any point. ρl denotes the density of the electrolyte, the value of which is constant. p denotes the pressure of the electrolyte. According to the mobility equation,
Assume that the bubble surface radius is R, and that it is integrated for a change from R to r. Then, the radial velocity can be written as an expression concerning R as
Further integration of the above equation from R to infinity yields
The pressure at the bubble boundary is related to the pressure inside the bubble, Pi, and its surface tension. So, the equation for the final formation of the bubble can be written as
The above equation is a differential equation for the formation of bubbles. r represents the variation of bubble diameter with time. The constants in the equation include the electrolyte density, the boundary, and the surrounding pressure and surface tension coefficients. These quantities are determined by the chemical and physical properties of the electrolyte.
As can be seen, both the gas produced by electrolysis and the gas entrained by the vortex effect become bubbles, which undergo a growth process from small to large. During this process, a variety of factors influence the final bubble size, starting with the type of electrolyte, the voltage of the electrolysis reaction, and the diameter of the electrode during the generation phase. In addition, the surface force, viscosity, and density of the liquid as well as the flow rate of the generated gas also have a direct influence on the final bubble diameter during the bubble growth phase.
Research has shown that the same conditions in the flow of liquid and the static liquid’s (generated by the bubble) volume are different. If the liquid has a velocity component in the vertical direction, when this velocity component is upward, it will produce an additional upward force on the bubble, which can accelerate the detachment of the bubble; the faster the liquid flow rate in this case, the smaller the volume of the generated bubble. Conversely, when the velocity of the liquid is downwards, it will inhibit the detachment of the bubbles, and the volume of the bubbles will increase as the velocity of the liquid increases.
To simplify the problem, the type of liquid used in this experiment, the flow rate, and the hydraulic pressure were analysed, and in this paper, the plural size of the bubbles generated on the surface of the workpiece was taken to be 30 μm.
Simplifying the analysis without sacrificing the basic characteristics, the following assumptions are made: (1) an identical set of bubble nucleation, growth, and separation is formed simultaneously over the entire equivalent surface; (2) the bubbles behave in similar patterns; (3) the nucleation locations of the bubbles are uniformly distributed over the equivalent surface; and (4) the properties of the electrolyte and the electrode surface are constant. The resulting analysis of a single small bubble, in a dielectric composed of electrolyte and bubble, considers a single spherical bubble in the electrode gap, and the electric field distribution within the gap is calculated as shown in Equations (13)–(15) below.
In Equations (13)–(15), is the electric field strength, where φ is the potential, ε is the dielectric constant, ε0 is the vacuum dielectric constant, is the potential shift vector, is the polarisation vector, and q is the free charge density.
Assuming that both the bubble and the electrolyte are homogeneous media and considering the weak conductivity of the bubble and the electrolyte, there should be Equation (16) on the dividing surface of the two at a steady state.
is the current density vector, the angular scale is the normal unit vector at the interface, 1 and 2 represent the medium on both sides of the interface, respectively, and γ is the effective conductivity including leakage current and relaxation loss. Based on the dielectric polarisation effect, Equation (17) should be used.
σ is the free charge surface density on the partition surface, then
In the initial stage, the free charge on the dividing surface σ = 0. As time increases, the free charge on the dividing surface gradually accumulates, and the accumulation process can be approximated as
In Equation (19), σ∞ is the charge density on the dividing surface in the steady state case, and τ is the relaxation time.
Considering the usual dielectric constants and conductivity of gases as well as electrolytes, the relaxation time is about tens to thousands of seconds and can be neglected for the duration of the impulse voltage, i.e., without considering the free charge density on the dielectric dividing surface. Thus, Equation (17) can be reduced to Equation (20).
That is, the distribution of the electric field strength is inversely proportional to the relative dielectric constant, ε, of the medium.
The relative permittivity of the electrolyte, NaNO3, is about 70, and the relative permittivity of air is about 1, so the field strength between the small bubble and the electrolyte is about
where and are the field strengths at the electrolyte and the small bubble, respectively, in addition to the potential difference between the two poles according to
where the integration intervals l1 and l2 are the integration lengths of the electrolyte and the small bubble in the vertical direction, respectively.
When the applied voltage is 400 V, and the nozzle and workpiece distance is 2.5 mm, taking the bubble size of 30 μm, Formulas (21) and (22) calculate that the bubble at the field strength, , is about 61.5 kV/cm. The standard state of the air bubble breakdown of the critical field strength is about 25~30 kV/cm, less than the actual field strength of the bubble, so the bubble will be broken through, and the discharge occurs.
After the first discharge has occurred, the charged particles generated by the discharge hit the liquid molecules, causing the liquid medium to decompose and produce gas. In addition, the huge heat generated by the discharge causes the electrolyte to evaporate and vaporise, further increasing the number of bubbles and gradually forming a bubble channel, where discharge is likely to occur. Small bubbles break through one by one and gradually arrange themselves into small bridges along the direction of the electric field, which run through both poles (i.e., the tool and the workpiece), finally leading to a breakdown of the entire gas–liquid two-phase mixing channel and a bright spark. This is shown in Figure 11.
After the discharge channel reaches the cathode nozzle, the discharge gap is fully conducted and forms a distinctive bright column of light in appearance. When a continuous and stable discharge channel is present, energy is effectively released in the form of electrical, optical, and thermal energy. This conclusion is also consistent with the discharge process captured by the high-speed camera during the experiment.
5. Conclusions
This paper investigates pulsed high-voltage electric jet processing discharges and draws the following conclusions.
- (1)
- An experimental study of high-voltage jet electrolytic discharge was carried out, with a high-speed camera recording the jet flow column. The results show that the discharge channel is preceded by a pilot discharge in the middle of the bottom mask hole, with the discharge channel developing bottom-up along the middle of the gas–liquid flow column and achieving penetration between the two poles to achieve a large-gap long-distance discharge. The discharge of the jet stream column is strongest when the tool electrode is moving directly above the workpiece material, which is completely unobstructed by the mask, creating a bright spark channel. The study also shows that Jet-ECDM does not have a bubble-forming gas film process; the discharge is not caused by gas film breakdown and does not have the typical preconditions for ECDM discharge.
- (2)
- Optical microscope observation studies of the workpiece morphology showed that when the machining voltage was 400V, a steady continuous spark appeared and the discharge marks produced at the bottom of the crater had the distinctive feature of a flat circle-like structure with a random specific shape and no serious damage to the mask, which had a good constraint on the machined morphology, inhibiting its width growth, promoting its longitudinal machining, and enhancing the removal of material. The experimental results further show that the high-pressure jet electrolyte helps to remove residual debris within the machined area, and the 3D images of the machined craters show that debris has been effectively removed, even under high pressure and long-distance discharge conditions, improving machining efficiency.
- (3)
- The electric field simulation model of the flow column channel was constructed based on COMSOL software, and the results showed that the field strength and potential at the gas–liquid boundary were both 0, while the potential inside the jet flow column decreased from the initial value to 0 from the bottom up. The study further showed that the electric field action range is limited by the mask to the mechanical area, and the marginal effect of the electric field makes the electric field strength of the exposed workpiece gradually increase from the edge to the centre, and the maximum of the electric field exists in the centre of the mask hole.
- (4)
- The mechanism of the discharge phenomenon is analysed and studied; firstly, an electrolytic reaction occurs to generate gas, which escapes in the form of bubbles. A mathematical derivation shows the dielectric electric field is composed of electrolyte and bubble; the actual field strength inside the bubble of this model is stronger than the critical field strength of air bubble breakdown in the standard state, and the bubble breakdown occurs in the discharge. The small bubbles break down one by one and are gradually arranged in the direction of the electric field to form small bridges, which run through both poles (i.e., the tool and the workpiece) and finally lead to the breakdown of the entire gas–liquid two-phase mixing channel.
Author Contributions
Conceptualization, C.C.; methodology, C.C.; software, C.C.; validation, C.C. and S.W. (Shaofang Wu); formal analysis, C.C. and L.S.; investigation, H.W.; resources, C.C.; data curation, K.L. and S.W. (Siyang Wu); writing—original draft preparation, C.C.; writing—review and editing, S.W. (Shaofang Wu); visualisation, C.C.; supervision, S.W. (Shaofang Wu); project administration, S.W. (Shaofang Wu); funding acquisition, C.C. All authors have read and agreed to the published version of the manuscript.
Funding
This research was funded by Guangzhou Higher Education Quality and Reform Project (2023CJRHJD002) and Key Research Platforms and Projects of Guangdong General Colleges and Universities (No. 2023ZDZX2051).
Institutional Review Board Statement
Not applicable.
Informed Consent Statement
Not applicable.
Data Availability Statement
The data are contained within the article.
Conflicts of Interest
The authors declare no conflict of interest.
References
- Chu, W.S.; Kim, C.S.; Lee, H.T.; Choi, J.-O.; Park, J.-I.; Song, J.-H.; Jang, K.-H. Hybrid manufacturing in micro/nano scale: A review. Int. J. Precis. Eng. Manuf.-Green Technol. 2014, 1, 75–92. [Google Scholar] [CrossRef]
- Singh, T.; Dvivedi, A. Developments in electrochemical discharge machining: A review on electrochemical discharge machining, process variants and their hybrid methods. Int. J. Mach. Tools Manuf. 2016, 105, 1–13. [Google Scholar] [CrossRef]
- Singh, T.; Appalanaidu, B.; Dvivedi, A. Improvement in energy channelization behaviour during micro hole formation in Y-SZ ceramic with magnetic field assisted ECSM process. Measurement 2022, 194, 111079. [Google Scholar] [CrossRef]
- Wüthrich, R.; Ziki, J.D.A. Index—Micromachining Using Electrochemical Discharge Phenomenon, 2nd ed.; Elsevier: Amsterdam, The Netherlands, 2015; pp. 203–208. ISBN 9780323241427. [Google Scholar]
- Singh, T.; Dvivedi, A. On prolongation of discharge regime during ECDM by titrated flow of electrolyte. Int. J. Adv. Manuf. Technol. 2020, 107, 1819–1834. [Google Scholar] [CrossRef]
- Zhang, Y.; Xu, Z.; Xing, J.; Zhu, D. Effect of tube-electrode inner diameter on electrochemical discharge machining of nickel-based superalloy. Chin. J. Aeronaut. 2016, 29, 1103–1110. [Google Scholar] [CrossRef]
- Singh, T.; Dvivedi, A. On energy channelization analysis for ECSM process during fabrication of microchannels in glass. Mater. Manuf. Process. 2021, 37, 1–5. [Google Scholar] [CrossRef]
- Singh, Y.P.; Jain, V.K.; Kumar, P.; Agrawal, D.C. Machining piezoelectric (PZT) ceramics using an electrochemical spark machining (ECSM) process. J. Mater. Process. Technol. 1996, 58, 24–31. [Google Scholar] [CrossRef]
- Singh, T.; Dvivedi, A. Fabrication of micro holes in Yttria-stabilized zirconia (Y-SZ) by hybrid process of electrochemical discharge machining (ECDM). Ceram. Int. 2021, 47, 23677–23681. [Google Scholar] [CrossRef]
- Gupta, P.K.; Dvivedi, A.; Kumar, P. Developments on electrochemical discharge machining: A review of experimental investigations on tool electrode process parameters. Proc. Inst. Mech. Eng. Part B J. Eng. Manuf. 2015, 229, 910–920. [Google Scholar] [CrossRef]
- Singh, T.; Dvivedi, A. On performance evaluation of textured tools during micro-channeling with ECDM. J. Manuf. Process. 2018, 32, 699–713. [Google Scholar] [CrossRef]
- Behzadiana, M.; Otaghsara, S.K.; Yazdani, M.; Ignatius, J. Astate-of-the-art survey of TOPSIS applications. Expert Syst. Appl. 2012, 39, 13051–13069. [Google Scholar] [CrossRef]
- Nayak, B.B.; Mahapatra, S.S. Multi-response optimization of WEDM Process Parameters using the AHP and TOPSIS method. Int. J. Theor. Appl. Res. Mech. Eng. 2013, 2, 109–215. [Google Scholar]
- Nguyen, P.; Banh, L.; Bui, V.; Hoang, D. Multi-response optimization of process parameters for powder mixed electro-discharge machining according to the surface roughness and surface micro-hardness using Taguchi-TOPSIS. Int. J. Data Netw. Sci. 2018, 2, 109–119. [Google Scholar] [CrossRef]
- Parthiban, K.; Duraiselvam, M.; Manivannan, R. TOPSIS based parametric optimization of laser micro-drilling of TBC coated nickel based superalloy. Opt. Laser Technol. 2018, 102, 32–39. [Google Scholar] [CrossRef]
- Ladeesh, V.G.; Manu, R. Machining of fluidic channels on borosilicate glass using grinding-aided electrochemical discharge engraving (G-ECDE) and process optimization. J. Braz. Soc. Mech. Sci. 2018, 40, 1–19. [Google Scholar] [CrossRef]
- Ananthakumar, K.; Rajamani, D.; Balasubramanian, E.; Davim, J.P. Measurement and optimization of multi-response characteristics in plasma arc cutting of Monel 400™ using RSM and TOPSIS. Measurement 2018, 135, 725–737. [Google Scholar] [CrossRef]
- Ishfaq, K.; Maqsood, M.A.; Anwar, S.; Alfaify, A.; Zia, A.W. Analyzing micromachining errors in EDM of Inconel 600 using various biodegradable. J. Braz. Soc. Mech. Sci. Eng. 2022, 44, 249. [Google Scholar] [CrossRef]
- Ishfaq, K.; Maqsood, M.A.; Anwar, S.; Harris, M.; Alfaify, A.; Zia, A.W. EDM of Ti6Al4V under nano-graphene mixed dielectric: A detailed roughness analysis. Int. J. Adv. Manuf. 2022, 120, 7375–7388. [Google Scholar] [CrossRef]
- Ishfaq, K.; Waseem, M.U.; Sana, M. Investigating cryogenically treated electrodes’ performance under modified dielectric(s) for EDM of Inconel (617). Mater. Manuf. Process. 2022, 37, 1902–1911. [Google Scholar] [CrossRef]
- Madhavi, J.B.; Hiremath, S.S. Machining and Characterization of Channels and Textures on Quartz Glass Using μ-ECDM Process. Silicon 2019, 11, 2919–2931. [Google Scholar] [CrossRef]
- Ladeesh, V.G.; Manu, R. Grinding-aided electrochemical discharge drilling in the light of electrochemistry. Proc. Inst. Mech. Eng. Part C J. Mech. Eng. Sci. 2019, 233, 1896–1909. [Google Scholar] [CrossRef]
- Bhargav, K.V.J.; Shanthan, P.; Balaji, P.S.; Sahu, R.K.; Sahoo, S.K. Generation of microholes on GFRP composite using ES-µ-ECDM system. CIRP J. Manuf. Sci. Technol. 2022, 38, 695–705. [Google Scholar] [CrossRef]
- Tripathy, S.; Tripathy, D.K. Multi-attribute optimization of machining process parameters in powder mixed electro-discharge machining using TOPSIS and grey relational analysis. Eng. Sci. Technol. Int. J. 2016, 19, 62–70. [Google Scholar] [CrossRef]
- Han, Y.; Liu, Z.; Cao, Z.; Kong, L.; Qiu, M. Mechanism study of the combined process of electrical discharge machining ablation and electrochemical machining in aerosol dielectric. J. Mater. Process. Technol. 2018, 254, 221–228. [Google Scholar] [CrossRef]
- Julfekar, A.; Karan, P.; Pradeep, D. Effect of tool-electrode material in through-hole formation using ECDM process. Mater. Manuf. Process. 2021, 36, 1019–1027. [Google Scholar]
- Zhang, X.; Song, X.; Ming, P.; Li, X.; Zeng, Y.; Cai, J. The Effect of Electrolytic Jet Orientation on Machining Characteristics in Jet Electrochemical Machining. Micromachines 2019, 10, 404. [Google Scholar] [CrossRef]
- Fan, G.; Chen, X.; Saxena, K.K.; Liu, J.; Guo, Z. Jet Electrochemical Micromachining of Micro-Grooves with Conductive-Masked Porous Cathode. Micromachines 2020, 11, 557. [Google Scholar] [CrossRef] [PubMed]
- He, J.; Wang, Z.; Zhou, W.; Jian, Y.; Zhou, L. Electrolytic Characteristics of Microhole Array Manufacturing Using Polyacrylamide Electrolyte in 304 Stainless Steel. Micromachines 2023, 14, 1808. [Google Scholar] [CrossRef]
- Chen, X.; Dong, B.; Zhang, C.; Luo, H.P.; Liu, J.W.; Zhang, Y.J.; Guo, Z.N. Electrochemical direct-writing machining of microchannel array. J. Mater. Process. Technol. 2019, 265, 138–149. [Google Scholar] [CrossRef]
- Zhan, S.; Lyu, Z.; Dong, B.; Liu, W.; Zhao, Y. Cathodic discharge plasma in electrochemical jet machining: Phenomena, mechanism and characteristics. Int. J. Mach. Tools Manuf. 2023, 187, 104015–104032. [Google Scholar] [CrossRef]
- Mayank, G.; Fuchen, C.; Masanori, K. Analysis of Reactions Determining Current Efficiency in Electrochemical Machining. Procedia CIRP 2018, 68, 511–516. [Google Scholar] [CrossRef]
Figure 1.
Physical diagram of the experimental device of Jet-ECDM.

Figure 2.
A set of discharge charts: (a) no discharge; (b) discharge; (c) discharge; (d) no discharge.
Figure 2.
A set of discharge charts: (a) no discharge; (b) discharge; (c) discharge; (d) no discharge.

Figure 3.
High-speed camera for high-voltage jet machining discharge diagram: (a) initial stage; (b) development s1; (c) development s2; (d) development s3; (e) penetration stage.
Figure 3.
High-speed camera for high-voltage jet machining discharge diagram: (a) initial stage; (b) development s1; (c) development s2; (d) development s3; (e) penetration stage.

Figure 4.
The shape of the crater machined by ECDM. (a) The beginning of the process; (b) the end of the process.
Figure 4.
The shape of the crater machined by ECDM. (a) The beginning of the process; (b) the end of the process.

Figure 5.
Morphology of craters machined at an applied voltage: (a) 3D colour picture; (b) depth and width dimension drawing.
Figure 5.
Morphology of craters machined at an applied voltage: (a) 3D colour picture; (b) depth and width dimension drawing.

Figure 6.
Morphology of craters machined at an applied voltage.

Figure 7.
Simplified model of the simulation geometry.

Figure 8.
Mesh generation of the simulation model: (a) 3D Mesh1; (b) 3D Mesh2; (c) 3D Mesh3.

Figure 9.
Voltage clouds and current density curves corresponding to different voltages: (a) 350 V; (b) 400 V; (c) 450 V; (d) 500 V.
Figure 9.
Voltage clouds and current density curves corresponding to different voltages: (a) 350 V; (b) 400 V; (c) 450 V; (d) 500 V.


Figure 10.
Partial enlargement of the flow column.

Figure 11.
Schematic diagram of the discharge channel penetration of a jet electrolytic flow.


Table 1.
Discharge Situation Table.
| Machining Voltage | 200 | 225 | 250 | 275 | 300 | 325 | 350 | 375 | 400 | 425 | 450 | 475 | 500 | |
|---|---|---|---|---|---|---|---|---|---|---|---|---|---|---|
| U (V) Machining Gap d (mm) | ||||||||||||||
| 1.5 | × | × | ○ | ○ | √ | √ | √ | ○ | ○ | ○ | ○ | ○ | ○ | |
| 2 | × | × | × | ○ | ○ | ○ | √ | √ | √ | √ | √ | ○ | ○ | |
| 2.5 | × | × | × | × | ○ | ○ | ○ | √ | √ | √ | √ | √ | √ | |
| 3 | × | × | × | × | × | ○ | ○ | ○ | √ | √ | √ | √ | √ | |
×—No discharge. ○—Unstable discharge. √—Discharge.
Table 2.
Simulation Parameters.
| Parameter Name | Numerical Values | Unit |
|---|---|---|
| Voltage | 350, 400, 450, 500 | V |
| Mask diameter | 500 | μm |
| Mask thickness | 50 | μm |
| Machining clearance | 2.50 | mm |
| 304 stainless steel molar quality | 54.94 | g/mol |
| 304 stainless steel density | 7.77 | g/cm3 |
| Electrolyte temperature | 298.15 | K |
| Electrical conductivity | 7.00 | S/m |
| Faraday’s constant | 96,486 | C/mol |
| Electrochemical equivalents | 2.1 × 10⁻³ | cm3/(A·min) |
Disclaimer/Publisher’s Note: The statements, opinions and data contained in all publications are solely those of the individual author(s) and contributor(s) and not of MDPI and/or the editor(s). MDPI and/or the editor(s) disclaim responsibility for any injury to people or property resulting from any ideas, methods, instructions or products referred to in the content. |
© 2023 by the authors. Licensee MDPI, Basel, Switzerland. This article is an open access article distributed under the terms and conditions of the Creative Commons Attribution (CC BY) license (https://creativecommons.org/licenses/by/4.0/).
Share and Cite
MDPI and ACS Style
Chen, C.; Wu, S.; Wu, H.; Shan, L.; Li, K.; Wu, S. Discharge Characteristics and Mechanisms of Electrolytic Discharge Processing by Jet Mask. Coatings 2023, 13, 1933. https://doi.org/10.3390/coatings13111933
AMA Style
Chen C, Wu S, Wu H, Shan L, Li K, Wu S. Discharge Characteristics and Mechanisms of Electrolytic Discharge Processing by Jet Mask. Coatings. 2023; 13(11):1933. https://doi.org/10.3390/coatings13111933
Chicago/Turabian StyleChen, Chaoda, Shaofang Wu, Hao Wu, Liang Shan, Kangxing Li, and Siyang Wu. 2023. "Discharge Characteristics and Mechanisms of Electrolytic Discharge Processing by Jet Mask" Coatings 13, no. 11: 1933. https://doi.org/10.3390/coatings13111933
Note that from the first issue of 2016, this journal uses article numbers instead of page numbers. See further details here.