Article

Thickness Measurement of Self-Lubricating Fabric Liner of Inner Ring of Sliding Bearings Using Spectral-Domain Optical Coherence Tomography

1
Fujian Provincial Key Laboratory of Terahertz Functional Devices and Intelligent Sensing, School of Mechanical Engineering and Automation, Fuzhou University, Fuzhou 350116, China
2
School of Physics and Information Engineering, Fuzhou University, Fuzhou 350116, China
3
Fujian Longxi Bearing Group Corporation Ltd., Zhangzhou 363000, China
*
Author to whom correspondence should be addressed.
Coatings 2023, 13(4), 708; https://doi.org/10.3390/coatings13040708
Submission received: 15 February 2023 / Revised: 25 March 2023 / Accepted: 28 March 2023 / Published: 31 March 2023

Abstract

:
This study presents a novel and highly accurate method of measuring the geometric thickness of the self-lubricating fabric liner of bearings by combining the optical coherence tomography (OCT) technology and the Hanning-windowed energy centrobaric method (HnWECM). The geometric thickness of wear-resistant coating material is one of the important indicators for evaluating its wear, and the measurement of its geometric thickness is of great significance for preventing coating failure. To address the issue of significant measurement errors caused by using the refractive index of the sample instead of the group refractive index to calculate the material’s geometrical thickness in previous OCT research and applications, our proposed method can accurately measure the geometrical thickness of materials without the influence of the refractive index of the material. Moreover, this method exhibits the advantages of non-contact and high precision, since it utilizes an SD-OCT system, making it a novel method for extracting the physical parameters of composite materials. The geometric thickness of the peeled-off liner obtained from our method is compared with the thickness measured by the spiral micrometer to evaluate its accuracy. The experimental results indicate that the thickness measured by the spiral micrometer was 172 μm, while the maximum difference in the data obtained by our method was 171.261 μm. This suggests that the difference between the two methods is less than 0.430%, which verifies the accuracy and validity of our method. Additionally, the obtained geometric thickness and the optical thickness of the peeled-off liner are used to evaluate the group refractive index of this material. The inside geometrical structure of the self-lubricating fabric liner on the end face and inner ring of the sliding bearing is imaged with this group refractive index. The measurement of the inner ring liner of the sliding bearing proves the flexibility of the fiber-optic OCT and provides a non-contact, nondestructive testing method for measuring the geometric thickness and internal geometric structure of composite materials.

1. Introduction

With the rapid development of new and high performance technologies in industries such as aerospace, energy, power engineering, etc., sliding bearings must operate continuously under high temperatures, high speeds, and high loads. In particular, the lubrication of the relative motion surface has become increasingly important in recent years, as lubrication failure will increase the friction and wear of the lubricated device.
In recent years, an increasing number of researchers have been working to determine better wear-resistant materials. High-entropy alloys prepared using thermal spraying and high-speed laser metal deposition techniques have been proven to have excellent corrosion and wear resistance as surface protective coatings [1]. Adding aluminum-based composite coatings to AA6082 aluminum alloy using laser cladding technology can also provide outstanding wear resistance, and the addition of tungsten carbide and alumina particles can provide additional hardness and wear resistance to the coatings [2]. Similarly, (Ti,Mo)(C,N)–Ni coatings prepared from sintered powders have excellent wear resistance. Researchers have studied the effects of high-velocity oxy-fuel (HVOF) and high-velocity air-fuel (HVAF) spraying techniques on the hardness and grain structure of the coatings, comparing them with other coatings [3]. Covering the contact surface with self-lubricating fiber pads is also an excellent solution. The geometric thickness of the self-lubricating fabric liner, as well as the structural integrity, should be inspected regularly to reduce the accident rate and avoid excessive economic losses. The geometric thickness and microstructure within materials can be measured using several methods.
OCT is considered a useful NDT method to measure the optical thickness of composite materials within the micrometer scale/range. Interestingly, both the optical thickness and the group refractive index of the sample are highly related to the geometric thickness. However, in previous OCT research and applications, the refractive index of the sample was used, instead of its group refractive index, which caused measurement errors in most cases, when broadband lights were used as the system light source. For broadband lights, the group refractive index is defined as the ratio of the group velocity of lights in the vacuum and the velocity in the medium, while the refractive index is the ratio of the velocity of single wavelength light in the vacuum and the medium [4]. To address this issue, this paper presents a novel method that combines the HnWECM and OCT to measure the geometric thickness of the sample with high precision, without the influence of its group refractive index [5]. The accuracy and feasibility of our novel method were verified by comparing the thickness of the peeled-off self-lubricating fabric liner of the bearing, measured by our novel method and spiral micrometer. The difference between these two methods is found to be less than 0.430%. Using the geometric and optical thickness measured by the novel method, the group refractive index of such a self-lubricating fabric liner can be obtained, and the real microstructure within the self-lubricating fabric liner on the end face and inner ring of the sliding bearing is imaged by our homemade fiber-optic OCT system.

2. Literature Review

In addition to OCT, which enables the non-destructive testing of materials, there are other methods available for non-destructive testing, including Fourier transform infrared spectroscopy (FTIR), X-ray photoelectron spectroscopy (XPS), atomic force microscopy (AFM), and time-of-flight secondary ion mass spectrometry (ToF-SIMS) [6,7,8,9,10,11,12]. However, all these methods require users to destroy the samples to obtain a cross-section view that enabled us to visualize the internal features of the samples. Apart from the aforementioned destructive methods, nondestructive testing (NDT) methods can also be used to detect internal flaws in materials to avoid the destruction of the samples, including X-ray tomography technology, ultrasonic tomographic imaging, terahertz imaging technology, etc. [13,14,15,16,17]. Limited to the system’s structure and size of these methods, it is difficult to meet the requirement of the inner ring dimensions of the bearings, especially for small-diameter samples. Meanwhile, due to the insufficient axial resolution of these methods, they cannot be used to measure micrometer-scale samples.
As opposed to the aforementioned methods, fiber-type OCT systems present a high axial resolution, lateral resolution, and flexibility, and they are generally cost-effective. To this end, these systems have attracted considerable attention in the fields of compound material science in recent years. The time-domain optical coherence tomography (TD-OCT) is based on the principle of low coherent interference and was first proposed in 1991 [18]. However, its measurements were perceived to be time-consuming because its reference beam had to perform mechanical scanning to obtain the cross-section image of the samples. To improve the imaging speed of the first-generation type of OCT system, the second-generation OCT was proposed [19]. This second-generation OCT system was called spectral-domain optical coherence tomography (SD-OCT) and could obtain a cross-section image in a short time.
At the early stage of OCT technology, it was widely used in the field of ophthalmology [18,19,20]. However, both the rapid improvement of the OCT principle of operation and the development of hardware manufacturing technology have provided the OCT systems with significant improvement in terms of their performance, and their application fields quickly expanded; they are now being used in areas such as the preservation of cultural heritage, criminal investigation, the pharmaceutical industry, and nondestructive testing for composite structures [20,21,22,23,24,25]. In all these applications, researchers have shown more concerns about the availability of NDT for composite materials and encouraged the development of more NDT systems to ensure that composite materials are tested adequately with the right NDT tools [26]. Currently, OCT is widely applied to detect the interior structure of polymer materials, textile composites, aerospace materials, etc. [6,27,28,29,30].

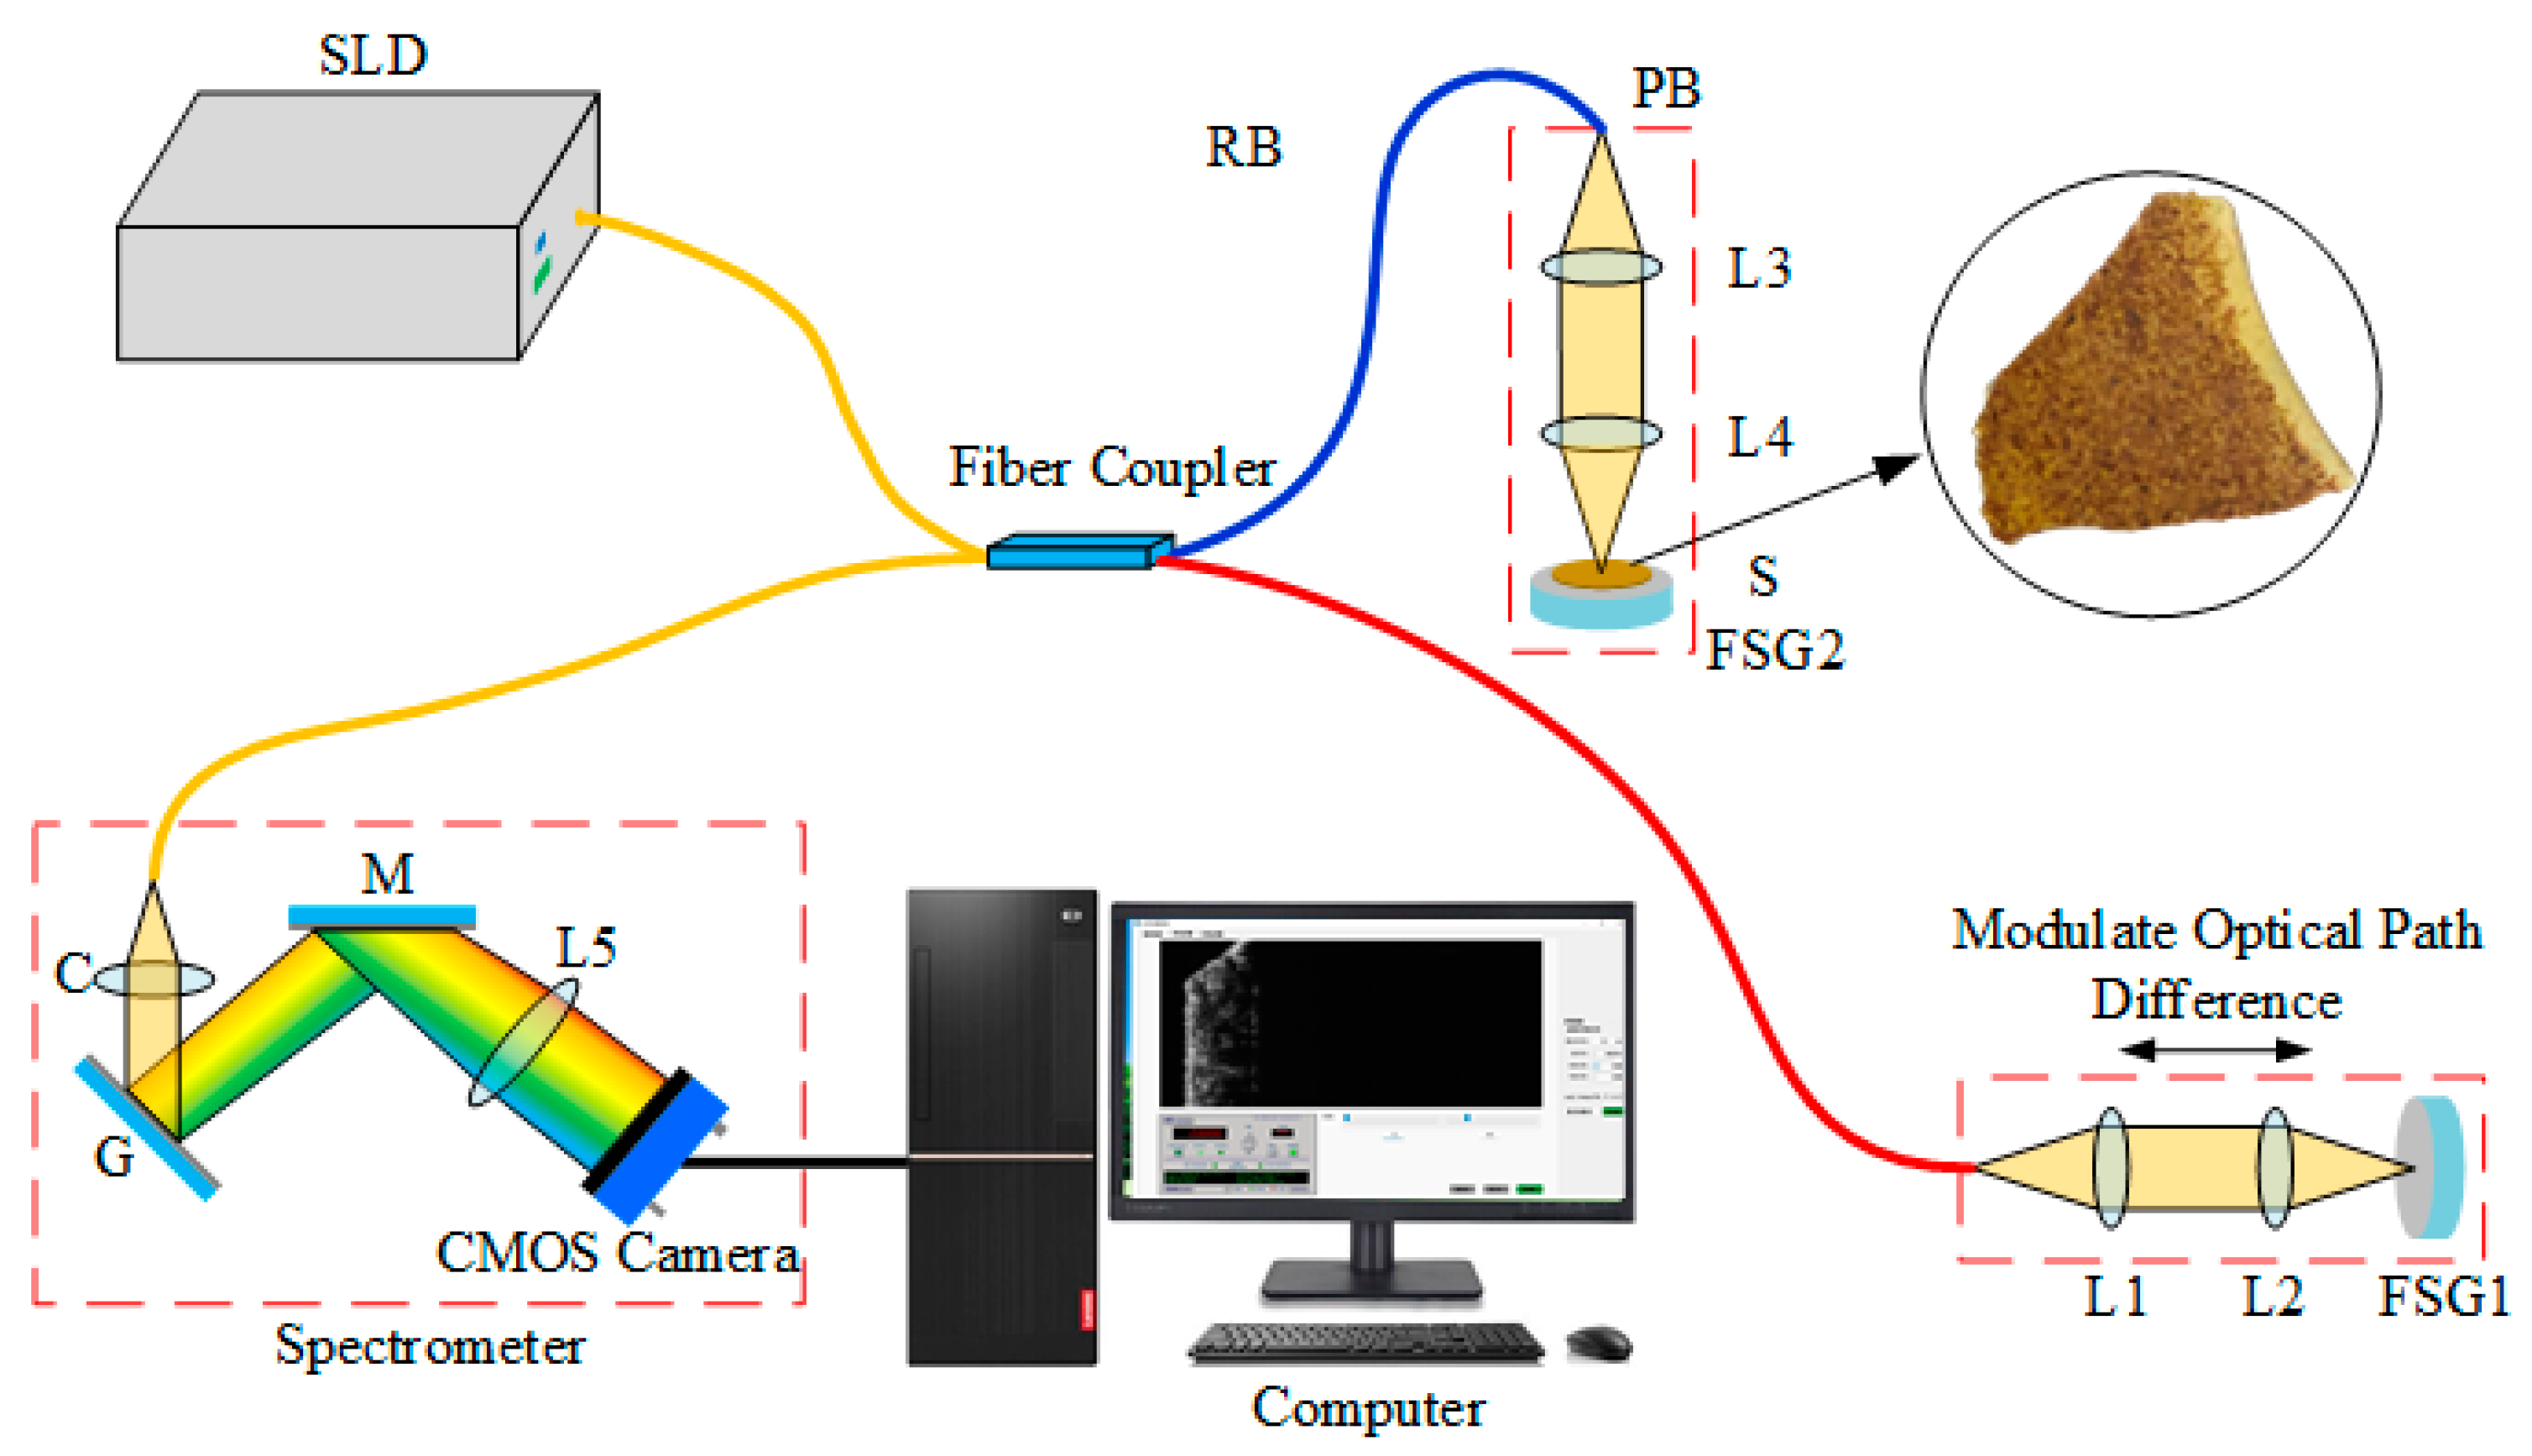
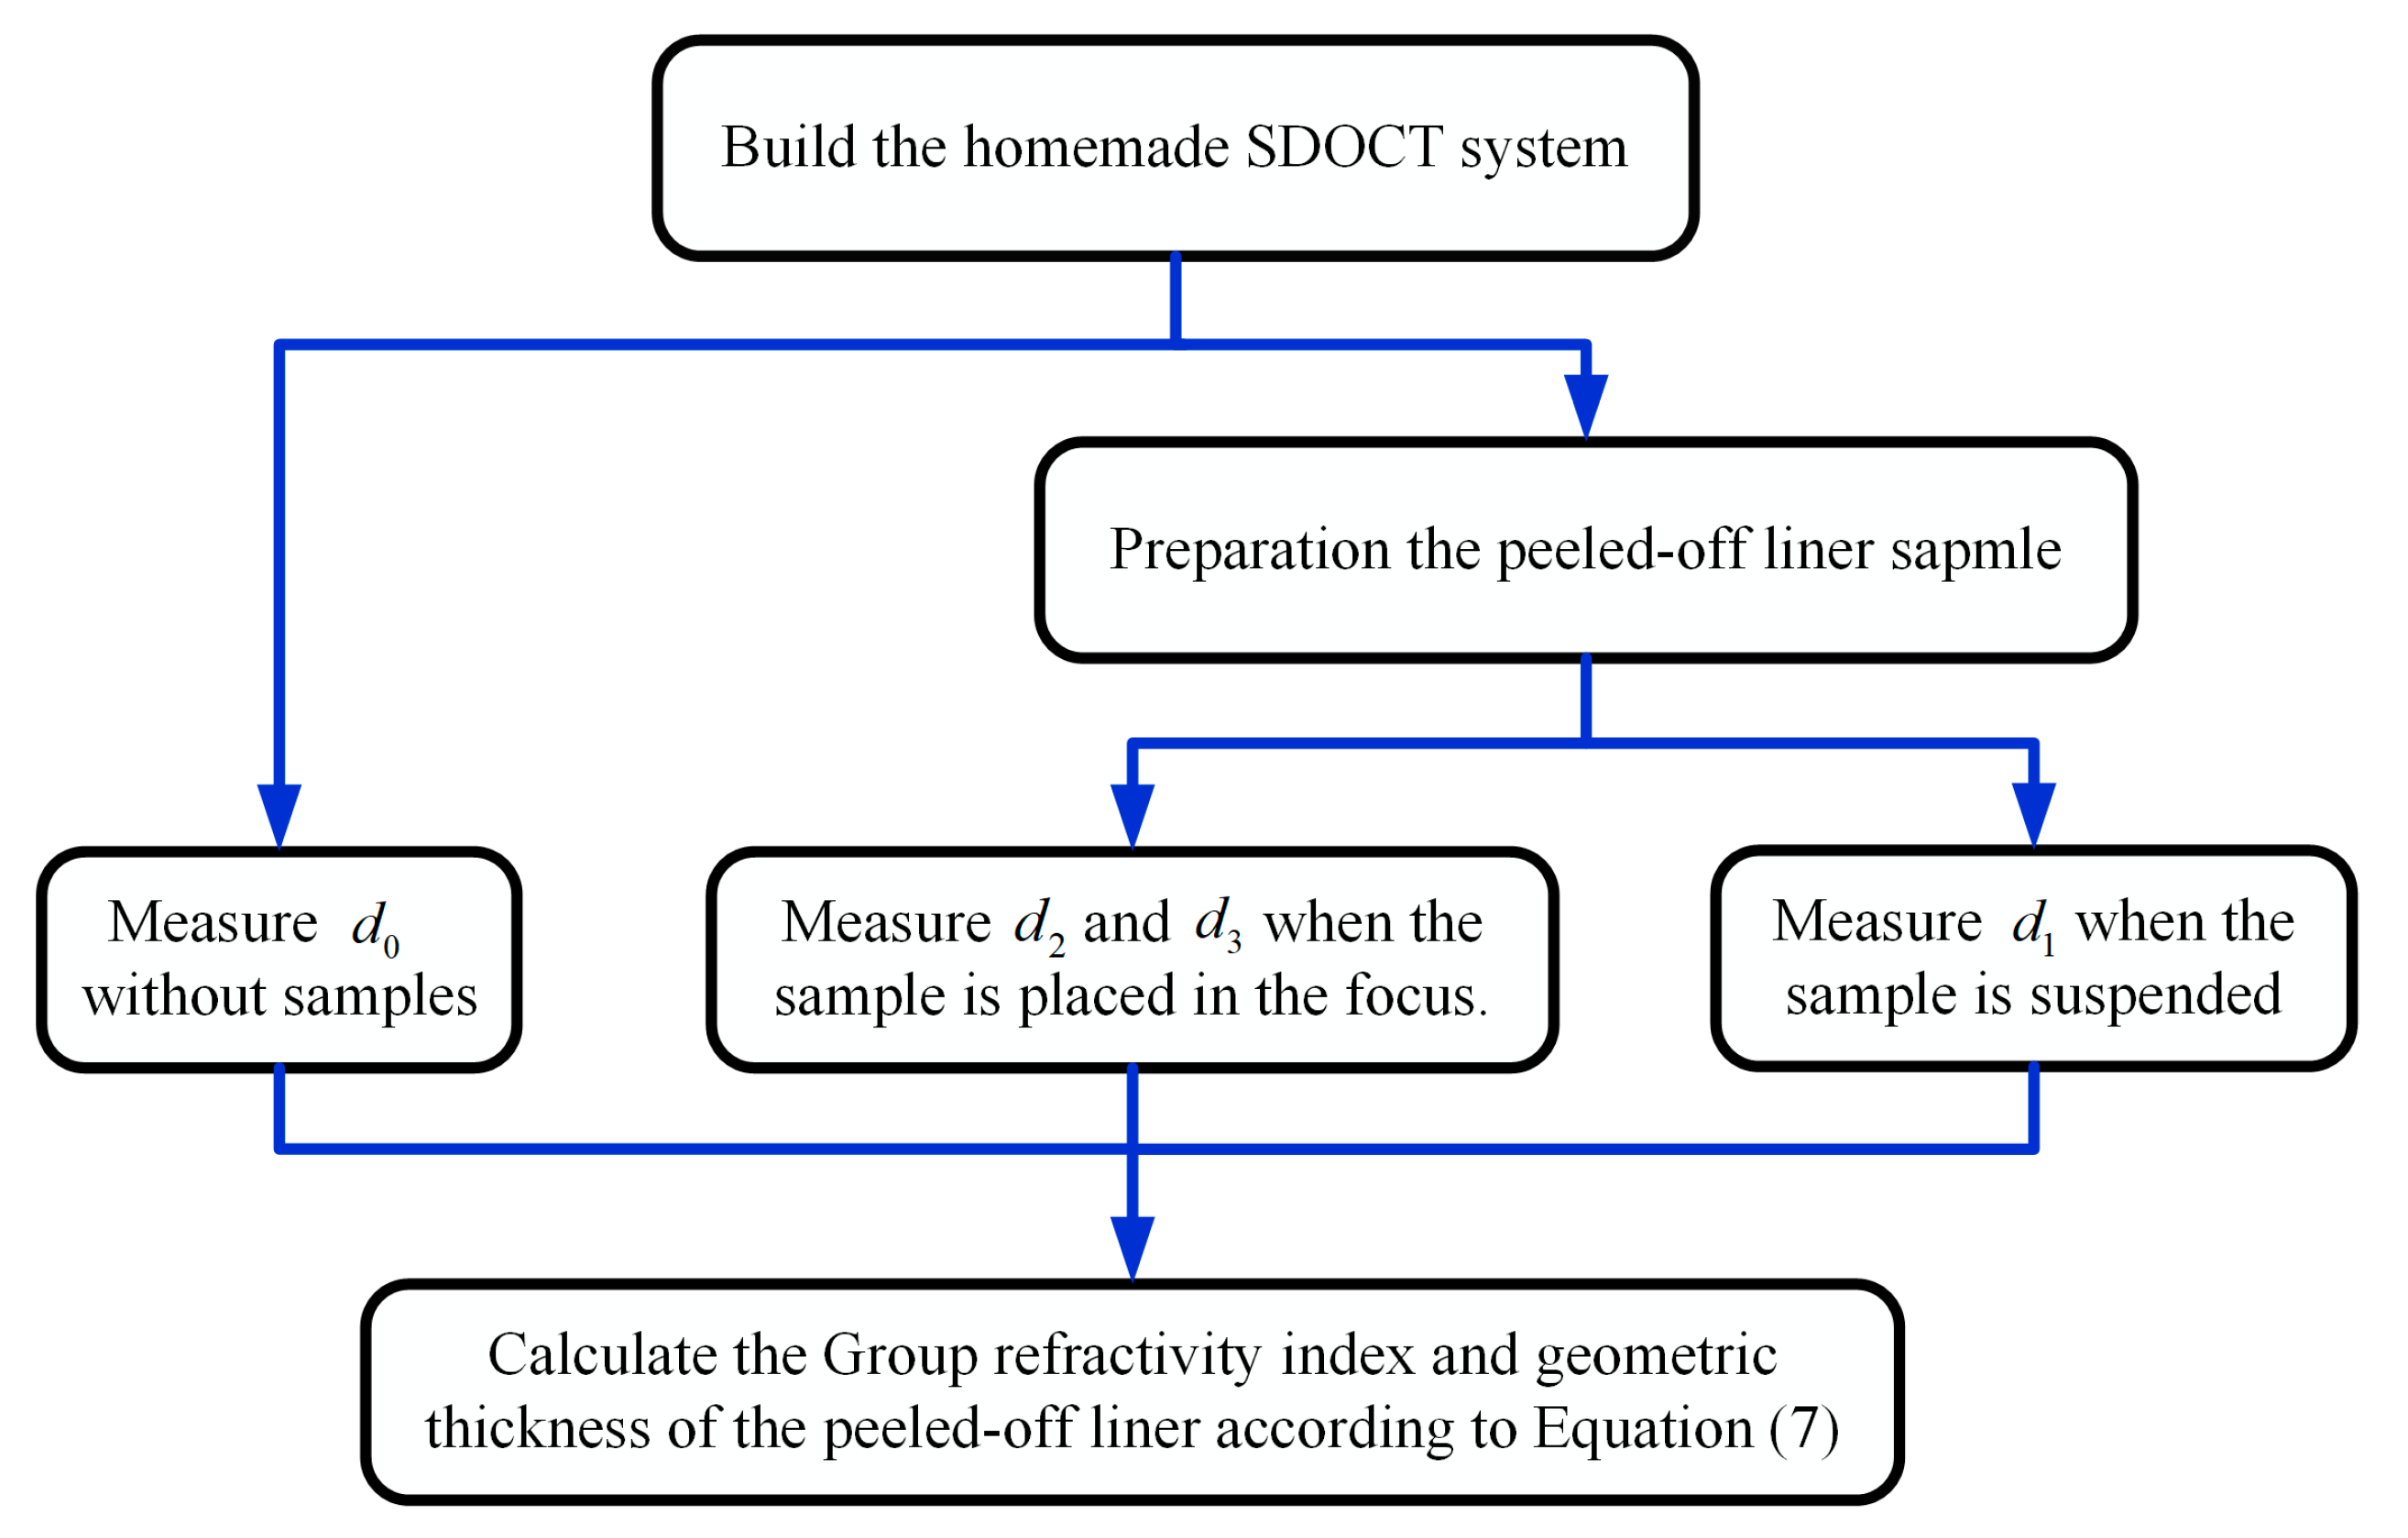
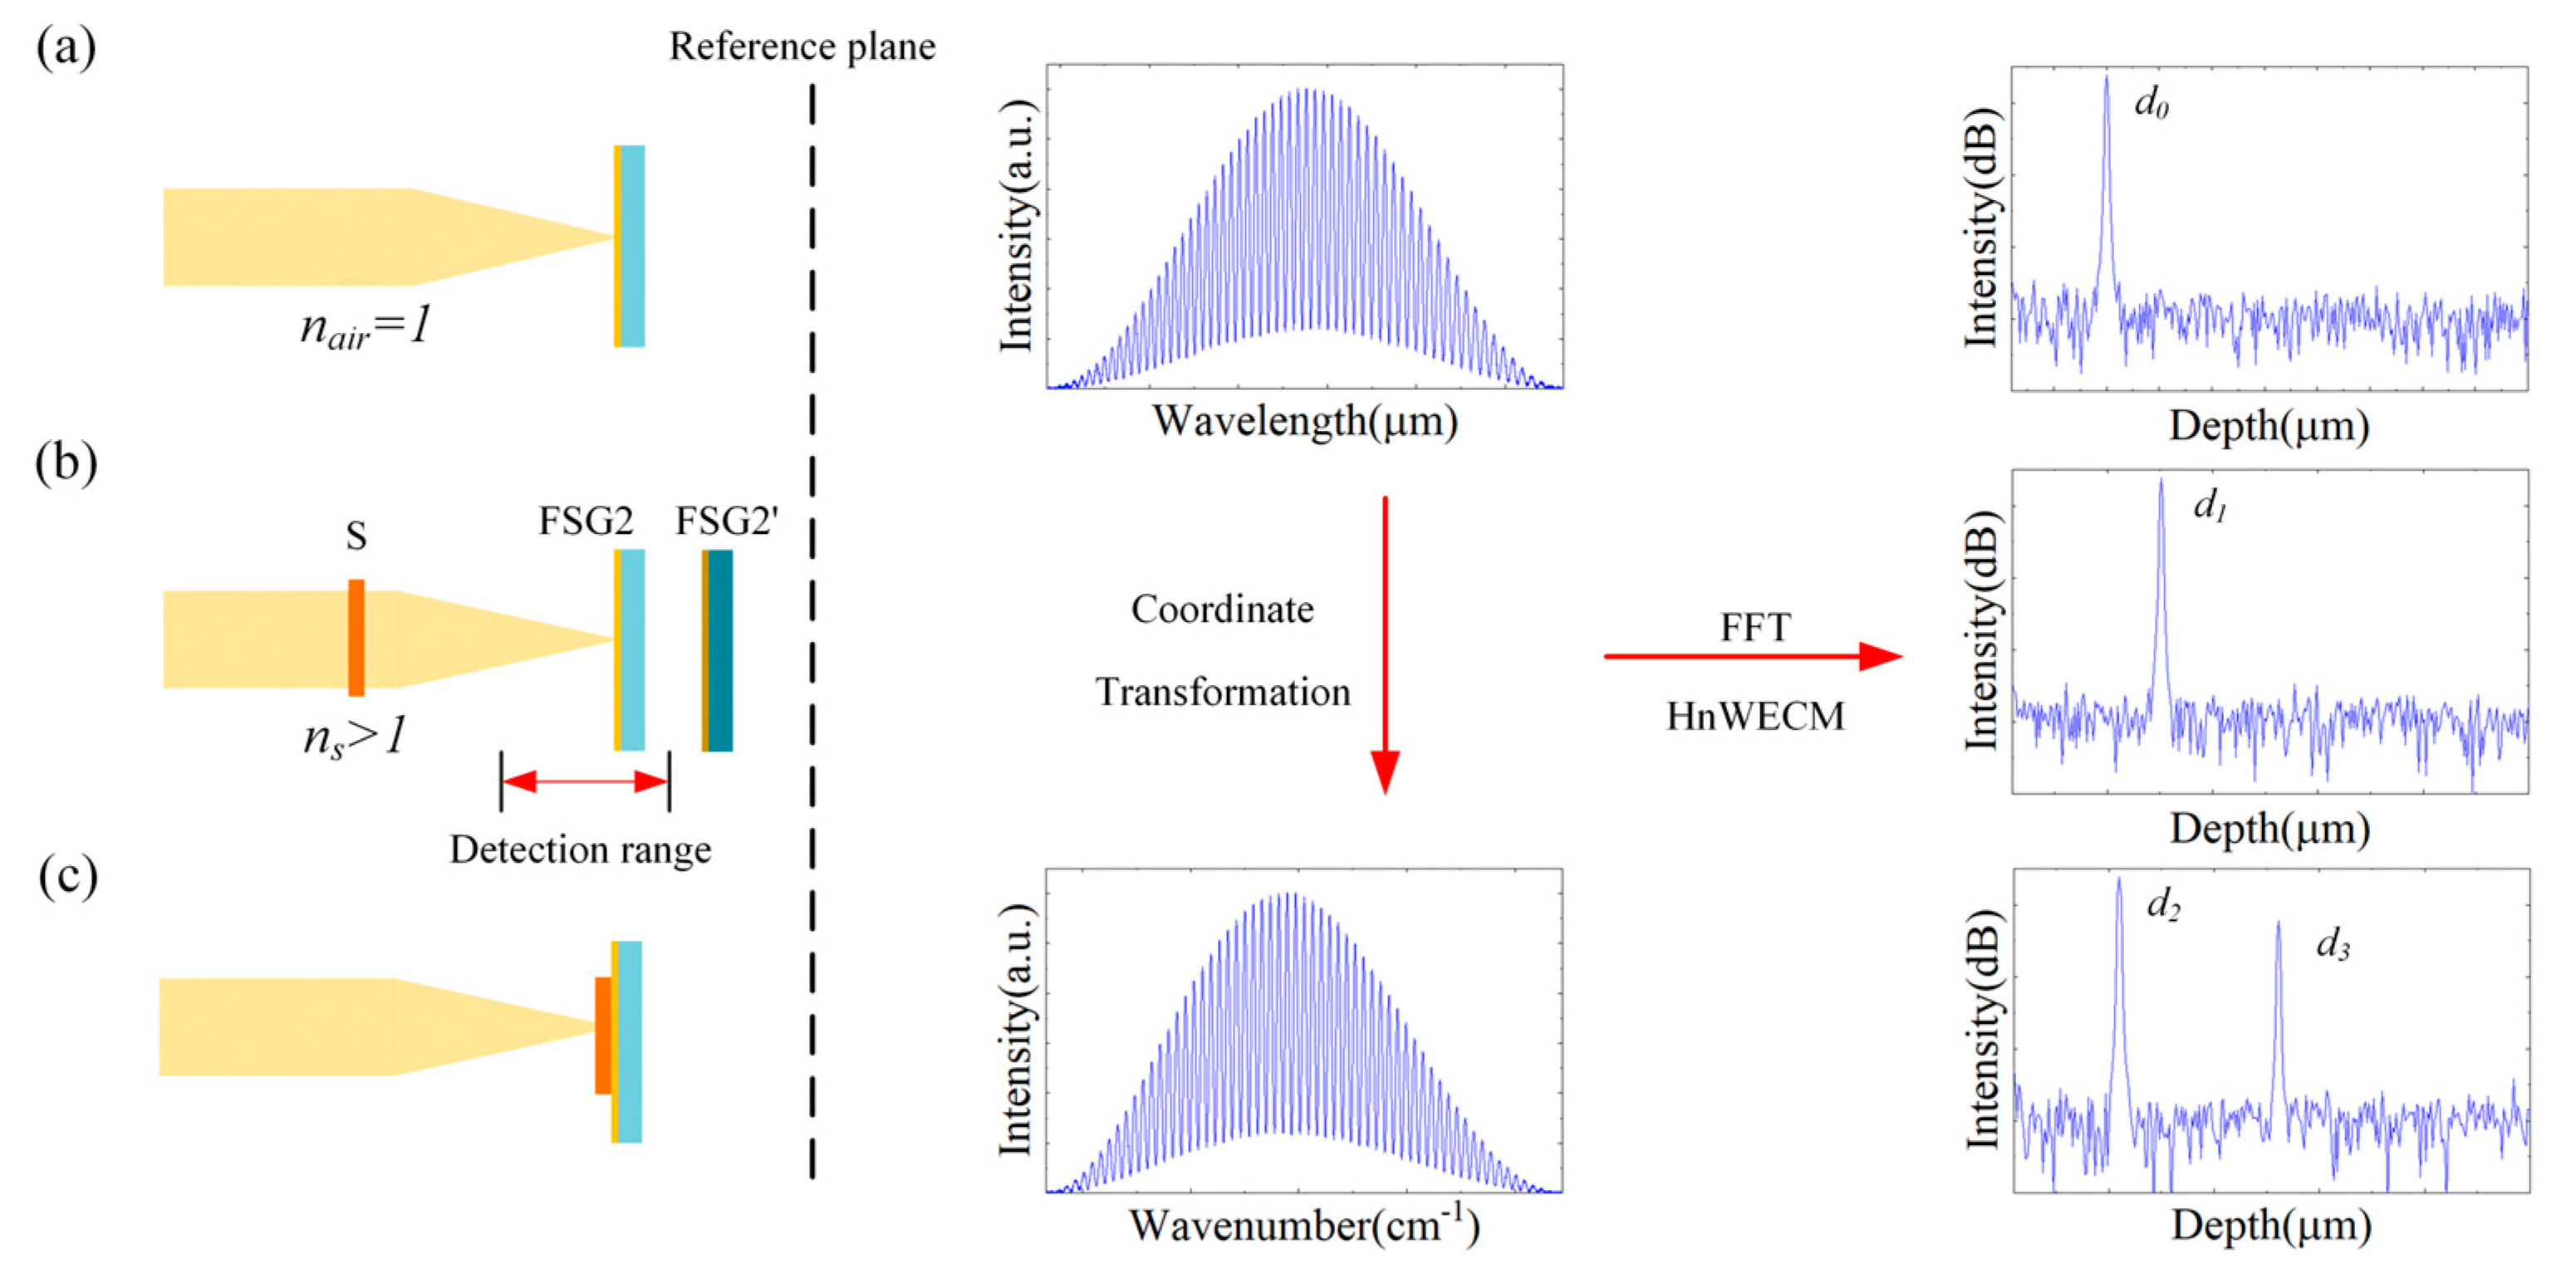
3. Methodology of Group Refractivity and Depth Measurement

The fiber-optic SD-OCT system in this work, involving the fiber-optic Michelson interferometer, a broadband light source, a spectrometer, and signal processing equipment (computer or DSP), was constructed as illustrated in Figure 1. The broadband light emitted from the superluminescent diode is split into the probe beam and reference beam by a single-mode fused fiber optic coupler. The reference beam is collimated into parallel light by lens (L1) and focused on the fused silica glass (FSG1) surface by lens (L2), while the probe beam is collimated into parallel light by lens (L3) and focused on the object by lens (L4). The light reflected from the reference mirror and the light reflected/scattered from different layers of objects are recombined through the optical fiber coupler, and they interfere with each other. The magnitude of the interference signal received by the spectrometer can be calculated as [4]:
I ( λ ) = a I rr λ + b n I nn λ + b 2 Re n m I nm λ exp 2 π j 2 τ nm λ + c 2 Re n I nr λ exp 2 π j 2 τ nr λ
where the first two items are the direct-current (DC) terms, the third item is the self-coherence term, and the fourth item is the required interference term. Variables a , b , and c represent the intensity distribution coefficients of the reference beam, sample beam, and interference term, respectively. I λ is the density function of the broadband light source, Re represents the absolute value of the operation symbol, and 2 τ is the optical path difference of the light reflected from different layers of the sample. Subscripts r , n , and m represent the light reflected or scattered from the reference beam, the n-th layer interface, and the m-th layer interface of the sample, respectively. Therefore, I nr λ means the interference intensity of the light reflected/scattered from the reference beam and the n-th layer interface of the sample; 2 τ nr is the optical path difference of the light reflected from the sample’s n-th layer interface and FSG1.
Converting the wavelength domain interferometric signal into the wavenumber domain, the interferometric signal can be expressed as:
I ( k ) = a I rr k + b n I nn k + b 2 Re n m I nm k exp ( 2 j k τ nm ) + c 2 Re n I nr k exp ( 2 j k τ nr )
where k is the wavenumber ( k = 2 π / λ , λ is the wavelength).
The self-coherence item can be ignored, though it is weak when the measured object is the self-lubricating liner; Equation (2) is simplified as:
I ( k ) = a I rr k + b n I nn k + c 2 Re n I nr k exp ( 2 j k l nr )
By performing the FFT operation of the broadband interferometric signal, the z-domain signal is obtained as follows:
F F T I k = A δ z + 0 + δ z 0 + A δ z + I nr + δ z I nr
where A is the FFT result of a I rr k + b n I nn k , and B is the FFT result of 2 c n I nr k .
The above steps describe the signal processing of SD-OCT. In order to determine the geometric thickness of the peeled-off self-lubricating fabric liner, we need to conduct three sets of experiments, as shown in the experimental stepwise flowchart in Figure 2. In Figure 3, the reference plane is the mirror plane of the fused silica glass (FSG1) at the focus of the reference beam, and S represents the peeled-off self-lubricating fabric liner. First, we placed fused silica glass (FSG2) at the focus of the probe beam, as shown in the left of Figure 3a. Then, we adjusted the optical path difference between the probe beam and the reference beam so that the optical path difference between the probe beam and the reference plane was close to zero because the SDOCT system has the best interference signal near the zero optical path point. Next, we collected the original interference signal, as shown in the upper middle of Figure 3a. Because the original interference signal shows non-linear periodic intervals, performing FFT directly would cause spectral broadening. Therefore, it is necessary to convert the original signal from the wavelength domain to the wavenumber domain to obtain the interference signal with linear periodic intervals, as shown in the lower middle of Figure 3a. In order to improve the calculation accuracy of 2 d 0 , HnWECM was used. Our previous research has shown that HnWECM can improve the resolution to the nanometer level [4]. The FFT result of the interference signal in the wavenumber domain is processed by HnWECM to obtain the accurate sample signal, as shown on the right of Figure 3a. By reading the horizontal coordinate of the highest point of the pulse peak, we can determine the optical path difference between the probe beam and the reference beam, represented by 2 d 0 . Next, we performed the second data collection, the only difference being that the sample was placed at a certain distance from FSG2, as shown on the left of Figure 3b. Since the sample is not within the detection range of the probe beam at this time, the system cannot detect the signal of the sample. Additionally, since the refractive index of the sample ( n s ) is greater than the refractive index of air ( n a i r ), the sample will increase the optical path of the probe beam to reach FSG2, ultimately increasing the optical distance of FSG2, represented by FSG2’. By using the same data processing method, we can obtain 2 d 1 , as shown on the right of Figure 3b The difference between 2 d 0 and 2 d 1 can be expressed as the following expression:
2 d 1 2 d 0 = 2 n s n air d
where d is the geometric thickness of the liner, n s is the group refractivity of the liner, and n air is the group refractivity of the air.
Finally, we collected data for the third time, and placed the sample on the upper surface of the FSG2, as depicted on the left side of Figure 3c. As the sample was placed within the detection range of the probe beam, we were able to obtain interference signals from both the upper and lower surfaces of the sample. Following signal processing, we extracted the optical path differences 2 d 2 and 2 d 3 from the right side of Figure 3c. The difference between 2 d 2 and 2 d 3 is the optical thickness of the liner:
2 d 3 2 d 2 = 2 n s d
where 2 d 2 is the optical path difference between the probe light scatter from the peeled-off self-lubricating fabric liner’s upper surface and the reference light reflected from FSG1, and 2 d 3 is the optical path difference between the probe light scatter from the liner’s lower surface and reference light reflected from FSG1. Referring to Equations (5) and (6), the geometric thickness and group reflectivity for the liner can be determined by:
d = d 3 d 2 d 1 d 0 n air n s = d 3 d 2 d
From Equation (7), the parameters n s and d can be calculated as soon as the group refractivity of the air is obtained. The relationship between the air refractivity and wavelength is given as [31]:
n tp = 1 + p n t 1 720.775 1 + p 0.817 0.0133 t 10 6 1 + 0.003661 t n t = 1 + 8342.13 + 2,406,030 130 1 / λ 2 + 15,997 38.9 1 / λ 2 10 8
where n tp is the refractivity of standard air, t  is the temperature in degrees Celsius, p  is the atmospheric pressure in torr, and n t  is the refractivity of standard air at 760 torrs and 15 °C.

4. Experimental Results

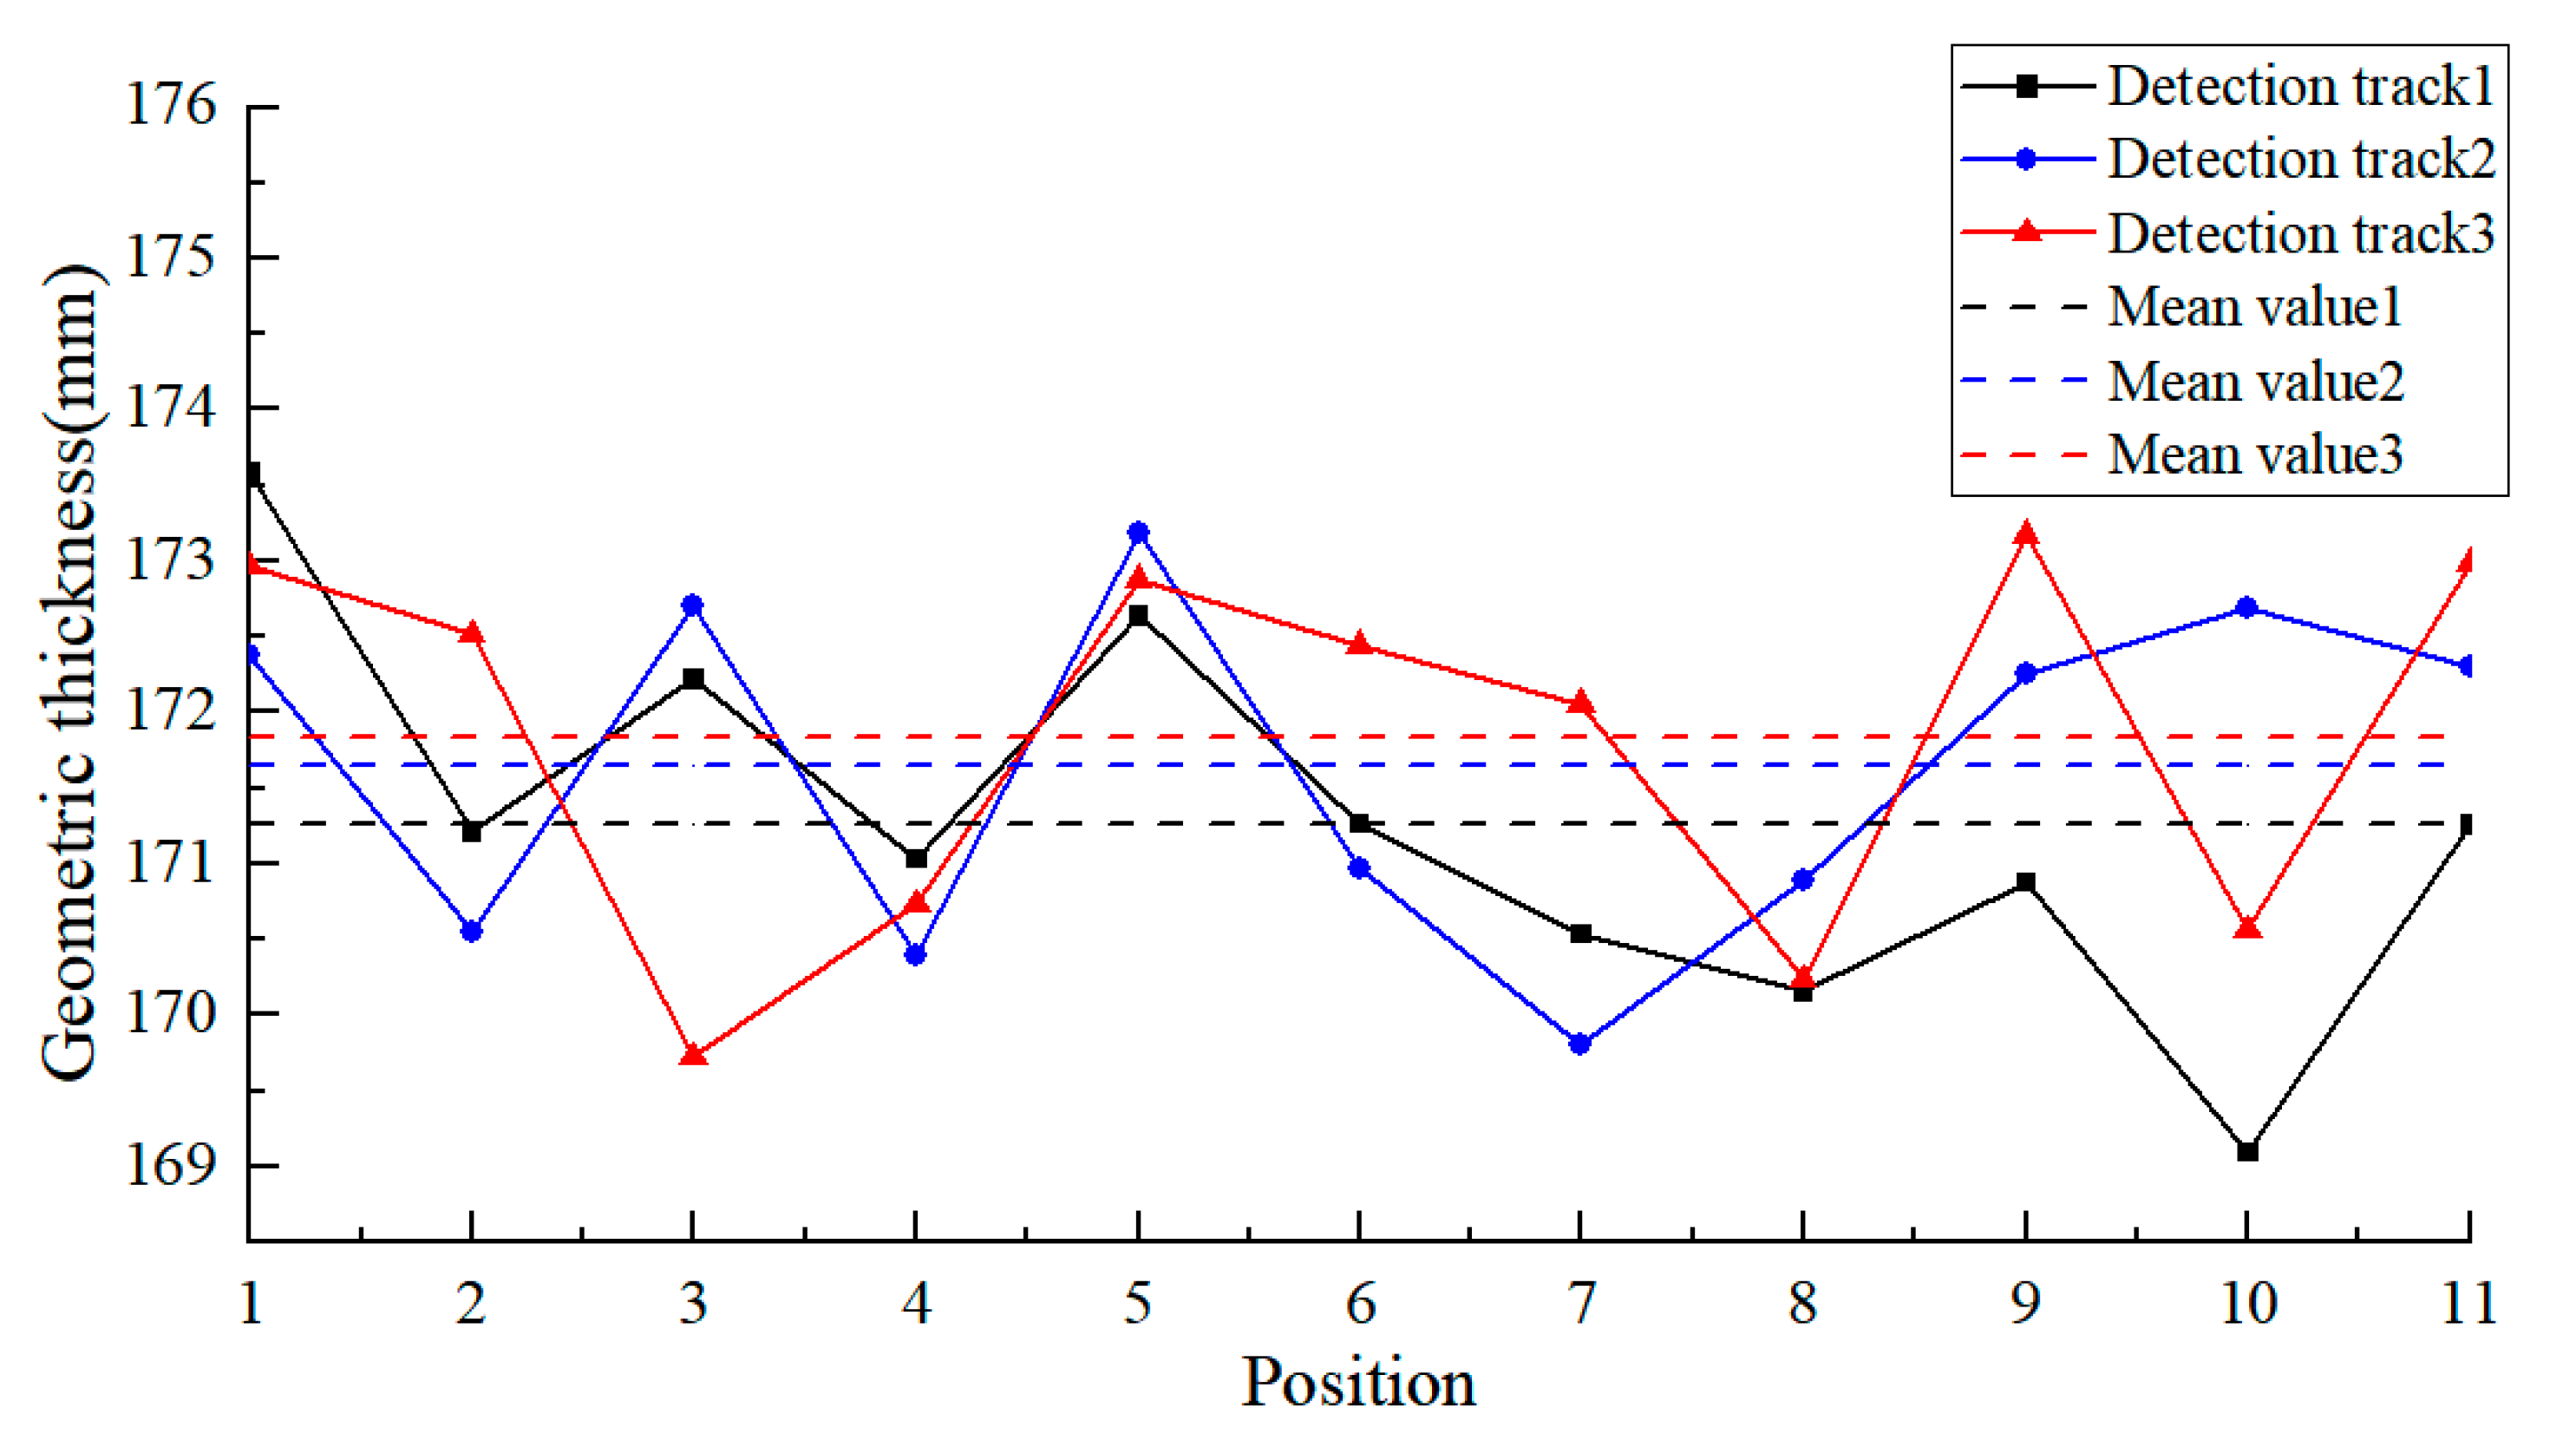
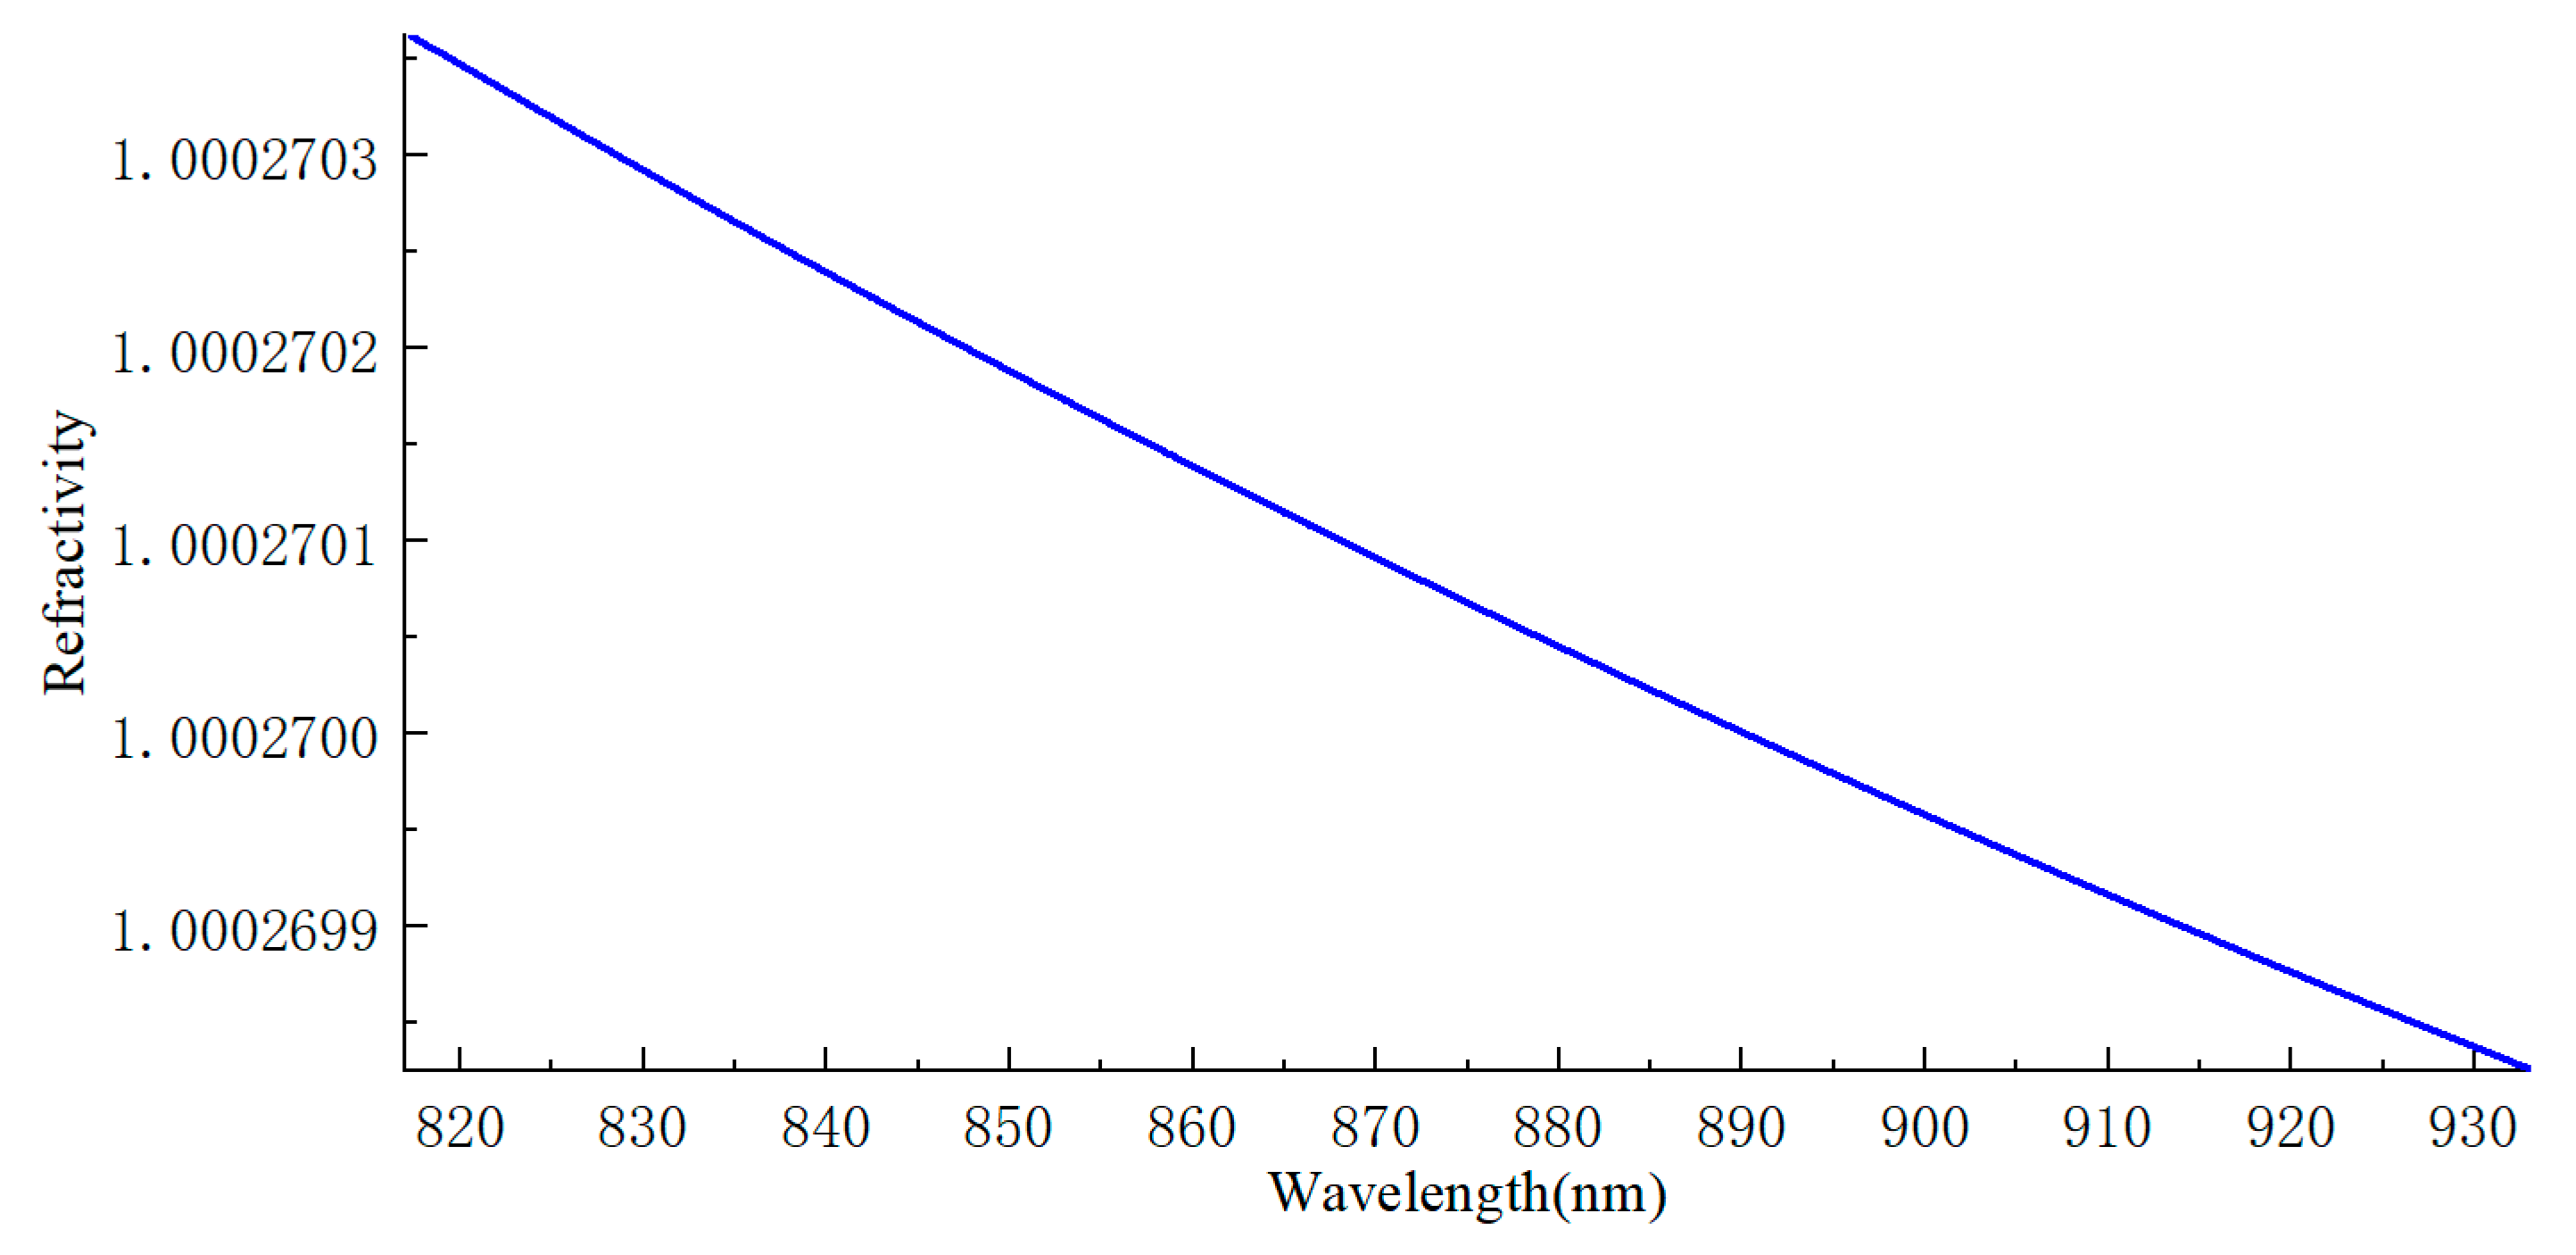
4.1. Geometric Thickness and Group Refractivity Measurement

Experiments regarding geometric thickness and group refractivity measurements for the peeled-off self-lubricating fabric liner were carried out to verify the accuracy and validity of our method. We built a fiber-optic SD-OCT system and conducted related experiments; the experiment set-up photo is shown in Figure 4a. For a wider light source broadband, we synthesized the light source of two super-luminescent diodes (SLD, EXS210006-03, Exalos; SLD, EXS210088-02, Exalos Inc., Schlieren, Switzerland), and then split the light into a reference beam and a probe beam using an 870 nm 2 × 2 single-mode fused fiber optical coupler (50:50, TW850R5A2, Thorlabs Inc., Newton, NJ, USA). The reference beam has two lenses (L1 is a collimator with a 25 mm focal length, and L2 is a focusing lens with a 25 mm focal length) and a fused silica glass (FSG1 to reflect the reference light). The probe beam consists of two lenses (L3 is a collimator with a 25 mm focal length, and L4 is a focusing lens with a 25 mm focal length). The diameter of the sleeves we used in the reference beam and the probe beam is 25.4 mm. A homemade spectrometer consisting of a collimator ( f = 50 mm), a diffraction grating (1200 grooves/mm, GR25-1208, Thorlabs Inc., Newton, NJ, USA), a mirror, and a 12-bit CMOS camera (LA-GM-04K08A, Teledyne DALSA Inc., Waterloo, Canada) was used to detect the interferometric signals. The spectrometer’s spectrum range was 817.3–933.3 nm, and it can provide a theoretical axial resolution of 3.29 μ m . Spectrum signals from the CMOS camera were transferred to a personal computer, analyzed, and displayed. A peeled-off self-lubricating fabric liner was used as the sample. The sample was moved by an X-Y motorized translation stage (25 mm travel range, MTS25/M-Z8, Thorlabs Inc., Newton, NJ, USA).
Using the method mentioned in Section 2, we measured the thickness of the peeled-off self-lubricating fabric liner at the different detection tracks (length: 600 µm) in Figure 4b. We have listed the detailed data for detection track 1 in Table 1 and plotted the data for detection track 2 and detection track 3 in the form of a line chart, together with detection track 1, in Figure 5. Below, we will take detection track 1 as an example to explain briefly our measurement process and data calculations. First, we put the FSG2 in the probe beam as a sample and obtain its tomographic signal on the glass surface, as shown in Figure 4c. From the tomographic signal, a series of d0 at the dotted line was accurately calculated with the help of the HnWECM. Then, the peeled-off self-lubricating fabric liner was placed above the FSG2, without changing other parameters of the OCT system, and another tomographic signal of FSG2 was obtained, as shown in Figure 4d. From Figure 4d, we found that the tomographic image showed a minor fluctuation because of the surface roughness of the liner. Finally, we removed the FSG2 and placed the liner in the focus point of the probe beam. Next, we continued the imaging process, and the tomography image of the liner was obtained (Figure 4e), selecting ten positions on the tomography image to calculate the geometric thickness of the liner. We then obtained d0, d1, d2, and d3 in Table 1 by taking the average of 50 continuity points at each position. The atmospheric pressure in Fuzhou was 103.1 kPa, the temperature was 25 °C at that time, and the spectrometer’s spectrum range was 817.3–933.3 nm. Substituting these parameters into Equation (8) to calculate the refractivity of air, we obtained the refractivity–wavelength curve shown in Figure 6. The difference between the maximum and the minimum refractivity of the air was less than 0.000001, which was negligible in regards to thickness measurement. The air refractivity at the central wavelength (870 nm) is used instead of the group refractivity so that n air is equal to 1.00027. d0, d1, d2, d3, and n air were substituted into Equation (7) to calculate the geometric thickness d of the liner, and the mean value is 171.261 μm. By following the same data processing procedure, we calculated the geometric thickness at detection track 2 and detection track 3 to be 171.646 and 171.841 μm, respectively.
We conducted multiple collections at two different locations, as shown in Table 2. The calculated RMSE demonstrates the stability of our method. To verify the accuracy and feasibility of our novel method, we used the spiral micrometer to measure the geometric thickness of the liner. In consideration of the probe head of the spiral micrometer being a circular plane, the thickness measured by the spiral micrometer is the mean value of the measurement plane. Therefore, we ensure that the measurement plane covers the dotted line position shown in Figure 4b. The results of three measurements are listed in Table 3. The mean value of the geometric thickness measured by our novel method is less than 0.430% of that measured by the spiral micrometer. The accuracy and feasibility of our novel method have been confirmed. Substituting d2, d3, and d into Equation (7), the value of n s is 1.52.

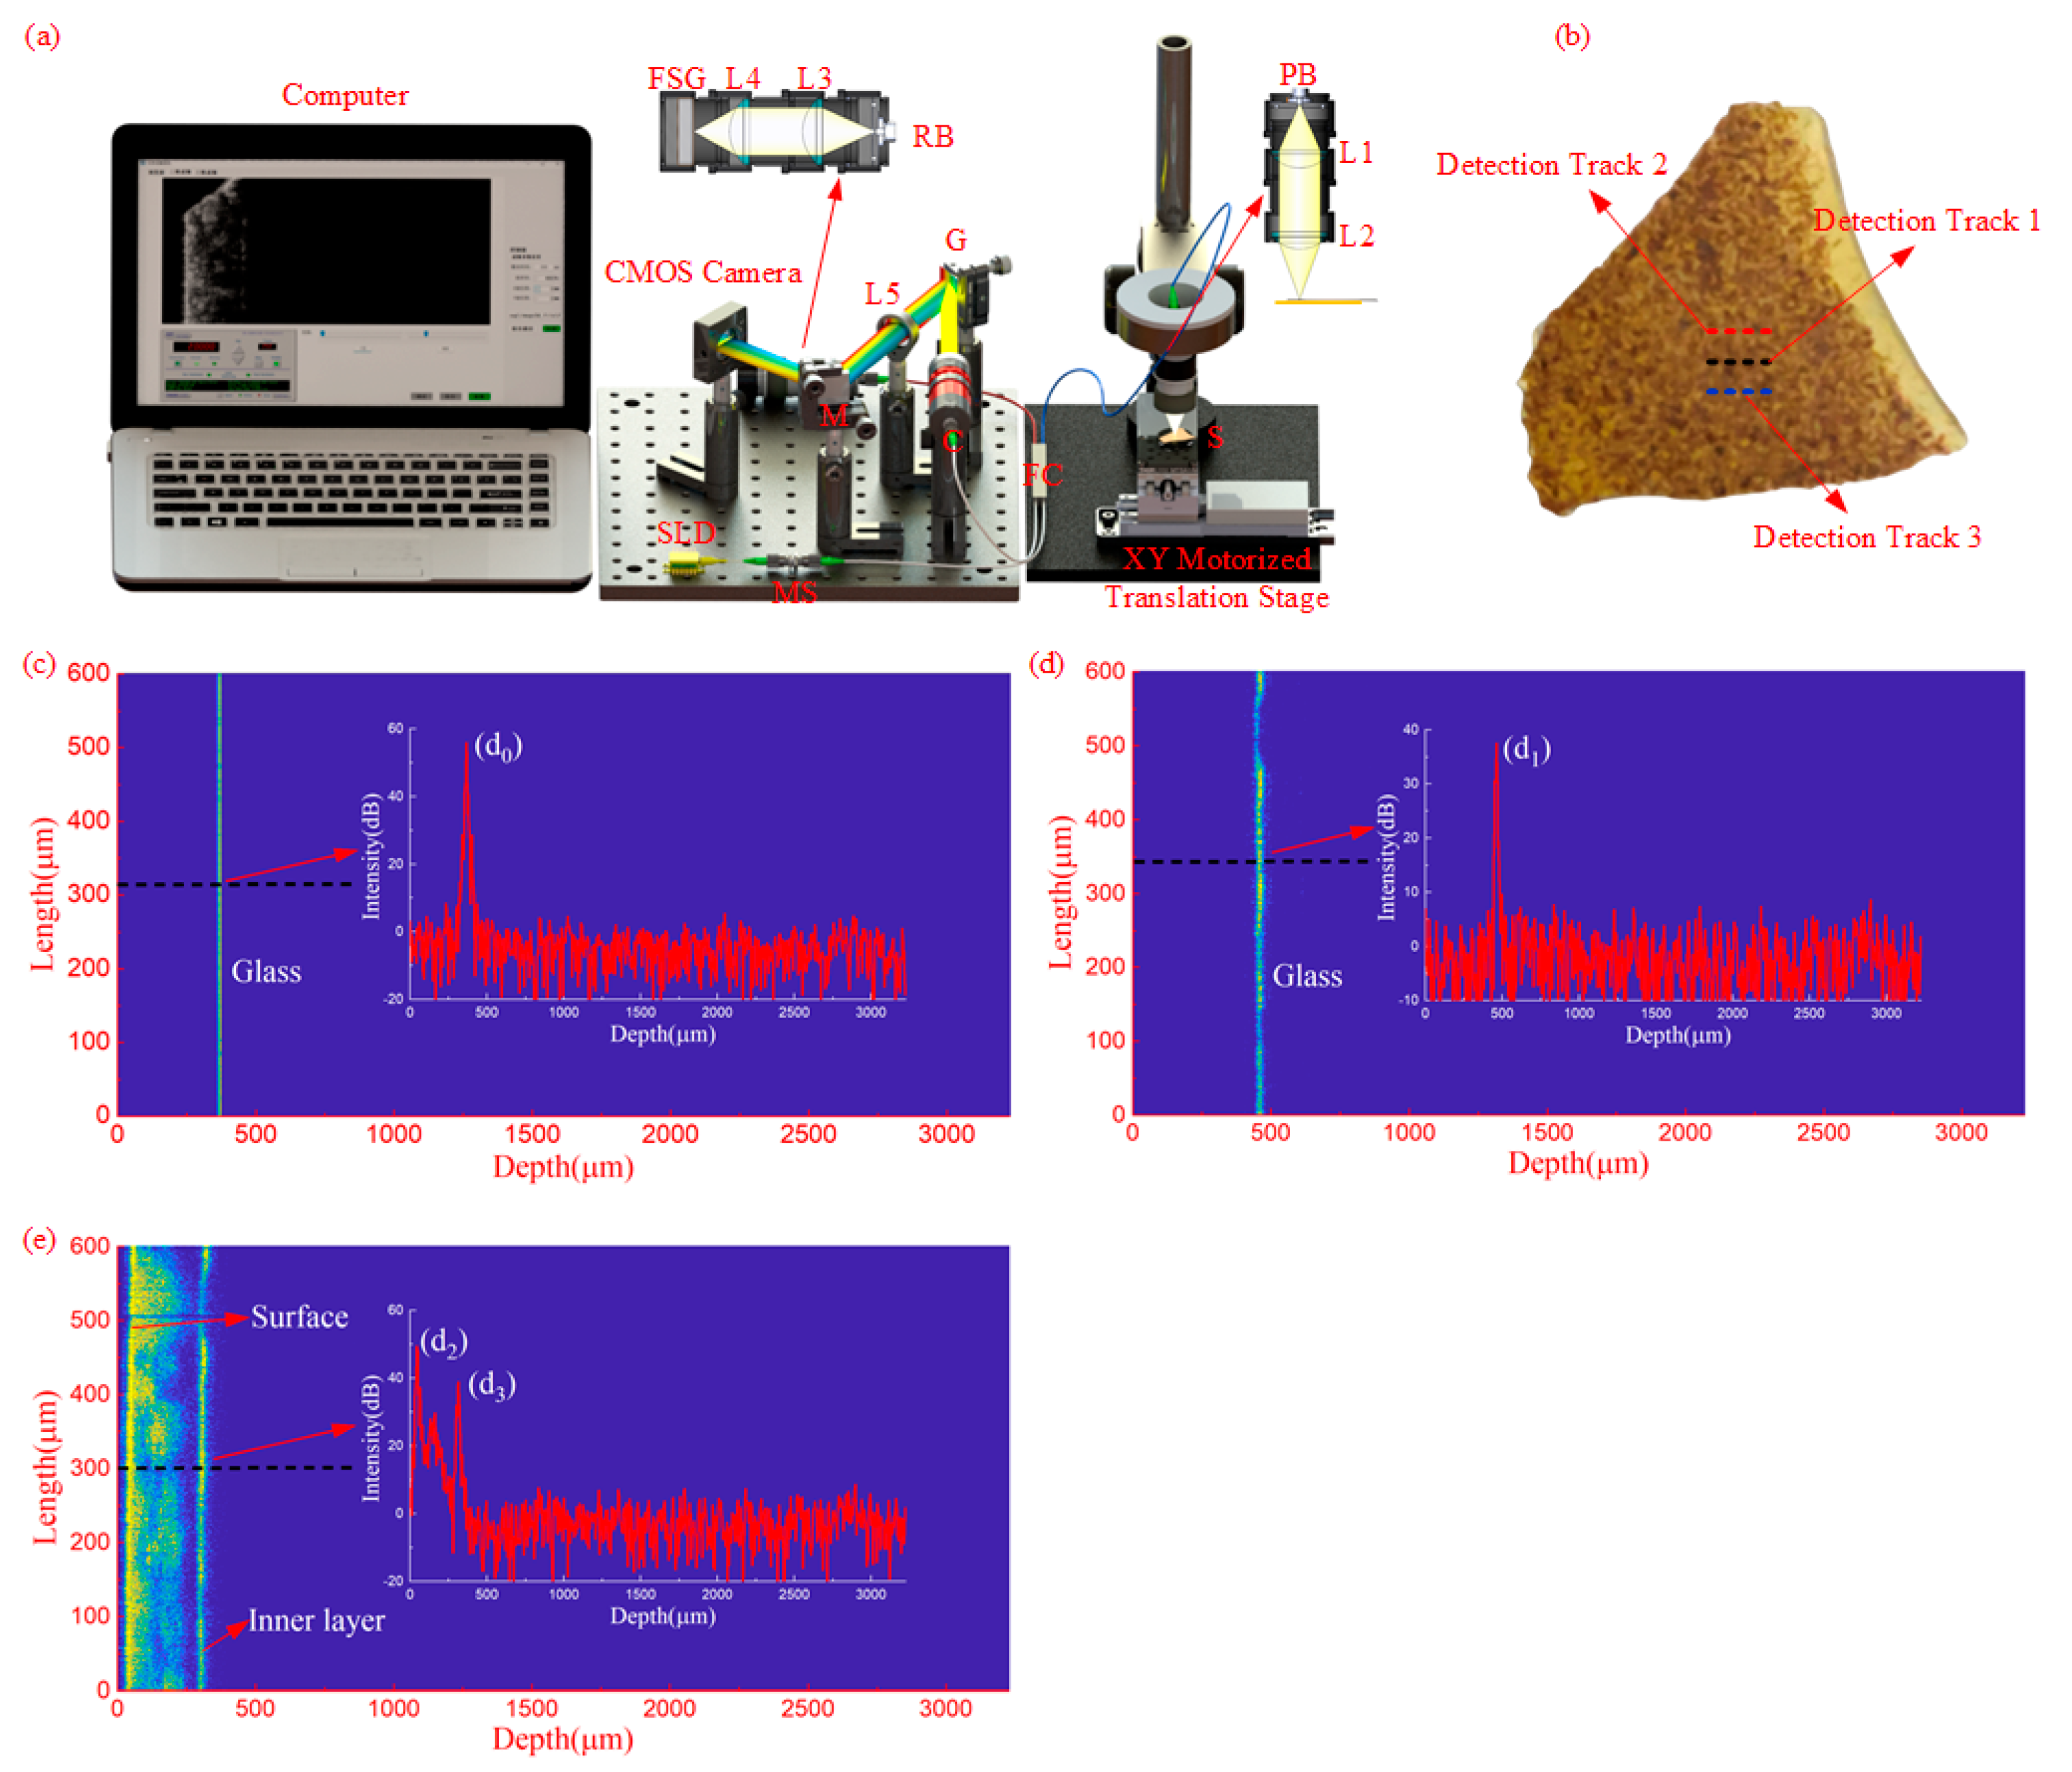
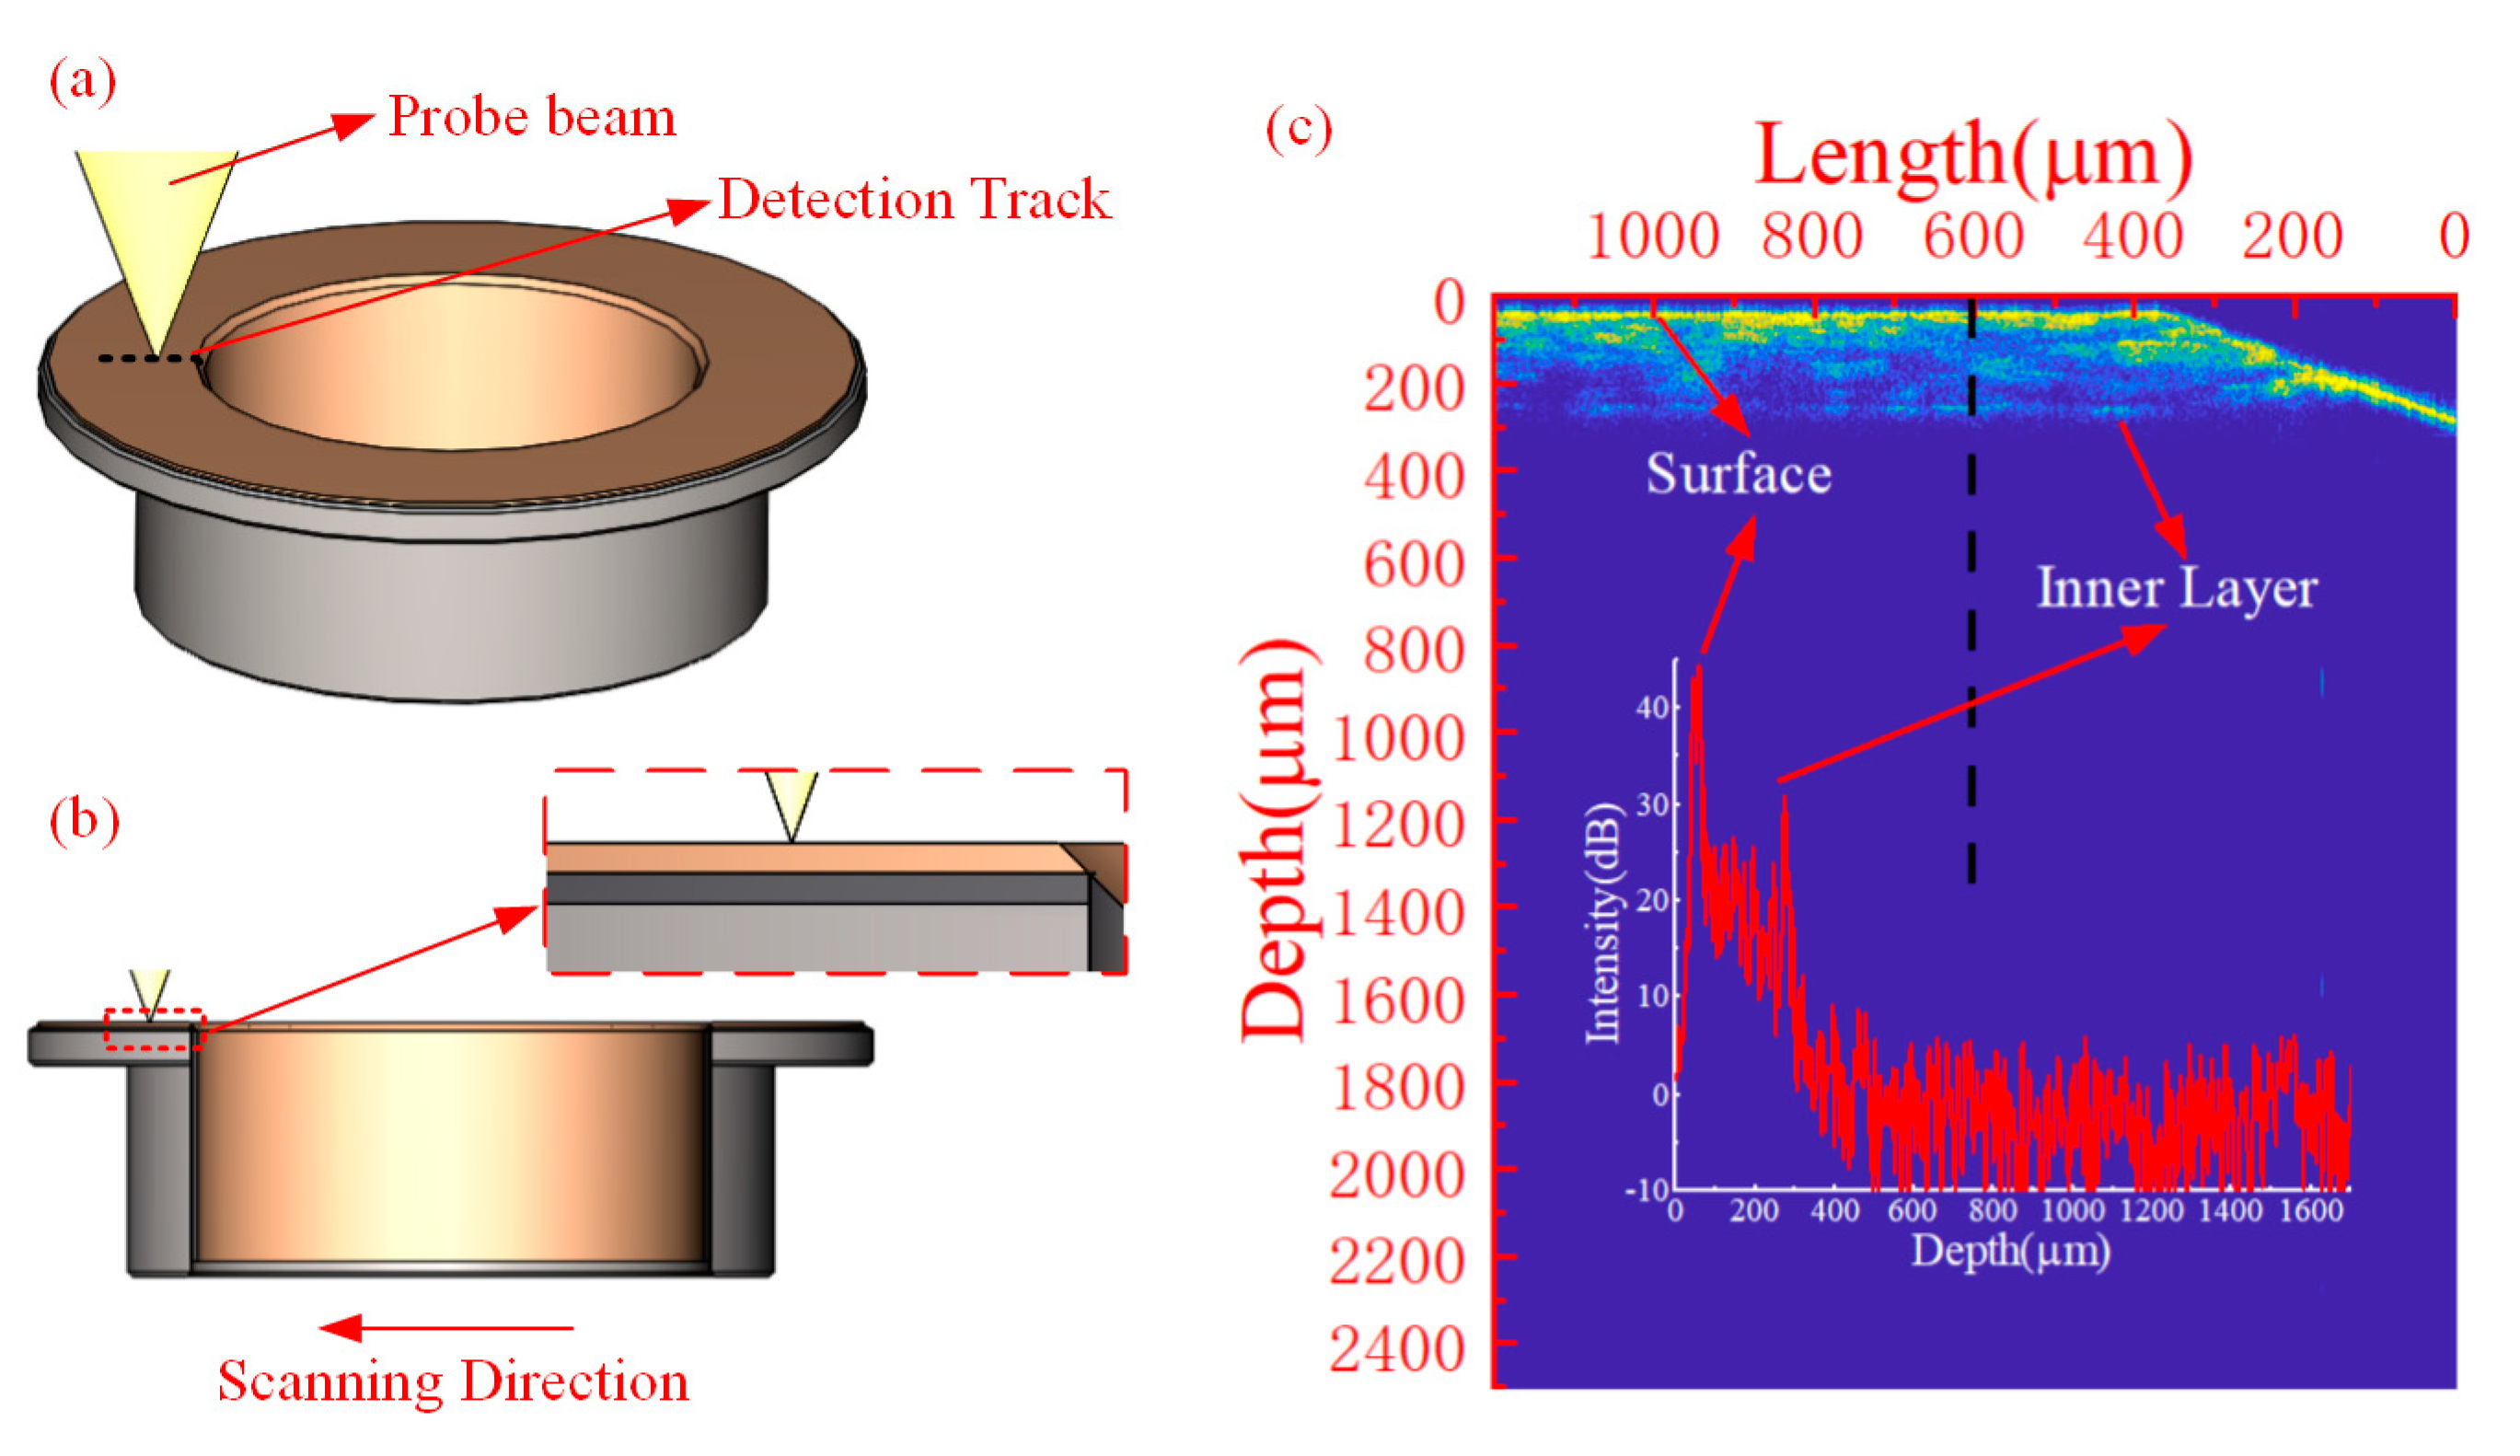
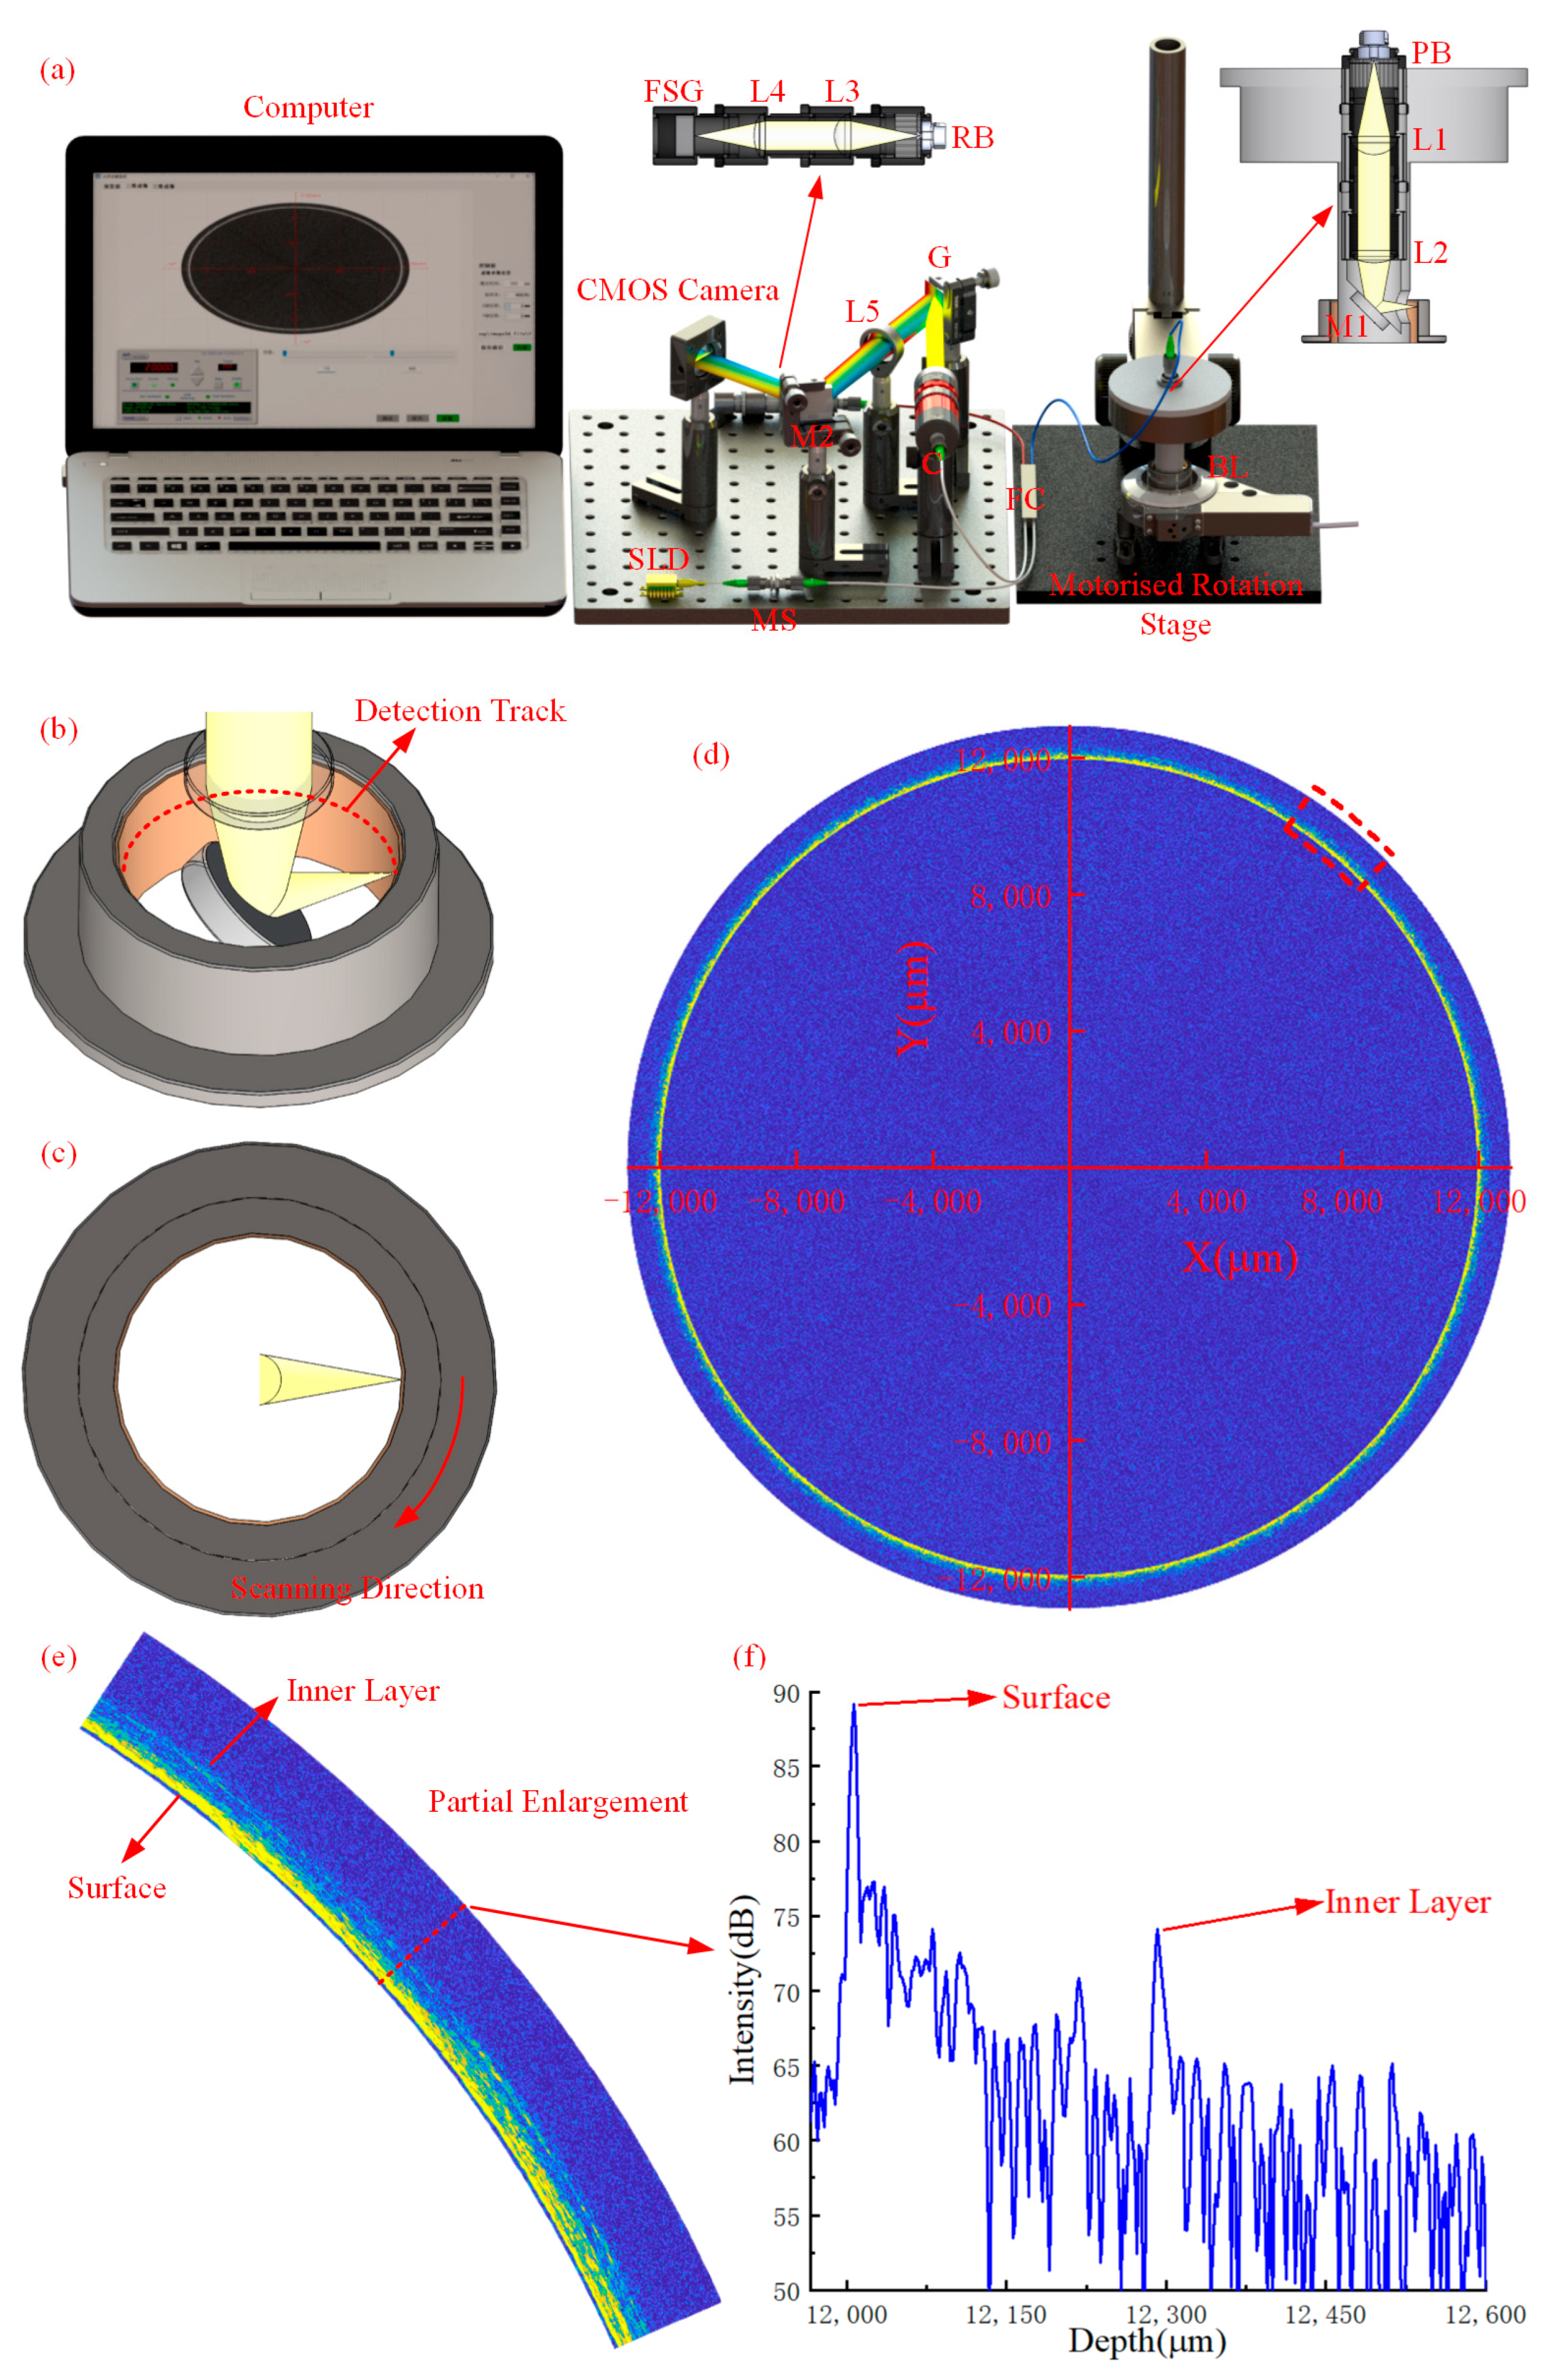
4.2. Imaging the Real Microstructure within the Self-Lubricating Liner of the Sliding Bearing

Using the above group refractivity n s , the real microstructure within the self-lubricating fabric liner on the end face and inner ring of the sliding bearing, whose liner material is the same as the peeled-off sample, was imaged. Firstly, the end face of the sliding bearing’s self-lubricating fabric liner was measured by the OCT system, which is the same as in Figure 4a. We scanned the sliding bearing’s end face from the inner ring edge to the external diameter along the diameter direction with 1.2 mm length, as shown in Figure 7a–c, which was the real microstructure, from which the surface and the inner layer of the liner could be seen. We determined that the liner thickness in the inner ring edge was relatively thin. The thickness kept increasing along the scanning direction and finally became stable.
To obtain the tomographic image of the self-lubricating fabric liner of the inner ring of the bearings, the configuration of the probe beam was changed. A photo of the modified experimental OCT system is shown in Figure 8a. The sleeves’ diameter is changed to 12.5 mm, and the focal lengths of L1, L2, L3, and L4 were changed to 20.3 mm. A rotation stage was used to rotate the inner ring liner instead of the X-Y motorized translation stages. To make the probe light incident perpendicularly to the inner ring liner, a mirror was placed in the sleeve at 45°. The rotation of the liner for one circle of the tomographic signal of the sliding bearing inner ring liner was measured, and the result was shown in Figure 8d. The diameter of the sample was much larger than the liner thickness, although it is difficult to identify the internal structure and thickness of the liner from Figure 8d. We amplified the red rectangular area of Figure 8d, and the locally enlarged drawing is shown in Figure 8e. From Figure 8e, the surface and inner layer of the self-lubricating fabric liner can be identified, and the thickness can be read from the 1-D drawing, as shown in Figure 8f.

5. Discussion

In our work, a novel method based on the fiber-optic OCT is proposed and used to measure the relative distance d0 between the OCT reference arm and FSG2, the distance d1 after inserting the liner into the probe arm, and the optical thickness d3-d2 of the liner. The measured signals are used to calculate the geometric thickness of the liner, without any influence from the group refractive index of the liner. We measured three sets of data at three different locations on the peeled-off self-lubricating fabric liner. The average geometric thickness for these three sets of data were 171.261 μm (detection track 1), 171.646 μm (detection track 2), and 171.841 μm (detection track 3), respectively. The geometric thickness measured using a spiral micrometer was 172 μm. By comparing these three sets of data using the spiral micrometer, we obtained differences of 0.430%, 0.206%, and 0.092%, respectively. Based on our experimental results, the maximum difference between the two methods is 0.430%, which verified the accuracy and validity of our method. The difference may come from the fact that the last portion of the spiral micrometer’s measurement result is the estimated portion, which may lead to inaccurate readings. With the optical thickness and the geometric thickness measured by our method, the group refractivity index of the liner can be calculated, which can be used for the nondestructive testing of the liner without peeling it off from the bearing. Figure 7 and Figure 8 show the geometric structural imaging of the liner on the end face and inner ring of the slide bearing using the measured group refractive index. We can design different types of probe beams to achieve different application requirements. The flexibility of our homemade fiber-optic OCT system is proven.
In our future work, we plan to enhance the system’s detection depth and reduce the impact of coating scattering by utilizing a broadband near-infrared light source with a central wavelength of 1500 nm, coupled with a near-infrared spectrometer. This will allow us to obtain higher resolution signals from the liner and achieve more accurate measurement results for geometric thickness.

6. Conclusions

This study combines an SD-OCT system with HnWECM to propose a novel method for measuring the geometric thickness of the self-lubricating fabric liner. The method can achieve a high-precision measurement result, without the influence of the group refractive index of the material. In the experiment, the differences between the three sets of data and the spiral micrometer are 0.430%, 0.206%, and 0.092%, respectively. The maximum difference between the two methods is 0.430%. The experimental results confirm the effectiveness of our method. Furthermore, we calculate the group refractivity index of the self-lubricating fabric liner using this method and obtain the real microstructure within the self-lubricating fabric liner on the end face and inner ring of the sliding bearing through imaging. The method proposed in this paper also provides a non-contact and nondestructive testing method for the geometric thickness measurement and structural imaging of composite materials.

Author Contributions

Literature retrieval, Y.D.; data analysis, Y.D.; manuscript writing, Y.D.; manuscript correction, S.Z. and Y.H.; experimental design, J.L. and Q.Z.; grammar revision, S.Z. and W.N.; system construction, J.L.; data collection, J.L.; writing—review and editing, S.C.; sample making, Z.C.; funding acquisition, S.Z. All authors have read and agreed to the published version of the manuscript.

Funding

This research was funded by the National Natural Science Foundation of China (Grant Nos. 52275096, 52005108, 52275523), and the Fuzhou-Xiamen-Quanzhou National Independent Innovation Demonstration Zone High-End Equipment Vibration and Noise Detection and Fault Diagnosis Collaborative Innovation Platform Project and the Fujian Provincial Major Research Project (Grant No. 2022HZ024005).

Institutional Review Board Statement

Not applicable.

Informed Consent Statement

Not applicable.

Data Availability Statement

Not applicable.

Conflicts of Interest

The authors declare no conflict of interest.

References

  1. Lindner, T.; Preuß, B.; Löbel, M.; Rymer, L.-M.; Grimm, M.; Schwarz, H.; Seyller, T.; Lampke, T. Non-Metallic Alloying Constituents to Develop a Wear-Resistant CrFeNi-BSiC High-Entropy Alloy for Surface Protective Coatings by Thermal Spraying and High-Speed Laser Metal Deposition. Coatings 2023, 13, 291. [Google Scholar] [CrossRef]
  2. Riquelme, A.; Rodrigo, P.; Escalera-Rodriguez, M.D.; Rams, J. Wear Resistance of Aluminum Matrix Composites’ Coatings Added on AA6082 Aluminum Alloy by Laser Cladding. Coatings 2022, 12, 41. [Google Scholar] [CrossRef]
  3. Bolelli, G.; Lyphout, C.; Berger, L.-M.; Testa, V.; Myalska-Głowacka, H.; Puddu, P.; Sassatelli, P.; Lusvarghi, L. Wear resistance of HVOF- and HVAF-sprayed (Ti,Mo)(C,N)–Ni coatings from an agglomerated and sintered powder. Wear 2023, 204550, 512–513. [Google Scholar] [CrossRef]
  4. Zhang, Q.; Zhong, S.; Zhong, J.; Fu, X. Ultrahigh-accuracy measurement of refractivity curves of optical materials using interferometry technology. Measurement 2018, 122, 40–44. [Google Scholar] [CrossRef]
  5. Zhang, Q.; Zhong, S.; Lin, J.; Huang, Y.; Nsengiyumva, W.; Chen, W.; Luo, M.; Zhong, J.; Yu, Y.; Peng, Z.; et al. Anti-noise frequency estimation performance of Hanning-windowed energy centrobaric method for optical coherence velocimeter. Opt. Lasers Eng. 2020, 134, 106250–106256. [Google Scholar] [CrossRef]
  6. Gocławski, J.; Korzeniewska, E.; Sekulska-Nalewajko, J.; Sankowski, D.; Pawlak, R. Extraction of the polyurethane layer in textile composites for textronics applications using optical coherence tomography. Polymers 2018, 10, 469. [Google Scholar] [CrossRef] [Green Version]
  7. Goddard, J.M.; Hotchkiss, J.H. Polymer surface modification for the attachment of bioactive compounds. Prog. Polym. Sci. 2008, 32, 698–725. [Google Scholar] [CrossRef]
  8. Xing, C.; Jiang, W.; Li, M.; Wang, M.; Xiao, J.; Xu, Z. Application of atomic force microscopy in bitumen materials at the nanoscale. Constr. Build. Mater. 2022, 342, 128059–128078. [Google Scholar] [CrossRef]
  9. Chen, H.; Yuan, L.; Song, W.; Wu, Z.; Li, D. Biocompatible polymer materials: Role of protein-surface interactions. Prog. Polym. Sci. 2008, 33, 1059–1087. [Google Scholar] [CrossRef]
  10. Son, D.R.; Raghu, A.V.; Reddy, K.R.; Jeong, H.M. Compatibility of thermally reduced graphene with polyesters. J. Macromol. Sci. Phys. 2016, 55, 1099–1110. [Google Scholar] [CrossRef]
  11. Han, S.J.; Lee, H.I.; Jeong, H.M.; Kim, B.K.; Raghu, A.V.; Reddy, K.R. Graphene modified lipophilically by stearic acid and its composite with low density polyethylene. J. Macromol. Sci. 2014, 53, 1193–1204. [Google Scholar] [CrossRef]
  12. Iuras, A.; Scurr, D.J.; Boissier, C.; Nicholas, M.L.; Roberts, C.J.; Alexander, M.R. Imaging of crystalline and amorphous surface regions using time of-flight secondary-ion mass spectrometry (tof-sims): Application to pharmaceutical materials. Anal. Chem. 2016, 88, 3481–3487. [Google Scholar] [CrossRef] [PubMed]
  13. Depriester, D.; Rolland du Roscoat, S.; Orgéas, L.; Geindreau, C.; Levrard, B.; Brémond, F. Individual fibre separation in 3D fibrous materials imaged by X-ray tomography. J. Microsc. 2022, 286, 220–239. [Google Scholar] [CrossRef]
  14. Chow, T.M.; Hutchins, D.A.; Mottram, J.T. Simultaneous acoustic emission and ultrasonic tomographic imaging in anisotropic polymer composite material. J. Acoust. Soc. Am. 1993, 94, 944–953. [Google Scholar] [CrossRef]
  15. Yang, X.; Ju, B.; Kersemans, M. Ultrasonic tomographic reconstruction of local fiber orientation in multi-layer composites using Gabor filter-based information diagram method. NDT E Int. 2021, 124, 102545–102555. [Google Scholar] [CrossRef]
  16. Tu, W.; Zhong, S.; Luo, M.; Zhang, Q. Non-destructive evaluation of hidden defects beneath the multilayer organic protective coatings based on terahertz technology. Front. Phys. 2021, 9, 676851–676857. [Google Scholar] [CrossRef]
  17. Luo, M.; Zhong, S.; Yao, L.; Tu, W.; Nsengiyumva, W.; Chen, W. Thin thermally grown oxide thickness detection in thermal barrier coatings based on SWT-BP neural network algorithm and terahertz technology. Appl. Opt. 2020, 59, 4097–4104. [Google Scholar] [CrossRef]
  18. Huang, D.; Swanson, E.A.; Lin, C.P.; Schuman, J.S.; Stinson, W.G.; Chang, W.; Hee, R.; Flotte, F.; Gregory, K.; Puliafito, A. Optical coherence tomography. Science 1991, 254, 1178–1181. [Google Scholar] [CrossRef] [Green Version]
  19. Fercher, A.F.; Hitzenberger, C.K.; Kamp, G.; El-Zaiat, S.Y. Measurement of intraocular distances by backscattering spectral interferometry. Opt. Commun. 1995, 117, 43–48. [Google Scholar] [CrossRef]
  20. Zaki, F.; Hou, I.; Cooper, D.; Patel, D.; Yang, Y.; Liu, X. High-definition optical coherence tomography imaging for noninvasive examination of heritage works. Appl. Opt. 2016, 55, 10313–10317. [Google Scholar] [CrossRef]
  21. Tong, R.; Hu, M.; Liu, X.; Zhang, Q.; Ge, H.; Gang, T. Spectral-domain optical coherence tomography for the non-invasive investigation of the pigment layers of Tang Dynasty tomb murals exhibited in museums. Optik 2019, 199, 163311–163319. [Google Scholar] [CrossRef]
  22. Liu, F.; Liu, G.; Zhao, Q.; Shen, L. Robust and high-security fingerprint recognition system using optical coherence tomography. Neurocomputing 2020, 402, 14–28. [Google Scholar] [CrossRef]
  23. Zhong, S.; Shen, Y.C.; Ho, L.; May, R.K.; Zeitler, J.A.; Evans, M.; Taday, P.F.; Pepper, M.; Rades, T.; Gordon, K.C.; et al. Non-destructive quantification of pharmaceutical tablet coating using terahertz pulsed imaging and optical coherence tomography. Opt. Lasers Eng. 2011, 49, 361–365. [Google Scholar] [CrossRef] [Green Version]
  24. Dong, B.; Xie, S.; He, Z.; Zhou, Y. Simultaneous measurement of temperature-dependent refractivity and depth-resolved thermal deformation fields inside polymers. Polym. Test. 2018, 65, 297–300. [Google Scholar] [CrossRef]
  25. Khinast, J.; Sacher, S.; Gartshein, E.; Wolfgang, M.; Wahl, P. Real-time measurement of coating film thickness. Int. J. Pharm. 2019, 31, 28–34. [Google Scholar]
  26. Nsengiyumva, W.; Zhong, S.; Lin, J.; Zhang, Q.; Zhong, J.; Huang, Y. Advances, limitations and prospects of nondestructive testing and evaluation of thick composites and sandwich structures: A state-of-the-art review. Compos. Struct. 2021, 256, 112951–113043. [Google Scholar] [CrossRef]
  27. Golde, J.; Schnabel, C.; Filippatos, A.; Wollmann, T.; Gude, M.; Koch, E. Non-destructive testing of a rotating glass-fibre-reinforced polymer disc by swept source optical coherence tomography. EPJ Web Conf. 2020, 238, 06007. [Google Scholar] [CrossRef]
  28. Gliścińska, E.; Sankowski, D.; Krucińska, I.; Gocławski, J.; Michalak, M.; Rowińska, Z.; Sekulska-Nalewajko, J. Optical coherence tomography image analysis of polymer surface layers in sound-absorbing fibrous composite materials. Polym. Test. 2017, 63, 194–203. [Google Scholar] [CrossRef]
  29. Shirazi, M.F.; Jeon, M.; Kim, J. Structural analysis of polymer composites using spectral domain optical coherence tomography. Sensors 2017, 17, 1155. [Google Scholar] [CrossRef] [Green Version]
  30. Liu, P.; Groves, R.M.; Benedictus, R. Signal processing in optical coherence tomography for aerospace material characterization. Opt. Eng. 2013, 52, 033201–033208. [Google Scholar] [CrossRef] [Green Version]
  31. Birch, K.P.; Downs, M.J. An Updated Edlén Equation for the Refractivity of Air. Metrologia 1993, 30, 155. [Google Scholar] [CrossRef]
Figure 1. Schematic diagram of the SD-OCT. SLD: superluminescent diode; MS: mating sleeve; FC: fiber coupler (50:50); BL: bearing liner; PB: probe beam; RB: reference beam; G: grating; C: collimator; M: mirror; L: lens; FSG: fused silica glass; S: sample; RB: reference beam; PB: probe beam.
Coatings 13 00708 g001
Figure 2. The stepwise flowchart for the measurement of the group refractivity index and the geometric thickness of the peeled-off self-lubricating fabric liner.
Coatings 13 00708 g002
Figure 3. Inspection schematic diagram: (a) the interferometric signal and FFT result of FSG2; (b) the interferometric signal and FFT result of FSG2 after inserting the liner into the probe beam; (c) the surface and inner layer of the liner.
Coatings 13 00708 g003
Figure 4. Geometric thickness and group refractivity measurement for the peeled-off self-lubricating fabric liner (a) the photo of experimental system; (b) the peeled-off self-lubricating fabric liner; (c) the tomography before inserting the liner into the probe beam; (d) the tomography after inserting the liner into the probe beam; (e) the tomography of the peeled-off self-lubricating fabric liner.
Coatings 13 00708 g004
Figure 5. The line chart of geometric thickness data at different detection tracks of the peeled-off self-lubricating fabric liner.
Coatings 13 00708 g005
Figure 6. The air refractivity–wavelength relationship curve at 773.314 torrs (103.1 kPa) and 25 °C.
Coatings 13 00708 g006
Figure 7. The tomographic image of the end face of the sliding bearing’s liner: (a) schematic diagram of bearing detection track; (b) schematic diagram of inner structure of liner; (c) the tomographic image.
Coatings 13 00708 g007
Figure 8. The tomographic image of the inner diameter liner: (a) the photo of the experimental system; (b,c) the diagram of the sliding bearing; (d) the tomographic image of the inner ring liner; (e) the partially enlarged view of (d); (f) the 1-D figure of the dotted line in (e).
Coatings 13 00708 g008
Table 1. The results of different positions in detection track 1.
Positiond0 (μm)d1 (μm)d2 (μm)d3 (μm)d (μm)
1370.896460.83463.384326.901173.580
2371.010463.34956.094319.644171.211
3371.052456.74253.138311.046172.219
4371.114460.43452.924313.275171.031
5371.162460.53750.901312.911172.634
6371.194461.03850.854311.961171.263
7371.292462.61350.092311.952170.539
8371.386460.21747.574306.567170.161
9371.489461.65647.755308.799170.877
10371.646460.23547.670305.357169.097
Mean Value371.224460.76652.038312.841171.261
Table 2. The results collected multiple times at the same location.
Group1st (μm)2nd (μm)3rd (μm)4th (μm)5th (μm)RMSE
1171.743171.761171.822171.977171.9230.180
2171.986172.031171.854171.855171.8260.121
Table 3. The geometric thickness measured by the spiral micrometer.
OrderD’ (μm)
1172
2172
3172
Mean Value172
Disclaimer/Publisher’s Note: The statements, opinions and data contained in all publications are solely those of the individual author(s) and contributor(s) and not of MDPI and/or the editor(s). MDPI and/or the editor(s) disclaim responsibility for any injury to people or property resulting from any ideas, methods, instructions or products referred to in the content.

