
Dissolution Behavior of Different Alumina Phases within Plasma Electrolytic Oxidation Coatings

Materials and Surface Engineering Group, Chemnitz University of Technology, 09111 Chemnitz, Germany
*
Author to whom correspondence should be addressed.
Coatings 2022, 12(8), 1205; https://doi.org/10.3390/coatings12081205
Submission received: 12 July 2022
/
Revised: 27 July 2022
/
Accepted: 28 July 2022
/
Published: 17 August 2022
(This article belongs to the Special Issue Plasma Electrolytic Oxidation (PEO) Coatings, 2nd Edition)
Abstract
:The influence of chemical redissolution in the PEO layer-growth equilibrium on aluminum is evaluated differently in literature. In order to estimate whether and to what extent various alumina modifications could be affected by redissolution processes during PEO, immersion experiments were carried out on PEO coatings in model electrolytes of different alkalinity and silicate concentration. Their composition was determined spectroscopically before and after the experiments. The layers were characterized by XRD before and after the tests and examined at affected and unaffected zones using SEM, EDX, and EBSD. The results show that chemical oxide dissolution can only be observed at the layer/substrate interface and that primarily amorphous alumina is affected. This process is intensified by higher alkalinity and inhibited by silicate additives. The crystalline AlO modifications show no significant attack by the electrolytes used. Transferring these observations to plasma electrolytic oxidation, they allow the conclusion that the electrochemically active zone in the pore ground of discharge channels interacts with the electrolytic and electrical process parameters throughout the entire PEO procedure. Influences of bath alkalinity and silicate content on layer growth rates are to be understood as impact on the passivation processes at the layer/substrate interface rather than chemical redissolution.
1. Introduction
The plasma electrolytic oxidation (PEO) is an established process for generating oxidic conversion layers on metals, such as Al, Mg, Ti, and metal compounds of those. In contrast to conventional anodic oxidation, microarc discharges are created after initial substrate passivation by applying a sufficiently high anodic voltage and used for layer formation. In the center of the microarc discharge, there is a plasma temperature of about 7000 K [1]. With increasing distance to the center, the temperature falls below the boiling point of the oxide. In this zone, the melted substrate material reacts with the anodically formed oxygen to form molten oxide [2]. This is followed by the outer concentric zone in which the melting temperature of the oxide is no longer exceeded. In this area, thermally induced phase changes of the oxides take place. According to Rogov et al., the conversion proceeds in the direction of the AlO modification with the lowest Gibbs free energy [3]:
More precisely, the Gibbs free energy of amorphous, -, and -alumina formation were quantified as −1625 kJ/mol, −1654 kJ/mol, and −1676 kJ/mol, respectively, by Naumann and Petzold [4]. Furthermore, the repeated remelting and heat treatment leads to a compaction of the inner oxide area, especially on Al materials. The result is a three-layered structure consisting of a barrier layer of a few 100 nm thickness at the substrate/layer interface, an inner, compact layer, and an outer, porous layer. The barrier layer is repeatedly formed by electrochemical oxidation at the base of a former microarc discharge and mainly consists of amorphous aluminum oxide [5,6]. The phases - and -AlO dominate within the compact layer [6,7]. In the outer, porous layer, mixed oxides are increasingly found because of the incorporation of electrolyte constituents. They are characterized by a higher amorphous portion due to the lower thermal influence. In terms of maximum protection of the Al substrate against corrosion and/or abrasive wear, a high proportion of the compact layer of the total layer thickness is aimed for. Such PEO coatings are characterized by a low porosity and a high proportion of particularly hard and chemically resistant crystalline alumina phases. The chemical composition of the substrate alloy, the electrical regime, and the electrolyte composition were identified as the main influencing factors on the layer microstructure [7,8]. There is scientific consensus that the electrolyte composition influences the passivation behavior of the electrochemical system. With the help of potentiodynamic polarization tests, a distinction can be made between metal dissolution, metal passivation, or complex behavior, depending on the system [9,10]. Furthermore, electrolyte systems can be classified according to whether conversion of the substrate into an oxide, the incorporation of electrolyte anions into a mixed oxide, or even the deposition of a foreign oxide is sought. In the case of Al alloys, a pure conversion into the particularly wear- and corrosion-resistant, crystalline alumina phases [11] is desirable. On the other hand, the inclusion of electrolyte anions such as aluminate in the layer-formation process enables the production of MgAlO spinel on Mg [12] and the deposition of AlO layers on unalloyed steel [13]. The scientific literature shows that the rate of oxide formation increases with increasing current density and that a higher thickness [14] and oxide mass can be achieved due to increasing electrical charge [15]. Besides the oxide formation, several electrochemical side reactions may occur during the PEO process. At the beginning of the process, electrochemical metal dissolution and gas evolution are competing with the anodic passive-layer formation [8]. Anodic oxygen evolution can also be observed as a competition reaction of the oxide formation during the passive layer growth.
It has been observed that the rate of oxide formation decreases with increasing electrolyte temperature [14,16,17], alkali concentration [14,18,19], and process time [5,14,20]. On the basis of this knowledge, the theory was developed that during PEO in strongly alkaline solutions, the chemical redissolution of the oxide occurs as a competitive reaction of the anodic oxide formation. Koroleveva et al. assigned this processes to reactions according to Equation (2) [21]:
This would be similar to the competition of oxide formation and oxide redissolution during conventional anodizing in acidic solutions. According to Nagayama and O’Sullivan [22,23], such reactions can be promoted by strong localization of electric field lines and are designated as field-assisted chemical redissolution. To describe the chemical redissolution of PEO coatings, Snizhko and Al Bosta also refer to the reaction according to Equation (2) for the chemical dissolution of the natural passive layer [18,20]. Within the above-mentioned publications, the Al content of the electrolyte after PEO is often estimated in order to get an experimental access to conceivable redissolution reactions during the process. However, several additional reaction routes may lead to the elevated Al content after PEO. Al ions can directly be emitted via field assisted anodic metal dissolution and emission of aluminum ions through the plasma channel [15,18]:
or by electrochemical etching of the metallic substrate in partial pulse periods without external polarization applied [20]:
Therefore, it is not clear to what extent chemical redissolution of the plasma electrolytically formed oxide occurs during the PEO process and to what extent this affects the layer microstructure.
On the other hand, possible influences of the electrolyte temperature and the alkali concentration on the electrochemical passivation of the Al substrate were not considered in most of the studies on the chemical redissolution. The authors Moon and Pyun [24] and Snizhko et al. [25] showed that the steady state of the passive-layer growth is delayed due to increasing hydroxide concentration. This might promote side-reactions such as metal dissolution and oxygen evolution during the repassivation of the Al substrate at the base of a microarc discharge. Therefore, a decrease of the oxide growth rate and an increase of the Al ion concentration in the electrolyte might also be explained by the impairment of the substrate passivation and not necessarily point at the chemical redissolution reaction. Furthermore, it is questionable as to whether the chemical redissolution reaction described by Equation (2), which originally refers to the chemical redissolution of amorphous alumina passive layers, can also be generalized for PEO layers consisting of a high proportion of crystalline alumina phases. Additionally, the redissolution behavior of mixed oxides, which arises through the incorporation of electrolyte anions, has not yet been taken into account. This is also indicated by the fact that there is a clear discrepancy in the scientific literature with regard to the significance of chemical redissolution in PEO processes. Several research groups observed an almost linear increase of the oxide thickness over a process time of up to 45 min [26,27,28]. The authors Xue et al. found that the ratio of the outward growth and the total oxide thickness started to decrease after about 2 h and that the total oxide growth rate did not decrease until a process duration of about 5 h [29]. In [27,28], compact and wear-resistant PEO layers are reported, which mainly consist of the crystalline phases - and -AlO. In contrast, the authors Al Bosta et al. observed a significant decrease of the layer growth rate after only about 20 min [20]. After exceeding a process time of 50 min, the layer thickness even decreased. At this point, the PEO layers consisted of around 55% -AlO, 18% AlSiO, 24% SiO, and only 8% -AlO [20]. From the results of [20,26,27,28,29] the conclusions might be drawn that the chemical redissolution of the oxide does not play a decisive role for PEO layers with a high proportion of crystalline alumina phases and technically relevant process times of less than one hour and that especially the presumably amorphous, Si-containing phases are characterized by a lower chemical resistance and a higher redissolution rate in alkaline solutions. This argumentation assumes that the rate of layer formation is constant over the entire process time, similar to conventional anodic oxidation, and that only the chemical redissolution rate determines the net growth rate and the maximum achievable oxide thickness. However, it is known that distribution and intensity of the microarc discharges change over the process duration due to the evolution of the oxide microstructure towards the formation of a more compact PEO layer [8,30]. The number of microarc discharges declines as the discharges focus on a decreasing number of defects in the oxide layer. The PEO process might even come to a complete standstill. In this case, redissolution would not be necessary to explain the declining rate of layer growth.
Within this work, it is intended to investigate the chemical redissolution of different oxide phases and the effect on the PEO coating’s microstructure and properties for the first time. The dissolution behavior of individual phases is assessed by comparing the phase composition and layer microstructure using diffraction methods and scanning electron microscopy before and after the exposition of the PEO coatings to an alkaline solution.
2. Materials and Methods
The PEO coatings were applied on the commercially available high-strength aluminum alloy EN AW-6082 T6, the chemical composition of which is listed in Table 1. The sheets had geometrical dimension of 100 × 25 × 3 mm. The plasma electrolytic oxidation was carried out within a laboratory plant consisting of a rectifier pe86CW-550-53-120/S (plating electronics, Sexau, Germany) and a capsuled treatment station (Scheigenpflug, Leipzig, Germany) with a basin for 12 L electrolyte, directly cooled by a heat exchanger. Two stainless steel sheets were used as counter electrodes. The electrolyte composition was 5 g/L KOH, 5 g/L NaSiO5HO, and 1 g/L NaHPO. All substances were of analytical grade (Sigma-Aldrich, St. Louis, MI, USA). The electrical regime was defined by a symmetric, bipolar, rectangular, current controlled pulse of = = 30 A/dm and = = 10 ms. The maximum anodic voltage was limited to 500 V, and the treatment time was 60 min.
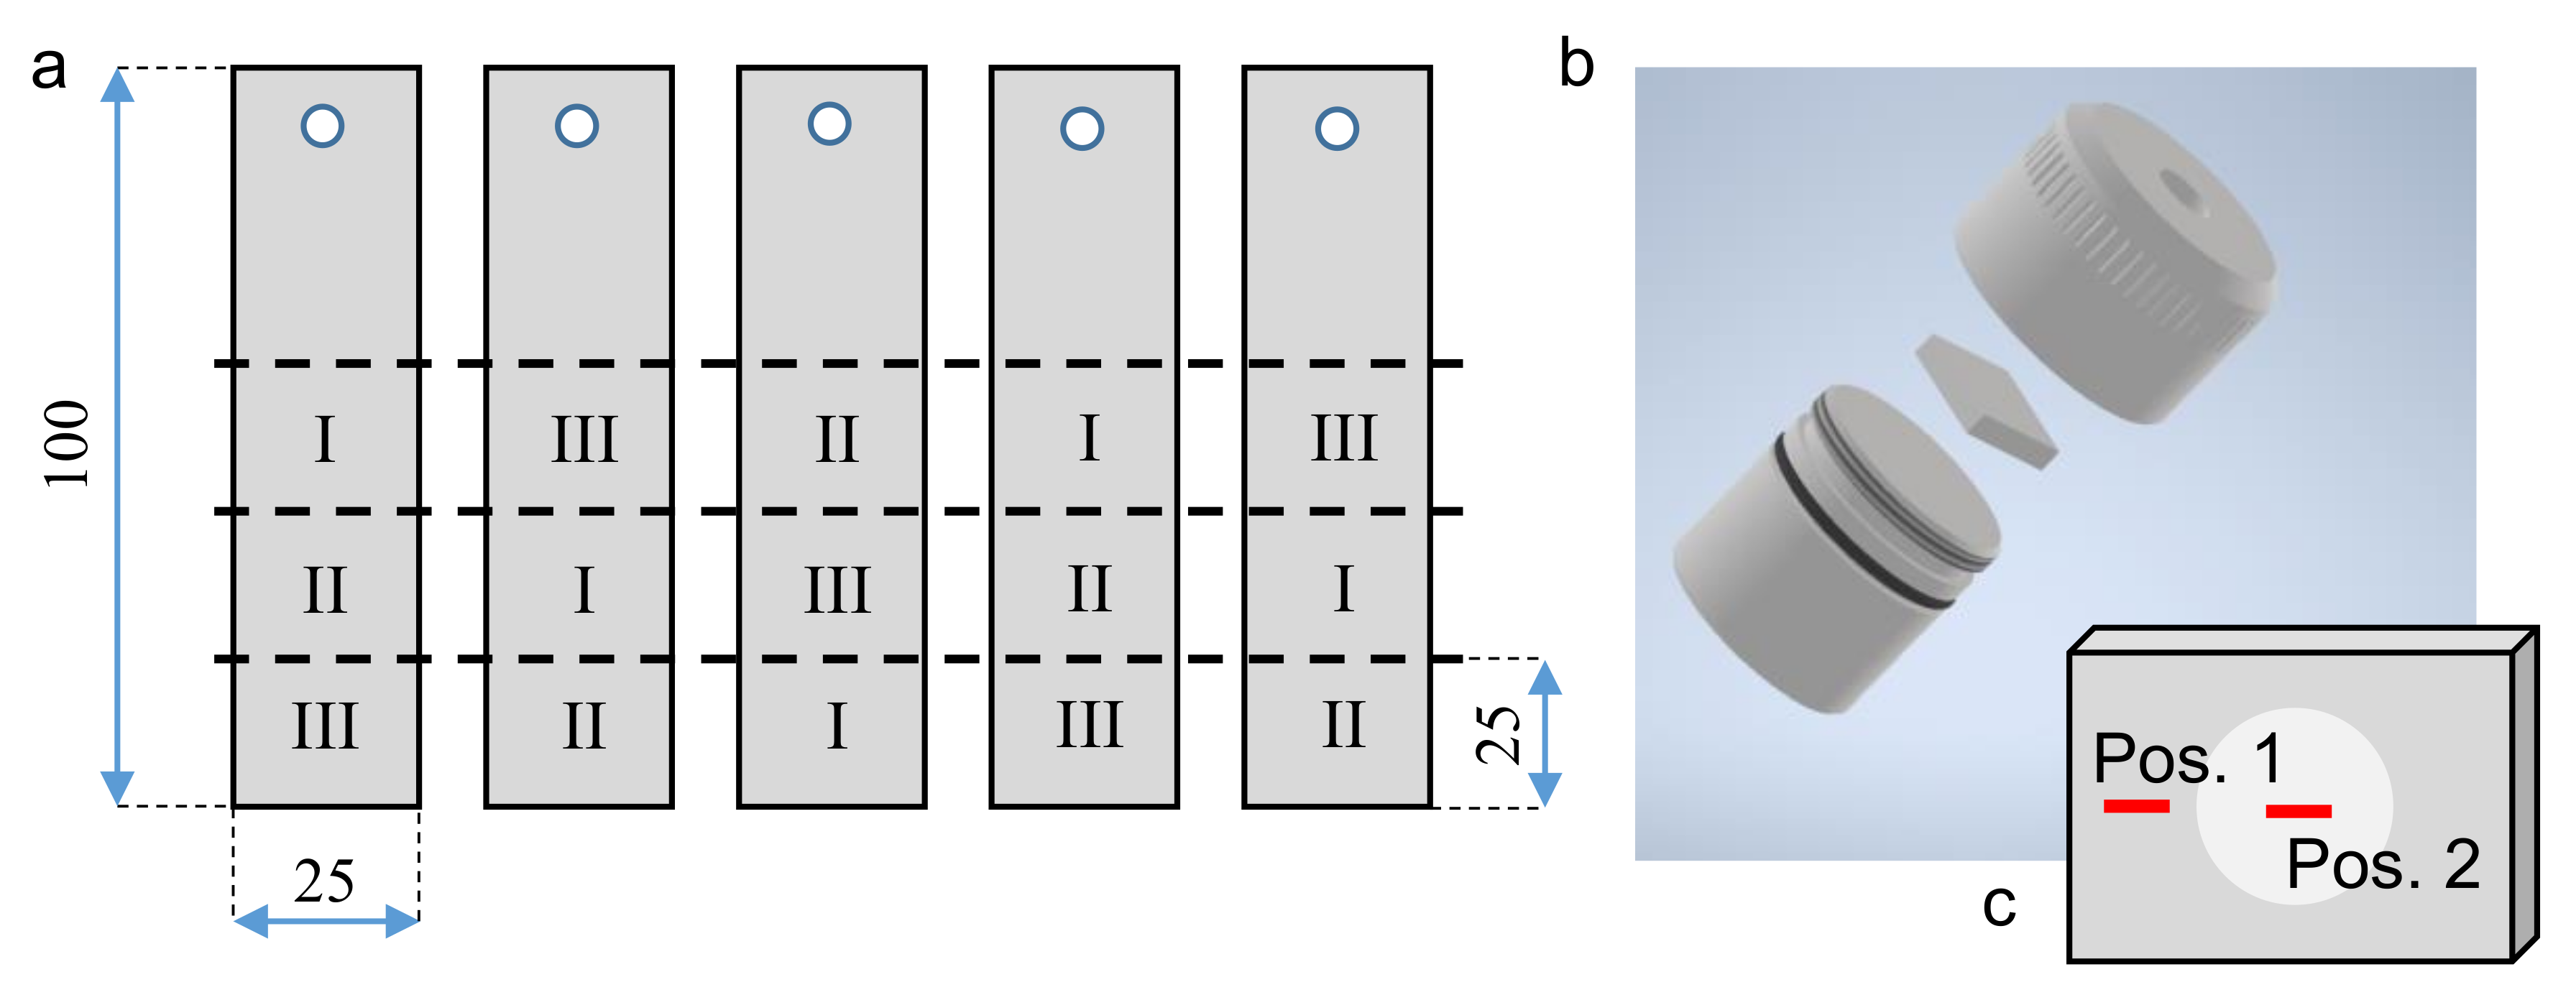
In order to provide the data resulting from the following investigations with a suitable statistical support, five aluminum sheets were treated under the same PEO conditions. Afterwards, three samples were cut from every sheet according to the schematic representation depicted in Figure 1a.
Figure 1.
Schematic representation of the PEO-coated aluminum sheets, extraction positions of the individual samples and indication of the electrolytes (Table 2) used for exposition experiments (a) within a sample holder (b) as well as the position of the further SEM and EBSD investigations (c).
Figure 1.
Schematic representation of the PEO-coated aluminum sheets, extraction positions of the individual samples and indication of the electrolytes (Table 2) used for exposition experiments (a) within a sample holder (b) as well as the position of the further SEM and EBSD investigations (c).

The 15 samples prepared in this way were mounted in sample holders as exemplary shown in Figure 1b and used for exposition experiments within three different electrolytes, indicated by the Roman numerals. The compositions of these are listed in Table 2.
For the exposition experiments, the mounted samples were placed into glasses with 140 mL of the respective pre-heated electrolyte. Afterwards, the glasses were closed with a watch glass, positioned in a thermostat filled with water of 95 C, and were exposed to the electrolyte for 60 min. In order to determine the exact chemical aluminum concentrations of the testing solutions before and after the experiments, test volumes of 50 mL were extracted and investigated by inductively coupled plasma optical emission spectroscopy (ICP-OES) using a Optima 8300 (PerkinElmer, Waltham, MA, USA). In the course of these measurements, three undiluted partial volumes were shot into the flame in order to analyze the spectral information of the resulting light emission for 5 to 20 s. The characteristic Aluminium wave lengths of 394.40 nm and 396.15 nm were used to determine the Al content by use of a N9300184-standard of Al(NO) in 2% HNO with 1000 µg/mL Al (PerkinElmer, Waltham, MA, USA). The phase composition of every single coated sample was examined by X-ray diffraction (XRD) before and after the exposition experiment. The setup consists of a D8 Discover with an 1D LYNXEYE XE-T detector with 192 channels (Bruker, Germany) using Co-K radiation. A point focus with a collimator diameter of 2 mm was chosen to gain integral information without interfering signals from the samples edges. A step size of 0.02° and a step time of 3.9 s/step, which results in an effective measurement step time of 748.8 s/step due to the use of the 1D detector.
The morphology of the coating, as well as the spatial distributions of the single alumina phases within the exposed and non-exposed coating regions (Positions 1 and 2 in Figure 1c), were investigated by using a scanning electron microscopy (SEM) and electron backscattering diffraction (EBSD). The chemical composition of the observed microstructure was determined by energy-dispersive X-ray spectroscopy (EDX) spot measurements and maps. For this purpose, one of the samples exposed to each of the electrolytes I, II, and III were prepared as listed in Table 3.
The samples exposed to electrolyte I or II were prepared without embedding, while the sample immersed in electrolyte III, which showed layer delamination, was vacuum infiltrated with an epoxy resin (Epothin, Buehler, IL, USA). Slices of 2 mm thickness were detached by using a diamond cutting disk and mounted in a thermoplastic sample holder (Crystalbond, Buehler, IL, USA). Afterwards, the surfaces were grinded in five steps with increasing abrasive particle number. The following polishing steps were carried out on silk tie (MD-Dur, Struers, Willich, Germany), stretched on a steel disk. The resulting counterbody is relatively hard, and its use prevents roundings of the ceramic edge at the substrate/coating interface (which could be observed, for example, when using flow tie). In order to allow for Si-specific element maps during the subsequent investigations, diamond (instead of SiO) suspensions with decreasing particle size were used as abrasive media. The polishing and vibration polishing steps with 1 and 0.05 µm diamond particle size were carried out on neoprene tie (MD-Chem, Struers, Willich, Germany), the narrow mesh size of which allows to bind such small particles. After the sample surface was prepared for EBSD measurements in this way, it was dismounted from the sample holder and purified for investigations under vacuum conditions. Therefore, it was immersed in acetone and treated by ultrasound to dissolve the thermoplastic residuals. The procedure was repeated five times, each time using fresh acetone to gradually decrease the contamination of the sample surface. Since acetone itself showed a certain tendency to adsorb at the surfaces of the sample, they were afterwards purified in isopropyl following the same procedure. Since the typical micro- and nano sized defect structure of PEO coatings results in an intrinsic capillary hygroscopy, the samples were dried for 24 h under vacuum at 60 C. Afterwards, an electrical conductive layer was sputtered onto the sample surface. The Kikuchi lines showed an unsatisfying band contrast by use of carbon layers, which can be attributed to their excessive thickness and uneven thickness distribution. Therefore, thin layers of gold, invisible to the naked eye, were applied.
The micro-structure analysis was carried out by using a field-emission SEM (NEON 40EsB, Zeiss, Jena, Germany) equipped with an EDX (GENESIS, EDAX, Mahwah, NJ, USA) and EBSD system (OIM 5.31, EDAX TSL, Mahwah, NJ, USA). The SEM micrographs were taken in backscatter (BS) and secondary (SE) electron mode using an acceleration voltage of 15 kV and a working distance of 10 mm. For the EBSD measurements, the acceleration voltage was 15 kV. The samples were tilted by 70°, and the aperture was opened to 120 µm in high current mode. The sampling step size was set to 150 nm, while the sampling time was limited to some seconds in order to prevent a deterioration of the EBSD data as a result of local charging (leading to electron-beam drift) and contamination. During this measurement, the parameters of which were optimized for electron backscattering diffraction, EDX data were recorded as well. They allow for a qualitative representation of the spatial distribution of the chemical elements detected. However, the short spot measurement prohibits a quantitative interpretation.
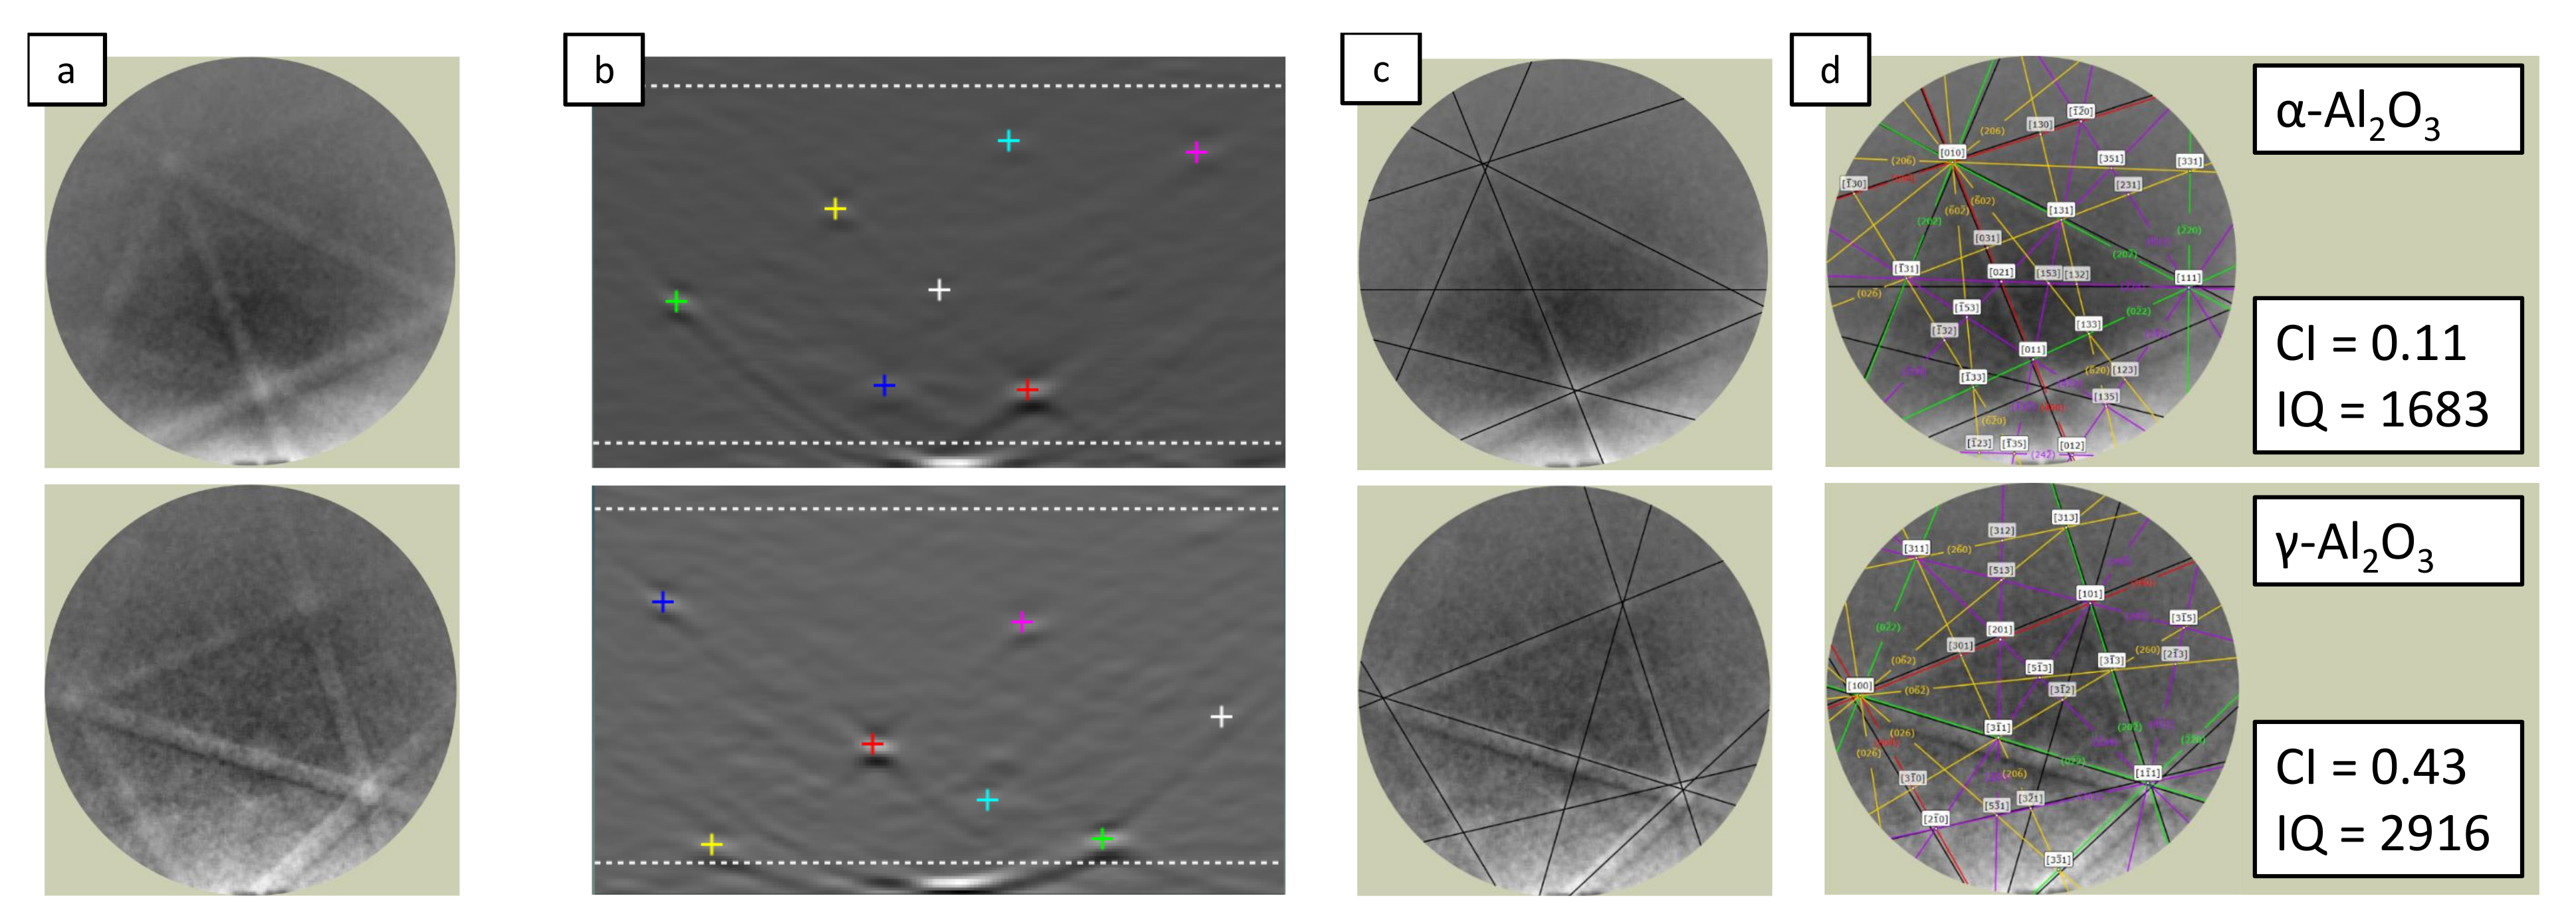
Figure 2 summarizes the procedure used for processing and indexing the data obtained by the EBSD measurement. The raw signal intensity map with diffraction bands visible for the naked eye, Figure 2a, was transferred by using Hough transform into an dual space shown in Figure 2b. Here, seven local maxima, indicated by colored markers, were used to identify the main characteristic diffraction lines of the spot under investigation, depicted in Figure 2c. Afterwards, the OIM software was used to assign those incomplete Kikuchi patterns to one of the two crystalline aluminum oxide modifications - and -AlO previously identified by XRD. The corresponding complete Kikuchi patterns are presented in Figure 2d. This combined use of diffraction-based material-analytic methods allows for an EBSD phase map, despite the confidence index (CI) being relatively low (between 0.1 and 0.5) in this study. The CI value quantifies, via a complex algorithm, how well the detected diffraction pattern matches the indexed diffraction pattern [31,32]. As a side effect of this procedure, some grains of the aluminum-substrate alloy were indexed as alumina phases as well, which has to be considered negligible artifacts of this methodology.
Figure 2.
Graphical representation of the procedure used for indexing EBSD data, showing the raw signal intensity map with diffraction bands (a), the dual space resulting from the Hough transform with colored markers (b), indicating the characteristic diffraction lines of the spot under investigation (c), which were used to assign the data to the characteristic Kikuchi pattern of - (top) or -AlO (button) (d).

During the EBSD measurement, regions were identified in which only a few to no diffraction bands were present, which showed only a low band contrast. This leads to a reduction of the peak number and strength in the Hough space and is quantified by the so-called image quality (IQ) [31]. In addition to numerous influencing factors on the part of preparation (topography, artefacts, edges) and the experimental setup (acceleration voltage, inclination angle, spot measurement time), the IQ is influenced by various structural features (residual stresses, distortions, dopants) along the area under investigation.
Furthermore, a low IQ can indicate amorphous areas or zones with a low crystalline order. Therefore, areas that did not allow for clear assignment to the crystalline aluminum-oxide modifications determined by XRD have been categorized into three subclasses in this work.
- i
- IQ = 0–500: no band contrast, no pattern detectable, areas with practical no signal response, cavities, edges, amorphous zones
- ii
- IQ ≥ 500–750: very low band contrast, weakly delectable diffraction patterns, no indexing possible
- iii
- IQ ≥ 750–1000: low band contrast, detectable diffraction patterns, no phase assignable
3. Results
3.1. ICP-OES
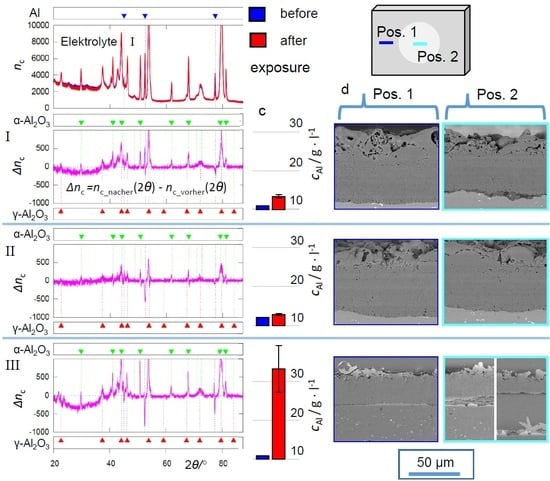
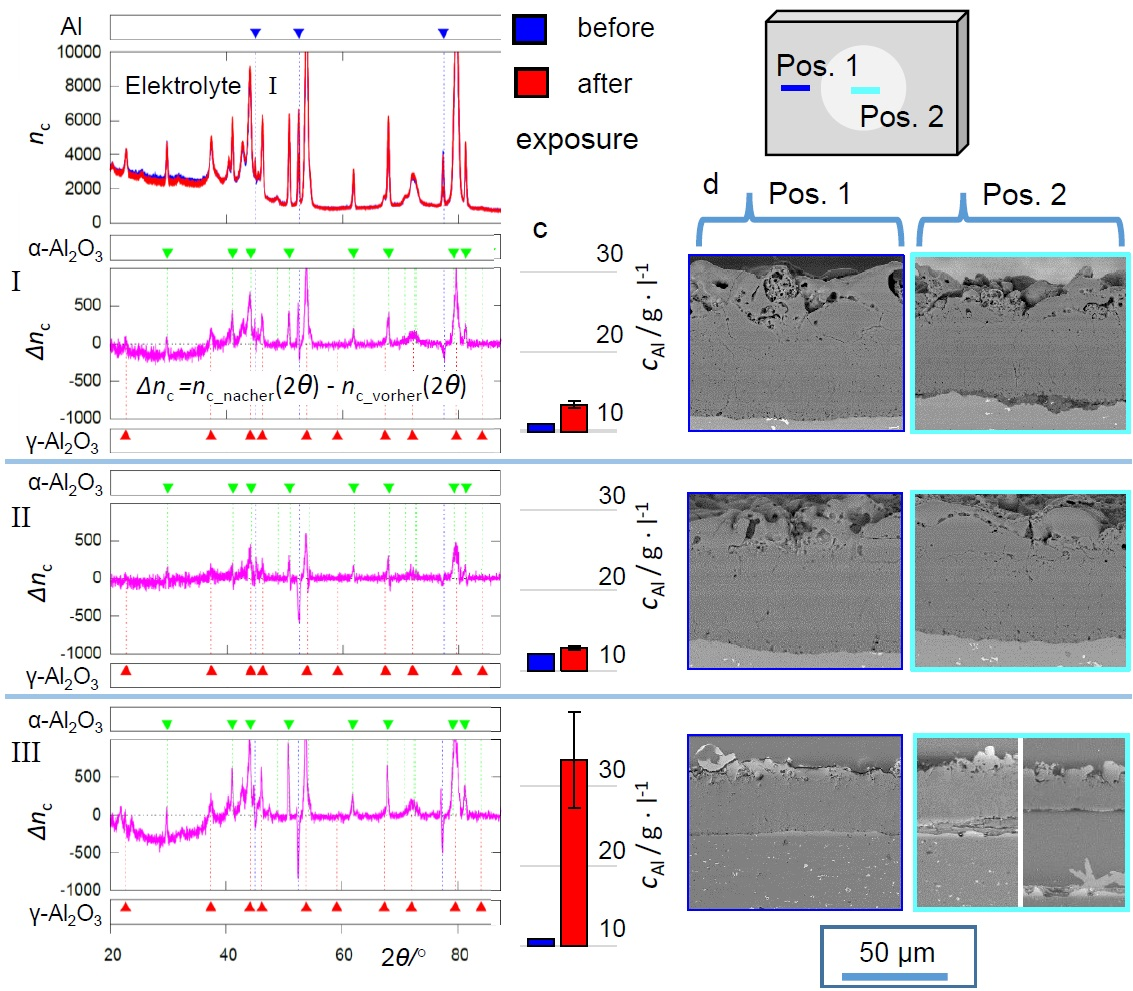
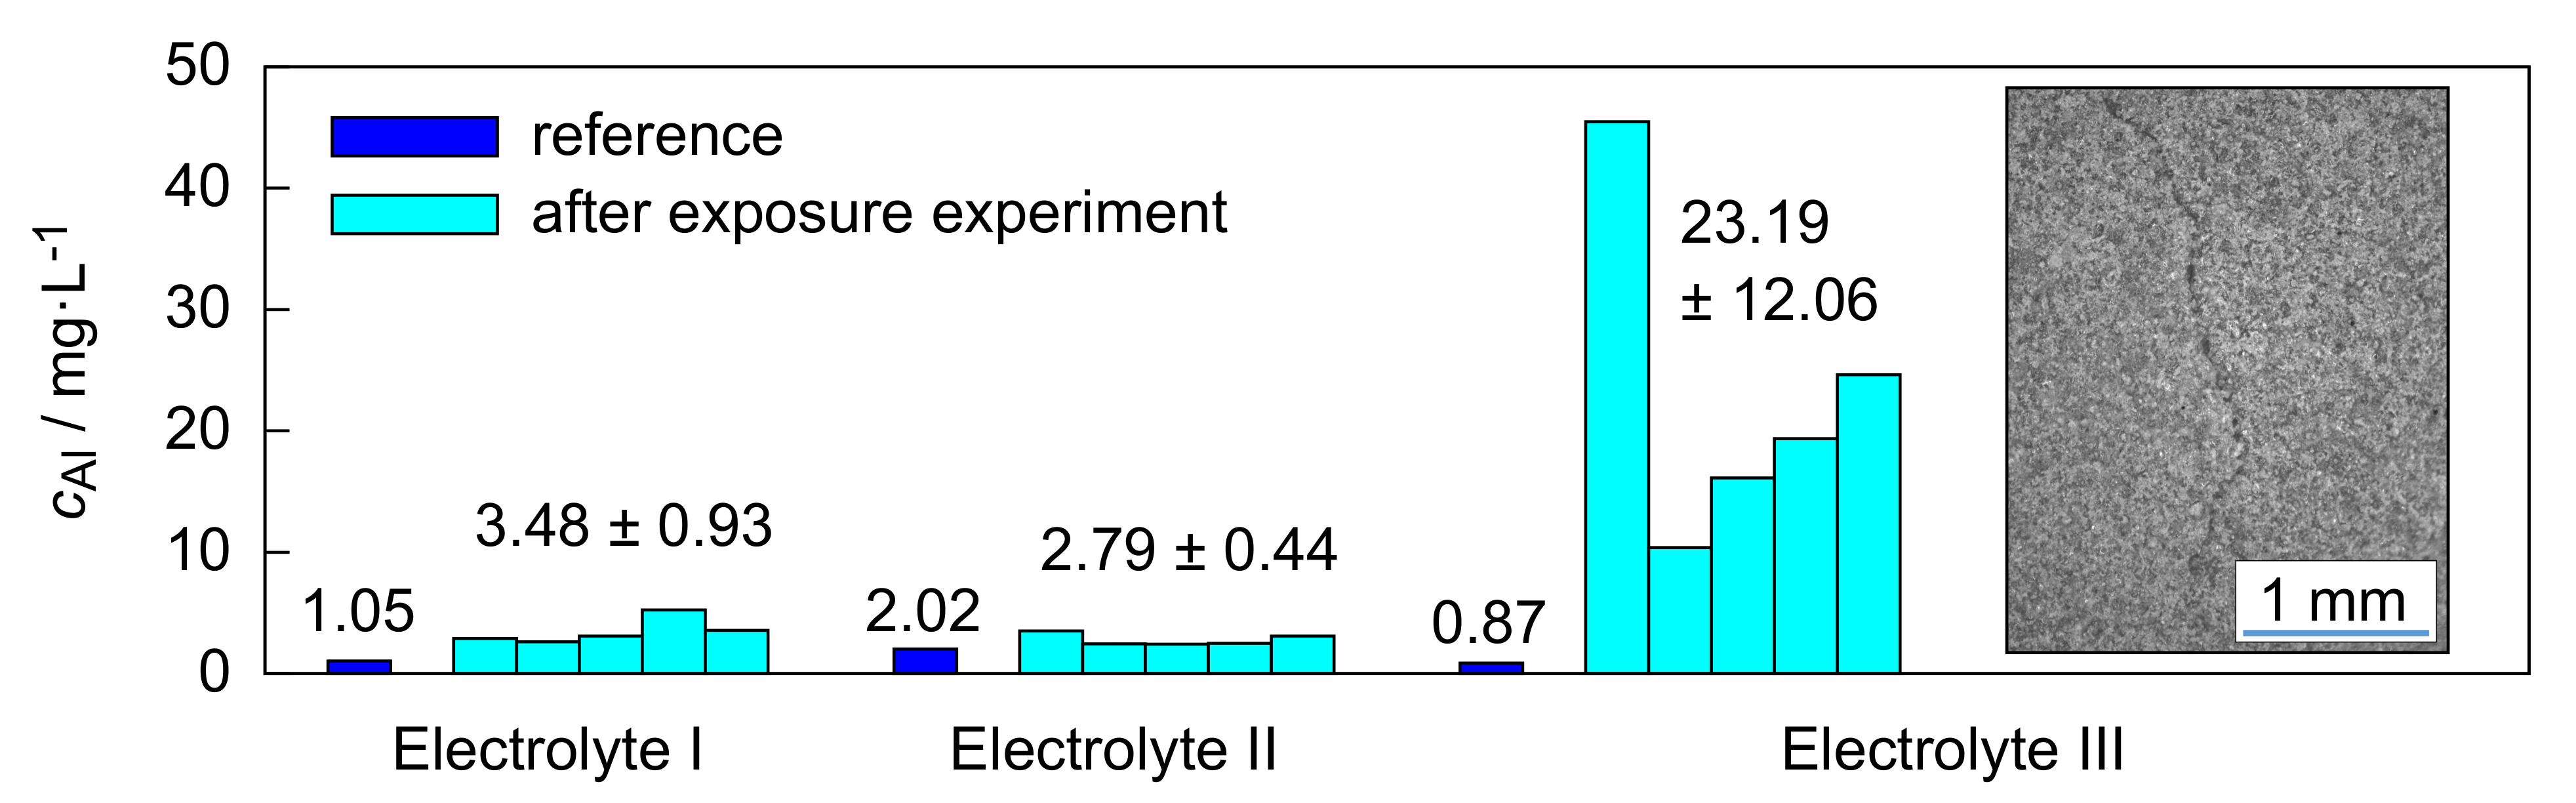
The results of the ICP-OES measurements are summarized in Figure 3. The bar graphs show the determined aluminum concentrations before and after the exposition experiments for the electrolytes I–III. Furthermore, a representative stereographic close up image of a delaminated coating region observed on a sample treated in electrolyte III is depicted. Here a cavity occurred between coating and sample during the experiments, which is shown exemplary in side view in Figure 11.
Figure 3.
Aluminum concentrations of the electrolytes I-III used for the exposition experiments: reference concentration after preparing the solutions (blue), concentrations after immersing the 5 mounted samples for 60 min at 95 C (cyan).
Figure 3.
Aluminum concentrations of the electrolytes I-III used for the exposition experiments: reference concentration after preparing the solutions (blue), concentrations after immersing the 5 mounted samples for 60 min at 95 C (cyan).

The reference measurements of the electrolytes before the exposition experiments showed aluminum concentrations of 0.9 to 2 mg/L, which are presumably originated from minor contaminations of the used deionized water, chemicals and laboratory equipment. The lowest aluminum concentration and deviations between the repetition measurements after the exposition were determined for the experiments in electrolyte II. Minus the reference measurement, the average concentration was 1.8 mg/L. After the subtraction of the reference concentration, the investigations in electrolyte I showed an average aluminum content of 2.5 mg/L with an elevated standard deviation. As result of the experiments in electrolyte III, a significantly higher average aluminum concentration of 22.3 mg/L was observed after subtraction the reference value. The individual test replicates show strong differences, resulting in a high standard deviation of 12 mg/L. Furthermore, the coatings showed macroscopic delaminations and cracks of various extent in the same areas.
3.2. X-ray Diffraction
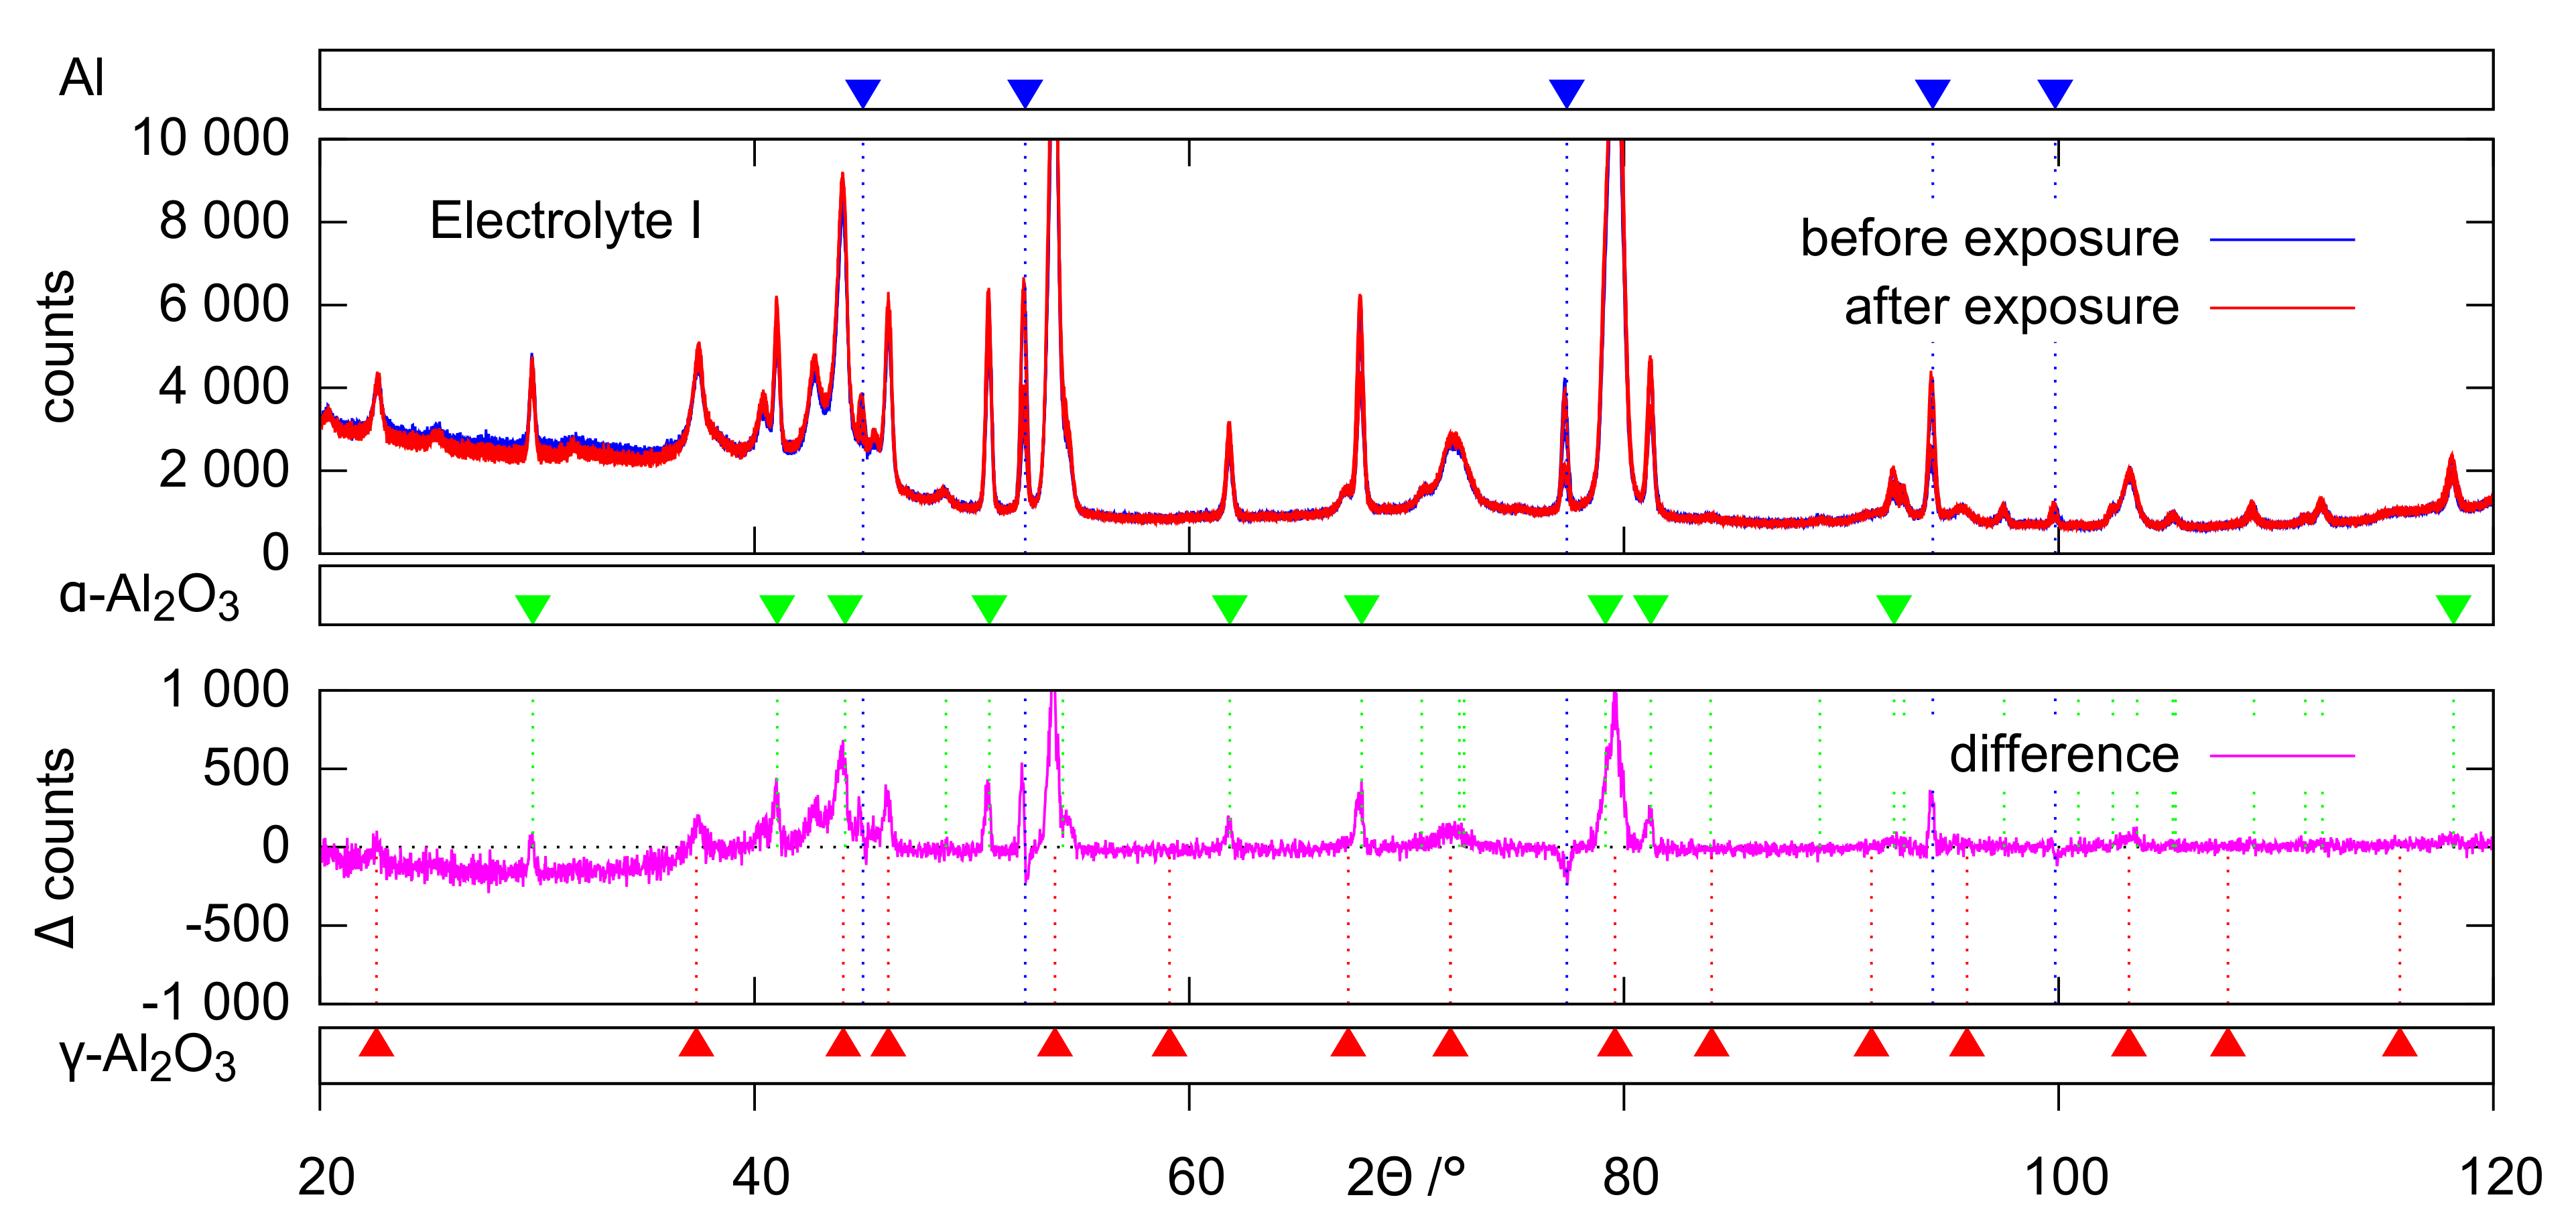
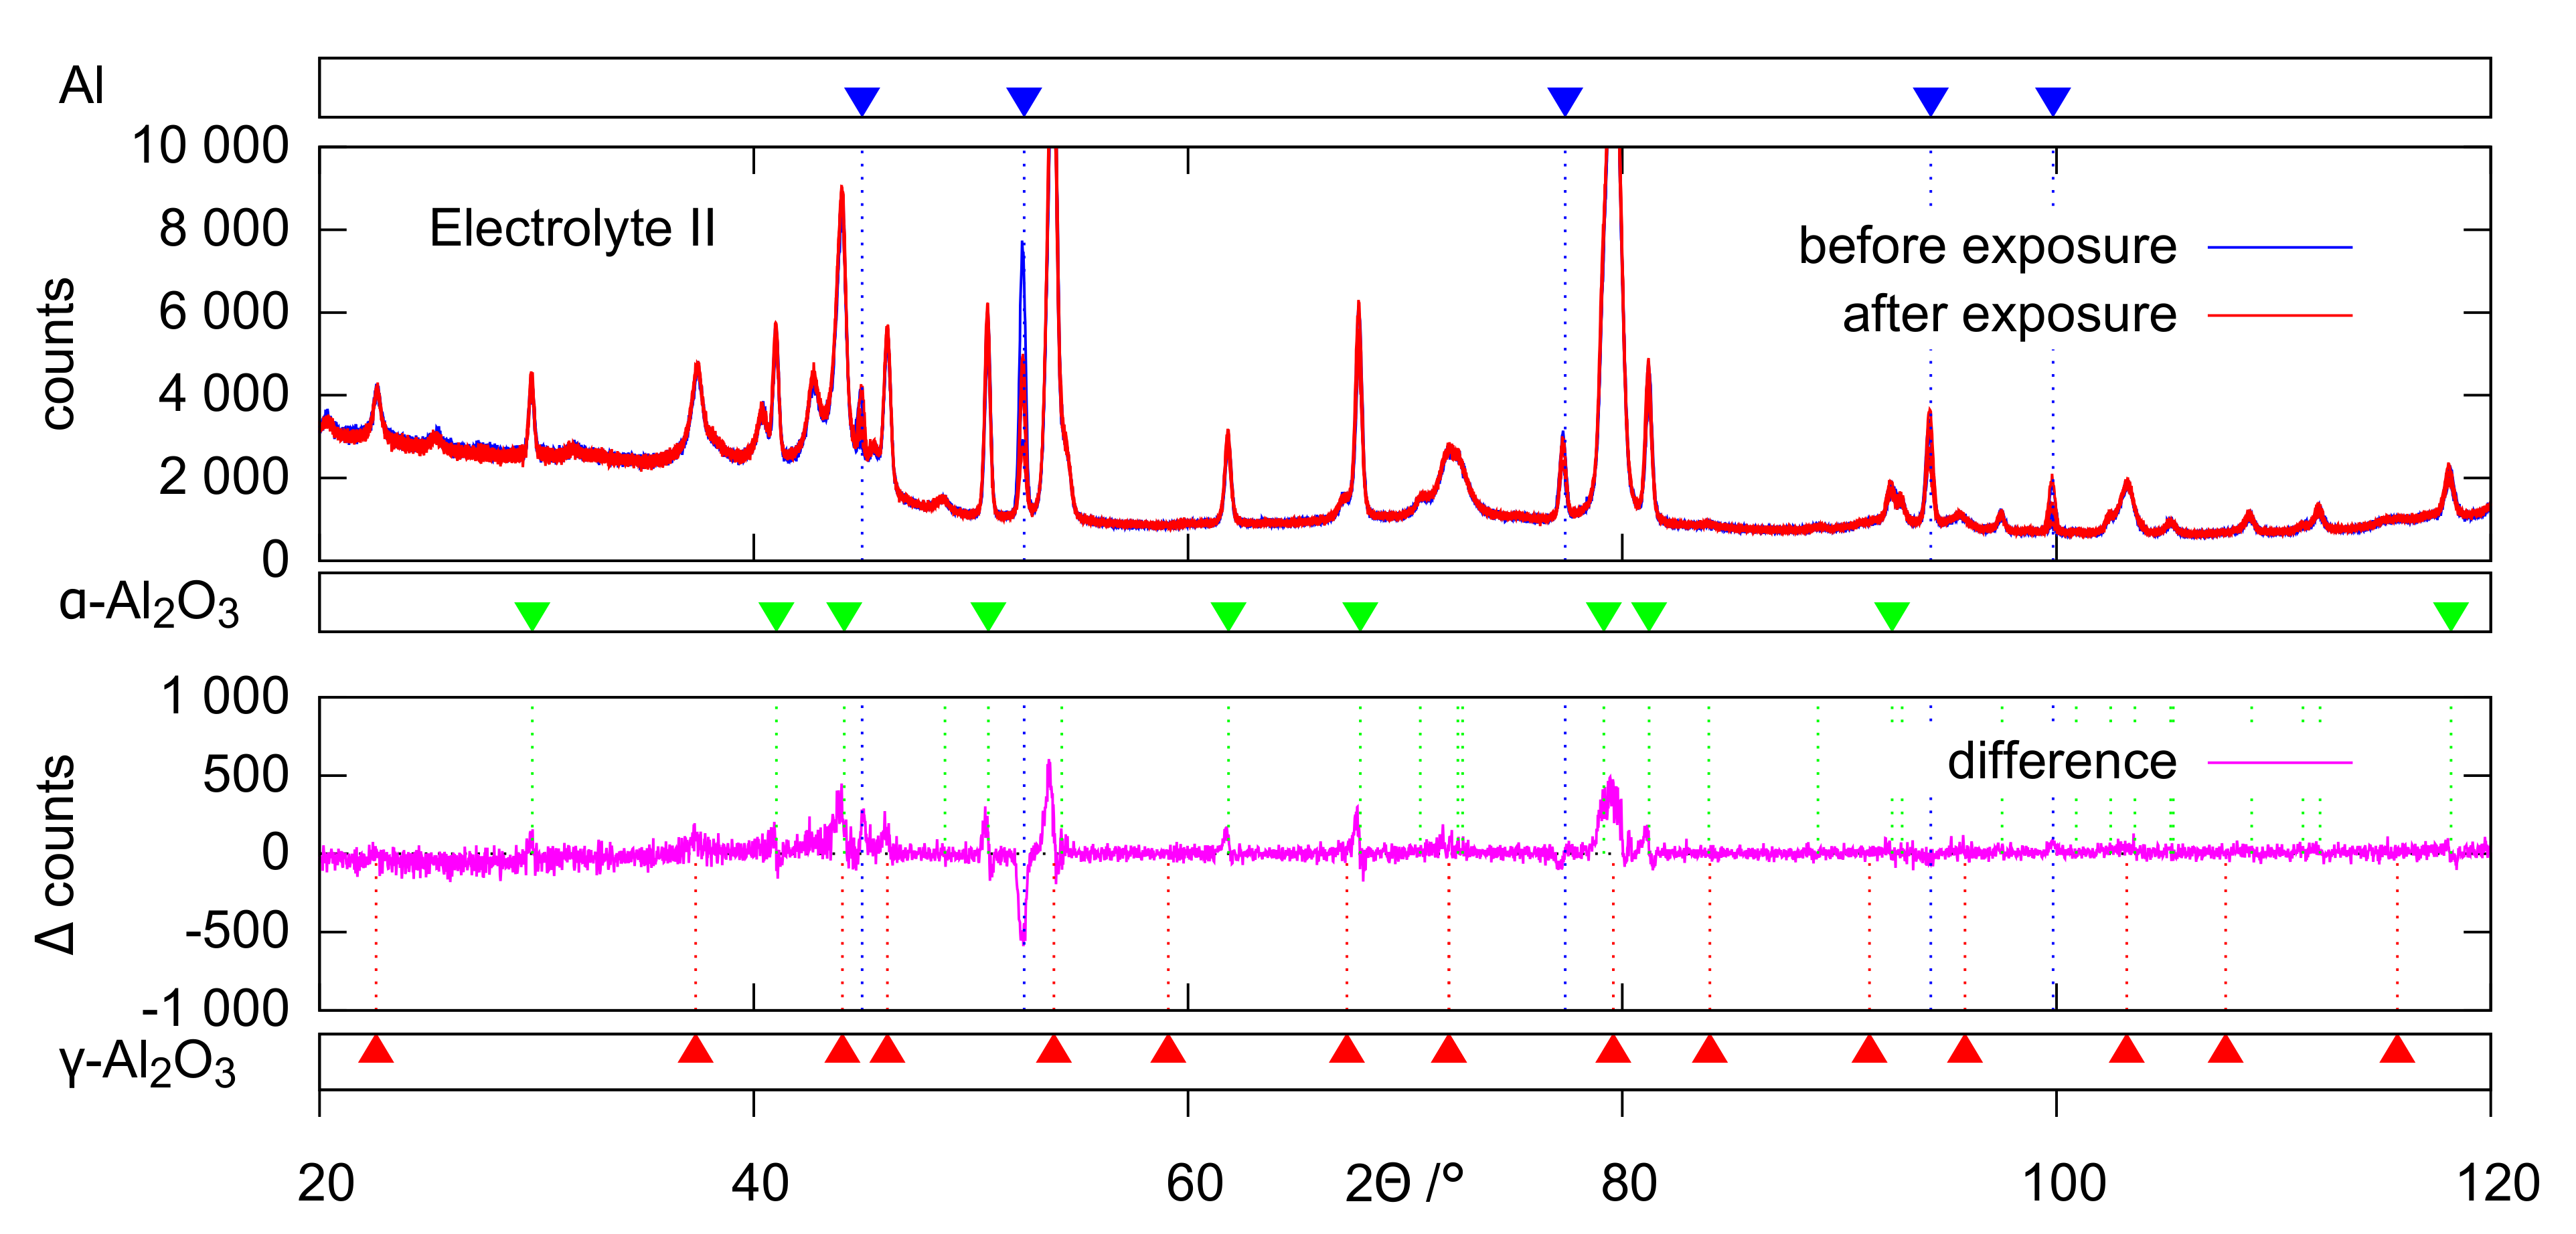
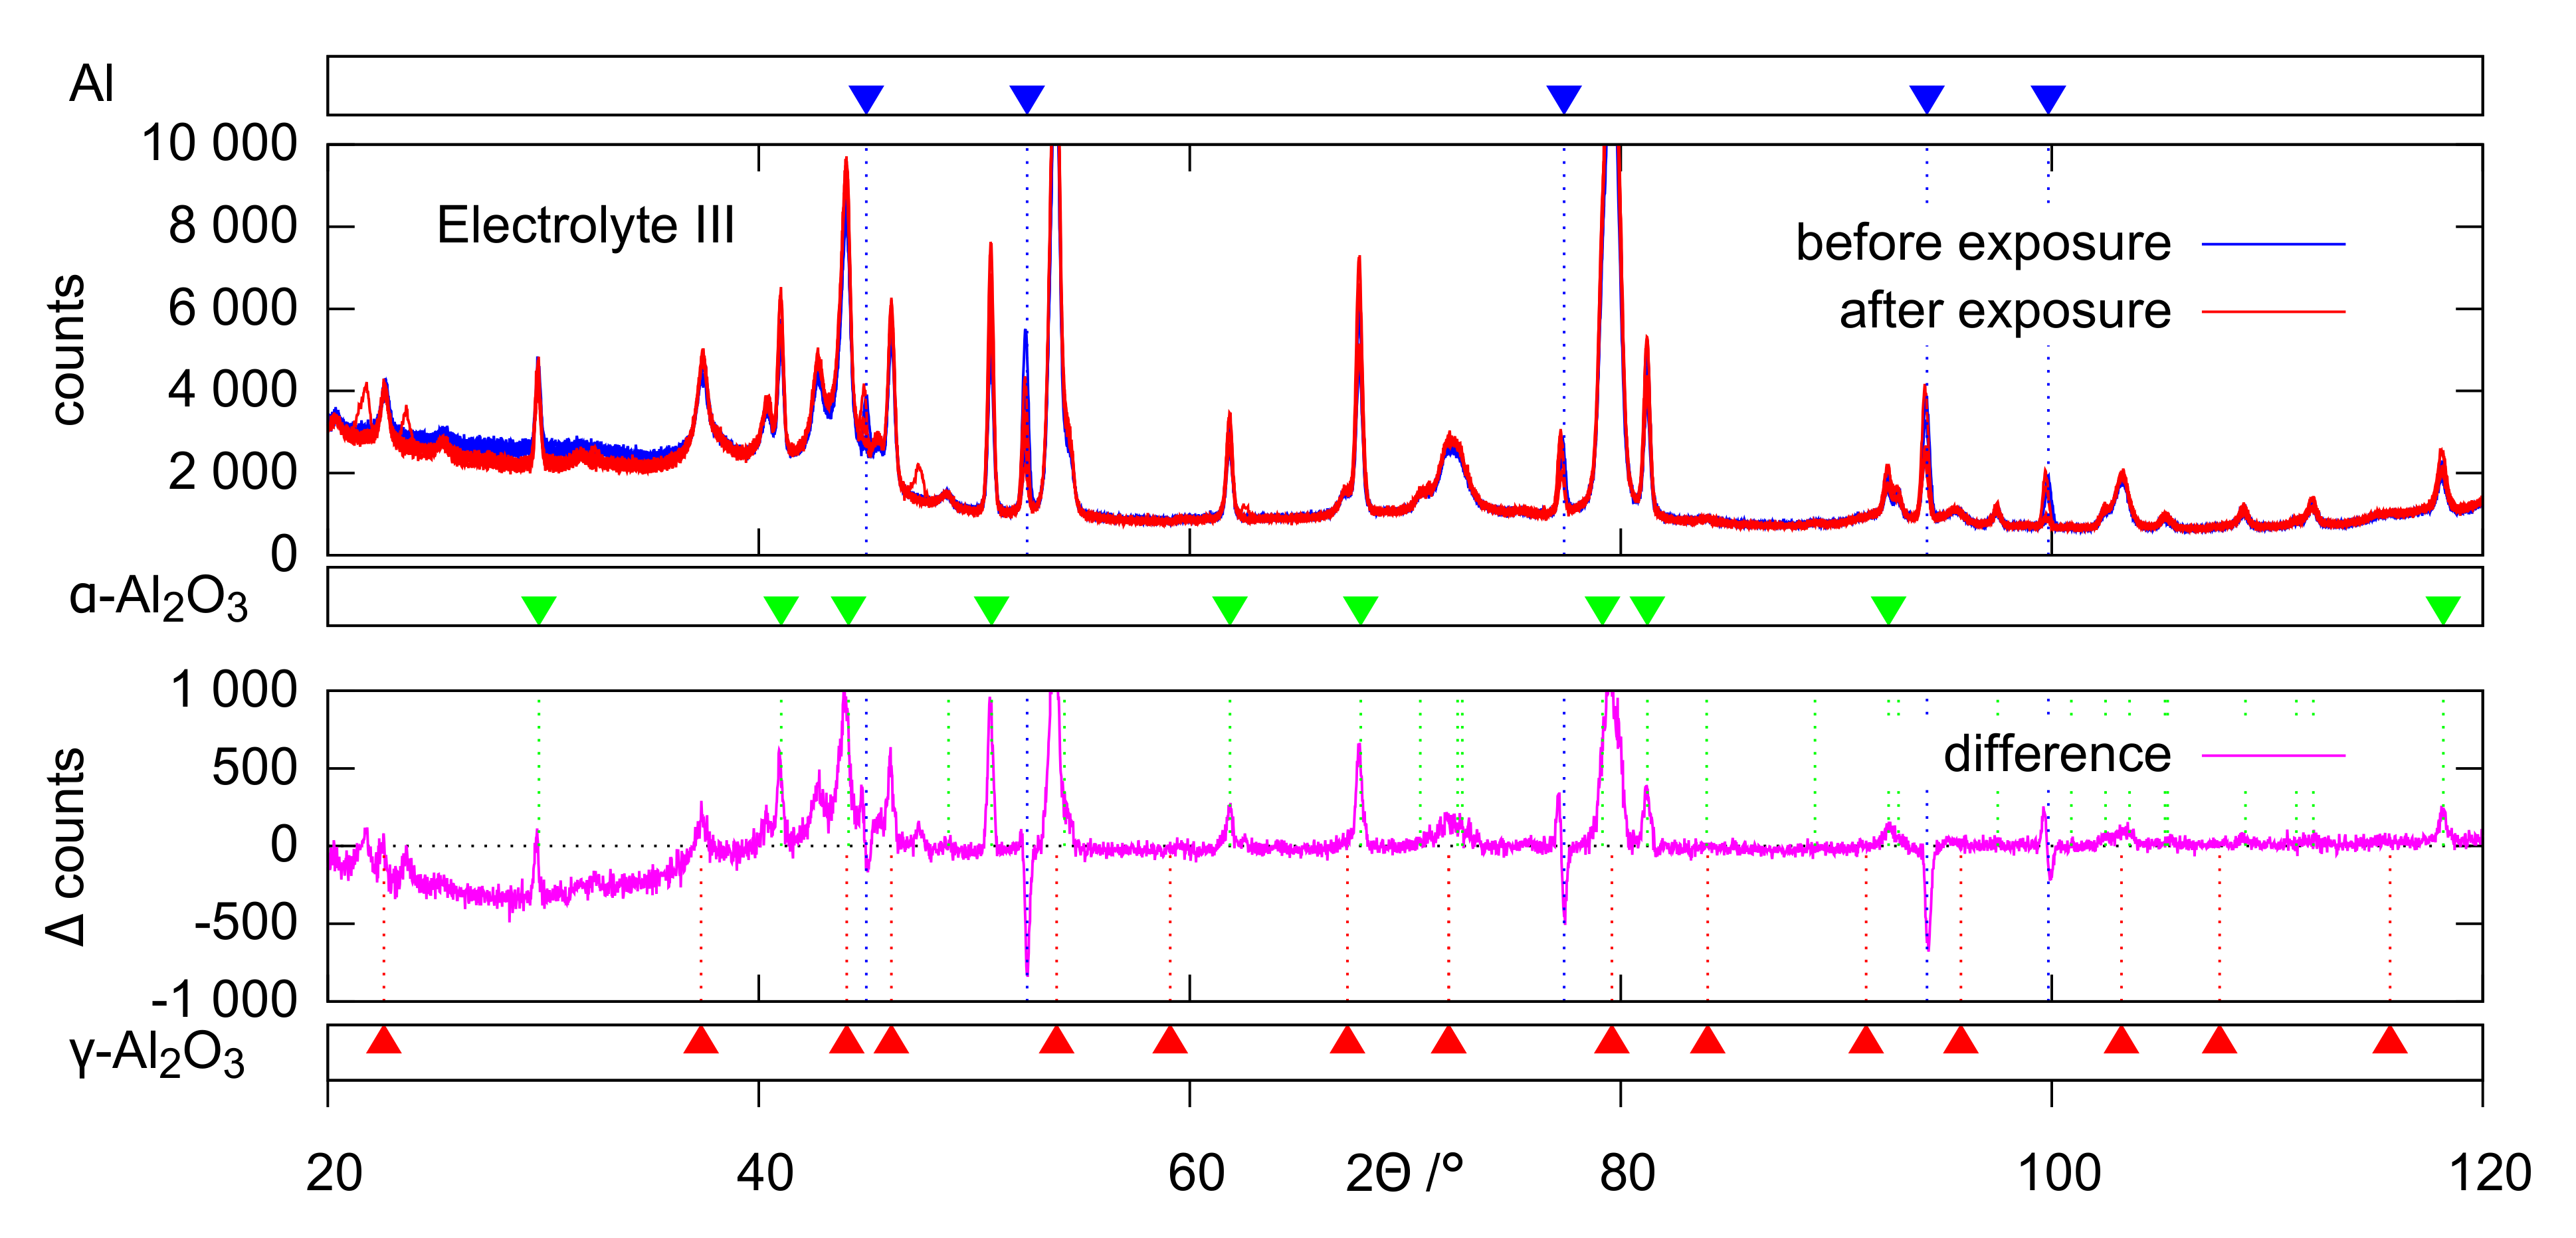
The results of the XRD measurements are summarized in the Figure 4, Figure 7 and Figure 10. The upper subplot with the Y-axis labelled with “counts” shows the five diffractograms measured on the samples before (blue) and after (red) the exposition experiments. The curves of the individual measurements are almost congruent, which indicates that the samples are practically identical with regards to XRD. While in the 2-range from 20° to approximately 37° a broadly drawn intensity range that indicates amorphous layer regions can be recognized, there are numerous crystalline peaks in the rest of the diffractogram. The peaks marked by blue dashed lines and indicated by blue upside down triangles at the top of the figures are originate from the aluminum substrate material. The lower subplot with the Y-axis labeled with “ counts” shows the average value of the difference between the XRD measurements of the five samples before and after the exposition experiments (purple). The positions of the peaks related to the -AlO phase (corundum) are indicated by green dashed lines and upside down triangles in the middle of the figure. The peaks corresponding to the -AlO phase are marked by red dashed lines starting from red triangles from the bottom of the figure. The data concerning the characteristic peak positions of the detected crystalline phases were taken from corresponding powder diffraction files (PDF) [33]. While in Figure 7 (electrolyte II) the purple difference graph shows nearly no shift within the predominantly amorphous 2-range (20°–37°), a significant deflection can be observed in Figure 4 (electrolyte I) which is even stronger pronounced in Figure 10 (electrolyte III). Within the angular range of the substrate-related aluminum peaks, the intensity difference curves show characteristic features, which are listed in Table 4.
The peaks related to the crystalline alumina modifications show an elevated intensity after the exposition experiments for all three electrolytes. This effect is stronger pronounced for the -AlO than for the -AlO phase and increases for the electrolytes in the following order: II, I, III.
Figure 4.
XRD diffractograms of the five PEO-coated samples exposed to electrolyte I before (blue) and after (red) the exposition experiments as well as the average difference graph (purple).
Figure 4.
XRD diffractograms of the five PEO-coated samples exposed to electrolyte I before (blue) and after (red) the exposition experiments as well as the average difference graph (purple).

Figure 5.
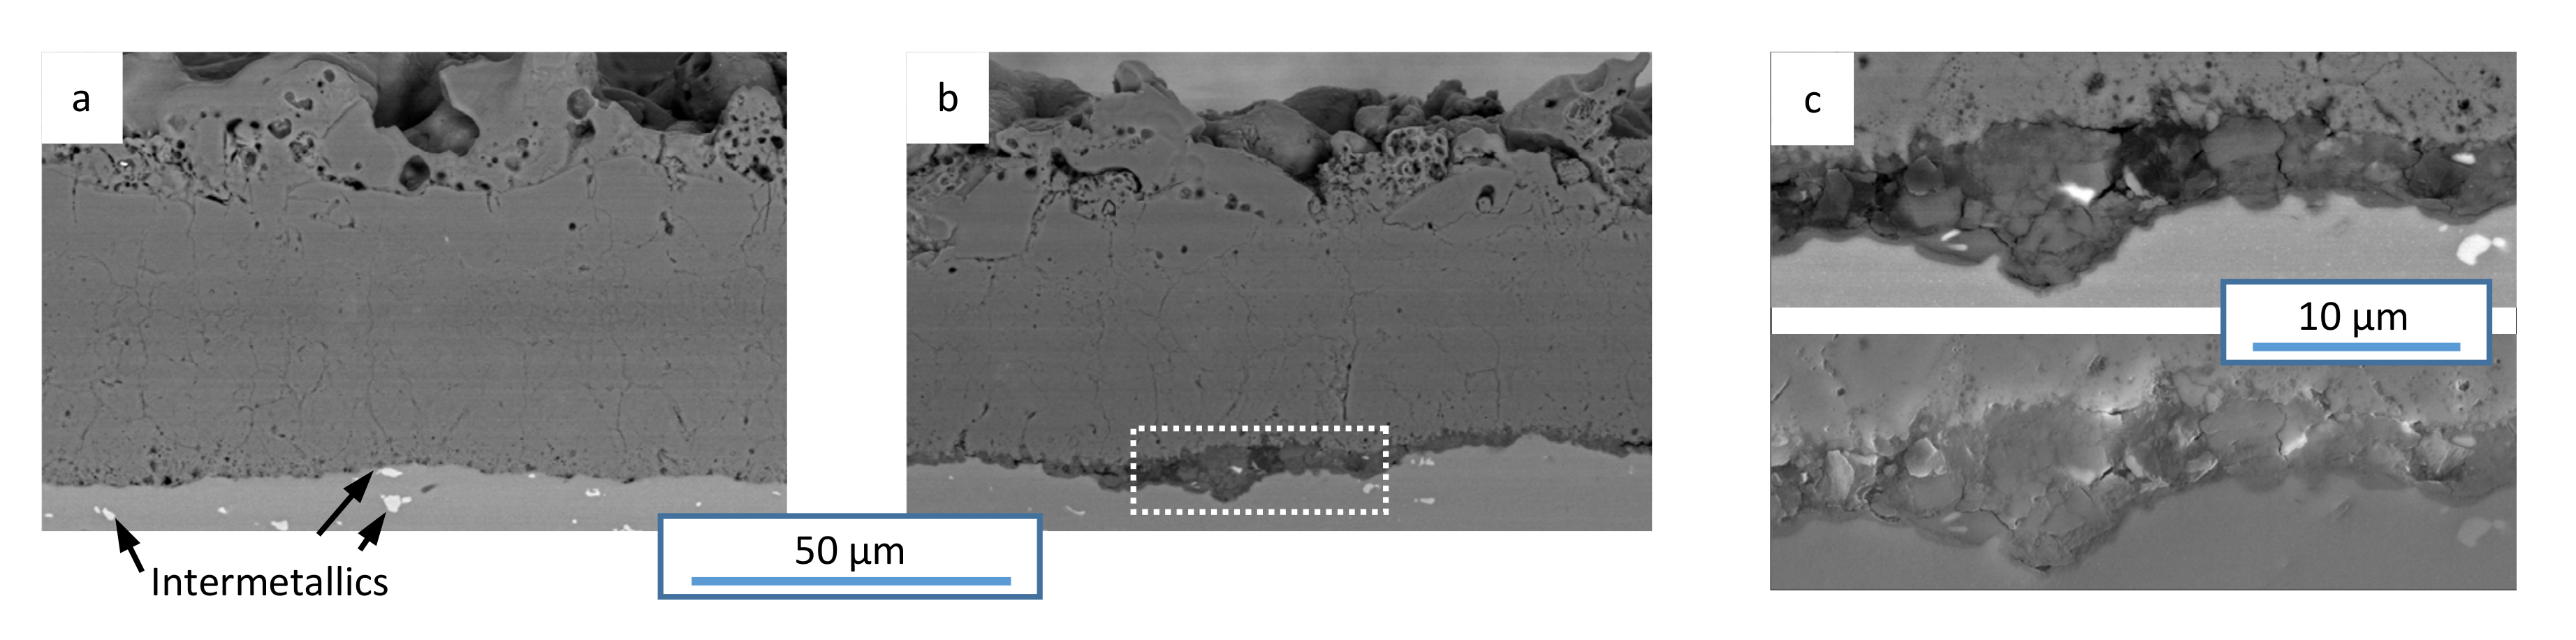
Backscatter SEM images of a sample which was exposed to electrolyte I at cross-sections of the unaffected (a) and affected region (b), as well as close-ups of the substrate/coating interface in backscatter (top) and secondary (bottom) electron mode (c).
Figure 5.
Backscatter SEM images of a sample which was exposed to electrolyte I at cross-sections of the unaffected (a) and affected region (b), as well as close-ups of the substrate/coating interface in backscatter (top) and secondary (bottom) electron mode (c).

Figure 6.
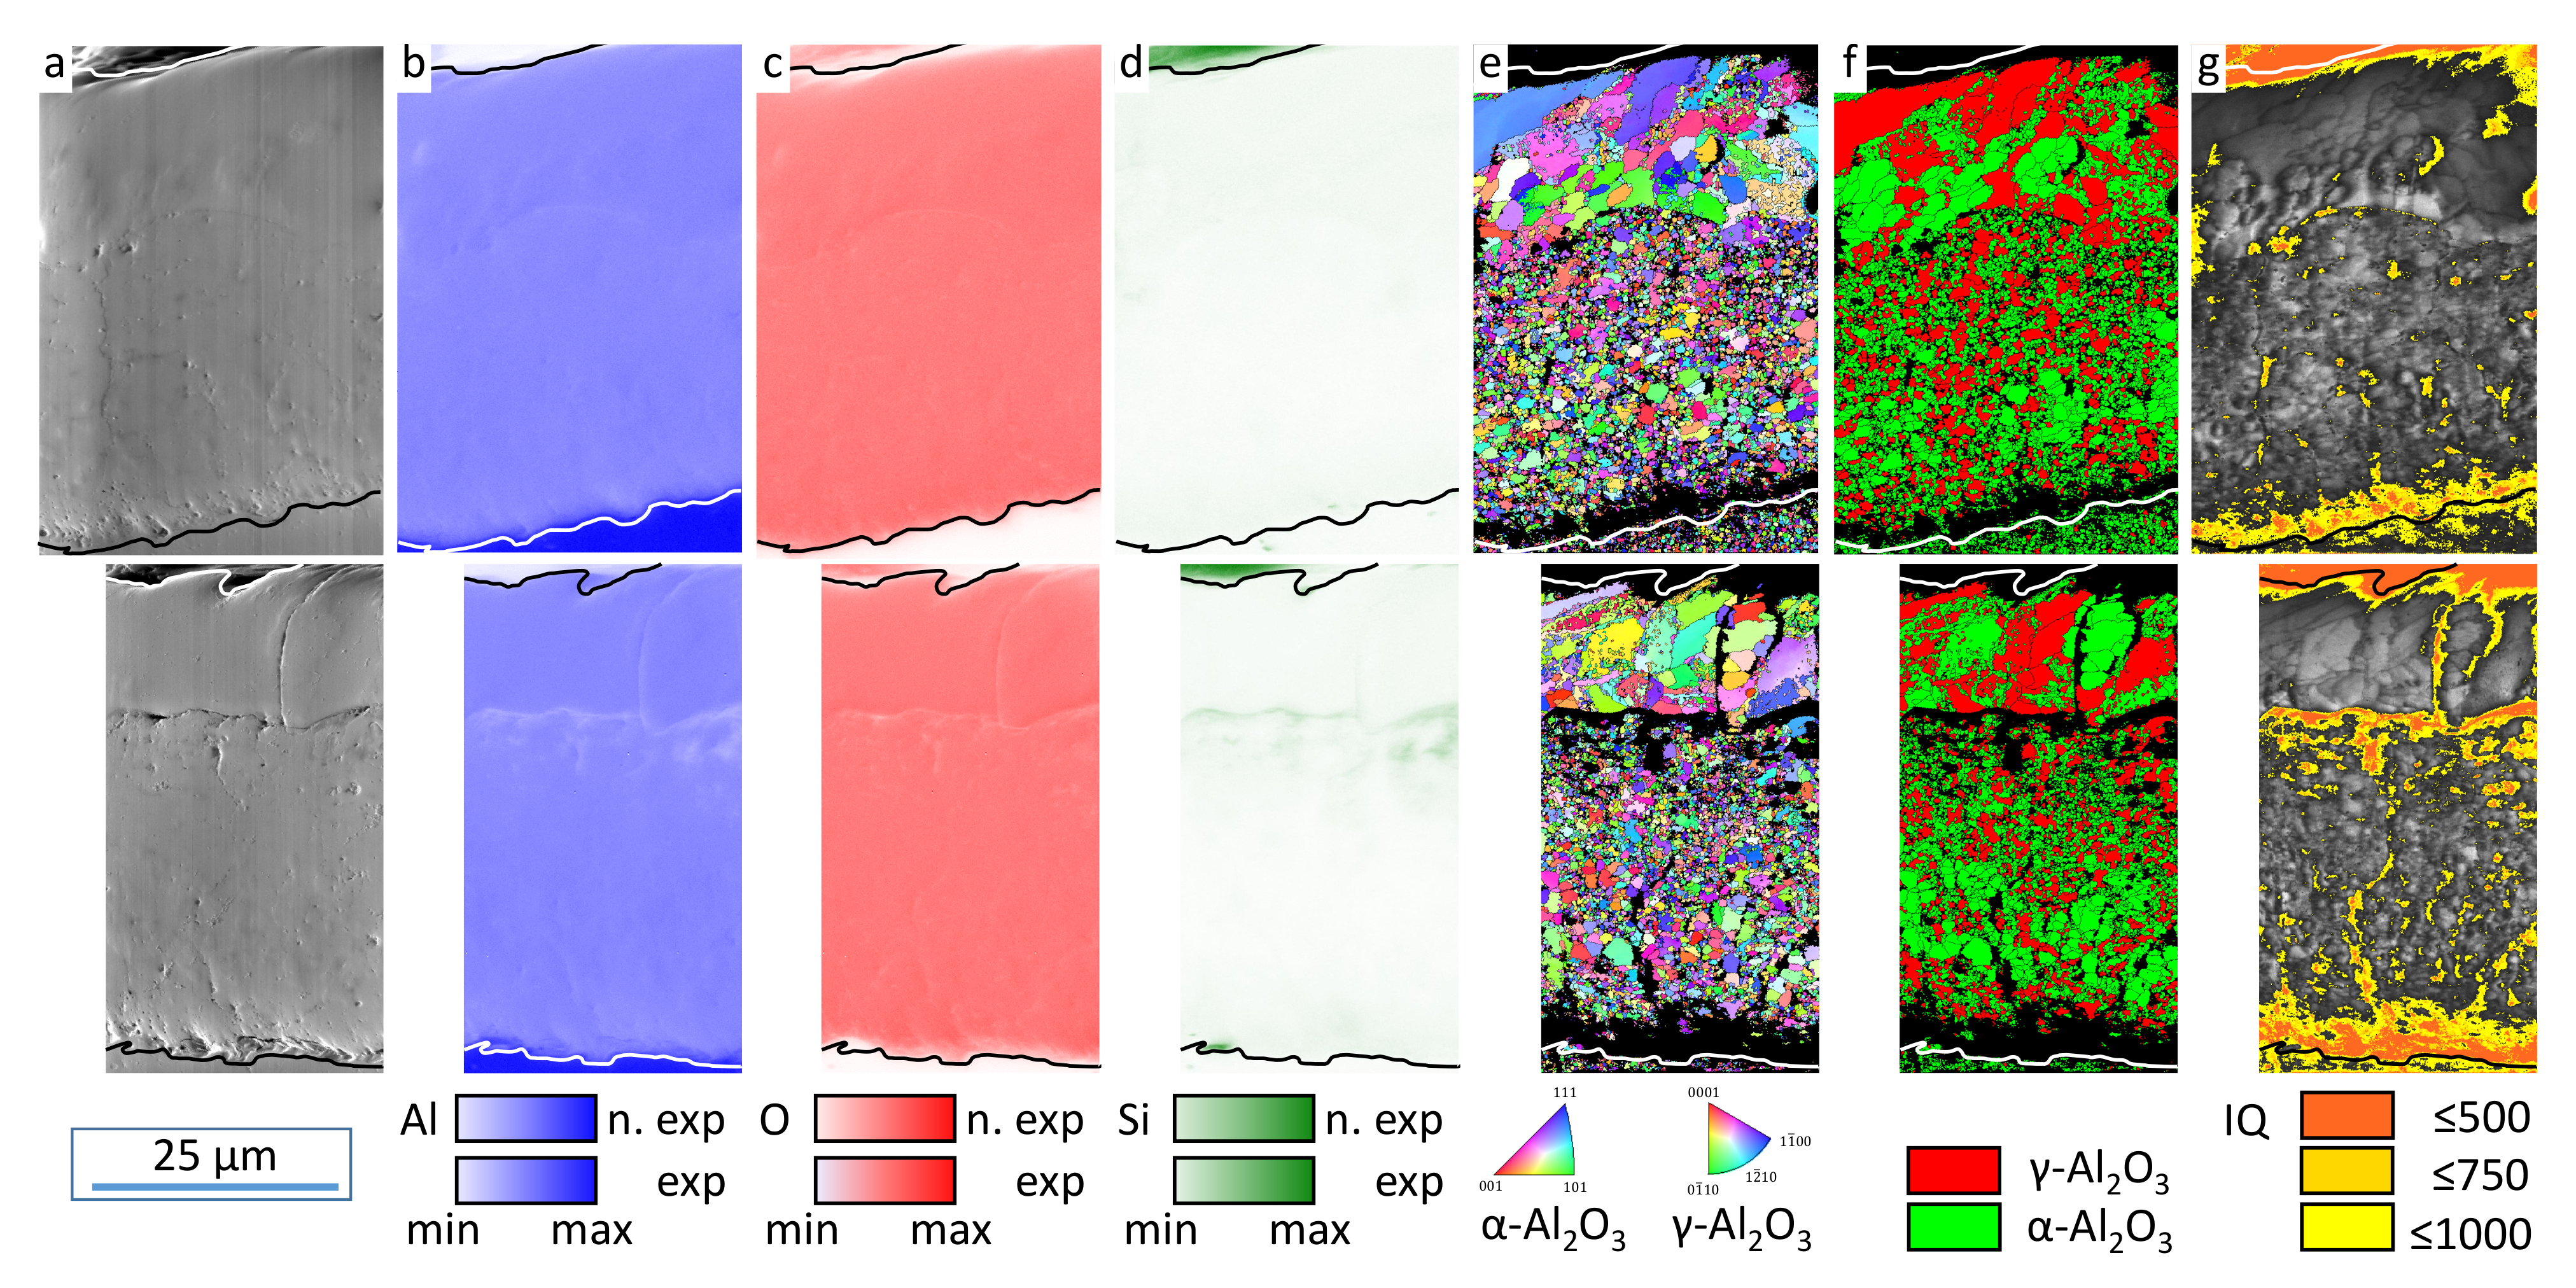
SEM (a) image as well as EDX (b–d) and EBSD (e–g) maps for the cross-section of a sample exposed to electrolyte I at unaffected (top) and affected (bottom) surface regions (Pos. 1 and 2 in Figure 1c).
Figure 6.
SEM (a) image as well as EDX (b–d) and EBSD (e–g) maps for the cross-section of a sample exposed to electrolyte I at unaffected (top) and affected (bottom) surface regions (Pos. 1 and 2 in Figure 1c).

Figure 7.
XRD diffractograms of the five PEO-coated samples exposed to electrolyte II before (blue) and after (red) the exposition experiments as well as the average difference graph (purple).
Figure 7.
XRD diffractograms of the five PEO-coated samples exposed to electrolyte II before (blue) and after (red) the exposition experiments as well as the average difference graph (purple).

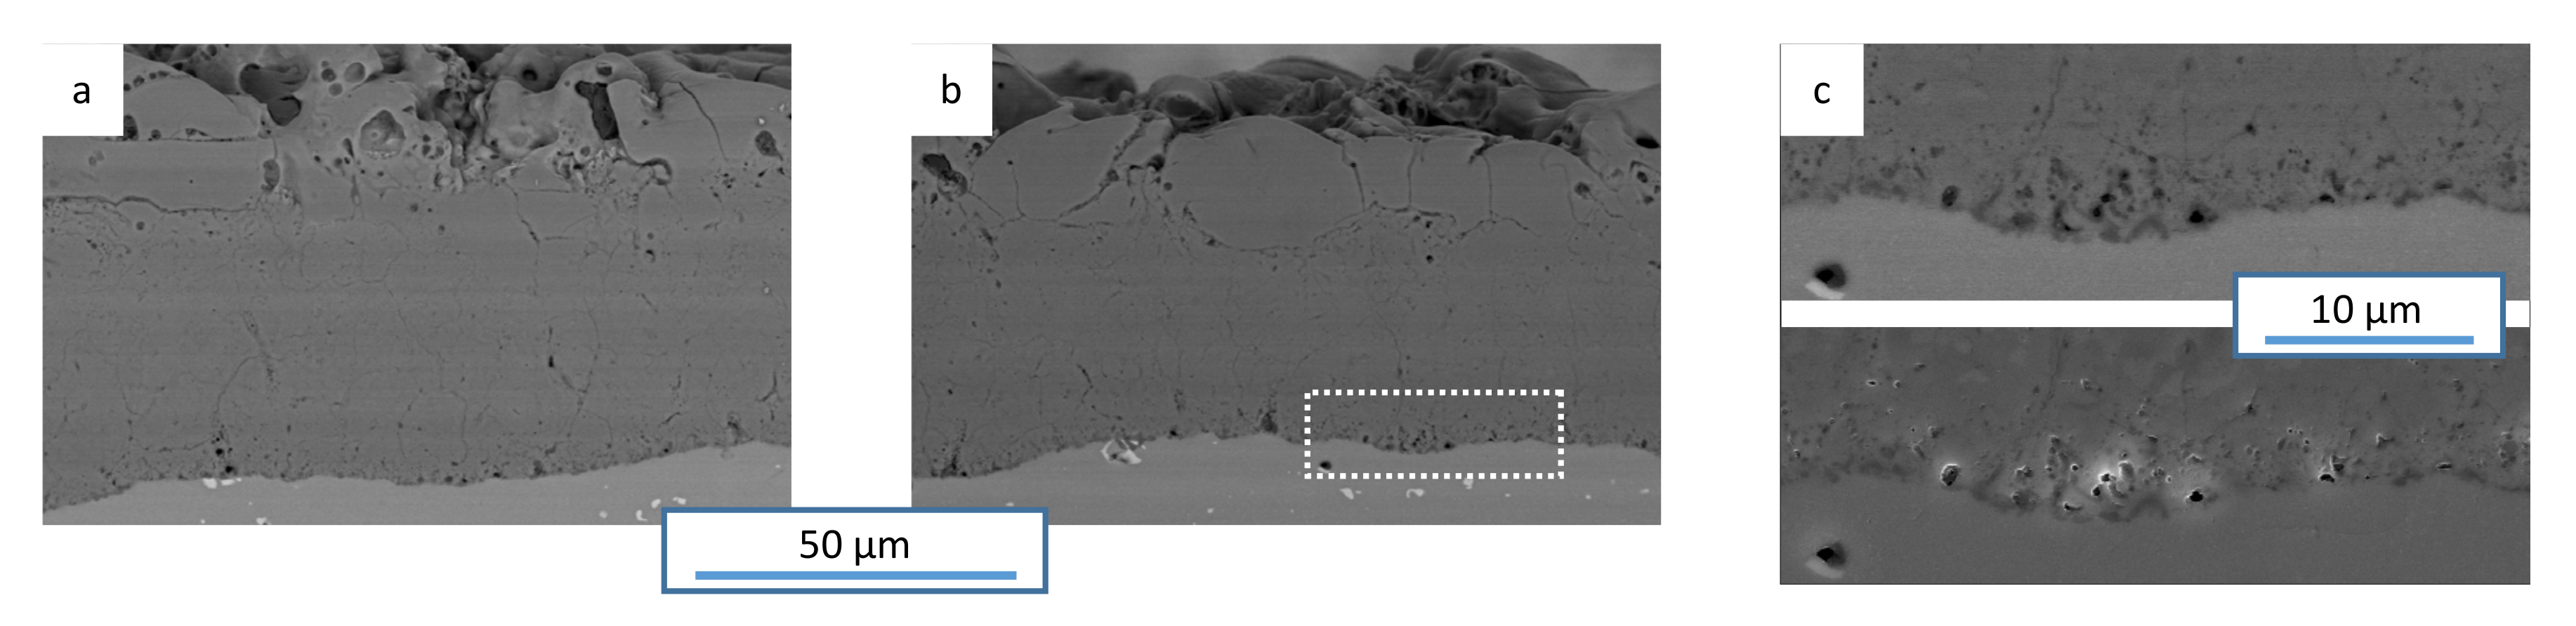
Figure 8.
Backscatter SEM images of a sample which was exposed to electrolyte II at cross-sections of the unaffected (a) and affected region (b), as well as close-ups of the substrate/coating interface in backscatter (top) and seconduray (bottom) electron mode (c).
Figure 8.
Backscatter SEM images of a sample which was exposed to electrolyte II at cross-sections of the unaffected (a) and affected region (b), as well as close-ups of the substrate/coating interface in backscatter (top) and seconduray (bottom) electron mode (c).

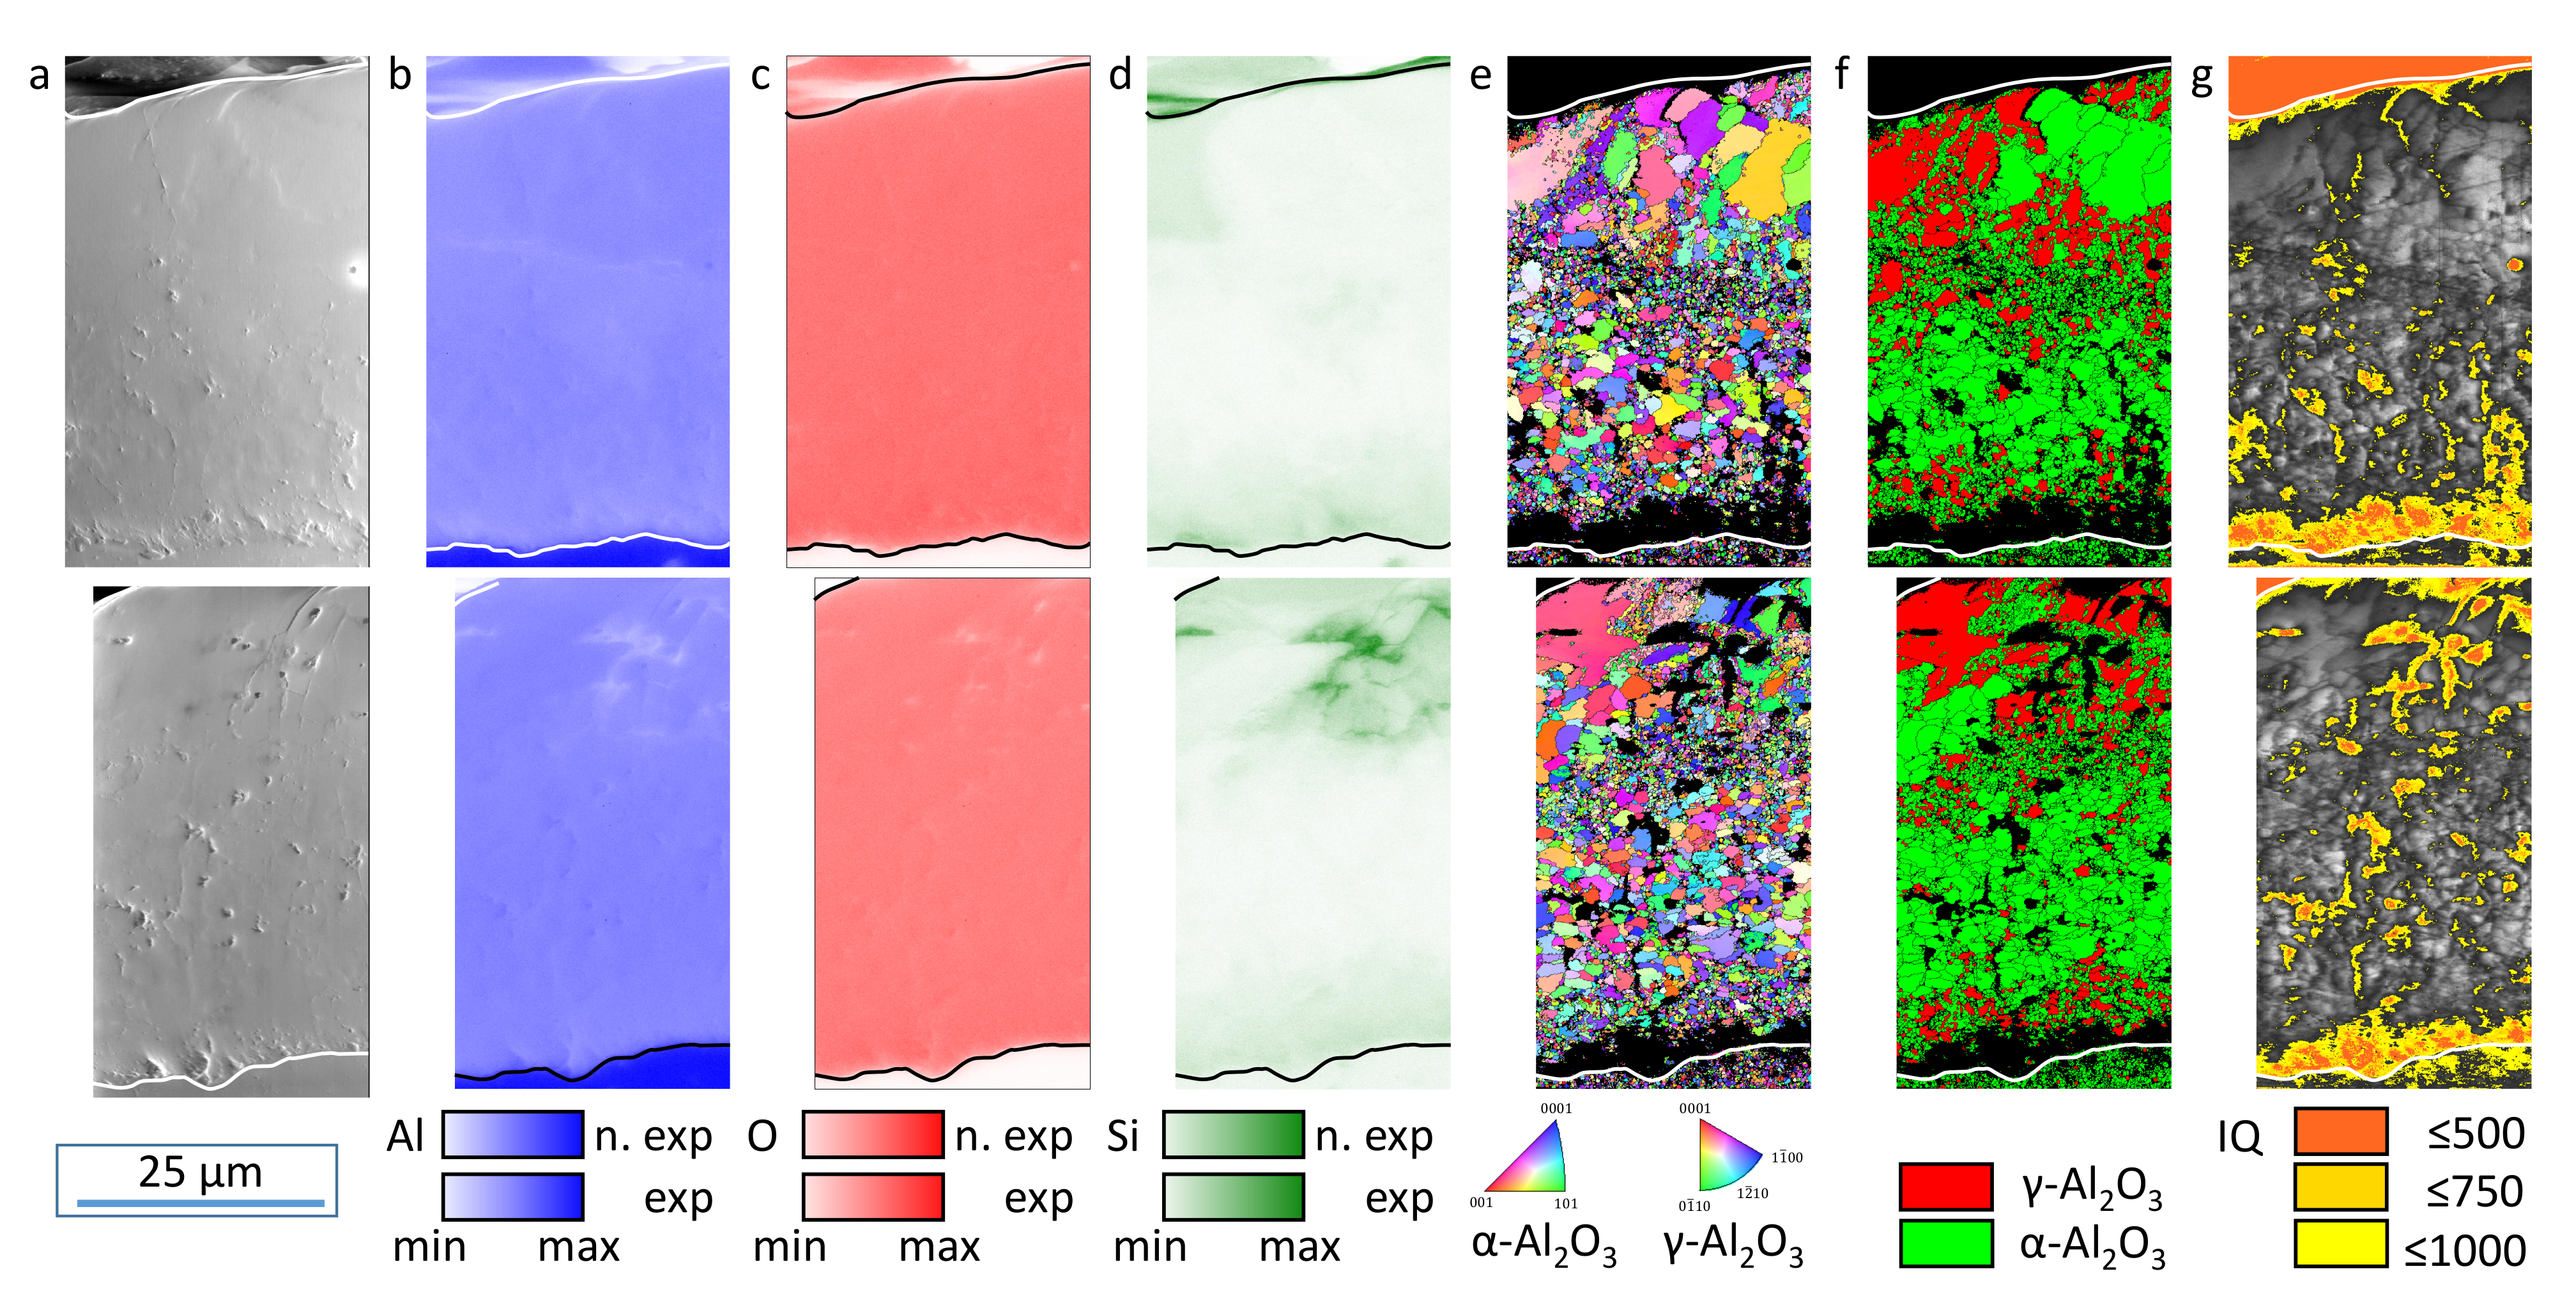
Figure 9.
SEM (a) image as well as EDX (b–d) and EBSD (e–g) maps for the cross-section of a sample exposed to electrolyte II at unaffected (top) and affected (bottom) surface regions (Pos. 1 and 2 in Figure 1c).
Figure 9.
SEM (a) image as well as EDX (b–d) and EBSD (e–g) maps for the cross-section of a sample exposed to electrolyte II at unaffected (top) and affected (bottom) surface regions (Pos. 1 and 2 in Figure 1c).

Figure 10.
XRD diffractograms of the five PEO-coated samples exposed to electrolyte III before (blue) and after (red) the exposition experiments as well as the average difference graph (purple).
Figure 10.
XRD diffractograms of the five PEO-coated samples exposed to electrolyte III before (blue) and after (red) the exposition experiments as well as the average difference graph (purple).

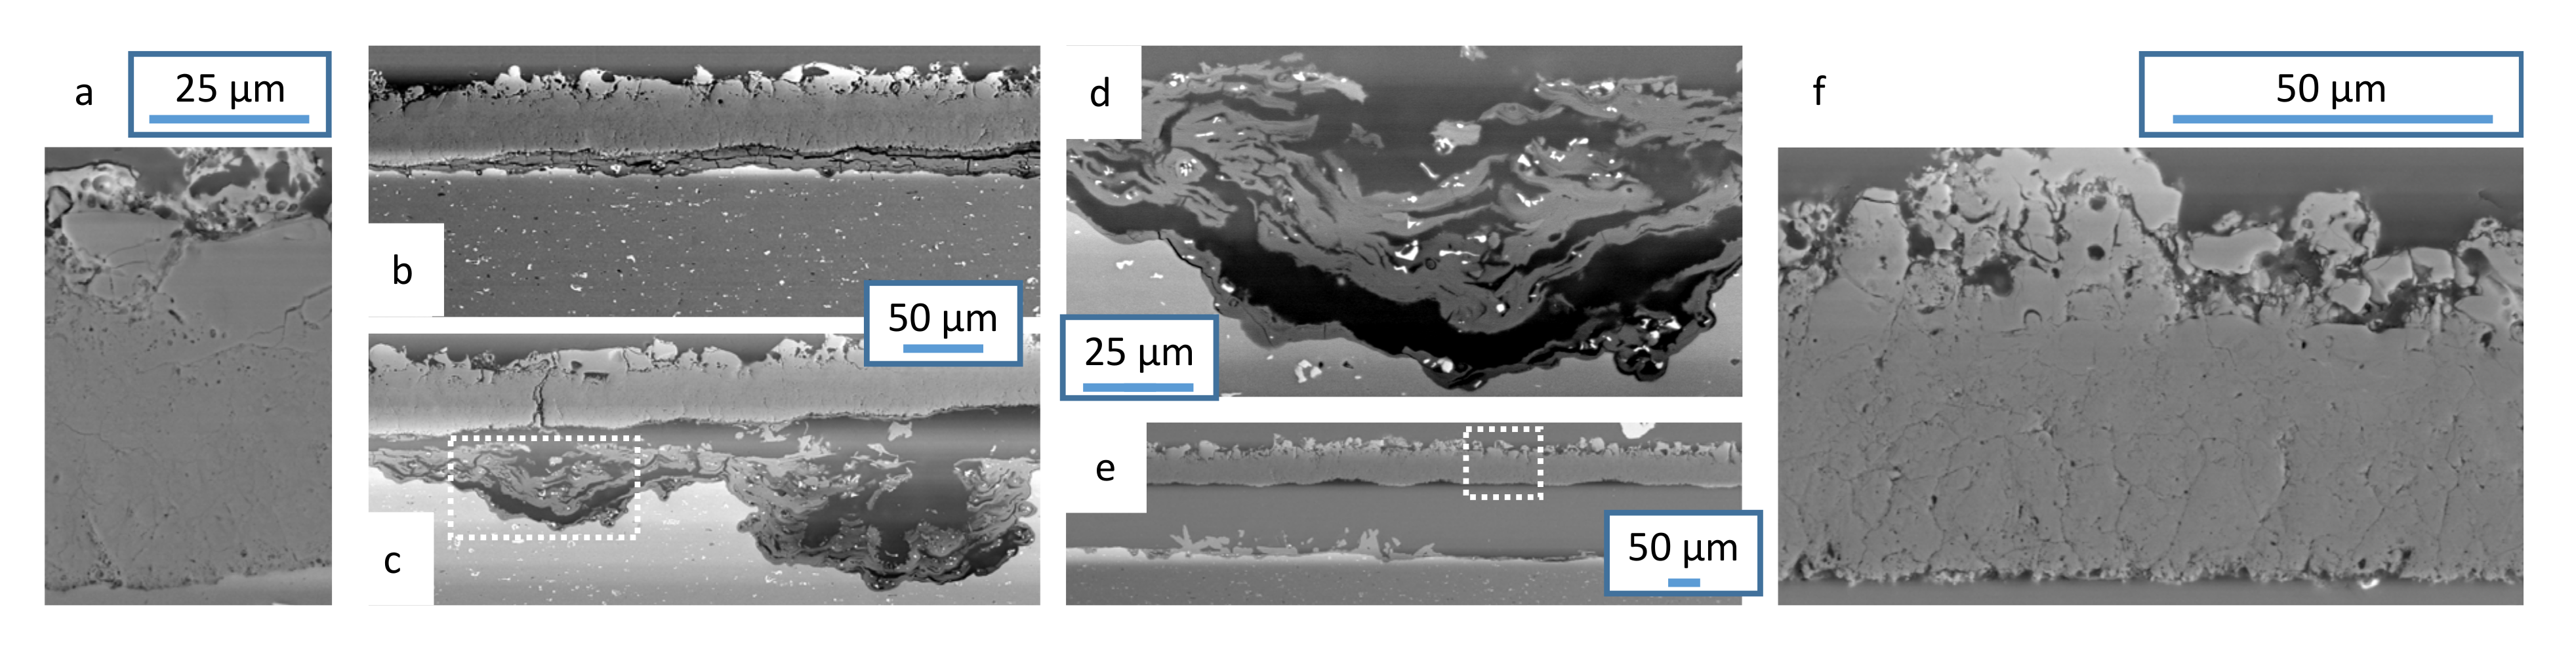
Figure 11.
Backscatter SEM images of a sample which was exposed to electrolyte III at cross-sections of the unaffected (a) and affected region (f), as well at the transition zone between these areas (b–e).
Figure 11.
Backscatter SEM images of a sample which was exposed to electrolyte III at cross-sections of the unaffected (a) and affected region (f), as well at the transition zone between these areas (b–e).

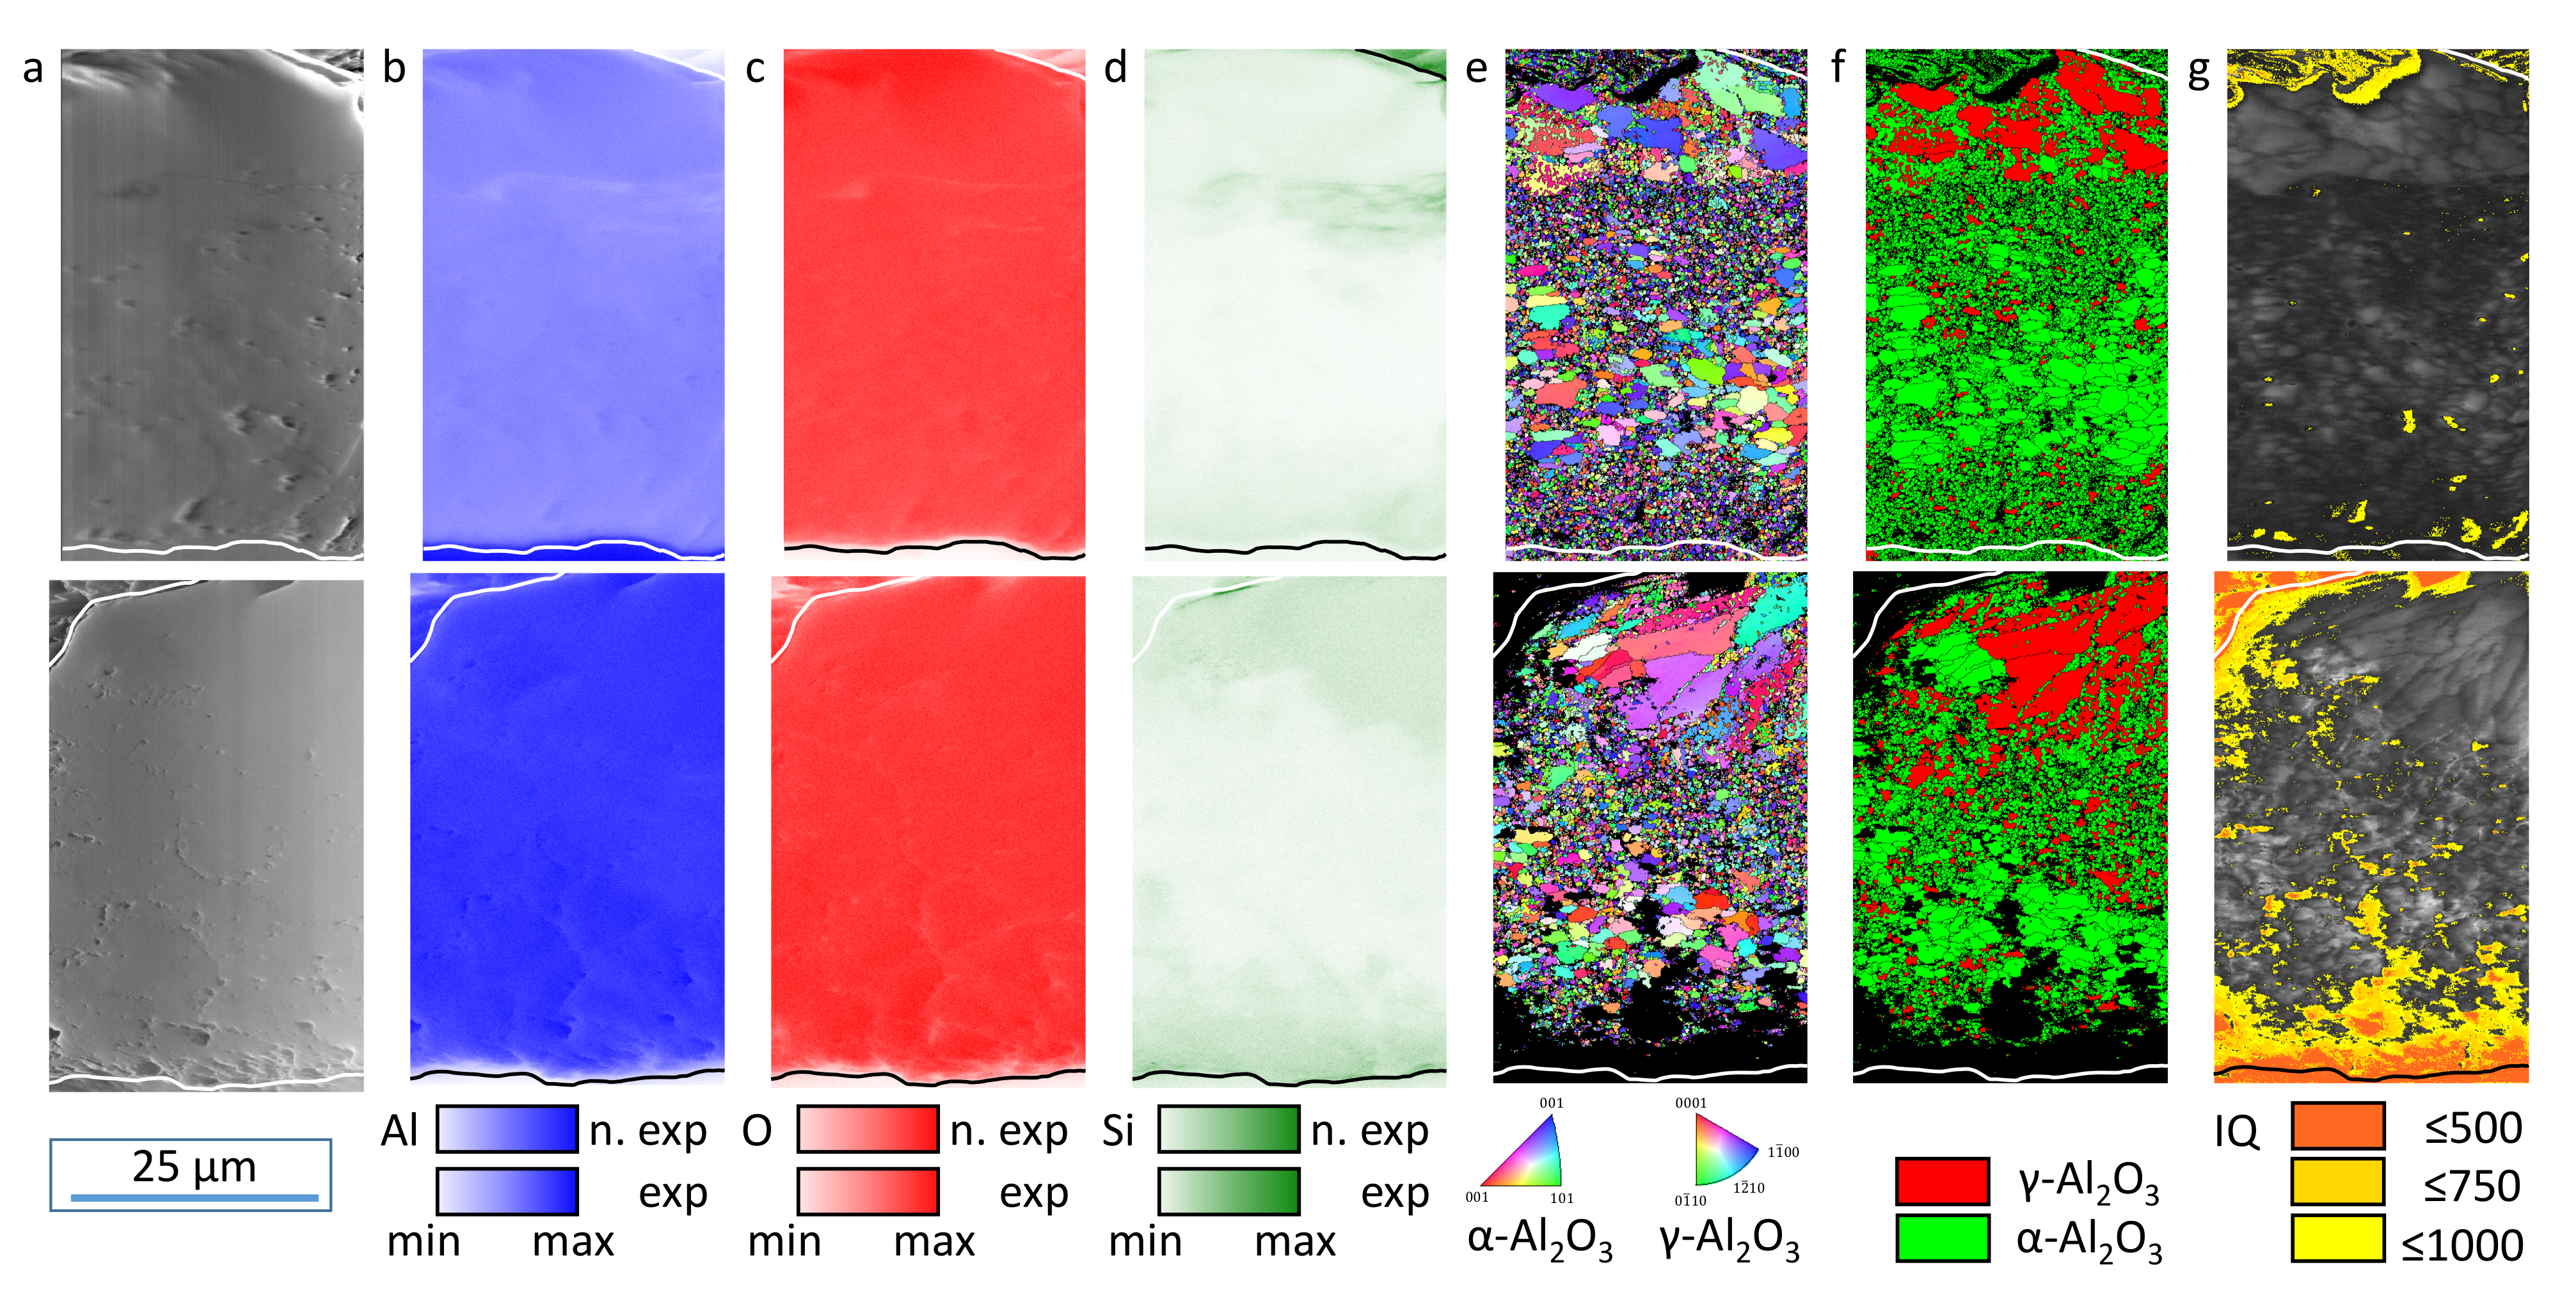
Figure 12.
SEM (a) image as well as EDX (b–d) and EBSD (e–g) maps for the cross-section of a sample exposed to electrolyte III at unaffected (top) and affected (bottom) surface regions (Pos. 1 and 2 in Figure 1c).
Figure 12.
SEM (a) image as well as EDX (b–d) and EBSD (e–g) maps for the cross-section of a sample exposed to electrolyte III at unaffected (top) and affected (bottom) surface regions (Pos. 1 and 2 in Figure 1c).

3.3. SEM, EDX, and EBSD
The SEM images that show the PEO coatings and their substrate/layer interface at Pos. 1 and 2 indicated in Figure 1c are summarized in Figure 5, Figure 8 and Figure 11. The images of the unaffected sample regions show equivalent microstructures. The coatings exhibit the literature-known structural characteristics of inner compact areas (working layer) and outer porous zones (technological layer) as well as a good substrate bonding with slightly elevated porosity. The entire coating structure is permeated by a fine intrinsic cavity network of cracks and discharge channels. The substrate material shows small uniformly distributed bright areas in the BS mode, which correspond to intermetallic phases of the EN AW-6082 T6 alloy used. For the sample exposed to electrolyte II (Figure 8), no alteration can be recognized qualitatively between the affected and unaffected areas. Neither the bulk coating nor the near-substrate interface zone of the exposed region show visible results of interaction with the testing solution. Similarly, the PEO coating exposed to electrolyte I (Figure 5b), shows no obvious impact on the bulk layer. However, there is a significant reaction zone at the substrate/coating interface. From the BS close-up shown in Figure 5c, it can be seen that the reaction products partially enclose intermetallic phases of the substrate material. The corresponding SE image shows a preparation-related topographical contrast. These effects are much more pronounced in the sample, which was exposed to electrolyte III. The coating shows delamination already at the transition zone between unexposed and exposed layer regions, as depicted in Figure 11b,c. While the coating itself seems unaffected, the reaction products enclose intermetallics of the sample material, which indicates substrate attack by the electrolyte. While this effect is largely uniform along the substrate/layer interface in Figure 11b, two significantly localized etch depressions are visible in Figure 11c. Above the left recess, a large crack within the layer is in plane with the materialographic cross-section. The underlying areas are shown as a close-up in Figure 11d. Figure 11e shows the overview image of the center of the sample area exposed to electrolyte. Some reaction products and etch depression are visible close to the substrate. The cavity between base alloy and PEO layer is filled with embedding resin. The coating is detached completely. A close-up of the area marked by dashed lines, which shows PEO coating exposed to the electrolyte, is depicted in Figure 11f. The bulk PEO layer seems unaffected, however, despite the preparation and SEM parameters are equal to the ones of the micrograph in Figure 11a, the intrinsic cavity network is recognizable more clearly. Furthermore, the underside of the layer shows a rougher profile than in the bonded interface zones in Figure 11a (or at the equivalent layers in the Figure 5 and Figure 8a).
The results of the EDX and EBSD measurements are summarized within Figure 6, Figure 9 and Figure 12 for the electrolytes I–III. While the upper lines show unaffected regions of the PEO coatings, in the lower lines, the zones affected by the electrolyte are depicted. Subfigure a shows the corresponding SEM images which were used to indicate the substrate/coating interface as well as the top edge of the tilted PEO layer by a spline. The subfigures b–d show EDX maps for the elements aluminum, oxygen, and silicon. The EBSD data are depicted in the subfigures e–g. These include: a representation of the inverse pole figures (IPF) indicating the spatial distribution of the detected grains as well as their crystallographic orientation (subfigure e); a phase map as a result of the indexing routine summarized in Figure 2, which shows the proportions of - and -AlO within the PEO layers (subfigure f); and an image quality plot (subfigure g) that shows areas of high IQ by bright gray and regions of low IQ values indicated by colors according to the categories i–iii described above. Exposure and measuring time per spot were optimized for EBSD at every investigation area to achieve a good signal/noise ratio and low electron beam drift in order to obtain a suitable band contrast within the diffraction patterns. As a result of that, the absolute count number and the range of color intensity varies between the different maps of an element. Therefore, the EDX maps only allow for a qualitative indication of the element distribution within one investigation area.
Except for the different preparation routine for the sample delaminated after interaction with electrolyte III, the images depicted in the top rows of Figure 6, Figure 9 and Figure 12 show PEO layers with identical experimental histories. The elements aluminum and oxygen are distributed homogeneously within the coating and just show lowered intensities in regions of cavities and structural defects. The Si maps show an enrichment of silicon in this zones. Furthermore, an elevated Si content can be recognized close to the substrate as well as in the outer coating regions. The distribution of crystallinity, indicated by the IPF map, shows a stacked structure of characteristic zones. Near to the substrate/layer interface is a region whose oxide material cannot be assigned to any crystallographic orientation. Above this is an area with grain sizes in the submicrometer range, which merges into a zone about 15 µm in thickness with grain sizes of several micrometers. Above, the grain size decreases again with increasing substrate distance. After the transition to the outer mesoporous layer area, larger grains with chord lengths over 10 µm are also present. The phase map generated using the methodology summarized in Figure 2 shows that the identified alumina modifications are not homogeneously distributed but also exhibit a stratified structure. While the zone of larger grains above the non-crystalline substrate/coating interface predominantly consist of -AlO, the outer mesoporous coating regions show an elevated -AlO content. Interestingly, based on the direct comparison with the Si map, it can be observed that the detected Si fractions are predominantly present in areas with high -AlO content, while the -AlO rich zones are almost free of silicon. The image quality plots show low IQ values at and above the outer coating edge because of topographic scattering. Similar effects lead to lowered IQ in regions of cracks, discharge channels and other cavities. The crystalline regions close to the substrate also show areas of low image quality, the extension of which cannot be explained based on structural effects alone. Since the element maps show the presence of aluminum, oxygen, and low amounts of silicon, a region of amorphous AlO with dopants of Si can be assumed. The direct comparison of the element maps before and after the exposition experiments indicates local changes of the chemical composition at the substrate/coating interface: for electrolyte I and III a depletion of aluminum and oxygen, for electrolyte III an enrichment of silicon. However, due to the already mentioned limitations of EDX measurements, these indications cannot be considered valid. In contrast to that, the EBSD measurements show a significant increase of the non-crystalline zone at the substrate/coating interface for electrolyte I, which is even more pronounced for electrolyte III. The dimensions of this amorphous oxide region remain unchanged after exposure of the sample to electrolyte II.
4. Discussion
The ICP measurements, represented in Figure 3, as well as the micrographs summarized in Figure 5, Figure 8 and Figure 11 show that the exposition to electrolyte II barely affected the PEO coating, while electrolyte I and III lead to Al release by dissolution of the substrate/coating interface and the substrate itself. The dissolution of the substrate/coating interface can be attributed to reactions according to Equation (2). The observed substrate attack can be interpreted as reactions according to Equation (4). Since these processes require hydroxide ions, the effects were more pronounced in electrolyte III with a pH of 14 than in electrolyte I with a pH of 13. The silicate content of electrolyte II (pH ≈ 13, = 5 g/L) suppressed the above-mentioned reactions by passivation. Furthermore, the spatially highly localized occurrence of the dissolution processes allows for the following conclusions. On the one hand, it is proven that the present intrinsic cavity network of the fully formed PEO coating still allows the electrolyte access to the layer/substrate interface. This supports the assumption that there is an electrochemically active zone in this area over the entire process time, the characteristics of which influence the PEO to a decisive extent [34,35,36]. On the other hand, it becomes clear that an oxide modification must be present at the substrate/layer interface in and above the passive film, which is more prone to chemical dissolution than the oxide of the unaffected bulk coating.
The evaluation of the XRD (Figure 4, Figure 7 and Figure 10) and EBSD (Figure 6, Figure 9 and Figure 12) data provides a conclusive explanation for this. The occurrence of the characteristic deflections in the purple intensity difference curves of the diffractograms is to be interpreted as the disappearance of amorphous parts after the exposition experiments. Accordingly, the corresponding non-crystalline oxide phases are affected preferentially by dissolution. The extent of this effect follows the same pattern that has already become clear from the ICP measurements and SEM images: hardly any oxide dissolution in electrolyte II, significant dissolution in electrolyte I, which is even stronger in electrolyte III. These observations can likewise be explained by increased dissolution of (amorphous) alumina at increased pH and inhibition of this reaction in the presence of passivating silicate constituents. The leaching of the amorphous coating parts leads to a slight relative increase of the generally much more stable crystalline oxide modifications. This directs to positive deflections in the 2 range of the crystalline peaks in the intensity difference curves. Since this peak’s superelevations are more pronounced for -AlO than for -AlO, at least the XRD data indicate that -AlO is slightly affected by dissolution as well.
However, this observation cannot be supported based on the EBSD data. The phase and IQ maps give a good overview regarding the spatial distribution of the oxide modifications. However, their statistical reliability is too low for allowing a statement as to whether the volume ratio of the crystalline oxides has changed as a result of the exposition experiments. Nevertheless, the element, EBSD, and IQ maps in Figure 6 and Figure 9 clearly show a zone of non (IQ < 500) and weakly (IQ 500–1000) crystalline oxide above the substrate/coating interface with an extension of some micrometers before the exposition experiments. This amorphous alumina can be attributed to be the freshest electrochemical formed oxide before the plasma-chemical phase-transformation processes according to Equation (1). The actual bonding character within the present AlO modifications, as well as a conceivable gradation between the layer/substrate interface and the crystalline layer regions, could be elucidated in course of further investigations by X-ray photoelectron spectroscopy (XPS). While the extension of the non- and weakly crystalline zones remains unchanged after exposition to electrolyte II (Figure 6g), the area of low IQ is increased and oblong zones are added after exposition to electrolyte I (Figure 9g). For electrolyte III, this effect is more pronounced (Figure 12g). Therefore, it can be concluded that the amorphous oxide components, whose disappearance is proven by the deflection of the purple intensity difference curve in the X-ray diffractogram, were indeed localized directly above the layer/substrate interface. Additional areas of low IQ were created by leaching these amorphous or weakly crystalline oxides and etching the surrounding crystalline oxides. This is also in accordance with the corresponding SEM images.
The elevated Si content in porous coating zones and the vicinity of the layer/substrate interface can be explained by electrolyte residues in layer cavities and the contribution of the silicate components to the passivation reactions [13]. It is an interesting observation that within the crystalline oxide modifications, Si is preferentially bound in -AlO but rarely in -AlO. However, no significant influence on the chemical dissolution of these oxides could be observed within this study. The effect is very small, if any, since the crystalline modifications have proven to be chemically stable in general. The exposition experiments used in this study do not fully represent the conditions during PEO in that the high electric fields actually present were not applied. However, since the electric permittivity of crystalline alumina is about 10 times that of aqueous solutions, electric field lines would have been localized along the cavity network around the crystalline regions and in the layer/substrate interface. Therefore, effects of a field-assisted chemical dissolution according to [22,23] would have increased the selective dissolution of amorphous alumina, if at all.
The observations regarding substrate-related XRD peaks within the intensity difference curves summarized in Table 4 could not be clearly explained within this study and require further investigations. A changed state of internal stress as a result of the continuous or partial layer delamination, which would cause a peak shift, would be conceivable. However, the deviations in the peak positions are comparably small. The changed height of the substrate material as a result of the formation of etch pits could also have influenced the angular position of the peaks. No clear interpretation is possible at this point. Further investigations are neccessary in order to clarify the observation.
5. Conclusions
In the course of this study, by means of exposition experiments, it was proven that the intrinsic cavity network of fully formed PEO layers allows access of electrolyte solutions down to the substrate/layer interface. In this zone, amorphous alumina is present, which has an increased susceptibility to chemical dissolution. The reactions observed can be intensified by increased alkalinity and inhibited by passivating silicate components in the electrolyte. The crystalline oxide parts of the layer, on the other hand, are not attacked even under strong alkalinity and the absence of passivating silicate constituents. Transferring the results of these model experiments to PEO, chemical redissolving reactions that presumably reduce the layer thickness during the process can be classified as negligible. Literature-known interactions between bath alkalinity and layer growth rate are, therefore, more likely to be due to influences on the passivation processes in the pore base of discharge channels, i.e., the balance between the competing anodic reactions: formation of electrically insulating reaction layers, metal dissolution and electrolysis. The observations made in this study fully support the assumption that the electrochemical properties of the passive film present in the bottom of the pores are process-relevant during the entire PEO treatment time and interact with the other electrolytic and electrical process parameters.
Author Contributions
F.S. conceived and designed the experiments, analyzed the data and wrote the experimental and conclusive parts of the paper, R.M. reviewed the literature, wrote the introduction and discussed the results with F.S. in context of the state of the art, S.C. carried out the SEM and EBSD analysis and developed the corresponding preparation routine, T.M. and T.L. directed the research and contributed to the discussions and interpretations of the results. All authors have read and agreed to the published version of the manuscript.
Funding
This research was funded by the German Research Foundation (Deutsche Forschungsgemeinschaft/DFG) Grant No. LA-1274/46-1.
Institutional Review Board Statement
Not applicable.
Informed Consent Statement
Not applicable.
Data Availability Statement
The authors confirm that the data supporting the findings of this study are available within the article.
Acknowledgments
The Work of Martin Kunze and Marc Pügner who carried out the ICP-OES and XRD measurements is gratefully acknowledged.
Conflicts of Interest
The authors declare no conflict of interest.
References
- Klapkiv, M.; Nykyforchyn, H.; Posuvailo, V. Spectral analysis of an electrolytic plasma in the process of synthesis of aluminum oxide. Mater. Sci. 1995, 30, 333–343. [Google Scholar] [CrossRef]
- Klapkiv, M.D. Simulation of synthesis of oxide-ceramic coatings in discharge channels of a metal-electrolyte system. Mater. Sci. 1999, 35, 279–283. [Google Scholar] [CrossRef]
- Rogov, A. The role of cathodic current in plasma electrolytic oxidation of aluminium: Current density ’scanning waves’ on complex-shape substrates. J. Phys. D Appl. Phys. 2018, 51, 405303. [Google Scholar] [CrossRef]
- Naumann, R.; Petzold, D. Die Bestimmung der Bildungsenthalpien von in thermischen Zersetzungsreaktionen auftretenden Verbindungen durch Einwurfkalorimetrie—Bildungsenthalpie AlCl3·6H2O, amorph-Al2O3, γ-Al2O3, Al2O3·2H2O·2HCl. J. Therm. Anal. 1981, 20, 319–330. [Google Scholar] [CrossRef]
- Matykina, E.; Arrabal, R.; Skeldon, P.; Thompson, G. Investigation of the growth processes of coatings formed by AC plasma electrolytic oxidation of aluminium. Electrochim. Acta 2009, 54, 6767–6778. [Google Scholar] [CrossRef]
- Nie, X.; Meletis, E.; Jiang, J.; Leyland, A.; Yerokhin, A.; Matthews, A. Abrasive wear/corrosion properties and TEM analysis of Al2O3 coatings fabricated using plasma electrolysis. Surf. Coat. Technol. 2002, 149, 245–251. [Google Scholar] [CrossRef]
- Sieber, M.; Simchen, F.; Morgenstern, R.; Scharf, I.; Lampke, T. Plasma electrolytic oxidation of high-strength aluminium alloys—Substrate effect on wear and corrosion performance. Metals 2018, 8, 356. [Google Scholar] [CrossRef]
- Simchen, F.; Sieber, M.; Kopp, A.; Lampke, T. Introduction to Plasma Electrolytic Oxidation—An Overview of the Process and Applications. Coatings 2020, 10, 628. [Google Scholar] [CrossRef]
- Kurze, P.; Krysmann, W.; Marx, G. About anodic oxidation of aluminum under spark discharge ANOF in aqueous electrolytes. Wiss. Z. Techn. Hochsch. 1982, 6, 665–671. (In German) [Google Scholar]
- Simchen, F.; Sieber, M.; Mehner, T.; Lampke, T. Characterisation Method of the Passivation Mechanisms during the pre-discharge Stage of Plasma Electrolytic Oxidation Indicating the Mode of Action of Fluorides in PEO of Magnesium. Coatings 2020, 10, 965. [Google Scholar] [CrossRef]
- Sieber, M.; Mehner, T.; Dietrich, D.; Alisch, G.; Nickel, D.; Meyer, D.; Scharf, I.; Lampke, T. Wear-resistant coatings on aluminium produced by plasma anodising—A correlation of wear properties, microstructure, phase composition and distribution. Surf. Coat. Technol. 2014, 240, 96–102. [Google Scholar] [CrossRef]
- Sieber, M.; Simchen, F.; Scharf, I.; Lampke, T. Formation of a Spinel Coating on AZ31 Magnesium Alloy by Plasma Electrolytic Oxidation. J. Mater. Eng. Perform. 2016, 25, 1157–1162. [Google Scholar] [CrossRef]
- Simchen, F.; Mosoud-Nia, N.; Mehner, T.; Lampke, T. Formation of corundum-rich alumina coatings on low-carbon steel by plasma electrolytic oxidation. IOP Conf. Ser. Mater. Sci. Eng. 2021, 1147, 012007. [Google Scholar] [CrossRef]
- Raj, V.; Mubarak Ali, M. Formation of ceramic alumina nanocomposite coatings on aluminium for enhanced corrosion resistance. J. Mater. Process. Technol. 2009, 209, 5341–5352. [Google Scholar] [CrossRef]
- Yerokhin, A.; Leyland, A.; Matthews, A. Kinetic aspects of aluminium titanate layer formation on titanium alloys by plasma electrolytic oxidation. Appl. Surf. Sci. 2002, 200, 172–184. [Google Scholar] [CrossRef]
- Savguira, Y.; Ni, Q.; Sobrinho, P.H.; North, T.; Thorpe, S. Effect of Process Parameters on the Corrosion Resistance Properties of PEO Coatings Produced on AZ31B Magnesium Alloy. ECS Trans. 2016, 72, 91–103. [Google Scholar] [CrossRef]
- Sobrinho, P.; Savguira, Y.; Ni, Q.; Thorpe, S. Statistical analysis of the voltage-time response produced during PEO coating of AZ31B magnesium alloy. Surf. Coat. Technol. 2017, 315, 530–545. [Google Scholar] [CrossRef]
- Snizhko, L.; Yerokhin, A.; Pilkington, A.; Gurevina, N.; Misnyankin, D.; Leyland, A.; Matthews, A. Anodic processes in plasma electrolytic oxidation of aluminium in alkaline solutions. Electrochim. Acta 2004, 49, 2085–2095. [Google Scholar] [CrossRef]
- Yerokhin, A.; Voevodin, A.; Lyubimov, V.; Zabinski, J.; Donley, M. Plasma electrolytic fabrication of oxide ceramic surface layers for tribotechnical purposes on aluminium alloys. Surf. Coat. Technol. 1998, 110, 140–146. [Google Scholar] [CrossRef]
- Al Bosta, M.; Ma, K.J.; Chien, H.H. The effect of MAO processing time on surface properties and low temperature infrared emissivity of ceramic coating on aluminium 6061 alloy. Infrared Phys. Technol. 2013, 60, 323–334. [Google Scholar] [CrossRef]
- Koroleva, E.; Thompson, G.; Hollrigl, G.; Bloeck, M. Surface morphological changes of aluminium alloys in alkaline solution: Effect of second phase material. Corros. Sci. 1999, 41, 1475–1495. [Google Scholar] [CrossRef]
- Nagayama, M.; Tamura, K. On the mechanism of dissolution of porous oxide films on aluminium during anodizing. Electrochim. Acta 1968, 13, 1773–1783. [Google Scholar] [CrossRef]
- O’Sullivan, J.P.; Wood, G.C. The Morphology and Mechanism of Formation of Porous Anodic Films on Aluminium. Proc. R. Soc. Lond. Ser. A 1970, 317, 511–543. [Google Scholar] [CrossRef]
- Moon, S.M.; Pyun, S.I. The formation and dissolution of anodic oxide films on pure aluminium in alkaline solution. Electrochim. Acta 1999, 44, 2445–2454. [Google Scholar] [CrossRef]
- Snizhko, L.; Yerokhin, A.; Gurevina, N.; Misnyankin, D.; Pilkington, A.; Leyland, A.; Matthews, A. A model for galvanostatic anodising of Al in alkaline solutions. Electrochim. Acta 2005, 50, 5458–5464. [Google Scholar] [CrossRef]
- Dunleavy, C.; Curran, J.; Clyne, T. Self-similar scaling of discharge events through PEO coatings on aluminium. Surf. Coat. Technol. 2011, 206, 1051–1061. [Google Scholar] [CrossRef]
- Rama Krishna, L.; Somaraju, K.; Sundararajan, G. The tribological performance of ultra-hard ceramic composite coatings obtained through microarc oxidation. Surf. Coat. Technol. 2003, 163-164, 484–490. [Google Scholar] [CrossRef]
- Sundararajan, G.; Rama Krishna, L. Mechanisms underlying the formation of thick alumina coatings through the MAO coating technology. Surf. Coat. Technol. 2003, 167, 269–277. [Google Scholar] [CrossRef]
- Xue, W.; Deng, Z.; Chen, R.; Zhang, T. Growth regularity of ceramic coatings formed by microarc oxidation on Al–Cu–Mg alloy. Thin Solid Film. 2000, 372, 114–117. [Google Scholar] [CrossRef]
- Parfenov, E.; Yerokhin, A.; Matthews, A. Small signal frequency response studies for plasma electrolytic oxidation. Surf. Coat. Technol. 2009, 203, 2896–2904. [Google Scholar] [CrossRef]
- Wright, S.; Nowell, M. EBSD image quality mapping. Microsc. Microanal. Off. J. Microsc. Soc. Am. Microbeam Anal. Soc. Microsc. Can. 2006, 12, 72–84. [Google Scholar] [CrossRef] [PubMed]
- Field, D.P. Recent advances in the application of orientation imaging. Ultramicroscopy 1997, 67, 1–9. [Google Scholar] [CrossRef]
- Al: 00-004-0787, α-Al2O3: 00-010-0173, γ-Al2O3: 01-077-0396; PDF-2 Release 2014. ICDD: Newtown Square, PA, USA, 2014.
- Rogov, A.; Yerokhin, A.; Matthews, A. The Role of Cathodic Current in Plasma Electrolytic Oxidation of Aluminum: Phenomenological Concepts of the “Soft Sparking” Mode. Langmuir ACS J. Surf. Colloids 2017, 33, 11059–11069. [Google Scholar] [CrossRef] [PubMed]
- Rogov, A.; Matthews, A.; Yerokhin, A. Role of cathodic current in plasma electrolytic oxidation of Al: A quantitative approach to in-situ evaluation of cathodically induced effects. Electrochim. Acta 2019, 317, 221–231. [Google Scholar] [CrossRef]
- Rogov, A.; Nemcova, A.; Hashimoto, T.; Matthews, A.; Yerokhin, A. Analysis of electrical response, gas evolution and coating morphology during transition to soft sparking PEO of Al. Surf. Coat. Technol. 2022, 442, 128142. [Google Scholar] [CrossRef]

Table 1.
Mass fractions of the alloying elements of EN AW-6082 T6 (Al balance).
| Si | Mg | Mn | Fe | Cr | Zn | Cu | Ti |
|---|---|---|---|---|---|---|---|
| 0.7–1.3 | 0.6–1.2 | 0.4–1.0 | ≤0.5 | ≤0.25 | ≤0.2 | ≤0.1 | ≤0.1 |
Table 2.
Composition of the electrolytes used for the exposition experiments.
| Electrolyte | Composition |
|---|---|
| I | 0.1 mol/L KOH, pH = 13 |
| II | 5 g/L KOH, 5 NaSiO5HO, 1 g/L NaHPO, pH ≈ 13 |
| III | 1.0 mol/L KOH, pH = 14 |
Table 3.
Preparation route for EBSD measurements on ceramic PEO coatings.
| No. | Working Step | Material | Duration | Device |
|---|---|---|---|---|
| 1 | cutting | diamond cutting disk | 2 min | Struers MiniTom |
| 2 | grinding | 600 cm SiC | 2 min | Buehler Phoenix Beta |
| 3 | grinding | 800 cm SiC | 5 min | — ” — |
| 4 | grinding | 1200 cm SiC | 5 min | — ” — |
| 5 | grinding | 2500 cm SiC | 5 min | — ” — |
| 6 | grinding | 4000 cm SiC | 10 min | — ” — |
| 7 | polishing | 9 µm diamond suspension on silk | 5 min | Struers DapV |
| 8 | polishing | 3 µm diamond suspension on silk | 5 min | — ” — |
| 9 | polishing | 1 µm diamond suspension on neoprene | 5 min | — ” — |
| 10 | vibration polishing | 0.05 µm diamond suspension on neoprene | 90 min | |
| 11–15 | purifying | acetone × 5 | 3 min | ultrasonic bath |
| 16–20 | purifying | isopropyl × 5 | 3 min | — ” — |
| 21 | drying | vacuum, = 60 C | 24 h | vacuum oven |
| 22 | sputtering | Au, I = 24 mA, p = 10 mbar | 6 s | Emitech K550 |
Table 4.
Characteristic features of the substrate-related Al peaks within the XRD intensity difference curves in Figure 4, Figure 7 and Figure 10.
| Electrolyte | 2/° | Description |
|---|---|---|
| I | 44 | fluctuation as a result of peak shift to lower 2 |
| 52 | fluctuation as a result of peak shift to lower 2 | |
| 77 | downshift | |
| 94 | amplification | |
| 99 | slight fluctuation as a result of peak shift to lower 2 | |
| II | 44 | amplification |
| 52 | fluctuation as a result of peak shift to higher 2 | |
| 77 | downshift | |
| 94 | no shift | |
| 99 | slight amplification | |
| III | 44 | fluctuation as a result of peak shift to lower 2 |
| 52 | downshift | |
| 77 | fluctuation as a result of peak shift to lower 2 | |
| 94 | downshift | |
| 99 | fluctuation as a result of peak shift to lower 2 |
Publisher’s Note: MDPI stays neutral with regard to jurisdictional claims in published maps and institutional affiliations. |
© 2022 by the authors. Licensee MDPI, Basel, Switzerland. This article is an open access article distributed under the terms and conditions of the Creative Commons Attribution (CC BY) license (https://creativecommons.org/licenses/by/4.0/).
Share and Cite
MDPI and ACS Style
Simchen, F.; Morgenstern, R.; Clauß, S.; Mehner, T.; Lampke, T. Dissolution Behavior of Different Alumina Phases within Plasma Electrolytic Oxidation Coatings. Coatings 2022, 12, 1205. https://doi.org/10.3390/coatings12081205
AMA Style
Simchen F, Morgenstern R, Clauß S, Mehner T, Lampke T. Dissolution Behavior of Different Alumina Phases within Plasma Electrolytic Oxidation Coatings. Coatings. 2022; 12(8):1205. https://doi.org/10.3390/coatings12081205
Chicago/Turabian StyleSimchen, Frank, Roy Morgenstern, Steffen Clauß, Thomas Mehner, and Thomas Lampke. 2022. "Dissolution Behavior of Different Alumina Phases within Plasma Electrolytic Oxidation Coatings" Coatings 12, no. 8: 1205. https://doi.org/10.3390/coatings12081205
Note that from the first issue of 2016, this journal uses article numbers instead of page numbers. See further details here.