
Kinetic Modeling of Grain Boundary Diffusion: Typical, Bi-Modal, and Semi-Lamellar Polycrystalline Coating Morphologies


1
Laboratory of Nuclear Installation Safety, Lithuanian Energy Institute, Breslaujos St. 3, LT-44403 Kaunas, Lithuania
2
Physics Department, Kaunas University of Technology, Studentu St. 50, LT-51368 Kaunas, Lithuania
*
Author to whom correspondence should be addressed.
Coatings 2022, 12(7), 992; https://doi.org/10.3390/coatings12070992
Submission received: 13 June 2022
/
Revised: 11 July 2022
/
Accepted: 12 July 2022
/
Published: 14 July 2022
(This article belongs to the Special Issue Thin Film Dynamics: Theory and Computer Simulations)
Abstract
:Polycrystalline coatings and materials are widely used in engineering applications. Therefore, it is important to know their kinetics and mass transport mechanisms. The effect of grain boundaries (GBs) on diffusion in thin films with different morphologies lacks understanding. Numerical studies are necessary to study GB kinetics but are limited to simplified cases. The present work addresses the lack of diffusion studies in more complex morphologies. Diffusion in two-dimensional polycrystalline coatings of typical, bi-modal, and semi-lamellar morphologies was modeled and the influence of the microstructure on the diffusion regimes and the overall rate was identified. Different morphologies with similar diffusion coefficients provided different regimes. The regime depends not only on the total diffusivity and grain/GB diffusivities, but also on the morphological features of the surface. While the fast diffusion pathways of GBs accelerated diffusion, the level of acceleration depends on the morphology since fast pathways and flux areas are limited to GBs. GB distribution is important to the mass transfer process, as GBs accelerate diffusion locally. The overall diffusion rate is generally dependent on the diffusion coefficients ratio. Nevertheless, the level of this dependence relies on the morphology.
1. Introduction
Polycrystalline coatings and materials have shown great functional and structural potential and outstanding mechanical and physical properties [1]. Alloys, metals, and ceramics with a polycrystalline microstructure are widely used in engineering applications, including but not limited to electronic devices [2], manufacturing [3], solar and fuel cells [4,5], structural materials [6], thin-film transistors [7], future fusion applications [8], scintillators [9], laser media [10], and light-emitting diodes [11]. Hence, it is important for both practical and phenomenological reasons to know and predict the kinetics and mass transport mechanisms in polycrystalline coatings.
The performance depends greatly on the polycrystalline microstructure of the coatings: their grain size [12] and shape, grain boundary (GB) morphology [13], grain orientation [12], etc. Many investigations have been performed to evaluate various properties and their relation to the microstructure of polycrystal materials: ductility [14], strength [15], ionic conductivity [16,17,18], thermal conductivity [19], toughness [20], and corrosion resistance [21]. Many of them concluded that the presence of polycrystalline microstructure and GBs improved the performance.
Diffusion in polycrystalline coatings plays an important role in many applications. GB diffusion serves as a fast diffusion path, therefore, for example, in IT-SOFC grain boundaries act as a pathway for metallic Ni to diffuse into the thin film [22]. Olyaeefar et al. [23] studied different grain size polycrystalline perovskites usage in solar modules. They found out that a smaller grain size leads to decreased diffusivity, while related research by Nazem et al. [24] showed that decreased diffusivity causes a lower short-circuit current density and lower open-circuit voltage. Mastour et al. [25] theoretically investigated grain size in thin film effect on solar cells efficiency and estimated diffusion length. As mentioned before, polycrystalline materials can be used as scintillators, where GB diffusion phenomena enhance photoluminescence due to reduced mobility and recombination of excitons [26]. Another example is polycrystalline laser media. Depending on the segregation coefficient, diffusion of dopant can be either enhanced or inhibited. For example, high Nd concentration slows down Yb and Lu diffusion inside the grains but speeds up in GBs [27]. Overall, diffusion in polycrystal materials and coatings is important to control and understand industrial and scientific processes. However, due to its complexity, it still is an active area of research.
The complexity of the polycrystal diffusion arises due to the differences and interfaces between grains and GBs. Diffusion in both grains and GBs obeys Fick’s laws. However, diffusion rates are different. The interplay between different diffusion rates and complex morphologies of polycrystal thin films results in a great variation in diffusion dynamics. Two main models of polycrystal diffusion have been developed, namely Fisher’s [28] and Whipple’s [29], providing profiles in idealized cases. Le Claire [30] analyzed those models and showed that approximate Fisher’s solution has some limitations compared to the exact Whipple’s solution.
Harrison [31] proposed a classification of polycrystal diffusion kinetic regimes into three principal types: A, B, and C. The regime depends on Dgb/Dg ratio, grain size, and time. Types A and C are limiting, with diffusion occurring, correspondingly, with little difference between GBs and grain interiors, and almost solely through GBs. Type-B is an intermediate between A and C, with diffusion occurring both in GBs and grains, but with significant differences. His work shed some light on diffusion kinetics and showed the importance of the volume fraction of the grains and GBs. Regimes can be classified and predicted using transition points, like Le Claire parameter β, suitable for the parallel slab model, or guidance indicators, e.g., diffusion length—. Further studies of kinetic regimes concentrated on the effects of segregation [32,33] and the extension of Harrison regimes [34,35].
Studies on the effect of grain boundaries and grain properties on mass transfer are still ongoing. Many experimental studies of the mechanism and influence of GB on diffusion have been conducted. The GBs can act either as fast diffusion paths [36] or trapping sites [37].
Since GB diffusion phenomenology can be complicated by other processes, e.g., segregation, impurities, porosity, non-uniform temperature distribution, and others, studies employing computational approaches are necessary to consistently study GB kinetics. The numerical work of Deng et al. [38] dealt with Ag diffusion through polycrystalline SiC coating. They concluded that effective diffusivity, transport of Ag, is sensitive to GB distribution, a fraction of GB type, and as well as GB diffusivity spectrum. Chepak-Gizbrekht et al. [39] conducted research on GB diffusion taking into account triple junctions and variation of the diffusion coefficient due to heating. Concerning the latter condition, the diffusant behaved non-monotonously and accumulated at triple junctions. Moreover, they showed that smaller grains and a higher diffusion coefficient ratio led to a faster and more pronounced concentration variation with a faster transfer of the diffusant. Several research groups focused their experimental [40] and numerical [41,42] studies on the influence of grain size on the mass transfer process. Not only different grain sizes with uniform distribution, but also non-uniform distribution can be observed and influence the diffusion process. The works of Zhang et al. [43] and Ciesielski et al. [44] investigated deposited metal layers on top of Ge wetting films. Layers had different grain structures and those with non-uniform grain size distribution resulted in different GB diffusion behavior. Such gradient distribution relates to accelerating or decelerating diffusion which can also be expected by a combination of different GB morphologies. These works show that it is important to study not only the influence of the morphology type, but also the distribution of grains.
Another important aspect that lacks a significant understanding is the effect of GBs on diffusion in different morphologies. Smith [45] wrote a review of polycrystalline materials and the peculiarities of their formation, describing various polycrystalline morphologies. The data reported by Brockman et al. [46] indicate that near-α titanium polycrystal has a typical granular microstructure. Chen et al. [47], Iwoaka et al. [48], Lee et al. [19], Oudriss et al. [37], Sowjanya et al. [49], Zheng et al. [14], and Jiang et al. [50] also reported the typical morphology of Gd0.1Ce0.9O2, palladium, graphene, pure nickel, La0.5Sr0.5Al0.2Fe0.8O3-δ, pure Mg, and GH3535 alloy, respectively. This grain distribution can be recognized as the dominant and most common. On the other hand, it was observed that lamellar polycrystalline microstructures are also often encountered and desirable due to their strength, toughness, plasticity, and creep resistance properties [51,52,53,54].
It is important to note that there are more microstructures, e.g., bi-modal (duplex) [55,56] and basket-weave [57], both found in titanium alloys, acicular ferrite of steel [58], γ/γ’ -phase microstructure of superalloy [59,60], which consists of cuboids, globular microstructures of AlSi7Mg0.6 alloy [61], dendritic [61,62,63], whose grain morphology of AlxCoCrFeNi alloys can be a cotton-ball shape, spinodal, petal, fishbone, and cauliflower depending on the grain size [64]. In addition, a quasi-columnar coating structure was observed [65]. Therefore, the polycrystal morphology pattern is complex and studies should not be limited to well-known cases. The GB structure of material coatings is ultimately defined by the deposition method and conditions [66].
In regard to numerical studies, Benedetti et al. [67] carried out a detailed overview of the generation of artificial polycrystalline microstructures, where different meshing techniques are discussed. It has been concluded that many researchers use classical Voronoi tessellation, while microstructural morphologies can be much more complex. Recent numerical investigations show [68] that simple regular microstructure and random Voronoi tessellations [41,53,69,70] are still common in computational research. Some reports are dedicated just to the computational design of microstructural models. Romanova et al. [71] presented the step-by-step packing (SSP) method, while Naderi et al. [69] introduced a package that generates realistic microstructures using the Voronoi tessellation method, and Laguerre–Voronoi tessellation was proposed by Falco et al. [70]. Notwithstanding, they all represent a granular microstructure with some modifications, e.g., regular, random, or weighted random distribution. Therefore, grains result in polyhedron (3D) or polygonal (2D) shape, and in an idealized case in cubes (3D) or squares (2D). Studies related to the diffusion in polycrystals are performed in the aforementioned morphologies due to their simplicity. Therefore, investigations of diffusion in more complex morphologies have been scarce and largely limited to the most known and simplified cases.
In our recent study [72], GB diffusion of different grain sizes of idealized polycrystal was determined. The present work addresses the lack of diffusion studies in complex morphologies. Diffusion was numerically simulated in the coatings with several non-idealized morphologies, and the influence of microstructure on the diffusion regimes and the overall rate was identified.
2. Materials and Methods
2.1. Numerical Model
Diffusion in a two-dimensional polycrystalline morphology thin layer was modeled by employing the finite difference method to numerically solve Fick’s second law Equation (1) with location-dependent diffusion coefficient values:
Discretizing Equation (1) using the forward time centered space method [73] yields the numerical form of the model:
where denotes time step, i vertical coordinate, j horizontal coordinate, and h atomic layer thickness, which is the same for all directions hi = hj = h.
While solving the numerical equations for this model, certain assumptions were made:
- Fick’s laws of diffusion are valid both in grain and GB areas;
- Volumetric diffusion from surface to deeper layers of the coating;
- Diffusion from GB to grain, and vice versa;
- Diffusion along and across GB;
- Chemical homogeneity at the interfaces, with no element segregation and/or precipitation;
- The diffusivity in the grain boundary is much higher than the diffusivity in the bulk;
- Diffusion coefficients are independent of time but dependent on position;
- Initial zero concentration of diffusing atoms in the whole volume;
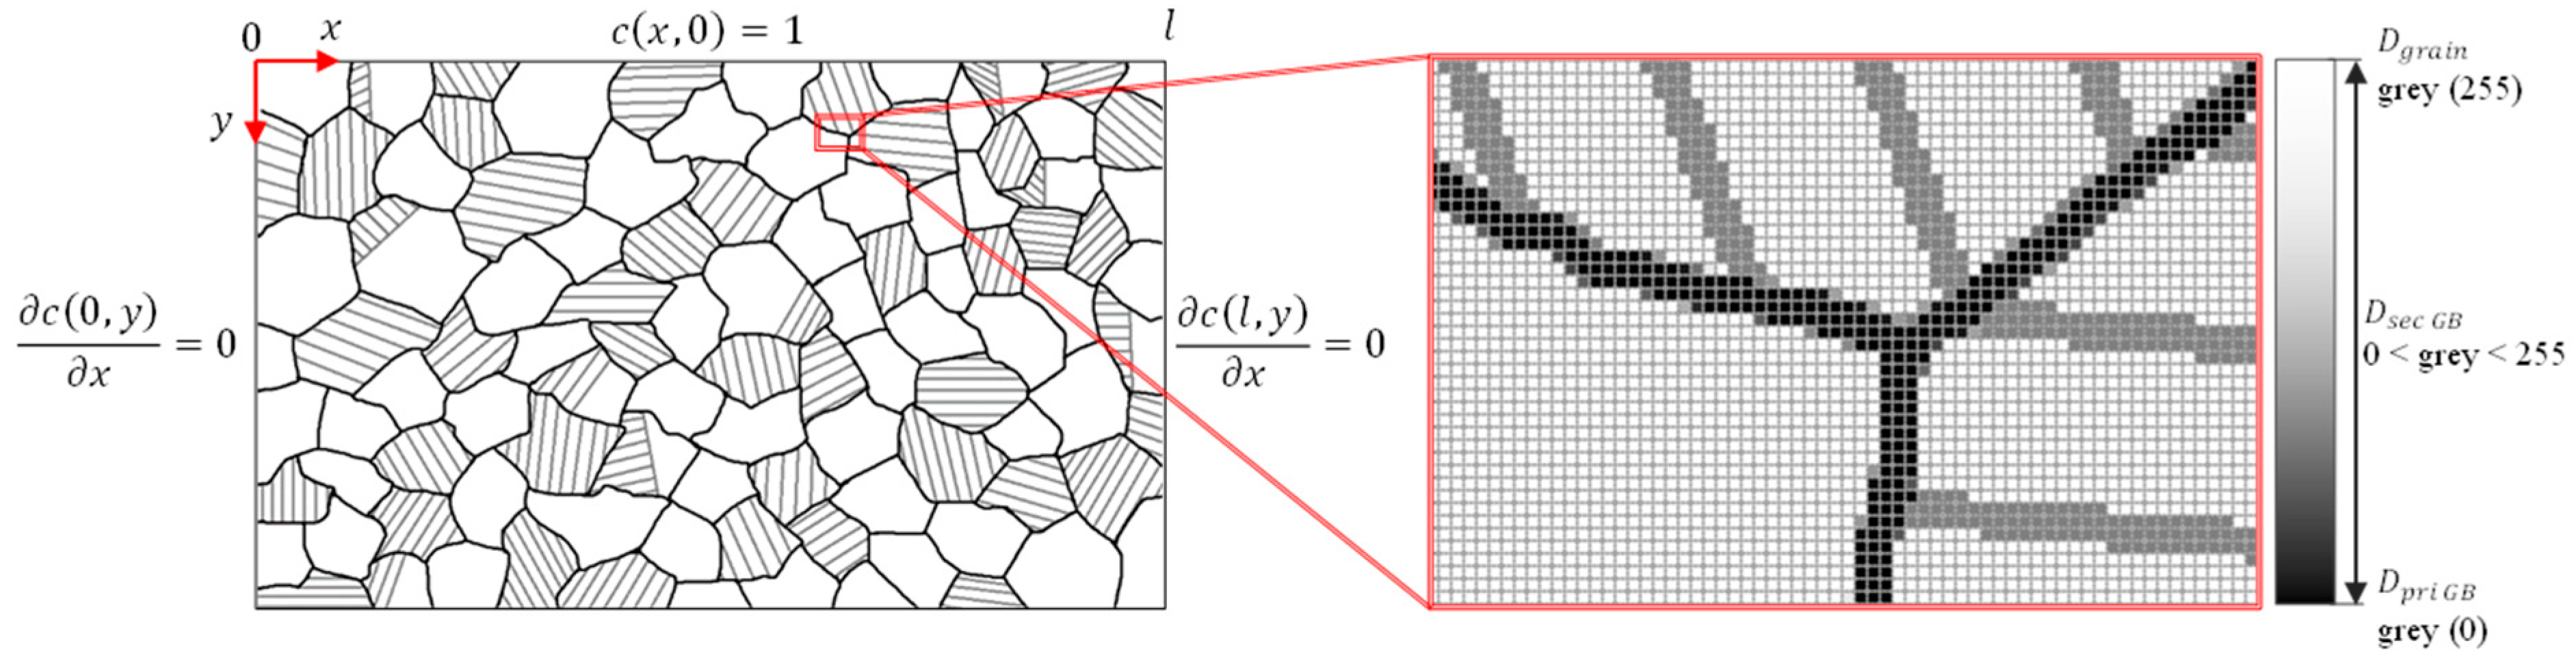
- The Dirichlet boundary condition for the first layer: ;
- The Neumann condition on all other sides: .
In this study, all parameters are non-dimensional. Considering similarity theory, no matter what size domain will be, under prescribed assumptions diffusion will be identical. Presented simulations were performed using grids of 600 × 1000 non-dimensional units with a total number of 600,000 grid nodes.
The polycrystalline microstructure was modeled through the spatial distribution of diffusion coefficient values, which were obtained as follows. A drawing of the polycrystalline microstructure of the coating was created and converted into the matrix of greyscale code numbers (m) as shown in Figure 1. Black color (the greyscale number equal to 0) corresponds to the primary GB, and the white color corresponds to the grain (greyscale number equal to 255), and all shades of gray between black and white correspond to the secondary GBs.
The described approach allowed us to take into account more complex polycrystalline morphologies with varying diffusivity in the primary and secondary GBs, which in our model are evaluated according to the greyscale number. The spatial distribution of the diffusion coefficients D corresponding to the simulated polycrystalline microstructure was then obtained by converting the GB morphology greyscale number matrix to a matrix of diffusion coefficients according to the following expression, where Dgb is the diffusion coefficient in the primary GB and Dg in the grain:
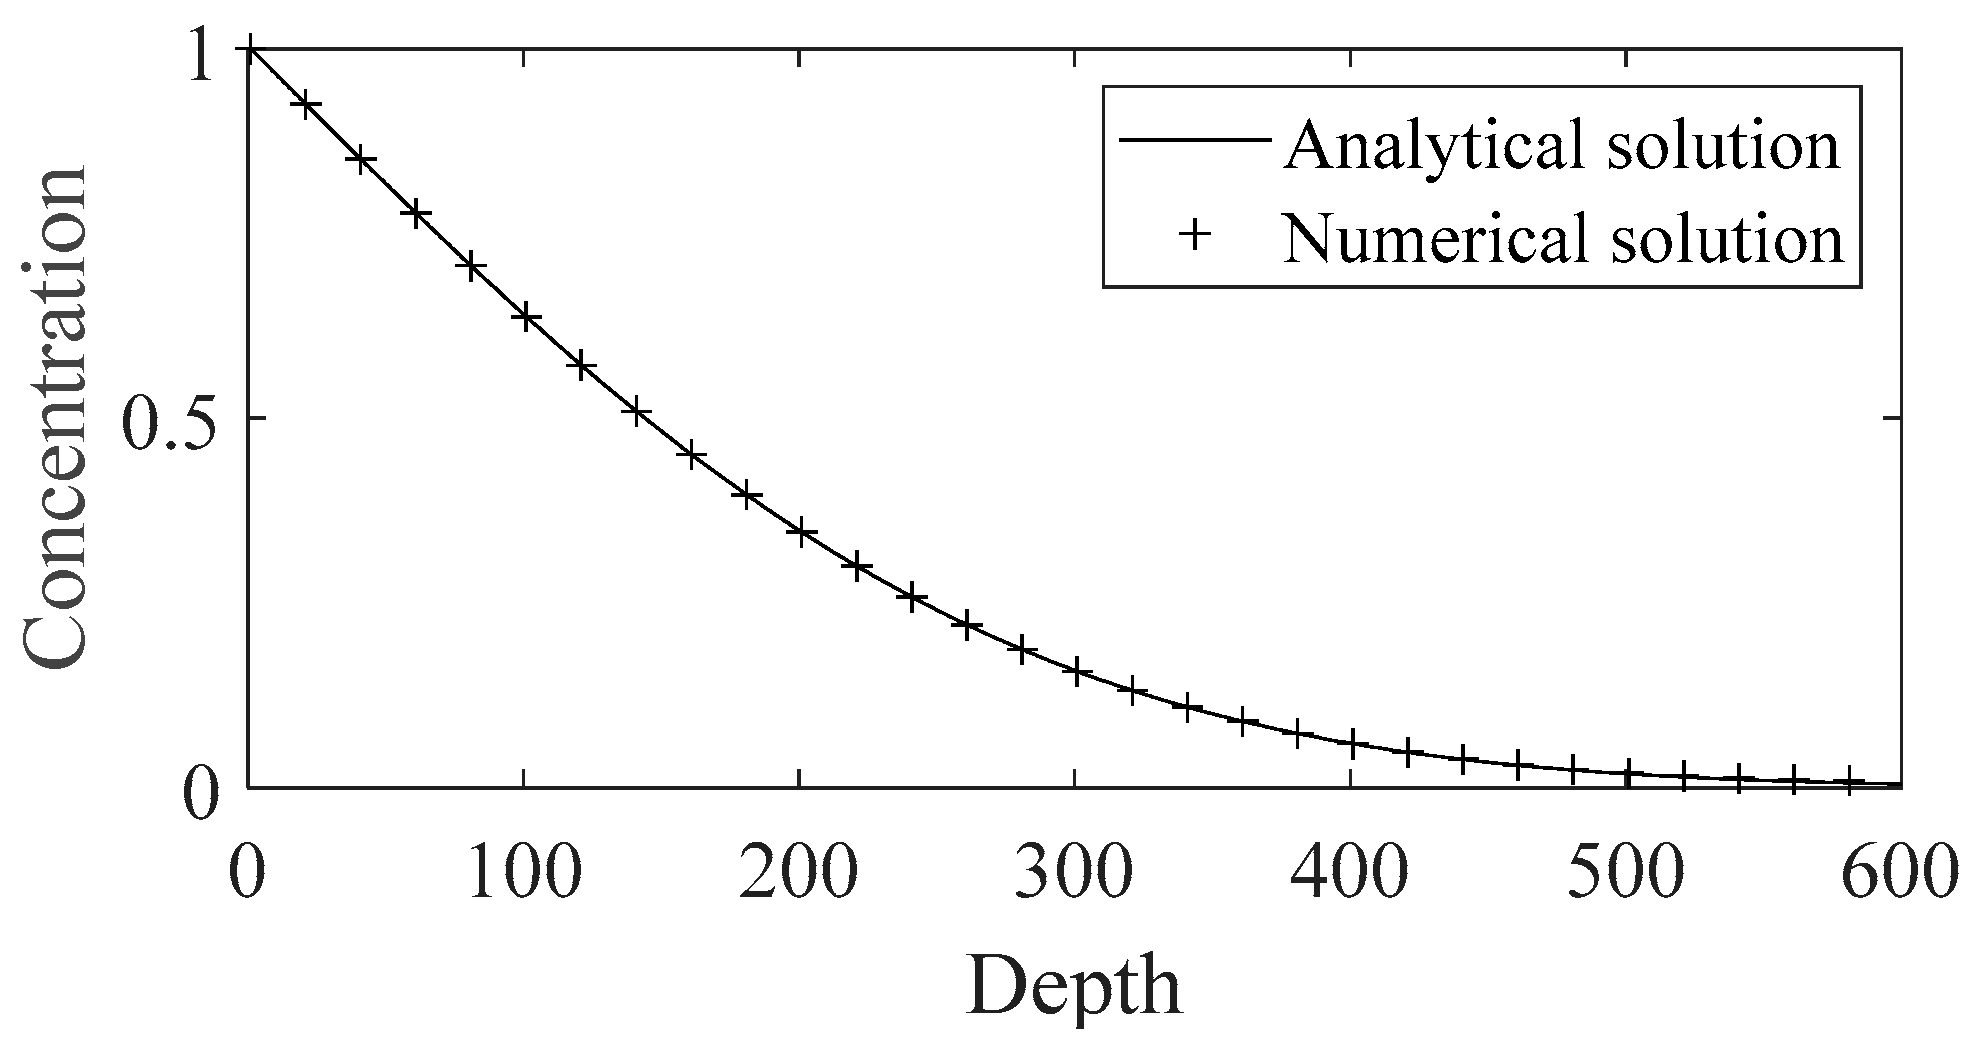
The developed model implementation was verified for a monocrystal material against the analytical solution of Fick’s second law (Equation (1)). Analytical and numerical solutions of vertical diffusant profiles in the semi-infinite slab case were compared. Obtained correspondence between the analytical and numerical results (Figure 2) demonstrates a correct implementation of the model.
2.2. Polycrystalline Microstructures
Three polycrystalline microstructure types were chosen for this study. No specific materials were designated for the simulation, since the study is performed within the scope of morphologies and all generated morphologies correspond to characteristic microstructures which can be found in a number of different real materials, coatings, and thin films [74]. In this research, already fully formed coatings having specific morphology are investigated.
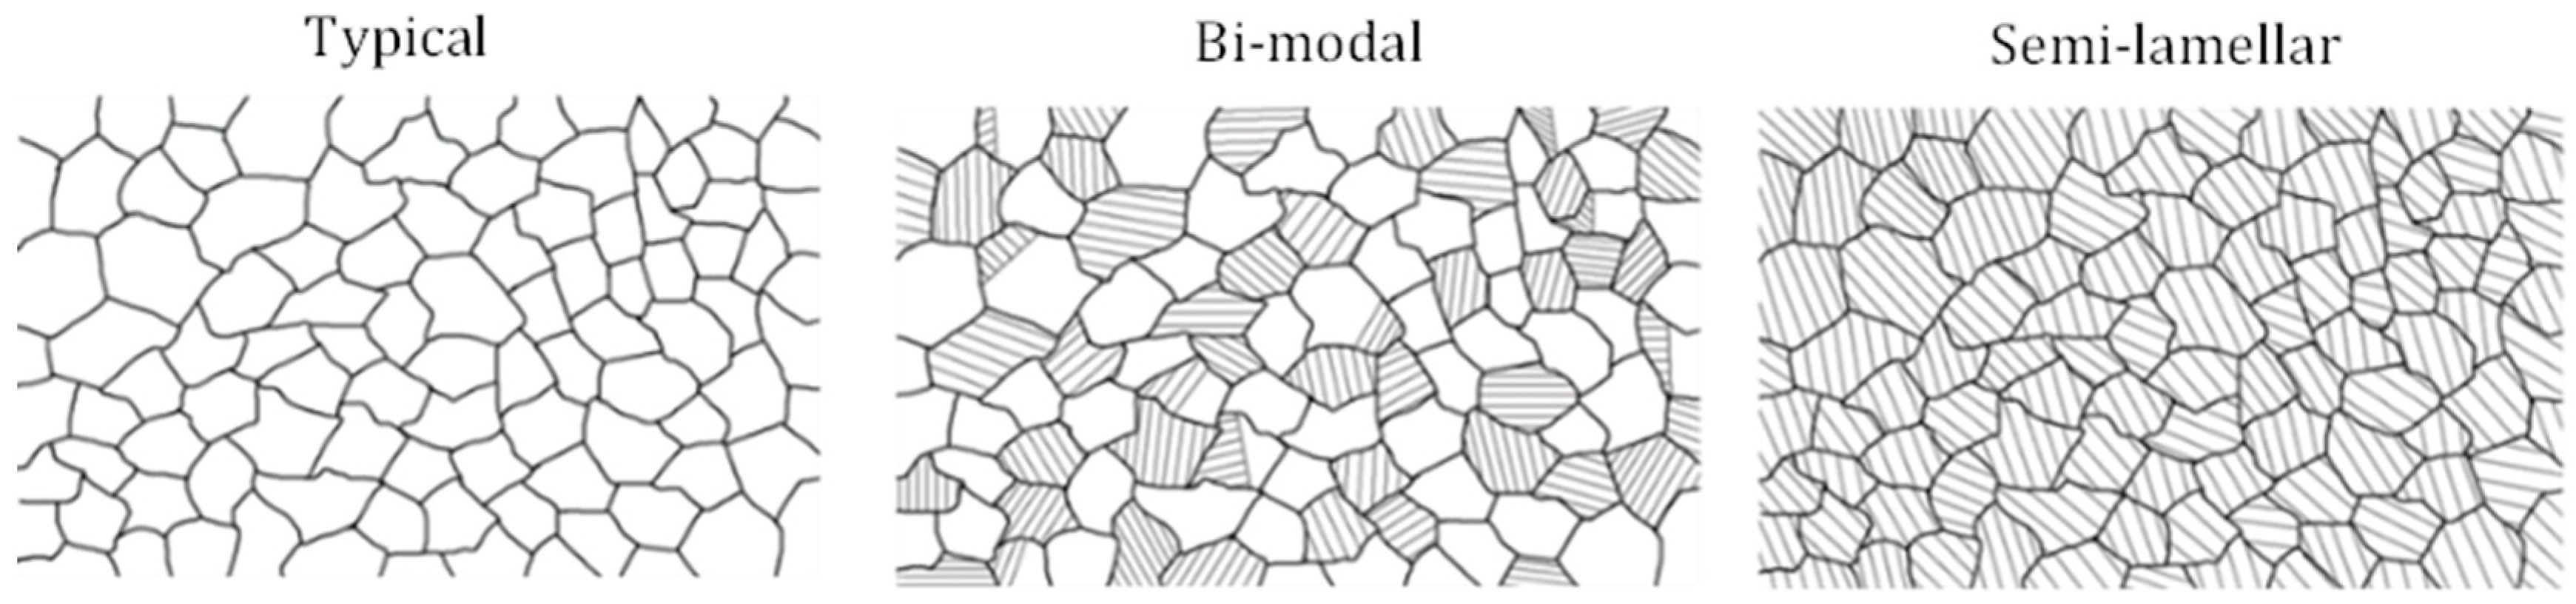
All generated morphologies contain polycrystal grains separated by the primary GBs. In addition to primary GBs, two of the selected morphologies contain secondary GBs within the grains (Figure 3, black—primary GB, gray—secondary GBs).
The primary and secondary GBs differ by the magnitude of the diffusion coefficient. The primary GB diffusion coefficient is a defined property Dgb of the simulated case. Diffusivities of the secondary GBs are expressed through the intensity of their gray color (Figure 2) and their diffusion coefficients are calculated from the grayscale number according to expression (2).
The typical microstructure is the most commonly found polycrystalline morphology. It is composed of solid grains of similar sizes and shapes separated by primary GBs only [45]. Bi-modal morphology also has the same distribution of grains and primary GBs as typical, but a fraction of grains also contains secondary GBs, while other grains do not, and some are partially filled [55]. Secondary GBs have no preferred orientation. Semi-lamellar morphologies have the same distribution of grains and primary GBs as typical, but all grains also contain secondary GBs [52].
Table 1 represents a comparison of all generated morphologies according to the occupied total, GB, and grain two-dimensional volume in arbitrary units. GBs occupy the smallest part of the volume in the typical morphology since it does not contain secondary GBs. However, the ratio of GB volume versus total volume does not fully characterize morphologies’ diffusive properties, since the ratio of primary and secondary GBs can differ between morphologies, as well as diffusivities of secondary GBs, resulting in different overall diffusivity even with the same ratio of GB and total volume.
Therefore, an additional parameter is defined to characterize the diffusivity of generated morphologies, coefficient agb:
where is the average greyscale number of the whole morphology. This coefficient expresses overall average GB-like diffusivity in the generated morphologies. As expected, the highest value of agb corresponds to the highest value of Vgb/Vtotal ratio (Table 1).
To study the relationship between the bulk and grain boundary diffusion and to identify their influence on the overall mass transfer, two cases of Dgb/Dg ratios were selected for investigation (see Table 2). The total diffusivity coefficient is calculated as
The general tendency can be observed that with the increasing Vgb/Vtotal ratio (see Table 1), total diffusion coefficient also increases. Cases 1 and 2 differ by 10 times lower Dg coefficients, while 2 and 3 by Dgb coefficients ten times lower. Cases 4 and 5 maintain the same constant total diffusivity with different Dgb/Dg ratios. Cases 4 and 6 maintain the same Dgb/Dg ratio, but total diffusivity differs by 10 times.
3. Results
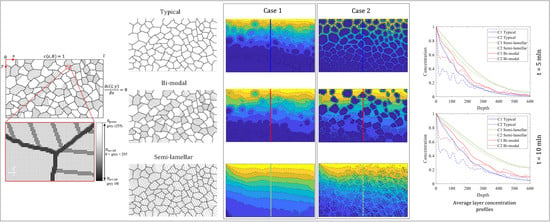
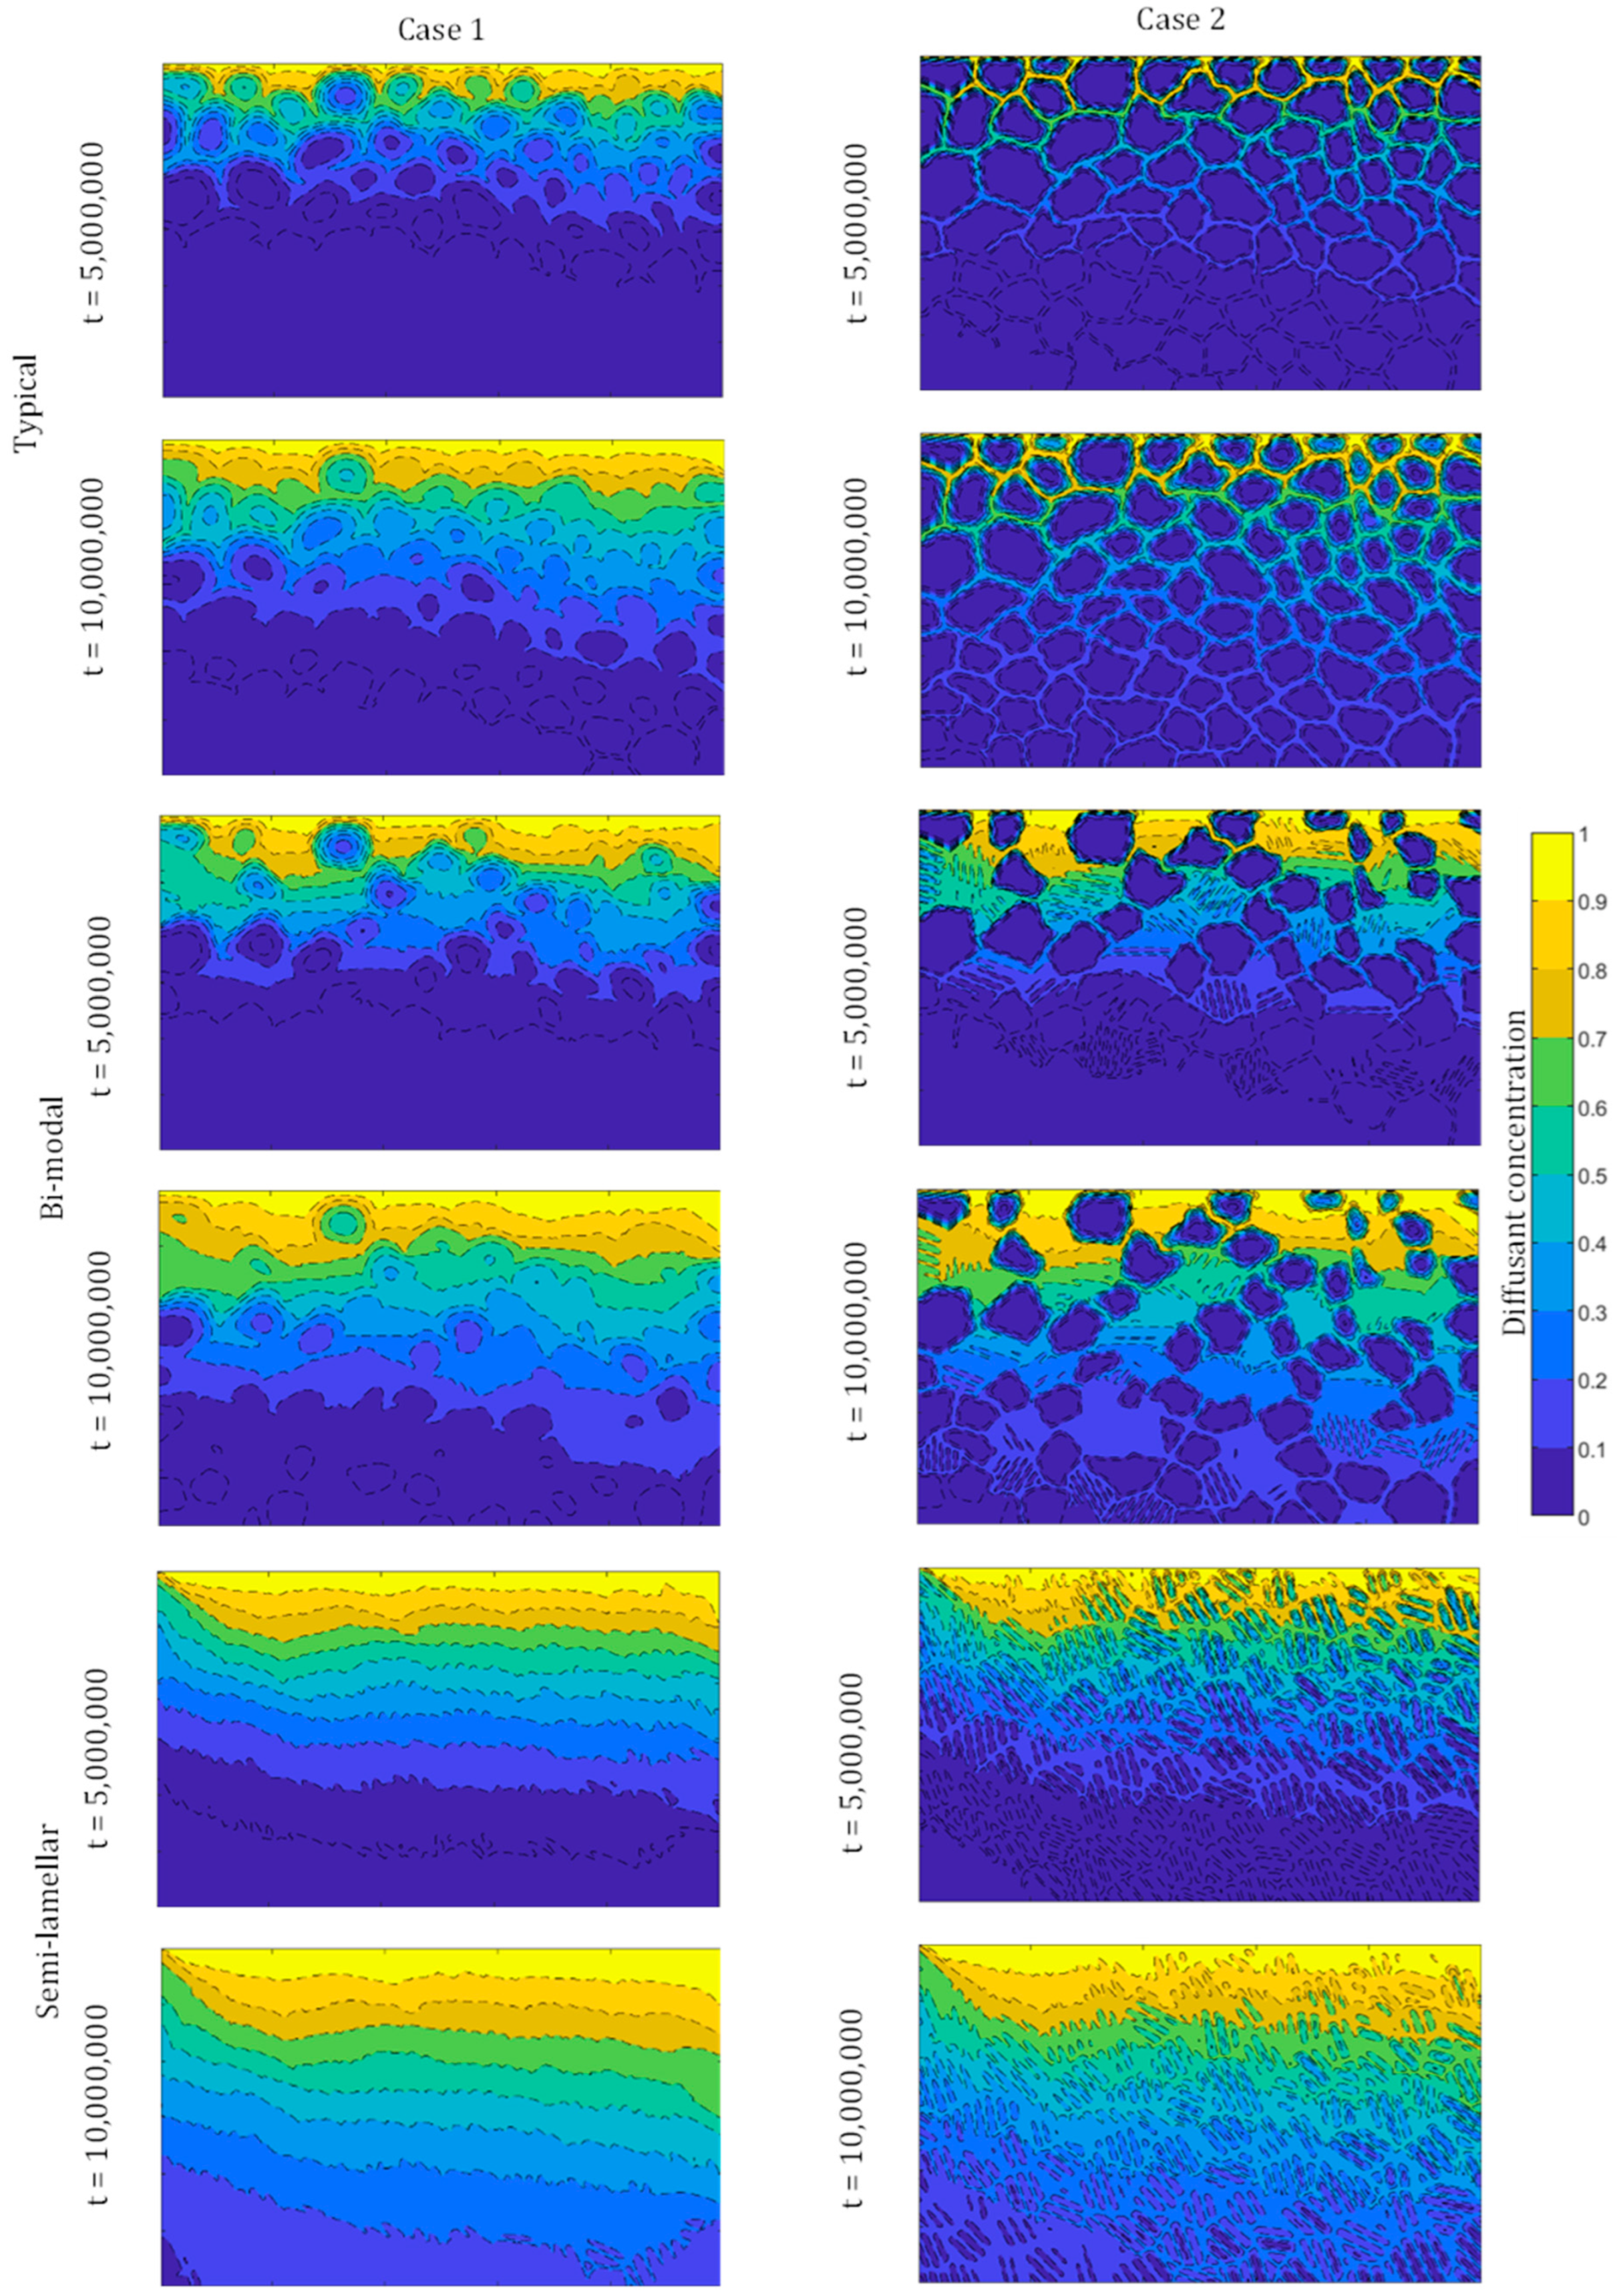
During the performed simulations the diffusion process in the coatings with the selected polycrystalline morphologies was modeled. An example of obtained results is presented in Figure 4 where concentration distributions of diffusant at selected instances of t = 5,000,000 and 10,000,000 are shown for Cases 1 and 2, and typical, bi-modal, and semi-lamellar morphologies (surface at the top). No morphological distribution is shown in Figure 4, which graphically shows whether morphology affects diffusion by preferring a diffusant path to GB or not. Therefore, it creates (or not) a pattern similar to a simulated case of morphology. The same progression of diffusion into the material from the surface was observed in coatings of all morphologies. Since diffusion coefficients were selected with significantly higher values in GBs compared to grain interiors, diffusion mostly progressed through the primary GBs, with slower diffusion occurring at secondary GBs. Diffusion into the grain interiors from the surface and GBs was significantly slower than along the GBs.
This general trend is visually confirmed by the obtained concentration distributions. The locations of higher diffusant concentrations correspond to the GBs in all simulated coatings confirming preferential transport of the diffusant. The relative intensity of diffusion into the grain interiors depends on the ratio of Dgb/Dg which is 10 times lower in case 1 than in case 2. This difference results in less sharp concentration distributions in case 1 (Figure 4 first column), where the concentration seems to be smeared from GBs into the grain interiors since grain diffusion is more intense, versus case 2, which still exhibits sharp primary GBs at this moment (Figure 4 second column).
It can be seen in Figure 4 that the obtained concentration distributions each exhibit quite a different character. The observed diversity can be explained by different Harrison regimes dominating different morphologies and cases [27].
3.1. Morphology Influence on Diffusion Regimes
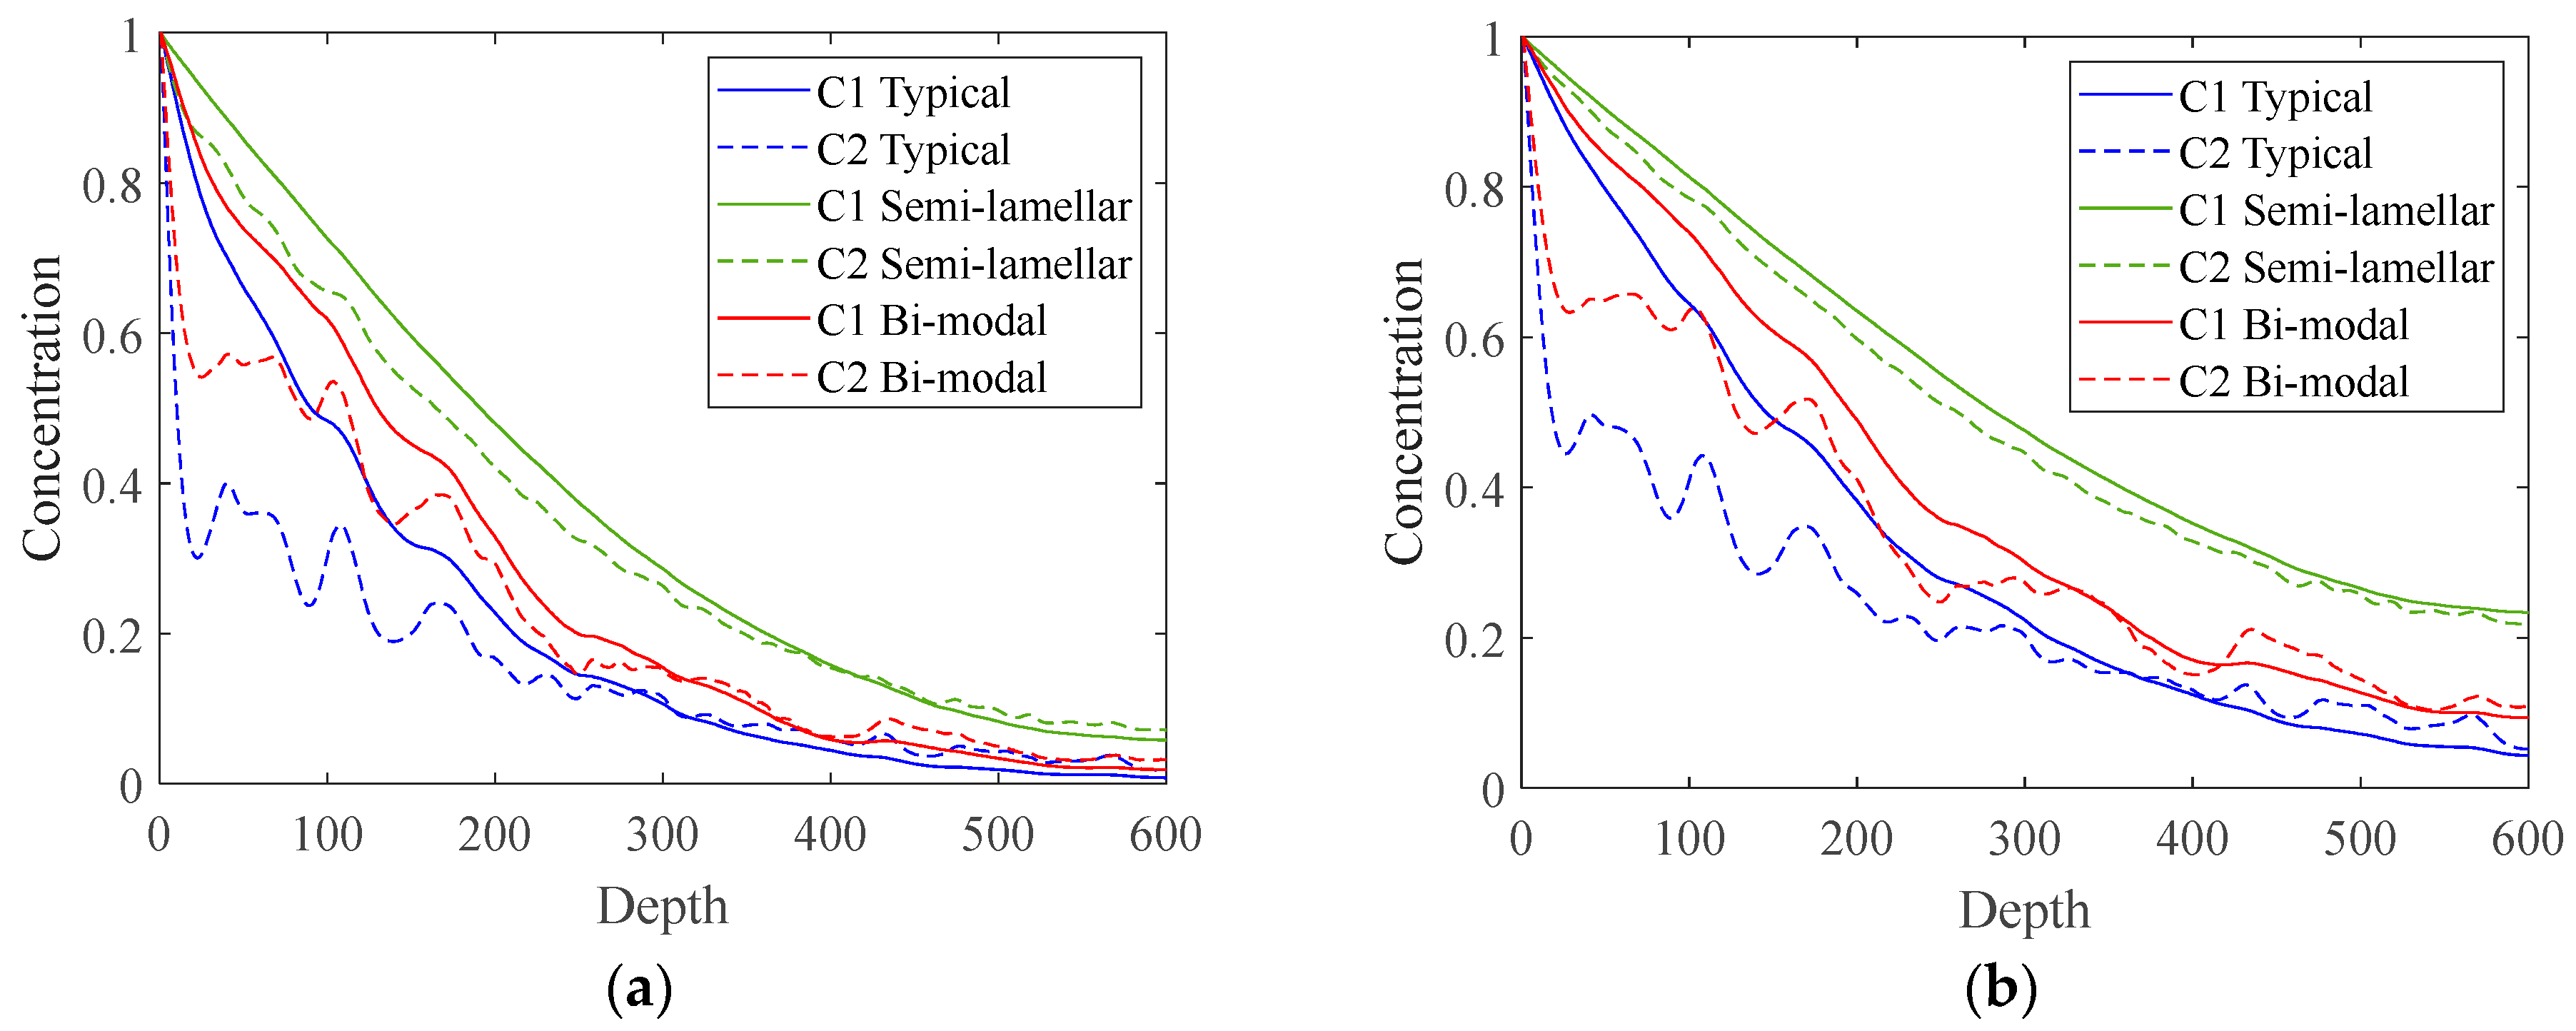
The Type-A regime corresponds to long diffusion times, grain diffusion coefficient not much greater than in GBs or smaller grains. However, as is shown below, Type-A regime is also facilitated by a higher density of secondary GBs. From the three presented cases, Type-A regime most clearly can be observed in Case 1 semi-lamellar morphology, which has the highest agb. This regime is distinguished by the insignificant differences between bulk and GB concentrations (Figure 4). The presence of Type-A regime is as well confirmed by the averaged concentration profiles (see Figure 5), which are also dependent on the dominant kinetic regime. Case 1 semi-lamellar curves are smooth, indicating no local effect of GBs, while every other case has greater or smaller peaks at depths where the grain boundary density is higher.
The Type-B regime, which is the most complicated, exhibits larger differences between GBs and grains, however, the distribution of concentrations does not approach any limiting case. GBs tend to be saturated, while grains are shallowly penetrated by diffusant, with substantially lower concentrations in the grains’ interiors. Since this regime is intermediate between limiting cases, it can be commonly observed during the transient. Due to a higher Dgb/Dg ratio, this regime dominates in Case 2 semi-lamellar morphology (compared to Type-A in Case 1). The Type-B regime can be clearly seen in Case 1 of other typical and bi-modal morphologies (Figure 4). However, in all these cases, the Type-B regime does not appear individually, while near the surface the Type-A regime is observed as well. A comparison of concentration distributions at different instances in these cases shows that Type-A regime region is expanding deeper from the surface with time. In the bi-modal morphology case, additional localization of Type A/B regimes can be distinguished where the diffusion around the grains with secondary GBs behaves as Type-A diffusion, while in the rest of the volume as Type-B. The Type-B regime is indicated by the visible GB-normal gradient of concentration towards the center of the grain. Likewise, the averaged concentration profile shows some bumps, which indicate a mild local effect of GBs (see Figure 5).
Type-C regime corresponds to short diffusion times or significant differences between grain and GB diffusion coefficients, for example, the diffusion length in grain is less than the GB width. It can be assumed that in this regime diffusion takes place only in GBs. In this research, a pure Type-C regime is facilitated by the absence of secondary GBs and is observed only in the early instances, when diffusion length is still sufficiently small. Case 2 concentration contours of the typical morphology at the earlier instance (Figure 4) are quite sharp and mainly correspond to this regime. In this case, diffusion takes place mostly along the GBs, and the leakage from the GBs to the grains is very low or non-existent. After some time, with diffusant leaking to grains, the Type-C regime begins to transition to Type-B (later instance).
If the thin film morphology has a complex distribution of primary and secondary GBs, like, in our case, bi-modal, it can simultaneously experience all three regimes in different locations: Type-A in grains with the secondary GBs nearer the surface, Type-B in grains with secondary GBs deeper in the material, and Type-C around the grains without secondary GBs. With increasing time, regime locations advance deeper into the material.
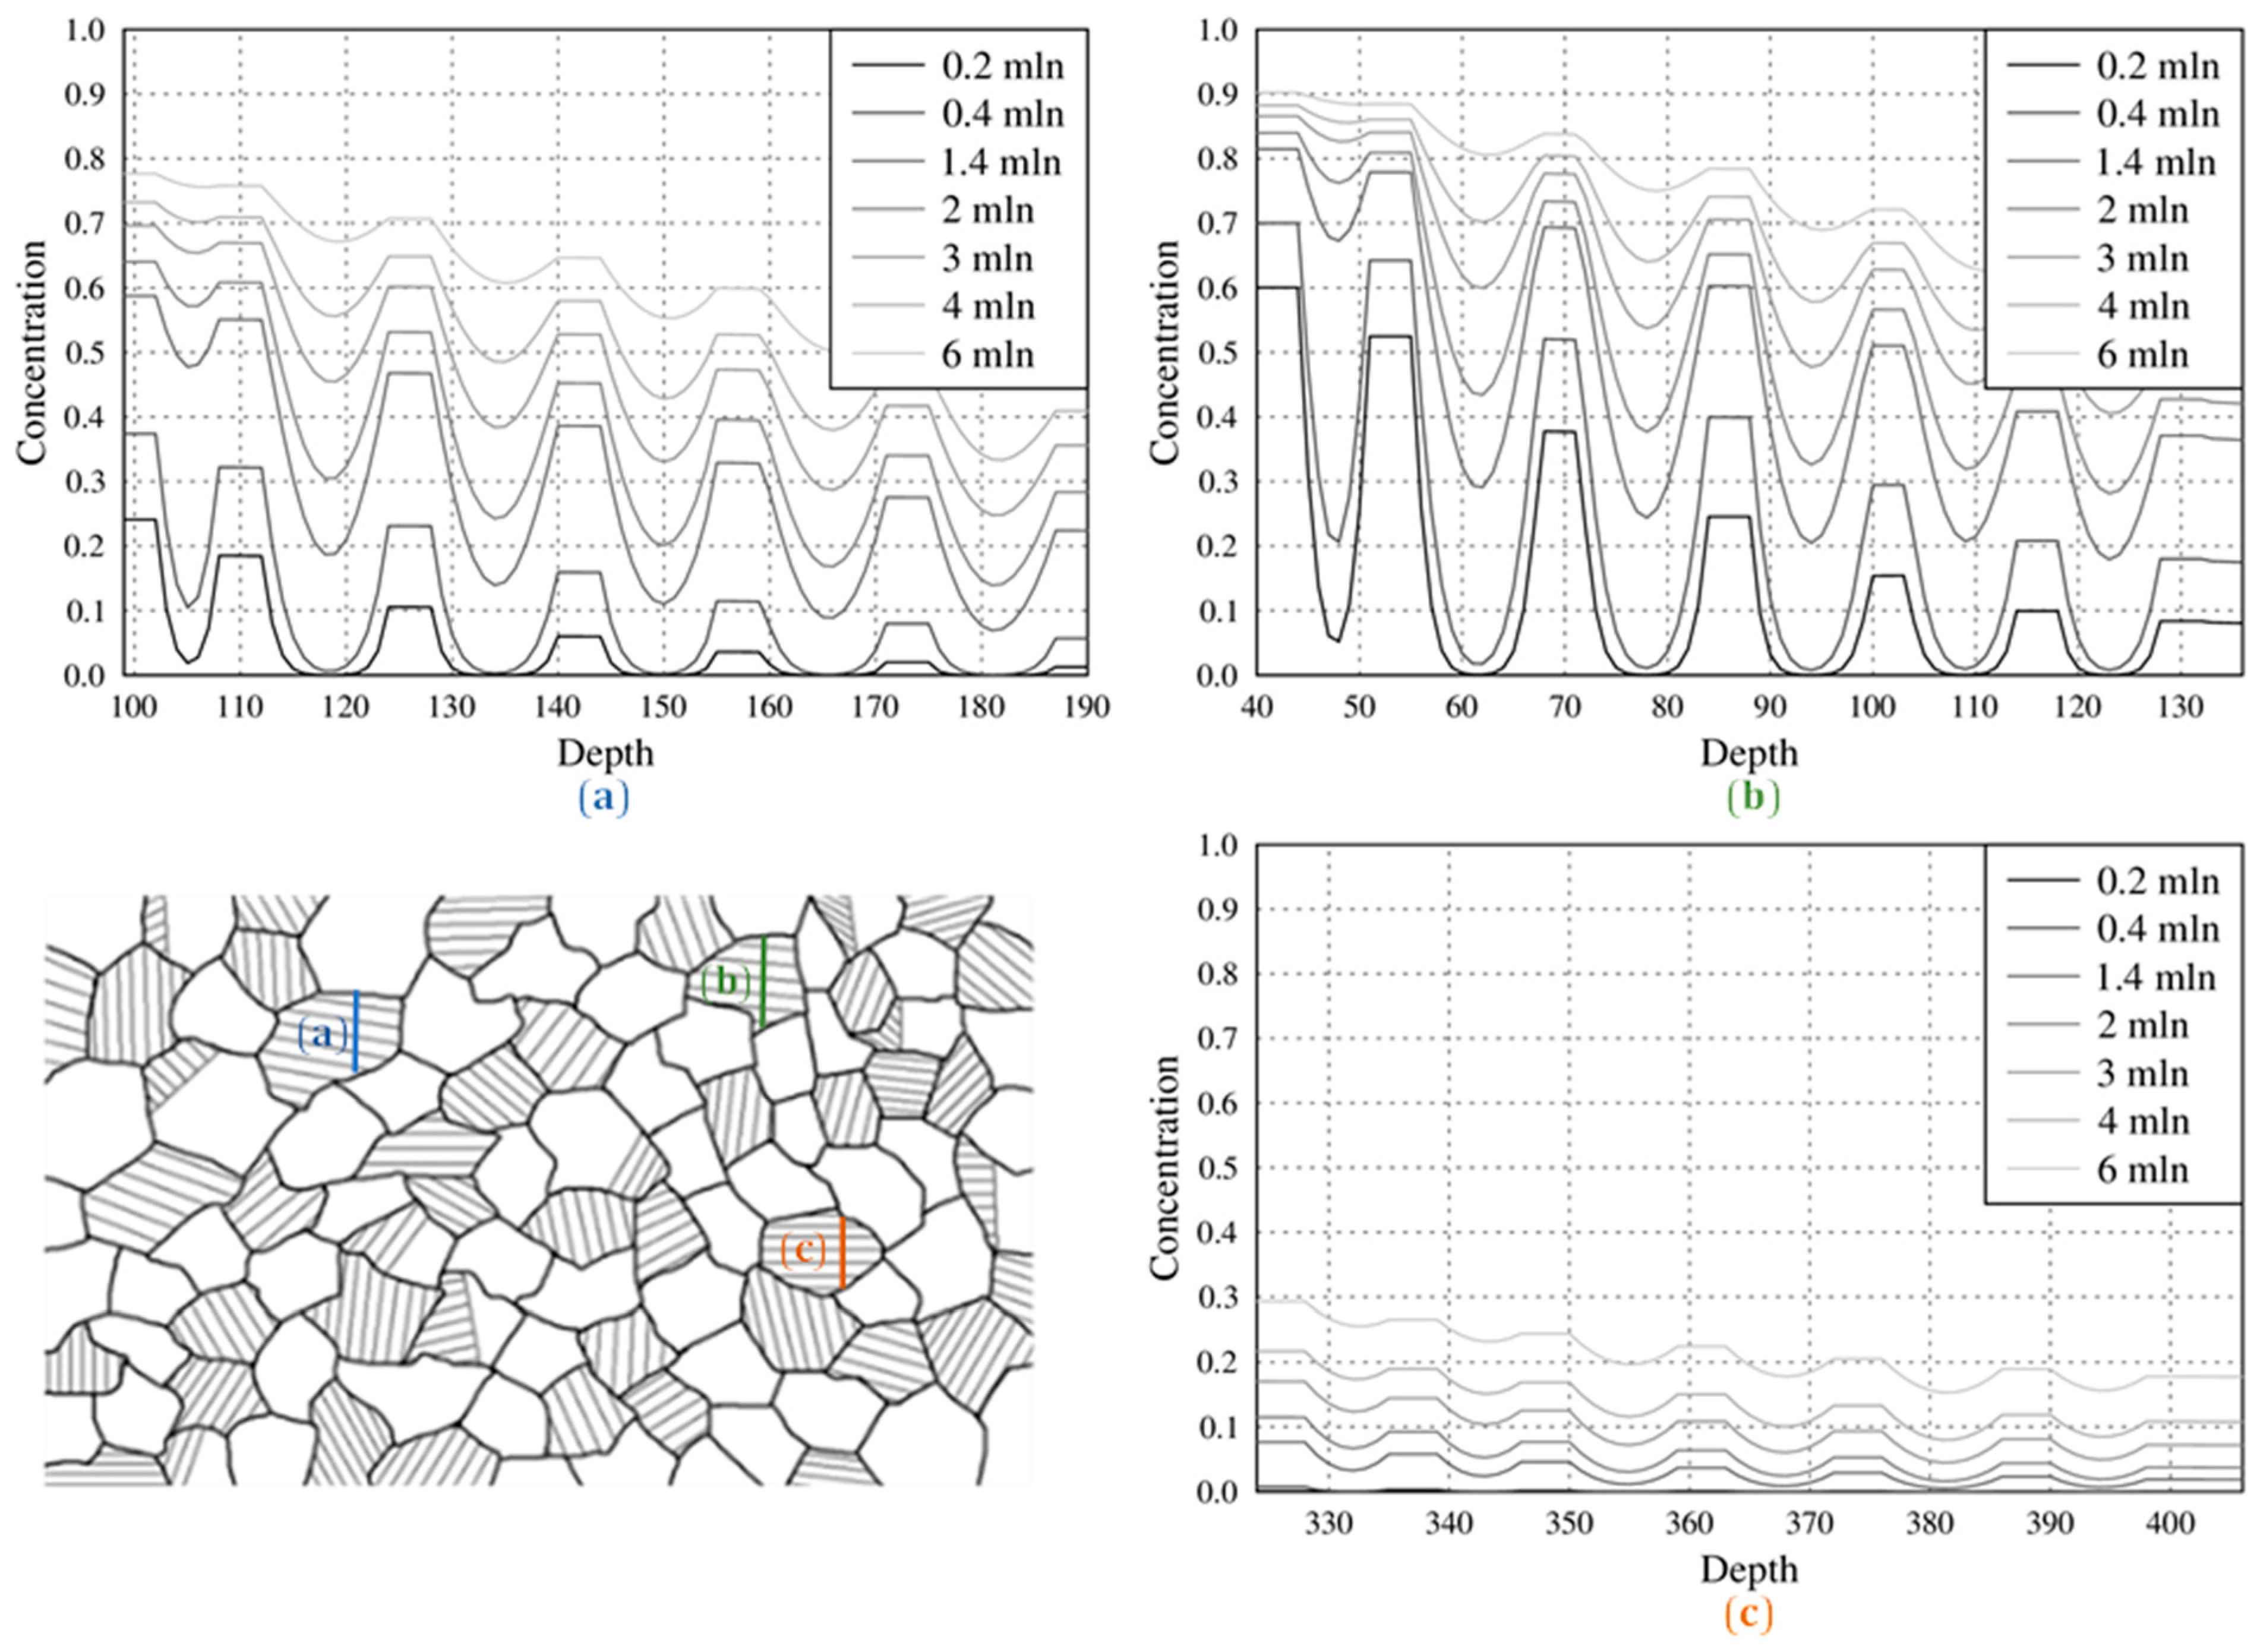
Type C-B-A transition in the coating is shown in more detail in Figure 6, where local concentration curves become smoother with time. A larger gradient between the grain interior and secondary GBs observed in grains closer to the surface can be attributed to overall higher gradients closer to the surface initially. Regime changes can also be seen in Figure 5, where the most prominent peaks are observed in case 2 typical morphology followed by the same case bi-modal morphology, corresponding to Type-C regime. However, they are slightly smearing out with time, indicating the beginning of a transition to Type-B.
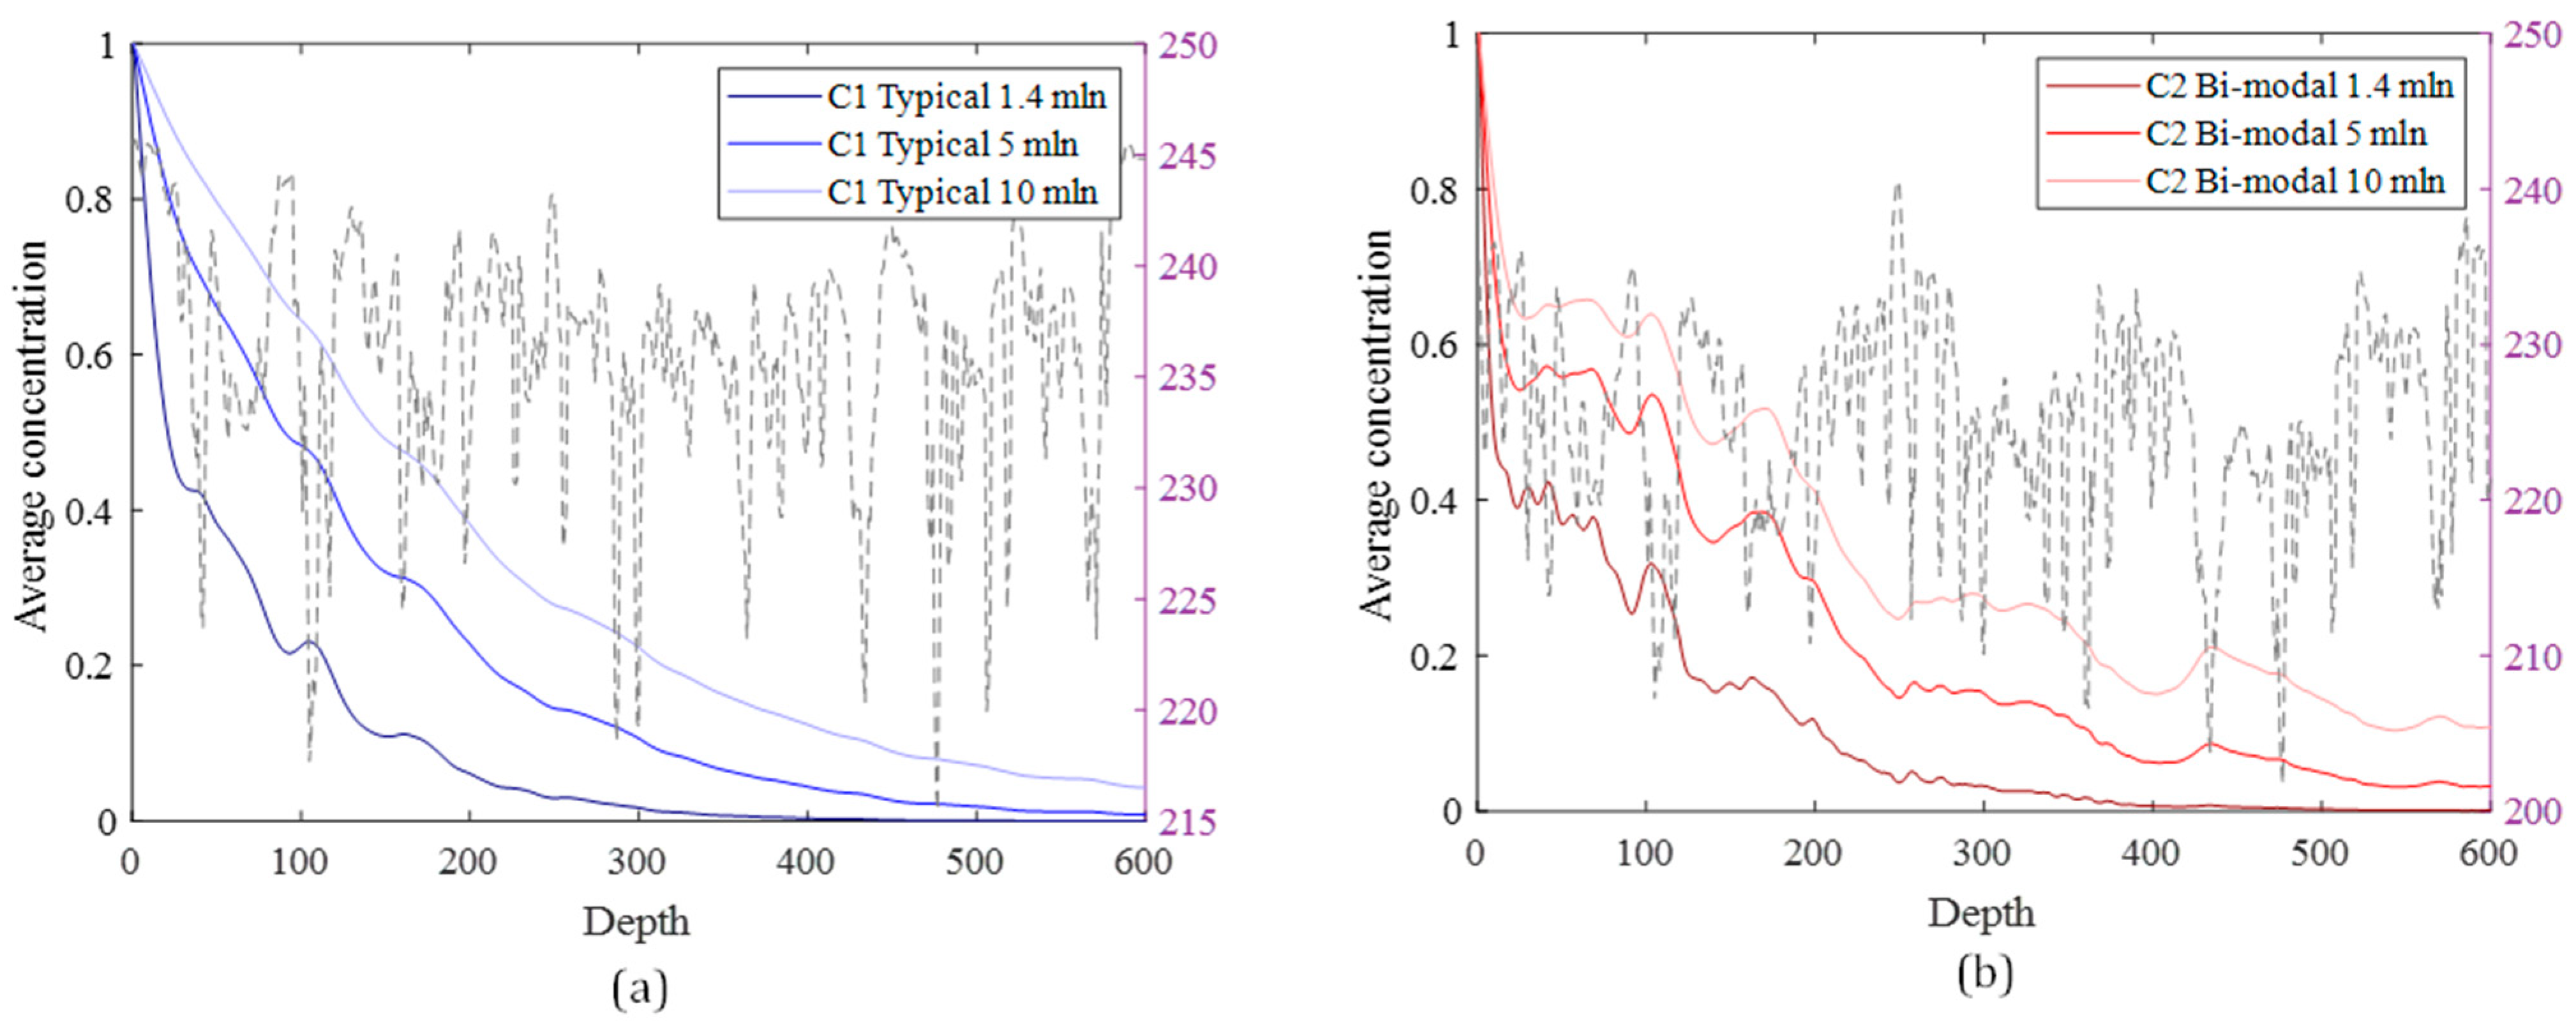
Several time moments of averaged concentration profiles are given in Figure 7 for Case 1 typical and Case 2 bi-modal morphology coatings. Curves tend to become smoother over time. It is apparent that the Type-A regime remains, while Type-B tends to switch to Type-A and Type-C shifts to Type-B. However, in Case 2 bi-modal morphology, further peaks, e.g., in between 100 and 200 depths, become greater, which indicates a local reversal and more pronounced Type-B or even Type-C regime.
Overall, averaged concentration profiles can indicate a dominant regime not only in simple polycrystal models but also in realistic and complex morphologies, for example, a non-uniform profile indicates Type-C or Type-B regimes, while a smooth curve shows that the regime is Type-A.
More densely located secondary grain boundaries create areas of faster diffusion, and a lower Dgb/Dg ratio leads to greater diffusant leakage from GBs to grains and a more uniform concentration distribution. If leakage to grains is low, the accumulation of diffusant in GBs can result in a non-uniform concentration distribution, and thus in non-uniform material properties, which may be a problem for an appliance that utilizes it.
3.2. Influence of Polycrystal Morphology on the Overall Rate
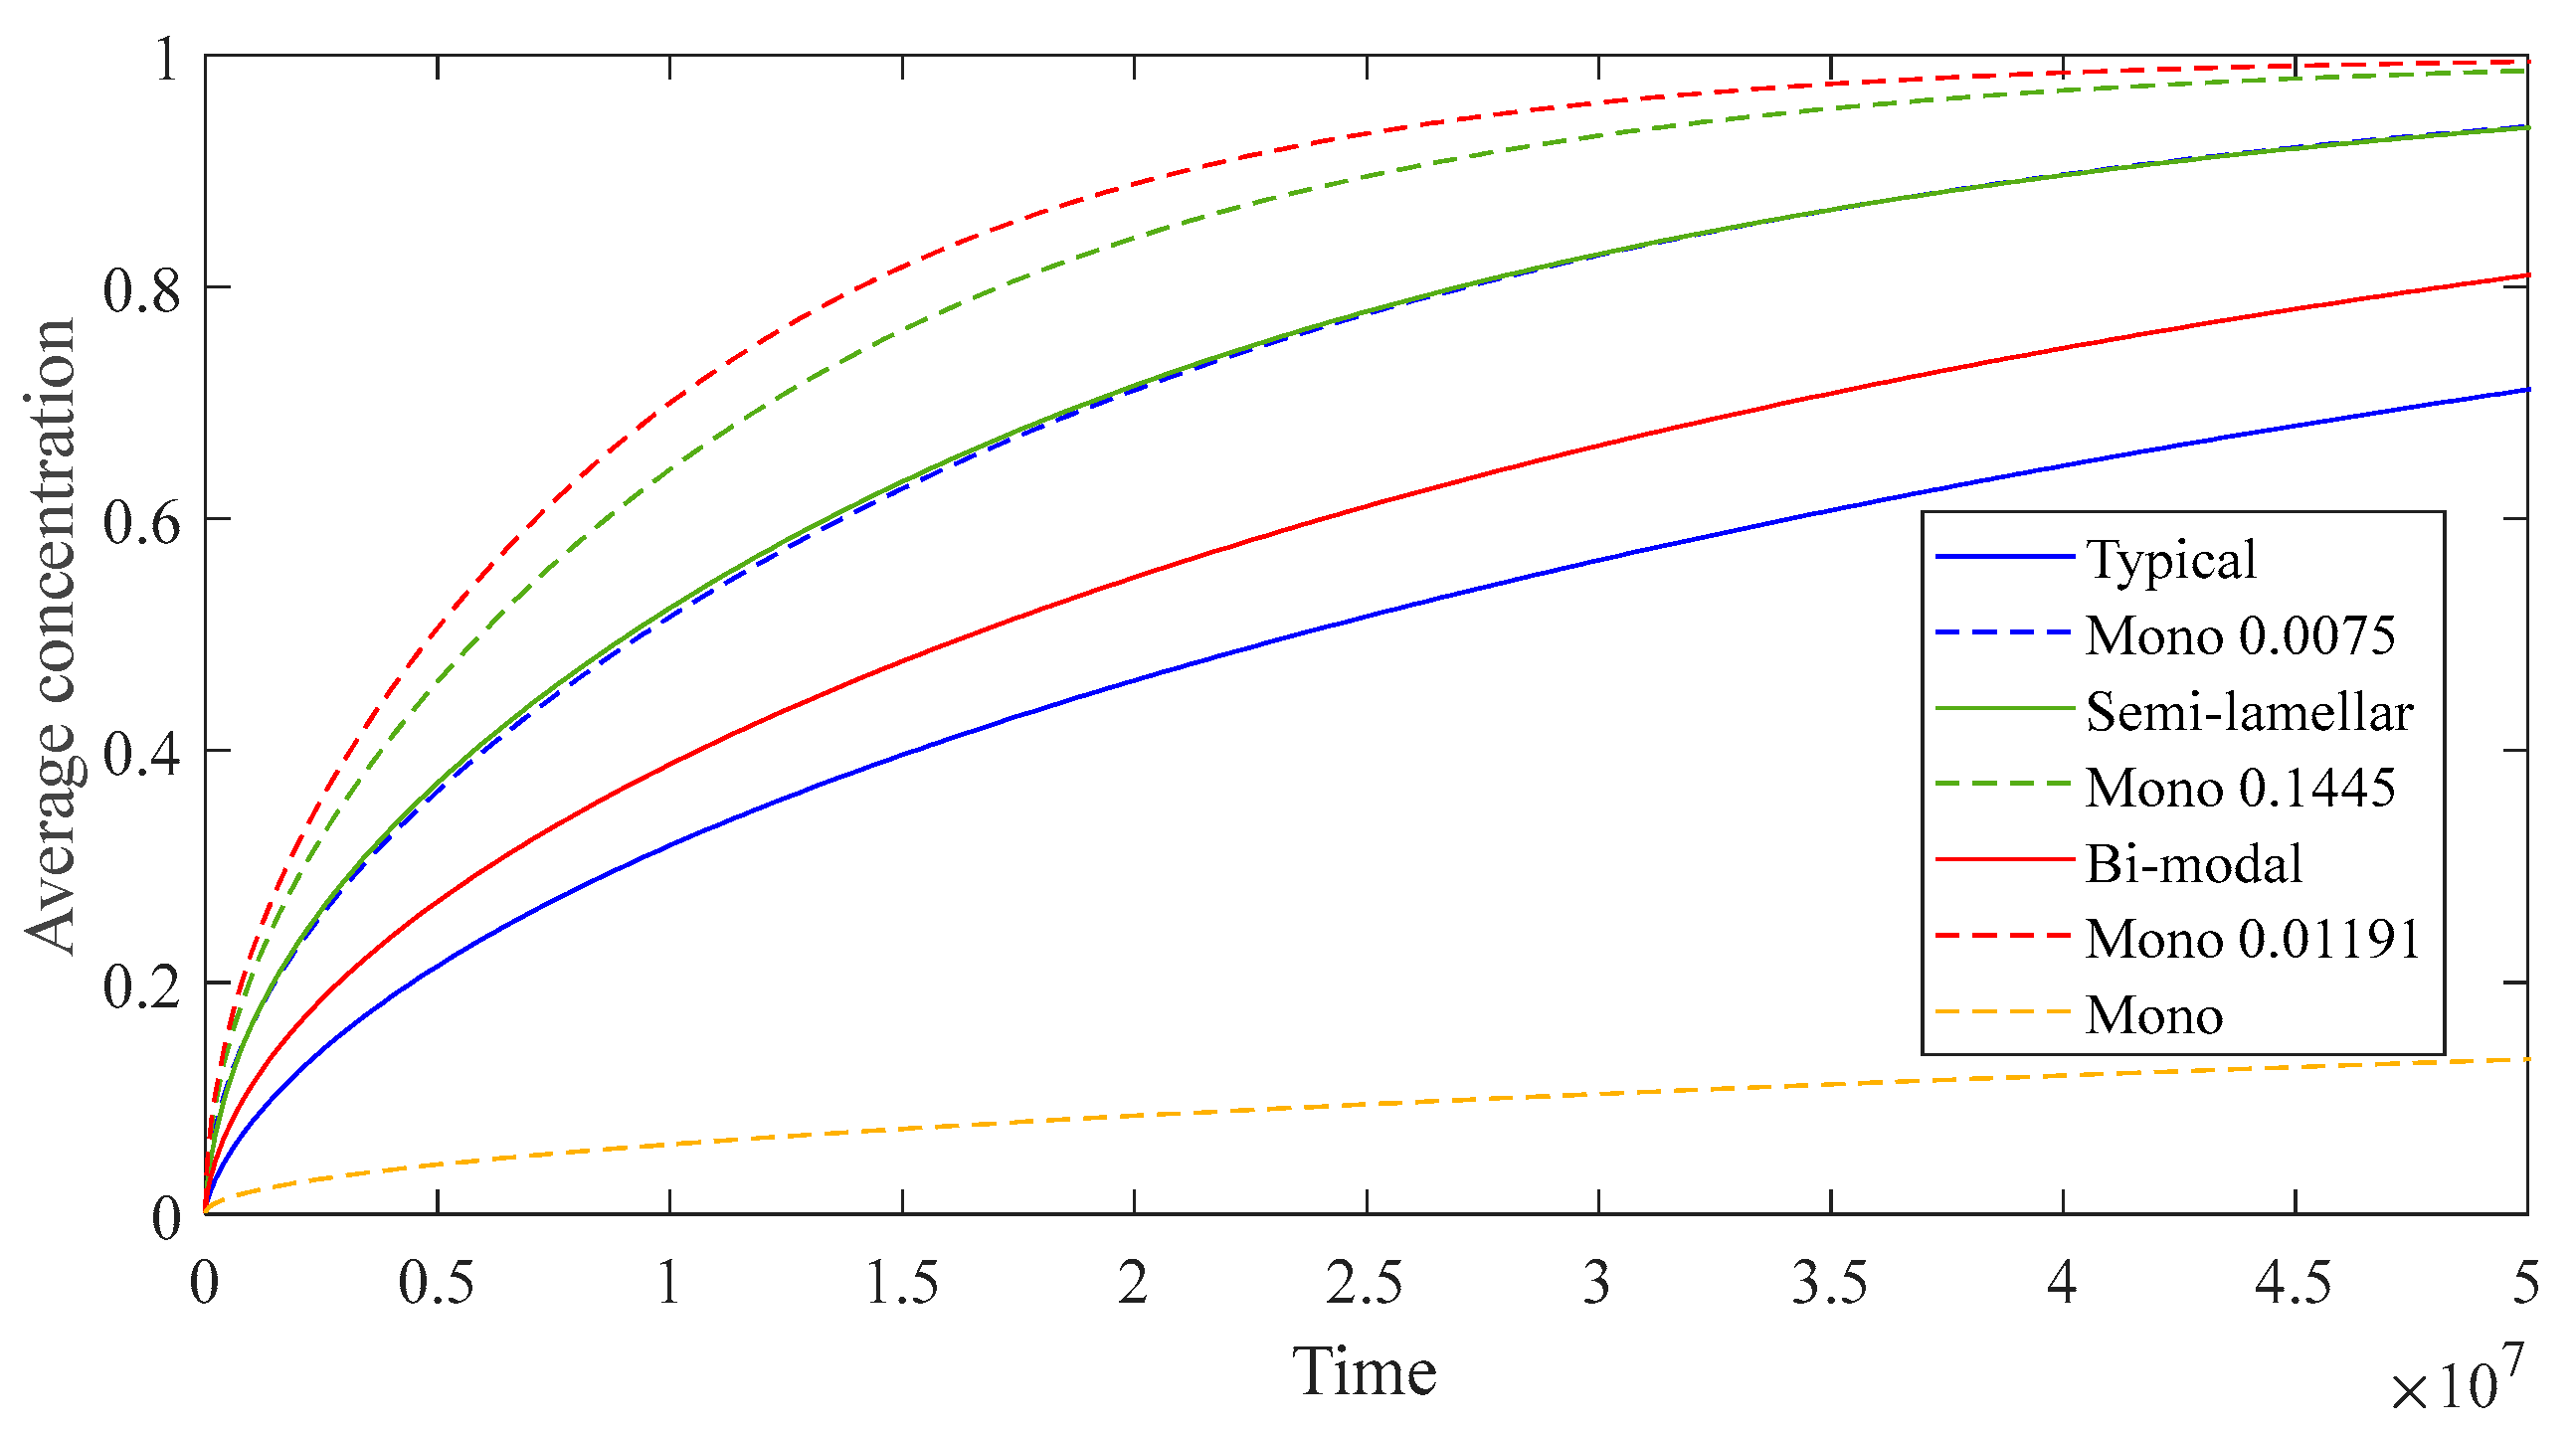
Figure 8 shows the evolution of average concentration in the simulated coating in Case 1 for all polycrystal morphologies and corresponding monocrystal cases. All polycrystal microstructures have the same Dgb and Dg, however, due to variations between morphologies’ total diffusivities, Dtotal are different. The introduction of GBs with a high diffusion coefficient has a straightforward effect of speeding up the integral diffusion rate in the material, as a comparison with monocrystal with D = Dg shows. The level of speed up depends on the morphology features and is limited due to the constraint of higher diffusion coefficients to the GBs, and subsequently, limited interface areas for faster diffusion fluxes. If the same total diffusivity, obtained in each polycrystal case, would be distributed homogenously in a corresponding monocrystal material, the overall diffusion rate would be higher, as illustrated in Figure 8. In conclusion, the presence of GBs speeds up the diffusion rate, but less efficiently than a homogenous increase of diffusivity to the same average value.
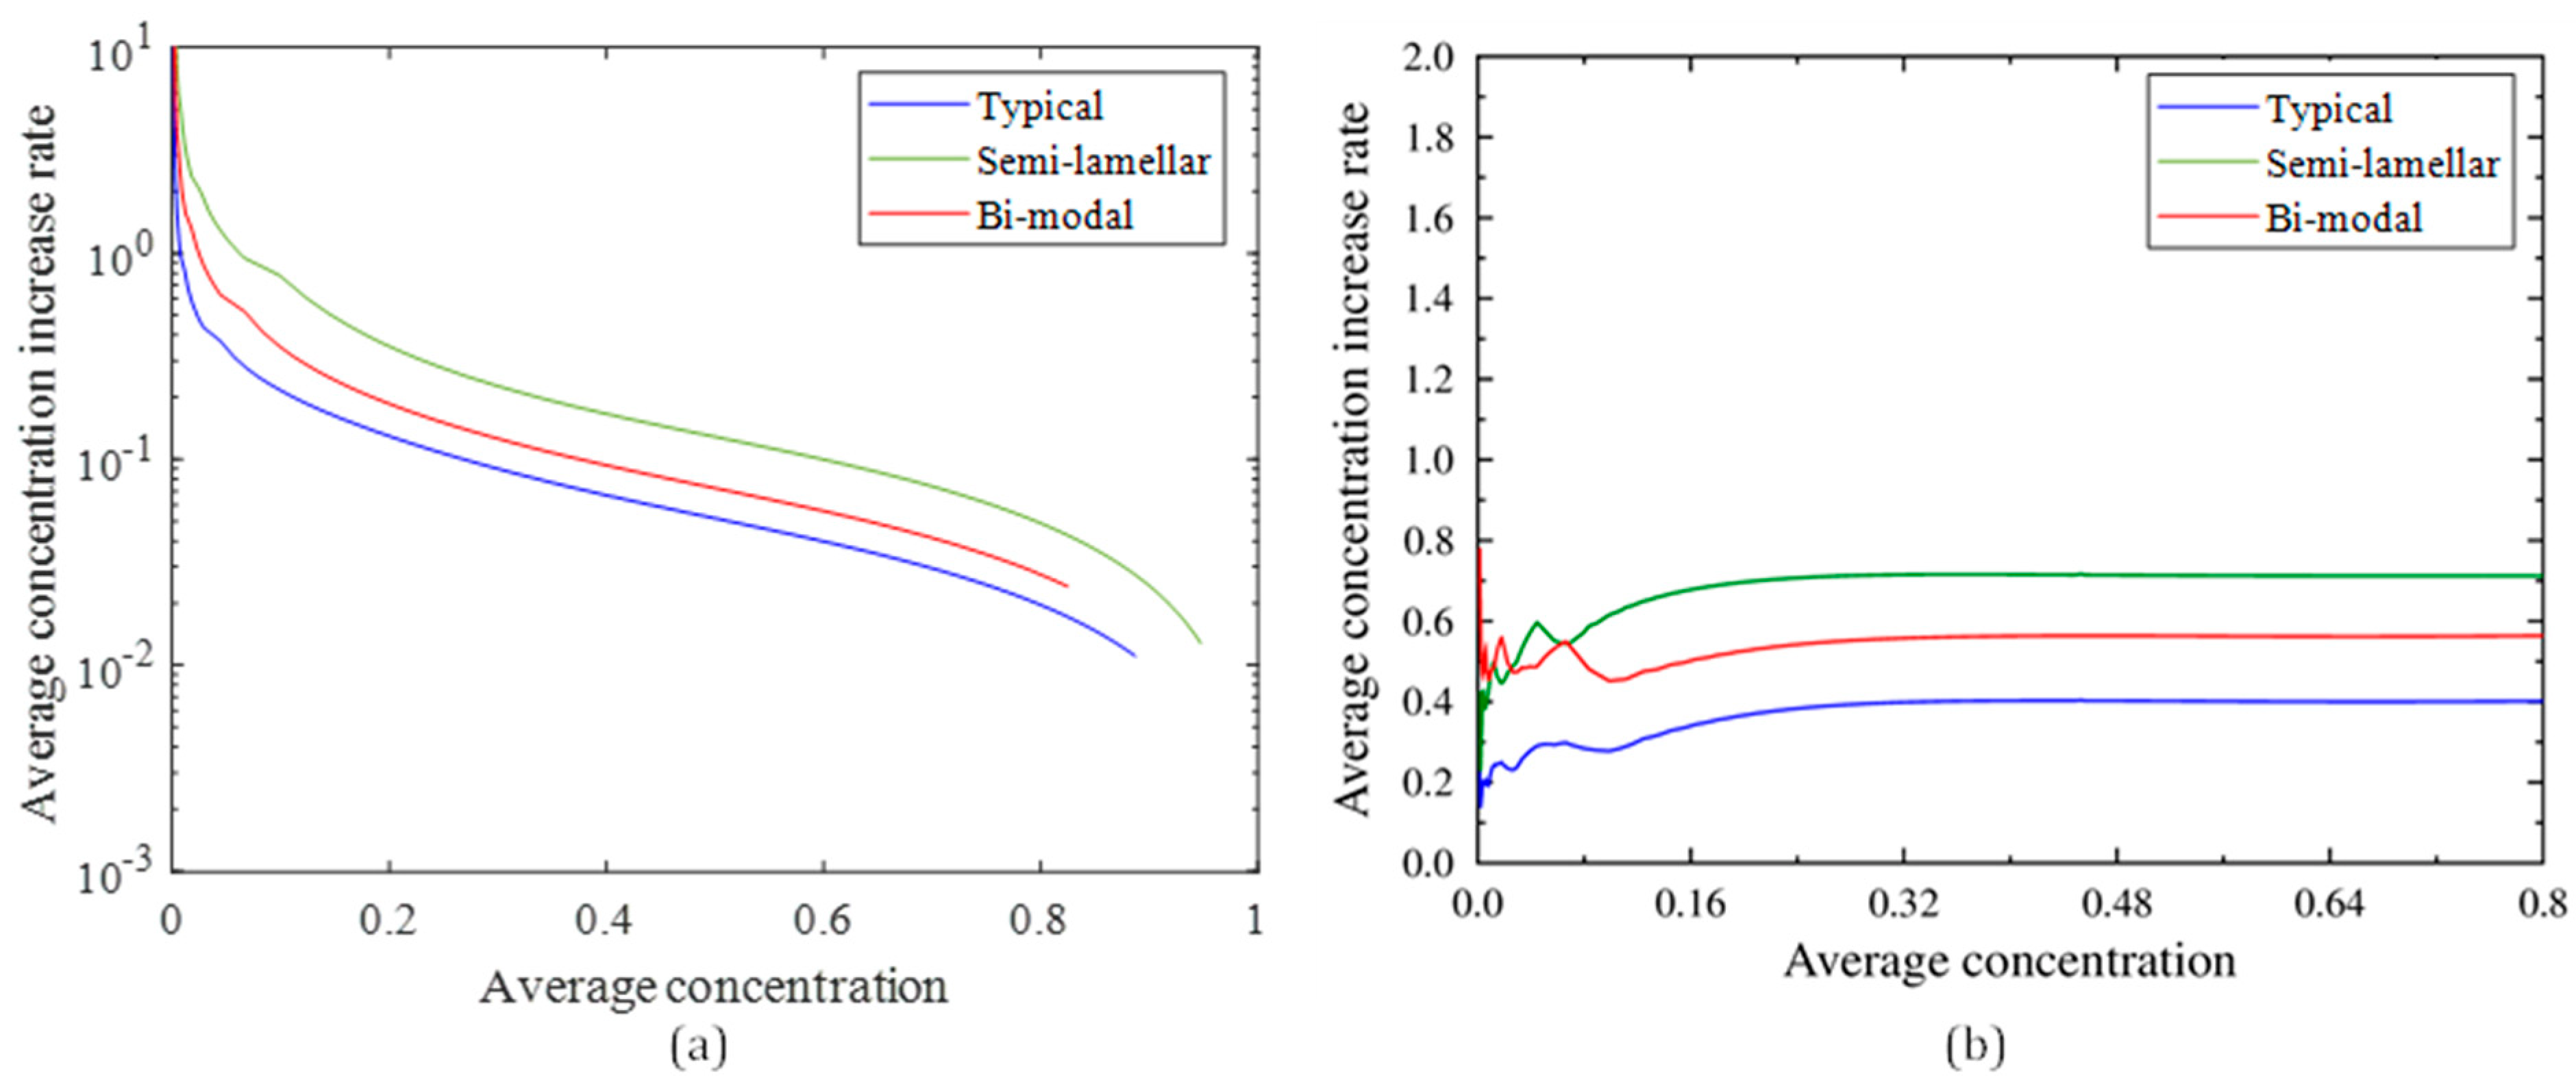
Figure 9a shows the dependency of the average concentration increase rate on the average concentration for all coatings. As could be expected, the average diffusion rate is higher in morphologies with a larger total diffusivity. Ratios of diffusion rates in these morphologies (Figure 9b) are practically constant when the average concentration is in the range of 0.4–0.7. Therefore, it is possible to compare averaged diffusion rates for these morphologies by taking values at the same selected average concentration from this range.
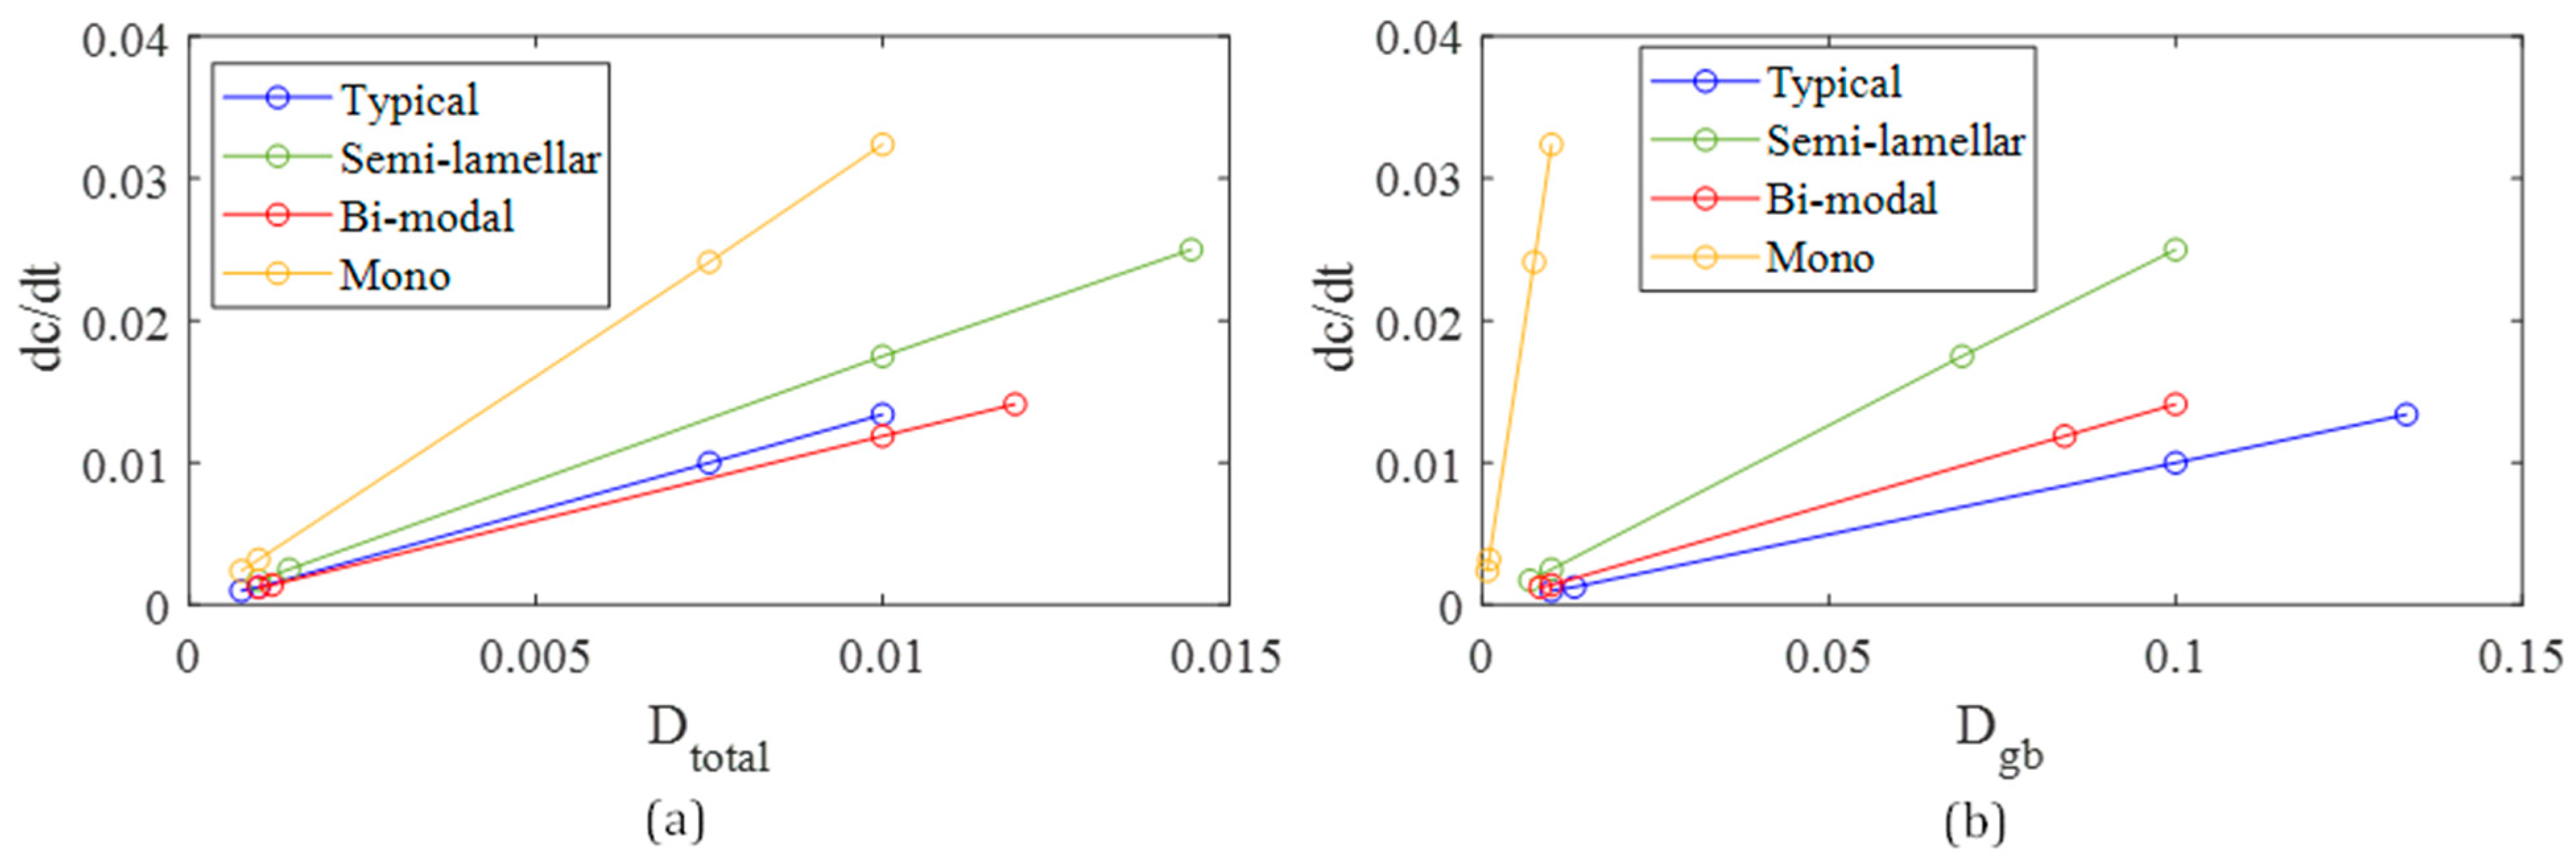
Figure 10 shows dependencies of the integral diffusion rate on Dtotal and Dgb at an average concentration of 0.5 for all morphologies (Dgb/Dg = 1000) and monocrystal cases. Linear dependencies are obtained, with proportionality coefficients depending on the morphology and the selected average concentration. As expected, in dependency on Dgb case, bi-modal morphology is between the typical and semi-lamellar morphologies, since it is the intermediate microstructure. However, when dependency against the Dtotal is examined, typical morphology seems to be more efficient than bi-modal. This result shows that the overall diffusion rate is not solely determined by the total diffusivity Dtotal, but results from a complex relationship between the Dtotal, Dgb, and distribution of primary and secondary GBs. To obtain higher total diffusivities in typical morphology, which does not contain secondary GBs, significantly higher Dgb values are needed. Moreover, it is these high Dgb values which then make overall diffusion faster in typical morphology than in the bi-modal morphology at the same Dtotal. However, diffusion is the fastest in semi-lamellar morphology, regardless of the lowest Dgb values required for the same Dtotal, showing that the relative importance of Dtotal or Dgb depends greatly on the morphology features and density of secondary GBs.
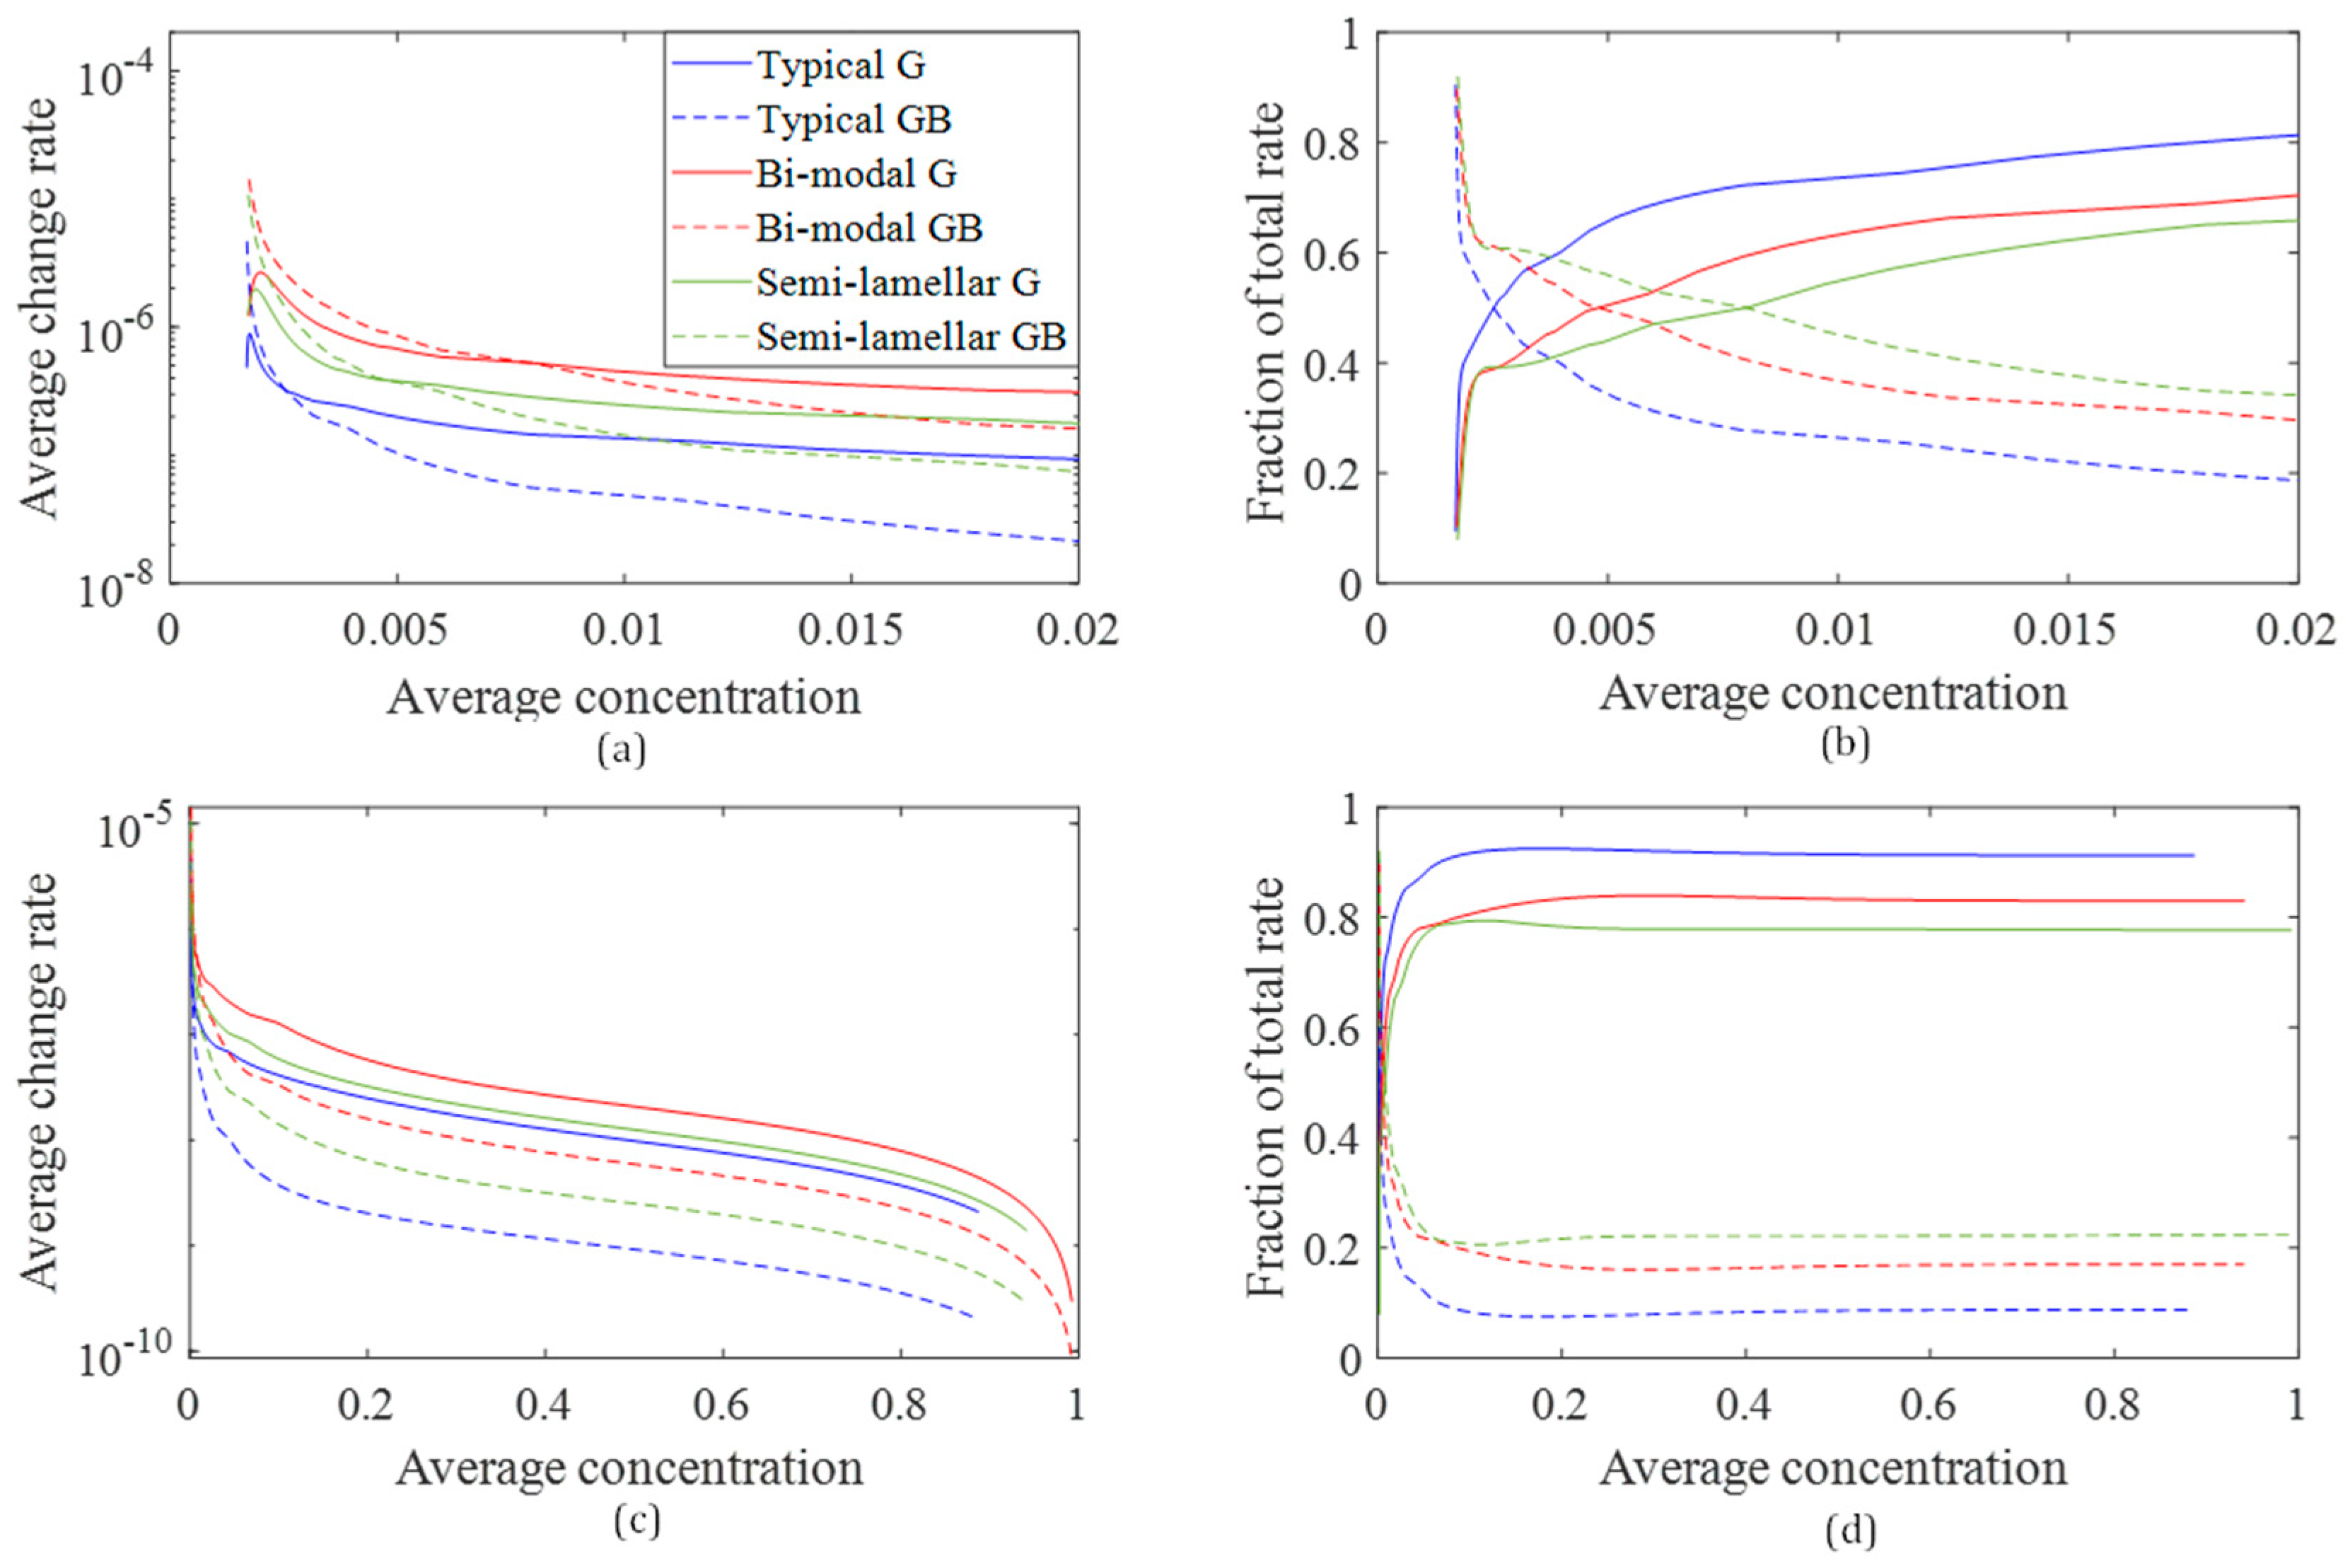
Figure 11 shows the dependence of overall concentration change rate on average concentration separately in grains and GBs in all three materials as an absolute value (Figure 11a,c) and as the fraction of total rate (Figure 11b,d) at the beginning of the transient (Figure 11a,b) and during the whole duration (Figure 11c,d). All three coatings differ only by the presence of secondary GBs: typical has none, semi-lamellar has secondary GBs in all grains, and bi-modal in approximately half of the grains. Figure 11 shows that diffusion is initially dominated by the GB transport in all morphologies. However, very soon, it is overcome by grain diffusion due to a larger volume of the material taken up by grains. The concentration at which grain diffusion starts to dominate increases with the increasing volume of secondary GBs. Moreover, with the increasing volume of secondary GBs, the dominance of grain diffusion decreases from about 0.9 (typical) to 0.78 (semi-lamellar). It is interesting to note that this ratio does not change for most of the duration of the transient, confirming the self-similar character of diffusion deeper in the material even if its microstructure is not idealized.
The higher ratio Dgb/Dg (with constant Dgb) of Case 2 affects the overall transient in two ways. First, the overall uptake of diffusant is slower in Case 2, as shown by Figure 12, since grain interiors, which comprise the majority of the material by volume, are filled slower, and second, the depth profile of layer-average concentrations (Figure 5) is shallower, since less diffusant is leaked from the GBs into the grain interiors, resulting in more intense diffusion into the deeper layers along the GBs.
However, the average concentration in semi-lamellar morphology is very similar in both cases, even though the Dgb/Dg ratio differs by an order of magnitude. This result shows that when the network of secondary GBs is sufficiently dense, the relative importance of grain diffusivity decreases. Coatings containing less or no secondary GBs show bigger differences between the cases. However, the relative difference is also decreasing with time.
4. Conclusions
The paper presents a model of diffusion in the polycrystalline coatings of different morphologies. Three different polycrystal morphologies were selected with or without secondary GBs. Two cases with constant Dgb and Dg values were modeled. The effect of polycrystalline coating morphology on the diffusion phenomena was studied.
The study has found the following effects of morphology on the diffusion process in the thin film:
- Different morphologies having the same values of diffusion coefficients Dg and Dgb can provide a variety of different diffusion regimes. The diffusion regime depends not only on the total diffusivity and ratio Dgb/Dg, but also on the morphological features of the coating:
- ○
- A dense network of primary and secondary GBs facilitates diffusion, and the Type-A regime is favored.
- ○
- Type-B regime in realistic morphologies was not observed individually in the simulated coatings. It was complemented by Type-A regime in the region by the surface, the depth of which increased with time. Additionally, if coating includes grains of significantly different average diffusivity (bi-modal in our case, containing grains both with and without secondary GBs), Type-A regime might replace Type-B in grains with higher diffusivity (presence of secondary GBs).
- ○
- Type-C regime could only be observed in coatings without secondary GBs in the simulated cases, showing that secondary GBs are effective diffusion and grain saturation pathways.
- ○
- In realistic complex morphology, all three regimes occur simultaneously in different places of the material depending on the local features of the microstructure.
- While the introduction of fast GBs accelerates diffusion, the level of acceleration depends on the morphological features, and ultimately, on the deposition method and conditions, since fast pathways and diffusion flux areas are limited to GBs, which reduces the effectiveness of total diffusivity compared to monocrystal diffusion. GB distribution and connections are important to the mass transfer process, as they accelerate diffusant transport locally.
- ○
- Speed-up of diffusion due to GBs does not straightforwardly depend on the total or GB diffusivities Dtotal and Dgb, but on the features of the coating morphology, which can provide more or less weight to the influence of one or another.
- ○
- Even in polycrystal coatings, the overall process is dominated by grain diffusion for most of the transient. Only initially is GB diffusion responsible for the larger part of the overall uptake of the diffusant. However, the denser network of GBs is present, the longer GB diffusion can dominate, and the larger fraction of the overall rate it takes than grain diffusion is dominating.
- ○
- The ratio of average grain and GB diffusion rates in the coating is constant for most of the transient and is dependent on the morphology. However, it corresponds directly neither to the ratio of grain and GB volumes, nor to the average GB-like diffusivity, expressed through the coefficient agb.
- ○
- If the coatings differ only by the presence of secondary GBs, developed diffusion in them maintains the same ratio of average rates at the same average concentrations, regardless of the irregular nature of the microstructures.
- ○
- The overall diffusion rate is generally dependent on the Dgb/Dg ratio (constant Dgb). However, the level of this dependence depends on the morphology. In the coatings with a high number of GBs, e.g., semi-lamellar, the relative influence of Dg is marginal.
- ○
- More densely located secondary grain boundaries create areas of faster diffusion (or accumulation areas), and a lower Dgb/Dg ratio leads to greater diffusant leakage from GBs to grains and a more uniform concentration distribution in the coating.
Finally, our modeling results may serve as a reference for experimental works which are designated for coatings having studied morphologies, for the initial estimation of morphological features influencing diffusion.
Author Contributions
Conceptualization, J.J., M.P. and A.G.; methodology, J.J., M.P. and A.G.; software, J.J. and M.P.; validation, M.P.; formal analysis, J.J. and M.P.; investigation, J.J., M.P. and A.G.; writing—original draft preparation, J.J. and M.P.; writing—review and editing, J.J., M.P. and A.G.; visualization, J.J.; supervision, M.P. and A.G. All authors have read and agreed to the published version of the manuscript.
Funding
This research received no external funding.
Institutional Review Board Statement
Not applicable.
Informed Consent Statement
Not applicable.
Data Availability Statement
Not applicable.
Conflicts of Interest
The authors declare no conflict of interest.
References
- Yang, G.; Park, S.J. Deformation of single crystals, polycrystalline materials, and thin films: A Review. Materials 2003, 12, 2003. [Google Scholar] [CrossRef] [PubMed] [Green Version]
- Kim, B.K.; On, N.; Choi, C.H.; Kim, M.J.; Kang, S.; Lim, J.H.; Jeong, K.J. Polycrystalline indium gallium tin oxide thin-film transistors with high mobility exceeding 100 cm 2/Vs. IEEE Electron Device Lett. 2021, 42, 347–350. [Google Scholar] [CrossRef]
- Li, G.; Rahim, M.Z.; Pan, W.; Wen, C.; Ding, S. The manufacturing and the application of polycrystalline diamond tools–A comprehensive review. J. Manuf. Process. 2020, 56, 400–416. [Google Scholar] [CrossRef]
- Angadi, R.V.; Revanasiddesh, B.; Vineet Kumar, P.K. A review on different types of materials employed in solar photovoltaic panel. Int. J. Eng. Res. Technol. 2019, 7. [Google Scholar]
- Ryu, S.; Yu, W.; Chang, I.; Park, T.; Cho, G.Y.; Cha, S.W. Three dimensional YSZ interface engineering layer for enhancement of oxygen reduction reactions of low temperature solid oxide fuel cells. Ceram. Int. 2020, 46, 12648–12655. [Google Scholar] [CrossRef]
- Pan, H.; Yin, X.; Xue, J.; Cheng, L.; Zhang, L. In-situ synthesis of hierarchically porous and polycrystalline carbon nanowires with excellent microwave absorption performance. Carbon 2016, 107, 36–45. [Google Scholar] [CrossRef]
- Magari, Y.; Kataoka, T.; Yeh, W.; Furuta, M. High-mobility hydrogenated polycrystalline In2O3 (In2O3: H) thin-film transistors. Nat. Commun. 2022, 13, 1–8. [Google Scholar] [CrossRef]
- Conte, M.; Aktaa, J. Manufacturing influences on microstructure and fracture mechanical properties of polycrystalline tungsten. Nucl. Mater. Energy 2019, 21, 100591. [Google Scholar] [CrossRef]
- Jeong, H.; Lee, J.H.; Lee, S.Y.; Lee, J.; Cho, S.O. A Transparent Nano-Polycrystalline ZnWO4 Thin-Film Scintillator for High-Resolution X-ray Imaging. ACS Omega 2021, 6, 33224–33230. [Google Scholar] [CrossRef]
- Ikesue, A.; Aung, Y.L. Origin and future of polycrystalline ceramic lasers. IEEE J. Sel. Top. Quantum Electron. 2018, 24, 1–7. [Google Scholar] [CrossRef]
- Chen, Z.; Li, Z.; Hopper, T.R.; Bakulin, A.A.; Yip, H.L. Materials, photophysics and device engineering of perovskite light-emitting diodes. Rep. Prog. Phys. 2021, 84, 046401. [Google Scholar] [CrossRef] [PubMed]
- Wieghold, S.; Correa-Baena, J.P.; Nienhaus, L.; Sun, S.; Shulenberger, K.E.; Liu, Z.; Tresback, J.S.; Shin, S.S.; Bawendi, M.G.; Buonassisi, T. Precursor concentration affects grain size, crystal orientation, and local performance in mixed-ion lead perovskite solar cells. ACS Appl. Energy Mater. 2018, 1, 6801–6808. [Google Scholar] [CrossRef]
- Choi, H.; Choi, K.; Choi, Y.; Kim, T.; Lim, S.; Park, T. A Review on Reducing Grain Boundaries and Morphological Improvement of Perovskite Solar Cells from Methodology and Material-Based Perspectives. Small Methods 2020, 4, 1900569. [Google Scholar] [CrossRef]
- Zheng, R.; Du, J.P.; Gao, S.; Somekava, H.; Ogata, S.; Tsuji, N. Transition of dominant deformation mode in bulk polycrystalline pure Mg by ultra-grain refinement down to sub-micrometer. Acta Mater. 2020, 198, 35–46. [Google Scholar] [CrossRef]
- Jia, H.; Liu, X.; Li, Z.; Sun, S.; Li, M. The effect of grain size on the deformation mechanisms and mechanical properties of polycrystalline TiN: A molecular dynamics study. Comput. Mater. Sci. 2018, 143, 189–194. [Google Scholar] [CrossRef]
- Šalkus, T.; Kazakevičius, E.; Banys, J.; Kranjčec, M.; Chomolyak, A.A.; Neimet, Y.Y.; Studenyak, I.P. Influence of grain size effect on electrical properties of Cu6PS5I superionic ceramics. Solid State Ion. 2014, 262, 597–600. [Google Scholar] [CrossRef]
- Xue, Q.; Huang, Z.; Zhang, J.; Zhang, H.; Feng, Z. Grain boundary segregation and its influences on ionic conduction properties of scandia doped zirconia electrolytes. J. Rare Earths 2019, 37, 645–651. [Google Scholar] [CrossRef]
- Huo, D.; Baldinozzi, G.; Simeone, D.; Khodja, H.; Surble, S. Grain size-dependent electrical properties of La1. 95Sr0. 05Zr2O7-δ as potential Proton Ceramic Fuel Cell electrolyte. Solid State Ion. 2016, 298, 35–43. [Google Scholar] [CrossRef]
- Lee, W.; Kihm, K.D.; Kim, H.G.; Shim, S.; Lee, C.; Park, J.S.; Cheon, S.; Kwon, O.M.; Lim, G.; Lee, W. In-plane thermal conductivity of polycrystalline chemical vapor deposition graphene with controlled grain sizes. Nano lett. 2017, 17, 2361–2366. [Google Scholar] [CrossRef]
- Gur, S.; Sadat, M.R.; Frantziskonis, G.N.; Bringuier, S.; Zhang, L.; Muralidharan, K. The effect of grain-size on fracture of polycrystalline silicon carbide: A multiscale analysis using a molecular dynamics-peridynamics framework. Comput. Mater. Sci. 2019, 159, 341–348. [Google Scholar] [CrossRef]
- Zhang, J.; Xu, L.; Han, Y.; Zhao, L.; Xiao, B. New perspectives on the grain boundary misorientation angle dependent intergranular corrosion of polycrystalline nickel-based 625 alloy. Corros. Sci. 2020, 172, 108718. [Google Scholar] [CrossRef]
- Li, Z.-P.; Mori, T.; Auchterlonie, G.J.; Zou, J.; Drennan, J.; Miyayama, M. Diffusion and segregation along grain boundary at the electrolyte–anode interface in IT-SOFC. Solid State Ion. 2011, 191, 55–60. [Google Scholar] [CrossRef]
- Olyaeefar, B.; Ahmadi-Kandjani, S.; Asgari, A. Classical modelling of grain size and boundary effects in polycrystalline perovskite solar cells. Sol. Energy Mater. Sol. Cells 2018, 180, 76–82. [Google Scholar] [CrossRef]
- Nazem, H.; Dizaj, H.P.; Gorji, N.E. Modeling of Jsc and Voc versus the grain size in CdTe, CZTS and Perovskite thin film solar cells. Superlattices Microstruct. 2019, 128, 421–427. [Google Scholar] [CrossRef]
- Mastour, N.; Mejatty, M.; Bouchriha, H. Theoretical approach of the electroluminescence quenching in (polymer-CdSe quantum dot) nanocomposite. Superlattices Microstruct. 2015, 82, 461–471. [Google Scholar] [CrossRef]
- Korzhik, M.; Fedorov, A.; Dosovitskiy, G.; Anniyev, T.; Vasilyev, M.; Khabashesku, V. Nanoscale Engineering of Inorganic Composite Scintillation Materials. Materials 2021, 14, 4889. [Google Scholar] [CrossRef] [PubMed]
- Rudzik, T.J.; Seeley, Z.M.; Ryerson, F.J.; Cherepy, N.J.; Payne, S.A. Counter-ion effect on the diffusion behavior of Yb, Lu, and Nd ions in YAG transparent ceramics. Opt. Mater. X 2022, 13, 100132. [Google Scholar] [CrossRef]
- Fisher, J.C. Calculation of diffusion penetration curves for surface and grain boundary diffusion. J. Appl. Phys. 1951, 22, 74–77. [Google Scholar] [CrossRef]
- Whipple, R.T.P. Concentration contours in grain boundary diffusion. Lond. Edinb. Dublin Philos. Mag. J. Sci. 1954, 45, 1225–1236. [Google Scholar] [CrossRef]
- Le Claire, A.D. The analysis of grain boundary diffusion measurements. Br. J. Appl. Phys. 1963, 14, 351–356. [Google Scholar] [CrossRef]
- Harrison, L.G. Influence of dislocations on diffusion kinetics in solids with particular reference to the alkali halides. Farad. Trans. 1961, 57, 1191–1199. [Google Scholar] [CrossRef]
- Divinski, S.V.; Lee, J.S.; Herzig, C. Grain Boundary Diffusion and Segregation in Compacted and Sintered Nanocrystalline Alloys. J. Metastable Nanocrystalline Mater. 2004, 19, 55–68. [Google Scholar] [CrossRef]
- Belova, I.V.; Fiedler, T.; Kulkarni, N.; Murch, G.E. The Harrison diffusion kinetics regimes in solute grain boundary diffusion. Philos. Mag. 2012, 92, 1748–1763. [Google Scholar] [CrossRef]
- Belova, I.V.; Murch, G.E. Investigation of Harrison Type-A, B and Intermediate AB Kinetics Regimes in Grain Boundary Diffusion. Defect Diffus. Forum. 2009, 283–286, 697–704. [Google Scholar] [CrossRef]
- Belova, I.V.; Murch, G.E.; Fiedler, T. Parametric Analysis of the Classification of Harrison Kinetics Regimes in Grain Boundary Diffusion. Defect Diffus. Forum. 2010, 297–301, 1226–1231. [Google Scholar] [CrossRef]
- Glienke, M.; Vaidya, M.; Guguraj, K.; Daum, L.; Tas, B.; Rogal, L.; Pradeep, K.G.; Divinski, S.V.; Wilde, G. Grain boundary diffusion in CoCrFeMnNi high entropy alloy: Kinetic hints towards a phase decomposition. Acta Mater. 2020, 195, 304–316. [Google Scholar] [CrossRef]
- Oudriss, A.; Creus, J.; Bouhattate, J.; Conforto, E.; Berziou, C.; Savall, C.; Feaugas, X. Grain size and grain-boundary effects on diffusion and trapping of hydrogen in pure nickel. Acta Mater. 2012, 60, 6814–6828. [Google Scholar] [CrossRef]
- Deng, J.; Ko, H.; Demkowitz, P.; Morgan, D.; Szlufarska, I. Grain boundary diffusion of Ag through polycrystalline SiC in TRISO fuel particles. J. Nucl. Mater. 2015, 467, 332–340. [Google Scholar] [CrossRef] [Green Version]
- Chepak-Gizbrekht, M.V.; Knyazeva, A.G. Grain-boundary diffusion modeling in a microstructural material. Comput. Mater. Sci. 2020, 184, 109896. [Google Scholar] [CrossRef]
- Zhang, Z.; Chen, C.; Liu, G.; Li, C.; Kurosaka, S.; Nagao, S.; Suganuma, K. Enhancement of bonding strength in Ag sinter joining on Au surface finished substrate by increasing Au grain-size. Appl. Surf. Sci. 2019, 485, 468–475. [Google Scholar] [CrossRef]
- Lacaille, V.; Morel, C.; Feulvarch, E.; Kermouche, G.; Bergheau, J.M. Finite element analysis of the grain size effect on diffusion in polycrystalline materials. Comput. Mater. Sci. 2014, 95, 187–191. [Google Scholar] [CrossRef]
- Gryaznov, D.; Fleig, J.; Maier, J. Finite element simulation of diffusion into polycrystalline materials. Solid State Sci. 2008, 10, 754–760. [Google Scholar] [CrossRef]
- Zhang, J.; Fryauf, D.M.; Garrett, M.; Logeeswaran, V.J.; Sawabe, A.; Islam, M.S.; Kobayashi, N.P. Phenomenological model of the growth of ultrasmooth silver thin films deposited with a germanium nucleation layer. Langmuir 2015, 31, 7852–7859. [Google Scholar] [CrossRef] [PubMed]
- Ciesielski, A.; Skowronski, L.; Gorecka, E.; Kierdaszuk, J.; Szoplik, T. Growth model and structure evolution of Ag layers deposited on Ge films. Beilstein J. Nanotechnol. 2018, 9, 66–76. [Google Scholar] [CrossRef] [Green Version]
- Smith, C.S. Some elementary principles of polycrystalline microstructure. Metall. Rev. 1964, 9, 1–48. [Google Scholar] [CrossRef]
- Brockman, R.A.; Pilchak, A.L.; Porter III, W.J.; John, R. Estimation of grain boundary diffusivity in near-α titanium polycrystals. Scripta Mater. 2011, 65, 513–515. [Google Scholar] [CrossRef]
- Chen, G.; Sun, W.; Luo, Y.; He, Y.; Zhang, X.; Zhu, B.; Li, W.; Liu, X.; Ding, Y.; Li, Y.; et al. Advanced fuel cell based on new nanocrystalline structure Gd0. 1Ce0. 9O2 electrolyte. ACS Appl. Mater. Interfaces 2019, 11, 10642–10650. [Google Scholar] [CrossRef]
- Iwaoka, H.; Arita, M.; Horita, Z. Hydrogen diffusion in ultrafine-grained palladium: Roles of dislocations and grain boundaries. Acta Mater. 2016, 107, 168–177. [Google Scholar] [CrossRef]
- Sowjanya, C.; Mandal, R.; Pratihar, S.K. Grain size dependent electrical conductivity, chemical surface exchange and bulk diffusion coefficient of La0.5Sr0.5Al0.2Fe0.8O3-δ. J. Alloy. Compd. 2020, 818, 152831. [Google Scholar] [CrossRef]
- Jiang, L.; Fu, C.T.; Leng, B.; Jia, Y.Y.; Ye, X.X.; Zhang, W.Z.; Bai, Q.; Xia, S.; Li, Z.J.; Liu, F.; et al. Influence of grain size on tellurium corrosion behaviors of GH3535 alloy. Corros. Sci. 2019, 148, 110–122. [Google Scholar] [CrossRef]
- Li, W.; Yu, W.; Xu, Q.; Zhou, J.; Nan, H.; Yin, Y.; Shen, X. Understanding the atomistic deformation mechanisms of polycrystalline γ-TiAl under nanoindentation: Effect of lamellar structure. J. Alloy. Compd. 2020, 828, 154443. [Google Scholar] [CrossRef]
- Edwards, T.E.J.; Di Gioacchino, F.; Clegg, W.J. An experimental study of the polycrystalline plasticity of lamellar titanium aluminide. Int. J. Plast. 2019, 118, 291–319. [Google Scholar] [CrossRef]
- Doan, D.Q.; Fang, T.H.; Chen, T.H. Effects of grain and twin boundary on friction and contact characteristics of CuZrAl nanocrystallines. Appl. Surf. Sci. 2020, 524, 146458. [Google Scholar] [CrossRef]
- Nagao, Y. Progress on highly proton-conductive polymer thin films with organized structure and molecularly oriented structure. Sci. Technol. Adv. Mater. 2020, 21, 79–91. [Google Scholar] [CrossRef] [Green Version]
- Lütjering, G.E.R.D. Influence of processing on microstructure and mechanical properties of (α+ β) titanium alloys. Mater. Sci. Eng. A 1998, 243, 32–45. [Google Scholar] [CrossRef]
- Wang, Y.; Chen, R.; Cheng, X.; Zhu, Y.; Zhang, J.; Wang, H. Effects of microstructure on fatigue crack propagation behavior in a bi-modal TC11 titanium alloy fabricated via laser additive manufacturing. J. Mater. Sci. Technol. 2019, 35, 403–408. [Google Scholar] [CrossRef]
- Shi, X.; Zeng, W.; Shi, C.; Wang, H.; Jia, Z. The fracture toughness and its prediction model for Ti–5Al–5Mo–5V–1Cr–1Fe titanium alloy with basket-weave microstructure. J. Alloy. Compd. 2015, 632, 748–755. [Google Scholar] [CrossRef]
- Shao, Y.; Liu, C.; Yan, Z.; Li, H.; Liu, Y. Formation mechanism and control methods of acicular ferrite in HSLA steels: A review. J. Mater. Sci. Technol. 2018, 34, 737–744. [Google Scholar] [CrossRef]
- Lapin, J.; Gebura, M.; Pelachova, T.; Nazmy, M. Coarsening kinetics of cuboidal γ’precipitates in single crystal nickel base superalloy CMSX-4. Kov. Mater. 2008, 46, 313–322. [Google Scholar]
- Wilson, B.C.; Hickman, J.A.; Fuchs, G.E. The effect of solution heat treatment on a single-crystal Ni-based superalloy. JOM 2003, 55, 35–40. [Google Scholar] [CrossRef]
- Birol, Y. Effect of solution heat treatment on the age hardening capacity of dendritic and globular AlSi7Mg0. 6 alloys. Int. J. Mater. Res. 2010, 101, 439–444. [Google Scholar] [CrossRef]
- Zhang, X.F.; Zhao, J.Z. Dendritic microstructure formation in a directionally solidified Al–11.6 Cu–0.85 Mg alloy. J. Cryst. Growth 2014, 391, 52–58. [Google Scholar] [CrossRef]
- Ares, A.E.; Gassa, L.M. Corrosion susceptibility of Zn–Al alloys with different grains and dendritic microstructures in NaCl solutions. Corros. Sci. 2012, 59, 290–306. [Google Scholar] [CrossRef]
- Li, C.; Li, J.C.; Zhao, M.; Jiang, Q. Effect of aluminum contents on microstructure and properties of AlxCoCrFeNi alloys. J. Alloy. Compd. 2010, 504, S515–S518. [Google Scholar] [CrossRef]
- Zhang, B.; Wei, L.; Gao, L.; Guo, H.; Xu, H. Microstructural characterization of PS-PVD ceramic thermal barrier coatings with quasi-columnar structures. Surf. Coat. Technol. 2017, 311, 199–205. [Google Scholar] [CrossRef]
- Tiron, V. Tungsten nitride coatings obtained by HiPIMS as plasma facing materials for fusion applications. Appl. Surf. Sci. 2017, 416, 878–884. [Google Scholar] [CrossRef]
- Benedetti, I.; Barbe, F. Modelling polycrystalline materials: An overview of three-dimensional grain-scale mechanical models. J. Multiscale Model. 2013, 5, 1350002. [Google Scholar] [CrossRef] [Green Version]
- Yu, H.C.; Choe, M.J.; Amatucci, G.G.; Chiang, Y.M.; Thornton, K. Smoothed boundary method for simulating bulk and grain boundary transport in complex polycrystalline microstructures. Comput. Mater. Sci. 2016, 121, 14–22. [Google Scholar] [CrossRef] [Green Version]
- Naderi, S.; Dean, J.S.; Zhang, M. Three-dimensional virtual microstructure generation of porous polycrystalline ceramics. Ceram. Int. 2019, 45, 21647–21656. [Google Scholar] [CrossRef]
- Falco, S.; Jiang, J.; De Cola, F.; Petrinic, N. Generation of 3D polycrystalline microstructures with a conditioned Laguerre-Voronoi tessellation technique. Comput. Mater. Sci. 2017, 136, 20–28. [Google Scholar] [CrossRef]
- Romanova, V.; Balokhonov, R. A method of step-by-step packing and its application in generating 3D microstructures of polycrystalline and composite materials. Eng. Comput. 2021, 37, 241–250. [Google Scholar] [CrossRef]
- Jaseliūnaitė, J.; Galdikas, A. Kinetic modeling of grain boundary diffusion: The influence of grain size and surface processes. Materials 2020, 13, 1051. [Google Scholar] [CrossRef] [PubMed] [Green Version]
- Tannehill, J.C.; Anderson, D.A.; Pletcher, R.H. Computational Fluid Mechanics and Heat Transfer, 2nd ed.; Taylor & Francis: Washington, DC, USA, 1997; pp. 220–224. [Google Scholar]
- Holm, E.A.; Srolovitz, D.J.; Cahn, J.W. Microstructural evolution in two-dimensional two-phase polycrystals. Acta Metall. Et Mater. 1993, 41, 1119–1136. [Google Scholar] [CrossRef] [Green Version]
Figure 1.
A schematic of the computational domain and boundary conditions.

Figure 2.
Depth profiles of diffusant in monocrystal material at a selected time instance.

Figure 3.
Generated polycrystalline coating morphologies.

Figure 4.
Concentration contours of diffusant (t = 5 mln and 10 mln), dashed lines represent the boundaries between different diffusant concentration sections.
Figure 4.
Concentration contours of diffusant (t = 5 mln and 10 mln), dashed lines represent the boundaries between different diffusant concentration sections.

Figure 5.
Concentration in case 1 and case 2 for several morphologies ((a) t = 5 mln and (b) 10 mln).
Figure 5.
Concentration in case 1 and case 2 for several morphologies ((a) t = 5 mln and (b) 10 mln).

Figure 6.
Local concentration curves of Bi-modal morphology in (a) the grain close to the surface; (b) the grain closest to the surface; (c) grain far from the surface.
Figure 6.
Local concentration curves of Bi-modal morphology in (a) the grain close to the surface; (b) the grain closest to the surface; (c) grain far from the surface.

Figure 7.
Averaged concentration profiles of (a) Case 1 Typical and (b) Case 2 Bi-modal morphologies (fray dashed line—layer average grayscale number).
Figure 7.
Averaged concentration profiles of (a) Case 1 Typical and (b) Case 2 Bi-modal morphologies (fray dashed line—layer average grayscale number).

Figure 8.
Evolution of an average concentration.

Figure 9.
(a) Average concentration increase rate on the average concentration, (b) ratios of average concentration increase rate on the average concentration.
Figure 9.
(a) Average concentration increase rate on the average concentration, (b) ratios of average concentration increase rate on the average concentration.

Figure 10.
Average diffusion rate (Dgb/Dg = 1000, = 0.5) dependency on (a) Dtotal, (b) Dgb.

Figure 11.
(a,c) Overall concentration change rate dependency on average concentration, (b,d) fraction of total rate dependency on average concentration.
Figure 11.
(a,c) Overall concentration change rate dependency on average concentration, (b,d) fraction of total rate dependency on average concentration.

Figure 12.
Average concentration evolution.


Table 1.
Comparison of two-dimensional volume and coefficient agb for each morphology.
| Morphology | |||||
|---|---|---|---|---|---|
| Typical | 600,000 | 53,698 | 546,302 | 0.098 | 0.0741 |
| Bi-modal | 105,453 | 494,547 | 0.213 | 0.1182 | |
| Semi-lamellar | 135,484 | 464,516 | 0.292 | 0.1436 |
Table 2.
Values of diffusion coefficients for all cases.
| Morphology | Diffusivity | Case 1 | Case 2 |
|---|---|---|---|
| Typical | Dgb | 0.1 | 0.1 |
| Dg | 0.0001 | 0.00001 | |
| Dgb/Dg | 1000 | 10000 | |
| Dtotal | 0.00750 | 0.00742 | |
| Bi-modal | Dgb | 0.1 | 0.1 |
| Dg | 0.0001 | 0.00001 | |
| Dgb/Dg | 1000 | 10000 | |
| Dtotal | 0.01191 | 0.01183 | |
| Semi-lamellar | Dgb | 0.1 | 0.1 |
| Dg | 0.0001 | 0.00001 | |
| Dgb/Dg | 1000 | 10000 | |
| Dtotal | 0.01445 | 0.01437 |
Publisher’s Note: MDPI stays neutral with regard to jurisdictional claims in published maps and institutional affiliations. |
© 2022 by the authors. Licensee MDPI, Basel, Switzerland. This article is an open access article distributed under the terms and conditions of the Creative Commons Attribution (CC BY) license (https://creativecommons.org/licenses/by/4.0/).
Share and Cite
MDPI and ACS Style
Jaseliūnaitė, J.; Povilaitis, M.; Galdikas, A. Kinetic Modeling of Grain Boundary Diffusion: Typical, Bi-Modal, and Semi-Lamellar Polycrystalline Coating Morphologies. Coatings 2022, 12, 992. https://doi.org/10.3390/coatings12070992
AMA Style
Jaseliūnaitė J, Povilaitis M, Galdikas A. Kinetic Modeling of Grain Boundary Diffusion: Typical, Bi-Modal, and Semi-Lamellar Polycrystalline Coating Morphologies. Coatings. 2022; 12(7):992. https://doi.org/10.3390/coatings12070992
Chicago/Turabian StyleJaseliūnaitė, Justina, Mantas Povilaitis, and Arvaidas Galdikas. 2022. "Kinetic Modeling of Grain Boundary Diffusion: Typical, Bi-Modal, and Semi-Lamellar Polycrystalline Coating Morphologies" Coatings 12, no. 7: 992. https://doi.org/10.3390/coatings12070992
Note that from the first issue of 2016, this journal uses article numbers instead of page numbers. See further details here.