
Optimization of Parameters for Protection of Materials by Primer Application


Mechanical Engineering Faculty in Slavonski Brod, University of Slavonski Brod, Trg I. B. Mažuranić 2, 35000 Slavonski Brod, Croatia
*
Author to whom correspondence should be addressed.
Coatings 2022, 12(3), 413; https://doi.org/10.3390/coatings12030413
Submission received: 24 February 2022
/
Revised: 16 March 2022
/
Accepted: 18 March 2022
/
Published: 20 March 2022
Abstract
:The protective properties of coating systems usually depend on their base layer, since its characteristics and chemical composition are greatly responsible for prevention of corrosion development. Moreover, a good primer as a base coating has to provide good adhesion between the coating system and the substrate material, as well as good cohesion, i.e., coating strength. The described experiment aimed to determine the influence of input parameters (anticorrosive pigment content, conditioning time, dry film thickness) on the adhesion properties of the coating. The optimization of input parameters was achieved by the pull-off test in order to determine their maximum values. For the purpose of imitating aggressive atmosphere of service conditions, the experiment was run in a salt spray chamber, in which samples were cyclically sprayed with 5% sodium chloride (NaCl) solution for 120 h. The obtained mathematical model makes it possible to define the optimal values of the input variables for the defined values of the required property, i.e., the adhesion properties of the applied primer for certain exploitative conditions.
1. Introduction
Application of organic coatings as a surface protection technology aims to create a barrier between the substrate material and the aggressive environment. Coatings are a typical method of preventing the development of corrosion mechanisms [1]. Organic coatings are used in many industrial branches, such as shipbuilding, automotive industry, aeronautics, manufacture of oil storage containers, etc. [2,3,4,5]. Accordingly, it is estimated that as many as 3/4 of metal surfaces are protected by organic coatings [6]. The purpose of protective coatings is to prevent the development of corrosion mechanisms by creating a barrier between the substrate material and the environment, which is referred to as a passive method of protection. Conversely, coatings also serve as active protectors by providing inhibition, neutralization of the medium, or cathodic protection. In addition, primers are expected to have good cohesion properties, i.e., to provide a layer of high strength and to ensure good bonding with the intercoat, all with the aim of ensuring good adhesion between the protective coating system and the substrate material to avoid corrosion mechanisms. Moreover, coatings are required to have good elastic properties, so that they can comply with any dilations of the substrate on which they are applied [6]. For these reasons, this research is focused on investigating the properties of a primer, more specifically an epoxy primer. Among organic coatings, epoxy coatings are given the greatest importance, due to their good mechanical properties, high thermal stability, good chemical resistance and corrosion resistance, and relatively low production costs [7,8]. Previous research has shown good results in the application of two-component epoxy coatings in different atmospheric conditions, so better corrosion resistance and preservation of steel is achieved by applying the same in marine, industrial and urban atmospheres [9,10,11]. One example of the successful application of these coatings is research conducted on coatings for use in the automotive industry. Four different epoxy primers were tested on four different types of material that served as a base for application, and mechanical tests showed good application results [12]. Additionally, except in different operating conditions, these coatings can be applied on different substrates. Although most of the structures are made of general structural carbon steel and the application of these coatings is the greatest tool for their protection, they can be used equally well in protecting and improving the corrosion resistance of structures made of materials with different chemical composition. Tests have proven the successful application of epoxy coatings in the protection of aluminum alloys, where the corrosion properties are further improved by adding phosphate pigments and in the second case by adding magnesium particles, all with the aim of achieving potential difference between base material and protective layer [13,14]. The application of epoxy coatings was also studied in the additional protection of stainless steels, where tests were conducted with the aim of studying the problem of adhesion between the base material and the coating [15]. The experiment started by determining the anticorrosive pigment content, dry film thickness and conditioning time as the input variables. The adhesion force as an output variable was determined by a pull-off test. It defines the adhesion properties of the coating, based on which optimal values of input variables are determined to observe desired properties in accordance with the set criteria. In this experiment, desired properties refer to the highest possible value of adhesion force obtained by the pull-off test, i.e., to the best possible adhesion. This definition of mathematical models allows the correct choice of protection parameters to be made. For specific operating conditions, it could be determined to which value each input variable should be changed. The corrosion category tested here is C3 (according to HRN EN ISO 19244-2), which refers to internal examples of the environment such as production plants with certain air pollution and low humidity, e.g., food processing plants, laundries, breweries, dairies. In contrast, examples of external environments for this category include urban and industrial atmospheres with moderate sulfur dioxide pollution and coastal areas with low salinity. Based on the obtained and defined mathematical models, it is possible to define specific values of input variables in order to achieve the best possible response value, i.e., adhesion of the primer to the surface of the protected material. For example, for a defined value of the dry film thickness of the coating, the proportion of anti-corrosion pigment and the conditioning time can be automatically determined, thus providing the required properties with set limits, in this case the maximization of adhesion. Likewise, if there is a change in, for example, the thickness of the dry coating film, the values of other parameters that will give the best results are defined again. The novelty of making such mathematical models is thus manifested in the achievement of a precisely defined property and the required characteristics of the applied coating for each set condition. To determine the referential values for input variables, the authors reviewed published literature dealing with this topic. It is important to mention that the reviewed studies usually dealt with just one of the components selected in this experiment as the input variable, and no research was found that studied all three components and their interaction. Thus, the presented research was required and justified. The values of the anticorrosive pigment content previously studied by some authors ranged from 2.6% [16], 3.5% [17], 5% [18], and 6% [19] up to 10% [20], and those values were used in this experiment as a basis for the determination of the same input variable. The values of the dry film thickness reported in published studies ranged from 60 ± 6 µm [21], 100 ± 25 µm [13], 120 µm [22], 130 ± 5 µm [23], and 170 ± 10 µm [18] up to 190 µm [9]. Conditioning time, which defines the time interval required to achieve good cohesion force within the coating itself, as well as good adhesion force between the coating and the substrate material, also varied in previous studies. Lower values of conditioning time ranged from 24 h at a room temperature with an additional 8 h at 60 ± 2 °C [24], 24 h at 25 °C with an additional 24 h at 60 °C [23], 5 days [25], and 7 days [20] up to 14 days [26] and 15 days [27].
The main findings from this experimental research are manifested in the ability to define the optimal anticorrosive pigment content in the coating and the optimal dry film thickness of the coating in order to provide satisfactory adhesive properties under certain operating conditions. Additionally, it was possible to determine the optimal conditioning time after application of the coating, that is, to define the optimal time interval after which satisfactory cohesion properties could be achieved in the coating, as well as the adhesion properties between the coating and the base material. Ultimately, this study demonstrates the possibility of achieving the desired physical properties of the coating by selecting the optimal parameters in the form of anti-corrosion pigment as well as technological parameters (dry film thickness and conditioning time) for the set goal (objective function defined by a mathematical model).
2. Experimental Research
Anticorrosive pigment content, dry film thickness and conditioning time affected the adhesion properties, which were tested by the pull-off method. Mathematical model was applied for determination of dependence of adhesion properties on input variables, and its functional dependence resulted from implemented experimental research and analysis of obtained data. The experiment proceeded with the optimization of input variables in order to obtain the best possible values of output variables for the set and desired criteria. The response surface methodology, i.e., the central composite design, was selected for experiment planning. Table 1 presents coded values of the factors.
As a method of planning experiments in this paper, the response surface method (RMS), i.e., the central composite design (CCD) was chosen. The central composite design belongs to the group of higher-order experiments, i.e., to non-factorial plans where each of the input variables varies at five levels, with not all levels are combined in the planning. As a higher-order experiment encompasses a set of mathematical and statistical methods applied to optimize the process, if k represents the number of observed factors, then the central composite plan of the experiment consists of factor states in the vertices (2k), states in the axes (2k), and central states of the experiment. Accordingly, by Formula (1), it is possible to calculate the number of measurements to be performed using this type of analysis of input variables [28]:
where N is the number of experiments, k is the number of factors, and n is the number of repetitions of the central point.
For each categorical factor condition (dry film thickness), there were five repetitions at the focal points. From all of the above, it follows that the number of thinner experiments was equal to 39.
Within the experiment, specimens were made out of S235JR structural steel, an overview of the chemical composition of which is given in Table 2 [29]. Most of the structures are made of general structural steel, and as mentioned in the introductory part, most of them (3/4) are protected by organic coatings. For this reason, the mentioned material was selected for the implementation of the experimental part of the research. Additionally, due to its lower corrosion resistance [30], it is more convenient to study the protective effect of the applied coating. The dimensions of the specimens were 150 mm × 100 mm × 2 mm. The surface used for application of the coating was prepared according to the HRN EN ISO 12944-4 standard, with the required quality of Sa 2.5 according to the HRN ISO EN 8501-1 standard. Each specimen was visually inspected, and its surface roughness was measured 20 times in order to obtain the mean value. If the mean value of roughness ranged from 40–70 μm, the specimen was appropriate for this experiment.
The coating was applied at the prepared specimens’ surface by airless spraying. Thicknesses of the applied coating layers are shown in Table 1 along with the coded values of the experiment plan. There were 15 measurements performed for each specimen, and the mean value of the dry film thickness had to be within the required limits. The specimens were then placed in a salt spray chamber and cyclically sprayed with 5% sodium chloride (NaCl) solution. Due to the high concentration of chlorides dissolved in the electrolyte, higher conductivity occurs. This enables the ion exchange in a higher concentration, which greatly accelerates the development of corrosion mechanisms. In this way, accelerated laboratory tests are performed, where results are obtained in a shorter period of time. Furthermore, it allows faster classification of the protective system characteristics, which saves valuable time in the process of development and production of coatings. Determined category of corrosivity is C3 for low durability (≤7 years) according to the HRN EN ISO 19244-2 standard. The duration of testing in the salt spray chamber was set to 120 h, according to HRN EN ISO 9227 standard.
Testing of Adhesion Properties by the Pull-Off Method
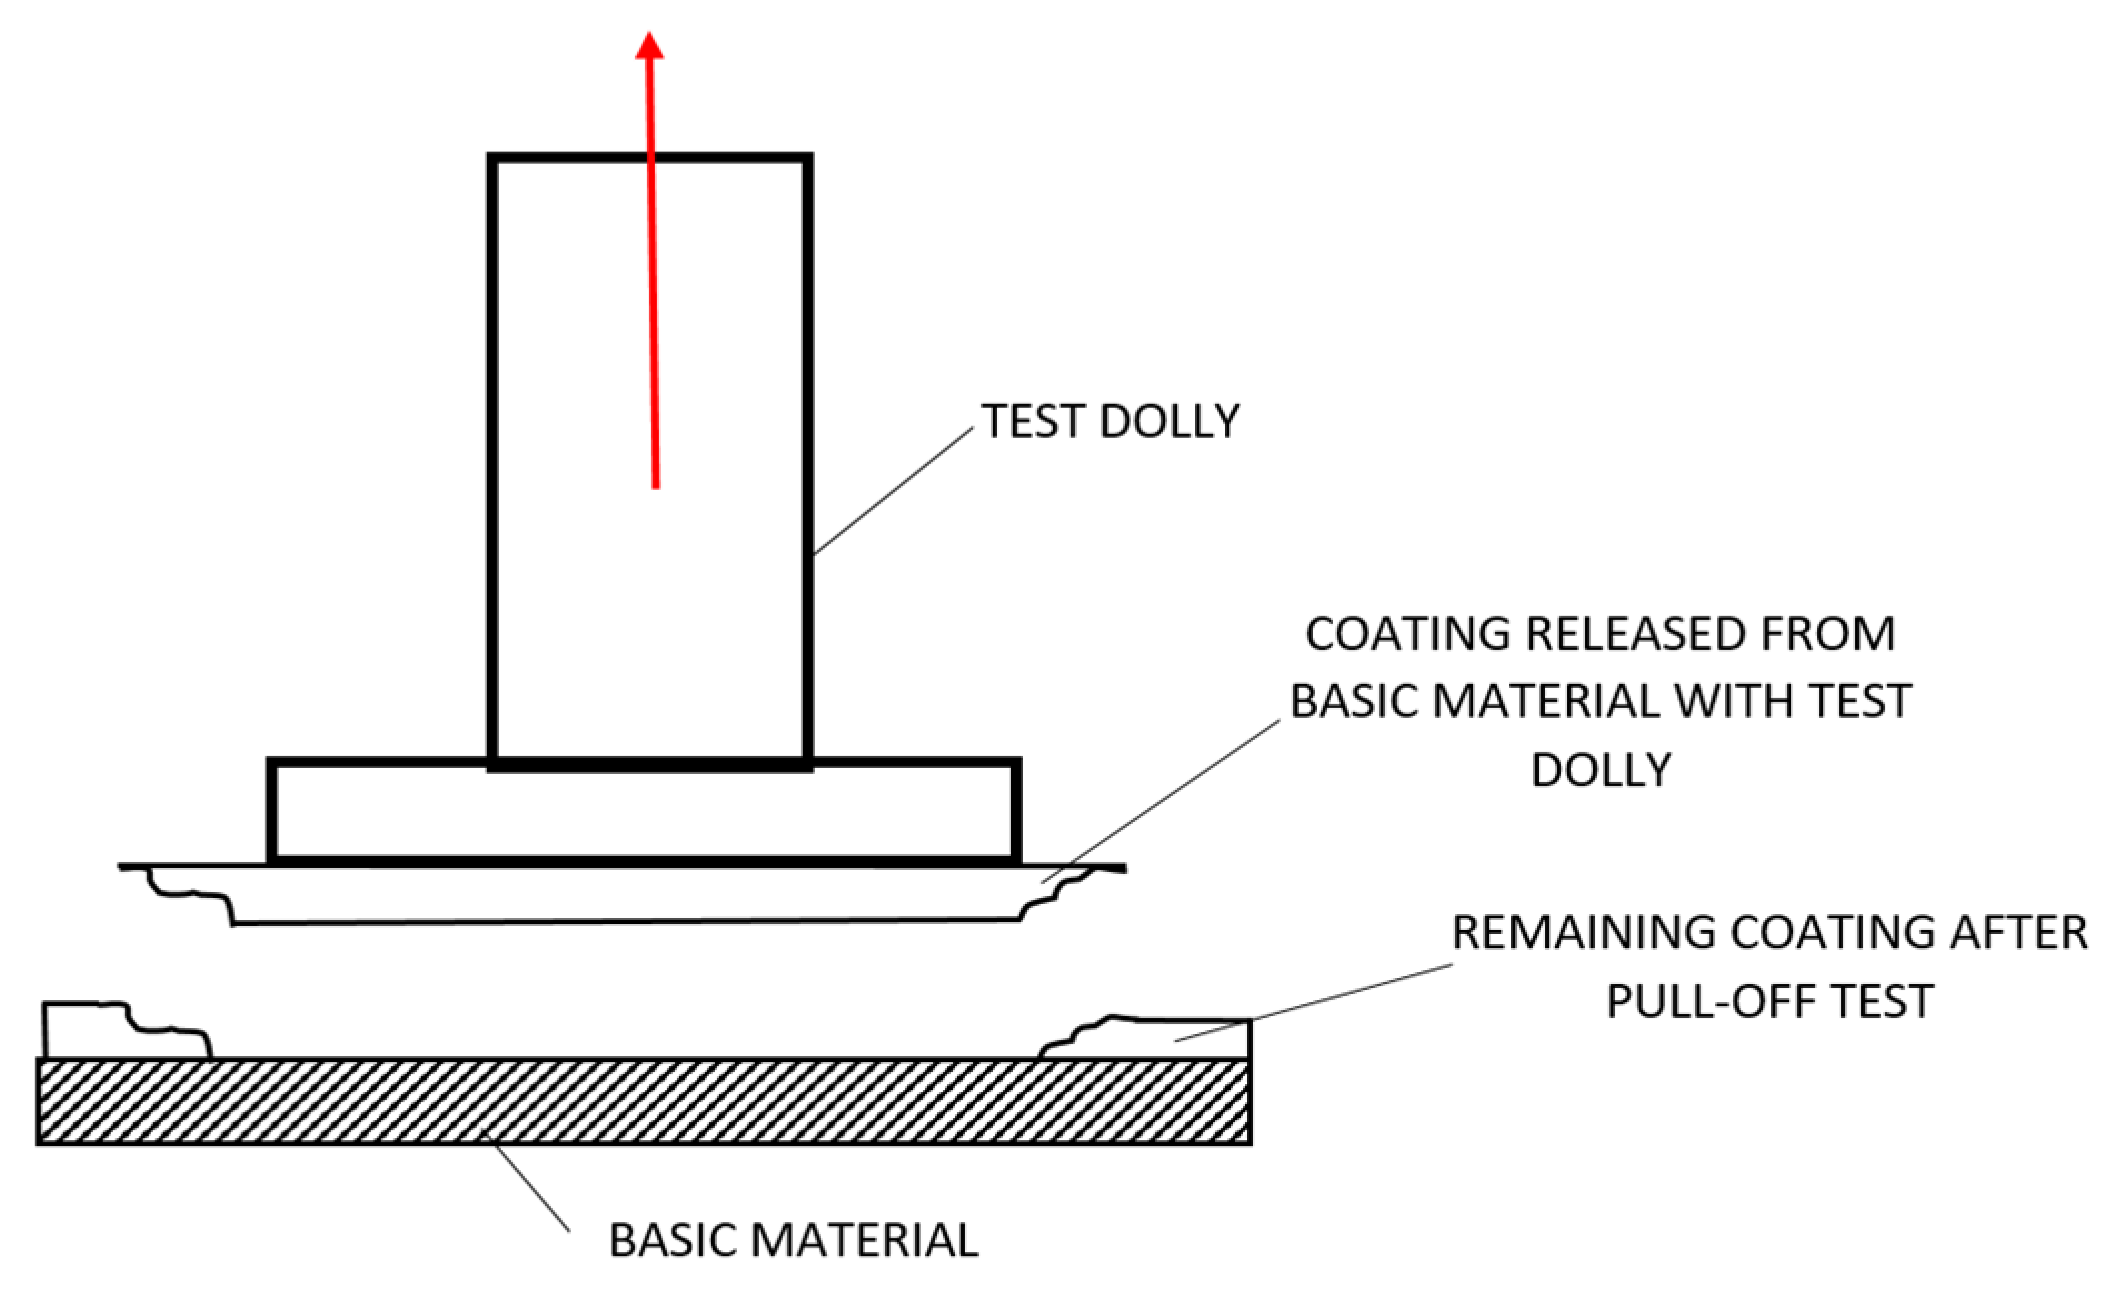
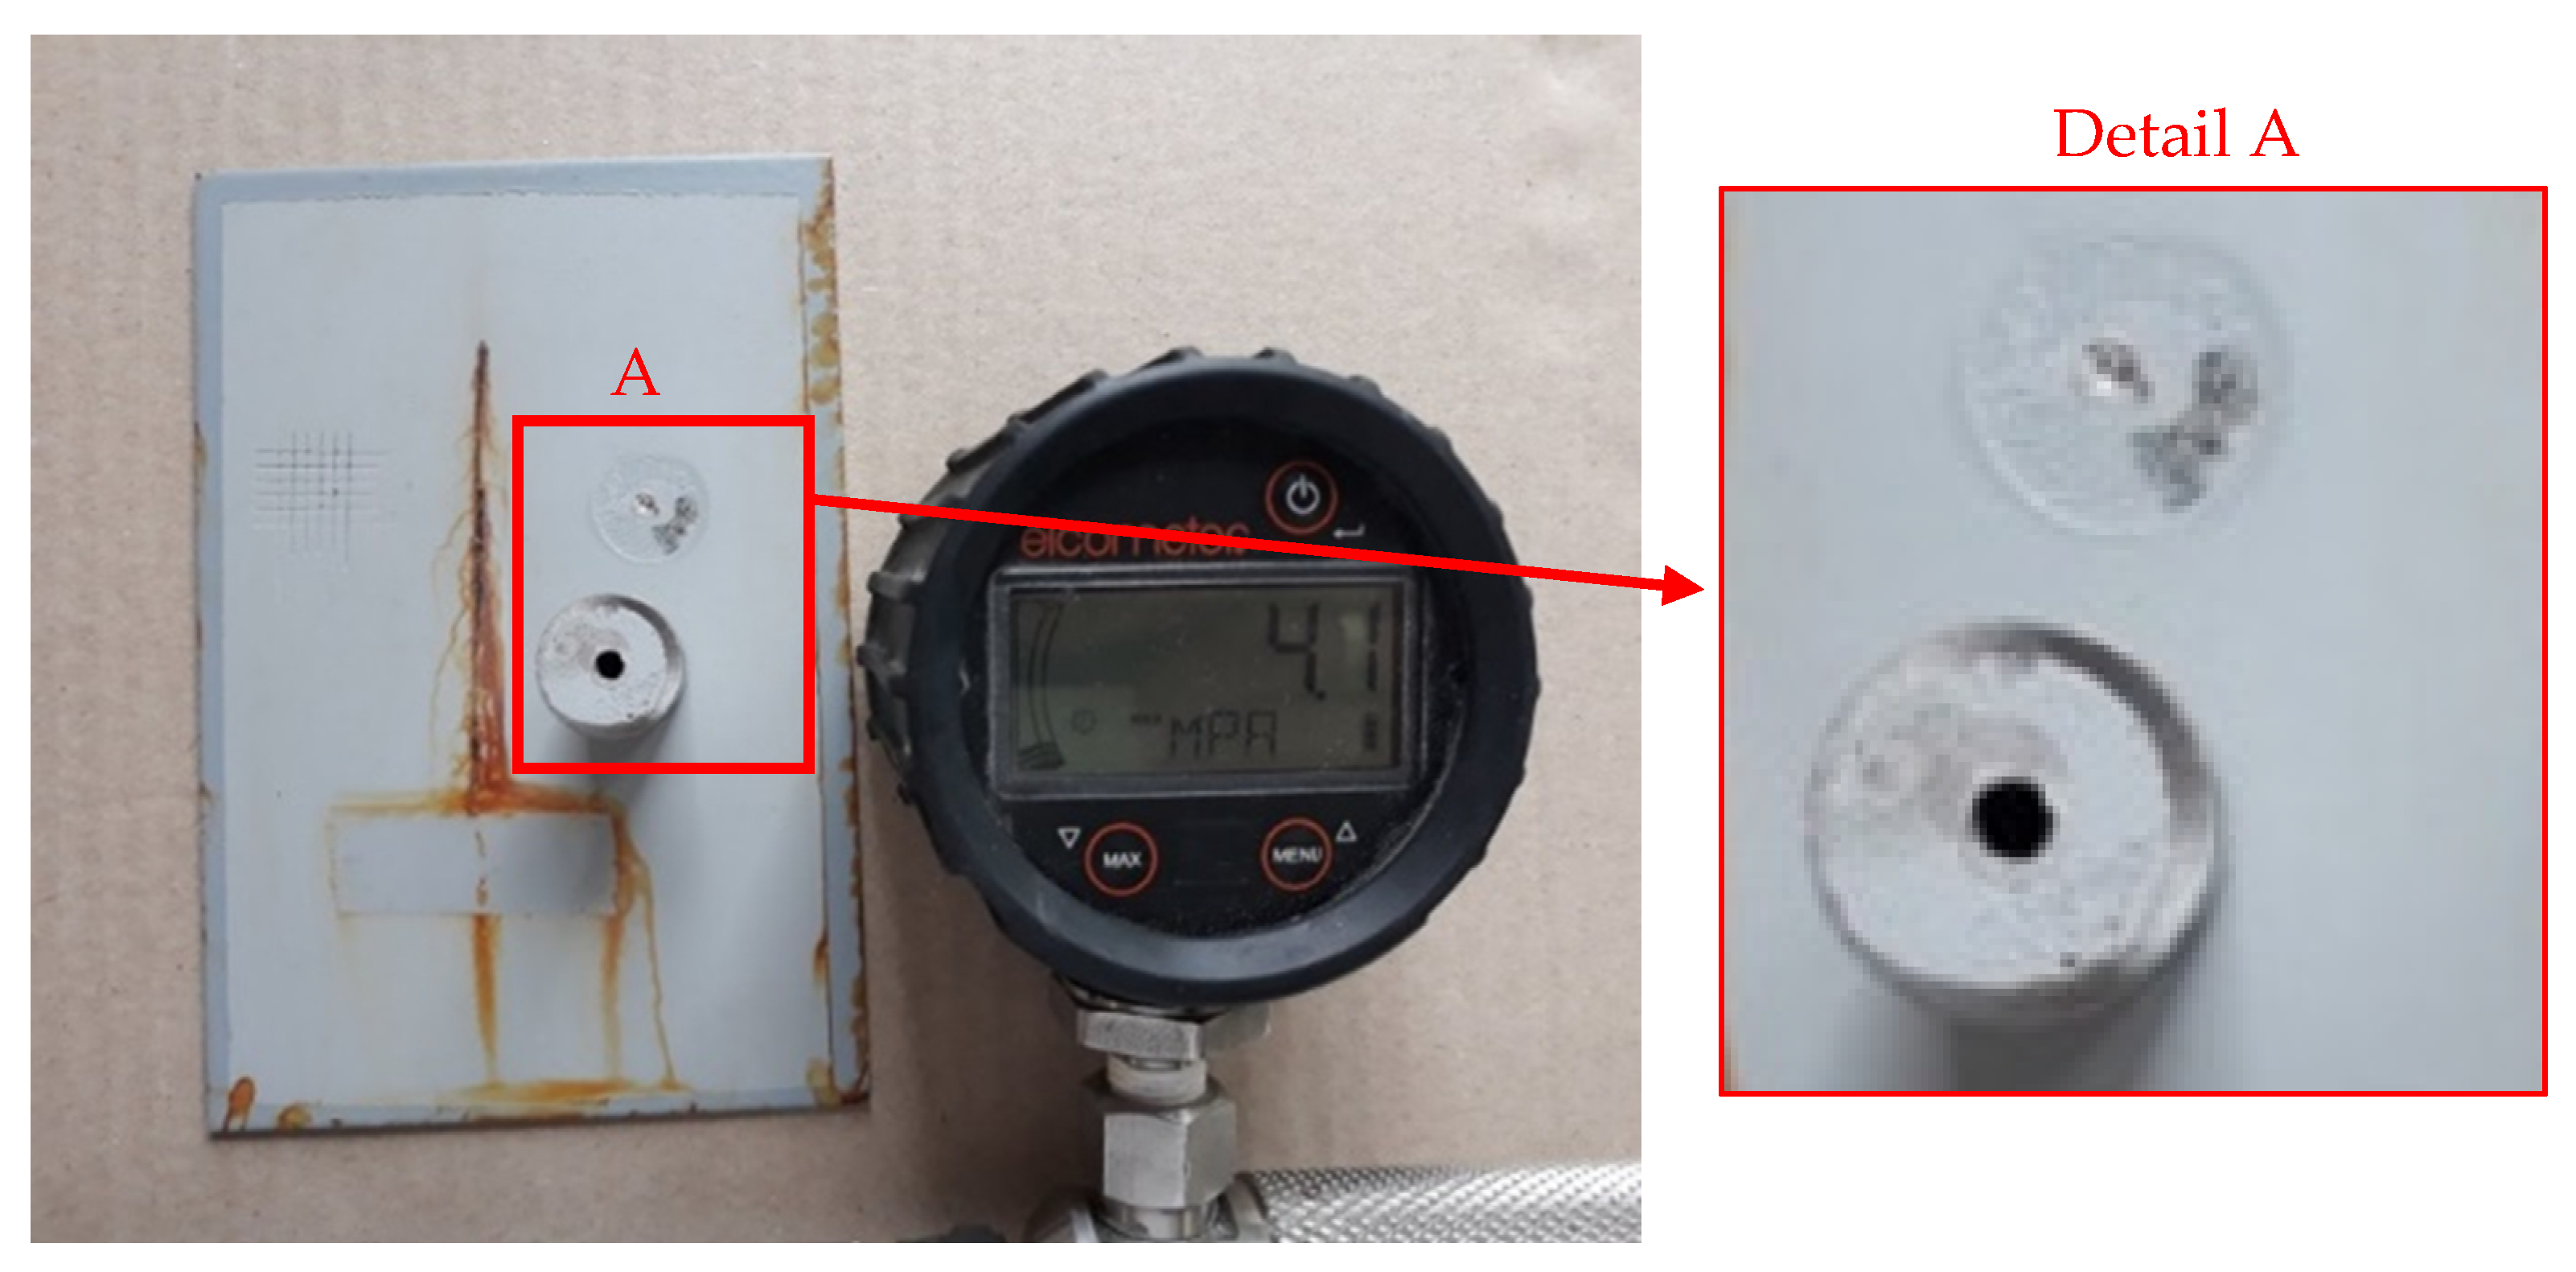
Testing of adhesion properties is important, because the quality of overall protection against corrosion greatly depends on adhesion. Poor adhesion properties can jeopardize even the extremely high quality of the coating itself, because, without good adhesion to the substrate, the coating will not deliver adequate protective effect. There are several ways to test adhesion or certain mechanical properties associated with adhesion, such as specimen bending, notching, and testing by the pull-off method. The equipment used for the pull-off test consisted of Elcometer 108 Hydraulic Adhesion Testers (Elcometer, Aalen, Germany). Figure 1 shows the scheme of the pull-off test, while Figure 2 shows the specimen after the pull-off test.
The pull-off test, used as a method of testing the adhesion properties in this experiment, was performed according to the HRN EN ISO 4624 standard. Within this method, the testing procedure consisted of several steps. The first step was the cleaning of the coated surface of the specimens in order to remove foreign particles, so that the test probe could be properly glued with two-component adhesive to the tested surface. When the adhesive was completely dry, the test probe was connected to a device that gradually increased the magnitude of applied force in order to separate the probe from the specimen. The magnitude of applied force at which the probe separated from the specimen was recorded as the adhesion strength of the coating [31].
3. Analysis of Research Results and Discussion
The obtained research results are presented as arithmetic means of the response, as listed in Table 3. Statistical analysis was completed in the Design Expert software.
3.1. Presentation of Results Obtained by Measurement of Adhesion Properties (Pull-Off Method)
Analysis of the results obtained for this experiment (Table 3) showed that the minimum response value (pull-off) was 4.1 MPa, while the maximum value was 5.3 MPa. The arithmetic mean of the response was 4.62 MPa, and the standard deviation was 0.2833 MPa. The quadratic model proved to be the best according to the values obtained by the pull-off test referring to adhesion properties. Table 4 states the indicators used in the selection of the model.
Table 5 shows the report obtained from the Design Expert with respect to the analysis of variance of the proposed and selected quadratic model. The model is used to present the dependence of adhesion force between the applied coating (pull-off) and the substrate surface on the input variables.
The coefficient of determination R2 was 0.8126. Adjusted coefficient of determination R2adj was 0.7363, and it was adjusted to the number of model members in relation to the number of runs. Predicted coefficient of determination R2pred was 0.5438.
Expression (2) describes regression model for the dependence of adhesion force (pull-off) between the applied coating and the substrate surface on the input variables (Factor A—anticorrosive pigment content; Factor B—conditioning time; Factor C—dry film thickness). Values of the mentioned variables are coded for high factor levels as +1, and for low factor levels as −1, according to Table 1. Expression (3) describes a regression model with actual factor values, where the factor C (dry film thickness) is equal to the value of D1. Expression (4) describes a regression model with actual factor values, where the factor C is equal to the value of D2, and Expression (5) describes a regression model with actual factor values, where the factor C is equal to the value of D3.
Pull-off = 4.8 − 0.1336 ∙ A + 0.0503 ∙ B − 0.0692 ∙ C1 − 0.1462 ∙ C2 − 0.0750 ∙ AB + 0.0035 ∙ AC1 + 0.0836 ∙ AC2 + 0.0683 ∙ BC1 − 0.0857 ∙ BC2 − 0.1437 ∙ A2 − 0.1438 ∙ B2
Pull-off = 3.758 + 0.108081 ∙ Anticorrosive pigment content + 0.007648 ∙ Conditioning time − 0.000195 ∙ Anticorrosive pigment content ∙ Conditioning time − 0.008984 ∙ Anticorrosive pigment content2 − 0.000016 ∙ Conditioning time2
Pull-off = 3.83017 + 0.128125 ∙ Anticorrosive pigment content + 0.006044 ∙ Conditioning time − 0.000195 ∙ Anticorrosive pigment content ∙ Conditioning time − 0.008984 ∙Anticorrosive pigment content2 − 0.000016 ∙Conditioning time2
Pull-off = 4.26747 + 0.085447 ∙ Anticorrosive pigment content + 0.007118 ∙ Conditioning time − 0.000195 ∙ Anticorrosive pigment content ∙ Conditioning time − 0.008984 ∙Anticorrosive pigment content2− 0.000016 ∙Conditioning time2
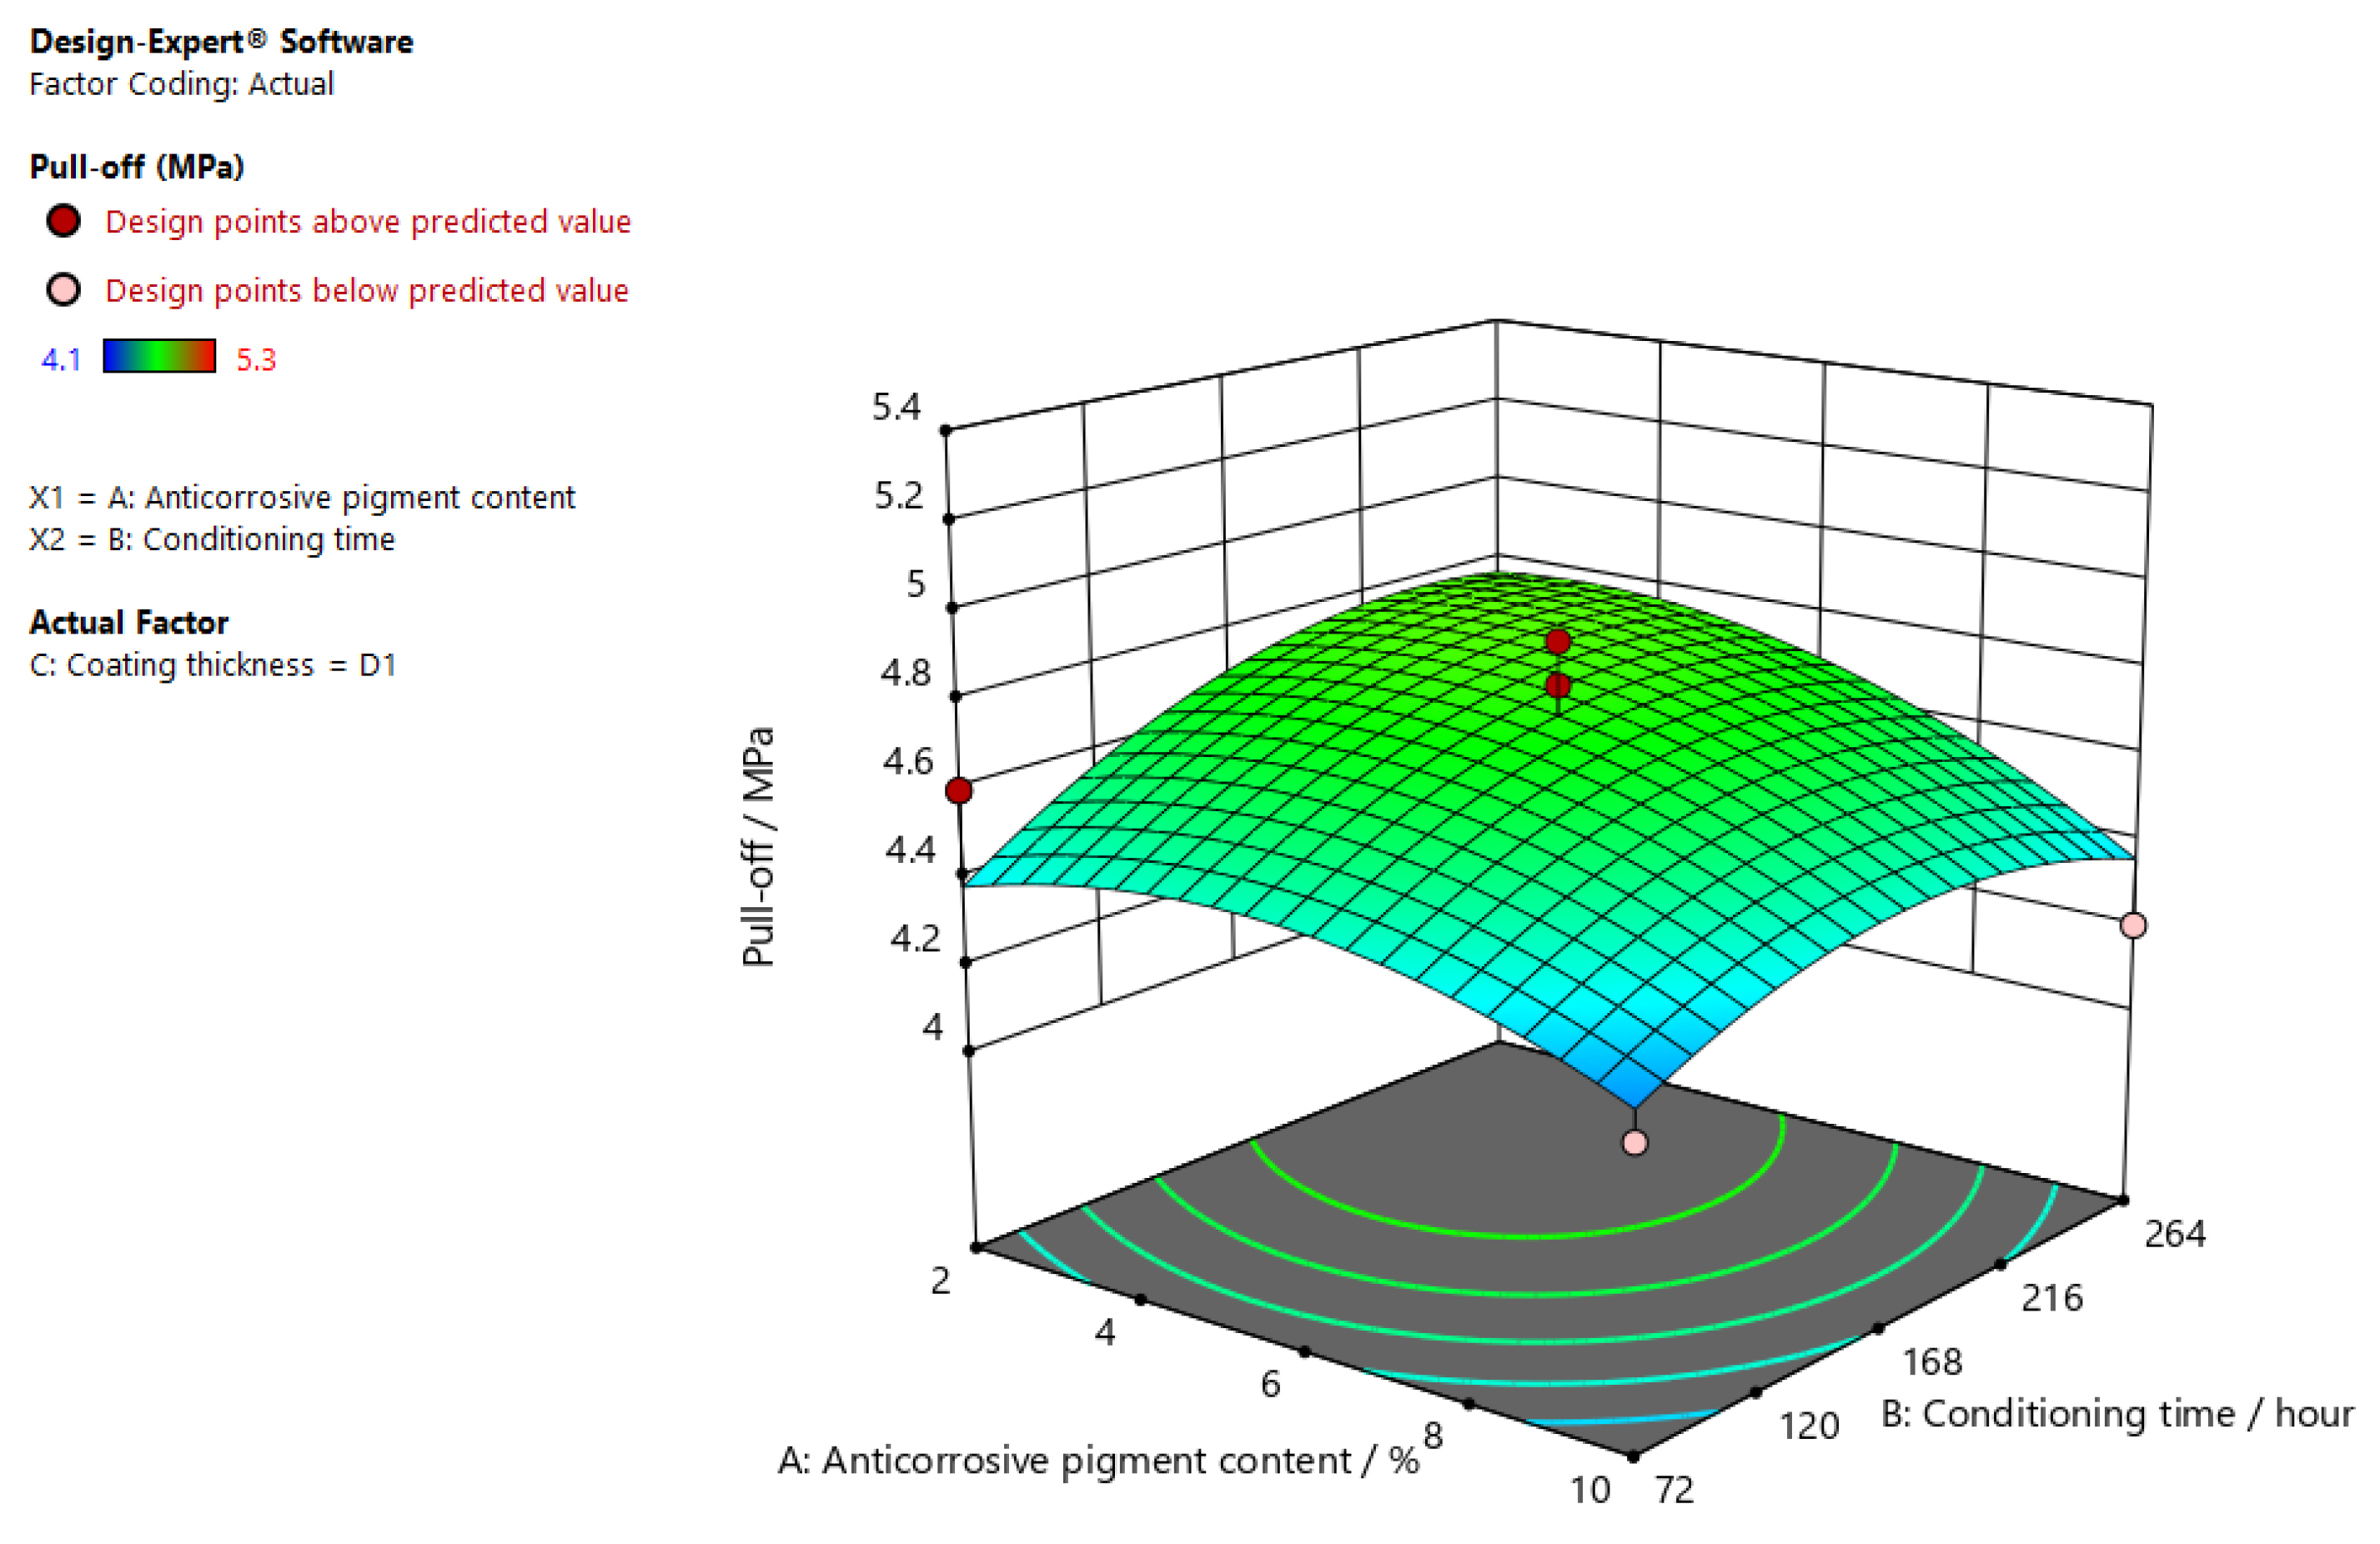
As shown in Figure 3, there was a trend of increase in the value of adhesion force (pull-off) between the applied coating and the substrate surface along with the decease of the anticorrosive pigment content and the increase of conditioning time for the D1 coating thickness.
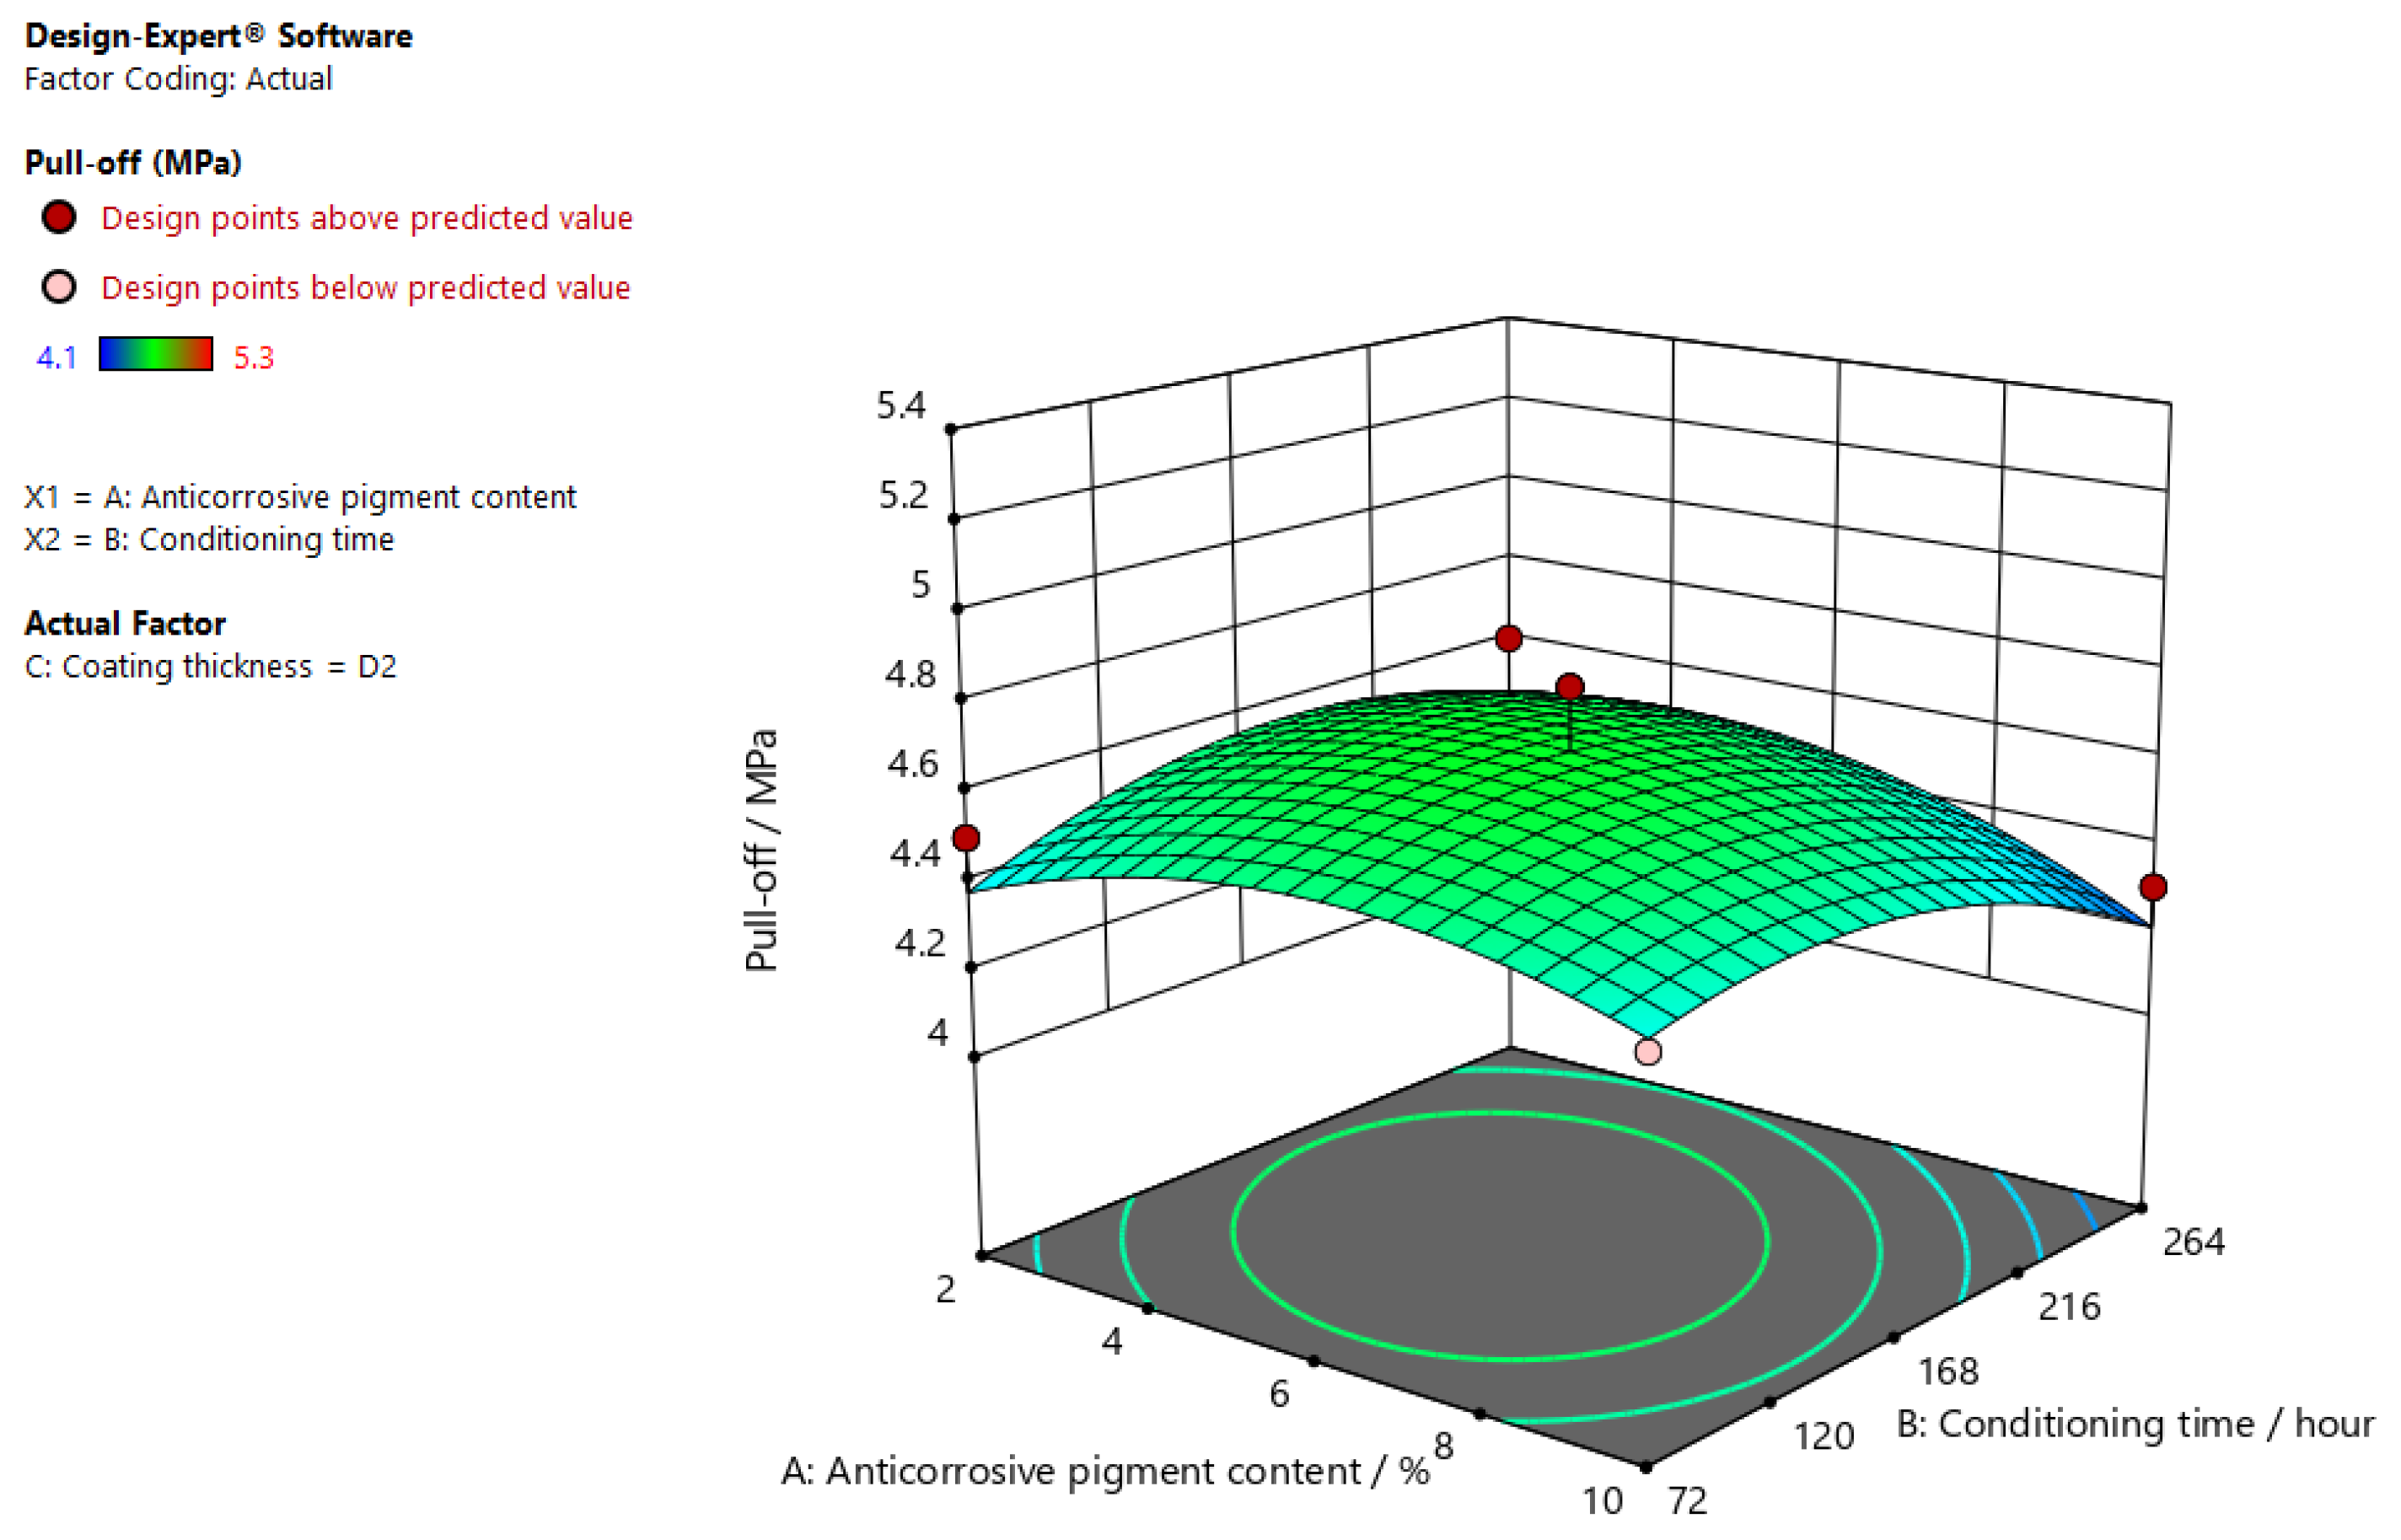
Figure 4 shows an increasing trend in the value of adhesion force (pull-off) between the applied coating and the substrate surface along with the decease of the anticorrosive pigment content up to the portion of 6%, and along with the increase of conditioning time up to 168 h. At those values, the adhesion force was the greatest for the D2 coating thickness.
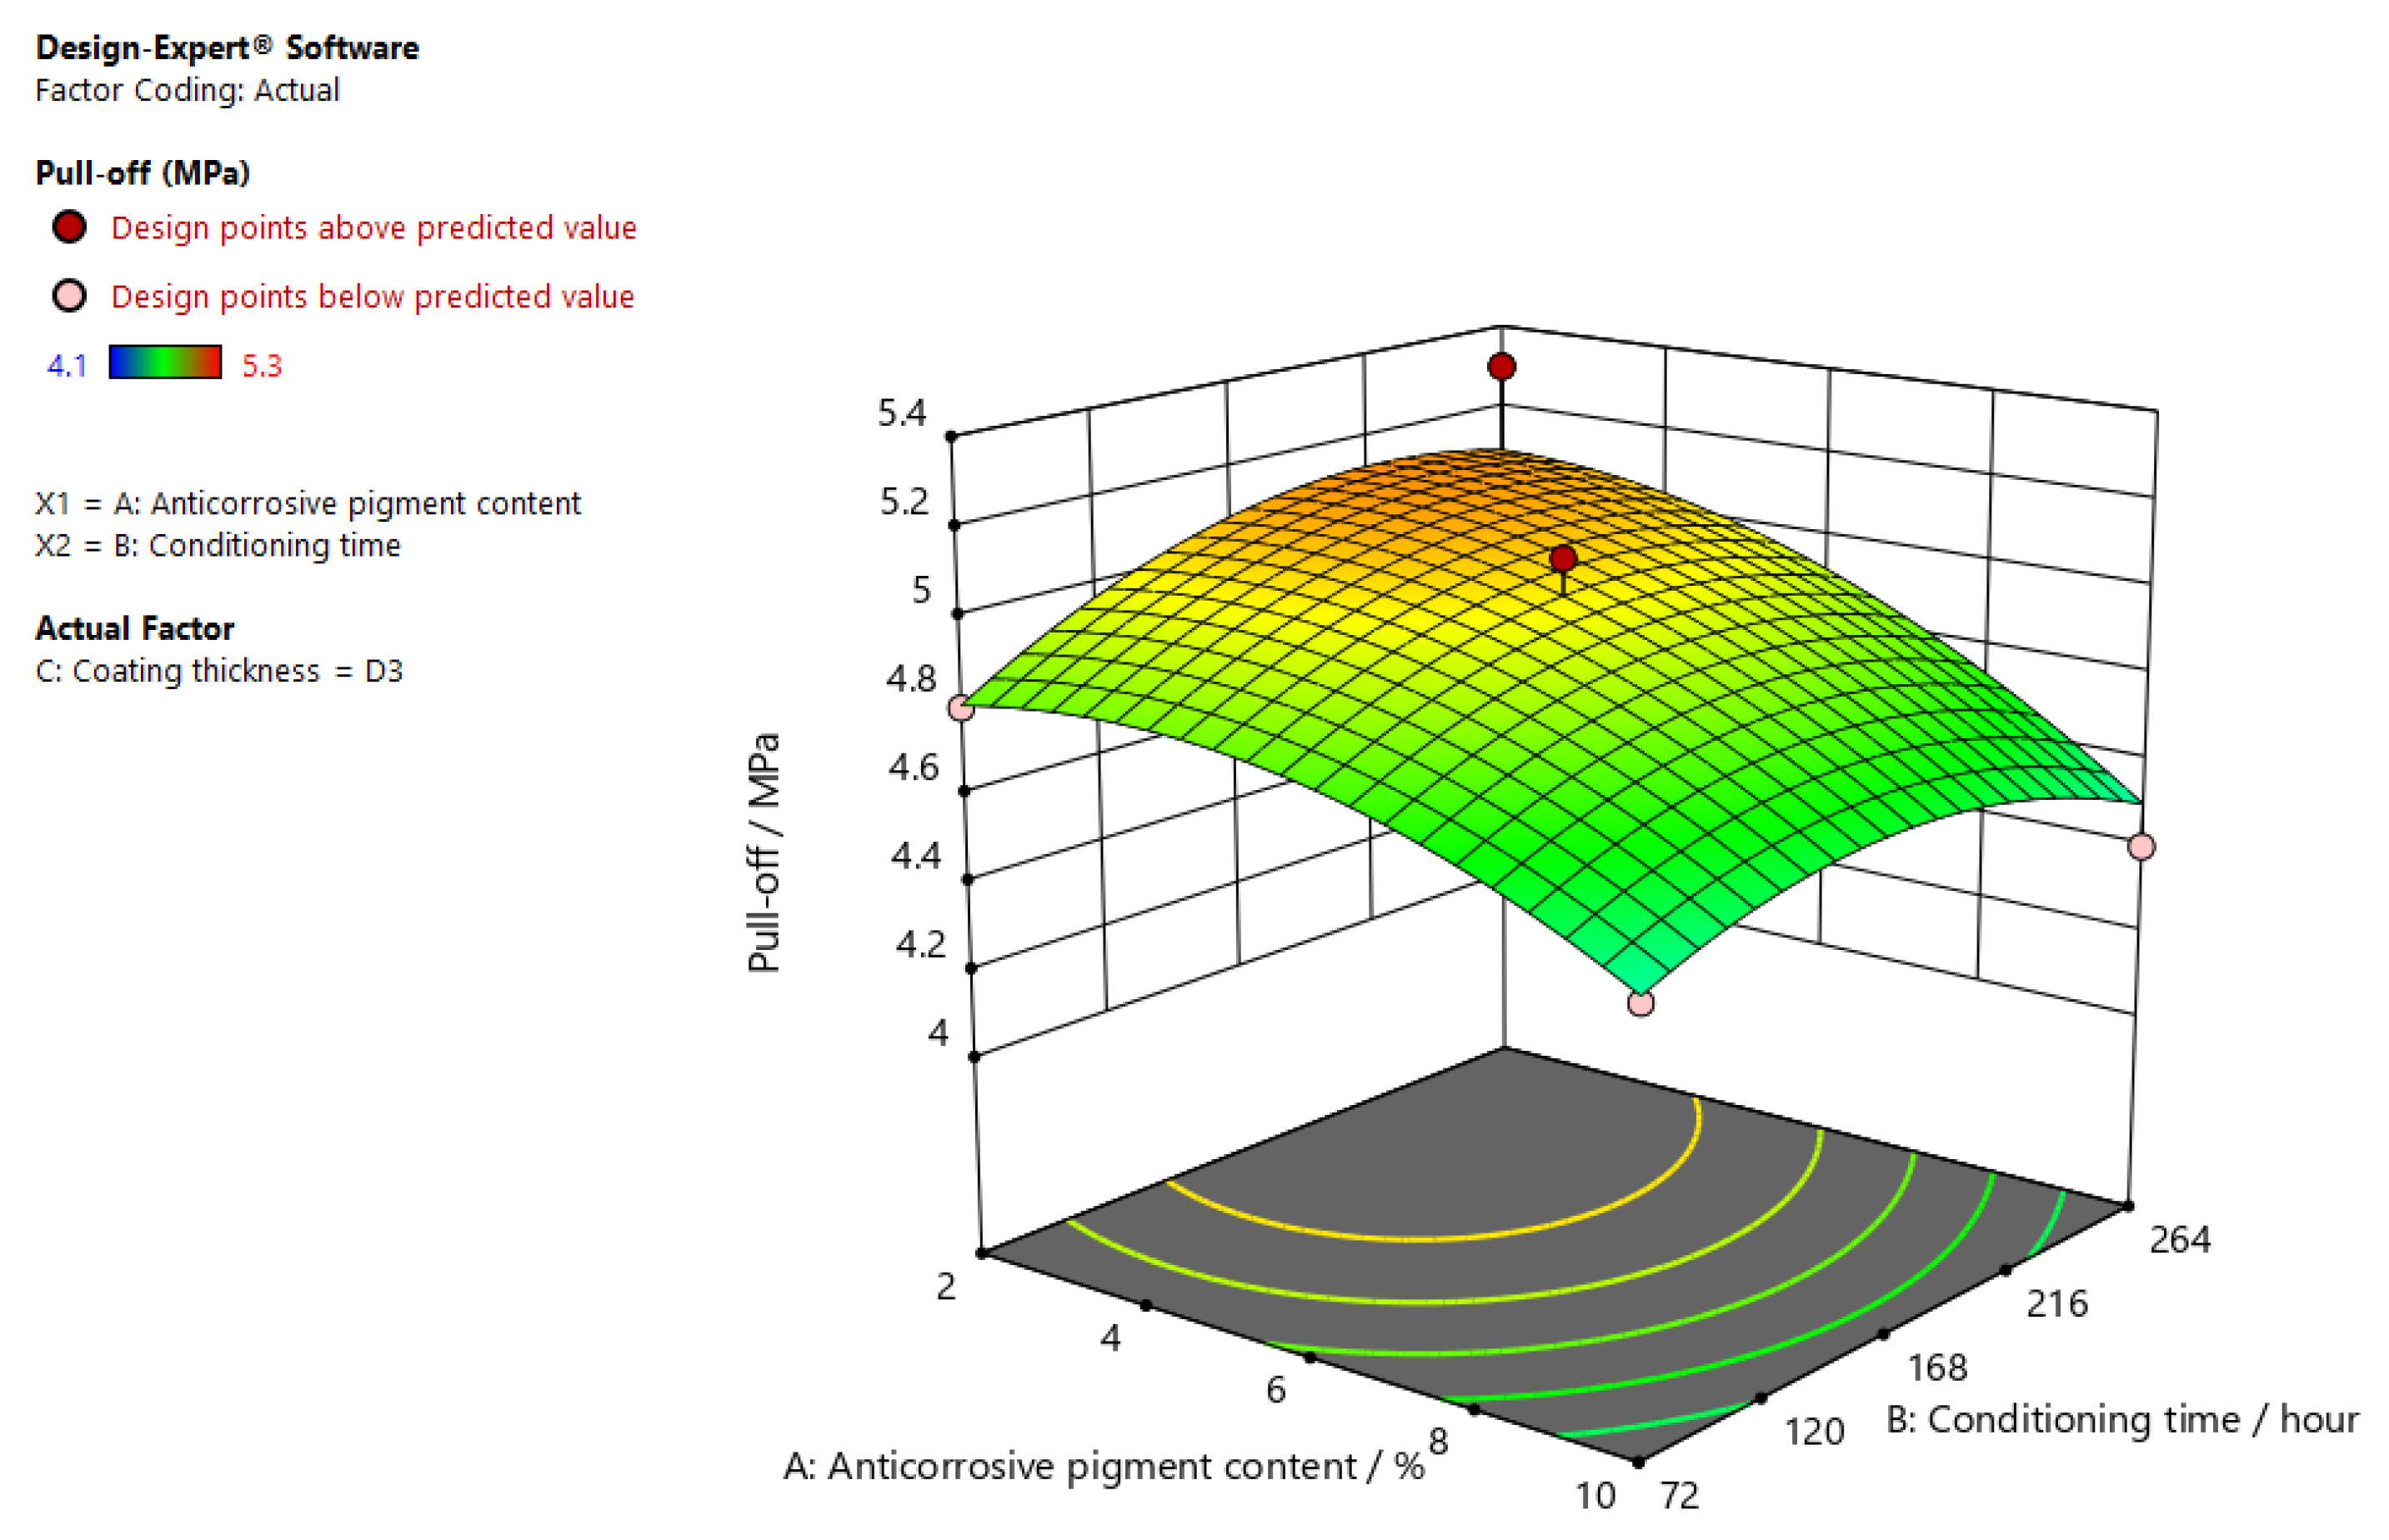
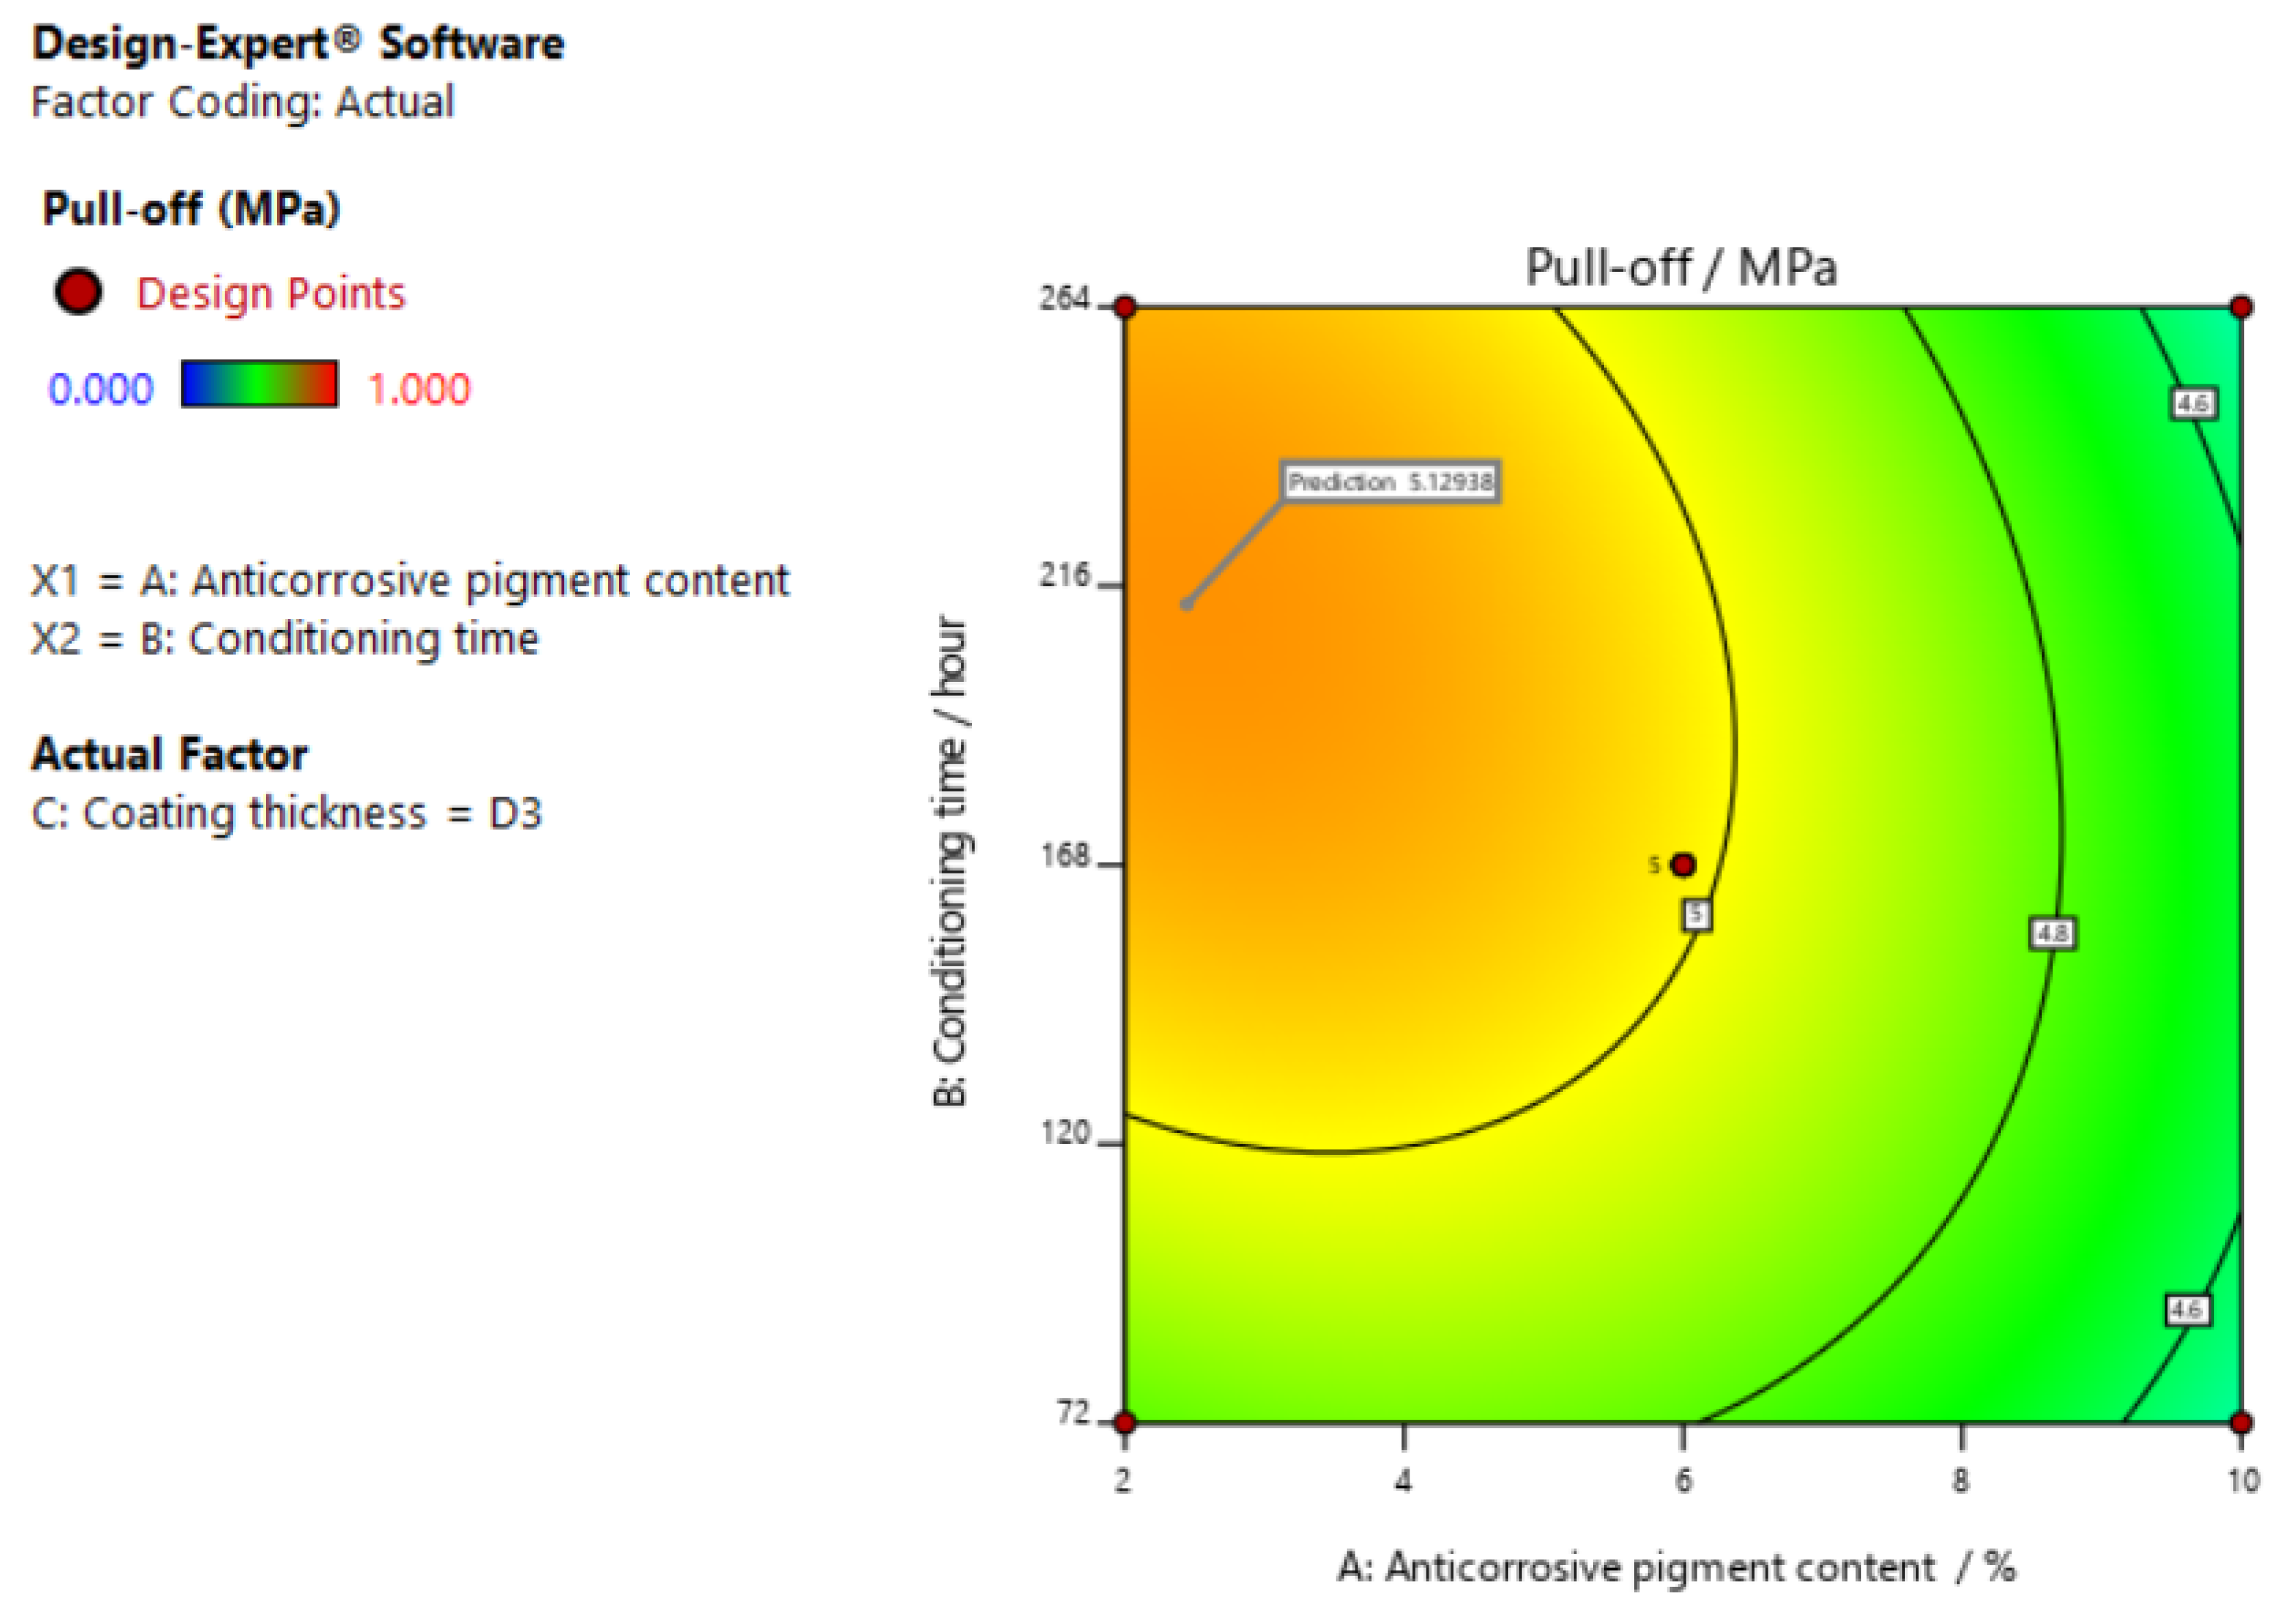
As seen in Figure 5, there was an increasing trend in the value of adhesion force (pull-off) between the applied coating and the substrate surface along with the decease of the anticorrosive pigment content and the increase of conditioning time for the D3 coating thickness.
Table 6 gives an overview of the values for the standard error of the regression coefficients, for the confidence interval (CI), and the lower and upper limits.
3.2. Regression Model Adequacy Checking
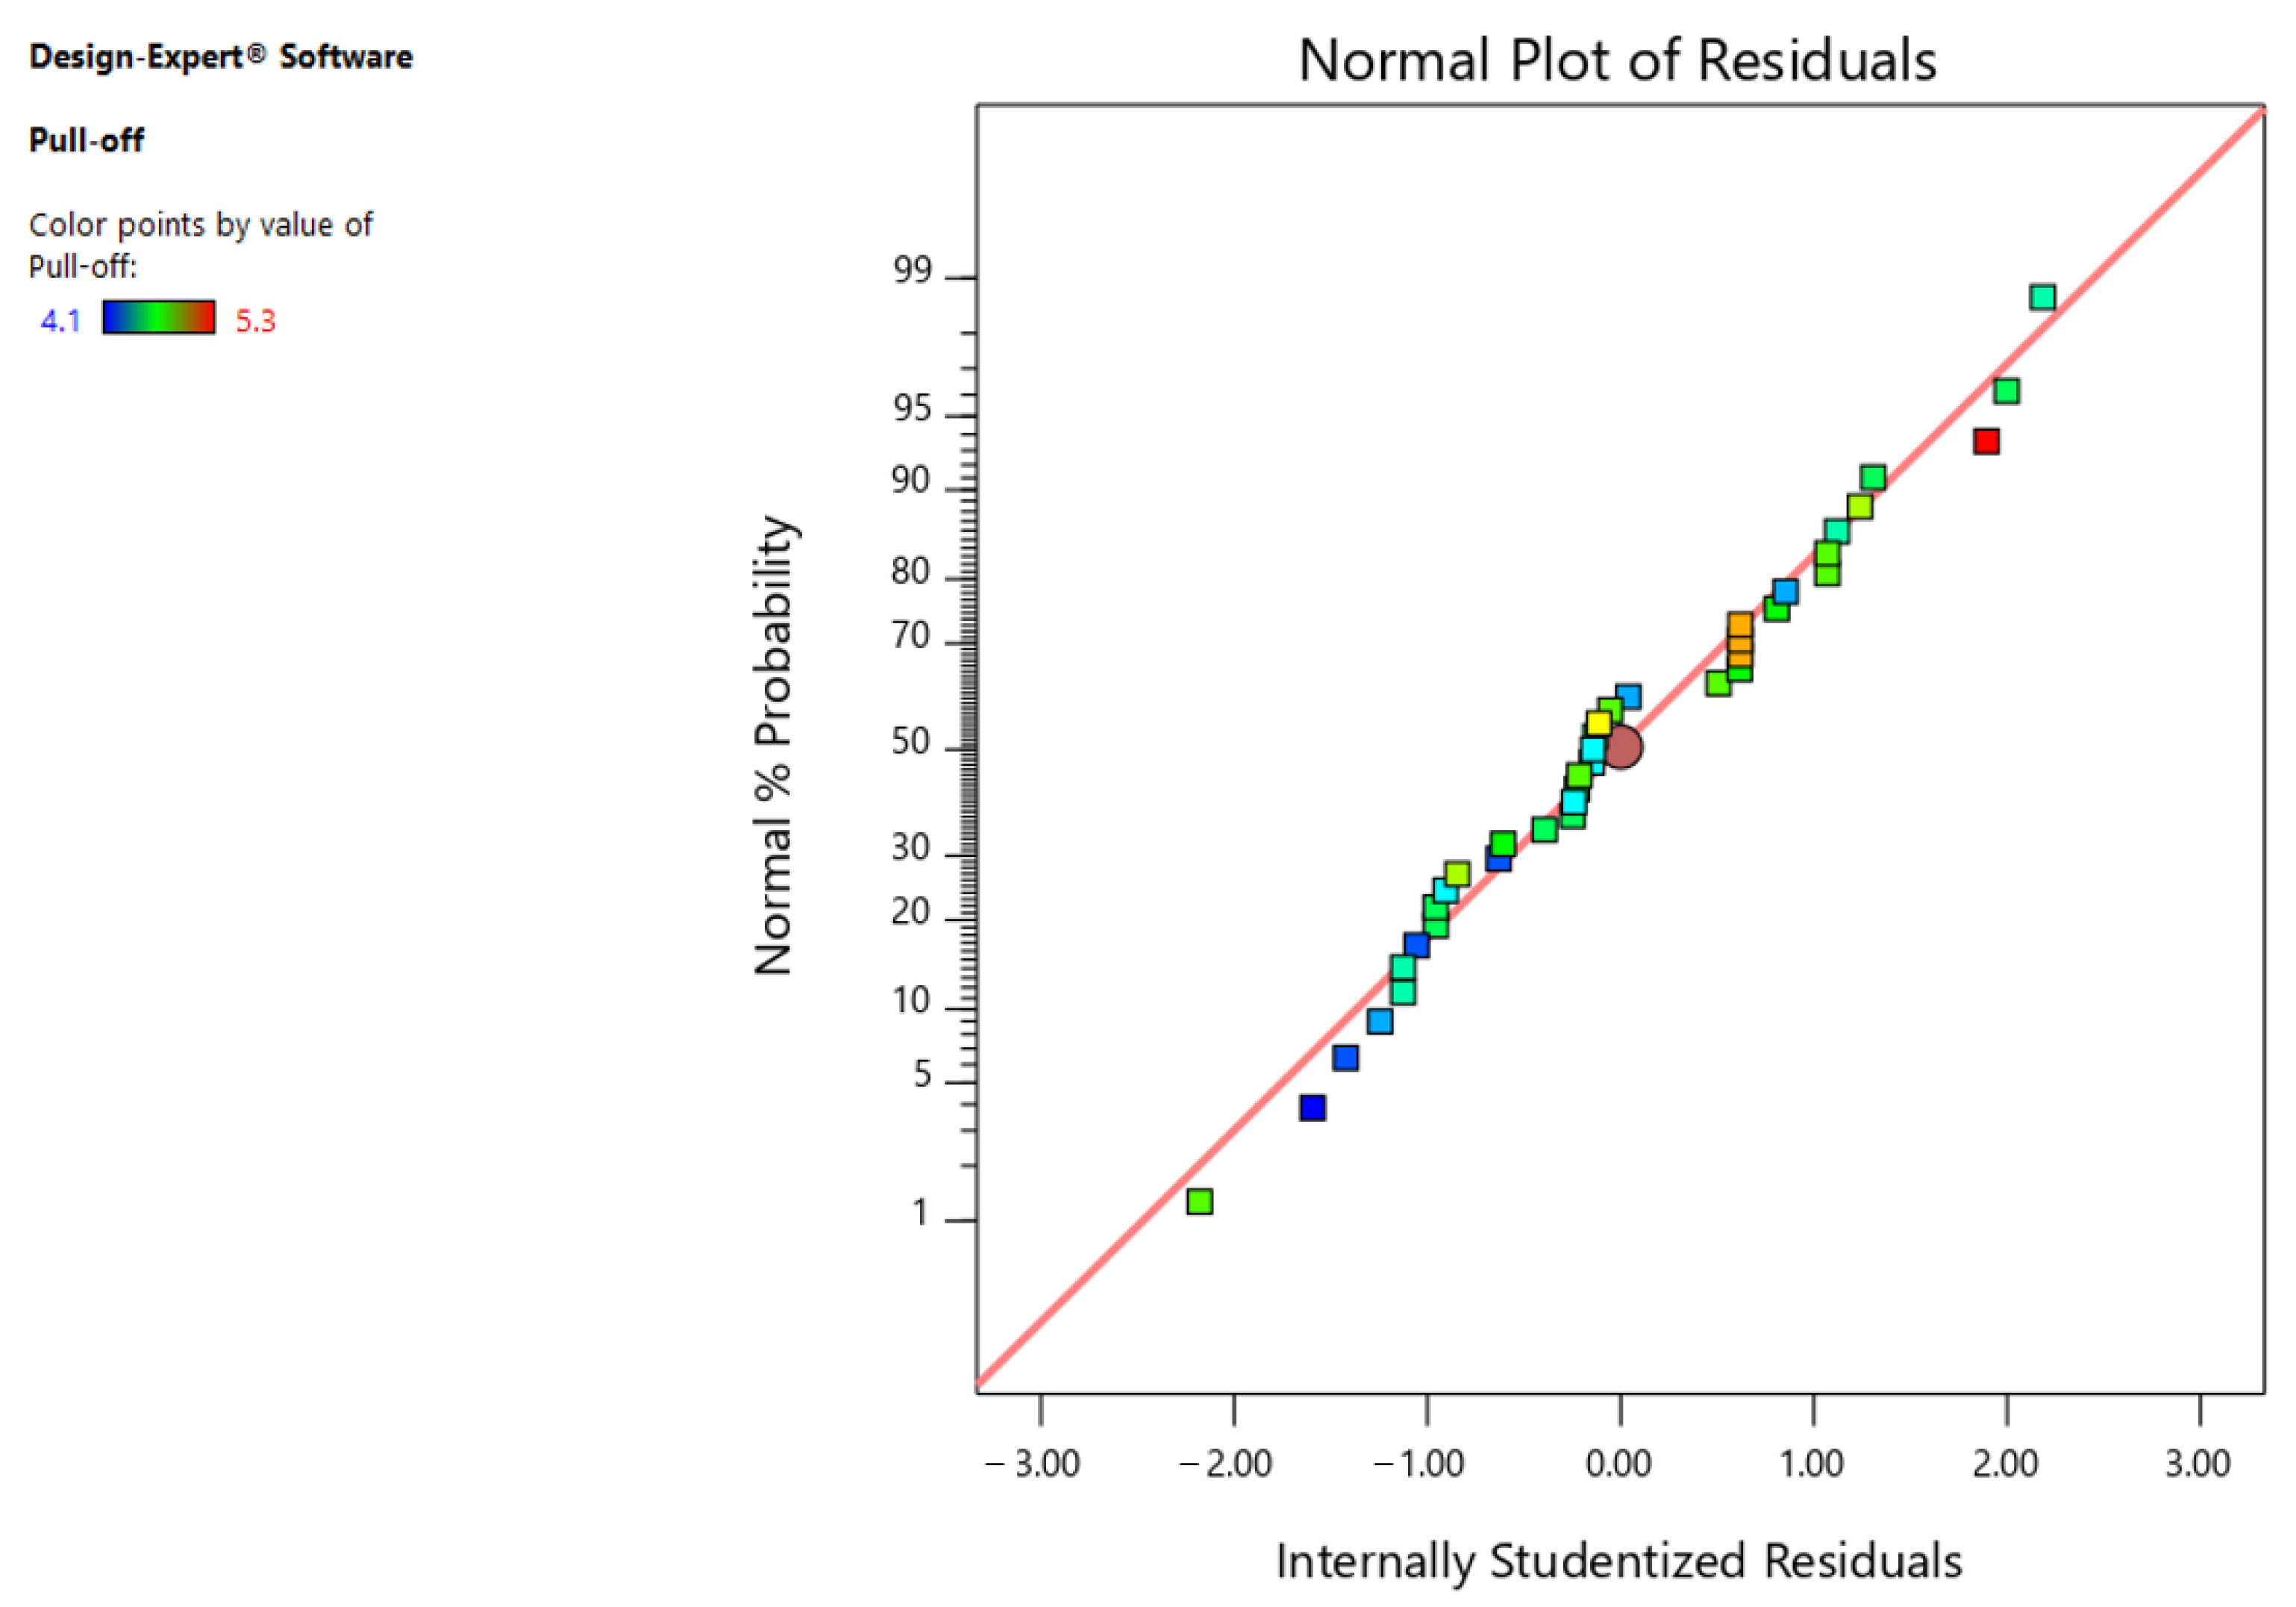
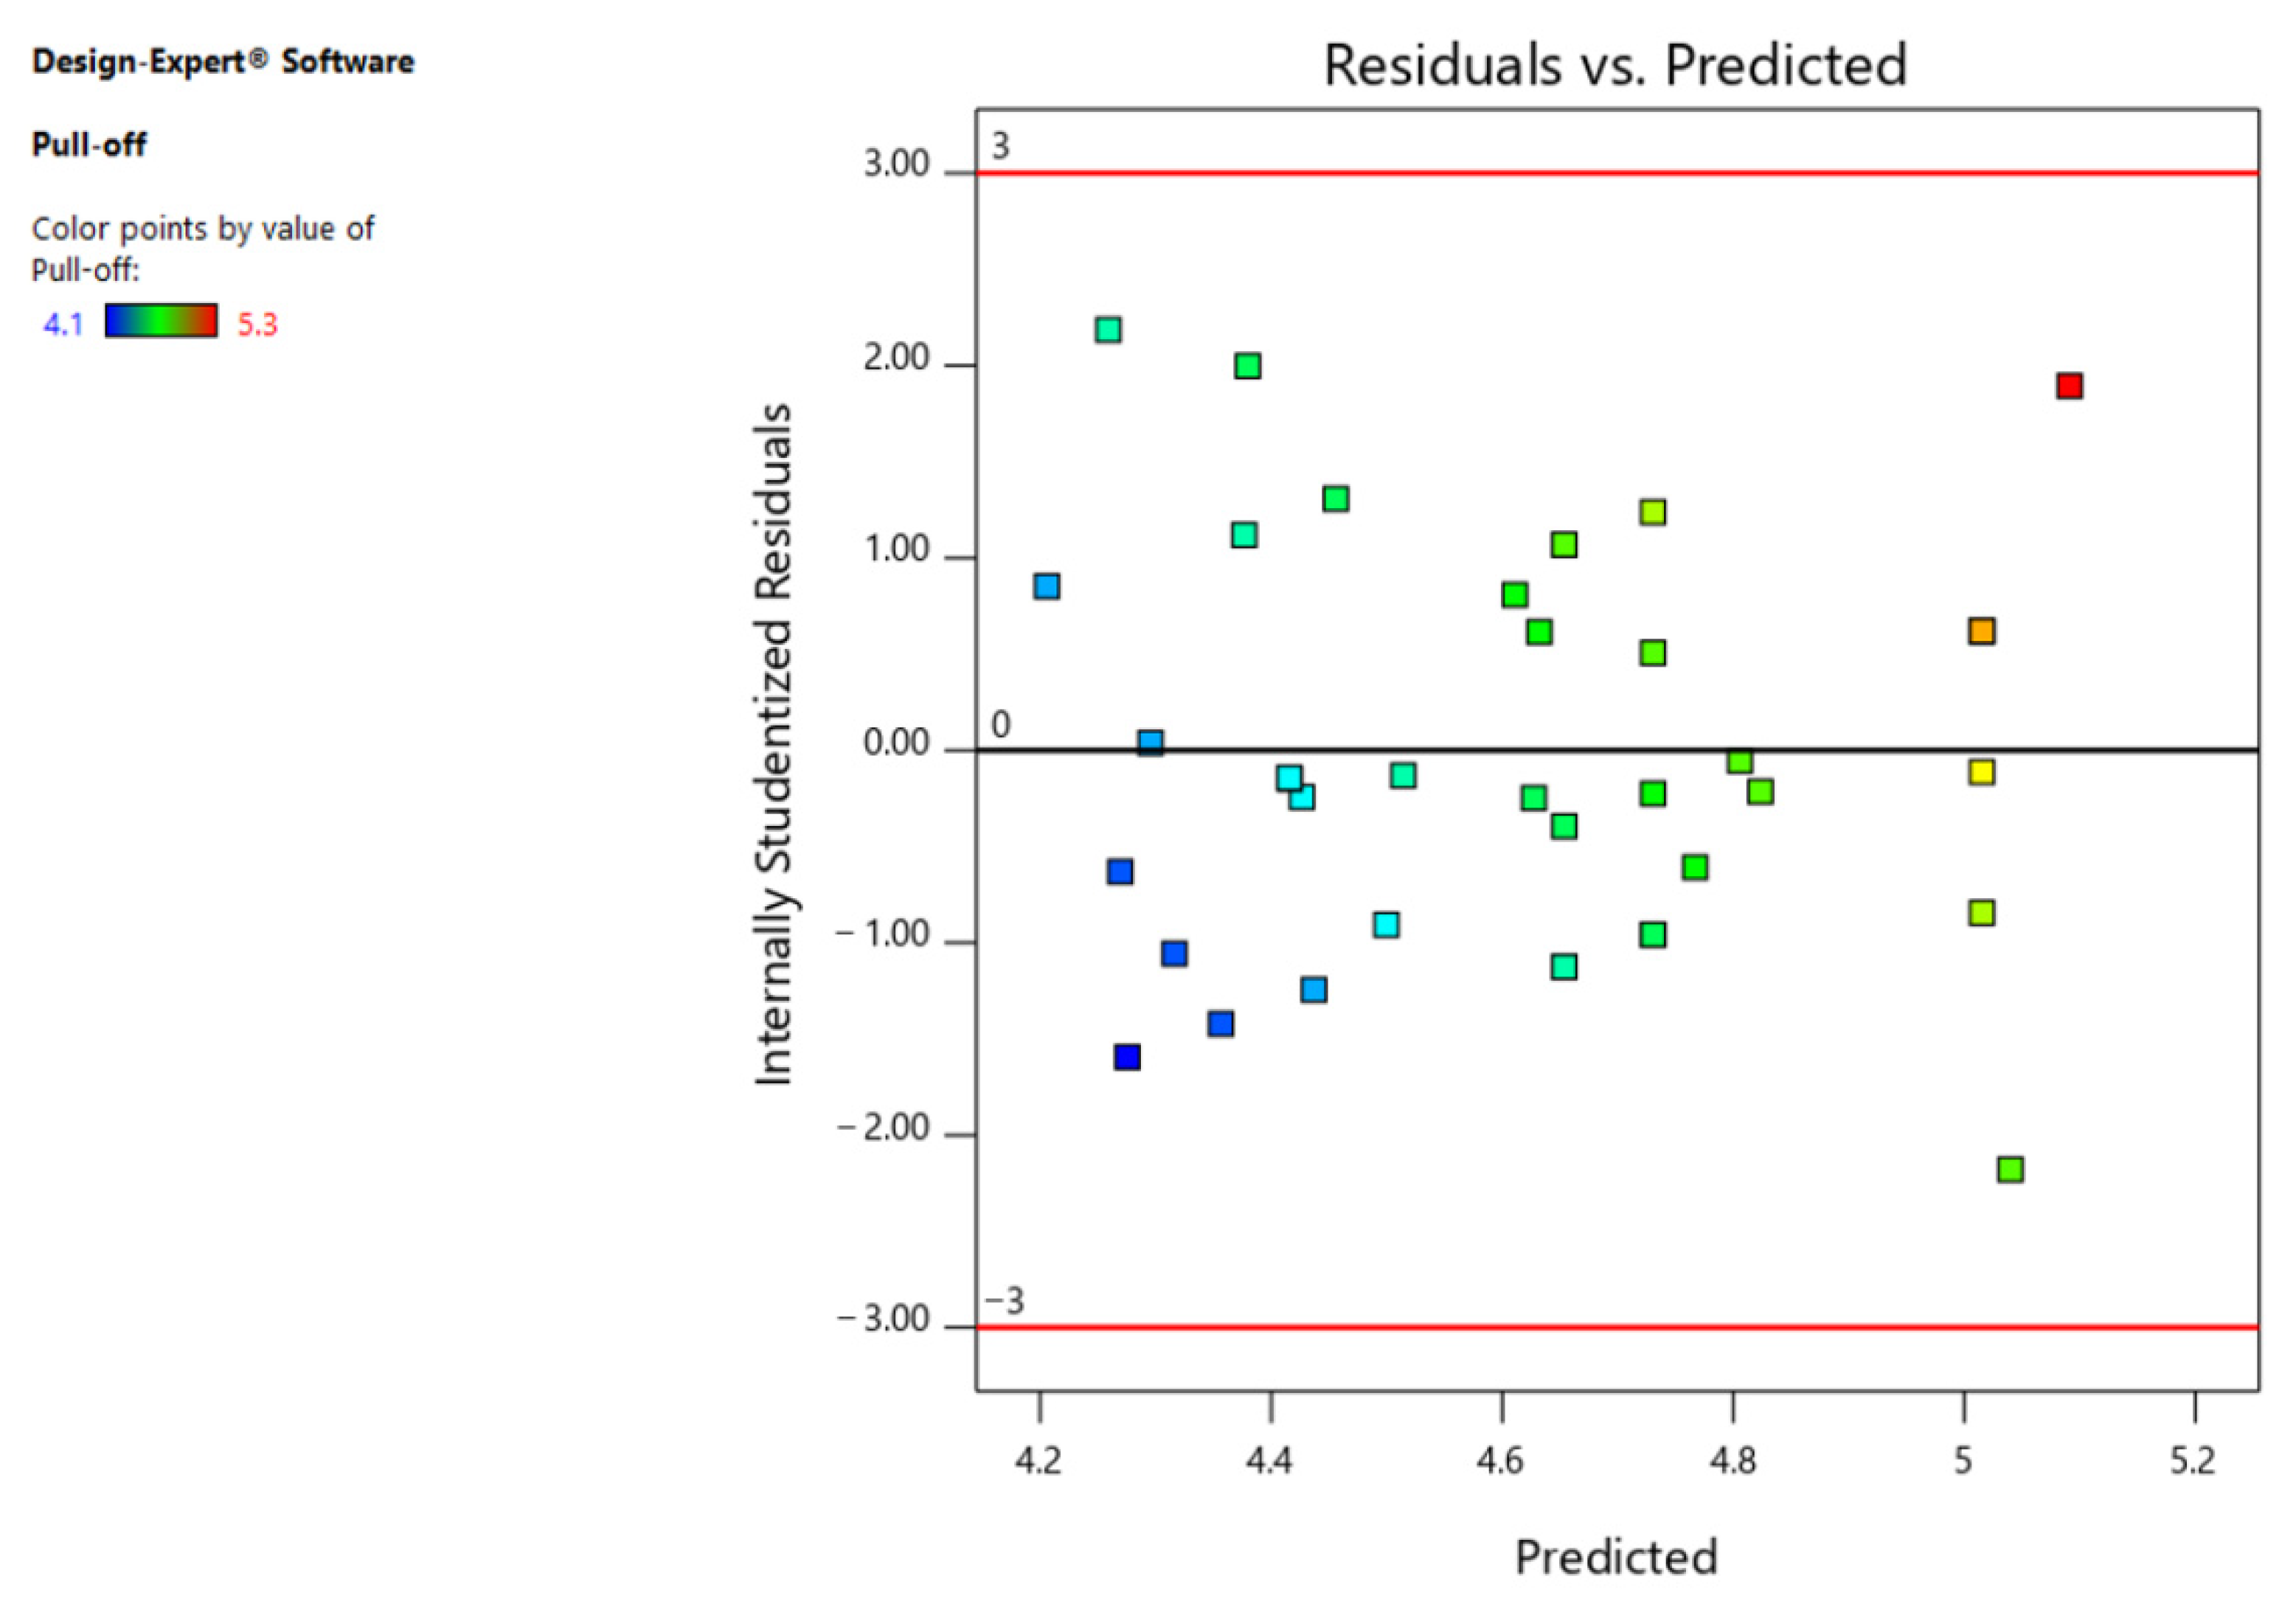
When checking the adequacy of the regression model, it is important to assume that errors in the model (residuals) should be independently and normally distributed, with expected zero and variance ϭ2. The error or residual is the deviation or difference between the real (actual) value obtained in the experiment and the value estimated by the regression model. Figure 6 and Figure 7 present the diagrams by which the adequacy of the model was checked.
Figure 6 shows that residuals (i.e., internally studentized residuals—transformed or scaled residuals) were distributed normally, since there were no significant deviations from the line.
Figure 7 shows the error, i.e., the residuals that did not correlate (there was neither a negative nor positive correlation) with certain values, and that they did not exceed the diagram boundaries for values ±3. The points in the diagram are colored according to the response (adhesion force).
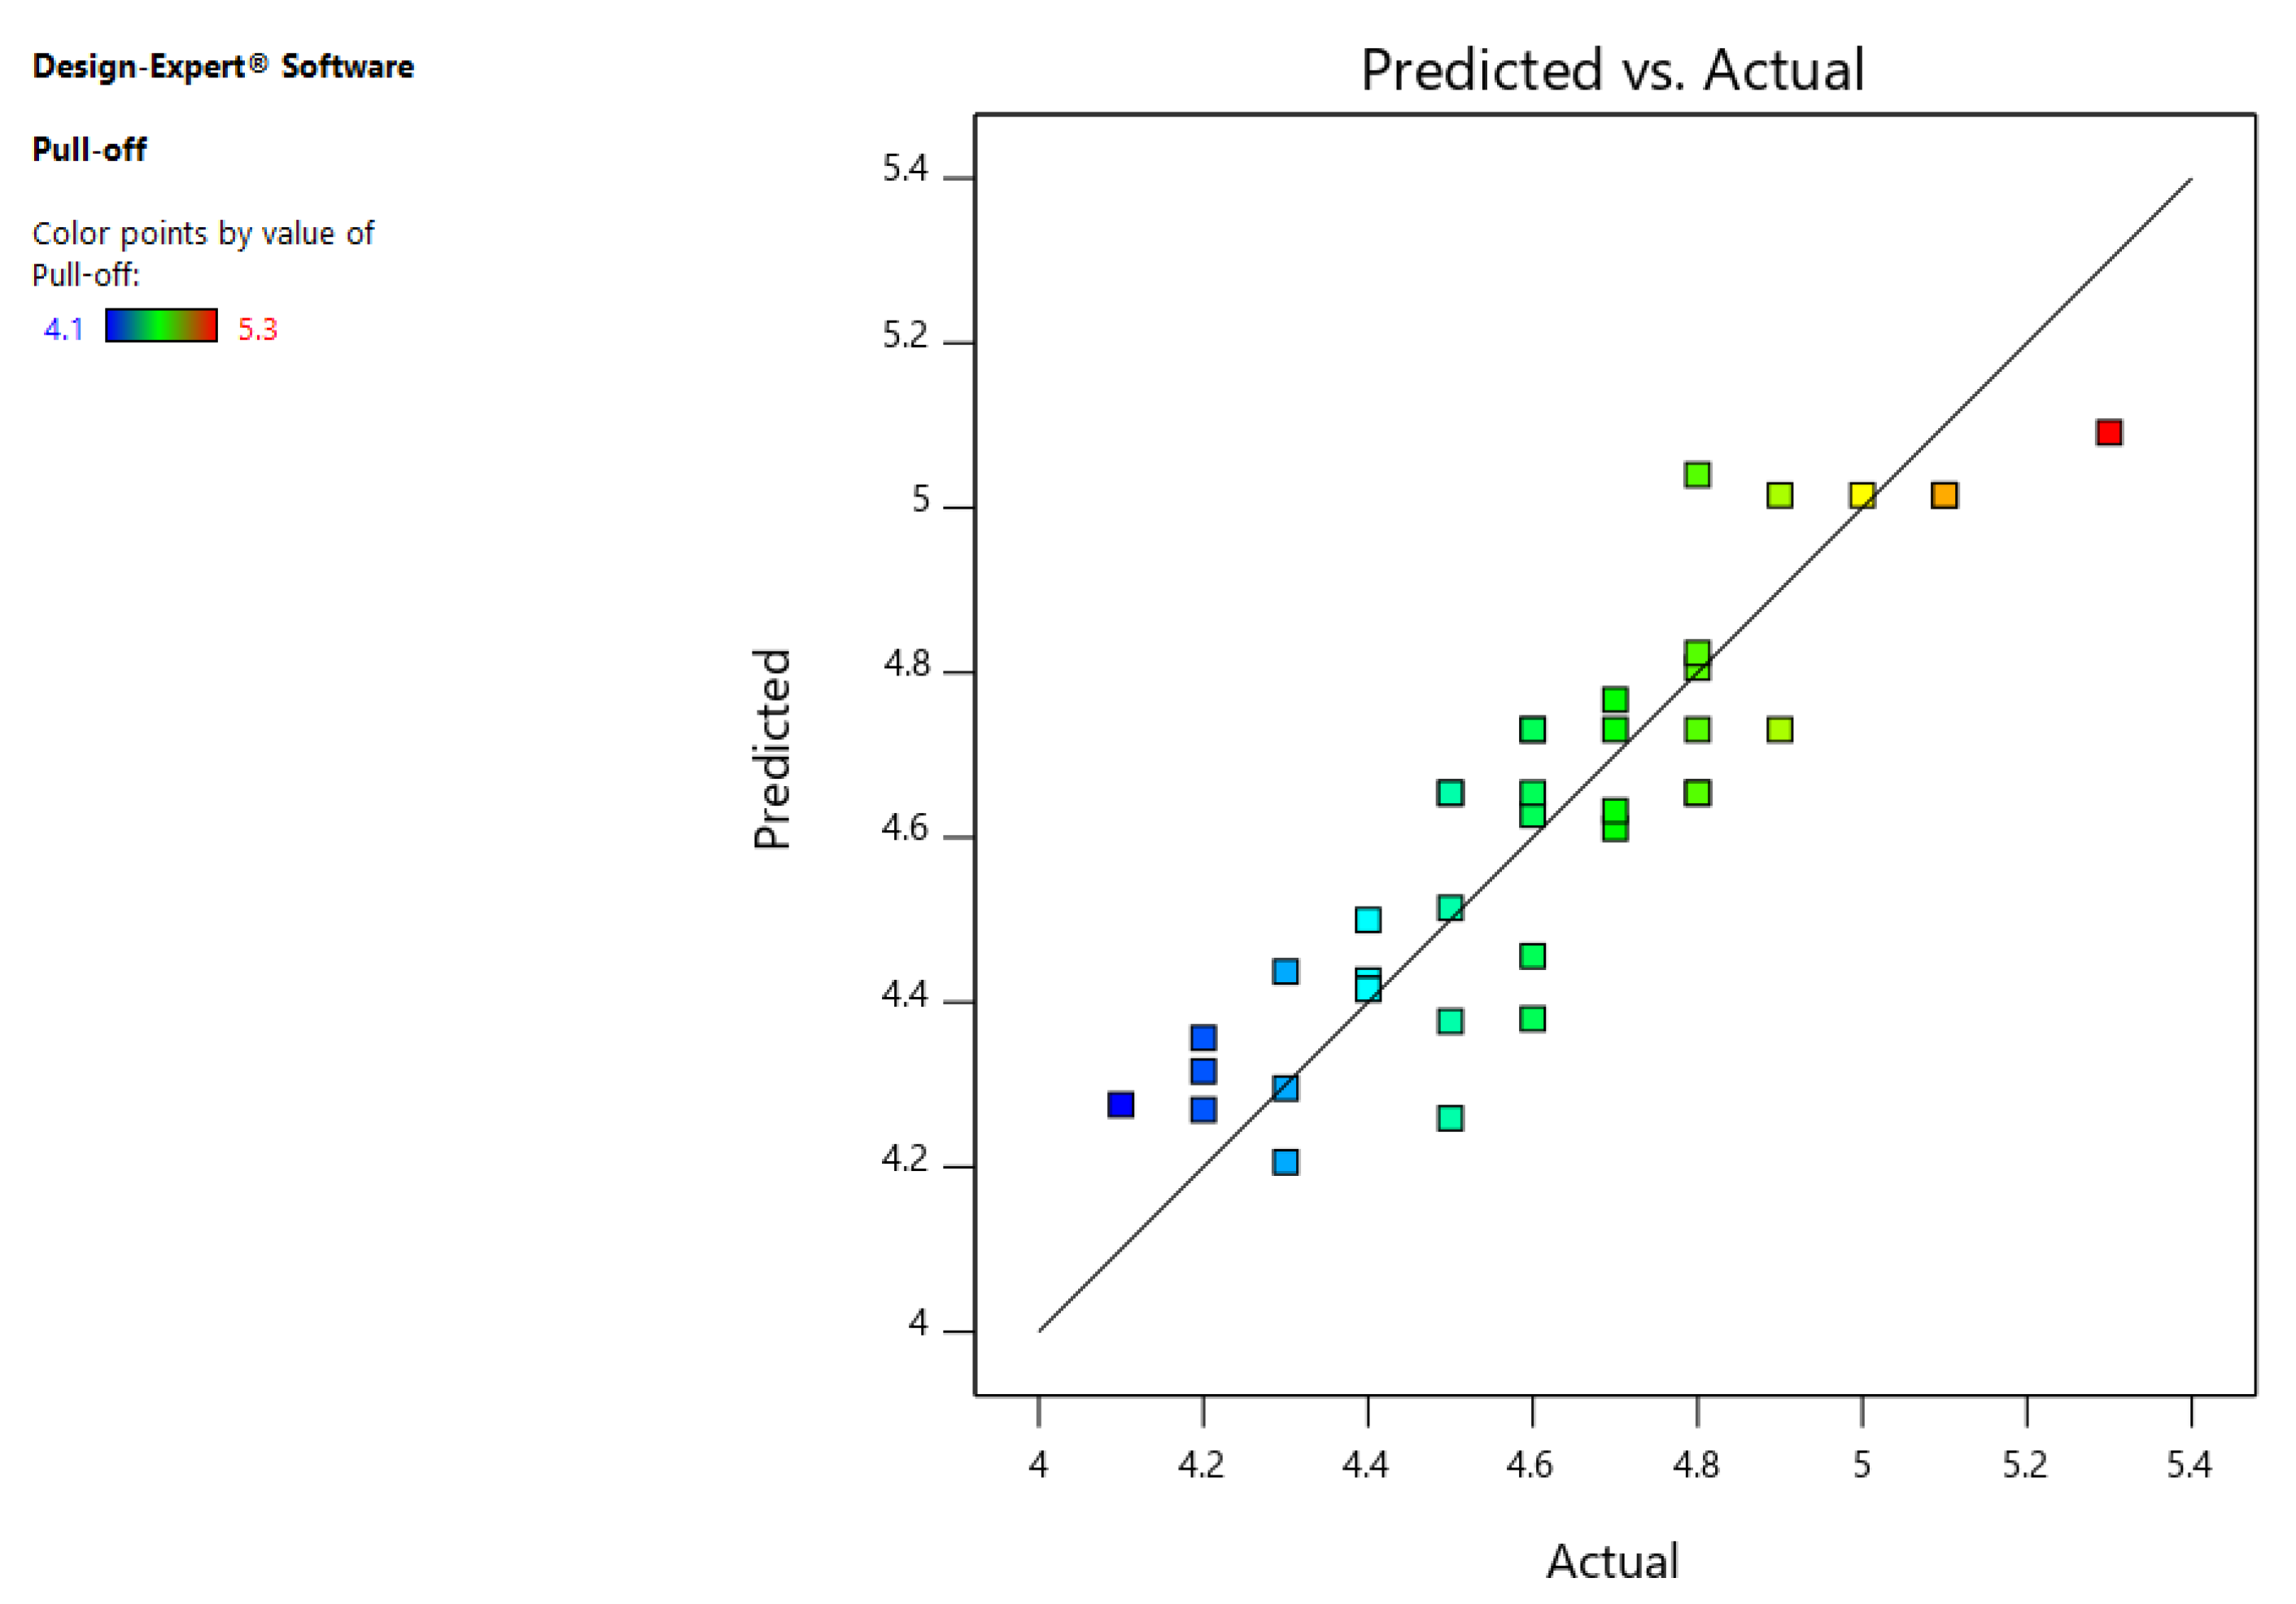
Figure 8 presents both the actually measured values and the values predicted by the model.
Based on the research results, parameters could be optimized by selecting the values of input variables that provided the desired properties. Table 7 gives an overview of the limitations set for the above-mentioned optimization, and there were given ranges within which the input variables and the desired property to be achieved by optimization were observed. The goal was to achieve the highest possible value of adhesion force between the coating and the substrate.
Following the defined limitations, Table 8 shows the solutions for three combinations of categorical factor levels (dry film thickness).
The optimal parameters that provided the best adhesive properties of the coating are presented in Table 1, above, as well as in Figure 9, below.
Analysis of the research results obtained within the defined central composite design of the experiment confirmed several conclusions. After exposing the specimens to aggressive atmosphere in the salt spray chamber for 120 h, the adhesion force between the applied coating of the dry film thickness D1 (75–85 μm) and D3 (155–165 μm) and the substrate surface was higher for the coating with lower anticorrosive pigment content, and at higher conditioning time. Results obtained for specimens with the applied coating of D2 dry film thickness (115–125 μm) indicated that the highest values were achieved with the anticorrosive pigment content of 6% after a conditioning time of 168 h. With respect to the values of adhesion force being dependent on the dry film thickness of the coating, it was determined that D1 and D2 coating thicknesses had approximately equal values, while the dry film thickness value of D3 was slightly higher. Such results led to the conclusion that higher values of adhesion force could be obtained by adding less anticorrosive pigment to the coating, as well as by applying coatings with greater dry film thickness. If the input parameters are optimized for the purpose of achieving the highest possible value of adhesion force between the coating and the substrate, according to the values obtained by the pull-off test, solutions can be obtained for all three levels of categorical factors. The mentioned combinations for all three categorical factor levels of coating that are able to provide the best adhesion properties (according to the set limitations) are presented in Table 8. According to the determined criteria, i.e., according to the highest adhesion force obtained by the pull-off test, the best adhesion properties of the coating can be achieved with an anticorrosive pigment content of 2.441%, at the conditioning time of 212.825 h and with a coating thickness with the same value as D3.
If we review other published literature on the topic of the adhesive properties of primers, we can see that this paper follows modern research. Efforts to improve the adhesion of the primer to the protected material have been made in various ways. Some authors varied surface preparation methods to ensure a more favorable profile [32,33], while others changed or modified the chemical composition of the coating, i.e., individual components. In this sense, the authors varied the proportion of epoxy binder [34] or optimized the proportion of pigment that will ensure the best adhesion [35]. Cross-cut [34,36] and pull-off methods [32,37] were used to evaluate the performed tests and analyze the obtained results, as two methods for testing the properties that describe adhesion. In comparison with previous research, the innovativeness of this paper can be noted and emphasized once again. In addition to the previously explained models and the possibilities of their use, it can be seen that so far, the variation has always been based on one component or influencing factor, while the interaction of three significant factors influencing adhesion was studied in this paper. In the same way, by varying one influential element, in this way it is possible to compensate for a possible shortcoming by varying the value of the second input variable, i.e., the observed parameter.
4. Conclusions
Upon analysis of the research results with reference to the observed properties, it was proved that changes in the percentage content of anticorrosive pigment had a significant influence on the adhesion properties of the coating. From the diagrams shown in Figure 3, Figure 4 and Figure 5, it is clear that the coating with a lower proportion of anticorrosive pigment had better adhesion properties. In this case, this applies for specimens exposed to aggressive conditions of lower corrosivity category (equally to 120 h in salt spray chamber). It was also confirmed that the application parameters had a significant influence on the observed adhesion properties. The increase in the dry film thickness influenced the increase of adhesion force between the applied coating and the substrate surface. Increasing the thickness of the coating increases the adhesive properties, which is especially evident in the layer applied at a thickness of 155–165 µm. The same goes for conditioning time, since higher values of measured adhesion properties were achieved with a higher conditioning time. Ultimately, optimization makes it possible to find the best ratios of all observed parameters in order to give the best defined properties, as here the best adhesion resulted from a combination of parameters with the following values: anticorrosive pigment content of 2.441%, conditioning time of 212.825 h and coating thickness with the same value as D3 (155–165 µm).
Author Contributions
Formal analysis, T.Š.; Resources, I.S.; Software, D.M.; Supervision, I.S.; Writing—original draft, T.Š.; Writing—review & editing, D.N. All authors have read and agreed to the published version of the manuscript.
Funding
This research received no external funding.
Institutional Review Board Statement
Not applicable.
Informed Consent Statement
Not applicable.
Data Availability Statement
The data presented in this study are available from the corresponding author, upon reasonable request.
Conflicts of Interest
The authors declare that they have no known competing financial interests or personal relationships that could have appeared to influence the work reported in this paper.
References
- Veselý, D.; Kalendová, A.; Němec, P. Properties of organic coatings depending on chemical composition and structure of pigment particles. Surf. Coat. Technol. 2010, 204, 2032–2037. [Google Scholar] [CrossRef]
- Chang, C.-H.; Huang, T.-C.; Peng, C.-W.; Yeh, T.-C.; Lu, H.-I.; Hung, W.-I.; Weng, C.-J.; Yang, T.-I.; Yeh, J.-M. Novel anticorrosion coatings prepared from polyaniline/graphene composites. Carbon 2012, 50, 5044–5051. [Google Scholar] [CrossRef]
- Chang, K.-C.; Ji, W.-F.; Lai, M.-C.; Hsiao, Y.-R.; Hsu, C.-H.; Chuang, T.-L.; Wei, Y.; Yeh, J.-M.; Liu, W.-R. Synergistic effects of hydrophobicity and gas barrier properties on the anticorrosion property of PMMA nanocomposite coatings embedded with graphene nanosheets. Polym. Chem. 2013, 5, 1049–1056. [Google Scholar] [CrossRef]
- Ding, J.; ur Rahman, O.; Peng, W.; Dou, H.; Yu, H. A novel hydroxyl epoxy phosphate monomer enhancing the anticorrosive performance of waterborne graphene/epoxy coatings. Appl. Surf. Sci. 2018, 427, 981–991. [Google Scholar] [CrossRef]
- Javidparvar, A.A.; Ramezanzadeh, B.; Ghasemi, E. Effect of Various Spinel Ferrite Nanopigments Modified by Amino Propyl Trimethoxy Silane on the Corrosion Inhibition Properties of the Epoxy Nanocomposites. Corrosion 2016, 72, 761–774. [Google Scholar] [CrossRef]
- Juraga, I.; Alar, V.; Stojanović, I. Korozija i Zaštita Ppremazima; Fakultet Strojarstva i Brodogradnje: Zagreb, Croatia, 2014. [Google Scholar]
- Liu, S.; Yan, H.; Fang, Z.; Wang, H. Effect of graphene nanosheets on morphology, thermal stability and flame retardancy of epoxy resin. Compos. Sci. Technol. 2014, 90, 40–47. [Google Scholar] [CrossRef]
- Zhang, Z.; Zhang, W.; Li, D.; Sun, Y.; Wang, Z.; Hou, C.; Chen, L.; Cao, Y.; Liu, Y. Mechanical and anticorrosive properties of graphene/epoxy resin composites coating prepared by in-situ method. Int. J. Mol. Sci. 2015, 16, 2239–2251. [Google Scholar] [CrossRef] [Green Version]
- Bano, H.; Mahmood, A.; Khan, M.I.; Kazmi, S.A. Spatial Evaluation of Preservability of Mild Steel by Coal Tar Epoxy Coatings Via Spectroscopic and Microscopic Techniques. Arab. J. Sci. Eng. 2015, 40, 117–124. [Google Scholar] [CrossRef]
- Bano, H.; Khan, M.I.; Kazmi, S.A. Structure and microstructure studies of epoxy coating after natural exposure testing. J. Chem. Soc. Pak. 2011, 33, 454–463. [Google Scholar]
- Duan, X.X.; Parris, T.; Kazlauciunas, A.; Guthrie, J. Preparation, characterization, and analysis of anti-corrosion subsea coatings. J. Coat. Technol. Res. 2017, 14, 823–827. [Google Scholar] [CrossRef] [Green Version]
- Bensalah, W.; Loukil, N.; De-Petris Wery, M.; Ayedi, H.F. Assessment of Automotive Coatings Used on Different Metallic Substrates. Int. J. Corros. 2014, 2014, 838054. [Google Scholar] [CrossRef]
- Li, J.; He, J.; Chisholm, B.J.; Stafslien, M.; Battocchi, D.; Bierwagen, G.P. An investigation of the effects of polymer binder compositional variables on the corrosion control of aluminum alloys using magnesium-rich primers. J. Coat. Technol. Res. 2010, 7, 757–764. [Google Scholar] [CrossRef]
- Mardel, J.; Garcia, S.J.; Corrigan, P.A.; Markley, T.; Hughes, A.E.; Muster, T.H.; Lau, D.; Harvey, T.G.; Glenn, A.M.; White, P.A.; et al. The characterisation and performance of Ce(dbp)3-inhibited epoxy coatings. Prog. Org. Coat. 2011, 70, 91–101. [Google Scholar] [CrossRef]
- Miyauchi, K.; Takita, Y.; Yamabe, H.; Yuasa, M. A study of adhesion on stainless steel in an epoxy/dicyandiamide coating system: Influence of glass transition temperature on wet adhesion. Prog. Org. Coat. 2016, 99, 302–307. [Google Scholar] [CrossRef]
- Roselli, S.; Bellotti, N.; Deyá, C.; Revuelta, M.; del Amo, B.; Romagnoli, R. Lanthanum-exchanged zeolite and clay as anticorrosive pigments for galvanized steel. J. Rare Earths 2014, 32, 352–359. [Google Scholar] [CrossRef]
- Roselli, S.N.; Romagnoli, R.; Deyá, C. The anti-corrosion performance of water-borne paints in long term tests. Prog. Org. Coat. 2017, 109, 172–178. [Google Scholar] [CrossRef]
- Dagdag, O.; El Harfi, A.; Essamri, A.; El Bachiri, A.; Hajjaji, N.; Erramli, H.; Hamed, O.; Jodeh, S. Anticorrosive Performance of New Epoxy-Amine Coatings Based on Zinc Phosphate Tetrahydrate as a Nontoxic Pigment for Carbon Steel in NaCl Medium. Arab. J. Sci. Eng. 2018, 43, 5977–5987. [Google Scholar] [CrossRef]
- Pokhmurs’kyi, V.I.; Bilyi, L.M.; Zin, Y.I. Corrosion-resistant inhibited coatings for welded joints of pipelines. Mater. Sci. 2013, 49, 281–291. [Google Scholar] [CrossRef]
- Jasková, V.; Kalendová, A. Anticorrosive coatings containing modified phosphates. Prog. Org. Coat. 2012, 75, 328–334. [Google Scholar] [CrossRef]
- Francisco, J.S.; Capelossi, V.R.; Aoki, I.V. Evaluation of a sulfursilane anticorrosive pretreatment on galvannealed steel compared to phosphate under a waterborne epoxy coating. Electrochim. Acta 2014, 124, 128–136. [Google Scholar] [CrossRef]
- Pokhmurs’kyi, V.I.; Bilyi, L.M.; Zin, Y.I.; Kytsya, A.R. Improvement of the protective properties of alkyd coatings by nanosized phosphate pigments. Mater. Sci. 2015, 50, 627–633. [Google Scholar] [CrossRef]
- Shi, C.; Shao, Y.; Wang, Y.; Meng, G.; Liu, B. Influence of submicron-sheet zinc phosphate synthesised by sol-gel method on anticorrosion of epoxy coating. Prog. Org. Coat. 2018, 117, 102–117. [Google Scholar] [CrossRef]
- Hao, Y.; Liu, F.; Han, E.-H.; Anjum, S.; Xu, G. The mechanism of inhibition by zinc phosphate in an epoxy coating. Corros. Sci. 2013, 69, 77–86. [Google Scholar] [CrossRef]
- Xue, Y.-N.; Xue, X.-Z.; Miao, M.; Liu, J.-K. Mass preparation and anticorrosion mechanism of highly triple-effective corrosion inhibition performance for co-modified zinc phosphate-based pigments. Dye. Pigment. 2019, 161, 489–499. [Google Scholar] [CrossRef]
- Kowalczyk, K.; Łuczka, K.; Grzmil, B. Preparation and characterization of anticorrosion polyurethane paints and coatings based on novel Zn-free phosphates. J. Coat. Technol. Res. 2015, 12, 153–165. [Google Scholar] [CrossRef] [Green Version]
- Wan, H.; Song, D.; Li, X.; Zhang, D.; Gao, J.; Du, C. Effect of Zinc Phosphate on the Corrosion Behavior of Waterborne Acrylic Coating/Metal Interface. Materials 2017, 10, 654. [Google Scholar] [CrossRef] [Green Version]
- Horvat, M.; Marić, D.; Duspara, M.; Samardžić, I. Primjena centralno kompozitnih planova pokusa pri optimiranju procesa zavarivanja. Eng. Technol. in Manuf. of Welded Constr. and Prod. SBW 2019, 2019, 295–304. [Google Scholar]
- Novosel, M.; Krumes, D.; Kladarić, I. Željezni Materijali, Konstrukcijski Čelici (II. Dopunjeno Izdanje); Mechanical Engineering Faculty in Slavonski Brod: Slavonski Brod, Croatia, 2013. [Google Scholar]
- Okonkwo Paul, C.; Shakoor, R.A.; Mohamed, A.M.A. Evironmental factors affecting corrosion of pipeline steel: A review. Int. J. Mech. Prod. Eng. Res. Dev. 2015, 5, 57–70. [Google Scholar]
- Meng, F.; Liu, Y.; Liu, L.; Wang, F. Studies on Mathematical Models of Wet Adhesion and Lifetime Prediction of Organic Coatings/Steel by Grey System Theory. Materials 2017, 10, 715. [Google Scholar] [CrossRef] [Green Version]
- Dos Santos, I.S.; de Carvalho, L.J.; Reznik, L.Y. Anti-corrosive properties of two epoxy primer systems applied to steel surface prepared with various mechanical abrasive treatments. J. Adhes. Sci. Technol. 2020, 34, 2467–2483. [Google Scholar] [CrossRef]
- Sabau, A.S.; Jun, J.; McClurg, D. Coating adhesion of a chromate-containing epoxy primer on Al2024-T3 surface processed by laser-interference. Int. J. Adhes. Adhes. 2020, 102, 102641. [Google Scholar] [CrossRef]
- Wang, C.; Han, Y.; Wang, W.; Liu, J.; Wang, N.; Hou, B. Polyvinyl chloride/epoxy double layer powder coating enhances coating adhesion and anticorrosion protection of substrate. Prog. Org. Coat. 2021, 158, 106335. [Google Scholar] [CrossRef]
- Hussain, A.K.; Seetharamaiah, N.; Pichumani, M.; Chakra, C.S. Research progress in organic zinc rich primer coatings for cathodic protection of metals—A comprehensive review. Prog. Org. Coat. 2021, 153, 106040. [Google Scholar] [CrossRef]
- Zhang, H.; Qi, Y.; Zhang, Z.; Yang, Q. Effect on N-(2-Aminoethyl)-3-Aminopropyltrimethoxysilane on the Adhesion of the Modified Silicone Tie-Coating to Epoxy Primer. Coatings 2021, 11, 71. [Google Scholar] [CrossRef]
- Zhang, Y.; Chen, Y.; Zhang, Y.; Bian, G. The long-term corrosion performance and adhesion properties of 7B04 aluminium alloy/anodic film/epoxy primer system in acidic NaCl solution. Mater. Corros. 2022, 73, 93–105. [Google Scholar] [CrossRef]
Figure 1.
Scheme of pull-off test.

Figure 2.
Specimen after the pull-off test.

Figure 3.
Response surface for regression model of the dependence of adhesion force (pull-off) between the applied coating and the substrate surface for the D1 coating thickness.
Figure 3.
Response surface for regression model of the dependence of adhesion force (pull-off) between the applied coating and the substrate surface for the D1 coating thickness.

Figure 4.
Response surface for regression model of the dependence of adhesion force (pull-off) between the applied coating and the substrate surface for the D2 coating thickness.
Figure 4.
Response surface for regression model of the dependence of adhesion force (pull-off) between the applied coating and the substrate surface for the D2 coating thickness.

Figure 5.
Response surface for regression model of the dependence of adhesion force (pull-off) between the applied coating and the substrate surface for the D3 coating thickness.
Figure 5.
Response surface for regression model of the dependence of adhesion force (pull-off) between the applied coating and the substrate surface for the D3 coating thickness.

Figure 6.
Checking the assumption on normal distribution for adhesion force.

Figure 7.
Residuals—predicted values for adhesion force.

Figure 8.
Presentation of actual and predicted values for adhesion force.

Figure 9.
Optimal parameters for achieving the best adhesive properties.


Table 1.
Coded values for the experiment plan.
| Coded Values | Factor 1—Anticorrosive Pigment Content/% | Factor 2—Conditioning Time/Hour | Factor 3—Coating Thickness | ||
|---|---|---|---|---|---|
| −1.414 | 0.34 | 32 | D1 (75–85 µm) | D2 (115–125 µm) | D3 (155–165 µm) |
| −1 | 2 | 72 | |||
| 0 | 6 | 168 | |||
| 1 | 10 | 264 | |||
| 1.414 | 11.66 | 304 | |||
Table 2.
Chemical composition of substrate material [29].
Table 2.
Chemical composition of substrate material [29].
| Chemical Composition of Substrate Material/% | |||
|---|---|---|---|
| C | P | S | N |
| 0.17 | 0.05 | 0.05 | ≤0.007 |
Table 3.
Results of the pull-off test.
| Specimen | Anticorrosive Pigment Content/% | Conditioning Time/Hour | Coating Thickness/µm | Pull-Off/MPa |
|---|---|---|---|---|
| 1 | 2 | 72 | D1 (75–85) | 4.6 |
| 2 | 10 | 72 | D1 (75–85) | 4.2 |
| 3 | 2 | 264 | D1 (75–85) | 4.7 |
| 4 | 10 | 264 | D1 (75–85) | 4.2 |
| 5 | 0.34 | 168 | D1 (75–85) | 4.6 |
| 6 | 11.66 | 168 | D1 (75–85) | 4.5 |
| 7 | 6 | 32 | D1 (75–85) | 4.1 |
| 8 | 6 | 304 | D1 (75–85) | 4.7 |
| 9 | 6 | 168 | D1 (75–85) | 4.6 |
| 10 | 6 | 168 | D1 (75–85) | 4.7 |
| 11 | 6 | 168 | D1 (75–85) | 4.6 |
| 12 | 6 | 168 | D1 (75–85) | 4.8 |
| 13 | 6 | 168 | D1 (75–85) | 4.9 |
| 14 | 2 | 72 | D2 (115–125) | 4.5 |
| 15 | 10 | 72 | D2 (115–125) | 4.4 |
| 16 | 2 | 264 | D2 (115–125) | 4.6 |
| 17 | 10 | 264 | D2 (115–125) | 4.3 |
| 18 | 0.34 | 168 | D2 (115–125) | 4.3 |
| 19 | 11.66 | 168 | D2 (115–125) | 4.3 |
| 20 | 6 | 32 | D2 (115–125) | 4.4 |
| 21 | 6 | 304 | D2 (115–125) | 4.2 |
| 22 | 6 | 168 | D2 (115–125) | 4.5 |
| 23 | 6 | 168 | D2 (115–125) | 4.5 |
| 24 | 6 | 168 | D2 (115–125) | 4.8 |
| 25 | 6 | 168 | D2 (115–125) | 4.8 |
| 26 | 6 | 168 | D2 (115–125) | 4.6 |
| 27 | 2 | 72 | D3 (155–165) | 4.8 |
| 28 | 10 | 72 | D3 (155–165) | 4.5 |
| 29 | 2 | 264 | D3 (155–165) | 5.3 |
| 30 | 10 | 264 | D3 (155–165) | 4.4 |
| 31 | 0.34 | 168 | D3 (155–165) | 4.8 |
| 32 | 11.66 | 168 | D3 (155–165) | 4.4 |
| 33 | 6 | 32 | D3 (155–165) | 4.7 |
| 34 | 6 | 304 | D3 (155–165) | 4.8 |
| 35 | 6 | 168 | D3 (155–165) | 5.1 |
| 36 | 6 | 168 | D3 (155–165) | 5.1 |
| 37 | 6 | 168 | D3 (155–165) | 4.9 |
| 38 | 6 | 168 | D3 (155–165) | 5 |
| 39 | 6 | 168 | D3 (155–165) | 5.1 |
Table 4.
Simulation using four models in Design Expert of adhesion force (pull-off) between the applied coating and the substrate surface.
Table 4.
Simulation using four models in Design Expert of adhesion force (pull-off) between the applied coating and the substrate surface.
| Source | Model p Value | Lack of Fit p Value | Adjusted R2 | Predicted R2 |
|---|---|---|---|---|
| Linear | 0.0002 | 0.0078 | 0.4074 | 0.3015 |
| 2FI | 0.3212 | 0.0076 | 0.4266 | 0.2050 |
| Quadratic | <0.0001 | 0.2149 | 0.7363 | 0.5438 |
| Cubic | 0.2146 | 0.2923 | 0.7716 | 0.2997 |
Table 5.
Analysis of variance for the regression model for adhesion force between the applied coating and the substrate surface.
Table 5.
Analysis of variance for the regression model for adhesion force between the applied coating and the substrate surface.
| Source | Sum of Squares | df | Mean Square | F Value | p Value |
|---|---|---|---|---|---|
| Model | 2.48 | 11 | 0.2253 | 10.65 | <0.0001 |
| A—Anticorrosive pigment content | 0.4286 | 1 | 0.4286 | 20.25 | 0.0001 |
| B—Conditioning time | 0.0607 | 1 | 0.0607 | 2.87 | 0.1018 |
| C—Coating thickness | 0.9431 | 2 | 0.4715 | 22.29 | <0.0001 |
| AB | 0.0675 | 1 | 0.0675 | 3.19 | 0.0853 |
| AC | 0.1167 | 2 | 0.0584 | 2.76 | 0.0813 |
| BC | 0.0984 | 2 | 0.0492 | 2.33 | 0.1170 |
| A2 | 0.4312 | 1 | 0.4312 | 20.38 | 0.0001 |
| B2 | 0.4312 | 1 | 0.4312 | 20.38 | 0.0001 |
| Residual | 0.5713 | 27 | 0.0212 | - | - |
| Lack of Fit | 0.3793 | 15 | 0.0253 | 1.58 | 0.2149 |
| Pure Error | 0.1920 | 12 | 0.0160 | - | - |
| Cor Total | 3.05 | 38 | - | - | - |
Table 6.
Standard errors of regression coefficients-adhesion force.
| Term | Coefficient Estimate | df | Standard Error | 95% CI Low | 95% CI High |
|---|---|---|---|---|---|
| Independent variable | 4.80 | 1 | 0.0376 | 4.72 | 4.88 |
| A—Anticorrosive pigment content | −0.1336 | 1 | 0.0297 | −0.1946 | −0.0727 |
| B—Conditioning time | 0.0503 | 1 | 0.0297 | −0.0106 | 0.1112 |
| C(1) | −0.0692 | 1 | 0.0329 | −0.1368 | −0.0016 |
| C(2) | −0.1462 | 1 | 0.0329 | −0.2137 | −0.0786 |
| AB | −0.0750 | 1 | 0.0420 | −0.1612 | 0.0112 |
| AC(1) | 0.0035 | 1 | 0.0420 | −0.0827 | 0.0896 |
| AC(2) | 0.0836 | 1 | 0.0420 | −0.0025 | 0.1698 |
| BC(1) | 0.0683 | 1 | 0.0420 | −0.0179 | 0.1544 |
| BC(2) | −0.0857 | 1 | 0.0420 | −0.1718 | 0.0005 |
| A² | −0.1437 | 1 | 0.0318 | −0.2091 | −0.0784 |
| B² | −0.1438 | 1 | 0.0318 | −0.2091 | −0.0784 |
Table 7.
Defined limitations for optimization of parameters.
| Name | Goal | Lower Limit | Upper Limit |
|---|---|---|---|
| A: Anticorrosive pigment content/% | is in range | 2 | 10 |
| B: Conditioning time/hour | is in range | 72 | 264 |
| C: Coating thickness | is in range | D1 | D3 |
| Pull-off/MPa | maximize | 4.1 | 5.3 |
Table 8.
Solution for three combinations of categorical factor levels.
| Number | Anticorrosive Pigment Content/% | Conditioning Time/Hour | Coating Thickness | Pull-Off/MPa |
|---|---|---|---|---|
| 1 | 2.441 | 212.825 | D3 | 5.129 |
| 3 | 3.597 | 222.652 | D1 | 4.804 |
| 4 | 5.389 | 159.992 | D2 | 4.659 |
Publisher’s Note: MDPI stays neutral with regard to jurisdictional claims in published maps and institutional affiliations. |
© 2022 by the authors. Licensee MDPI, Basel, Switzerland. This article is an open access article distributed under the terms and conditions of the Creative Commons Attribution (CC BY) license (https://creativecommons.org/licenses/by/4.0/).
Share and Cite
MDPI and ACS Style
Šolić, T.; Marić, D.; Novoselović, D.; Samardžić, I. Optimization of Parameters for Protection of Materials by Primer Application. Coatings 2022, 12, 413. https://doi.org/10.3390/coatings12030413
AMA Style
Šolić T, Marić D, Novoselović D, Samardžić I. Optimization of Parameters for Protection of Materials by Primer Application. Coatings. 2022; 12(3):413. https://doi.org/10.3390/coatings12030413
Chicago/Turabian StyleŠolić, Tomislav, Dejan Marić, Daniel Novoselović, and Ivan Samardžić. 2022. "Optimization of Parameters for Protection of Materials by Primer Application" Coatings 12, no. 3: 413. https://doi.org/10.3390/coatings12030413
Note that from the first issue of 2016, this journal uses article numbers instead of page numbers. See further details here.