Research on the Metal Corrosion Process in the Sea Mud/Seawater/Atmosphere Interface Zone
by
 ,
,
Zhiwei Chen
1,2,† ,
,
Wenting Xia
1,2,†,
Caiqi Yao
1,2,
Zhifeng Lin
1,2,
Wei Zhang
1,2,* and
Weihua Li
1,2,3 1
School of Chemical Engineering and Technology, Sun Yat-sen University, Zhuhai 519082, China
2
Southern Marine Science and Engineering Guangdong Laboratory (Zhuhai), Zhuhai 519082, China
3
Key Laboratory of Marine Environmental Corrosion and Bio-fouling, Institute of Oceanology, Chinese Academy of Sciences, Qingdao 266071, China
*
Author to whom correspondence should be addressed.
†
These authors contributed equally to this work.
Coatings 2020, 10(12), 1219; https://doi.org/10.3390/coatings10121219
Submission received: 19 November 2020
/
Revised: 2 December 2020
/
Accepted: 11 December 2020
/
Published: 14 December 2020
(This article belongs to the Special Issue Corrosion Science and Surface Engineering)
Abstract
:Corrosion in the interface zone is a complicated local corrosion phenomenon. The conventional single-electrode method finds it difficult to obtain the kinetic information of corrosion occurrence and development process. In this paper, metal corrosion was studied by Wire Beam Electrode (WBE) technology on the interfaces of sea mud/seawater and seawater/atmosphere. The study found that the metal corrosion in the interface is a process of coupling a dual corrosion cell into a single corrosion cell. Initially, a corrosion cell is formed with the seawater/atmosphere interface acting as the cathode and the upper part of the metal in the seawater area as the anode. This is due to the oxygen concentration cell caused by the waterline effect. The cathode area is always enriched near the seawater/atmosphere interface. The lower part of the metal in the seawater area and the metal in the sea mud area are the anode and the cathode, respectively, of another corrosion cell. Along with the immersion time, the anodic area of the first corrosion cell gradually extends to the lower part of the metal in the seawater zone and finally the sea mud zone, resulting in the disappearance of the second corrosion cell. In the single corrosion cell stage, the seawater/atmosphere interface is the cathode area; the seawater area and the sea mud area are the anode areas, and the electrode adjacent to the cathode area becomes the anode area with the largest current density. During the whole experiment, the sea mud zone is a process of polarity transition from the cathode zone to the anode zone, and finally forms the anode zone of the whole electrode together with the anode zone in the sea zone.
1. Introduction
Corrosion is a naturally occurring phenomenon with costly and harmful effects on critical industry sectors [1,2,3,4,5,6]. Drilling platforms and steel piles exposed to the marine environment are typically located in five zones: the atmospheric zone, splash zone, tidal zone, full immersion zone and marine mud zone [7,8]. The corrosion of these sectors near the two-phase interface is particularly serious, because the environmental factors on both sides of the two-phase interface are very different, resulting in difference in the reaction mechanism and the body system at the two-phase interface.
Many observations and much research has been focused on metal corrosion in each zone or between adjacent zones [9]. Jeffrey used a raft to study the steel corrosion loss profiles adjacent to the water-line (between atmospheric zone and tidal zone) in calm natural seawater [10]. The high corrosion loss some 200 mm below the waterline observed in the experiment was consistent with classical laboratory studies. This indicated that it was the result of an oxygen concentration cell with the well-aerated immediate waterline region becoming cathodic to the less well-aerated immersed parts of the steel strip that became anodic. Hou obtained the corrosion characteristics of steel in the marine environment through an electrical connection test [11]. Zhang found that the galvanic couple effect appeared between the same steel samples in the seawater–sea mud transition region [12].
However, due to the lack of in-situ electrochemical information, it is difficult to obtain accurate information of alternating cathodic–anodic processes and corrosion dynamics via microscopic observations and weight-loss measurement [13]. The Wire Beam Electrode (WBE) is an in-situ electrochemical technique capable of measuring surface potential and current distribution, especially for complex multi-interface corrosion.
Tan used a WBE to study the long-term corrosion behavior of carbon steel in the water-line area [14]. Chen studied waterline corrosion processes of carbon steel in the seawater–atmosphere interface by the WBE technique [15]. It was found that under the action of an oxygen concentration cell, the vicinity of seawater–atmosphere was the cathode area, and the seawater area was the anode area. Hu studied the corrosion law of carbon steel at the seawater–atmosphere interface through WBE technology [16]. The results showed that the corrosion of carbon steel at the seawater–atmosphere interface was controlled by many factors such as potential difference, the concentration of dissolved oxygen and corrosion products. We investigated the processes of waterline corrosion in natural and artificial seawater by WBE [17]. Deng used WBE technology to study the corrosion behavior of X70 steel in the seawater–sea mud transition zone [18]. It was found that the corrosion current peak was formed in the area near the seawater–sea mud interface.
Previous experiments only involved a single interface region and did not take the simultaneous influence of multiple interface regions into consideration. In order to explore the influence of waterline (seawater–atmosphere interface) action on multiple areas, here WBE technology was used to study the corrosion process of carbon steel under waterline action at the interfaces of sea mud/seawater and seawater/atmosphere.
2. Experimental
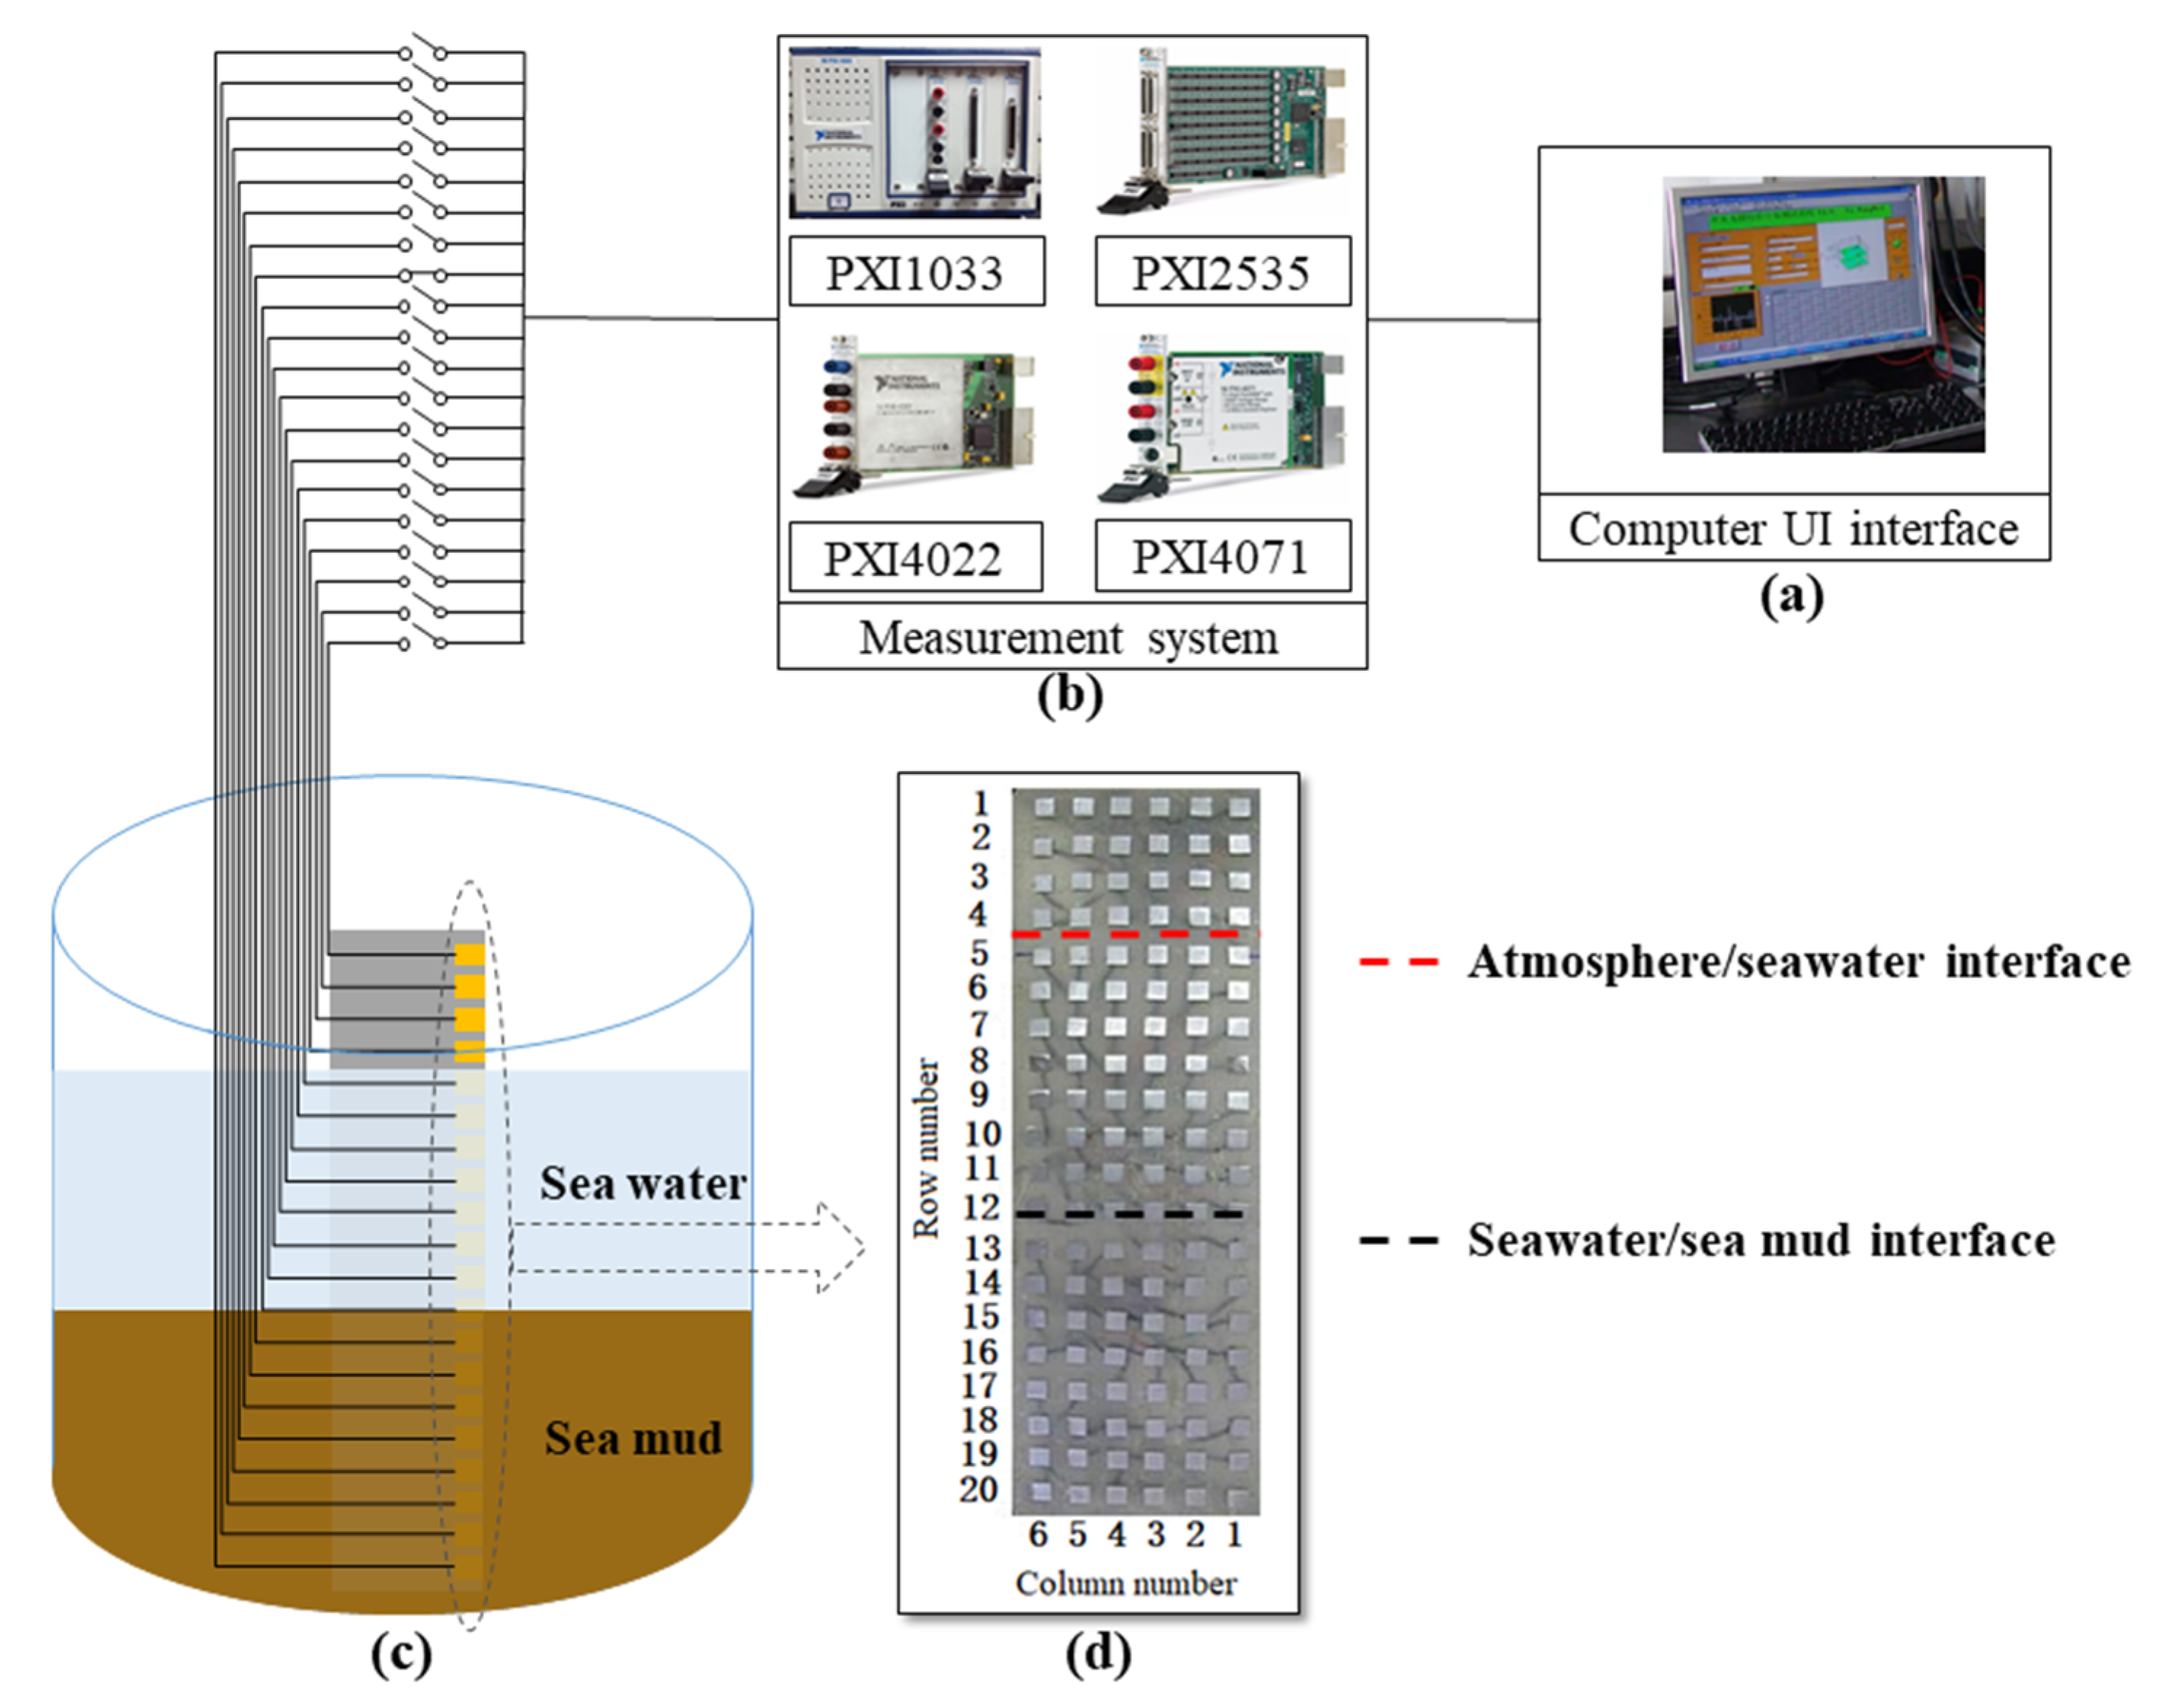
Figure 1 displays a schematic diagram of the experimental setup required for the corrosion experiment. The WBE was fabricated by arranging carbon steel (material: Q235, side length: 10 mm, interval: 10 mm) into a 6 × 20 matrix, sealed by epoxy (Figure 1d). The working surfaces of WBE were abraded with silicon carbide papers and rinsed with distilled water and ethanol before being dried by a hairdryer. The WBE is made up of rows numbered 1–20 from top to bottom and coumns numbered 1–6 from right to left.
In the experiment, the sea mud was first placed in a high-temperature sterilization pot and kept at 120° for 2 h to kill the sulfate-reducing bacteria that may exist in the sea mud, and then cooled to room temperature. The WBE was immersed in the sea mud and then injected with 3.5 wt.% NaCl solution. Distilled water was added daily to make up for the water lost due to water evaporation. The atmosphere/seawater interface (i.e., the waterline) is the middle of the epoxy resin between the electrodes in the 4th and 5th rows, and the seawater/sea mud interface is the middle of the electrodes in the 12th row. The electrodes rows 1–4, the electrodes rows 5–11 and the electrodes rows 12–20 are called the atmosphere area, the immersion area, the sea mud area, respectively. The schematic diagram is shown in Figure 1c.
The instrument for the WBE test consists of modular instruments (National Instruments Co. NI, Austin, TX, USA), as shown in Figure 1b. Before the test, all electrodes in the WBE were connected to allow the electrons to flow freely. When the current distribution test started, the first electrode disconnected from the others, and the current between the individual electrode and other connected electrodes was measured. Subsequently, the first electrode was reconnected to the other electrodes and the second electrode was disconnected and the above procedures were repeated. The above experimental process is controlled by self-designed software [19,20], as shown in Figure 1a.
3. Results and Discussion
3.1. Surface Current Density Distribution
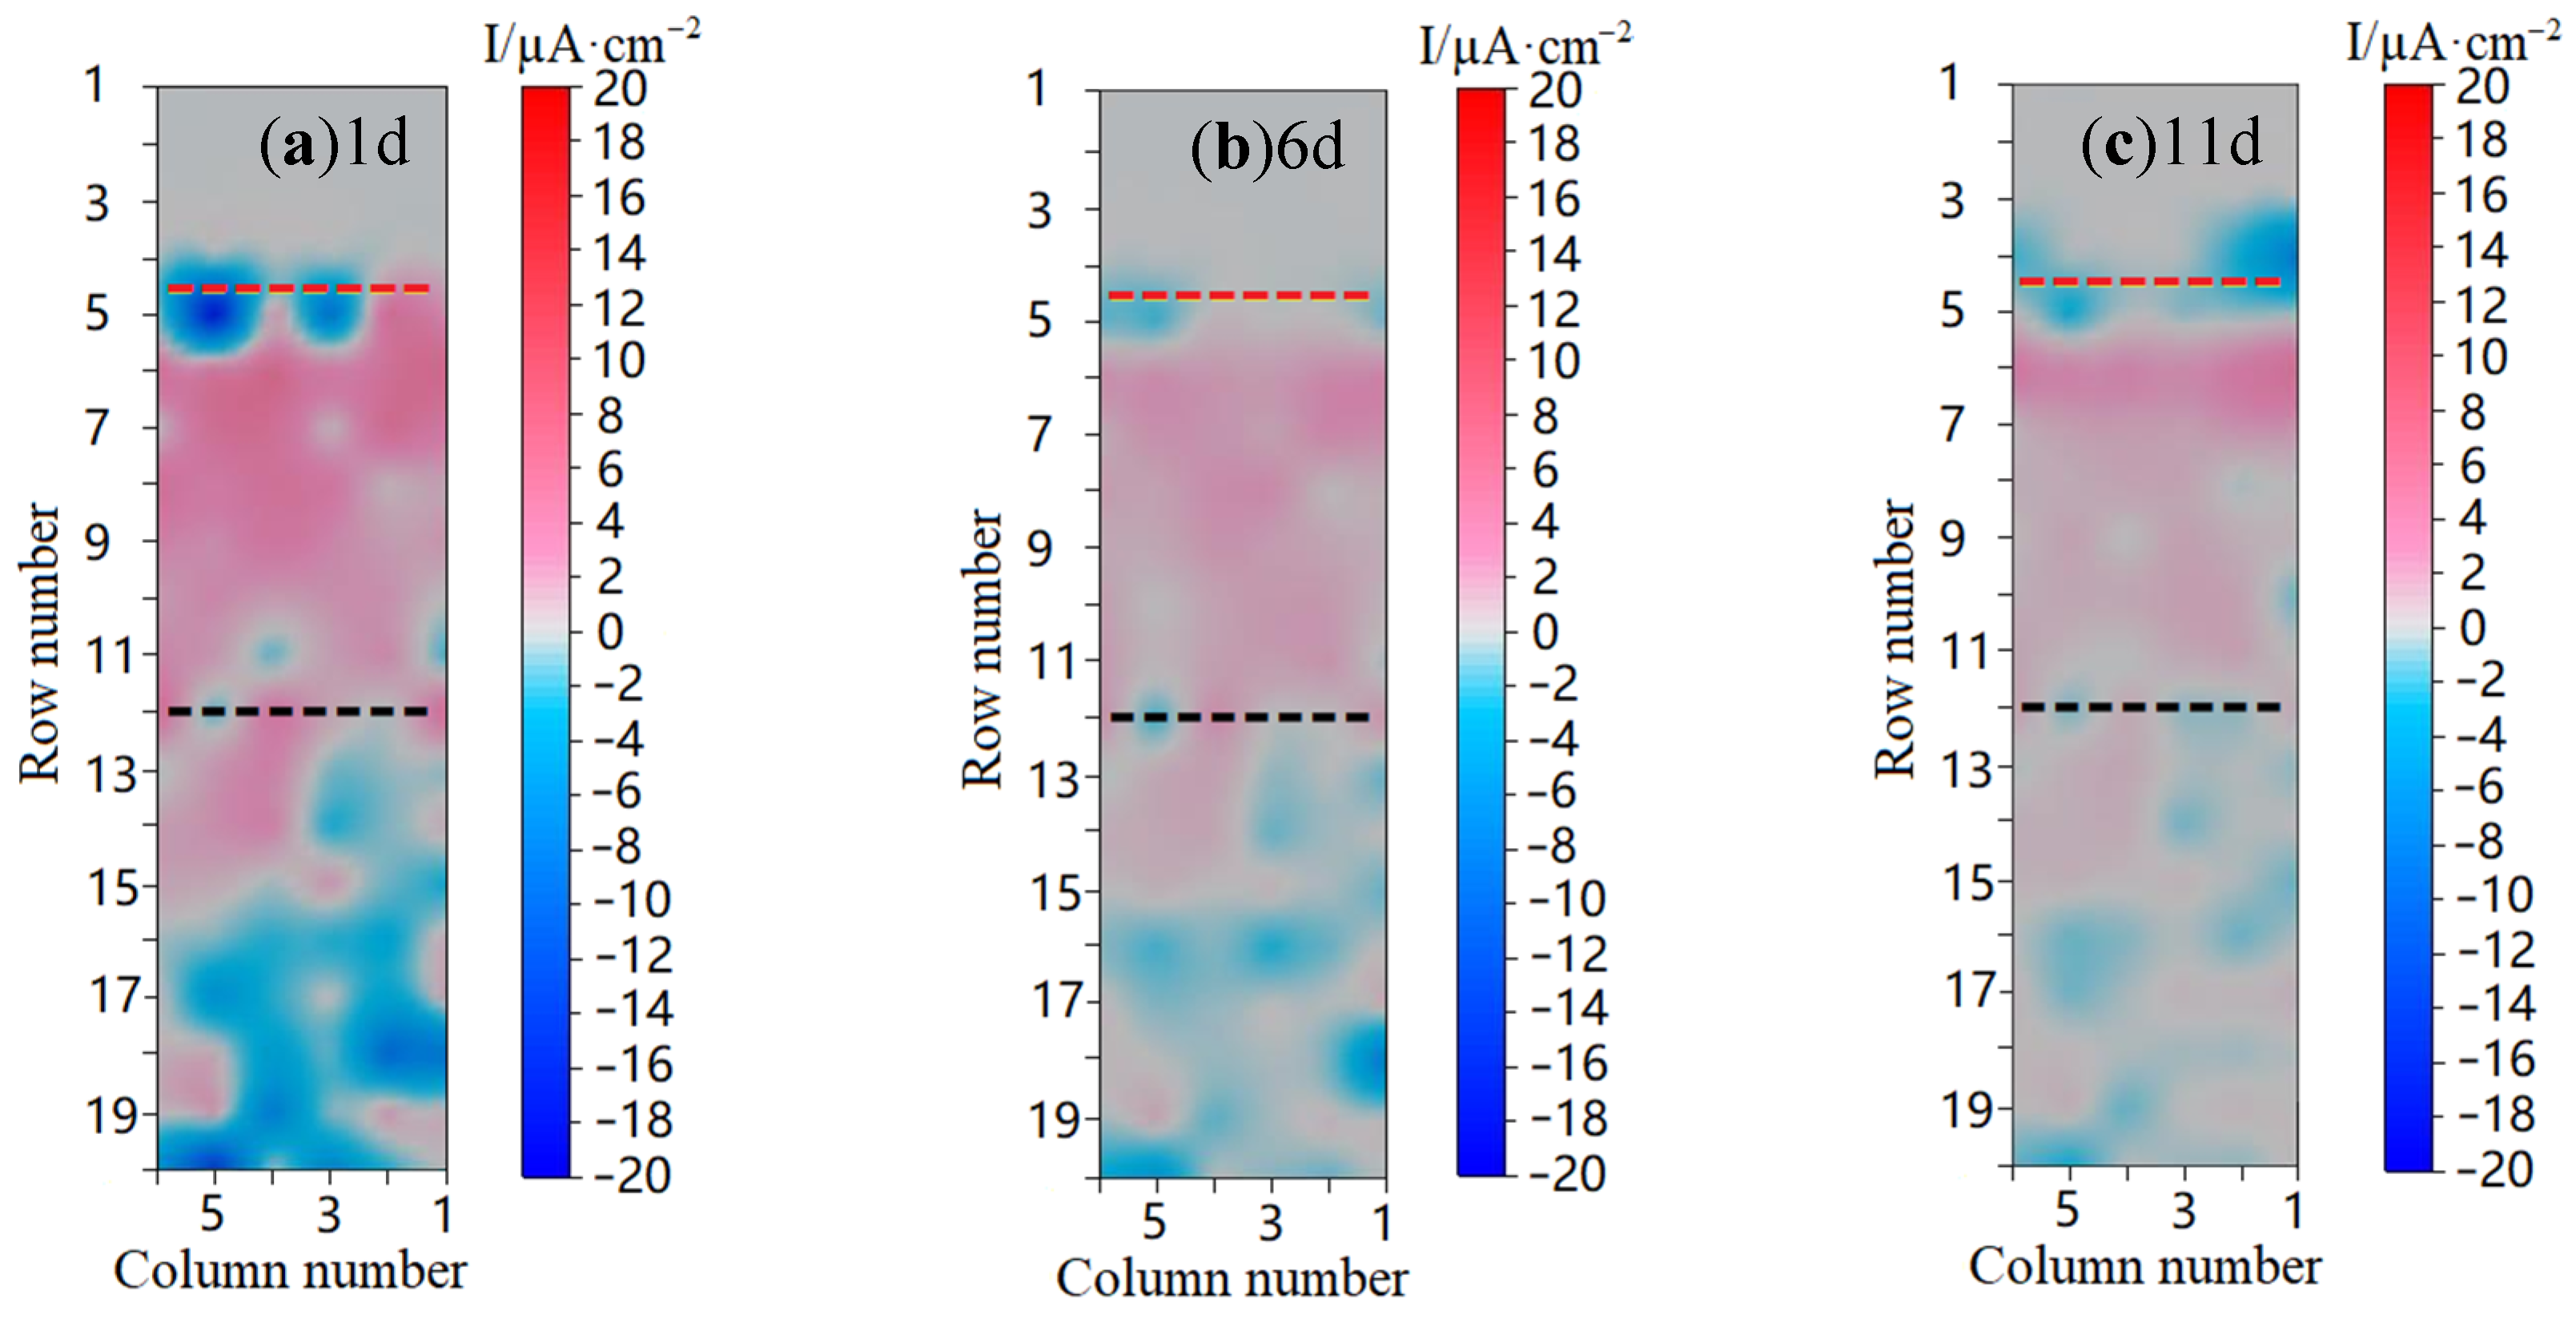
Figure 2 displays the galvanic current distribution maps of the WBE in a sea mud/seawater/atmosphere environment for various days. The red dotted line is the atmospheric/seawater interface, and the black dotted line is the seawater/mud interface.
Figure 2a shows the WBE surface distribution of the anode and cathode area on the first day of the experiment. It can be seen that the atmosphere/seawater interface was dominated by the cathode reaction; the upper part of the seawater area was the anode area. There was no clear boundary between the cathode and the anode area near the seawater/mud interface in the 12th row. The bottom and sea mud area were the coexistence region between the anode and the cathode area. At this time, the WBE was in the initial stage of metal corrosion, and dual corrosion cell was established. Oxygen concentration cells were formed between the seawater area and the area near the waterline, and between the seawater area and the sea mud area, respectively.
The cathode reaction tends to occur near the waterline due to the high oxygen exchange rate and oxygen concentration. With the increase in water depth, the concentration of dissolved oxygen decreases, and the anodic reaction occurs easily [21]. In the previous experiment, we tested the concentration of dissolved oxygen at different depths and found that there was a 2.58 mg/L concentration difference between the bottom and the top [22]. Oxygen exists in the clearance of sea mud and oxygen reduction reaction occurs, so the cathode reaction is the main reaction in the sea mud area.
On the 6th day, the color of the cathode area and anode area was significantly lighter than that of immersion for the 1st day, indicating that the current density decreased, as shown in Figure 2b. No significant cathode current was observed in the area above the waterline, and there was no driving factor for anodic reaction. The oxygen in the sea mud was gradually consumed by the cathode reaction, and the oxygen concentration decreased, leading to the cathode reaction slowing down. Due to the coupling of the cathode and anode, the anodic reaction was weakened and the anodic current density decreased.
On the 11th day, the color of the cathode in the sea mud area and the anode in the lower part of the seawater area further lightened, indicating the further decrease in the current density. The anode color at the upper part of the seawater area (near the waterline) was darker than that on the 6th day, indicating an increase in current density. Oxygen in the sea mud was further consumed by the cathode reaction, which slowed down the cathode reaction and weakened the anode reaction at the lower part of the seawater area. The cathode current appeared in the area above the waterline, which promoted the positive reaction in the upper part of the seawater area. An invisible liquid film was formed on the surface of the metal electrode in this area [23], which conducts with the electrolyte solution below the waterline. The cathode reduction reaction of oxygen occurs in this area, so the area presents as the cathode current [15].
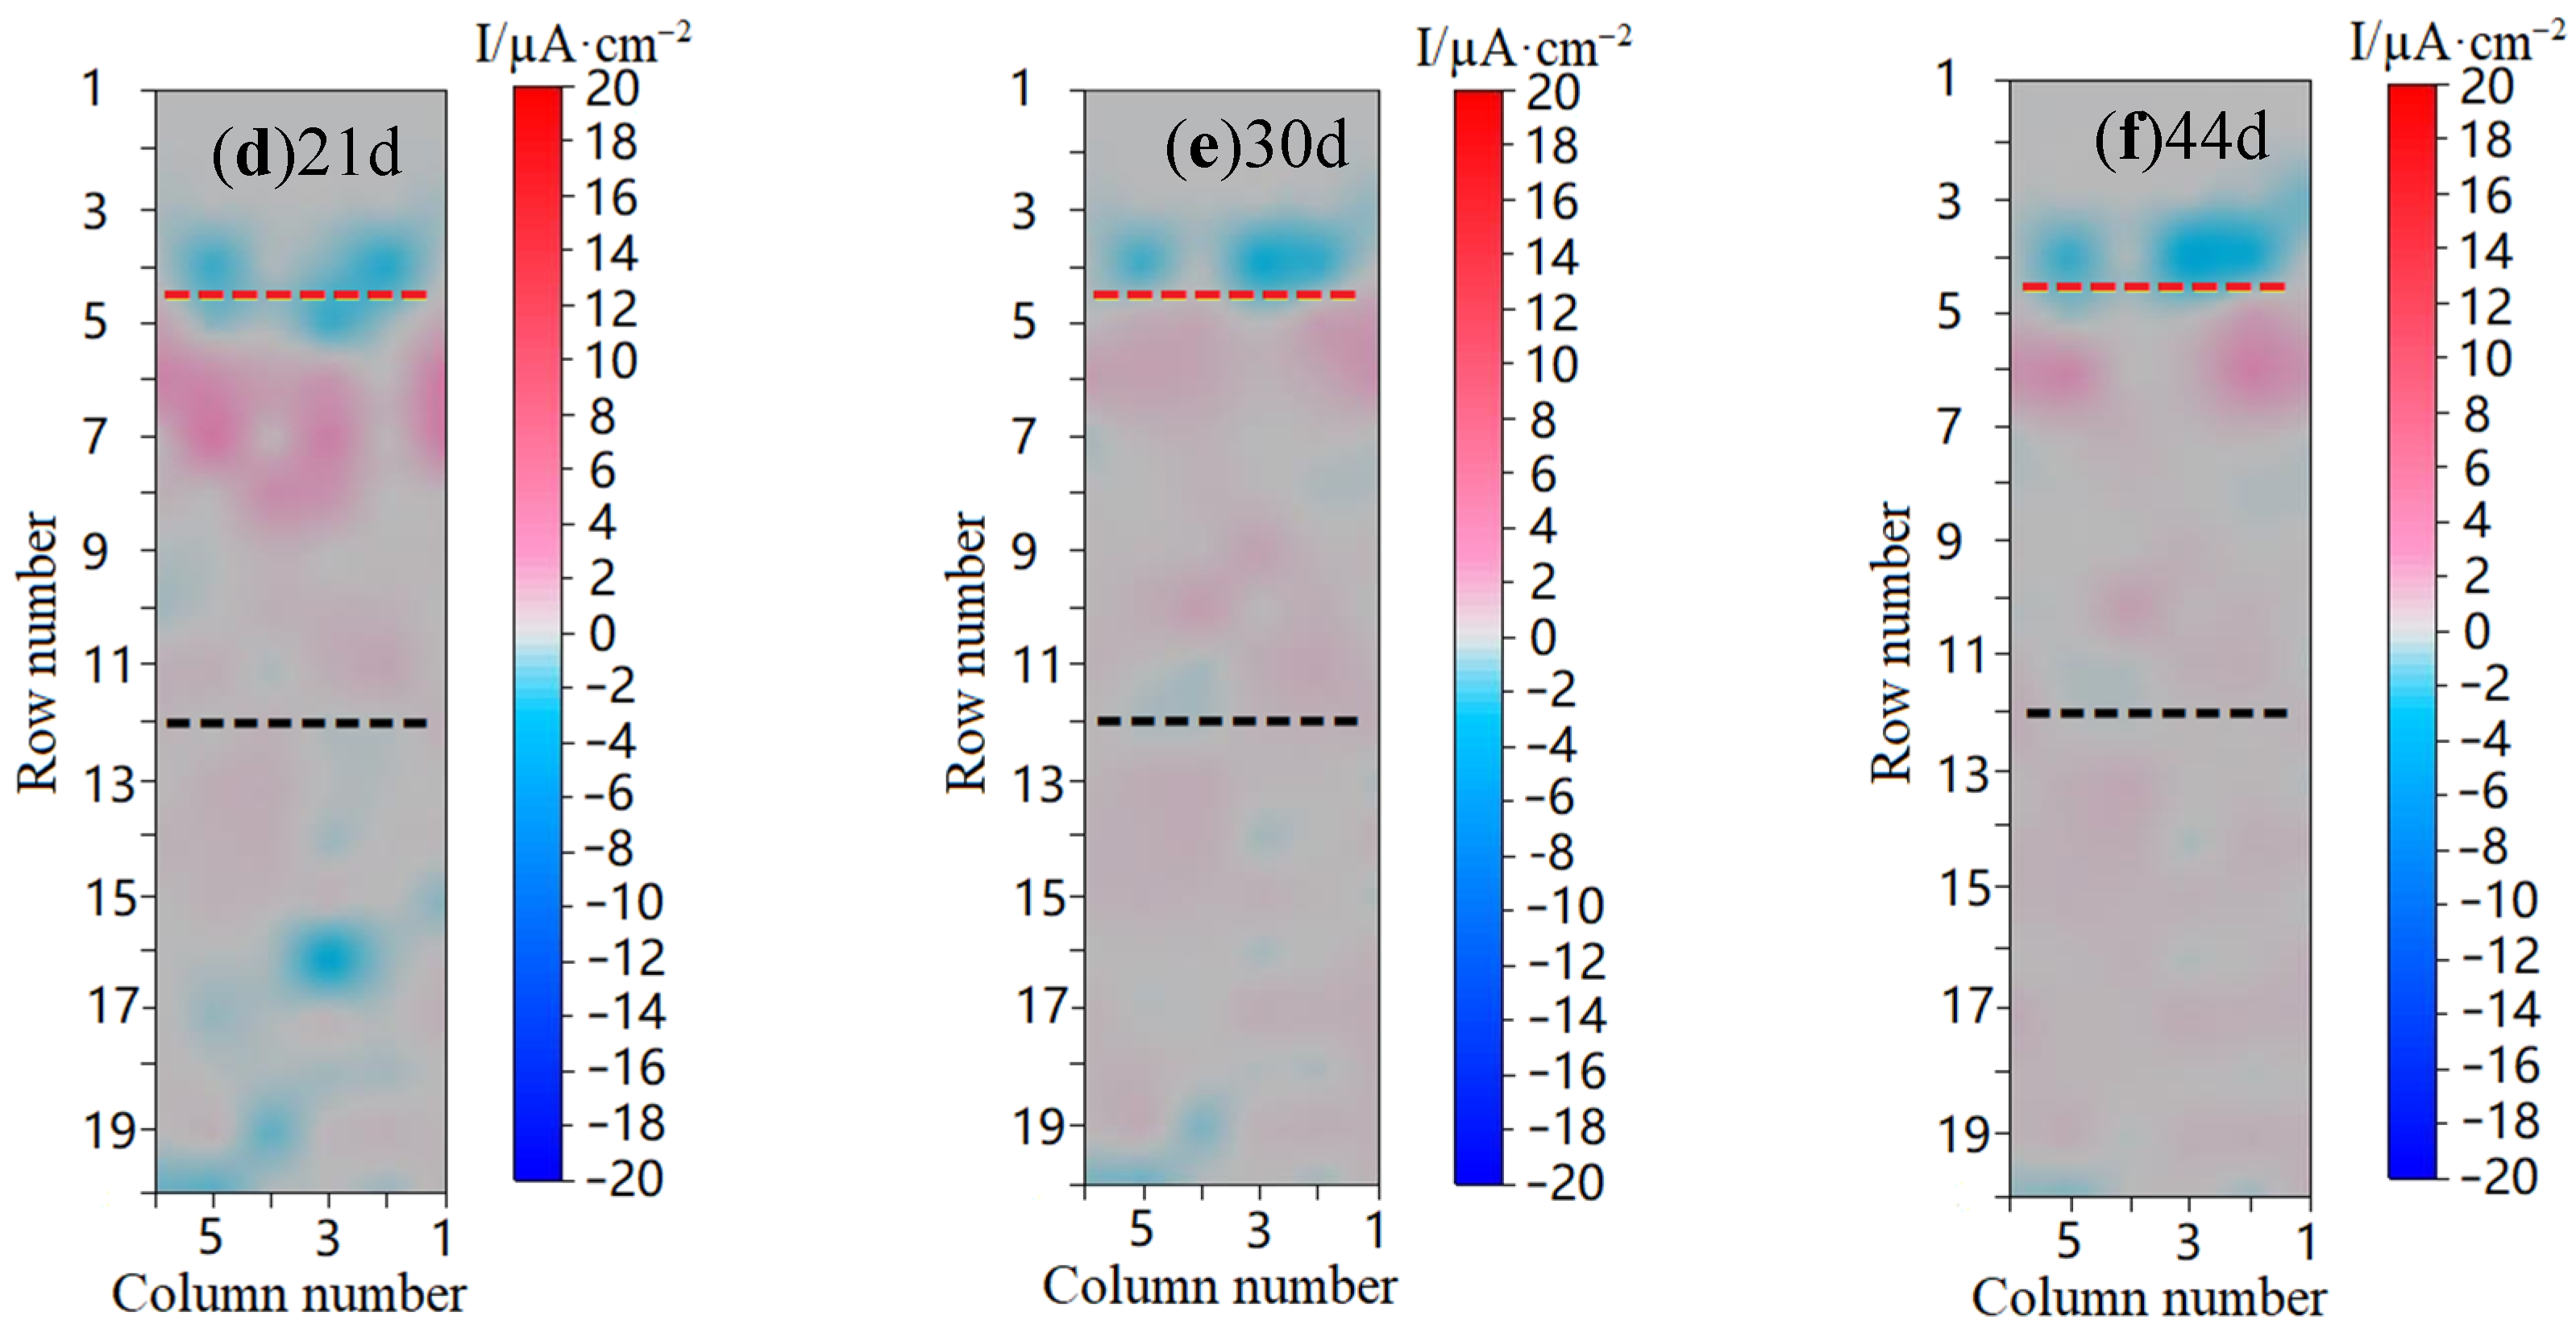
On the 21st day, the cathode reaction in the sea mud area was further weakened and gradually changed to the anode reaction, as shown in Figure 2d. With the depletion of oxygen in the sea mud interstitial, the cathode reaction gradually decreased. it was difficult for the oxygen to diffuse into sea mud and the reaction was reversed from cathode to weak anode. At this stage, the electrode was in the coupling stage of the dual corrosion cell. The anodic reaction in seawater decreased gradually and the anodic area in the coexistence region expanded continuously.
With the progress of the experiment, the cathode area in the sea mud area basically disappeared on the 30th day of immersion, and the corrosion process entered the stage of a single corrosion cell. Until the end of the experiment, the cathode area was near the atmosphere/seawater interface, and the seawater area and sea mud area were anode reaction areas. This was consistent with the reversal of steel plate polarity in the seawater–sea mud transition zone observed in Zhang’s experiment [12]. The reason for the change was the change of oxygen concentration in the environment and the change of steel surface state, which reflected the coupling process of multi-electrode.
The value of this research lies in the discovery of a process in which two initial galvanic cells are coupled into a single corrosion cell at the atmospheric/seawater/sea mud interface. This is the spontaneous process of the coupled multi-electrode system, which took more than one month to complete.
3.2. The Current Density Vector Sum
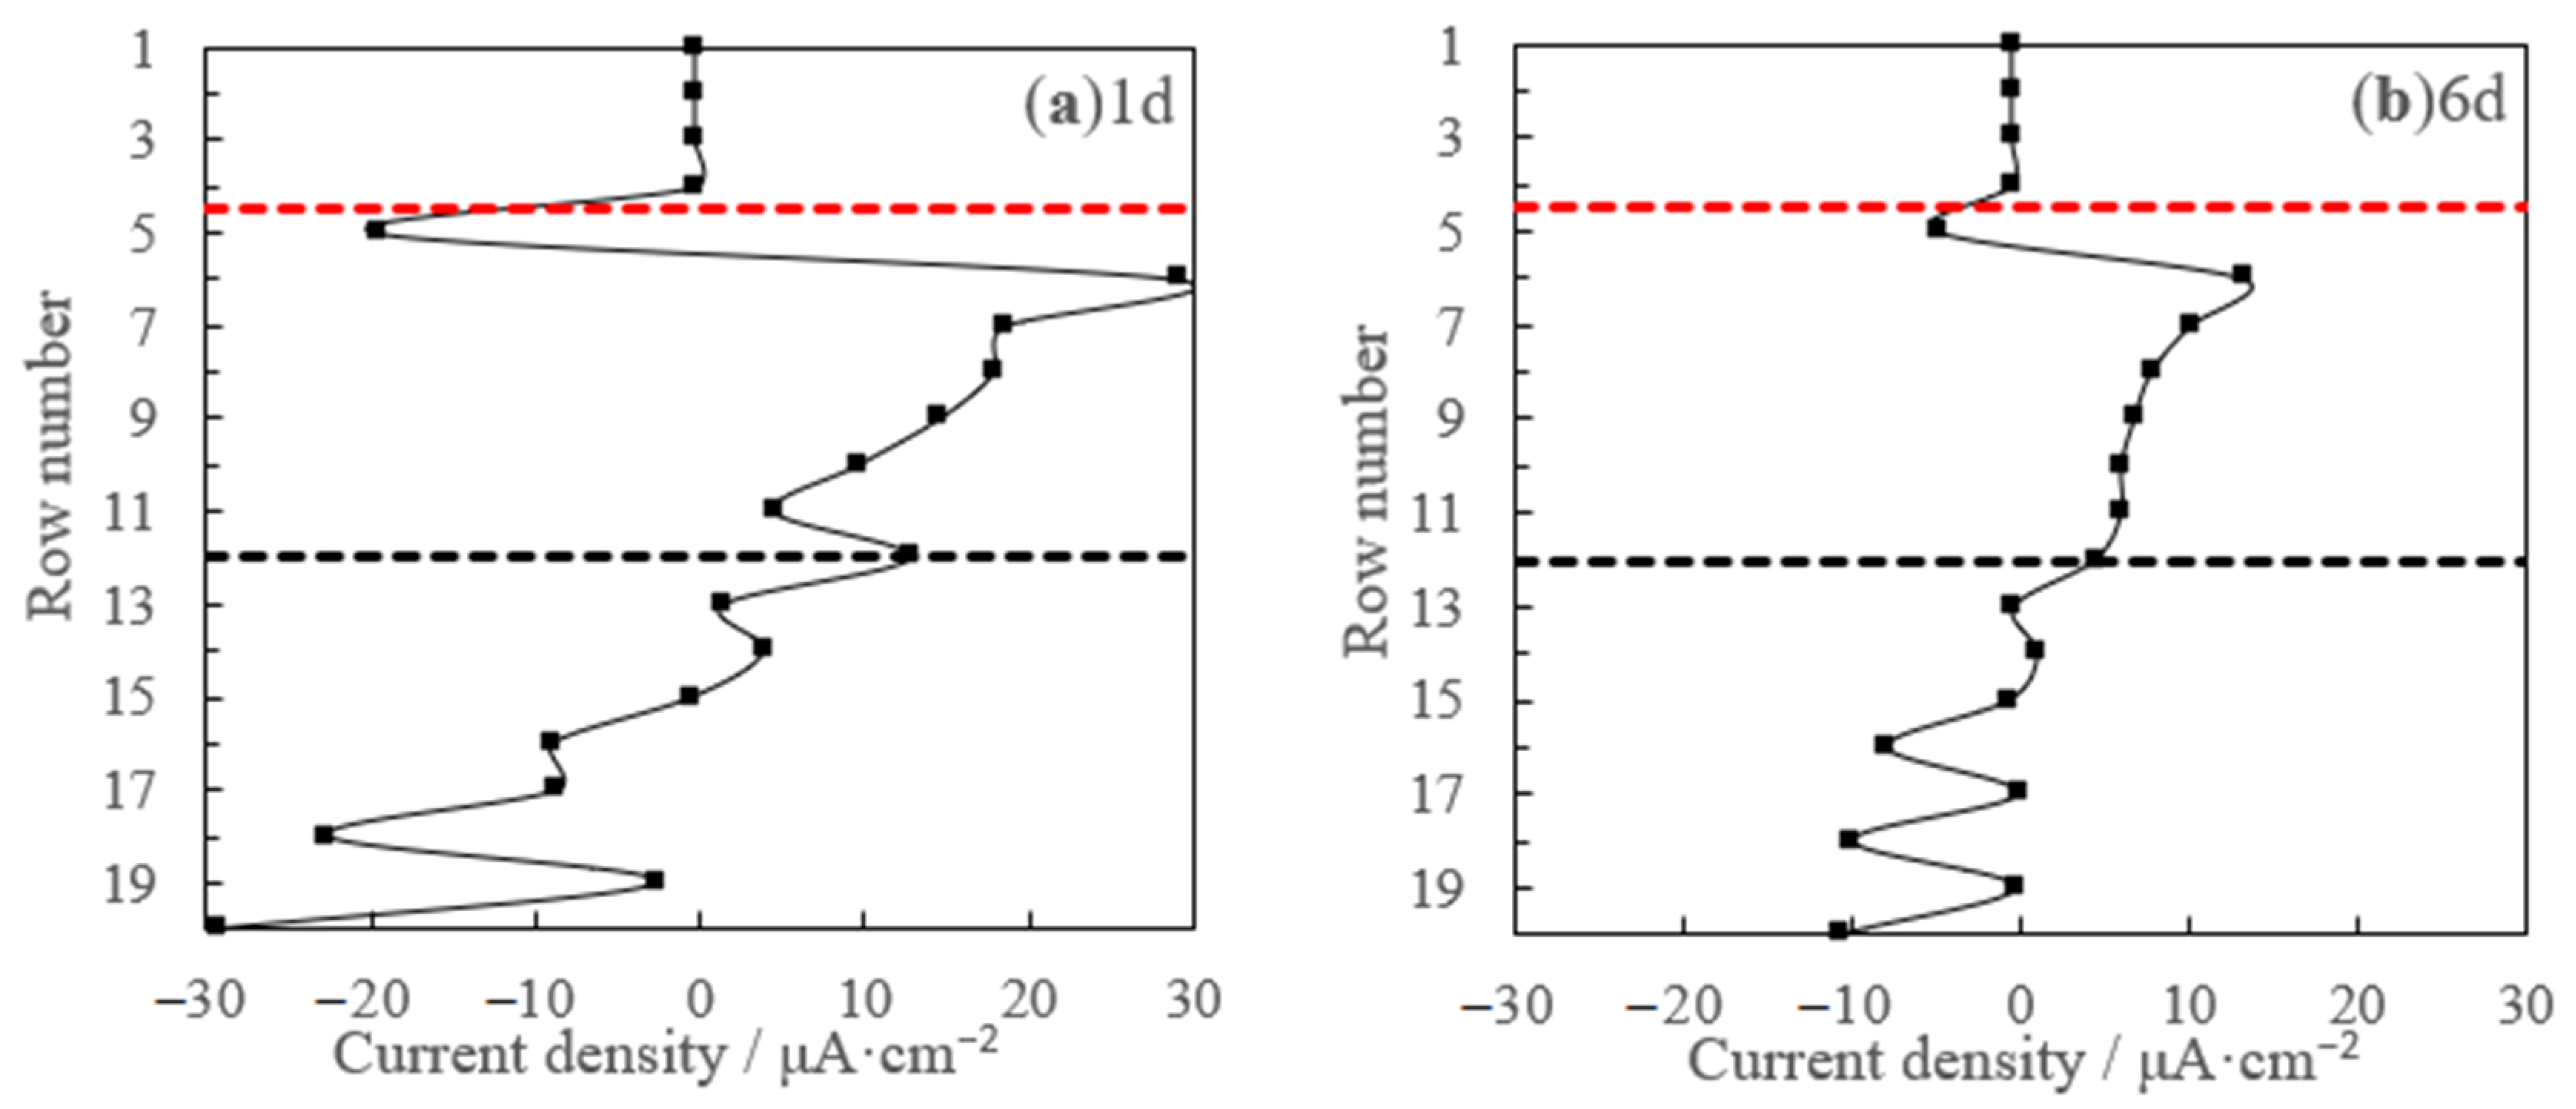
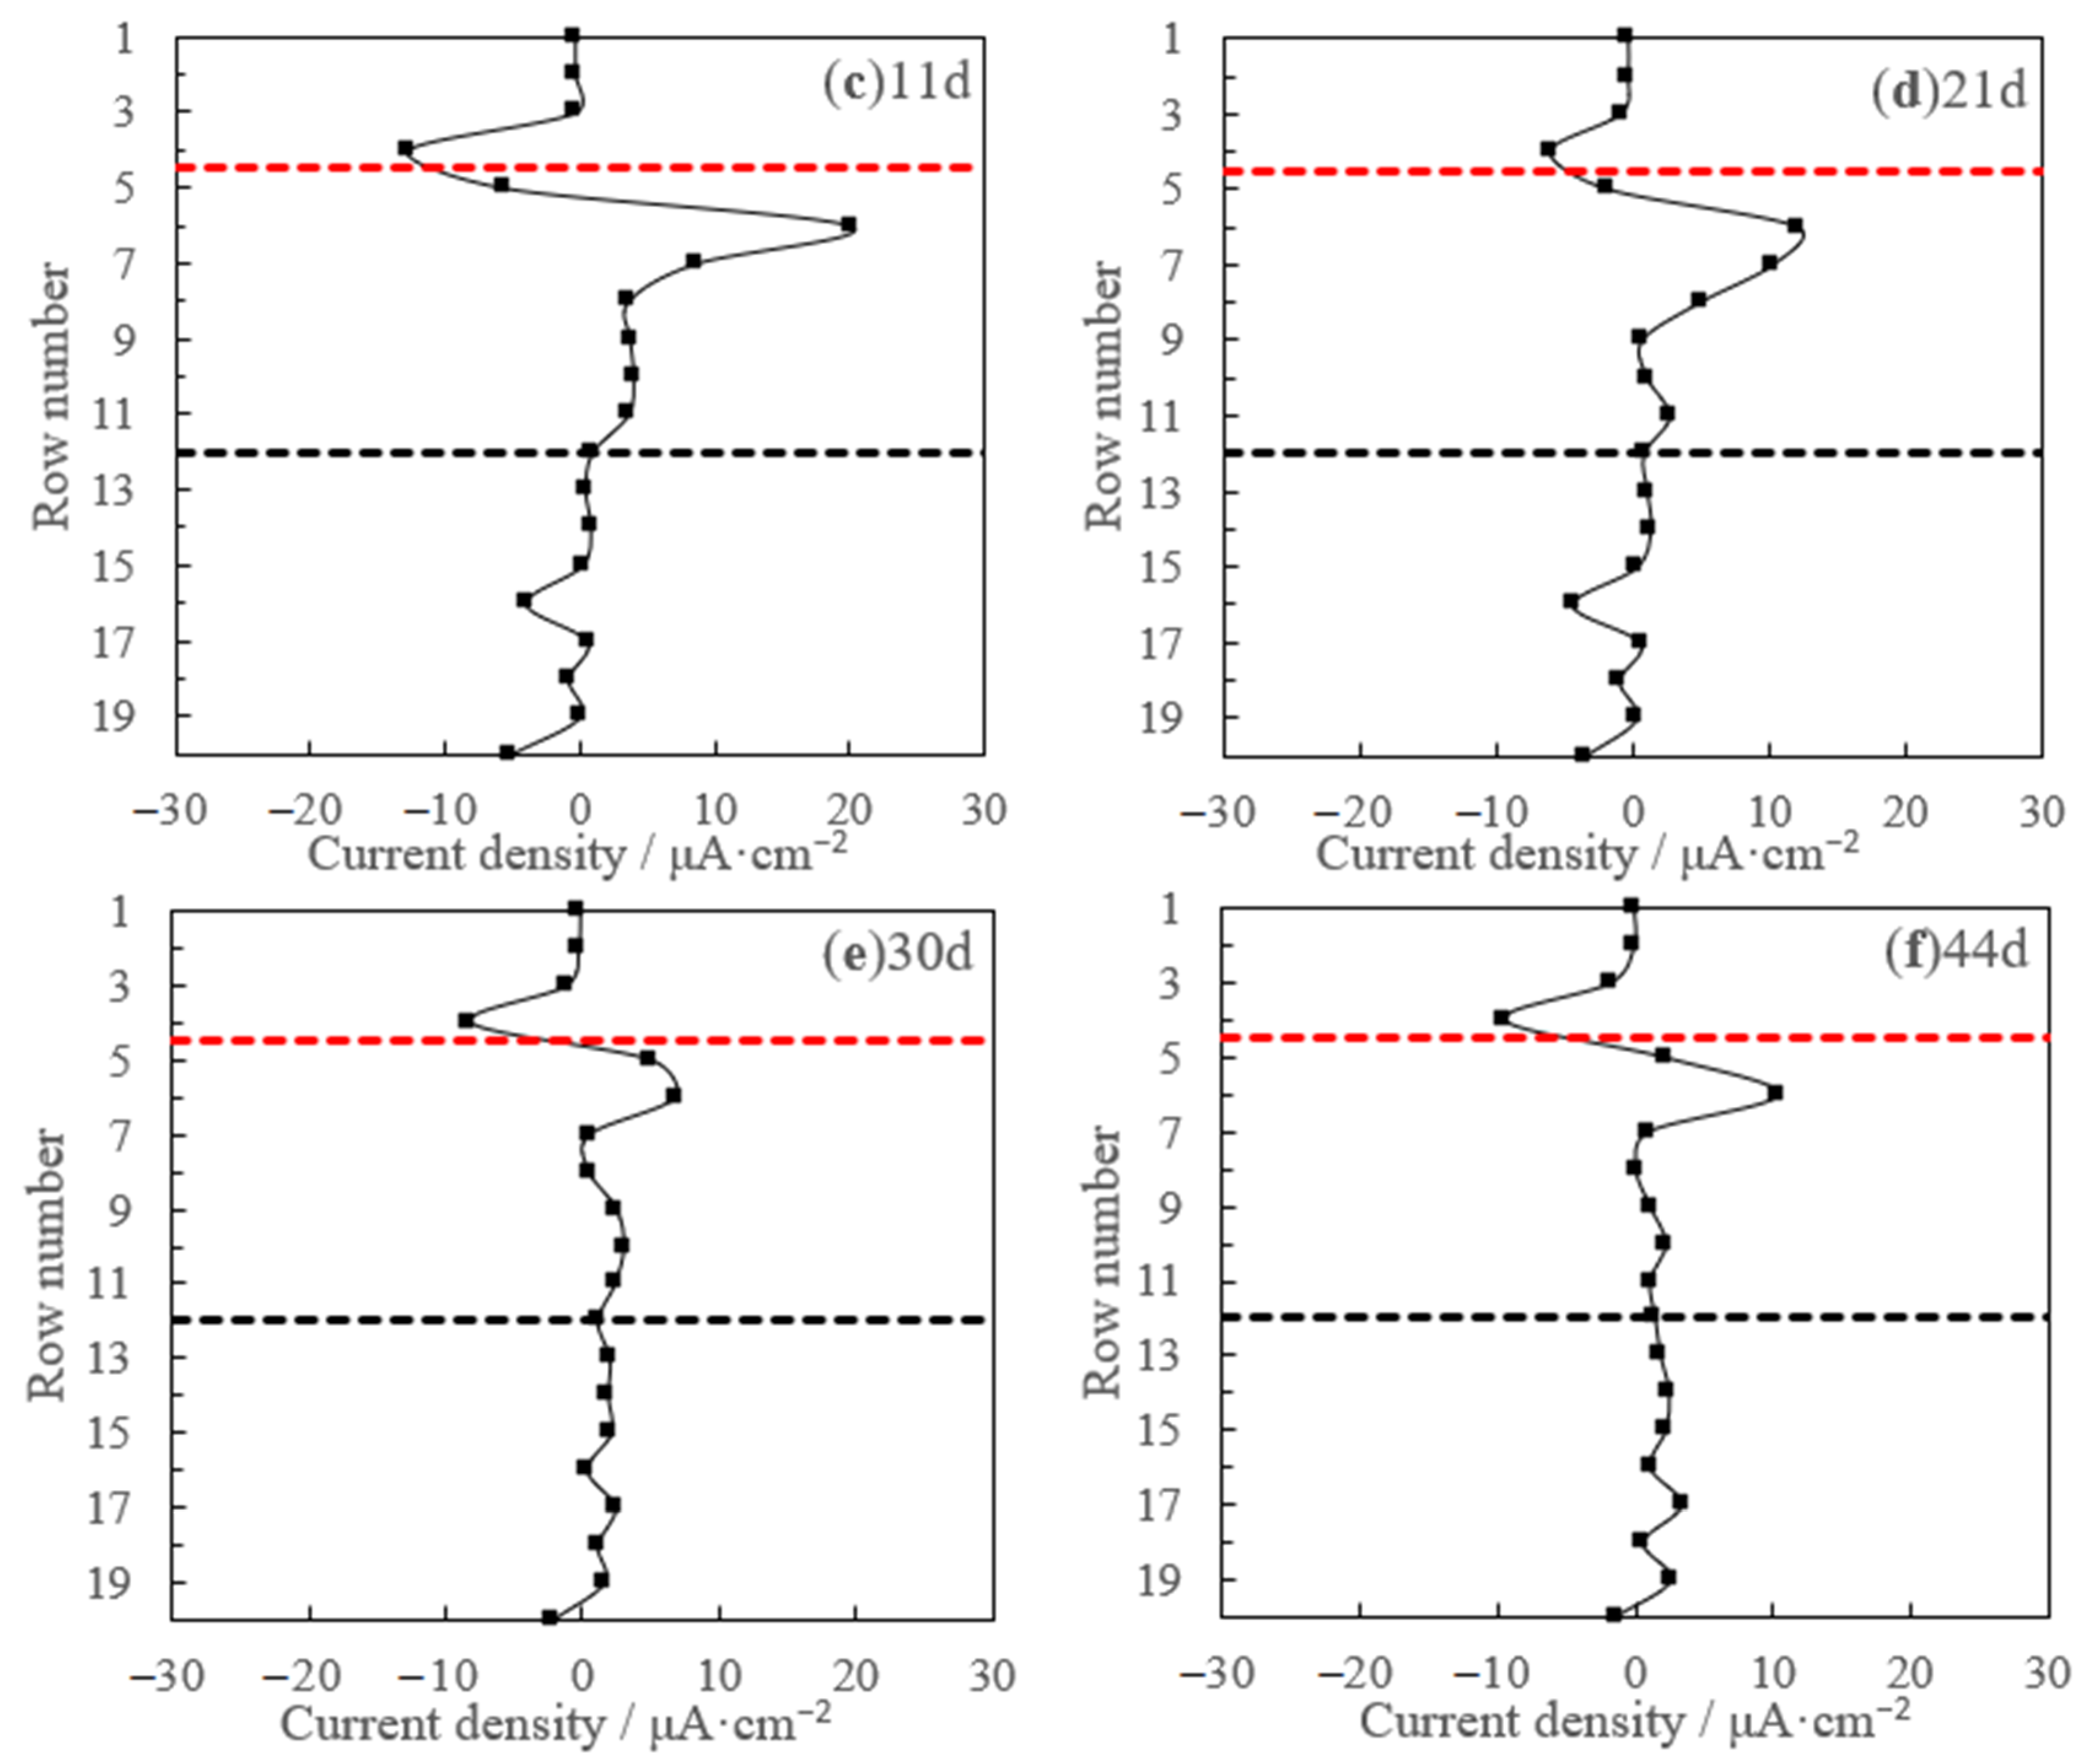
In order to illustrate the variation of current density at different depth of the electrode surface with time, we introduced the concept of single-row current density [15]. We added the current density of each row (six cylinders) to obtain the single-row current density. Figure 3 displays the current density vector sum at various immersion time. It should be noted that if the current density of a row is positive, this does not mean that all the electrodes in the row have an anodic dissolution reaction and vice versa.
It can be seen from Figure 3a that, on the first day, the single-row current density of each electrode in the atmospheric region is close to zero. In the seawater area, the 5th row electrode showed cathode current and the 6th–11th rows electrode showed anode current. In the sea mud area, the 12th–14th rows electrode showed anode current and the 15th–20th row electrode showed cathode current. The maximum single cathode current was 29.24 µA·cm−2 in the 20th row and the maximum single anode current was 29.11 µA·cm−2 in the 6th row. In the initial stage of immersion, the dissolved oxygen content near the waterline and the oxygen content in the clearance of sea mud was sufficient, making the upper part of the seawater area and sea mud area become the main areas of cathode reaction. The cathode reaction drove the anode reaction to proceed rapidly, so the anode current density was high in the initial stage [24]. On the 6th day, the vector sum of the current density of each electrode in the atmospheric region was still close to zero, and the current distribution in the seawater region and the sea mud region did not change.
In the initial stage of the dual corrosion cell, the place near the seawater/atmosphere interface was cathode current, the seawater area was anode current, and the sea mud area was the coexistence region of cathode current and anode current (as shown in Figure 3a,b).
On the 11th day, the 4th row electrode in the atmospheric area showed obvious cathode current, while the current distribution on the surface of the electrode in the seawater area did not change. The maximum single cathode current was 12.8 µA·cm−2 in the 6th row and the maximum single anode current was 20.19 µA·cm−2 in the 6th row. A thin liquid film formed on the electrode surface in the atmosphere area, which participated in the whole electrode reaction process and became the strongest cathode reaction region [23]. As oxygen was continuously consumed in the sea mud area, the electrode in the 15th row, 17th row and 19th row in the sea mud area was reversed to the anode current. On the 21st day, the cathode current continued to expand upward in the atmosphere, and the third electrode in the atmosphere area showed a weak cathode current.
In the coupling stage of the dual corrosion cell, the place near the seawater/atmosphere interface was cathode current, the seawater area was anode current, and the sea mud area was the coexistence region of cathode current and anode current (as shown in Figure 3c,d). Compared with the initial stage, the cathode reaction was the strongest in the atmosphere area due to the production of thin liquid film on the electrode surface [25]. The cathode current in the sea mud area decreased gradually and the polarity reversed
From the 30th day until the end of the experiment, the place near the seawater/atmosphere interface was cathode current, the seawater area was anode current, and the sea mud area (except for the 20th row) was the anode current (as shown in Figure 3e,f). The dual corrosion cell had transitioned to a single corrosion cell.
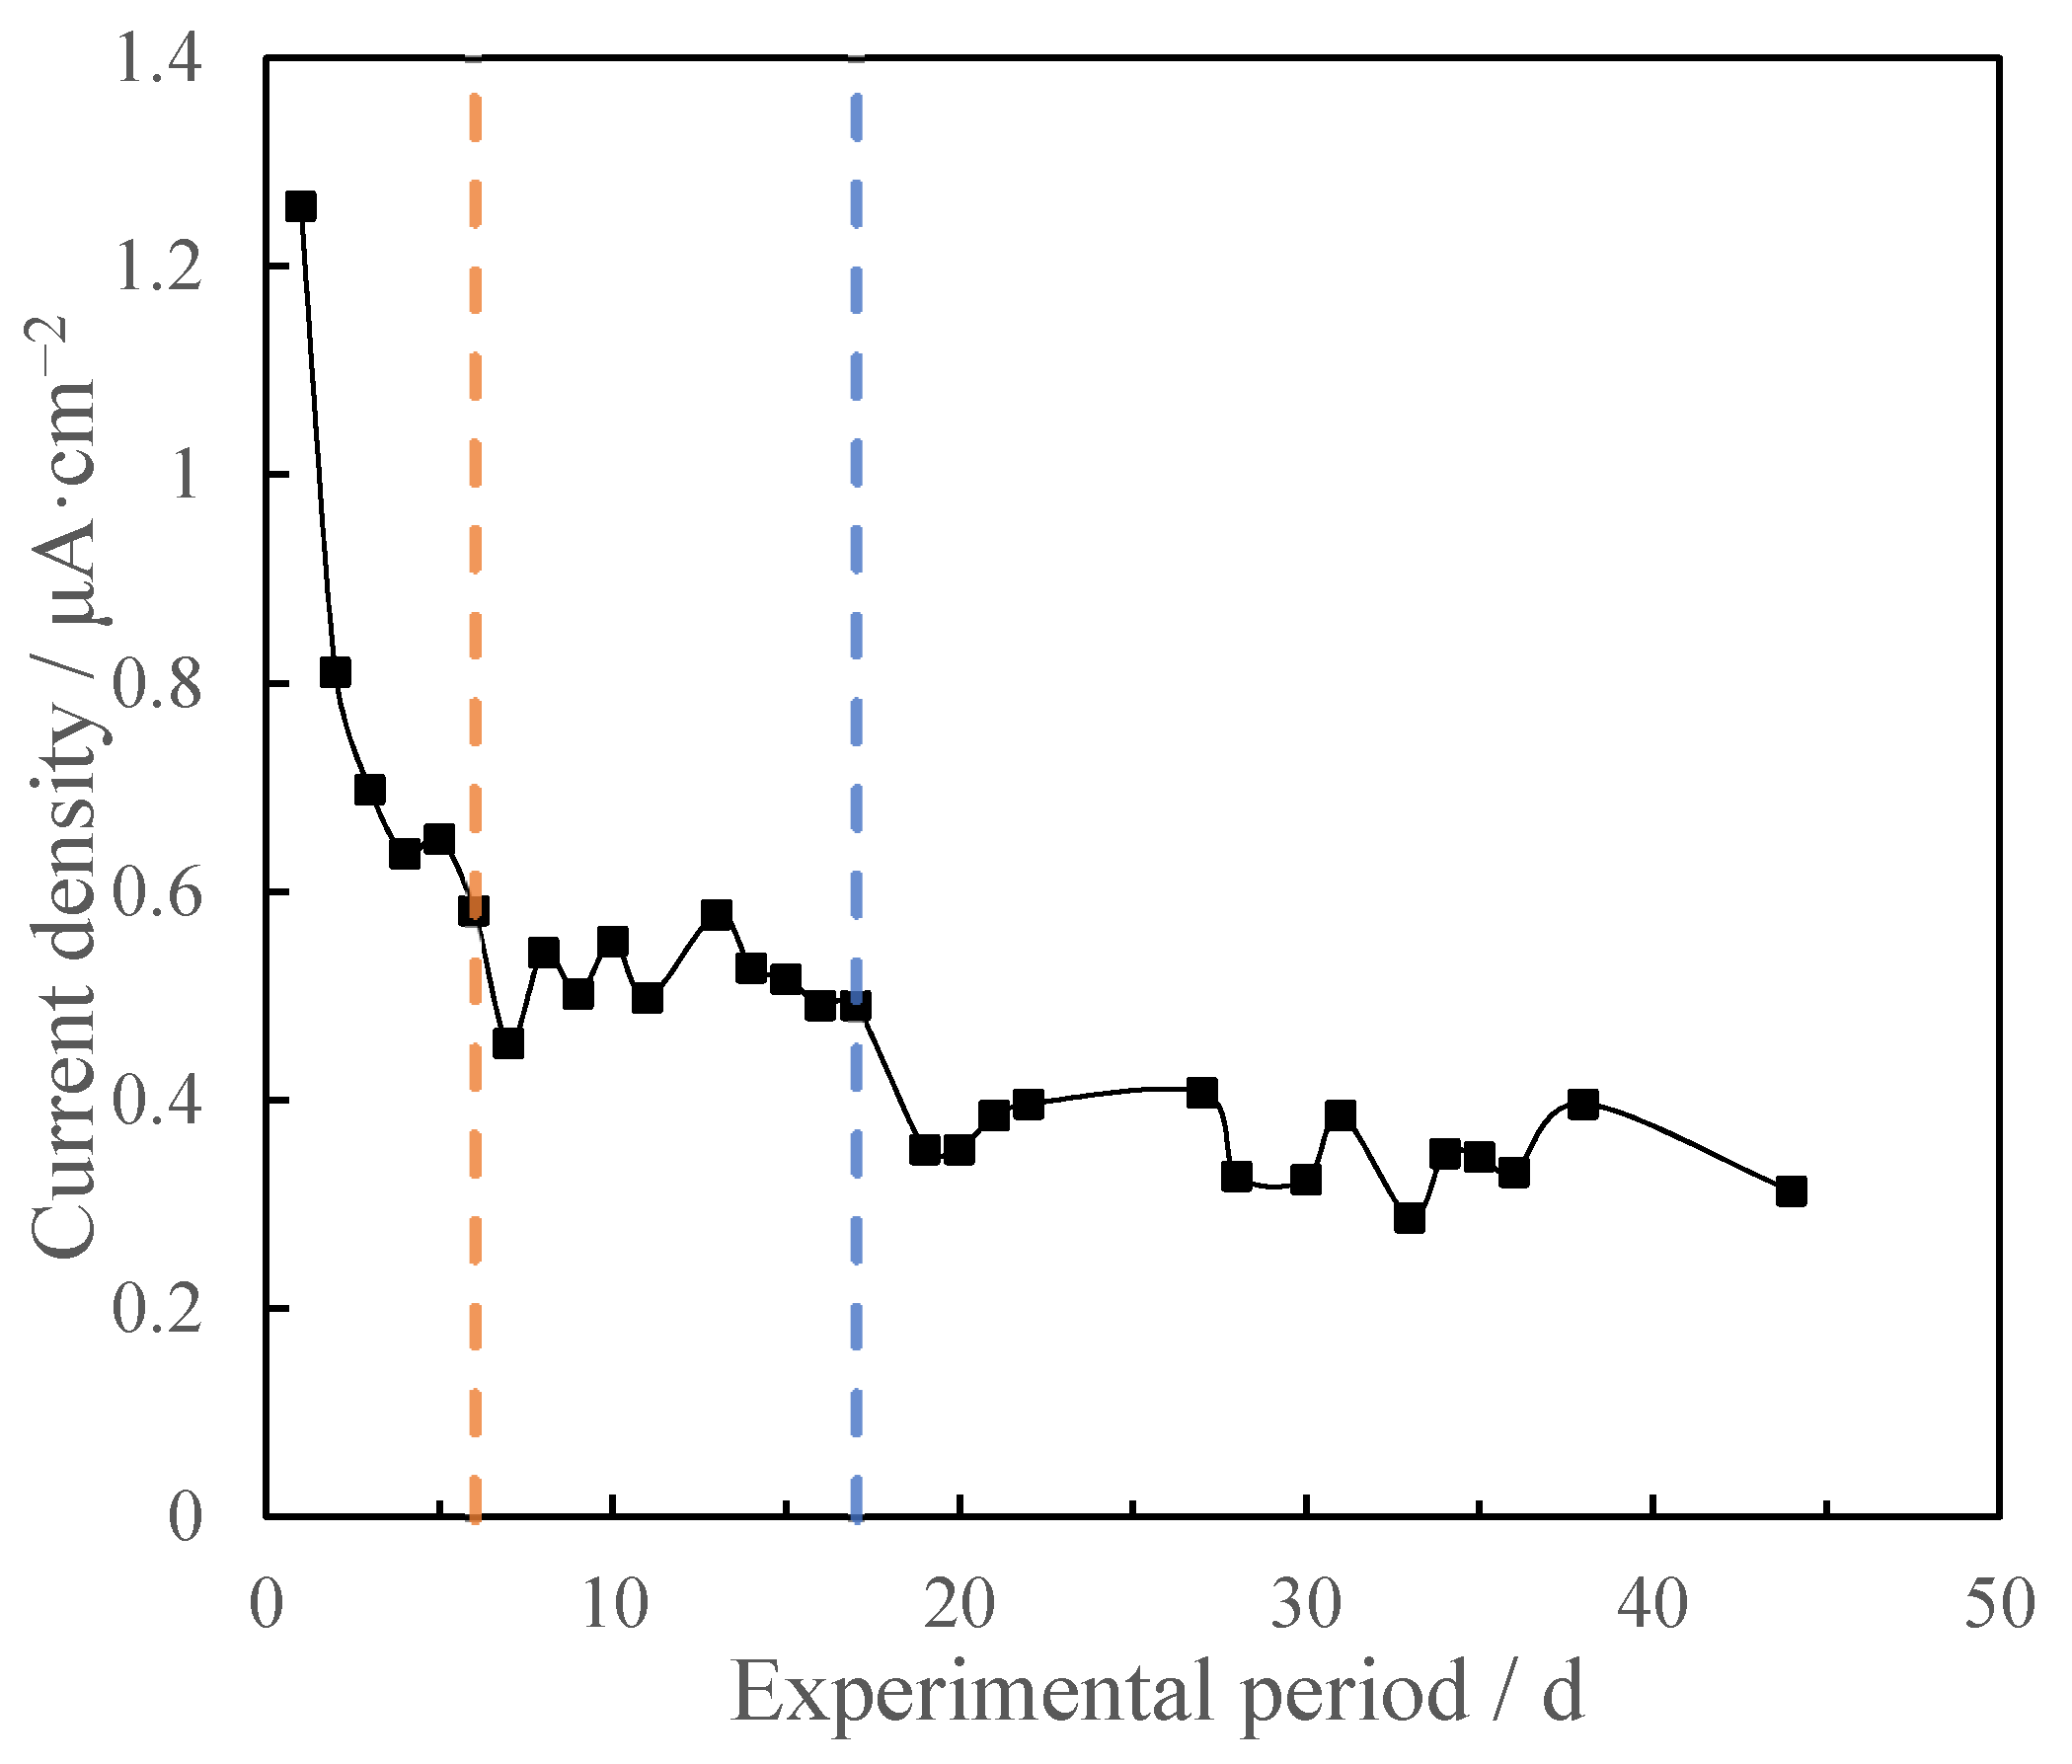
Figure 4 shows the variation of the total anode current density on the electrode surface with the immersion time. The anode current density on the electrode surface was maintained at the maximum level at the beginning of the immersion due to the highest oxygen concentration at this time. With the increase in immersion time, the dissolved oxygen in the seawater area and the sea mud area could not be rapidly and effectively replenished due to the hydrostatic state, and the anode current density on the electrode surface kept decreasing rapidly. From the 6th day to the 17th day, the anode current density on the electrode surface maintained a moderate level of stability. The reason is that the oxygen supply in the hydrostatic state was slow, and the oxygen in the sea mud area was constantly consumed and could not be effectively replenished. From the 17th day to the end of the experiment, the anode current density on the electrode surface was further reduced. The reason is that the rust layer formed on the surface of the electrode in the seawater area inhibited the anodic reaction of the metal [26]. At the same time, the sea mud area almost exhausted oxygen. Two factors maintain the anode current density at the electrode surface at a low level.
3.3. Morphology of WBE Surface
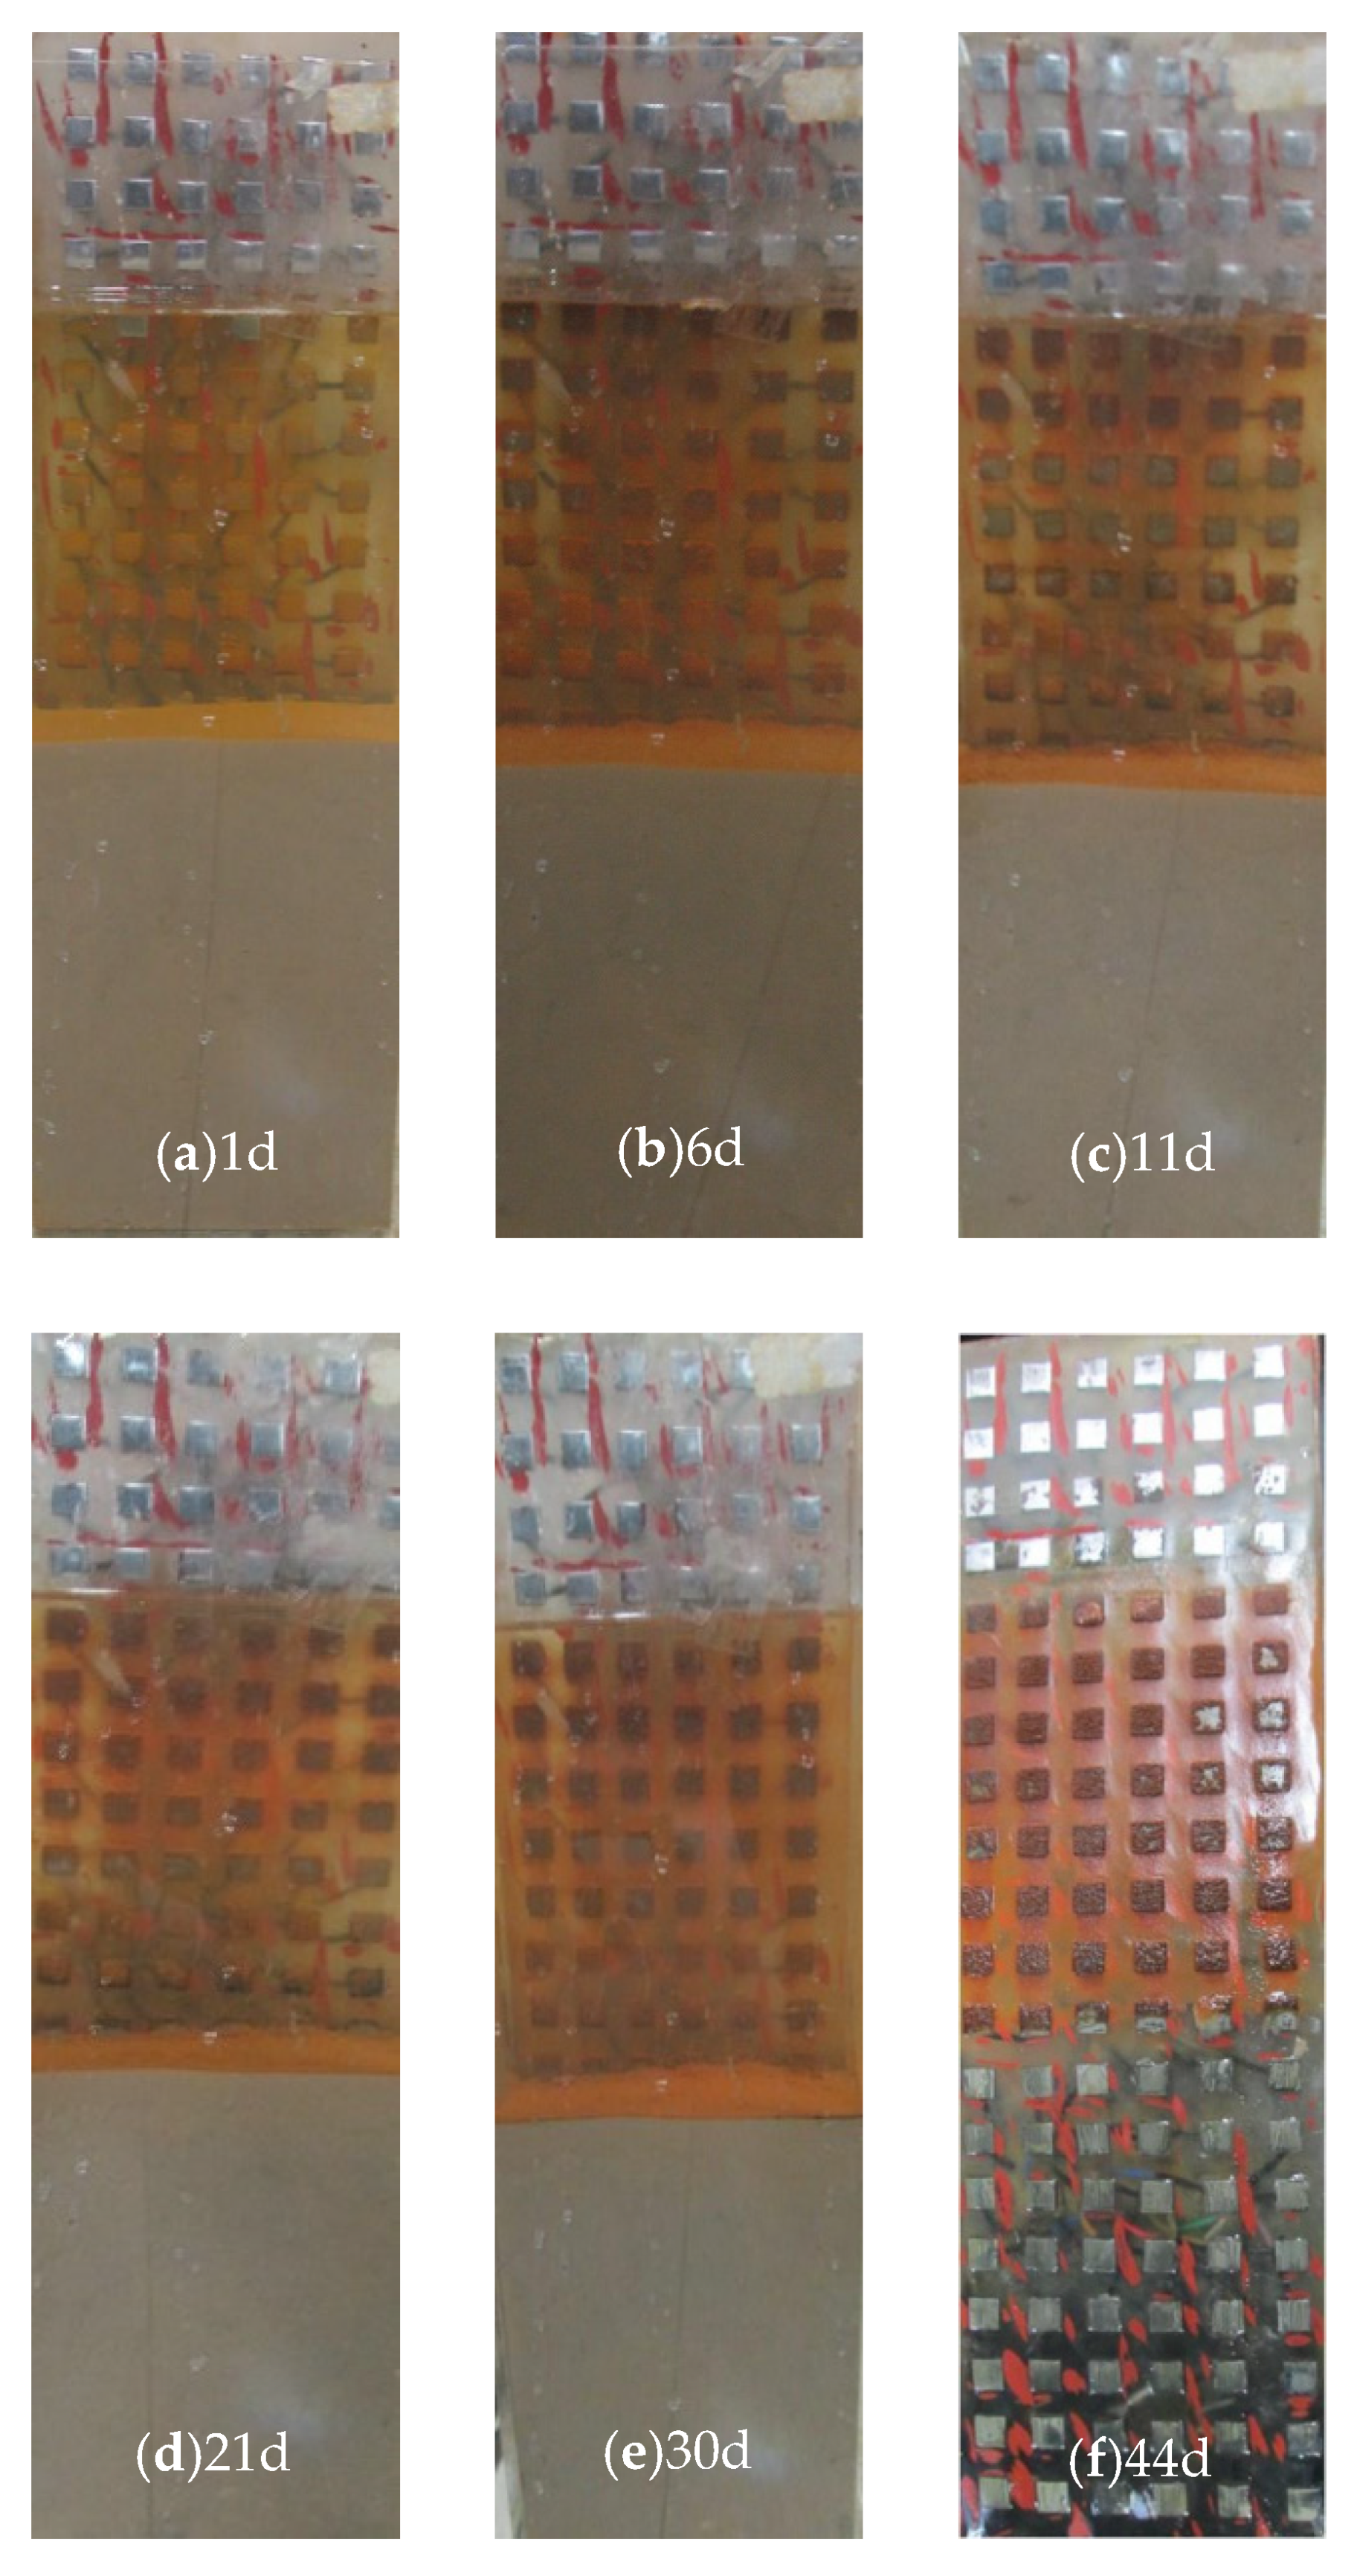
Figure 5 shows the surface topography of the WBE at different immersion times. It can be seen from the figure that the corrosion degree of the atmospheric area was the lightest, and the corrosion degree of the electrode in the seawater area increased gradually with the extension of immersion time. Figure 5f shows the corrosion morphology of the electrode surface at the end of the experiment. The surface of the electrode in the atmospheric region still had metallic luster, and the metal matrix in this region was free from corrosion. The surface of the electrode in the seawater area was covered with a thick layer of reddish–brown rust. This is iron oxide/hydroxide formed by oxidation when oxygen was abundant [27,28]. The surface of the metal in the sea mud area was covered with a thin layer of black rust. This is a small amount of ferric tetroxide formed under the condition of insufficient oxygen [29,30].
3.4. Mechanism of Metal Corrosion at Sea Mud/Seawater/Atmospheric Interface
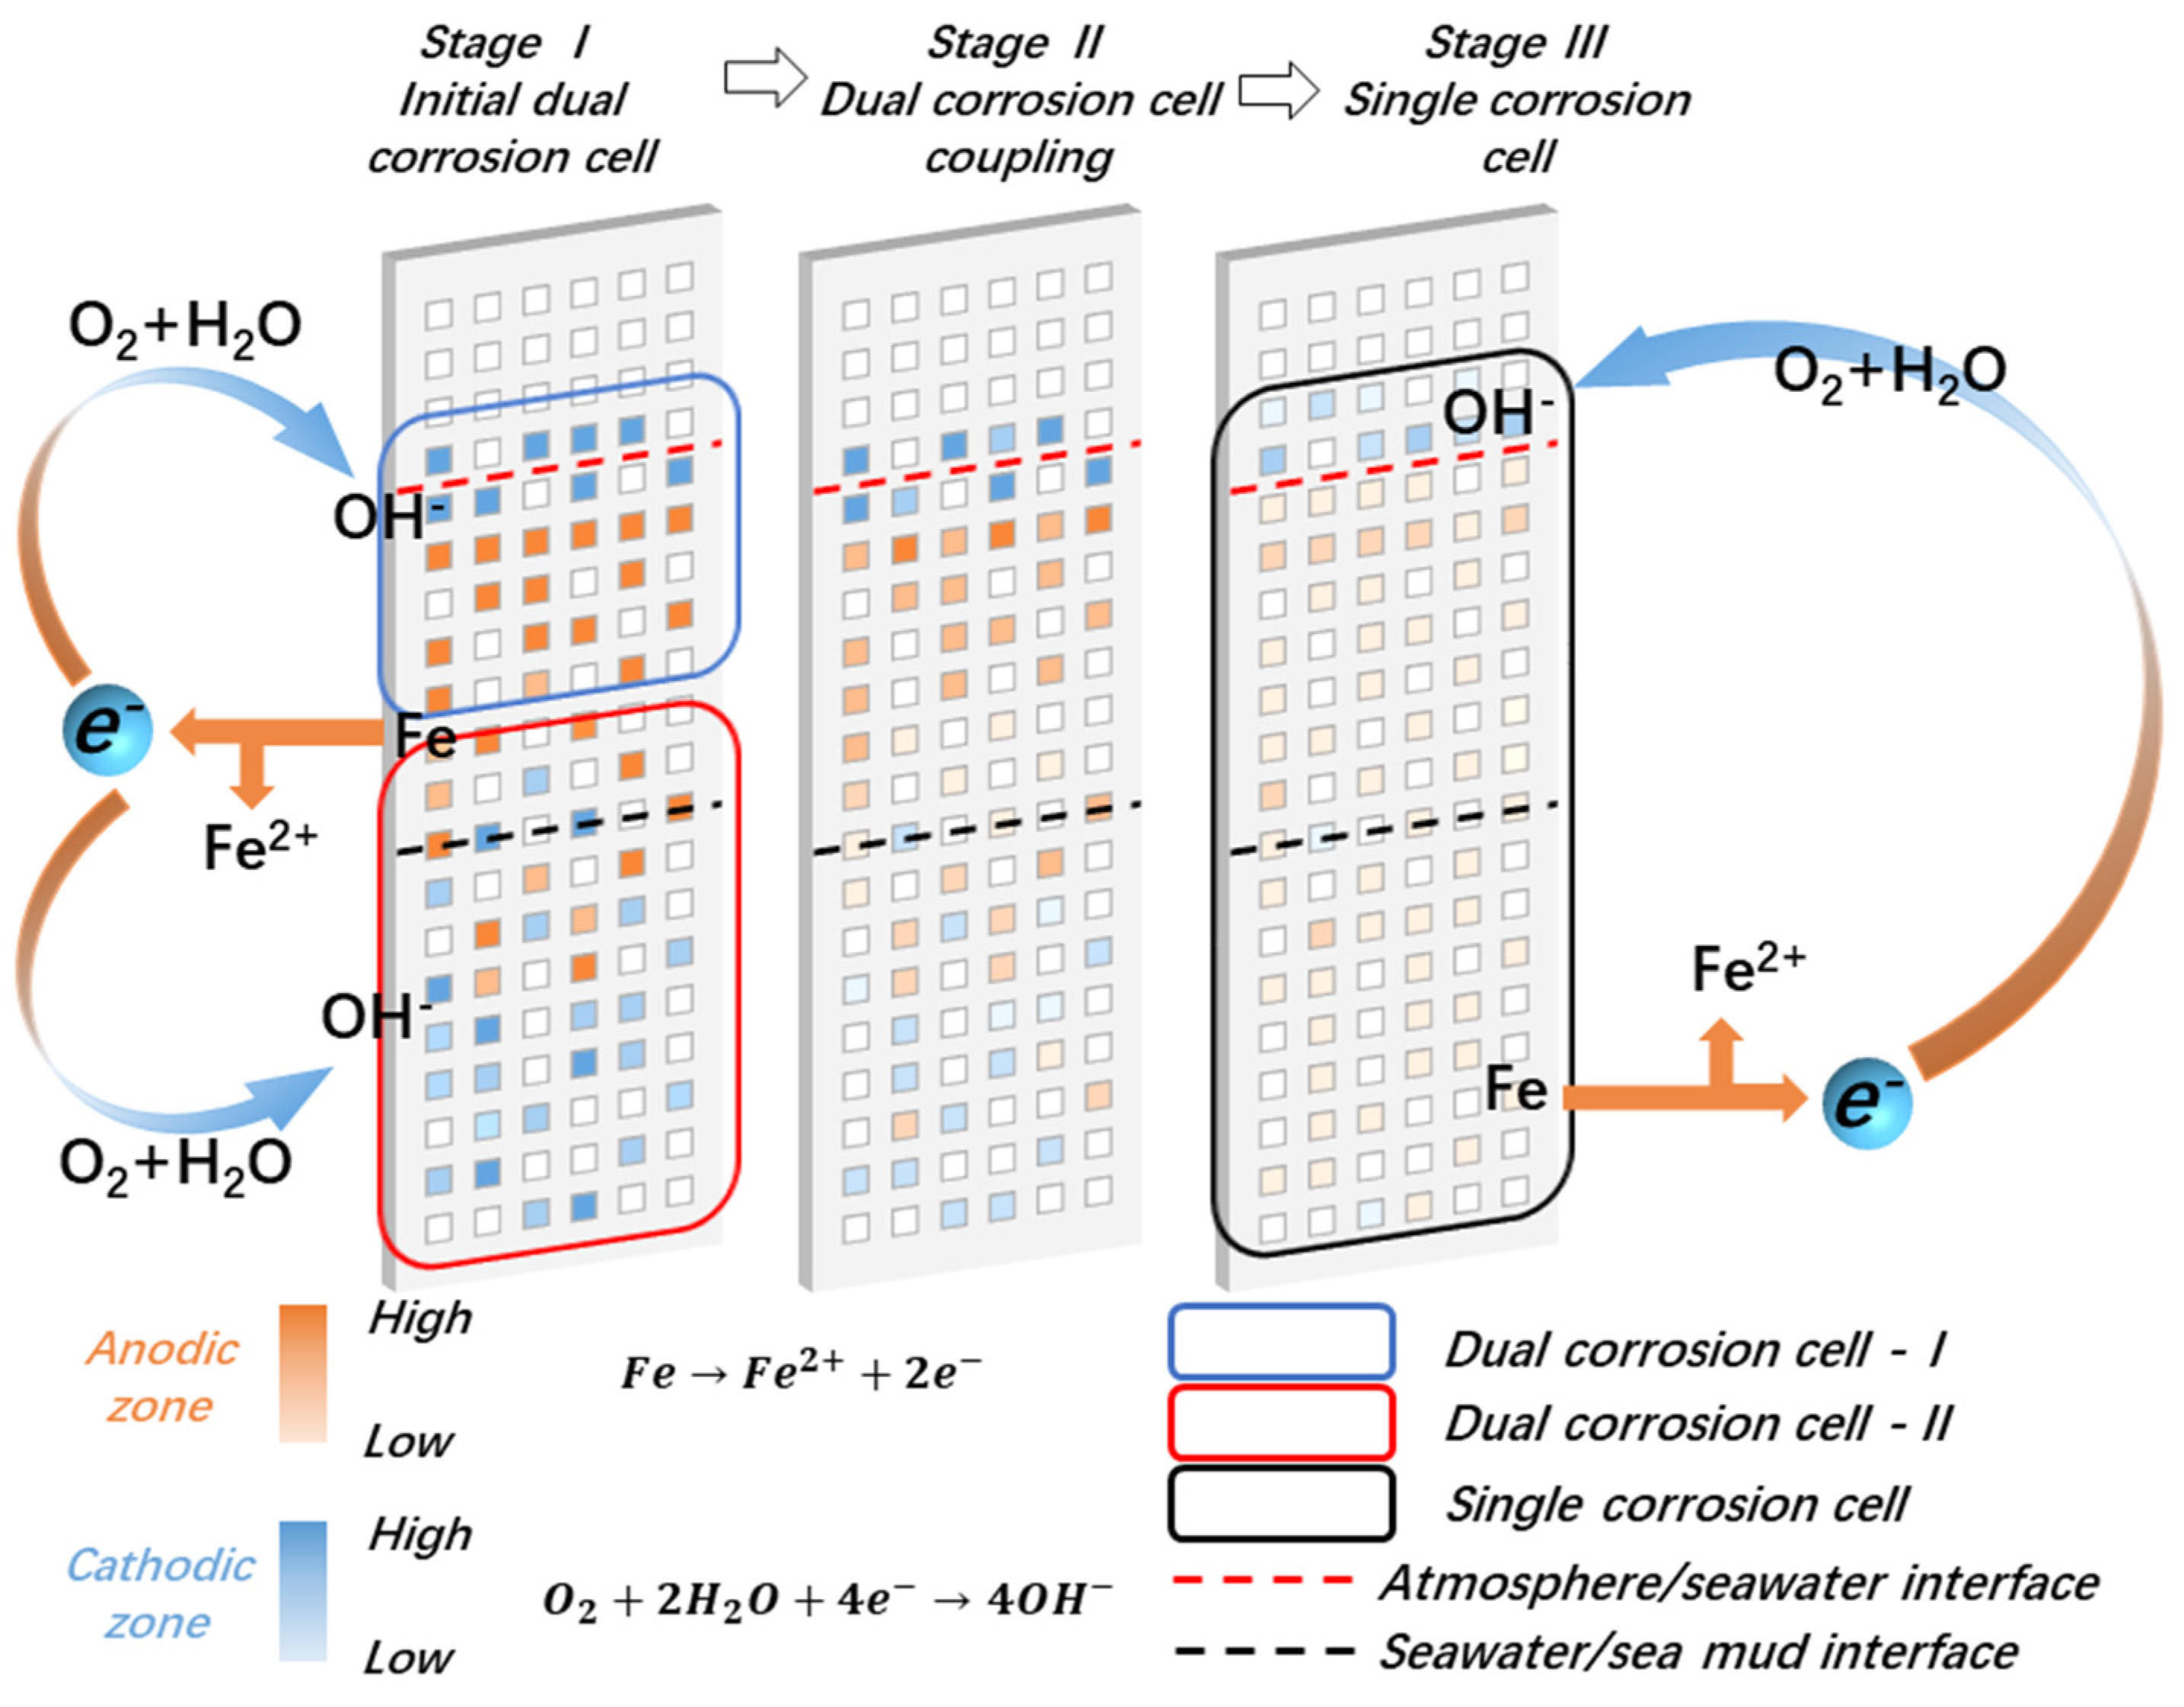
Figure 6 shows a schematic diagram of a metal corrosion mechanism at the sea mud/seawater/atmospheric interface. In the initial stage of the dual corrosion cell, the concentration of dissolved oxygen in the electrolyte solution near the atmosphere/seawater interface was high and tended to show cathode reaction. With the increased water depth, the concentration of dissolved oxygen decreased gradually, and the anode reaction easily occurred [21]. Oxygen existed in the clearance of sea mud, and an oxygen reduction reaction occurred in this area.
In the coupling stage of the dual corrosion cell, the anode reaction in the seawater area was weakened, and the anode area in the coexistence area was continuously expanded. The cathode area in the sea mud area decreased and the cathode current decreased gradually. It was difficult for oxygen to diffuse into the sea mud under the water condition, and the cathode reaction decreased gradually with the gradual consumption of oxygen in the sea mud clearance.
In the stage of the single corrosion cell, the atmosphere area was the cathode area, while the seawater area and sea mud area were the anode area, and the cathode and anode were at a lower level. The oxygen in the clearance of the sea mud area was consumed, so the cathode area in the sea mud area disappeared.
4. Conclusions
The seawater/atmosphere interface was generally the cathode area of the electrode, and the upper part of the seawater area was typically the anode area of the electrode. This is because the oxygen concentration cell generated by waterline action causes the cathode area to be concentrated near the seawater/atmosphere interface. The corrosion degree of seawater area was related to the distance between electrode and water line, and the corrosion degree decreased successively from the waterline down. The overall corrosion degree of the seawater area was one order of magnitude higher than that of the sea mud area, and the sea mud area was the area with the lowest system corrosion degree. In the early stage of the experiment, the sea mud area was the cathode area, while in the later stage, the polarity changed to the anode area, and the sea mud area became a part of the anode area on the whole electrode surface.
Author Contributions
Conceptualization, W.Z. and W.L.; methodology, Z.C., W.X. and W.Z.; software, W.Z.; validation, Z.C. and C.Y.; formal analysis, Z.C. and W.X.; investigation, Z.C. and W.X.; resources, W.Z. and W.L.; data curation, Z.C., W.X., and W.Z.; writing—original draft preparation, Z.C., W.X. and W.Z.; writing—review and editing, C.Y. and Z.L.; visualization, Z.C. and W.X.; supervision, W.L.; project administration, W.Z.; funding acquisition, W.Z. and W.L. All authors have read and agreed to the published version of the manuscript.
Funding
This research was funded by the National Natural Science Foundation of China [Grant Nos. 51525903, 51879292, 21203034 and 51771057]; and GF research and cultivation project of Sun Yat-sen University [Grant No. 76110-18843406].
Conflicts of Interest
There are no conflicts of interest to declare.
Data Availability Statement
The data that support the findings of this study are available from the corresponding author on request.
References
- Hou, B.; Li, X.; Ma, X.; Du, C.; Zhang, D.; Zheng, M.; Xu, W.; Lu, D.; Ma, F. The cost of corrosion in China. NPJ Mater. Degrad. 2017, 1, 1–10. [Google Scholar] [CrossRef]
- Bhaskaran, R.; Bhalla, L.; Rahman, A.; Juneja, S.; Sonik, U.; Kaur, S.; Kaur, J.; Rengaswamy, N.S. An analysis of the updated cost of corrosion in India. Mater. Perform. 2014, 53, 56–65. [Google Scholar]
- Morshed, A. Corrosion management and cost optimization. Mater. Perform. 2017, 56, 61–64. [Google Scholar]
- Kruger, J. Cost of Metallic Corrosion; John Wiley & Sons, Inc.: Hoboken, NJ, USA, 2011. [Google Scholar]
- Li, X.; Zhang, D.; Liu, Z.; Li, Z.; Du, C.; Dong, C. Share corrosion data. Nature 2015, 527, 441–442. [Google Scholar] [CrossRef] [PubMed]
- Kowalski, D.; Grzyl, B.; Kristowski, A. The cost analysis of corrosion protection solutions for steel components in terms of the object life cycle cost. Civ. Environ. Eng. Rep. 2017, 26, 5–13. [Google Scholar] [CrossRef]
- Hou, B.; Zhang, J. Corrosion behavior of steel in tidal range and full immersion zone. Mar. Sci. 1980, 4, 16–19. [Google Scholar]
- Li, X. Corrosion Behaviors and Mechanism of Marine Engineering Materials; Chemical Industrial Press: Beijing, China, 2016. (In Chinese) [Google Scholar]
- Evans, U.R. The Corrosion and Oxidation of Metals: Scientific Principles and Practical Applications; Edward Arnold Ltd.: London, UK, 1960. [Google Scholar]
- Jeffrey, R.; Melchers, R.E. Corrosion of vertical mild steel strips in seawater. Corros. Sci. 2009, 51, 2291–2297. [Google Scholar] [CrossRef]
- Hou, B.; Guo, G.; Ma, S.; Zhang, J. Study on corrosion and protection at seawater-gas and seawater-mud exchange interface in Marine environment. Mar. Sci. 1993, 2, 31–34. [Google Scholar]
- Zhang, J.; Hou, B.; Guo, Y.; Yang, F.; Xie, X. Studies on electrochemical corrosion behavior of steel in juncture area between sea clay and seawater. Oceanol. Limnol. Sin. 1995, 1, 98–102. [Google Scholar]
- Tan, Y.J.; Bailey, S.; Kinsella, B. Mapping non-uniform corrosion using the wire beam electrode method. III. Water-line corrosion. Corros. Sci. 2001, 43, 1931–1937. [Google Scholar] [CrossRef]
- Tan, Y.J. Wire beam electrode: A new tool for studying localised corrosion and other heterogeneous electrochemical processes. Corros. Sci. 1998, 41, 229–247. [Google Scholar] [CrossRef]
- Chen, Y.; Zhang, W.; Wang, W.; Wang, J.; Wang, Q.; Cai, G. Evaluation of water-line area corrosion for Q235 steel by WBE technique. J. Chin. Soc. Corros. Prot. 2014, 34, 451–458. [Google Scholar] [CrossRef]
- Hu, Z.; Cheng, X.; Li, X.; Deng, P.; Wang, G. Evaluation of sea-air interface area corrosion for carbon steel by WBE technique and LP technique. Corros. Prot. 2015, 36, 1014–1020. [Google Scholar] [CrossRef]
- Wu, J.; Wang, P.; Gao, J.; Tan, F.; Zhang, D.; Cheng, Y.; Chen, S. Comparison of water-line corrosion processes in natural and artificial seawater: The role of microbes. Electrochem. Commun. 2017, 80, 9–15. [Google Scholar] [CrossRef]
- Deng, P.; Liu, Q.; Li, Z.; Wang, G.; Hu, Z.; Wang, X. Corrosion behavior of X70 pipeline steel in the tropical juncture area of seawater-sea mud. J. Chin. Soc. Corros. Prot. 2018, 38, 415–423. [Google Scholar] [CrossRef]
- Kong, D.; Wang, Y.; Zhang, W.; Wang, W.; Liu, X.; Wang, J. Correlation between electrochemical impedance and current distribution of carbon steel under organic coating. Mater. Corros. 2012, 63, 475–480. [Google Scholar] [CrossRef]
- Wang, W.; Zhang, X.; Wang, J. The influence of local glucose oxidase activity on the potential/current distribution on stainless steel: A study by the wire beam electrode method. Electrochim. Acta 2009, 54, 5598–5604. [Google Scholar] [CrossRef]
- Cao, C. Corrosion Electrochemical Principle, 3rd ed.; Chemical Industry Press: Beijing, China, 2008. [Google Scholar]
- Ding, J.; Zhang, W.; Wang, J.; Chen, Y.; Yin, P.; Zhang, B. Evaluation of water-line area corrosion for coating delamination by WBE technique-I. J. Chin. Soc. Corros. Prot. 2016, 36, 463–470. [Google Scholar] [CrossRef]
- Liu, Z.; Wang, W.; Wang, J.; Peng, X.; Wang, Y.; Zhang, P.; Wang, H.; Gao, C. Study of corrosion behavior of carbon steel under seawater film using the wire beam electrode method. Corros. Sci. 2014, 80, 523–527. [Google Scholar] [CrossRef]
- Chen, Y.; Zhang, W.; Ding, K.; Wang, J.; Yin, P.; Dong, C.; Yang, W. Debonding mechanism of organic coating with man-made defect in the area nearby water-line by WBE technique. J. Chin. Soc. Corros. Prot. 2016, 36, 67–72. [Google Scholar]
- Liao, X.; Cao, F.; Zheng, L.; Liu, W.; Chen, A.; Zhang, J.; Cao, C. Corrosion behaviour of copper under chloride-containing thin electrolyte layer. Corros. Sci. 2011, 53, 3289–3298. [Google Scholar] [CrossRef]
- Zhang, Q.; Wu, J.; Chen, J.; Wang, J.; Li, A.; Yang, X. Characterization of rust layer formed on low alloy steel exposed in marine atmosphere. J. Mater. Sci. Technol. 2002, 18, 455–458. [Google Scholar] [CrossRef]
- Ma, Y.; Li, Y.; Wang, F. The effect of β-FeOOH on the corrosion behavior of low carbon steel exposed in tropic marine environment. Mater. Chem. Phys. 2008, 112, 844–852. [Google Scholar] [CrossRef]
- Jolivet, J.P.; Tronc, E.; Chanéac, C. Iron oxides: From molecular clusters to solid. A nice example of chemical versatility. C. R. Geosci. 2006, 338, 488–497. [Google Scholar] [CrossRef]
- Xia, H.; Ye, W.; Song, X.; Ma, Y.; Li, Y. Evolution of akaganeite in rust layers formed on steel submitted to wet/dry cyclic tests. Materials 2017, 10, 1262. [Google Scholar] [CrossRef] [Green Version]
- Cano, H.; Neff, D.; Morcillo, M.; Dillmann, P.; Diaz, I.; Fuente, D.D.L. Characterization of corrosion products formed on Ni 2.4wt %–Cu 0.5wt %–Cr 0.5wt % weathering steel exposed in marine atmospheres. Corros. Sci. 2014, 87, 438–451. [Google Scholar] [CrossRef] [Green Version]
Figure 1.
Schematic diagram of the experimental setup. (a) Computer console. (b) Measurement system. (c) Experimental device. (d) Photo of the WBE before applying the coating on the surface.
Figure 1.
Schematic diagram of the experimental setup. (a) Computer console. (b) Measurement system. (c) Experimental device. (d) Photo of the WBE before applying the coating on the surface.

Figure 2.
Galvanic current recorded on the Wire Beam Electrode (WBE) in sea mud/seawater/atmosphere environment for various immersion days. (a–f) correspond to 1, 6, 11, 21, 30, and 44 days, respectively.
Figure 2.
Galvanic current recorded on the Wire Beam Electrode (WBE) in sea mud/seawater/atmosphere environment for various immersion days. (a–f) correspond to 1, 6, 11, 21, 30, and 44 days, respectively.


Figure 3.
Single row current density vector sum at various experiment times. (a–f) correspond to 1, 6, 11, 21, 30, and 44 days, respectively.
Figure 3.
Single row current density vector sum at various experiment times. (a–f) correspond to 1, 6, 11, 21, 30, and 44 days, respectively.


Figure 4.
The average current density of the single row anode.

Figure 5.
Morphology of the WBE surface immersed for 1 d (a), 6 d (b), 11 d (c), 21 d (d), 30d (e) and 44 d (f).
Figure 5.
Morphology of the WBE surface immersed for 1 d (a), 6 d (b), 11 d (c), 21 d (d), 30d (e) and 44 d (f).

Figure 6.
Schematic diagram of metal corrosion processes in sea mud/seawater/atmosphere environment. Stage I: initial dual corrosion cell. Stage II: dual corrosion cell coupling. Stage III: single corrosion cell.
Figure 6.
Schematic diagram of metal corrosion processes in sea mud/seawater/atmosphere environment. Stage I: initial dual corrosion cell. Stage II: dual corrosion cell coupling. Stage III: single corrosion cell.

Publisher’s Note: MDPI stays neutral with regard to jurisdictional claims in published maps and institutional affiliations. |
© 2020 by the authors. Licensee MDPI, Basel, Switzerland. This article is an open access article distributed under the terms and conditions of the Creative Commons Attribution (CC BY) license (http://creativecommons.org/licenses/by/4.0/).
Share and Cite
MDPI and ACS Style
Chen, Z.; Xia, W.; Yao, C.; Lin, Z.; Zhang, W.; Li, W. Research on the Metal Corrosion Process in the Sea Mud/Seawater/Atmosphere Interface Zone. Coatings 2020, 10, 1219. https://doi.org/10.3390/coatings10121219
AMA Style
Chen Z, Xia W, Yao C, Lin Z, Zhang W, Li W. Research on the Metal Corrosion Process in the Sea Mud/Seawater/Atmosphere Interface Zone. Coatings. 2020; 10(12):1219. https://doi.org/10.3390/coatings10121219
Chicago/Turabian StyleChen, Zhiwei, Wenting Xia, Caiqi Yao, Zhifeng Lin, Wei Zhang, and Weihua Li. 2020. "Research on the Metal Corrosion Process in the Sea Mud/Seawater/Atmosphere Interface Zone" Coatings 10, no. 12: 1219. https://doi.org/10.3390/coatings10121219
Note that from the first issue of 2016, this journal uses article numbers instead of page numbers. See further details here.